Munich Personal RePEc Archive An empirical investigation of the APT in a frontier stock market FARUQUE, MUHAMMAD U Royal Holloway, University of London 1 June 2011 Online at https://mpra.ub.uni-muenchen.de/38675/ MPRA Paper No. 38675, posted 10 May 2012 01:51 UTC

Welcome message from author
This document is posted to help you gain knowledge. Please leave a comment to let me know what you think about it! Share it to your friends and learn new things together.
Transcript
Munich Personal RePEc Archive
An empirical investigation of the APT in
a frontier stock market
FARUQUE, MUHAMMAD U
Royal Holloway, University of London
1 June 2011
Online at https://mpra.ub.uni-muenchen.de/38675/
MPRA Paper No. 38675, posted 10 May 2012 01:51 UTC

1
AN EMPIRICAL INVESTIGATION OF THE ARBITRAGE PRICING THEORY
IN A FRONTIER STOCK MARKET: EVIDENCE FROM BANGLADESH
Muhammad Umar Faruque1
Department of Economics, Royal Holloway University of London, Egham, Surrey, UK
Abstract Although the existing literature of Arbitrage Pricing Theory (APT) on different categories of stock
markets is vast, it is non-existent in the case of frontier stock markets (defined as very small capital
markets). This paper fills this gap by investigating how APT performs in a frontier stock market. To
address the common problem of multi-collinearity in macro variables, this study uses principal
component analysis (PCA) as a robustness check on the previous results. The results confirm
evidence of one significant macroeconomic factor in the Dhaka stock market - a frontier stock
market of Bangladesh. This result is comparable to that of some emerging (larger than frontier
markets) stock markets.
JEL : G10, G12,G11, G24, G32
Key words: Arbitrage pricing theory (APT), Capital-asset pricing model, Dhaka stock exchange
(DSE), Principal component analysis, Principal components (PC), Efficiency market hypothesis
(EMH) and Chen, Roll and Ross (CRR).i
1Department of Economics, Royal Holloway University of London, Egham, Surrey, UK
Email: [email protected]
Tel: 0044 7735032452; Fax: + 44 (0)1784 439534
Special thanks owed to Dr Vinay Nundlull, Dr Stacy Chan, Dr Hui-fai Shing, Dr Maris Goldmanis, Dr Molla,
Dr Mahiuddin and Mr Tanvir for providing counsel and criticism.

2
I. INTRODUCTION:
Markowitz’s (1952) theory of Portfolio Diversification has been instrumental in paving the way for
modern asset pricing models to measure risks associated with equity returns. Subsequently, Capital
Asset Pricing Model (CAPM) has been developed by Sharpe (1964), Linter (1965) and Mossin (1966).
The Arbitrage Pricing Theory (APT) proposed by Ross (1976, 1977), has come as an alternative to
CAPM measure of risk-return. The progress of models especially the APT appears to be influenced by
the macroeconomic factors that intuitively affect capital investment. Whether the APT stands empirical
viability has been tested widely time and again hence there exists a dense literature e.g. Shanken
(1982), Brown and Weinstein (1983),Chen (1983), Cho, Elton and Gruber (1984), Chen, Roll, and
Ross (1986), Connor and Korajczk (1986), Burmeister and McElroy (1988), Lehman and Modest
(1988), to mention but a few.
However, the literature is rather limited in that these theories especially the APT have been tested in
large developed stock markets now and then. Though it is noted that the APT has already been tested
in a few emerging markets e.g. in Pakistan, Turkey and Indonesia (among others) yet in the context of
frontier stock markets, defined as less advanced and very small capital markets, the evidence is
nonexistent.1
The empirical test of APT in the Dhaka stock market would enable it to compare its
performance in a Bangladeshi stock market with that of other stock markets around the world.
Subsequently, it will have implications in investment decision-making for the capital markets of
Bangladesh.
Thus, this study aims to fill the gap by investigating the APT in a rather small but rapidly developing
stock market and in addition, contribute further evidence to the already existing literature of the
empirical tests of APT. Dhaka Stock Exchange (DSE) is a premier stock market of Bangladesh which
was incorporated in 1954. As of 2009 the total market capitalization (MC) of DSE amounts to

3
USD19020.18 millions which approximately has a ratio of 1: 0.21 as GDP to Market Capitalization.
Similar ratios for other countries are shown in the table below:
Table 1:2 A Comparison of Market Capitalization Across a Range of Different Stock Markets
Country MC as a Percentage of GDP
(in %)
Bangladesh 21
Hong Kong 525.36
India 77.53
Malaysia 104.96
Indonesia 19.61
Pakistan 49
USA 102.01
Table 1 exhibits the small MC of DSE when compared to other stock markets in the region as well as
in the world. The annual growth rate of MC in DSE was 135.28% in 2007 but somewhat subdued since
then as a result of Global Financial Crisis. Consequently, in 2009 the growth rate of MC was 23.9%. In
order to test the APT empirically, this study employs pre-specified macroeconomic factor approach
developed by Chen et al. (1986) (CRR) that requires the use of two-pass regression methodology
originally developed by Fama and Macbeth (1973). The dataset used in this study is a time-series data
consists of 23 stocks and seven macro-variables for the period 1996-2010. It is noteworthy that CRR
results suffer from robustness check as time-series of macro-variables contains the possibility of multi-
collinearity. To resolve this problem, this study incorporates principal component analysis into the
regression model. The results confirm evidence of one significant macroeconomic factor in the Dhaka
stock market. Furthermore, this study provides a critic of asset pricing models as they fall short of
incorporating non-quantifiable factors that affect stock returns. To this effect, this study addresses the
issue ‘what constitutes stock returns’ and uses the analysis to explicate the findings. The hypotheses of
the present study are as follows:
H0 1: macroeconomic factors do not influence stock returns in a frontier stock market.
H0 2: stock returns are not affected by non-quantifiable factors such as ‘market psychology’.
This paper is structured as follows: section 2 provides a literature review of APT; section 3 discusses
some of the criticisms of asset pricing models; section 4 elaborates the methodology; section 5

4
analyses the data; section 6 discusses the findings of this study while section 7 summarizes and
concludes.
II. LITERATURE REVIEW:
II.I. Arbitrage Pricing Theory:
The first empirical study of APT was done by Brennan (1971) in which he concluded that two risk-
factors must represent return as opposed to single factor of CAPM. However, the first published work
on APT was made by Gehr (1975) in which he carried out similar version of factor analysis approach.
There were no further studies until Ross and Roll (1980) carried out their own empirical investigation
of APT. The APT is based on the assumptions and insights developed in ICAPM3 and Efficient Market
Hypothesis (EMH)4 and like CAPM it is a linear model though of multiple betas rather than single beta
as in CAPM (Chen et al. 1986). Ross’ (1976) criticism of earlier studies is that they are mainly tests of
hypothesis that stock-index is mean-variance efficient, hence empirical tests of asset pricing models
would hold only if true market portfolio (which is unattainable) can be calculated. However, some
studies such as that of Shanken (1987) and Kandel and Stambaugh (1987) show less rigorous measures
under which CAPM can be tested. Unlike Mean-variance portfolio where firm-specific risks can be
diversified away the APT states that there are systematic risks in the economy that subject all the
available stocks to same degree. The APT suggests that prices of risky assets abide by the law of no
arbitrage. The APT predicts that stock/equity returns are influenced by a set of state variables e.g. GDP
or Inflation or Interest Rate etc. The risk premium of each asset is sensitive to the risk premium of risk-
factors (see e.g. Bodie et al. 2009). The empirical test of APT is carried out by two different
approaches (factor analytic approach and pre-specified macro-factor approach) as formulated by Roll
and Ross (1980) and Chen et al. (1986)(CRR) respectively, which are discussed in the Methodology
part. In CRR’s APT framework there is no binding on the selection of number of risk factors. In
contrast to this, French and Fama (1993, 96) formulate a 3-factor model that captures three specific
factors influencing expected return. In the same mode of argument there has been 4-factor model or 5-
5
factor model until Zhongzhi et al. (2010) propose a new model called DFPM (Dynamic Factor Pricing
Model) which employs both ex-ante and ex-post factors and integrates elements of price dynamics
across assets as well through time.
II.II. A Brief Sketch of the Empirical Results of APT:
The empirical tests of APT have been carried out widely throughout the world from the USA to Greece
to Indonesia (see e.g. Fabrian and Herwany (2010) and Michailidis (2009)). Several studies compare
APT with CAPM or CAPM with French and Fama 3-Factor model (see e.g. Drew et al. (2003)). Most
studies have focused on developed stock markets (see e.g. Asprem, 1989) while some of them
compared developed stock markets with the emerging markets. Many studies have found evidence for
APT while a few found against it (see e.g. Subramanyam, 2010).
Ross and Roll (1980) investigate APT using 42 groups of 30 individual securities for the period 1962-
72 and find at least three significant factors, thus lays the empirical foundation of APT. The seminal
work of CRR (1986) finds four priced factors for the period of 1958-84. However, their result suffers
from lack of robustness which is investigated in detail by Shanken and Weinstein (2006). Shanken and
Weinstein (2006) use post-ranking-returns approach as opposed to CRR backward-looking returns to
address ‘lack of robustness’ in CRR results using the same data and they find that only industrial
production index is significant among all factors. Their results show that CRR macro-variables are
sensitive to alternative approaches. Shanken (1982,85, 92) too makes a number of criticisms of the
empirical viability of APT as for example, he argues that APT is more vulnerable than CAPM because
it rules out the very expected return differentials which it tries to elucidate . However, his critique is
not on APT itself rather it is directed on some methodological and empirical aspects of APT. In a
critique of APT Dhrymes, et al. (1984) find that as one increases the number of securities, the number
of ‘factors’ determined increases. This increase in the number of ‘factors’ with outsized groups of
equities cannot readily be explained by a distinction between ‘priced’ and ‘non-priced’ risk factors as it

6
is impermissible to carry out tests on whether a given ‘risk factor is priced’ using factor analytic
procedures. However, Ross (1984) refutes the arguments posed against APT by Dhrymes, et al. (1984).
II.III. Some empirical results of APT in the context of emerging stock markets:
The closest counterparts to frontier stock markets are emerging stock markets. Hence findings of APT
as regards the emerging markets are relevant to this study. Dhankar and Esq (2005) analyze APT in the
Indian stock market using monthly and weekly returns for the 1991-02 period, and show that APT with
multiple factors provides a better indication of asset risk and return than CAPM which uses beta as the
single measure of risk. Using the pre-specified macroeconomic factor approach Azeez and Yonezawa
(2006) test APT in a Japanese stock market and find that four different types of risk factors have
significant influence on expected returns in each of the sample period. They are money supply,
inflation, exchange rate, and industrial production. Ikbal and Aziz (2005) use both explanatory factor
analysis and pre-specified macroeconomic approach with sixteen variables to test APT for Karachi
Stock Market and find two priced factors in both cases. However, their result contains some evidence
of instability as the value of R2 is low. Fabrian and Herwany (2010) investigate the ability of both
CAPM and APT to explain excess portfolio returns in the Jakarta stock exchange and find that while
beta does not on its own explain excess returns, two macroeconomic variables namely exchange rate
and interest rate spread appear to be significant in APT test. Altay (2003) performs APT for both the
German and the Turkish stock markets and finds that while the evidence of APT exists for Germany it
falls short in Turkey’s case. Michailidis (2009) test both APT and CAPM in the Athens stock market
for the period of 1997-04 and find that the CAPM performs better than the APT. Using the
autoregressive model developed by Mei (1993) Ferreira and Rocha (2002) test APT in the Portuguese
stock market and find two significant factors explaining stock returns. All these results show relevance
of APT in emerging stock markets. Subramanyam (2010) reviews the literature on cross-section of
expected stock returns for the past twenty-five years and draws the following conclusions. Too many
predictive variables are used without a proper analysis of their correlation structure and studies

7
generally fall short of accounting for the control in relation to a complete set of variables. A range of
methodologies are applied but the robustness of the results is not adequately addressed across different
methods.
The research at this stage shows the following characteristics:
• There exists a wealth of literature of APT covering a period of thirty years but no
investigation has been done (to the best of our knowledge) in the context of frontier stock
markets.
• Existing literature does not fully incorporate all the possible risk-factors that affect stock
returns. The theories of Efficient Market Hypothesis and rational expectation on which APT
bases its assumptions are not fully agreed upon by researchers (this issue is fully addressed
in the ensuing section).
III. A CRITICISM ON SOME FEATURES OF ASSET PRICING MODELS:
In the perspective of efficient-market theory and rational expectations of inter-temporal asset-pricing
theory (see e.g. Cox et al. 1985); Chen et al. (1986) in their seminal study state that asset prices should
be influenced by the macroeconomic factors that represent the economy. The theoretical basis of APT
is drawn from this perspective. However, the argument and evidence from behavioral finance challenge
this foundation. The works of RJ Shiller (see e.g. Shiller 1981, 84, 93, and 2005) call for attention,
since for the last thirty years he has produced several studies in this regard suggesting
alternative/additional factors that may affect stock prices. It may be asked, why this debate persists for
such a long time about the fundamentals of asset pricing models? One of the explanations states that
since Enlightenment there is an unofficial concept of ‘scientific attitude’ in the academic circles that
seeks for ‘quantitative’ and ‘definitive’ answers to intricate problems that are essentially ‘ambiguous’
or ‘qualitative’ in nature (see e.g. Shiller, 2005: p-18).5 In his book, Shiller (2005) provides evidence
and explanations about factors that influence the market and yet are not justified by the rationale of
‘economic fundamentals’. He lists twelve such precipitating factors in the US context but many of

8
these factors e.g. the idea that investing in stock means a way to become rich quickly; media-expansion
of business report; increasingly optimistic forecasts by analysts, are also relevant to stock markets
around the world. These factors are said to be amplified by investors’ expectations and overconfidence
which create a false impression of stock returns. Apart from this, cultural and psychological factors
such as excessive Media report of financial news or peer pressure of equity investment etc. also carry
weight in explaining fluctuations in stock prices.
III.I. The Perspective of Behavioral Finance:
Shiller’s argument has resonance in the field of behavioral finance which argues that irrationality on
the part of agents in financial market can be explained using models that account for agents’
irrationality (Barberis and Thaler, 2003a). Selden (1912) provides a framework on the belief that
movement of stock prices depends to a large degree on the psychology of financial investors. The
domain of human behavior cannot be quantified like other observable variables, hence researchers who
discuss psychological factors in relation to stock returns rely themselves on intuitive argument and
related indicatory data. Counter to the principles of Efficiency Market Hypothesis (EMH) hypothesis,
behavioral finance seeks to expound ‘why’ and ‘how’ markets might be inefficient reflecting
unpredictable nature of the collective ‘human psyche’ (Sewell, 2007). Akerlof and Shiller (2009)
provide several arguments that ‘human psychology’ does matter in economic models and theories, but
since they could not specify a ‘new’ model that replaces old models their argument suffers negative
criticisms (Farmer, 2009). However, the core of the problem remains unchanged even if one fails to
devise a new paradigm.
The arguments from the preceding paragraphs delineate that there is no ‘exact’ answer to the question
why ‘stock prices’ are volatile or takes a ‘random walk,’ so empirical investigations are more viable
when considered in a broader context. Thus, the present investigation considers both qualitative and
quantitative factors that affect stock returns.
IV. METHODOLOGY:

9
IV.I. The range of approaches to the empirical tests of APT:
The empirical test of APT can be approached from various angles which are exhibited in the diagram
below:
Fig 1: Range of Approaches to the Empirical Tests of APT
IV.II. The Framework of the Present Methodology:
The previous section demonstrates the different statistical methods that can be incorporated while
carrying out empirical tests of APT to enhance its estimates. The methodology of APT as developed by
Chen et al. (1986) thus allows flexibility in its framework. However, there are two main methods by
which most of these studies investigate APT (while integrating a specific statistical tool into the
framework e.g. principal component analysis for this study): explanatory factor analysis and pre-
specified macroeconomic approach. This study uses pre-specified macroeconomic factors approach
(PMF) developed by Chen et al (1986). Regressions are also run using principal components analysis
(PCA) to remove multi-collinearity in macro-variables and enhance statistical accuracy of the results.
The characteristic feature of principal components is their uncorrelatedness, hence coefficient of
principal components (PC) remained unaltered even though another PC is incorporated into the
Sequential test of
APT (Shukla and
Trztinka, 1990)
Bayesian Approach
(McCulloch and Rossi,
1991)
APT Gaussian Temporal
Factor (Chiu and
Xu , 2004)
Autoregressive Model
Approach (Mei , 1993)
Approach
Posterior, predictive
and utility-based
approach (McCulloch
and Rossi, 2002)
Maximum likelihood
Ratio(Shukla and
Trztinka (1990)
Non-linear Approach
to APT ( Bansal and
Viswanathan ,1993)
Principal Component
Analysis (Martikainen
et al, 1991)

10
equation whereas in the case of original variables any addition/removal of variable changes the
contribution and coefficient of regression model. This holds true when multicollinearity is present in
the model (Flury and Riedwyl, 1988, p. 212).
One of the main advantages using the macroeconomic variables approach is that it names the factors.
Since pre-specified macroeconomic factors approach names factors, it provides a more direct link
between various corporate strategic policies (e.g. capital structure and dividend policy) and changing
economic events. However, unanticipated changes in the macro-variables are difficult to measure that
are required to proxy for the factors. As a consequence, some variables like oil prices, which have semi
predictable movements, are unlikely to show up as factors even though they might be genuine factors
(Grinblatt and Titman, 2002:p-186). Although PMF approach specifies factors beforehand it falls short
of quantifying pertinent factors e.g. political changes, like the fall of Berlin Walls may have a big
effect on stock returns but it is difficult to construct an index of crucial political episodes (Claude et al.
1996).
Even though this study primarily leans on Chen et al. (1986) paper it faces some limitations while
implementing some aspects of CRR methodological framework. The primary feature of the PMF
approach is its lack of formal theoretical guidance for choosing the variables. There is ‘no fixed
number of variables’ that one has to incorporate in the PMF framework. As a result, procedures for
selecting an appropriate set are informal at best. The lack of a defined framework is prominent given
the highly correlated nature of many economic time series variables. Macroeconomic data are also
vulnerable to measurement problems especially over short horizons (Chen and Jordan, 1993).
However, as the study by Chen and Jordan (1993) demonstrate there is insignificant difference in terms
of results when both exploratory factor and pre-specified macroeconomic factors approaches are
compared but PMF seems to perform better.
After personal meetings with the officials of Bangladesh Bank Statistic Dept. it is found that there is no
recorded data for ‘expected rate of inflation’ before 2008. Besides, inflation is a controversial issue in

11
Bangladeshi politics and its data is reported to be manipulated.6 Considering all these limitations, this
study cannot formulate ‘unanticipated’ change in inflation. Instead, it uses a proxy variable-CPI
National Index to reflect changes in inflation. The variable ‘term structure’ faces similar problems. In
Bangladesh, the use of Bond and T-bill is still infrequent. During 1996-2005 periods t-bill rate and
bond rate have remained unchanged month after month which is why it is not included in the
regression. Taking all these factors into account this study chooses seven macroeconomic factors (in
contrast to five such factors in CRR): 1) Change in Industrial Production Index 2) Changes in
Exchange Rate 3) Change in CPI National Index 4) Change in Export 5) Change is Interest Rate 6)
Change in Money supply 7) Change in Import. All these factors are found to be priced in various
studies in varying contexts. To test the APT using pre-specified macro-economic factors, following
two-pass regression methodology is used for the period 1996-2010. Time series data are collected for
23 stocks and then monthly time series of stock return data for 180 months is computed using the
formula: StRnit= Ft+1-Ft/Ft, where i is the individual stock in month t and F is the return value of the
stock i in the corresponding month. There are total 179 observations instead of 180 as the macro
variables are measured in rates of change instead of absolute values. The rate of change is calculated
using logarithmic differencing which renders the series stationary. Time-series regressions of asset
returns on macro-variables is first estimated for each stock i to obtain asset sensitivities, known as
‘factor betas,’ denoted by βi = (βi1, βi2 ... βik), where k is the number of factor betas.
Rit = αi+ βi1 F1 + βi2 F2 + .... + βikFk + eit ........................................(1.1)
where Rit is the return of the stock i at month t, αi is the stock specific effect for stock i, Fj’s (
j=1,2,....k) are macroeconomic factors (or factor scores),all of which are specified in the Appendix 1
and eit are the unsystematic return components of the stocks. Using these factor sensitivities as
independent variable and stock average returns as dependent variable, the following second 2nd
pass
cross-sectional regression is run to test which factors are priced:
Ri = δ0 + δi1 β1 + δi2 β2+ ... + δik βk .................................................. (1.2)

12
where is the average monthly return for security and δ0 is the constant and δi = (δi1 ... δik ) are
coefficients of sensitivities of asset returns to changes in macroeconomic factors. The coefficients of
factor sensitivities in the 2nd
pass regression measure the size and significance of the estimated risk
premium related with each macro factor. The whole process is repeated to obtain regression results for
two sub-periods: i) December 1995 to November 2001 ii) December 2001 to November 2010. The
reason for this division is to account for the implausible movements in DSE index that occurred during
1996-98 periods as well as periodic fluctuations of DSE index that originate from speculation of
political events and unidentified reasons. Moreover, regressions on sub-periods help to analyse stability
factor. A sub-period needs to contain 60 months as a prerequisite to effect substantial interpretation of
results according to CRR methodology.
V. DATA:
The Data consists of 23 most actively traded stocks from DSE covering the period from December
1995 to November 2010. Stock returns data are collected in Compact Disk format from the office of
Dhaka Stock Exchange and put into time series form.8 Macroeconomic variable data are collected from
International Financial Statistics (IMF) database and ‘Monthly Economic Trends’ of Bangladesh Bank.
The IFS database contains time series data for over two hundred countries in the world on a wide range
of economic topics. However, the IFS database does not contain recent figures (2010 onward) for
macro-variables that are used in this study. Moreover, it has a few missing observations it its time
series data. The missing observations and recent estimates of macroeconomic variables are collected
from ‘Monthly Economic Trends’ of Bangladesh Bank- a monthly journal available on its website.9
The dataset used in this study has limitation being a ‘developing country data’ which is less reliable
from that of developed countries. This is so because in developing countries data is not recorded and
preserved well. The key institution responsible for recording data in Bangladesh is Bangladesh Bureau
of Statistics, and it is found that it does not have recorded macro variables data prior to 2000. The
statistic department of Bangladesh Bank publishes Monthly Economic Trends but it does not preserve
13
macro-variables in time series format. Moreover, after personal investigation, the researcher finds that
neither Bangladesh Bank nor Bangladesh Bureau of Statistics have developed statistically reliable data
recording process. One instance of this is found in various copies of ‘Monthly Economic Trends’ in
which figures for the same indicator is found to be different in various issues.10
The stock returns data
are recorded on a daily basis, and are found to be in acceptable condition, and these same data are used
in a number of studies mentioned in the preceding section. The stock return dataset contains seventeen
missing observations. To proxy for all these observations similar industry return data is used.
Furthermore, in developing countries macroeconomic data is reported to be manipulated in favor of the
government.11
The data shows that average returns for all the stocks are positive. Three stocks are
found to be negatively skewed and some stocks demonstrate very high Kurtosis e.g. 114.088. The
standard deviation of the overall stock return data is medium.
V.I. Dhaka Stock Exchange: some findings:
During a transition of government in 1996 the DSE index has risen sharply without any reference to
the market fundamentals. On 31 May 1996 the DSE index was 804 which then rose to 3596 by 17 Nov
1996 and then plunged to 622.28 on 16 April 1998. The instances of such fluctuation are a common
characteristic of DSE. As recent as in Dec 2010 the DSE index rose to all-time high and then
plummeted and then mounted again followed by a steep fall. All these events have taken place in a
week’s time.12
Basher et al. (2007) find that Time-varying volatility and equity returns for the DSE
returns show negative skewness, excess kurtosis and deviation from normality. Furthermore, in
Bangladesh the processing of new information is weak because of the presence of a large number of
non-actively traded shares and inadequate institutional background for broker houses and mutual
funds. In conjunction with all these facts and results Mollik and Bepari (2009) find Dhaka Stock
Market to be ‘weak-form inefficient’ while a study (Mollik and Bepari , 2010) by the same authors
investigates beta-instability in DSE over a period of 2000-07 and show that beta is highly unstable and
this instability increases with holding periods.
14
VI. RESEARCH FINDINGS ANALYSIS:
VI.I. Derivation of Principal Components:
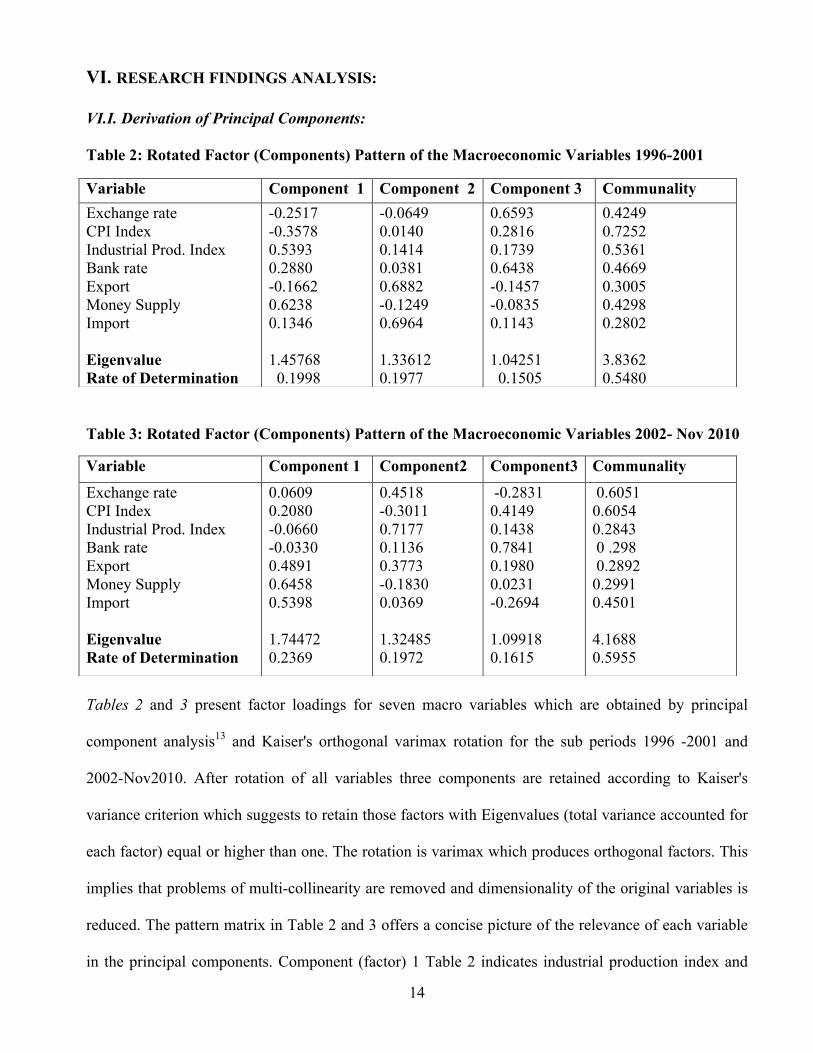
Table 2: Rotated Factor (Components) Pattern of the Macroeconomic Variables 1996-2001
Table 3: Rotated Factor (Components) Pattern of the Macroeconomic Variables 2002- Nov 2010
Tables 2 and 3 present factor loadings for seven macro variables which are obtained by principal
component analysis13
and Kaiser's orthogonal varimax rotation for the sub periods 1996 -2001 and
2002-Nov2010. After rotation of all variables three components are retained according to Kaiser's
variance criterion which suggests to retain those factors with Eigenvalues (total variance accounted for
each factor) equal or higher than one. The rotation is varimax which produces orthogonal factors. This
implies that problems of multi-collinearity are removed and dimensionality of the original variables is
reduced. The pattern matrix in Table 2 and 3 offers a concise picture of the relevance of each variable
in the principal components. Component (factor) 1 Table 2 indicates industrial production index and
Variable Component 1 Component 2 Component 3 Communality
Exchange rate
CPI Index
Industrial Prod. Index
Bank rate
Export
Money Supply
Import
Eigenvalue
Rate of Determination
-0.2517
-0.3578
0.5393
0.2880
-0.1662
0.6238
0.1346
1.45768
0.1998
-0.0649
0.0140
0.1414
0.0381
0.6882
-0.1249
0.6964
1.33612
0.1977
0.6593
0.2816
0.1739
0.6438
-0.1457
-0.0835
0.1143
1.04251
0.1505
0.4249
0.7252
0.5361
0.4669
0.3005
0.4298
0.2802
3.8362
0.5480
Variable Component 1 Component2 Component3 Communality
Exchange rate
CPI Index
Industrial Prod. Index
Bank rate
Export
Money Supply
Import
Eigenvalue
Rate of Determination
0.0609
0.2080
-0.0660
-0.0330
0.4891
0.6458
0.5398
1.74472
0.2369
0.4518
-0.3011
0.7177
0.1136
0.3773
-0.1830
0.0369
1.32485
0.1972
-0.2831
0.4149
0.1438
0.7841
0.1980
0.0231
-0.2694
1.09918
0.1615
0.6051
0.6054
0.2843
0 .298
0.2892
0.2991
0.4501
4.1688
0.5955

15
money supply since these have the highest factor loadings (correlation with the factor scores) in it
while Component 2 represents import and export for similar reasons. Component 3 refers to exchange
rate, bank rate and inflation. The coefficients of all respective components show positive sign.
Communality is the variance that is ‘unique’ to the variable and not shared by other variables e.g.
42.49% of variance in variable exchange rate is not shared by any other factor. The total variance
explained by all factors in Table 2 is 54.80%. Analogously in Table 3, export, money supply and
import correspond to component 1 and exchange rate and industrial production represent component 2.
The last component represents remaining factors by its corresponding high loadings and total variance
accounted for all components is 59.55%. Similar process is employed to extract PCs for the period
1996-2010.
VI.II. First Pass Regression and Robustness of the results:
First pass regression is carried out according to the equation below:
Rit = αi+ βi1 F1 + βi2 F2 + .... + βikFk + eit
An aggregate of 138 time series regressions are carried out employing PCs as wells as without PCs as
explanatory variables. This is done to add robustness to the findings. One period has 23 regressions and
a complete set (e.g. using PCA) has three different periods and two such sets add up to 138 equations.
The R2 range and F-value range exhibit medium strength compared to other studies (e.g. Gunsel and
Cukur, 2007). The highest R2 value found in regression using seven macro-variables is 30% while that
of the lowest value is 0.31%. The range of the F-value shows similar fluctuation from 3.98 to 0.08.
Most of the values in both F-test and R2 range however, lie in the middle of the highest and the lowest
value. The large fluctuation implies some stocks are inactive while others are hyper-active and
equities’ varying degree of responsiveness to macro factors. Similarly, the F-value and R2 range show
large variation when regression is done using PCs in all the three periods. The highest value for F-
statistics and R2 are 9.38 and 29.27% while lowest values are 0.11% and 0.07 respectively. To check

16
serial correlation of stock returns data Breusch-Godfrey LM test is carried out after each of 138
regressions. Table 4 and 5 demonstrate whether autocorrelation is present in the results.
Table 4: Autocorrelation Test of Regression Output (First Pass) Using Macro-variables (1996-2010)
Notes: dependent variable: monthly stock returns; independent variables: changes in macro variables (7) *Tested with 1 lags (1 degree of freedom); ** Serially correlated; ***12 lags (12 degrees of freedom).
Table 5: Autocorrelation Test of Regression Output (First Pass) Using PCs (1996-2001)
Reg 1 Reg 2 Reg 3 Reg 4 Reg 5 Reg 6 Reg 7
Breusch-
Godfrey
LM
(1)***
2.763 1.761 0.047 0.028 15.913* 0.784 3.468
Reg 8 Reg 9 Reg 10 Reg 11 Reg 12 Reg 13 Reg 14 Reg 15
Breusch-
Godfrey
LM (1)
2.145 0.434 2.955 0.136 2.337 15.157* 2.687 0.271
Reg 16 Reg 17 Reg 18 Reg 19 Reg 20 Reg 21 Reg 22 Reg 23
Breusch-
Godfrey
LM (1)
0.198 0.141 2.958 19.921* 7.352
**
0.735 1.032 1.400
Notes: dependent variable: monthly stock returns; independent variables: principal components (3)
*Tested with 12 lags (12 degree of freedom); ** Serially correlated; ***1 lags (1 degrees of freedom)
Table 4 and 5 show Autocorrelation results for two different periods. Some of the tests in both tables
are done using 12 degrees of freedom since observations one year ago can influence present value. The
results in other periods show no autocorrelation. Table 4 exhibits presence of autocorrelation in three
cases where as Table 5, for that matter does in one instance. Thus evidence of autocorrelation is
minimal. This result is comparable to that of Gunsel and Cukur (2007) and Febrian and Herwany
(2010).
Reg 1 Reg 2 Reg 3 Reg 4 Reg 5 Reg 6 Reg 7
Breusch-
Godfrey
LM
(12)***
16.994 1.734* 12.954 17.593 10.810 12.495 1.465*
Reg 8 Reg 9 Reg 10 Reg 11 Reg 12 Reg 13 Reg 14 Reg 15
Breusch-
Godfrey
LM (12)
12.656 11.792 8.309 6.820 7.080 22.491** 18.070 13.961
Reg 16 Reg 17 Reg 18 Reg 19 Reg 20 Reg 21 Reg 22 Reg 23
Breusch-
Godfrey
LM (12)
0.875* 6.016 13.343 24.628** 30.222** 10.144 4.115 19.850

17
VI.III. Analysis of 2nd
Pass Regression:
The 2nd
Pass cross-sectional regression results are obtained using the equation below where,
Ri = δ0 + δi1 β1 + δi2 β2+ ... + δik βk
dependent variable is the Average Monthly Return and independent variables are factor betas
calculated in First Pass.
Table 6: Results of Cross Sectional Regression (2nd
pass) Using Principal Components (3periods)
Period Constant δComp1 δComp2 δComp3 R2 F-
value
Breusch-Pagan
Test - chi2(3)c
1996-10
1996-01
2002-10
0.025645
(5.76)b
0.028952
(6.61)b
0.0260347
(5.14)b
0.2839103
(1.45 )
-0.10001
(-0.62)
-.1084147
(0.04)
0.392069
(1.02)
-0.18939
(-2.03)a
.3357553
(1.03)
-0.24393
(-0.86)
0.42962
(1.45)
.0153012
(-0.44)
0.1388
0.1871
0.0551
1.02
1.46
0.37
14.49
16.40
5.28b
Notes: dependent variable: average monthly stock returns; independent variables: sensitivities of asset
returns to Principal Components derived; (t-values in parentheses),asignificant at 0.10 level,
bsignificant at 0.05 level,
cthree
degrees of freedom.
Table 6 shows results of 2nd
Pass regression in which only one factor is found to be priced at 10% level
of significance in all the different periods. However, high t-values of constant indicate association of
additional state variables that are not included in the study. From the preceding section it is known that
component2 represents export and import and they exhibit negative relation with the stock returns. The
R2 shows low value in sub-period 2002-10 and in other periods it is comparatively higher though not
high enough to render the results stable. The F-values in all periods are insignificant since Fcritical at 5%
level of significance lies above all of them. This result is similar to what is found for Finnish Stock
market by Martikainen et al. (1991) in one of the sub periods. But since regression contains only 23
observations F-test becomes predictable. Breusch-Pagan test of heteroskedasticity shows only results
18
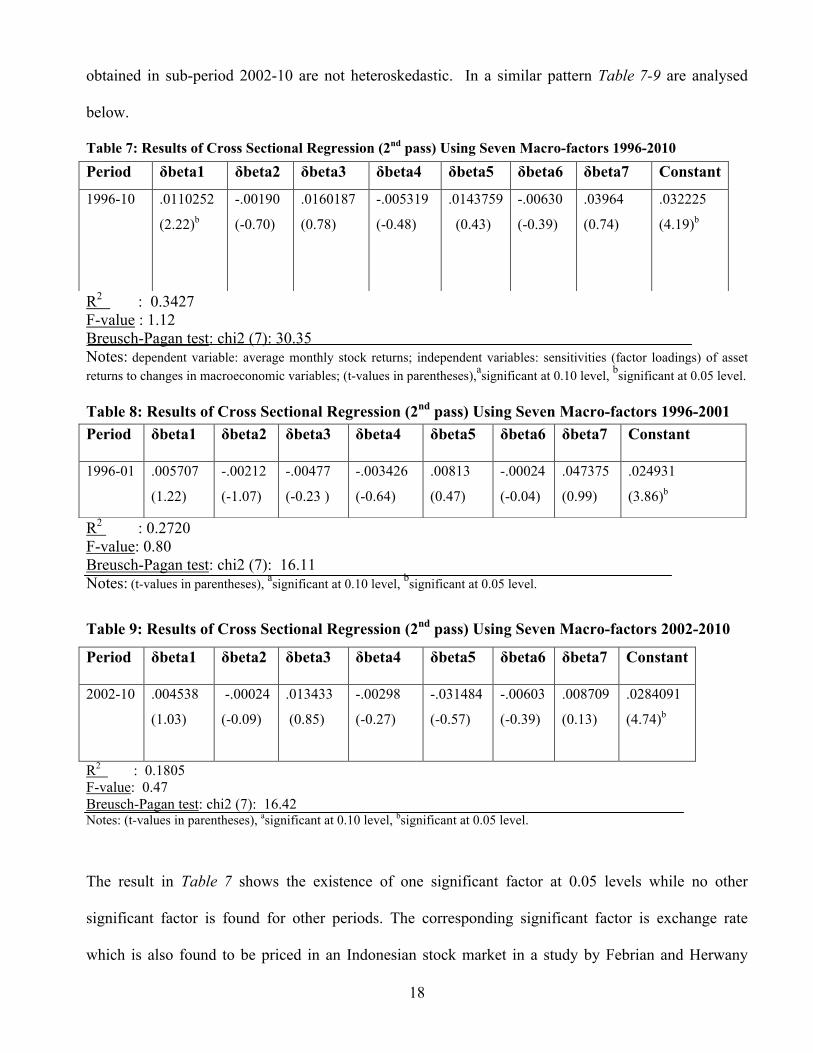
obtained in sub-period 2002-10 are not heteroskedastic. In a similar pattern Table 7-9 are analysed
below.
Table 7: Results of Cross Sectional Regression (2nd
pass) Using Seven Macro-factors 1996-2010
R2 : 0.3427
F-value : 1.12
Breusch-Pagan test: chi2 (7): 30.35
Notes: dependent variable: average monthly stock returns; independent variables: sensitivities (factor loadings) of asset
returns to changes in macroeconomic variables; (t-values in parentheses),asignificant at 0.10 level,
bsignificant at 0.05 level.
Table 8: Results of Cross Sectional Regression (2nd
pass) Using Seven Macro-factors 1996-2001
R2 : 0.2720
F-value: 0.80
Breusch-Pagan test: chi2 (7): 16.11
Notes: (t-values in parentheses), asignificant at 0.10 level,
bsignificant at 0.05 level.
Table 9: Results of Cross Sectional Regression (2nd
pass) Using Seven Macro-factors 2002-2010
Period δbeta1 δbeta2 δbeta3 δbeta4 δbeta5 δbeta6 δbeta7 Constant
2002-10
.004538
(1.03)
-.00024
(-0.09)
.013433
(0.85)
-.00298
(-0.27)
-.031484
(-0.57)
-.00603
(-0.39)
.008709
(0.13)
.0284091
(4.74)b
R2 : 0.1805
F-value: 0.47
Breusch-Pagan test: chi2 (7): 16.42 Notes: (t-values in parentheses), asignificant at 0.10 level, bsignificant at 0.05 level.
The result in Table 7 shows the existence of one significant factor at 0.05 levels while no other
significant factor is found for other periods. The corresponding significant factor is exchange rate
which is also found to be priced in an Indonesian stock market in a study by Febrian and Herwany
Period δbeta1 δbeta2 δbeta3 δbeta4 δbeta5 δbeta6 δbeta7 Constant
1996-10
.0110252
(2.22)b
-.00190
(-0.70)
.0160187
(0.78)
-.005319
(-0.48)
.0143759
(0.43)
-.00630
(-0.39)
.03964
(0.74)
.032225
(4.19)b
Period δbeta1 δbeta2 δbeta3 δbeta4 δbeta5 δbeta6 δbeta7 Constant
1996-01
.005707
(1.22)
-.00212
(-1.07)
-.00477
(-0.23 )
-.003426
(-0.64)
.00813
(0.47)
-.00024
(-0.04)
.047375
(0.99)
.024931
(3.86)b

19
(2010). The R2 shows relatively higher values particularly in 1996-2010 periods when it is 34.27%
compared to that of Table 6 but F-values are lower as compared with those of Table 6. The constants
are significant in all cases and test of heteroskedasticity is not passed in any cases. To correct for
heteroskedasticity different functional forms are attempted for dependent variable but these renders t-
values insignificant after corrected forms of variable is regressed. The coefficient of beta-2 is inflation
which shows negative association with stock returns. This is consistent with the result found in Asprem
(1989), Chen et al. (1986), and Kaul (1987) who all attempt to explain negative relationship between
inflation and stock returns. Although there is no theoretical basis for the signs of state variables as
noted by CRR yet their signs are indicative of the plausible relation between stock returns and
macroeconomic factors. Table 7-9 shows signs of inflation (beta 2) and bank rate (beta 4) to be
negative while that of industrial production to be positive (except for one period) which is consistent
with CRR and Febrian and Herwany (2010) findings. The signs of export (except in one instance) and
import are positive while that of money supply is negative similar to what is found in Türsoy et al.
(2008) and Azeez and Yonezawa (2006). Although CRR finds five priced factors their results lack
robustness which is fully addressed by Shanken and Weinstein (2006) in a seminal paper in which they
use same data but find no significant factors in one of the sub-periods as opposed to five factors found
in CRR for the same period. They only find one priced factor in the overall period of 1958-83, thus
subjecting CRR results to further scrutiny. The F-values (1.27 is highest) found in Shanken and
Weinstein (2006) for the period 1968-77 is similar to what is found in this study. The R2 found in this
study is lower than that of Indian, Indonesian and Pakistani stock markets as evidenced in Dhankar and
ESQ (2005), Febrian and Herwany (2010) and Iqbal and Aziz (2005) respectively while it is similar to
what is evidenced in Turkish Stock Market by Tursoy et al. (2008). The results in this study also show
instability similar to that of Iqbal and Aziz (2005) as a consequence of low R2-adj. All in all, the
findings exhibit similarities to those of Turkish, Pakistani and Indonesian stock markets as discussed in

20
this section. This is encouraging because with longer time horizon and larger sample size the
robustness of the results is likely to be augmented.
VI. IV. A Wider Context of the Results:
Overall, the results demonstrate the existence of one priced factor in DSE but after correcting for
heteroskedasticity t-values become insignificant. The possible reasons are numerous. DSE is shown to
be weak-form inefficient market (Mollik and Bepari, 2009). Moreover, evidence (explored in the
following) suggests that artificial maneuvering by large investors frequently leads to unexpected
fluctuation in stock prices with no relation to market fundamentals. Since DSE is a small market a
syndicate of traders who own large volume of shares would be able to control ‘share price.’ There are
27 broker houses for a total number of 3.5 million investors (increased from 500,000 since 2007) and a
population of 150 million.14
According to Financial Express (Jan 2011a) thousands of accounts (called
‘Beneficiary Owner’ account needed to trade in the secondary market) were opened and broker-house
branches were permitted to operate throughout the country without any intervention of regulatory
bodies to investigate if false accounts were being issued. Despite the increase in number of investors,
the numbers of broker-houses remain proportionately lower. The number of broker-houses in
Bangladesh is proportionately lower than that of Karachi Stock Exchange in Pakistan which has over
600 broker-houses for a population of over 170 million.15
However, Karachi stock market is relatively
larger than the DSE. On 20th
Jan 2011 stock market has had to be suspended as DSE index fell by 600
points in five minutes time. However, such events have occurred in last one month since 20th
Jan’11 as
fig.2 shows below:

21
Fig 216
: DSE Index Movement -22Dec 2010 to 20 Jan 2011.
As the stock market collapsed the Finance Minister of Bangladesh admitted its failure and said that
government has failed to control the market and was unable to track down the ‘‘vicious syndicate’’ of
traders (Financial Express, Jan 2011b). Following the incident, the stock-market regulators suspended
six stockbrokers for one month on charges of manipulation in the secondary market (Daily Star, Jan
2011). An ex-governor of Bangladesh Bank says the recent failure in the stock market could not have
happened if responsible perpetrators were punished in 1996 stock market bubble as referred to in
previous sections (Financial Express, Jan 2011c). Various media reports bring out the following
features of DSE: limited access to information, city centred trading, imperfect trading system and
inadequate learning opportunities for market participants, limited choice for investors in terms of
diversification, and poor regulation, all contribute to the current events of DSE which moreover, are
characteristics of frontier stock markets in general.17
However, even if all of these factors were not
associated there would be no assurance that APT holds well in Bangladesh since movement in stock
prices does not always depend on market fundamentals as argued in preceding sections.

22
VI.V. Limitation of Findings:
This study has limitations in different dimensions. The data horizon of this study is shorter by eleven
years than that of CRR (1986) research. But data are not available in Bangladesh to extend the time-
period of the study. The number of stocks selected for this study is small. With a larger sample size, the
robustness of the results is expected to increase. Important factors like unanticipated inflation and term
structure rates are not incorporated in the regression as in CRR since relevant data and context, as
explained in the previous section, are not found. Finally, the research is conducted only on one frontier
stock market. A comparison with other frontier stock markets would be insightful.
VII. CONCLUSION:
This paper assesses the performance of APT in a frontier stock market in Bangladesh. To test the
applicability of APT, this study employs CRR (1986) methodology and uses data for the period 1996-
2010. To address the problem of multi-collinearity in macro-variables, this study uses principal
component analysis. Only exchange rate is found to be priced out of seven macroeconomic variables.
However, the results should be treated with caution as the significance of t-values has altered after
correcting for heteroskedasticity. The focus of this research is a frontier stock market, and it is a first of
its kind in this respect since previous studies are administered in the context of secondary emerging,
advanced emerging and developed stock markets. Nevertheless, the evidence found in this study is
comparable to that of Turkish and Pakistani stock markets taking into account the latter are ‘secondary
emerging stock markets.’
The principles of APT are derived from the hypothesis that there are systematic sources of risks in the
economy that are represented by state-variables that affect all equity returns. This is consistent with the
efficiency market hypothesis that states factors influencing stock prices should be justified by ‘market
fundamentals.’ In contrast, the arguments of Shiller (2005) provide an alternative paradigm which state
that stock prices are not exhausted by the unique influence of state-variables. The presence of non-
quantifiable factors such as ‘market psychology’ also plays a part in explaining the stock returns. The
23
domain of behavioral finance presents evidence to this regard which is discussed at length. Earlier
studies (e.g. Mollik and Bepari, 2009) find that DSE is ‘weak-form inefficient’ and evidence in the
‘Findings’ section demonstrates the presence of non-quantifiable factors such as artificial manipulation
of share-price etc. in DSE which are consistent with the proposition of behavioral finance. Thus, both
null hypotheses are rejected in favor of the alternative. The implication of all these conclusions bears
meanings for the investment community in that investment decision, in a frontier stock market is likely
to be governed by uncertain factors. However, as ‘antecedent discussion’ of this study argues it is far
from being settled ‘what factors constitute stock returns’ and the wide array of approaches employed
by researchers make it difficult to confer a conclusion in this regard. There exists no ‘holistic model’
which accounts for both quantifiable and non-quantifiable factors that affect stock returns. However, a
detailed discussion of such model is beyond the scope of this study and should be extended for future
research. The criticism that many studies of APT suffer from ‘pricing error’ (see e.g. Zhang and Wang,
2006), and robustness check, is addressed in the present study. To improve the results further, this
study recommends using longer period of data with more frequent stock trading e.g. weekly returns
data, as well as larger sample size and incorporating more macro variables. Since the focus of this
study is a frontier stock market, a comparative study of APT on two or more frontier stock markets
should constitute for future research to gain relevant insights.
24
Endnotes: 1 Frontier stock markets are less advanced and very small capital markets from the developing world
e.g. Bangladesh, Botswana, and Serbia etc. Definition adapted from Investopedia at
(http://www.investopedia.com/terms/f/frontier-market.asp). FTSE Global Equity Index publishes
‘ranking’ of all different stock markets at
http://www.ftse.com/Indices/FTSE_Frontier_Indices/index.jsp
2 MC calculated before ‘Sub-prime crisis’ occurred in 2007 because after the crisis the respective MCs
of different stock markets were changed as some countries remained less affected by the crisis.
3 Inter-temporal capital asset pricing model developed from portfolio selection behaviour is an
equilibrium model.
4 According to the EMH, stocks always trade at their fair value on stock exchanges, which makes it unattainable
for investors to either purchase undervalued stocks or sell stocks for inflated prices. Although it is a foundation
of modern financial theory, the EMH is very controversial.
5 Shiller draws the example of ‘Fall of Rome’ to demonstrate that exact quantifiable reasons cannot be
constructed to explain such phenomenon.
6 One example of contradictory inflation figures is seen in the dataset obtained from IFS in which ‘rate
of inflation’ significant differs from ‘CPI index’ during 2000-02 periods.
7Figures calculated from Export Promotion Bureau Bangladesh at
http://www.epb.gov.bd/index.php?NoParameter&Theme=default&Script=publication
8 data is collected in person and it is found in excel sheet with returns against specific dates.
9 In the IFS dataset 37 missing observations were found which were then collected from various issues
of Monthly Economic Trends.
10 a few observations for ‘money supply’ were found to be different in different issues which were then
adjusted by taking their ‘average’ values.
11 since there is no unbiased transparent institution for overseeing statistical record there is an
opportunity for government to manipulate data in its favor.
12source: index chart of DSE it its website at www.dsebd.org
13 principal components are obtained using relevant commands in the STATA. There are different methods to
obtain principal components e.g. Martikainen et al. (1991) obtain PCs using ‘principal component factoring’
(pcf) whereas this study derives PCs using PCA which retains some correlatedness unlike principal component
factoring which completely removes ‘correlation.’ However, regressions are conducted using pcf as well and the
results do not show any significant alteration.
14 source: Bangladesh Trade Directory available at http://www.bangladeshtrades.com/bangladesh-
business/stock-market-bd/bangladesh-stock-brokers-house-4.html

25
15 source: Pakistan Stock Exchange at http://stockexchangepakistan.info/karachi-stock-exchange-list-
of-members/
16 source: Financial Times on 21
st Jan 2011 available at http://www.thefinancialexpress-
bd.com/more.php?news_id=123566&img=1&date=2011-01-21
17 source: various issues of the Financial Express, the Daily Star, Prothom Alo, and Amar-Desh
collected online from www.sonarbangladesh.com
Appendix I:
Variable Specification:
Inflation Rate:
A number of studies find Equity returns to be negatively associated with inflation (see e.g. Fama, 1981;
Kaul, 1987). Change in Inflation is calculated as follows:
R(INFj)t = Ln (INFj)t – Ln(INFj)t-1
where R(INFj)t: change in inflation; Ln (INFj)t – Ln(INFj)t-1: Monthly logarithmic difference of
inflation (series).
Industrial production Index:
The profitability, spending, and employment level of a firm is affected by fluctuations in industrial
production. The series is computed as follows:
R(IPDj)t = Ln (IPDj)t – Ln(IPDj)t-1
where R(IPDj)t: change in Industrial production index ; Ln (IPDj)t – Ln(IPDj)t-1 : Monthly logarithmic
difference of IPD(series).
Money Supply:
In this study M0 (measure of broad money) is used which is consistent and widely used across several
studies and the series is measured using the same procedure as in the case of inflation.
Export:
Export sector is a blooming industry in Bangladesh. In 1980 the total value of export was 1000 USD
millions where as in 2006 the figure rose to 12000USD millions. In real terms that is more than 250%
increase.7 A number of studies such as Beenstock and Chan (1988) use Export variable in their
research. The series is obtained through calculating logarithmic difference in every month.
Bank Rate:
Unlike developed economies where interest rate is fixed by the Central Bank every month Bangladesh
Bank does not publish separate ‘bank rate.’ What is used as an interest rate variable is the average of
borrowing and lending rate which is available from the journal of Bangladesh Bank.
Import:
The series is obtained using the same procedure as in the case of variable Export.

26
References: Azeez, A. and Yonezawa Y.,(2004). ‘‘Macroeconomic factors and the empirical content of the
Arbitrage Pricing Theory in the Japanese stock market’’, Japan and the World Economy,18 (2006)
568–591.
Akerlof, A. G. and Shiller, J.R. (2009, pp. 130-35). ‘Animal Spirits: How Human Psychology Drives
the Economy, and Why it Matters for Global Capitalism,’ (Princeton University Press, Princeton and
Oxford, 2009).
Asprm, M. (1989), Stock prices, Asset portfolios and Macroeconomic variables in ten European
countries, Journal of Banking and Finance, 13, 589-612.
Altay, E., (2003). “The Effect of Macroeconomic Factors on Asset Returns: A Comparative
Analysis of the German and the Turkish Stock Markets in an APT Framework”, Martin-Luther-
Universität Halle, Betriebswirtschaftliche Diskussionsbeiträge, Nr. 48/2003
Barberis, C., and Thaler, H. C.(2003). ‘A Survey of Behavioural Finance.’ In: George M.
CONSTANTINIDES, Milton HARRIS, and Rene M. STULZ, eds. Handbook of the Economics of
Finance: Volume 1B, Financial Markets and Asset Pricing. Elsevier North Holland, Chapter 18, pp.
1053{1128.
Brennan. J.M. (1971). "Capital Asset Pricing and the Structure of Security Returns." Unpublished
manuscript, University of British Columbia.
Brown,S.J. and M.I.Weinstein (1983), “A New Approach to Testing Asset Pricing Models: The
Bilinear Paradigm”, The Journal of Finance, Vol.38, pp.711-744.
Bansal, R., and Viswanathan, S. (1993), No arbitrage and arbitrage pricing: A new approach, Journal
of Finance, 48, 1231–1262.
Burmeister,E. and M.B.McElroy (1988), “Joint Estimation of Factor Sensitivities and Risk Premia for
the Arbitrage Pricing Theory”, The Journal of Finance, Vol.43, no.3, pp.721-735.
Bodie, J. and, Kane, A. and Marcus, A. (2009). ‘Investments.’ Publisher: McGraw-Hill Higher
Education; 9e edition ISBN-13: 978-0071263252
Basher, A.S. and Hassanb,K.M. and Islam, M.A. (2007). ‘Time-varying volatility and equity returns in
Bangladesh stock market.’ Applied Financial Economics, 2007, 17, 1393–1407
Chiu, K. and Xu, L. (2004). ‘Arbitrage pricing theory-based Gaussian temporal factor analysis for
adaptive portfolio management,’ Decision Support Systems 37 (2004) 485– 500
Chen, S.J. and Jordan, B. (1993), “Some Empirical Tests of the Arbitrage Pricing Theory:
Macrovariables vs. Derived Factors”, Journal of Banking and Finance, Vol.17, pp.65-89.

27
Cox, J., Ingersoll, J., Ross, S., (1985). An intertemporal general equilibrium model of asset prices.
Econometrica 53, 363–384.
Chen, N. (1983), “Some Empirical Tests of the Theory of Arbitrage Pricing”, The Journal of Finance,
Vol.38, pp.1393-1414.
Chen, N.F., R.Roll and S.Ross (1986), “Economic Forces and the Stock Market”, Journal of Business,
Vol.59, pp.383-403.
Cho, D.C., E.J.Elton and M.J.Gruber (1984), “On the Robustness of the Roll and Ross Arbitrage
Pricing Theory”, Journal of Financial and Quantitative Analysis, Vol.19, no.1, pp.1-10.
Claude, B. E., and Harvey, R.C. and Viskanta, E.T. (1996). ‘Political Risk, Economic Risk, and
Financial Risk.’Source: Financial Analysts Journal, Vol. 52, No. 6 (Nov. - Dec., 1996), pp. 29-46
Drew, E.M. and Naughton, T.and Veeraraghavan, V. (2003). ‘Firm Size, Book-to-Market Equity and
Security Returns: Evidence from the Shanghai Stock Exchange,’ Australian Journal of Management,
Vol. 28, No. 2 September 2003,
Dhankar, P. and ESQ, M (2005). ‘‘ARBITRAGE PRICING THEORY AND THE CAPITAL ASSET
PRICING MODEL EVIDENCE EROM THE INDIAN STOCK MARKET.’’ Journal of Financial
Management and Analysis, 18(I):2005:14-27
Dhrymes, P.J., I.Friend and N.B.Gultekin (1984), “A Critical Reexamination of the Empirical
Evidence on the Arbitrage Pricing Theory”, The Journal of Finance, Vol.39, no.2, pp.323-346.
Febrian, E and Herwany, A. (2010). ‘‘THE PERFORMANCE OF ASSET PRICING MODELS
BEFORE, DURING, AND AFTER AN EMERGING MARKET FINANCIAL CRISIS: EVIDENCE
FROM INDONESIA.’’ The International Journal of Business and Finance Research ♦ Volume 4 ♦
Number 1 ♦ 2010.
Farmer, R.E.A. (2009) ‘Confidence, Crashes and Animal Spirits’, NBER working paper #14846,
National Bureau of Economic Research, Cambridge, MA.
Flury, B. and Riedwyl, H. (1988). Multivariate Statistics. A Practical Approach. London: Chapman
and Hall.
Fama, E . and MacBeth, J.(1973). “Risk, Return, and Equilibrium: Empirical Tests.” Journal of
Political Economy. 81:3, pp. 607–36.
Fama, E. F. (1981), Stock returns, real activity, inflation, and money, American Economic Review, 71,
545-65.
Fama, E. and French. R. K. (1992). “The Cross-Section of Expected Stock Returns.” Journal of
Finance. 47:2, pp. 427–65.
28
Fama, E. and French, K.R.(1993), ‘Common risk factors in the returns on stocks and bonds’, Journal
of Financial Economics, Vol. 33, 1993, pp. 3–56.
Fama, E. and French, K.(1996). ‘Multifactor explanations for asset pricing anomalies’, Journal of
Finance, Vol. 51, 1996, pp. 55–84.
Fama, F. E, and French, R. K. (2004). ‘The Capital Asset Pricing Model: Theory and Evidence,
Journal of Economic Perspectives—Volume 18, Number 3—Summer 2004—Pages 25–46
Ferreira, M.H. P and Rocha, R. A. (2002). ‘An Autoregressive Approach of
the Arbitrage Pricing Model to the Portuguese Stock Market.’ International Journal of Business,
2002, v. 7, issue. 2, pp. 37-52
Gehr, A.(1975). Some Tests of the Arbitrage Pricing Theory, Journal of Midwest Finance Association,
pp. 91–105.
Grinblatt, M and Titman, S. (2002, pp-186). ‘Financial Markets and Corporate Strategy,’’ (2nd
edition), McGraw Hill Higher Education, NY 10020.
Ikbal and Aziz, 2005. ‘‘Arbitrage pricing theory: evidence from an emerging stock market,’’ Munich
Personal RePEc Archive. Online at http://mpra.ub.uni-muenchen.de/8699/ MPRA Paper No. 8699,
posted 10. May 2008 / 10:45
Kandel, S., Stambaugh, R.(1987). On correlations and inferences about mean variance efficiency.
Journal of Financial Economics 18, 61– 90.
Kaul, G. 1987, Stock returns and inflation. The role of the monetary sector, Journal of Financial
Economics, 18, 253-276
Lintner, J. (1965). The valuation of risk assets and the selection of risky investments in stock portfolios
and capital budgets. Review of Economics and Statistics 47 (February): 13–37 .
Lehman, B.N. and Modest, M. (1988), “The Empirical Foundations of the Arbitrage Pricing Theory”,
Journal of Financial Economics, Vol.21, pp.213-254.
Mei, J. (1993), “A Semiautoregression Approach to the Arbitrage Pricing Theory”, The Journal of
Finance, Vol.48, pp.599-620.
Michailidis, G. (2009). ‘Multivariate methods in examining macroeconomic variables effect on Greek
stock market returns, 1997-2004.’ Applied Econometrics and International Development, 2009, vol. 9,
issue 1
Markowitz, H., (1952). Portfolio selection. Journal of Finance 7, 77-91.
Martikainen, T., Yli-Olli, P. and Gunasekaran, A. (1991), Incremental significance of pre-specified
macroeconomic factors in testing the arbitrage pricing theory: empirical evidence with Finnish data,
Applied Financial Economics, 1, 139-147.

29
Mollik, A.T. and Bepari, M.K. (2009), ‘‘Weak-form market efficiency of Dhaka Stock Exchange
(DSE), Bangladesh (24 August, 2009)’’, Proceedings of the 22nd Australasian Finance and Banking
Conference, Australian School of Business, The University of New South Wales, Sydney, available at
SSRN: http://ssrn.com/abstract-1460536
Mollik, T.A. and Bepari, K.M.(2010). ‘Instability of stock beta in Dhaka Stock Exchange.’
Bangladesh Managerial Finance, Vol. 36 No. 10, 2010: pp. 886-902
Merton, R. C. (1973). “An Intertemporal Capital Asset Pricing Model.” Econometrica. 41:5, pp. 867–
87.
Mossin, J. (1966). "Equilibrium in a Capital Asset Market." Econometrica 34 (October 1966), 768-83.
Ouysse, R and Kohn, R. (2010). ‘Bayesian variable selection and model averaging in the arbitrage
pricing theory model,’ Computational Statistics and Data Analysis, 54 (2010), pp. 3249-3268
Ross,S. (1976), “The Arbitrage Theory of Capital Market Asset Pricing”, Journal of Economic Theory,
Vol.13, pp.341-360.
Ross,S. (1977), “Risk, Return and Arbitrage”, Risk and Return in Finance, I, Friend, and J.Bicksler
(Eds.), Balliner, Cambridge
Roll, R., and Ross, S. (1980). An empirical investigation of the arbitrage pricing theory. Journal of
Finance 35: 1073-1103.
Ross A. S.(1984). ‘Reply to Dhrymes: APT is empirically relevant.’ The Journal of Portfolio
Management Fall 1984, Vol. 11, No. 1: pp. 54-56
Sharpe, W.F. (1964), “Capital Asset Prices: A Theory of Market Equilibrium Under Conditions of
Risk”, Journal of Finance, Vol.19, pp.425-442.
Shanken, J., (1982). The arbitrage pricing theory: is it testable. Journal of Finance 37, 1129–1140.
Shanken, J., (1985). Multi-beta CAPM or equilibrium APT?: a reply. Journal of Finance 40, 1189–
1196.
Shanken, J., (1987). Multivariate proxies and asset pricing relations: living with the roil critique.
Journal of Financial Economics 18, 91– 110.
Shanken, J., (1992). The current state of the arbitrage pricing theory. Journal of Finance 47, 1569–
1574.
Shanken , J. and Weinstein, I. M. (2006). ‘Economic forces and the stock market revisited.’ Journal of
Empirical Finance 13 (2006) 129– 144
Shiller, R. (1981), “Do stock prices move too much to be justified by subsequent changes in
dividends?”, American Economic Review 71:421−436.
30
Shiller, R. (1984), “Stock prices and social dynamics”, Brookings Papers on Economic Activity 2:
457−498.
Shiller, R. and Beltratti, A.(1993). "Actual and Warranted Movements in Asset Prices" Beltratti,
A., Oxford Economic Papers (1993), 45: 387–402. [CFDP 970, CFP 859]
Shiller, J. R. (2005, pp. 110-118). Irrational Exuberance: Second Edition, Publisher: Princeton
University Press; 2nd edition (22 Feb 2005) ISBN-13: 978-0691123356, pp. 172-176
Selden, G. C., (1912). Psychology of the Stock Market: Human Impulses Lead To Speculative
Disasters. New York: Ticker Publishing.
Sewell, M.(2007). ‘Behavioural Finance.’ Available at
http://www.behaviouralfinance.net/behavioural-finance.pdf
Shukla, R. K., and Trzcinka,A. C. (1990), Sequential Tests of the Arbitrage Pricing Theory: A
Comparison of Principal Components and Maximum LikelihoodFactors, Journal of Finance, 45,
1541–1564.
Subrahmanyam, A. (2010). ‘The Cross-Section of Expected Stock Returns: What Have We Learnt
from the Past Twenty-Five Years of Research?’ European Financial Management, Vol. 16, No. 1,
2010, 27–42
Türsoy, T. and Günsel, N. and Rjoub, H. (2008). ‘Macroeconomic Factors, the APT and the Istanbul
Stock Market,’ International Research Journal of Finance and Economics ISSN 1450-2887 Issue 22
Zhang, X. and Wang, Z. (2006). ‘Empirical evaluation of asset pricing models: arbitrage and pricing
errors over contingent claims.’ Paper provided by Federal Reserve Bank of New York in its series Staff
Reports with number 265. Postal: 33 Liberty Street, New York, NY 10045-0001MANAGEMENT
SCIENCE, Vol. 55, No. 7, July 2009, pp. 1255-1266
Zhongzhi L. H, and Huh, S. and Lee, B. (2010). ‘Dynamic Factors and Asset Pricing .’ JOURNAL OF
FINANCIAL AND QUANTITATIVE ANALYSIS Vol. 45, No. 3, June 2010, pp. 707–737
International Financial Statistics (database) available online at http://www.imfstatistics.org/imf/
Dhaka Stock Exchange available at www.dsebd.org
Bangladesh Bank –Monthly Economic Trends (data achieve) available at http://www.bangladesh-
bank.org/
Related Documents