Empirical Problems Using the Efficient Frontier to Find Optimal Weights in Asset Classes Matt Maher Boise State University Harry White Boise State University Phil Fry Boise State University This study documents the transitory nature of “efficient” weights in six commonly employed asset classes, going beyond a simple stock and bond classes and using a 30 year data window. We review the literature on asset class diversification, including its failures during the recent credit crisis. Results show that asset class diversification benefits are inconsistent and, contrary to common academic wisdom before recent times, historical asset class covariances (even estimated with decades of data) are poor estimates of future values. INTRODUCTION The efficient frontier (the highest expected return for a given standard deviation), holds a sacred place in academic finance and has driven much of the world’s movement towards increased diversification. Further, diversification across broad asset classes (stocks, bonds, cash, commodities and real estate for example) is commonly believed to account for the vast majority of long-term portfolio returns and picking the right assets within asset classes for only a smaller proportion. Given the means, standard deviation and covariance’s of the asset classes, linear programming can solve for the weights in the asset classes for different levels of risk tolerance (portfolio standard deviation) so the portfolio is “optimized” (has the highest return/risk profile). A central issue for this research is that asset class weights calculated using the efficient frontier are ill-behaved and startlingly different depending on the length of time and time period chosen to estimate the inputs (asset class mean return, standard deviation, and covariance). Many efficient portfolios have zero weights in most asset classes and huge weights in others, seemingly contradictory for a theory that touts diversification. Further, even small changes in estimated inputs yield wide swings in weights, so it follows that weights change dramatically depending on the length of time (five years, ten years etc.) used to estimate the inputs. These issues are well documented in a vast academic literature, but much of the published research in this area considers only stock diversification or stock/bond diversification issues, not the more practical problem of portfolio weights across a broader, commonly-employed spectrum of asset classes. The Journal of Accounting and Finance vol. 11(4) 2011 47

Welcome message from author
This document is posted to help you gain knowledge. Please leave a comment to let me know what you think about it! Share it to your friends and learn new things together.
Transcript
Empirical Problems Using the Efficient Frontier to Find Optimal Weights in Asset Classes
Matt Maher
Boise State University
Harry White Boise State University
Phil Fry
Boise State University
This study documents the transitory nature of “efficient” weights in six commonly employed asset classes, going beyond a simple stock and bond classes and using a 30 year data window. We review the literature on asset class diversification, including its failures during the recent credit crisis. Results show that asset class diversification benefits are inconsistent and, contrary to common academic wisdom before recent times, historical asset class covariances (even estimated with decades of data) are poor estimates of future values. INTRODUCTION
The efficient frontier (the highest expected return for a given standard deviation), holds a sacred place in academic finance and has driven much of the world’s movement towards increased diversification. Further, diversification across broad asset classes (stocks, bonds, cash, commodities and real estate for example) is commonly believed to account for the vast majority of long-term portfolio returns and picking the right assets within asset classes for only a smaller proportion. Given the means, standard deviation and covariance’s of the asset classes, linear programming can solve for the weights in the asset classes for different levels of risk tolerance (portfolio standard deviation) so the portfolio is “optimized” (has the highest return/risk profile).
A central issue for this research is that asset class weights calculated using the efficient frontier are ill-behaved and startlingly different depending on the length of time and time period chosen to estimate the inputs (asset class mean return, standard deviation, and covariance). Many efficient portfolios have zero weights in most asset classes and huge weights in others, seemingly contradictory for a theory that touts diversification. Further, even small changes in estimated inputs yield wide swings in weights, so it follows that weights change dramatically depending on the length of time (five years, ten years etc.) used to estimate the inputs.
These issues are well documented in a vast academic literature, but much of the published research in this area considers only stock diversification or stock/bond diversification issues, not the more practical problem of portfolio weights across a broader, commonly-employed spectrum of asset classes. The
Journal of Accounting and Finance vol. 11(4) 2011 47
emphasis for this study is to document the transitory nature of “efficient” weights for commonly employed asset classes.
By utilizing index returns for the last thirty years, the change in correlations across asset class returns as well as change in efficient combinations of classes is documented for the entire period compared to a variety of sub-periods. The results highlight the difficulty inherent in using the historical returns to set target weights for portfolio construction going forward. LITERATURE REVIEW
Portfolio optimization techniques are commonly used by sophisticated money managers as a first step in the process of creating a portfolio for new clients. Given the investor’s risk tolerance, portfolio optimization solves for the weights in various asset classes so that the overall portfolio has the highest expected return for the given standard deviation. Optimization techniques are seldom, if ever, employed at the level of individual assets; the resulting large covariance matrices are cumbersome without some serious computing power and many believe covariances for individual assets are too transitory for the past to be reasonable estimates of the future. Common academic wisdom is that asset class weights are far more important than picking the right individual assets, though that contention is not without debate (Ibbotson and Kaplan, 2000; Hood, 2005). In practical applications, the asset class weights derived from the optimization calculations are called “strategic” or long-term weights, which are then adjusted by “tactical” or short-term rationales based on over/under valued asset class metrics or the forecast for the macro economy and associated sensitivities of the asset classes (Haugen, 2001, pp. 177-194). Many financial advisors attempt to sell their ability to predict the future with expensive tactical allocation strategies.
The finance literature has long documented the extreme sensitivity of asset class weights to changes in input variables (asset class means and the covariance matrix). For example, “A surprisingly small increase in the mean of just one asset drives half the securities from the portfolio. Yet the portfolio expected return and standard deviation are virtually unchanged.” (Best and Grauer, 1991, p. 315). The current literature often concentrates on high-powered econometric methods (Bayesian statistics and “shrinking” the covariance matrix) to estimate the inputs. Despite the extra mathematical rigor, overall results show that these strategies do not consistently outperform the simple strategy of allocating 1/N to each asset class (DeMiguel, Garlappi and Uppal. 2007).
Even though optimization methodologies are relatively quantitative in nature there seems to be little consensus about which are the appropriate asset classes; they range from the simple stocks versus bonds to 15-25 different classes that might parse domestic stocks into nine different classes with bond classes also stratified by term and credit risk. Real estate, commodities and venture capital are often separate asset classes. Evidence from professional investors is scant since they like to hedge their pronouncements and seldom provide hard strategic asset allocation targets. Target date (or lifestyle) mutual funds supply some evidence about the diffuse nature of professional advice, however, since they are designed to be an investor’s entire portfolio and automatically switch from relatively risky assets (usually stocks) to safer assets (mostly bonds) as the “target” date approaches (commonly called a “glide path”). Evidence from target date funds shows little consensus for the appropriate asset classes and wild variations in the optimal asset class weights for different funds with the same target date (Maher, White and Schooley, 2010).
Asset class diversification has received extra scrutiny in the last few years for a bad reason; it generally failed to help avoid large portfolio losses in the 2008-2009 liquidity crisis and its aftermath. Two different problems have been posited as key contributors to the poor results. First, correlations between asset classes change dramatically when stock markets have large gains (low correlations) versus when they have large losses (high correlation). Secondly, returns distributions are fat-tailed with far more extreme losses/gains than predicted by the normal distribution. The correlation issue is commonly classified as the “new normal” with “risk off” (good market conditions) and “risk on” (bad) regimes (Page and Taborsky, 2010). There are several corollaries to the fat-tailed returns distribution argument,
48 Journal of Accounting and Finance vol. 11(4) 2011

including volatility clusters and return distribution skewness (different sized positive/negative tails) (Stoyana et. al., 2011).
Even sophisticated diversification strategies such as the “Yale model” cracked under the pressure of the 2008-2009 economic downdraft. In the 2000s, the Yale University endowment leader, Dave Swensen, became the guru of investing into a wide range of alternative assets, including illiquid assets like hedge funds, natural resources and private equity. The basic arguments were that liquidity was overpriced for long-term investors and alternative investments provide low correlations (and increased diversification benefits) for standard asset classes like stocks and bonds ( Leibowitz, Bova and Hammond, 2010). Though the Yale endowment performed admirably over the entire decade through 2009, it lost almost 25% in the year ending June 30, 2009. Basically, correlations between asset classes increased dramatically in the liquidity crisis (Page and Taborsky, 2010) and endowment portfolios traded like the traditional 60 % stock / 40% bond fund in the boom and then were more volatile in the bust (Coggan, 2011).
The recent failure of asset class diversification strategies has led to new research attempting to link systematic risk and asset allocation. The key empirical properties on contagion (systematic risk) are developed, but practical implications for asset allocation are scarce. One approach is to “diversify trends” by linking expectations of different asset classes to macroeconomic variables (Fabozzi and Focaardi, 2010). Another is to employ risk factors (yield curve variables, commodities, credit quality spreads, swap spreads etc.) rather than asset classes. Research shows the risk factors are less correlated with equity markets than asset classes, especially in market downturns (Page and Taborsky, 2010). But effective diversification across risk factors still involves a crystal ball into the future, a prospect less appealing given the spectacular collective failures to foresee the future revealed over the past decade. DATA AND METHODOLOGY
To examine the relative stability of the correlations and resulting optimal mix of assets over different time periods, the monthly returns on six asset class indices were obtained from Morningstar’s ENCORR database for the period January 1979 to May 2010. The indices are the Russell 1000 large cap stock index, the Russell 2000 small cap stock index, the S&P GSCI Index broad based commodities index, the BarCap Aggregate Bond Index of bond returns, the MSCI EAFE Index of international stock returns, and the FTSE NAREIT All REIT Index of real estate returns. All indices are total returns monthly for the time period.
The data was analyzed over the entire period and then divided into sub-periods to examine how the results changed as the time period changed. The sub-periods examined included three ten year periods – the 1980’s, the 1990’s and the 2000’s, and the two twenty year periods at the beginning and the end of the thirty-year overall period. The monthly returns data was used to calculate the correlation coefficients for all the combinations of assets for each of the time periods. The results are shown in Tables 1-6.
The Optimizer program in Morningstar’s ENCORR database was then used to generate the efficient investment frontier for the combinations of the index returns for each to the time periods. The portfolio statistics were calculated for different levels of standard deviation for each of the time periods. These portfolio statistics are also presented in Tables 1-6.
Journal of Accounting and Finance vol. 11(4) 2011 49
TABLE 1 CORRELATION AND PORTFOLIO STATISTICS FOR THE
ENTIRE THIRTY-YEAR PERIOD
Correlations - 1/1979 - 5/2010 N
Periods Russell
1000 TR USD
Russell 2000
TR USD
S&P GSCI
TR
BarCap US
Agg Bond
TR USD
MSCI EAFE USD
FTSE NAREIT
All REITs
TR Russell 1000 TR USD
377 1.0000 0.8525 0.1426 0.2384 0.6378 0.5887
Russell 2000 TR USD
377 0.8525 1.0000 0.1600 0.1409 0.5749 0.6714
S&P GSCI TR 377 0.1426 0.1600 1.0000 -0.0118 0.2153 0.1365 BarCap US Agg Bond TR USD
377 0.2384 0.1409 -0.0118 1.0000 0.1757 0.2388
MSCI EAFE USD
377 0.6378 0.5749 0.2153 0.1757 1.0000 0.4484
FTSE NAREIT All REITs TR
377 0.5887 0.6714 0.1365 0.2388 0.4484 1.0000
Portfolio Statistics - 1/1979 - 5/2010 St.
Dev. 3.0
St. Dev.
4.0
St. Dev.
5.0
Russell 1000
TR USD
Russell 2000
TR USD
S&P GSCI
TR
BarCap US
Agg Bond
TR USD
MSCI EAFE USD
FTSE NAREIT
All REITs
TR
Russell 1000 TR USD
36.95 53.12 9.43 100.00 0.00 0.00 0.00 0.00 0.00
Russell 2000 TR USD
3.87 3.98 62.65 0.00 100.00 0.00 0.00 0.00 0.00
S&P GSCI TR
0.00 0.00 0.00 0.00 0.00 100.00 0.00 0.00 0.00
BarCap US Agg Bond TR USD
33.51 5.74 0.00 0.00 0.00 0.00 100.00 0.00 0.00
MSCI EAFE USD
0.00 0.00 0.00 0.00 0.00 0.00 0.00 100.00 0.00
FTSE NAREIT All REITs TR
25.67 37.16 27.92 0.00 0.00 0.00 0.00 0.00 100.00
Expected Return
0.90 0.99 1.05 1.00 1.07 0.71 0.70 0.68 1.00
Standard Deviation
3.02 4.01 5.01 4.52 5.75 5.64 1.70 5.04 4.94
Sharpe Ratio
0.30 0.25 0.21 0.22 0.19 0.13 0.41 0.13 0.20
50 Journal of Accounting and Finance vol. 11(4) 2011
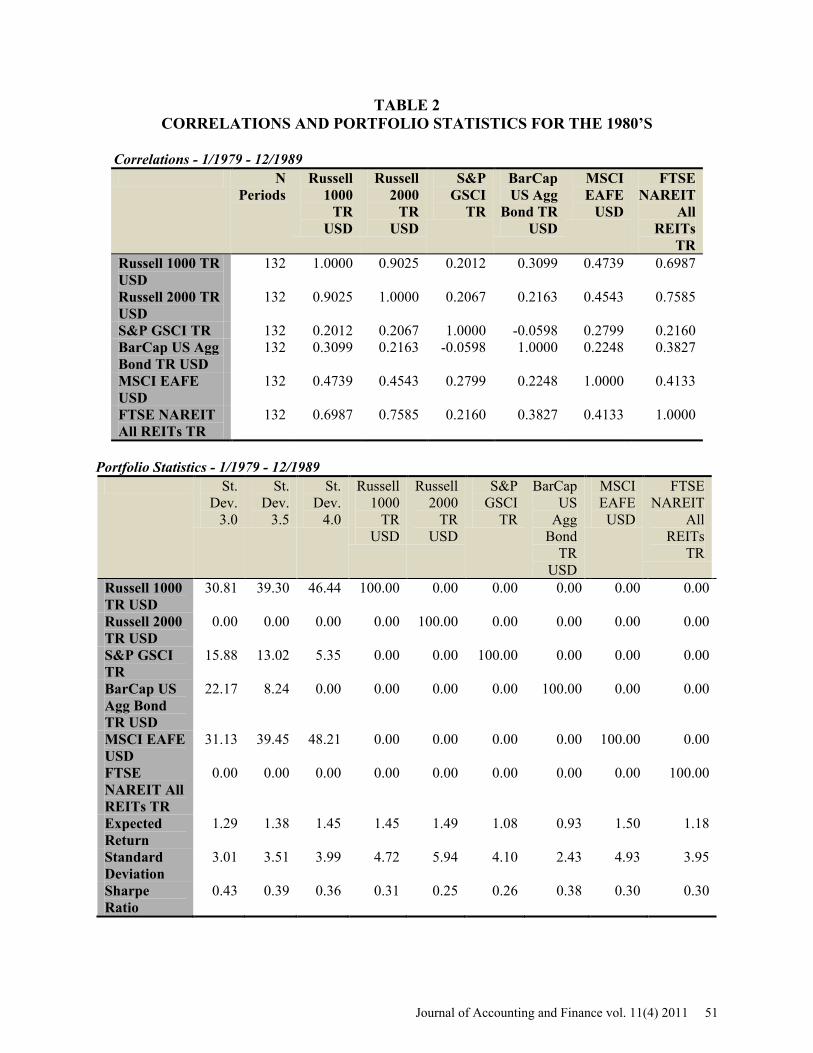
TABLE 2 CORRELATIONS AND PORTFOLIO STATISTICS FOR THE 1980’S
Correlations - 1/1979 - 12/1989 N
Periods Russell
1000 TR
USD
Russell 2000
TR USD
S&P GSCI
TR
BarCap US Agg
Bond TR USD
MSCI EAFE
USD
FTSE NAREIT
All REITs
TR Russell 1000 TR USD
132 1.0000 0.9025 0.2012 0.3099 0.4739 0.6987
Russell 2000 TR USD
132 0.9025 1.0000 0.2067 0.2163 0.4543 0.7585
S&P GSCI TR 132 0.2012 0.2067 1.0000 -0.0598 0.2799 0.2160 BarCap US Agg Bond TR USD
132 0.3099 0.2163 -0.0598 1.0000 0.2248 0.3827
MSCI EAFE USD
132 0.4739 0.4543 0.2799 0.2248 1.0000 0.4133
FTSE NAREIT All REITs TR
132 0.6987 0.7585 0.2160 0.3827 0.4133 1.0000
Portfolio Statistics - 1/1979 - 12/1989
St. Dev.
3.0
St. Dev.
3.5
St. Dev.
4.0
Russell 1000
TR USD
Russell 2000
TR USD
S&P GSCI
TR
BarCap US
Agg Bond
TR USD
MSCI EAFE USD
FTSE NAREIT
All REITs
TR
Russell 1000 TR USD
30.81 39.30 46.44 100.00 0.00 0.00 0.00 0.00 0.00
Russell 2000 TR USD
0.00 0.00 0.00 0.00 100.00 0.00 0.00 0.00 0.00
S&P GSCI TR
15.88 13.02 5.35 0.00 0.00 100.00 0.00 0.00 0.00
BarCap US Agg Bond TR USD
22.17 8.24 0.00 0.00 0.00 0.00 100.00 0.00 0.00
MSCI EAFE USD
31.13 39.45 48.21 0.00 0.00 0.00 0.00 100.00 0.00
FTSE NAREIT All REITs TR
0.00 0.00 0.00 0.00 0.00 0.00 0.00 0.00 100.00
Expected Return
1.29 1.38 1.45 1.45 1.49 1.08 0.93 1.50 1.18
Standard Deviation
3.01 3.51 3.99 4.72 5.94 4.10 2.43 4.93 3.95
Sharpe Ratio
0.43 0.39 0.36 0.31 0.25 0.26 0.38 0.30 0.30
Journal of Accounting and Finance vol. 11(4) 2011 51
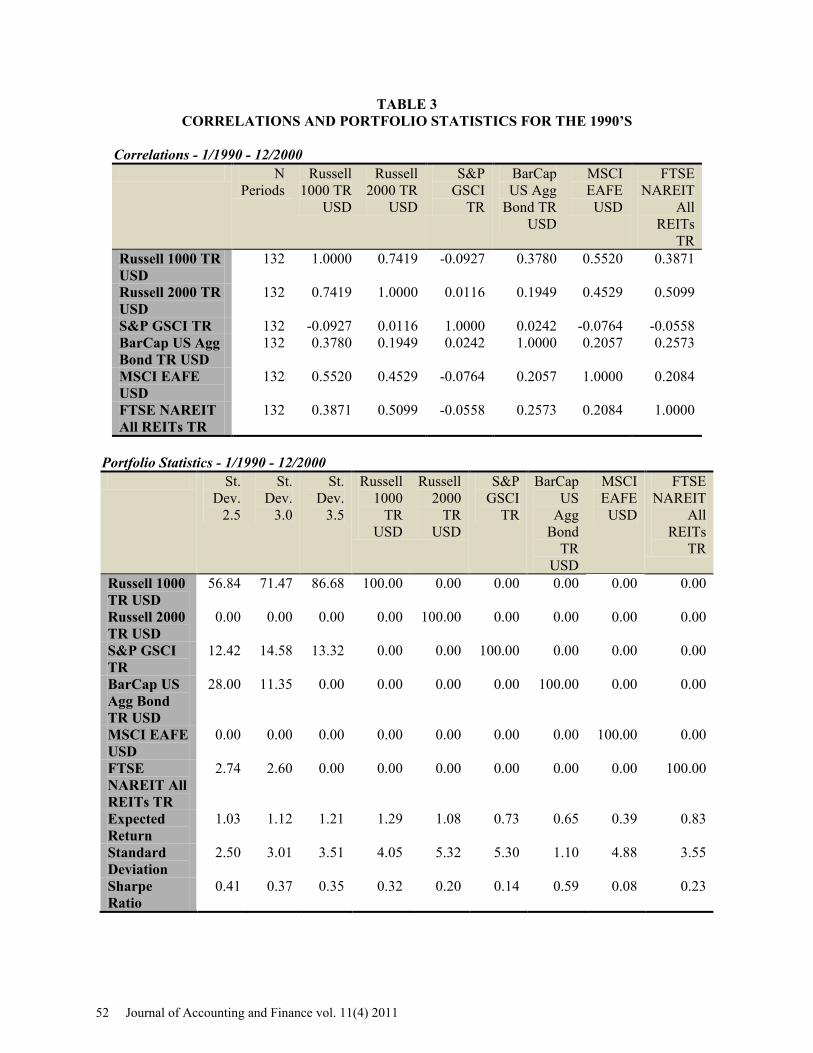
TABLE 3 CORRELATIONS AND PORTFOLIO STATISTICS FOR THE 1990’S
Correlations - 1/1990 - 12/2000 N
Periods Russell
1000 TR USD
Russell 2000 TR
USD
S&P GSCI
TR
BarCap US Agg
Bond TR USD
MSCI EAFE USD
FTSE NAREIT
All REITs
TR Russell 1000 TR USD
132 1.0000 0.7419 -0.0927 0.3780 0.5520 0.3871
Russell 2000 TR USD
132 0.7419 1.0000 0.0116 0.1949 0.4529 0.5099
S&P GSCI TR 132 -0.0927 0.0116 1.0000 0.0242 -0.0764 -0.0558 BarCap US Agg Bond TR USD
132 0.3780 0.1949 0.0242 1.0000 0.2057 0.2573
MSCI EAFE USD
132 0.5520 0.4529 -0.0764 0.2057 1.0000 0.2084
FTSE NAREIT All REITs TR
132 0.3871 0.5099 -0.0558 0.2573 0.2084 1.0000
Portfolio Statistics - 1/1990 - 12/2000 St.
Dev. 2.5
St. Dev.
3.0
St. Dev.
3.5
Russell 1000
TR USD
Russell 2000
TR USD
S&P GSCI
TR
BarCap US
Agg Bond
TR USD
MSCI EAFE USD
FTSE NAREIT
All REITs
TR
Russell 1000 TR USD
56.84 71.47 86.68 100.00 0.00 0.00 0.00 0.00 0.00
Russell 2000 TR USD
0.00 0.00 0.00 0.00 100.00 0.00 0.00 0.00 0.00
S&P GSCI TR
12.42 14.58 13.32 0.00 0.00 100.00 0.00 0.00 0.00
BarCap US Agg Bond TR USD
28.00 11.35 0.00 0.00 0.00 0.00 100.00 0.00 0.00
MSCI EAFE USD
0.00 0.00 0.00 0.00 0.00 0.00 0.00 100.00 0.00
FTSE NAREIT All REITs TR
2.74 2.60 0.00 0.00 0.00 0.00 0.00 0.00 100.00
Expected Return
1.03 1.12 1.21 1.29 1.08 0.73 0.65 0.39 0.83
Standard Deviation
2.50 3.01 3.51 4.05 5.32 5.30 1.10 4.88 3.55
Sharpe Ratio
0.41 0.37 0.35 0.32 0.20 0.14 0.59 0.08 0.23
52 Journal of Accounting and Finance vol. 11(4) 2011

TABLE 4 CORRELATIONS AND PORTFOLIO STATISTICS FOR THE 2000’s
Correlations - 1/2001 - 5/2010 N
Periods Russell 1000 TR USD
Russell 2000 TR USD
S&P GSCI TR
BarCap US Agg Bond TR USD
MSCI EAFE USD
FTSE NAREIT All REITs TR
Russell 1000 TR USD
113 1.0000 0.8964 0.2702 -0.0543 0.8945 0.6774
Russell 2000 TR USD
113 0.8964 1.0000 0.2431 -0.0895 0.8173 0.7583
S&P GSCI TR 113 0.2702 0.2431 1.0000 -0.0057 0.4027 0.1915 BarCap US Agg Bond TR USD
113 -0.0543 -0.0895 -0.0057 1.0000 0.0398 0.1532
MSCI EAFE USD
113 0.8945 0.8173 0.4027 0.0398 1.0000 0.6401
FTSE NAREIT All REITs TR
113 0.6774 0.7583 0.1915 0.1532 0.6401 1.0000
Portfolio Statistics - 1/2001 - 5/2010
St. Dev. 3.0
St. Dev. 4.0
St. Dev. 5.0
Russell 1000 TR USD
Russell 2000 TR USD
S&P GSCI TR
BarCap US Agg Bond TR USD
MSCI EAFE USD
FTSE NAREIT All REITs TR
Russell 1000 TR USD
0.00 0.00 0.00 100.00 0.00 0.00 0.00 0.00 0.00
Russell 2000 TR USD
0.00 0.00 0.00 0.00 100.00 0.00 0.00 0.00 0.00
S&P GSCI TR
0.00 0.00 0.00 0.00 0.00 100.00 0.00 0.00 0.00
BarCap US Agg Bond TR USD
59.28 43.89 28.83 0.00 0.00 0.00 100.00 0.00 0.00
MSCI EAFE USD
0.00 0.00 0.00 0.00 0.00 0.00 0.00 100.00 0.00
FTSE NAREIT All REITs TR
40.72 56.11 71.17 0.00 0.00 0.00 0.00 0.00 100.00
Expected Return
0.70 0.78 0.85 0.13 0.57 0.25 0.49 0.06 1.00
Standard Deviation
3.02 4.03 5.04 4.72 6.01 7.33 1.11 5.28 7.00
Sharpe Ratio 0.23 0.19 0.17 0.03 0.10 0.03 0.44 0.01 0.14
Journal of Accounting and Finance vol. 11(4) 2011 53

TABLE 5 CORRELATIONS AND PORTFOLIO STATISTICS FOR THE
FIRST TWENTY-YEAR PERIOD
Correlations - 1/1979 - 12/1999 N
Periods Russell
1000 TR USD
Russell 2000 TR
USD
S&P GSCI
TR
BarCap US Agg
Bond TR USD
MSCI EAFE USD
FTSE NAREIT
All REITs
TR Russell 1000 TR USD
252 1.0000 0.8676 0.0598 0.3213 0.4941 0.6124
Russell 2000 TR USD
252 0.8676 1.0000 0.0982 0.2012 0.4473 0.7148
S&P GSCI TR 252 0.0598 0.0982 1.0000 -0.0277 0.0966 0.1166 BarCap US Agg Bond TR USD
252 0.3213 0.2012 -0.0277 1.0000 0.2070 0.3423
MSCI EAFE USD
252 0.4941 0.4473 0.0966 0.2070 1.0000 0.3437
FTSE NAREIT All REITs TR
252 0.6124 0.7148 0.1166 0.3423 0.3437 1.0000
Portfolio Statistics - 1/1979 - 12/1999 St.
Dev. 2.5
St. Dev.
3.0
St. Dev.
3.5
Russell 1000
TR USD
Russell 2000
TR USD
S&P GSCI
TR
BarCap US
Agg Bond
TR USD
MSCI EAFE USD
FTSE NAREIT
All REITs
TR
Russell 1000 TR USD
47.77 62.58 77.62 100.00 0.00 0.00 0.00 0.00 0.00
Russell 2000 TR USD
0.00 0.00 0.00 0.00 100.00 0.00 0.00 0.00 0.00
S&P GSCI TR
10.42 8.78 7.12 0.00 0.00 100.00 0.00 0.00 0.00
BarCap US Agg Bond TR USD
41.81 28.64 15.26 0.00 0.00 0.00 100.00 0.00 0.00
MSCI EAFE USD
0.00 0.00 0.00 0.00 0.00 0.00 0.00 100.00 0.00
FTSE NAREIT All REITs TR
0.00 0.00 0.00 0.00 0.00 0.00 0.00 0.00 100.00
Expected Return
1.11 1.21 1.31 1.46 1.34 0.77 0.79 1.05 0.96
Standard Deviation
2.52 2.99 3.51 4.34 5.50 4.59 1.93 4.95 3.74
Sharpe Ratio
0.44 0.40 0.37 0.34 0.24 0.17 0.41 0.21 0.26
54 Journal of Accounting and Finance vol. 11(4) 2011

TABLE 6 CORRELATIONS AND PORTFOLIO STATISTICS FOR THE
SECOND TWENTY-YEAR PERIOD
Correlations - 1/1990 - 5/2010 N
Periods Russell
1000 TR USD
Russell 2000 TR
USD
S&P GSCI
TR
BarCap US Agg
Bond TR USD
MSCI EAFE USD
FTSE NAREIT
All REITs
TR Russell 1000 TR
USD 245 1.0000 0.8215 0.1213 0.1691 0.7269 0.5551
Russell 2000 TR USD
245 0.8215 1.0000 0.1448 0.0578 0.6395 0.6482
S&P GSCI TR 245 0.1213 0.1448 1.0000 0.0107 0.1923 0.1151 BarCap US Agg
Bond TR USD 245 0.1691 0.0578 0.0107 1.0000 0.1276 0.1803
MSCI EAFE USD
245 0.7269 0.6395 0.1923 0.1276 1.0000 0.4672
FTSE NAREIT All REITs TR
245 0.5551 0.6482 0.1151 0.1803 0.4672 1.0000
Portfolio Statistics - 1/1990 - 5/2010 St.
Dev. 2.5
St. Dev.
3.5
St. Dev.
4.5
Russell 1000
TR USD
Russell 2000
TR USD
S&P GSCI
TR
BarCap US
Agg Bond
TR USD
MSCI EAFE USD
FTSE NAREIT
All REITs
TR
Russell 1000 TR USD
3.38 6.08 8.69 100.00 0.00 0.00 0.00 0.00 0.00
Russell 2000 TR USD
8.92 10.54 12.10 0.00 100.00 0.00 0.00 0.00 0.00
S&P GSCI TR
0.00 0.00 0.00 0.00 0.00 100.00 0.00 0.00 0.00
BarCap US Agg Bond TR USD
52.78 30.90 9.75 0.00 0.00 0.00 100.00 0.00 0.00
MSCI EAFE USD
0.00 0.00 0.00 0.00 0.00 0.00 0.00 100.00 0.00
FTSE NAREIT All REITs TR
34.91 52.48 69.47 0.00 0.00 0.00 0.00 0.00 100.00
Expected Return
0.72 0.79 0.86 0.76 0.84 0.51 0.58 0.24 0.91
Standard Deviation
2.51 3.51 4.50 4.40 5.64 6.31 1.11 5.06 5.41
Sharpe Ratio
0.29 0.23 0.19 0.17 0.15 0.08 0.52 0.05 0.17
Journal of Accounting and Finance vol. 11(4) 2011 55

RESULTS
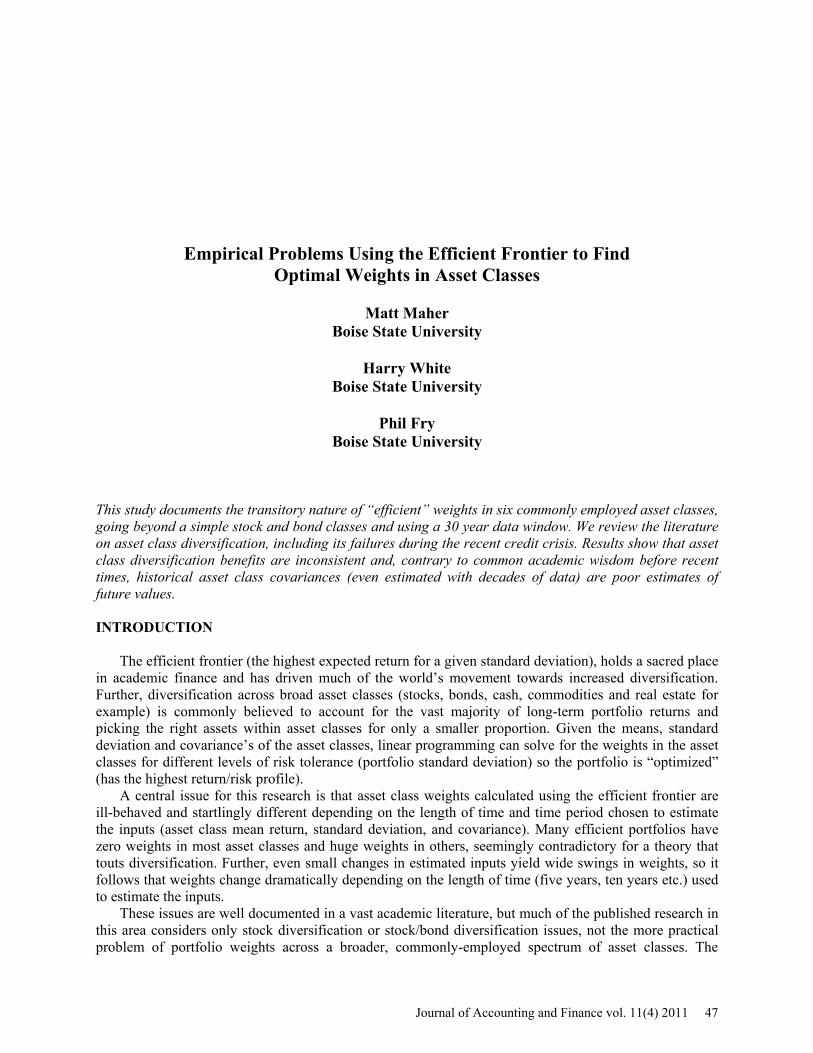
The correlation coefficients in Table 1 indicate that for the entire thirty year time period relative high positive correlations (generally greater than .5) exist between the two domestic stock indices, the real estate index, and the international stock index. The commodity index and the bond index have lower correlations with the stock and real estate indices as well as with each other, potentially providing significant diversification benefits for possible portfolios.
The portfolio statistics presented in Table 1 provide asset allocations, expected returns, and Sharpe ratios for three different levels of standard deviation of returns. The standard deviation levels picked are 3%, 4% and 5% based on monthly returns. These levels were selected to provide some perspective along the frontier depicted in Figure 1. The data reveal the optimal portfolios are dominated by four of the six asset classes over the range of risk levels chosen. The real estate index is a prominent part of all three points on the frontier. The shift in asset class as the risk level changes occurs between the mix of stocks and bonds and from large to small cap stocks. The Sharpe ratio indicates the relative slope of the frontier and the tradeoff between risk and return as the investor moves along the frontier. The thirty year results are the long term base case that are compared to the other time periods to examine how the make-up and tradeoffs change along the frontiers generated by different sets of data.
The results from dividing the data into three decades within the overall thirty year time period are presented in Tables 2, 3, and 4. The first sub-period is from January 1979 to December 1989, the second covers the period January 1990 to December 2000, and the third covers the period January 2001 to May 2010. The efficient frontiers are shown in Figures 2, 3, and 4. The results show some interesting differences from the results for the entire period and from each of the decades.
The decade of the eighties is characterized by a relatively steeply sloped efficient frontier (Figure 2) giving the investor a better risk return tradeoff than any other time period studied. The real estate asset class and small cap stocks have zero weights at all the monthly standard deviations shown in Table 2 (3%, 3.5% and 4%). The optimal portfolios are spread between the other four asset classes, depending on risk level, with international stocks and large cap stocks dominating the portfolios at higher risk levels. Table 2 also indicates correlations were somewhat higher across asset classes for the 80s compared to later decades.
The decade of the nineties is characterized by lower correlations of the commodity index to all of the other asset class indices; providing potential diversification benefits (Table 3). The efficient frontier for the 90s is steeply sloped (though not as steep as the 80s) providing investors with favorable risk return tradeoffs (Figure 3). The optimal portfolios at the 2.5%, 3% and 3.5% levels are dominated by large cap stocks, bonds, and the commodity asset class (providing that diversification benefit indicated by the correlations). Real estate enters the risk portfolios only marginally, and small caps and foreign stocks not at all.
The decade of the 2000’s is characterized by a relatively flat efficient frontier indicating investors would need to take on larger amounts of risk for increases in return during the decade (Figure 4). The indication from Table 4 is that the optimal portfolios are completely dominated by only two asset classes – real estate and bonds. The other four asset classes do not enter the optimal portfolio at any of the chosen risk levels. The Sharpe ratios for this decade are well below the other two decades examined except for the bond asset class. The results for this decade differ greatly from the results for any of the other time periods chosen.
The two twenty year sub-periods show very different results as well. The combination of the eighties and nineties reflect the relatively steep slope to the efficient investment frontier (Figure 5 and Table 5) of those decades and the dominance of the large cap stock and bond asset classes with the diversification benefits of the commodity index. The other three asset classes do not appear in any of the optimal portfolios at the chosen levels of risk. The combination of the nineties and the 2000’s reflects the influence of the last decade (Figure 6 and Table 6). Bonds and real estate dominate the portfolios with smaller allocations to both large and small cap stocks. The Sharpe ratios are much lower for this period than the other twenty year period examined.
56 Journal of Accounting and Finance vol. 11(4) 2011

This set of results indicates vastly different asset allocations depending on which historical period one examines to set target or strategic asset class weights. The portfolios in each time period are dominated by three asset classes and those asset classes shift depending on which decade of data one examines. Correlations, and diversification benefits, between asset classes shift significantly over the different decades. Taken together, results show that asset class diversification benefits are inconsistent and, contrary to common academic wisdom before recent times, historical asset class covariance’s (even estimated with decades of data) are poor estimates of future values.
Journal of Accounting and Finance vol. 11(4) 2011 57
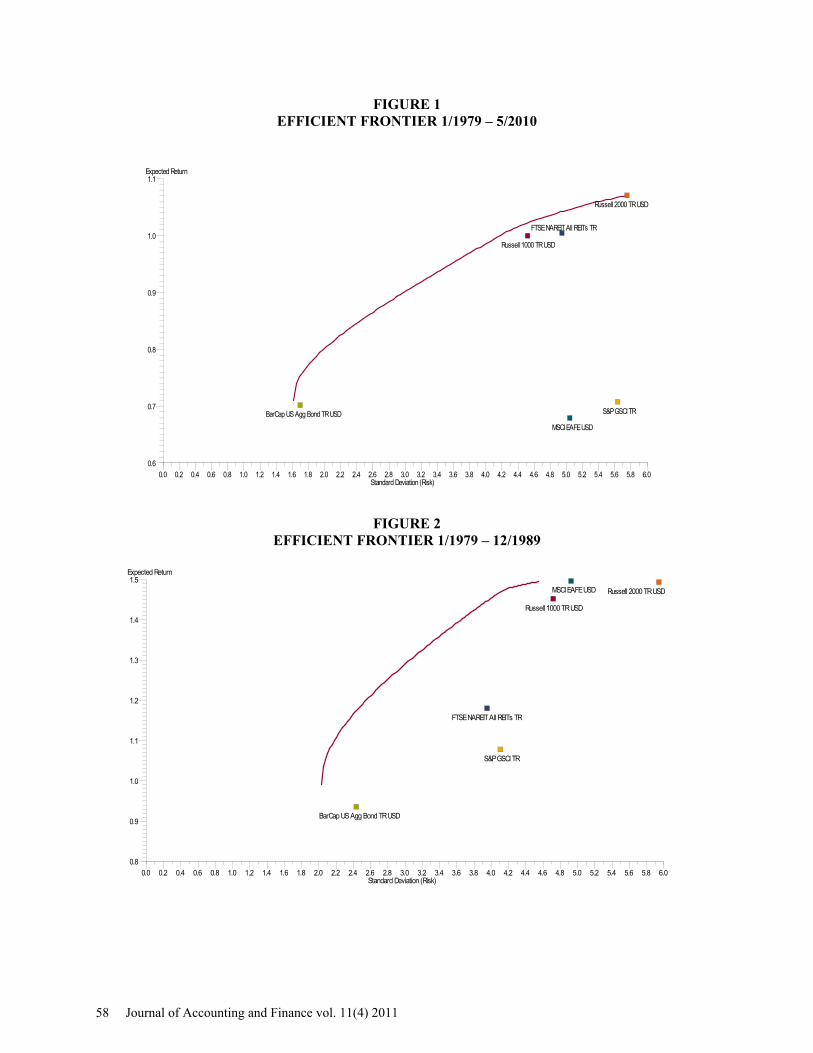
FIGURE 1 EFFICIENT FRONTIER 1/1979 – 5/2010
FIGURE 2 EFFICIENT FRONTIER 1/1979 – 12/1989
Standard Deviation (Risk)
Expected Return
0.0 6.00.2 0.4 0.6 0.8 1.0 1.2 1.4 1.6 1.8 2.0 2.2 2.4 2.6 2.8 3.0 3.2 3.4 3.6 3.8 4.0 4.2 4.4 4.6 4.8 5.0 5.2 5.4 5.6 5.80.6
1.1
0.7
0.8
0.9
1.0Russell 1000 TR USD
Russell 2000 TR USD
S&P GSCI TRBarCap US Agg Bond TR USD
MSCI EAFE USD
FTSE NAREIT All REITs TR
Standard Deviation (Risk)
Expected Return
0.0 6.00.2 0.4 0.6 0.8 1.0 1.2 1.4 1.6 1.8 2.0 2.2 2.4 2.6 2.8 3.0 3.2 3.4 3.6 3.8 4.0 4.2 4.4 4.6 4.8 5.0 5.2 5.4 5.6 5.80.8
1.5
0.9
1.0
1.1
1.2
1.3
1.4Russell 1000 TR USD
Russell 2000 TR USD
S&P GSCI TR
BarCap US Agg Bond TR USD
MSCI EAFE USD
FTSE NAREIT All REITs TR
58 Journal of Accounting and Finance vol. 11(4) 2011
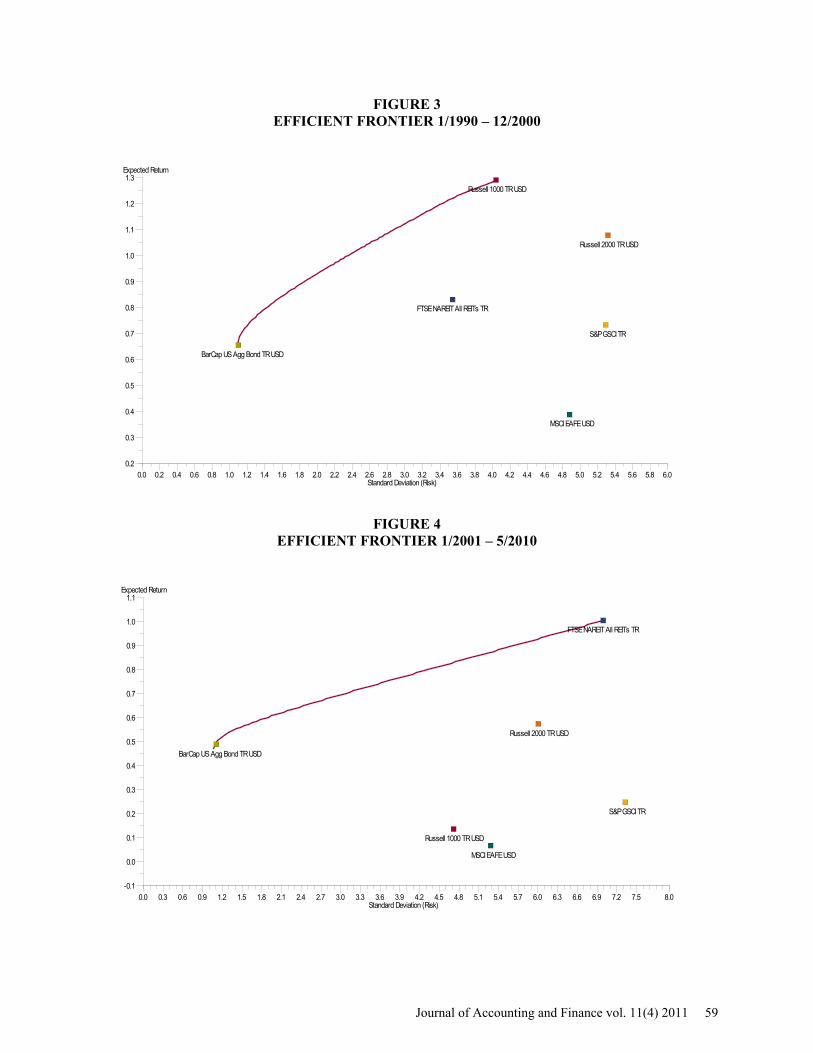
FIGURE 3 EFFICIENT FRONTIER 1/1990 – 12/2000
FIGURE 4 EFFICIENT FRONTIER 1/2001 – 5/2010
Standard Deviation (Risk)
Expected Return
0.0 6.00.2 0.4 0.6 0.8 1.0 1.2 1.4 1.6 1.8 2.0 2.2 2.4 2.6 2.8 3.0 3.2 3.4 3.6 3.8 4.0 4.2 4.4 4.6 4.8 5.0 5.2 5.4 5.6 5.80.2
1.3
0.3
0.4
0.5
0.6
0.7
0.8
0.9
1.0
1.1
1.2
Russell 1000 TR USD
Russell 2000 TR USD
S&P GSCI TR
BarCap US Agg Bond TR USD
MSCI EAFE USD
FTSE NAREIT All REITs TR
Standard Deviation (Risk)
Expected Return
0.0 8.00.3 0.6 0.9 1.2 1.5 1.8 2.1 2.4 2.7 3.0 3.3 3.6 3.9 4.2 4.5 4.8 5.1 5.4 5.7 6.0 6.3 6.6 6.9 7.2 7.5-0.1
1.1
0.0
0.1
0.2
0.3
0.4
0.5
0.6
0.7
0.8
0.9
1.0
Russell 1000 TR USD
Russell 2000 TR USD
S&P GSCI TR
BarCap US Agg Bond TR USD
MSCI EAFE USD
FTSE NAREIT All REITs TR
Journal of Accounting and Finance vol. 11(4) 2011 59

FIGURE 5 EFFICIENT FRONTIER 1/1979 – 12/1999
FIGURE 6
EFFICIENT FRONTIER 1/1990 – 5/2010
Standard Deviation (Risk)
Expected Return
0.0 6.00.2 0.4 0.6 0.8 1.0 1.2 1.4 1.6 1.8 2.0 2.2 2.4 2.6 2.8 3.0 3.2 3.4 3.6 3.8 4.0 4.2 4.4 4.6 4.8 5.0 5.2 5.4 5.6 5.80.7
1.5
0.8
0.9
1.0
1.1
1.2
1.3
1.4
Russell 1000 TR USD
Russell 2000 TR USD
S&P GSCI TRBarCap US Agg Bond TR USD
MSCI EAFE USD
FTSE NAREIT All REITs TR
Standard Deviation (Risk)
Expected Return
0.0 7.00.2 0.4 0.6 0.8 1.0 1.2 1.4 1.6 1.8 2.0 2.2 2.4 2.6 2.8 3.0 3.2 3.4 3.6 3.8 4.0 4.2 4.4 4.6 4.8 5.0 5.2 5.4 5.6 5.8 6.0 6.2 6.4 6.6 6.80.1
1.0
0.2
0.3
0.4
0.5
0.6
0.7
0.8
0.9
Russell 1000 TR USD
Russell 2000 TR USD
S&P GSCI TR
BarCap US Agg Bond TR USD
MSCI EAFE USD
FTSE NAREIT All REITs TR
60 Journal of Accounting and Finance vol. 11(4) 2011

CONCLUSIONS
The historical returns for six broad asset class indices are used to indentify optimal portfolios at different levels of chosen risk across different time periods to highlight the difficulty in determining target asset class weights using historical return data. The results confirm that the efficient frontier shifts dramatically with relatively small changes in correlation coefficients between asset classes that occur in different time periods. The optimal portfolios encompass half or less of the six available asset classes examined in many time periods (including the thirty year period) with very different classes included in the optimal portfolios depending on which time period was examined.
This instability of the efficient frontier is problematic for even investment professionals, let alone individual investors, attempting to set target weights for different risk preferences. The targets are fluid and the investor should have little confidence that the future investment horizon will follow the historical data being used to construct the weights.
Diversification within asset classes has become a ubiquitous and standardized investment practice, with relatively cheap products like exchange-traded funds and index mutual funds easily available to even small investors. In contrast, diversification across asset classes, commonly believed to be the most important component of overall diversification strategies, is confusing and expensive with few common tenets or metrics. REFERENCES Bekkers N., R. Doeswijk, and T. Lam., http://papers.ssrn.com/sol3/papers.cfm?abstract_id=1368689 Strategic Asset Allocation: Determining the Optimal Portfolio with Ten Asset Classes, Forthcoming in Journal of Wealth Management Best M., and R. Grauer (1991). On the Sensitivity of Mean-Variance Efficient Portfolios to Changes in Asset Means: Some Analytical and Computational Results, The Review of Financial Studies, 4, (2), 315-342. Black, F., and R. Litterman (1992). Global Portfolio Optimization. Financial Analysts Journal, 48, 28-43. Campbell, J.Y., Y.L. Chan and L.M. Viceira (2003). A Multivariate Model for Strategic Asset Allocation. Journal of Financial Economics 67, 41-80. Coggan, P. (2011). Yale May Not Have the Key, The Economist (in the Buttonwood column), http://www.economist.com/research/articlesBySubject/displaystory.cfm?subjectid=2512631&story_id=17913011 DeMiguel, V., L. Garlappi, and R. Uppal, Optimal Versus Naïve Diversification: How Ineffecient is the 1/N Strategy? (2007). The Review of Financial Studies, 0, (0), 1-39. Fabozzi F. and S. Focardi. (2010). Diversification: Should We Be Diversifying Trends? Journal of Portfolio Management, 36, (4). Haugen, R., Modern Investment Theory. (2001). 5th Edition, Prentice Hall, Upper Saddle River NJ. Hood R. (2005). Determinants of Portfolio Performance - 20 Years Later, The Financial Analysts Journal, 61, (5). Ibbotson R., and P. Kaplan. (2000). Does Asset Allocation Policy Explain 40%, 90%, or 100% of Performance? The Financial Analysts Journal.
Journal of Accounting and Finance vol. 11(4) 2011 61
Leibowitz M., A. Bova, and B. Hammond. (2010). The Endowment Model of Investing: Return, Risk, and Diversification, Wiley Finance, John Wiley & Sons, Hoboken NJs. Maher, M., H. White, and D. Schooley, Spring 2010, Target Date Funds: Simple in Concept but Complex in Practice, Journal of Contemporary Business Issues, Vol. 17, No 1, 16-23. Page S. and M. Taborsky, The Myth of Diversification, September 2010, http://singapore.pimco.com/LeftNav/Viewpoints/2010/The+Myth+of+Diversification+Risk+Factors+vs+Asset+Classes.htm Stoyanov, S. Rachev, S., Racheva-Yotova, B. and Fabozzi, F., Winter 2011, Fat-Tailed Models for Risk Estimation, The Journal of Portfolio Management, Vol. 37 No. 2, 107-117.
62 Journal of Accounting and Finance vol. 11(4) 2011
Related Documents