Costly Communication, Shareholder Activism, and Limits to Arbitrage Michael Bradley, Alon Brav, Itay Goldstein, and Wei Jiang * August 2005 Abstract Using a unique hand-collected dataset, we show that shareholder activism aimed at open ending U.S. based closed-end funds has become frequent since 1992. We denote this phenomenon as activist arbitrage and distinguish it from the standard pure trading arbitrage. We document a dual relationship between activist arbitrage and funds’ discounts: a high discount increases the probability of an activist attack, while a high probability of ex post attack reduces the ex ante discount. We provide evidence showing that the ease of shareholder communication is a major determinant for the emergence of activist arbitrage. This holds for the time series – activist arbitrage has become much more common following the law reform of 1992 that lifted restrictions on shareholder communication – as well as for the cross section – activist arbitrage is more likely in funds that exhibit low costs of communication. Overall, our results provide direct evidence on the presence of arbitrage activities, but also demonstrate the existence of limits to arbitrage. Costly communication is identified as such limit. * Bradley and Brav are from the Fuqua School of Business, Duke University. Goldstein is from the Wharton School, University of Pennsylvania. Jiang is from the Graduate School of Business, Columbia University. Bradley can be reached at, phone: (919) 660-8006, email: [email protected] ; Brav at, phone: (919) 660-2908, email: [email protected] ; Goldstein at, phone: (215) 746-0499, email: [email protected] ; and Jiang at, phone: (212) 854-9679, email: [email protected] . We benefited from comments from the seminar participants at Yale. We would like to thank Phillip Goldstein for his numerous insights on the closed end fund industry and on key aspects of arbitrage activity in this area.

Welcome message from author
This document is posted to help you gain knowledge. Please leave a comment to let me know what you think about it! Share it to your friends and learn new things together.
Transcript

Costly Communication, Shareholder Activism, and Limits to Arbitrage
Michael Bradley, Alon Brav, Itay Goldstein, and Wei Jiang*
August 2005
Abstract
Using a unique hand-collected dataset, we show that shareholder activism aimed at open ending U.S. based closed-end funds has become frequent since 1992. We denote this phenomenon as activist arbitrage and distinguish it from the standard pure trading arbitrage. We document a dual relationship between activist arbitrage and funds’ discounts: a high discount increases the probability of an activist attack, while a high probability of ex post attack reduces the ex ante discount. We provide evidence showing that the ease of shareholder communication is a major determinant for the emergence of activist arbitrage. This holds for the time series – activist arbitrage has become much more common following the law reform of 1992 that lifted restrictions on shareholder communication – as well as for the cross section – activist arbitrage is more likely in funds that exhibit low costs of communication. Overall, our results provide direct evidence on the presence of arbitrage activities, but also demonstrate the existence of limits to arbitrage. Costly communication is identified as such limit.
*Bradley and Brav are from the Fuqua School of Business, Duke University. Goldstein is from the Wharton School, University of Pennsylvania. Jiang is from the Graduate School of Business, Columbia University. Bradley can be reached at, phone: (919) 660-8006, email: [email protected]; Brav at, phone: (919) 660-2908, email: [email protected]; Goldstein at, phone: (215) 746-0499, email: [email protected]; and Jiang at, phone: (212) 854-9679, email: [email protected]. We benefited from comments from the seminar participants at Yale. We would like to thank Phillip Goldstein for his numerous insights on the closed end fund industry and on key aspects of arbitrage activity in this area.

1
1. Introduction
The role of arbitrageurs in financial markets is undeniable. One of the main debates in
financial economics centers on the possibility that arbitrageurs are constrained in their arbitrage
activities. Proponents of the efficient markets hypothesis (e.g., Friedman (1953) and Fama
(1965)) argue that arbitrage is almost unlimited and thus leads to efficient asset prices. On the
other hand, the growing literature on limits to arbitrage (for example: DeLong, Shleifer,
Summers, and Waldmann (1990) and Shleifer and Vishny (1997)) points out that mispricing may
persist in equilibrium for long periods of time since arbitrageurs have to bear costs and risks and
thus are constrained in their activities.
One of the main examples provided by proponents of the second view for the existence of
limits to arbitrage concerns closed-end funds (CEFs). A closed end fund is an investment firm,
whose own shares are traded in the market. An empirical fact is that the prices of these funds
tend to deviate from their net asset values (NAVs) for long periods of time and to typically trade
at substantial discounts.1 Attempts to explain this pattern by pointing out that the methods used
to calculate the NAVs overstate the value of the assets due to agency costs, tax liabilities, or
illiquidity of the underlying assets have largely failed (Malkiel (1977)). This has led Lee,
Shleifer, and Thaler (1991) to propose that discounts arise due to the presence of irrational
traders and that they persist due to the constraints that prevent arbitrageurs from making a profit
on the resulting mispricing. Indeed, Pontiff (1996) and, more recently, Gemmill and Thomas
(2002), have provided empirical evidence consistent with the view that arbitrageurs might be
limited in their ability to purchase discounted funds while shorting the funds’ underlying assets
for the length of time necessary to profit from the correction in fund prices.2
While Pontiff (1996), Gemmill and Thomas (2002), and others focus on a pure trading
arbitrage, i.e., arbitrage that involves only buying and selling of assets in financial markets in
hope of price convergence, we focus on an alternative type of arbitrage, which we denote as
1 This fact is unique to closed-end funds. In an open-end fund, investors can redeem their share from the fund for the net asset value at any point in time and thus the share price is forced to be equal to the NAV. 2 Ignoring all limits to arbitrage, Thompson (1978), Brauer (1988) and Pontiff (1995) show that discounted funds provide profitable arbitrage opportunities. Specifically, abnormal returns can be earned through a passive strategy of buying the shares of CEFs with high discounts and shorting the shares of low discount CEFs. For a thorough review of the closed-end-fund literature, see Dimson and Minio-Kozerski (1999).
2
activist arbitrage. With this type of arbitrage, the arbitrageur acquires shares in the discounted
fund, and then, instead of waiting for the share price to converge to the NAV, he takes actions to
affect the policies within the fund in a way that will move the share price towards the NAV. For
example, the arbitrageur can take actions to open end the fund, which, in case of success, will
equate the share price to the NAV.
Existence of the two forms of arbitrage is not unique to close-end funds. In a general
corporate setting, an investor can either use his information for pure trading, or can use it to
intervene within the firm and take actions that will change its value. Such intervention could be
via a shareholder proposal for corporate restructuring or a proxy contest to replace the board.
Bolton and Van Thadden (1998), Kahn and Winton (1998), and Maug (1998) provide theoretical
models that highlight the trade offs between the two types of arbitrage in a regular corporation.3
Closed-end funds provide a unique place to analyze the activist arbitrage because the increase in
value of the firm following a successful intervention (open-ending) is clearly defined (the
discount).
Some prior research on closed-end funds recognizes the possibility of activist arbitrage,
but argues that this type of arbitrage is very costly and difficult to execute (Lee, Shleifer, and
Thaler (1991)) and may fail due to resistance of managers and blockholders (Barclay,
Holderness, and Pontiff (1993)). Indeed, activist arbitrage has been quite rare in the U.S.
closed-end fund industry until the early 1990s. Since 1992, however, when the SEC made
changes to the law relaxing constraints on communication among shareholders of public
corporations, this type of arbitrage has become very common. Specifically, several arbitrageurs
have become very active in initiating proxy contests and referendums targeted at open ending or
liquidating deeply discounted closed end funds. Most of these attempts have been met with
resistance from funds’ managements. Still, quite a few of these attempts have succeeded despite
such resistance, or have become credible enough to cause a significant shrinkage of the
discount.4
3 Dodd and Warner (1983), DeAngelo and DeAngelo (1989), Gordon and Pound (1993), Ikenberry and Lakonishok (1993), Carleton, Nelson, and Weisbach (1998), Del Guercio and Hawkins (1999), and Gillan and Stark (2000) provide empirical analysis of shareholder activism. 4 Activist arbitrage can also be pursued via takeovers. In such arbitrage, the arbitrageur acquires control over the firm, and makes restructuring decisions without being dependent on the votes of other shareholders. A recent evaluation of the takeover mechanism vs. the proxy contest mechanism in a general corporate setting is performed

3
Our first goal in this paper is to document the phenomenon of activist arbitrage in closed-
end funds and to study its relation with the discounts at which funds are traded. Using an
extensive hand-collected dataset of all domestic and international equity funds based in the U.S.,
over the period between 1989 and 2003, we document an increasing trend of strong and frequent
activist arbitrage. We show that the probability that a fund will be attacked by activist
arbitrageurs increases in the size of the discount at which the fund is traded. This suggests that
arbitrageurs perceive that they can make higher profits by attacking funds that are traded at
larger discounts, or, they do not seem to believe that measurement issues, as mentioned before,
are the main factors driving these discounts. We also show that the probability of an ex-post
attack has a negative effect on the ex-ante discount. This suggests that there is a rational
component in the discount. When an attack, which subsequently may lead to convergence of the
price to the NAV, is likely, the forward-looking share price incorporates this and rises closer to
the NAV.5
Our second goal is to study the effect of communication on activist arbitrage, and via that
on fund discounts. We hypothesize that communication and coordination among shareholders
play a key role in enabling the type of arbitrage studied in this paper. In order to lead an attack
on a discounted closed-end fund, an arbitrageur needs to communicate with many other
shareholders and convince them to vote for his plan. Thus, the ability to communicate and
coordinate should be an important factor in determining whether such activist arbitrage will be
attempted. Following the same logic, costs and limits on communication (such as the law before
1992) constitute limits to arbitrage.
The first piece of evidence that supports the role of communication is found in the time
series. Following the change in the law in 1992 that enabled shareholder communication, the
by Bebchuk and Hart (2001). Interestingly, takeovers are virtually non existent in the closed-end fund industry. One reason may be that they are subject to the famous free-rider problem, identified by Grossman and Hart (1980). We believe, however, that the main reason is the anti-pyramiding provision, enacted in the Investment Company Act of 1940, that prevents registered investment companies from holding more than 3% of the shares of other registered investment companies. The National Securities Markets Improvement Act of 1996 classifies private funds as investment companies for the purpose of being subject to the 3% limitation. This prevents most potential activist arbitrageurs from attempting a takeover of a closed-end fund. 5 It should be noted, however, that despite this strong effect, discounts have not decreased after 1992, when the attacks became much more common, compared to their levels during 1988-1992. This suggests that other forces that generate discounts became stronger in the late 1990s. After 2000 (up till the end of 2004), however, overall discounts have been declining. The explanation of what generally determines the level of the discount is beyond the scope of this paper.
4
number of attacks on closed end funds increased dramatically. Before the change in the law,
communication among shareholders was severely restricted by the SEC, as any type of
communication between shareholders had to be approved by the SEC. The change in 1992 lifted
many of these restrictions, and thus made communication and activist arbitrage much more
feasible. This, we believe, led to the increase in the number of activists’ attacks.6
Since it is possible that the dramatic change in the magnitude of activist arbitrage after
1992 may be due to other factors that are unrelated to the change in the law, we provide
additional, cross-sectional, evidence to strengthen our thesis that communication is important in
enabling activist arbitrage. We use fund-specific variables that proxy for the cost of
communication, and test whether these explain differences in the probability of attack in the
cross section. We use three such variables. The first variable is turnover, which measures the
frequency at which the shares of the closed-end fund change hands. We argue that a high
turnover indicates greater costs of communication, since it suggests that shareholders are
changing frequently and thus are difficult to be located and communicated with. Pound (1988)
was the first one to suggest this variable as a proxy for the cost of communication. The second
variable is the percentage of institutional ownership in the fund. Institutional investors typically
hold larger accounts and are more tuned to the market. Thus, they are easier to locate and
communicate with. We hypothesize that a greater percentage of institutional ownership indicates
smaller communication costs. The third variable that we use is the average size of trade in the
fund’s shares. We argue that a greater size of trade indicates that, on average, shareholders hold
bigger accounts in the fund, and thus that overall the fund has fewer shareholders, so
communication is easier.7 Our cross-sectional tests show that these three variables are indeed
important in explaining the probability of attack. Their effects go in the expected directions.
We perform additional tests to check the combined effect of the change in the law in
1992 with that of cross-sectional variables. These tests reinforce the conclusion that
6 In Section 2, we provide a broad discussion on the change in the law and its implications. Additional references are Pound (1991), who provides an excellent discussion on the restrictions in the old law and their detrimental effect on the proxy process, and Choi (2000), who brings evidence on the increase in number of proxy contests in regular corporations following the change in the law in 1992. 7 Ultimately, we are interested in knowing the number of shareholder accounts for each fund, and use that as a proxy for costs of communication. However, despite our efforts, we were not able to get a version of this variable that is accurate enough for our purposes. See Section 4 for more details.

5
communication among shareholders is important for activist arbitrage. First, we show that the
effect of the proxies for communication costs, described in the previous paragraph, strengthened
after the change in the law in 1992. Our interpretation is that prior to 1992, communication was
severely restricted by the SEC for all funds, so that differences in costs of communication across
funds did not play a big role. This changed in 1992 following the removal of restrictions by the
SEC. Second, we use different variables to proxy for the quality of governance of individual
funds. We find that, while bad-governance funds were more likely to be avoided by activist
arbitrageurs before 1992, they became more likely targets after 1992. This is expected since
communication among shareholders is particularly important for activists in bad-governance
funds, where the management is fighting hard against open-ending attempts and trying to put
more restrictions on transmission of information.
To summarize our findings and put them in the perspective of the vast literature on
arbitrage, we believe two main conclusions should be drawn from our study. The first
conclusion is that arbitrage activities are alive. We bring direct evidence on such activities
occurring over more than a decade in one of the most puzzling assets traded in financial markets.
Our evidence shows that arbitrageurs respond to profit opportunities and that they perform an
important role in the determination of asset prices in financial markets.8
The second conclusion is that limits to arbitrage do exist. Different authors have
emphasized different factors that lead to limits on arbitrage activities. Campbell and Kyle (1993)
focus on fundamental risk, i.e., the risk that something will change in the fundamentals of the
assets, while the arbitrage strategy is being pursued. DeLong, Shleifer, Summers, and
Waldmann (1990) argue that noise-trading risk, i.e., the risk that noise trading will increase the
degree of mispricing, may warrant arbitrage activities unprofitable. Many authors (for example,
Mitchell and Pulvino (2001), Mitchell, Pulvino, and Stafford (2002), and Pontiff (1996)) look at
the transaction costs and holding costs that arbitrageurs have to incur while pursuing an arbitrage
strategy. Others (Geczy, Musto, and Reed (2002) and Lamont and Thaler (2003)) discuss the
importance of short-sales constraints.
8 Two other papers study open ending of closed-end funds: Brauer (1984) and Del Guercio, Dann, and Partch (2003). However, they do not look at the attacks of arbitrageurs on closed-end funds. They also do not simultaneously study the effect of the discount on the probability of open ending and that of the probability of open ending on the discount, and do not look at the effects of communication and the law.

6
The limits to arbitrage featured in our paper emanate from a different source: the need to
communicate and coordinate with other agents in order to pursue a profitable arbitrage strategy.
At the basis of this argument lies the idea that different agents may not agree on the true value of
the asset. Some may think that open ending a discounted closed-end fund is in the best interest
of shareholders, for example, because mangers charge too high fees, which dissipate the NAV
(as is suggested by the theoretical work of Berk and Stanton (2004), and Cherkes, Sagi, and
Stanton (2005)). Others may think open ending a discounted closed-end fund is not in the best
interest of shareholders because closed end funds are efficient in managing long-term portfolios,
and thus will provide higher long-term returns than open-end funds (as is suggested by the
theoretical work of Stein (2005)). The idea of disagreement is very natural. In fact, it is
mirrored in the academic literature, as different authors have different views regarding the source
of the discount and whether or not it should trigger open ending.9 In light of such disagreement,
arbitrageurs who want to initiate a proxy contest aimed at open ending a fund need to be able to
communicate with other shareholders and convince them that their view of the world is right.
This communication is costly and constrained in our world, and thus arbitrage is limited.10
One may argue that communication and coordination among participants in financial
markets may be important only for the type of arbitrage studied in this paper – i.e., activist
arbitrage via proxy contests. After all, the arbitrageurs, whose actions are documented here,
need the votes of other shareholders to change the structure of the fund and complete the
arbitrage strategy. We believe, however, that communication and coordination are crucial in
other types of arbitrage, not documented here. As argued by Shleifer and Vishny (1997), even in
a pure-trading arbitrage, an arbitrageur, who is financially constrained, needs to be able to
communicate to providers of capital that his arbitrage strategy is profitable. At times in which
his position might be losing money the arbitrageur needs to convince his investors that his
rationale for the causal mechanism driving prices is the correct one (see Brav and Heaton
9 This disagreement can be viewed as the ‘model risk’ in the terminology of Lee, Shleifer and Thaler (1991). 10 One manifestation of these limits in our dataset can be found in the fact that, despite great profit opportunities in the closed-end fund industry, only a handful of arbitrageurs were involved in activist arbitrage during the period of time studied in our paper. The complexity of pursuing an activist arbitrage strategy involving lengthy campaigns, direct communication with shareholders, and possible legal liability requires a lot of expertise and knowledge from the arbitrageur. Thus, unlike standard textbook arbitrage in which many shareholders take a small part in an arbitrage activity, we can clearly see how few activist arbitrageurs are controlling this type of arbitrage activity, and pursuing it against more and more funds.

7
(2002)). Moreover, as argued by Abreu and Brunnermeier (2003) (and demonstrated empirically
by Brunnermeier and Nagel (2004)), also in a setting of pure-trading arbitrage, lack of
communication and coordination among arbitrageurs can make them choose to ride on a bubble,
rather than go against it and correct the mispricing. Thus, our empirical results have implications
for a broader context than the one studied in this paper.
The remainder of this paper is organized as follows. In Section 2 we trace the history of
the SEC regulations of the proxy process and highlight the dramatic changes that occurred in
1992 regarding the ability of stockholders to communicate with each other as well as with
arbitrageurs. We also provide some institutional details and examples of activist arbitrage in the
closed-end fund industry. Section 3 describes the unique dataset used for the empirical analysis
in this paper. In Section 4 we develop the empirical methodology used for the empirical
analysis. Then we present our empirical results on the relations between activist arbitrage and
closed end funds’ discounts and on the effects of communication costs on the activist arbitrage.
Section 5 concludes and outlines areas for future research.
2. Background
2.1. SEC Regulation of the Proxy Process
2.1.1. Regulation prior to 1992: Limitations on Shareholder Communication
Dissident shareholders have two main avenues via which they can impose changes in a
corporation. They can initiate a proxy contest to replace the board of directors and achieve
ultimate control over the corporation, or they can make a shareholder proposal to improve
corporate governance measures, alter corporate decisions, etc. The issues raised by dissidents in
proxy contests and shareholder proposals are resolved by shareholders’ voting. In the voting
process, also called proxy process, the dissident shareholders try to get the proxies (votes) of
other shareholders to support the changes they wish to make.
The rules governing the proxy process were first established by the Securities and
Exchange Commission (SEC) in 1935 under the authority granted by Section 14(a) of the
Securities Exchange Act of 1934 (see SEC (1935)). In establishing the rules, the intent of the
SEC was to insure that shareholders were accurately informed about voting issues and that

8
voting was fair, honest, and immune from manipulation by soliciting parties. One of the first
rules enacted by the SEC required any party soliciting proxies (requesting votes) from other
shareholders to register and disclose information such as the name and ownership position of the
soliciting party, the matters to be voted on, the intended vote of the soliciting party, and other
matters. The information could not contain statements that were false or misleading. The proxy
solicitation documents were reviewed by the SEC, which often exercised its power to require
significant changes before approval.
The proxy rules evolved significantly after 1935. The most significant amendments were
enacted in 1956 following an increase in public controversy over proxy contests for control of
large, visible corporations (see SEC (1956)). These amendments created major deterrents on
communication among shareholders during the course of a proxy process. The main component
of the 1956 amendments was a change in the definition of a proxy solicitation. Previously,
solicitation had been defined to involve only a formal request for a proxy. Under the new
definition, a solicitation consisted of any communication under circumstances reasonably
calculated to influence voting decisions. This liberal interpretation of solicitation dramatically
expanded the power of the SEC to require registration and review of proxy communications. In
particular, the new definition allowed the agency to assert control over any communications
between a soliciting party and shareholders (not only the solicitation document itself); public
statements made by dissidents and third parties allied with dissidents; analyses of voting issues
rendered by parties with no formal affiliation with any party (such as investment analysts); and
any impromptu communications made through television, speeches or on the radio. The second
major component of the 1956 amendments was the increase in the requirements of disclosure
about the identity, intentions, and associations of dissidents attempting to elect a competing slate
of directors. Finally, the third broad component of the new proxy rules placed restrictions on
communications containing complex, sophisticated, or forward-looking language, or questioning
the competence of other soliciting parties, especially the incumbent management. As examples
of statements that might be misleading (and therefore disallowed), the new rules mentioned
predictions regarding future sales, earnings or dividends and ad homonym attacks on the
competency or integrity of the current management.
Clearly, these rules had a stifling effect on stockholder communication. By placing
almost any communication among shareholders under the control of the SEC, and by making it
9
difficult to disseminate detailed and predictive information in proxy campaigns, the regulations
limited the provision of private information on voting issues. Providers of private information
had to bear the direct costs of dealing with the SEC – such as filing costs, costs of delay, and risk
of being disapproved. They had to give up anonymity, and bear the risk of being sued when the
communication might be interpreted as violating the regulations. 11 Thus, the regulations
disturbed the working of the voting market considerably. Importantly, the impact of the
regulations fell probably mostly on dissidents, who typically start the proxy process at a
disadvantage relative to the incumbent management. The 1956 regulations remained in place till
1992 and were, in fact, reinforced several times in further regulations and court decisions during
that period.
2.1.2. The 1992 Reform: Enhanced Shareholder Communication
The limitations on shareholder communication in the pre-1992 law have been subject to
wide criticism. Pound (1991) summarized the criticism from an academic point of view. In
policy circles, SEC Chairman at the time, Richard Breeden, ironically stated that: “If political
elections were subject to the SEC’s old guidelines, every time citizens wanted to discuss their
views on President Bush, Bill Clinton or Ross Perot, they would have to file a description of
themselves and their views with the SEC”.12 Finally, in October 1992, the SEC enacted major
revisions in the proxy rules in order to increase shareholder communication (see SEC (1992)).
The new rules curtailed the definition of a proxy solicitation to exclude any
communication by shareholders when not directly seeking the power to vote as proxy for other
shareholders, as long as the shareholders’ motive is only to gain pro rata with other shareholders.
The 1992 amendments also specifically excluded shareholders’ public statements of their voting
intentions and/or voting rationale (including public speeches, press releases, newspaper
advertisements, and internet communications) from the definition of a solicitation. These
changes effectively allowed independent shareholders to freely engage in communication during
11 Note that law suits are possible even if the communication passes through the SEC. Pound (1991, pp 269-278) provides an excellent discussion on this issue and other implications of the 1956 regulations. 12 David R. Sands, Investors Victors in Wide SEC Reforms, WASHINGTON TIMES, Oct. 16, 1992, at C1.

10
(and before) a proxy process without being monitored by the SEC, and without bearing the
liability imposed by law on proxy solicitations.13
To sum up, the reform of 1992 lifted restrictions on communication among shareholders
in the proxy process. This change is expected to make the proxy process easier for dissident
shareholders, and thus to decrease the limits to activist arbitrage. In this paper, we document and
study activist arbitrage in the closed-end fund industry. We analyze the effect of the 1992
reform on this arbitrage, and more generally the relation between this arbitrage and costs of
communication.
2.2. Activist Arbitrage in the Close-End Fund Industry
2.2.1. The Arbitrageurs
The textbook treatment of arbitrage activity typically posits that a large number of
investors add a smaller portion of a mispriced asset to their well-diversified portfolio thus
leading to the elimination of observed mispricing. One of the distinctive features of the study
that we conduct is the ability to identify the arbitrageurs that are active in the CEF market, the
funds that they are involved in, and the extent of cooperation among these activists. Indeed, only
a handful of arbitrageurs tend to actively engage in attempts to liquidate or open-end CEFs.
Consider, for example the following passage from a recent Business Week article:
“Some institutions are more aggressive than others. A few groups are known for their activism: Newgate Management Associates, based in Greenwich Conn., Harvard College, City of London Investment Management, Lazard Freres & Co., and Phillip Goldstein, who runs Opportunity Partners, a $40 million hedge fund that specializes in closed-end funds in Pleasantville, N.Y. Their stake in a closed-end fund does not guarantee an open-ending, but the odds are higher.”14
Similarly, in reviewing arbitrage activity in CEFs, an article published in Forbes reviewed the
activity of a key activist, Phillip Goldstein, and commented that:
“Goldstein’s Opportunity Partners is joined in these battles by some heavy weight speculators: Harvard, [George] Soros Fund Management, Michael Price’s Mutual
13 In 1998, the SEC instituted another pro-dissidents reform in the proxy rules. This reform made it easier for shareholders to include a broader range of proposals in companies’ proxy materials. In this paper, we do not focus on this reform. 14 Toddi Gutner, When the lead comes off closed-end funds, BUSINESS WEEK, Sep.29, 1997.
11
Qualified, investment bank Lazard Freres and Newgate Management based in Greenwich, Conn.”15
As we review each of the histories of the equity CEFs in our database it is evident that the
arbitrageurs that are mentioned in the previous quotes are, with minor exceptions, the ones that
tend to engage in activist arbitrage.16 This evidence is important since a small set of risk-averse
arbitrageurs will be unwilling to take large stakes in underperforming CEFs thus limiting their
ability to easily eliminate observed discounts (Barberis and Thaler (2003)). Moreover, the
activity of only a small number of institutions suggests that coordination among their actions is
likely to be paramount in successful open ending.
Since some of the activist activity that we focus on is relatively unexplored we now
proceed with a detailed description of the evolution of an activist attempt at open-ending. This
example reflects some key commonalities in the behavior of dissident shareholders and
managements. Figure 1 provides illustration of the example.
[Insert Figure 1 here]
2.2.2. Activist Example: The Growth Fund of Spain
The Growth Fund of Spain conducted an IPO in early 1990. The fund’s prospectus
required that if a discount of greater than ten percent would persist for twelve weeks, and if a ten
percent shareholder would submit a written request, the fund will have to propose a
reorganization into an open-end structure to be passed by a three-fourths vote. In early 1996
management submitted a preliminary proxy statement inviting the fund shareholders to the
annual meeting to be held the following May indicating that both the discount and written
request conditions were met (PRE 14A filed on March 8th 1996). Management indicated its
opposition to open-ending, however. Since the vote in favor was only 30 percent of outstanding
shares the proposal failed (N-30D filed on July 30th 1996). At the same meeting shareholders
also considered a proposal by Cargill Financial Markets PLC that the fund make a practice of
making repurchases at three-month intervals. This proposal did pass with a majority of the
15 Thomas Easton, Try your hand at fund arbitrage, FORBES, 09/08/1997 Vol. 160(5), page 209. 16 Other key players include Ron Olin, founder of Deep Discount Advisors, Bankgesellschaft Berlin AG, and Laxey Partners Limited.
12
voting shares. Shortly thereafter Cargill Financial Markets sent a letter to the fund requesting
that a proposal that the fund be converted into open-end investment company be included in the
proxy materials for the Fund's 1997 annual meeting of shareholders. The management chose,
however, not to include Cargill’s proposal in the proxy material thus thwarting the attempt to
open-end (see both SC 13D filed on November 22nd 1996 and DEF 14A filed on April 9th 1997).
In June 1997, the fund’s largest shareholder, Bankgesellschaft Berlin AG, expressed its
interest in eliminating the fund discount, which at the time was 19 percent. It suggested
measures including open-ending, tender offers, and liquidation. It also suggested that it may
increase its holdings to gain a majority, seek representation on board, or solicit a proxy (SC 13D
filed June 18th 1997). By October 1997, Bankgesellschaft Berlin sent a letter requesting that its
nominees, rather than the fund nominees be included on the proxy for the meeting of
shareholders (SC 13D/A filed October 8th 1997). By the time the letter was sent
Bankgesellschaft Berlin had increased the shares held to 9.2 percent of shares outstanding. The
fund then replied that the Bank’s letter had arrived too late, and the Bank’s nominees would not
be included for consideration in the special meeting scheduled for early December.
In response, Bankgesellschaft Berlin decided to solicit its own proxies for the upcoming
special meeting in December. The Bank proposed two nominees to the board and asked
shareholders that they return the Bank’s proxy, not the fund’s (PREC14A filed November 3rd
1997, SC 13D/A filed November 4th 1997 and DEFC14A filed November 6th 1997). The fund
responded with a letter, (DEFA14A filed November 24th 1997) to shareholders suggesting that
the Bank’s intention is to realize a short-term gain, while diminishing the long run return of the
fund. Bankgesellschaft Berlin then responded by sending a letter to fund managers demanding a
proposal that the fund be open ended. By this time the Bank had increased its holding of the
fund shares to 11 percent (SC 13D/A filed November 26th 1997). In addition, the Bank sent a
letter to shareholders announcing that at the December special meeting, the Bank's nominees
received a plurality of votes and would take office upon the upcoming merger transaction. The
Bank’s nominees won the board positions by a landslide: 8,663,028 to 1,772,125 over the fund’s
nominees (SC 13D/A filed December 16th 1997 and N-30D filed August 3rd 1998).

13
In September of 1998, the newly elected board of the fund filed a proposal that the fund
be converted into an open-end investment company (PRE 14A filed September 11th 1998). The
proposal passed with 11,399,716 votes in favor and only 221,207 against.
3. Data
Using the Center for Research in Security Prices (“CRSP”), we gathered information on
all closed end funds that were in existence sometime over the period 1988 through 2002. We
then constrained this sample to funds managing either domestic or international equity, including
specialized equity funds. Eliminated from the sample are closed end funds investing in
convertible bond, preferred stock, taxable bond, real estate, private equity, and municipal debt.
We also excluded exchange traded funds, funds incorporated outside the U.S, and funds for
which we were unable to obtain Net Asset Value (NAV) information. We cross checked our list
of funds with various Barron’s publications to make sure that our sample encompasses all public
equity funds that were traded sometime after 1988. We conducted a similar comparison using
data obtained from Lipper and various Morningstar’s Principia publications for all closed end
funds. The resulting sample includes 142 closed end funds that were traded sometime over the
period 1988-2002.
Based on this sample, we hand-collected, all reports filed with the SEC through Edgar.
Since the information on Edgar is typically not available prior to the mid-90s we used Lexis
Nexis for filings in earlier years. We retrieved registration statements, proxy related materials,
and annual reports. We also searched for news stories using databases such as factiva (formerly
Dow Jones Interactive), Proquest, Lexis Nexis, as well as news published on the internet. For
each fund, we then formed a summary of all events that might potentially be related to arbitrage
activity of the kind we study in this paper. These events include funds’ decisions to repurchase
shares, conduct rights offerings, merge, liquidate, and open end, as well as detailed timeline of
dissident activity to open end the fund whether successful or not.
To assess the completeness of the resulting fund activity we purchased various monthly
publications from Thomas Herzfeld Advisors. These publications provide a thorough description
of the full universe of closed end funds’ corporate activity ranging from liquidations and mergers
that have already been consummated to outstanding and unresolved activities (such as tender

14
offers, rights offerings, and dissident activity). We then cross checked that the events outlined in
the Herzfeld publication match those compiled from the sources described earlier.
Since the regression analysis hinges on the construction of indicator variables for various
degrees of arbitrage activity, we constructed three fund activity indicators denoted “strong”,
“medium” and “weak.” The indicator variable “strong” receives the value ‘1’ if an open ending,
merger, or liquidation have occurred in a given year and zero otherwise. The variable “medium”
receives the value ‘1’ if an attempt (either by the management or a dissident) has been made to
open-end or liquidate the fund in a given year and zero otherwise. Finally, we recorded events in
which CEFs conduct more mundane corporate activity such as share repurchases and rights
offerings – which sometimes come as a response to an attack of activist arbitrageurs – as “weak”
and assigned a value ‘1’ to a fund-year if such activity is detected and zero otherwise. In later
analysis, we equate the existence of either “medium” or “strong” activity to an open-ending
attempt, and the existence of “strong” activity to a successful open-ending. The “weak”
indicator ended up not delivering significant results.
Table 1 Panel A reports the summary statistics (the mean, median, and standard deviation
among all existing funds at each year) of major fund characteristics variables. We purchased
monthly NAV and price data from Securities Data Corporation (SDC). In a few cases in which
the data is missing we obtained the NAV and price data from Herzfeld Advisors. Following the
practice in the literature, fund discount is calculated as (NAV-Price)/NAV. In most years, about
80%-90% of the CEFs trade in discount, similar to the numbers documented in the prior
research. Institutional holdings are from Thomson Financial’s Spectrum Data, and insider
holdings are from Thomson Financial’s Lancer Analytics. From CRSP we also obtained
information about price, volume, return, dividend, market capitalization, and turnover rate. Fund
age is calculated as the time, in years, since the fund first listed on CRSP. The annual dividend
yield is calculated as the difference between the annual buy and hold return with dividends and
the buy and hold return without dividends.
Table 1 Panel B lists the summary statistics of the governance variables for the full
sample period and sub-periods (1988-1992, 1993-1998, 1999-2002). We collected information
on the existence of a staggered board, supermajority, special meeting, and confidential voting by
15
examination of the funds’ filings with the SEC which were discussed earlier.17 Information on
lifeboat provisions, which entail commitment of the fund to take action to reduce the discount in
certain circumstances, was purchased from Thomas Herzfeld Advisors and augmented by a
review of funds’ activities that we compiled. Finally, information on management fees was
purchased from SDC. It can be seen that most of these variables have some but little variation
within the same fund. To disentangle time trends from composition effects, we separately report
the summary statistics in each period for old and new funds, depending on whether the fund has
been in our sample for more than three years.
[Insert Table 1 here]
Figure 2 plots the time trends of open-ending attempts (i.e., “medium” and “strong”
activities) and actual open-endings, liquidations and mergers into open-end funds (i.e., “strong”
activities) from 1988 to 2003.18 There is a clear upward trend in open-ending attempts after the
law change, especially after 1994. In early 1990s, only 3-4% of the funds were subject to activist
arbitrage attacks. In the peak of 1999-2000, it rose to 27% of the sample funds.
[Insert Figure 2 here]
4. Empirical Results
4.1. Review of CEF Discounts
To set the stage for the empirical analysis, we begin with a review of the key cross-
sectional determinants of CEF discounts documented in the literature. Most of the existing work
focuses on noise-trader risk, agency costs, and the costs of arbitrage (transaction and holding
costs) as the main explanations for the discounts. Table 2 presents a brief review using our
sample data, where regressions are presented using the full sample, i.e., 1988 through 2002. The
dependent variable is DISCOUNT, defined as (NAV-Price)/NAV. The first column provides
17 We do not present statistics on confidential voting since there is little cross-sectional variation in this variable. 18 Information is retrieved for one more year into 2003 because in the analysis open-ending activities will be regressed on lagged variables.

16
results based on a pooled regression with year fixed effects while the second column provides
results based on a Fama-MacBeth type regression.
[Insert Table 2 here]
We start with funds’ market value and share price. Pontiff (1996) argues that high
transaction costs increase the costs of arbitrage trading, and thus generate a higher degree of
mispricing, i.e., a higher discount. He argues that transaction costs are greater for small funds
and funds with a low market price. The rationale for the inclusion of market price is that the bid-
ask spread tends to be relatively fixed at low prices. As a result, low-price securities tend to have
higher proportional transaction cost. We include these variables in the regression along with
share turnover as alternative measure of liquidity.19 We measure fund size by the market
capitalization (MV) of the fund in log dollars; market price (P) of the fund shares is also
expressed in log dollars; and share turnover (TO) is given by the yearly share volume scaled by
shares outstanding. We find that market capitalization does not impact the magnitude of the
discounts when other characteristics are controlled for. However, the results in Table 2 indicate
that lower share price is indeed associated with higher discount, consistent with Pontiff (1996).
Similarly, share turnover is inversely related to fund discount, consistent with the idea that more
liquid CEFs tend to trade at lower discounts.20
Our next variable is also motivated by Pontiff (1996). The pure-trading arbitrage of
CEFs requires taking opposite positions in the underlying assets. Consequently, the ease of
replicating the fund portfolios is a determinant for the cost of arbitrage. Specifically, the more
unconventional the underlying assets are, the more costly arbitrage is, and the more likely it is
that the price will deviate from its NAV. On the other hand, a CEF might go public precisely
because investors are willing to pay a premium for the hard-to-replicate fund assets, which could
19 The turnover variable will be used later on in our analysis under a different interpretation. 20 It is possible, that the inverse relation between fund discount and share price is driven by a mechanical correlation given that the denominator of the dependent variable, NAV, is highly correlated with price (the correlation exceeds 0.9). We therefore consider two alternative liquidity measures that do not involve price or NAV normalization (results are not tabulated). The first measure, following, Bekaert, Harvey, and Lundblad (2005), is the proportion of zero-return days for each fund-year where days without any price change reflect very thin trades (or no trades). The second measure is based on Pastor and Stambaugh (2003) who argue that illiquidity can be proxied by a stronger relation between daily returns and signed lagged dollar volume. We estimate for each fund-year these liquidity measures. We find that for both measures higher illiquidity is indeed associated with higher fund discounts although only the second measure is marginally significant.

17
lead to higher (lower) premium (discount). Which effect dominates is an empirical question.
Similar to Pontiff (1996) and Gemmill and Thomas (2002), we use residual standard deviation of
a fund’s NAV return (STDNAV) as a proxy for the replicability of the fund’s underlying
portfolio. The residual obtains from a regression of a fund’s NAV return on the Fama-French
three factors plus an additional momentum factor. These four factors were all obtained from Ken
French’s web site. To this we add two MSCI international indices representing the European
market and the Far East market. We find that the effect of STDNAV on discount is negative and
significant in the two specifications, suggesting that the second effect above dominates the first
one.21
Pontiff (1996) also argues that higher dividend yields should make it easier to execute a
pure-trading arbitrage and thus be associated with lower discounts. A dividend payout is
essentially a partial liquidation of the fund share, and thus draws price closer to the NAV.
Further, higher dividends increase the liquidity of the assets because the cash flows become more
front-loaded. The regression results show that dividend yield (DIV) is significantly (at the 2.5%
level) negatively related to discount, consistent with the findings by Pontiff (1996). A one
percentage point increase in the dividend yield is associated with 0.3-0.5 percentage point
decrease in the discount.
The expense ratio (FEES) and the proportion of fund shares held by insiders (INSIDER)
have been commonly adopted as proxies for agency costs. Fees do not seem to be related to
deeper discounts.22 A lack of relation between fees and discount is also documented by Malkiel
(1977), Barclay, Holderness and Pontiff (1993), Gemmill and Thomas (2002) and Del Guercio,
Dann, and Partch (2003). On the other hand, higher insider ownership is overall significantly
associated with higher discount, consistent with the hypothesis of insiders’ private benefit of
control.
Another variable we consider is fund age (AGE). The literature has documented that
CEFs go public when investors demand for their assets is high. This leads to funds trading at a
21 The inverse relation between STDNAV and fund discount differs from that documented by Pontiff (1996) and Gemmill and Thomas (2002) and may very well arise due to the different sample that is used in our study. Additional robustness tests yield similar results. 22 The result does not change much if FEES is replaced with the residuals from a regression of FEES on fund characteristics that could affect expenses for non-agency related reasons: fund size; turnover; the fund being primarily invested in international stocks, specialized stocks, or small-cap stocks, and a time trend.

18
premium after their initial public offering which over time turns into a discount. The regression
results are consistent with this pattern although the statistical significance is low.
Lastly, we also consider the presence of a lifeboat provision (LIFEBOAT). Such
provision entails commitment of the fund to take action to reduce the discount in certain
circumstances. Thus, it puts an upper bound on fund discount. Lifeboat provisions vary in their
rigidity: from some promise of remedial measures (such as share repurchase) to a firm
commitment of open-ending when the discount rises above a certain threshold. A lifeboat
dummy is coded as one if the fund has genuine lifeboat provision or specifies explicit dates of
tender offers or repurchase. As expected, LIFEBOAT seems to reduce discount but the
magnitude is moderate: the existence of a lifeboat provision reduces the discount by 1.4-1.8
percentage points, with marginal significance.
For robustness check, Column 3 of Table 2 considers a more parsimonious alternative to
year dummies. Following Lee, Shleifer and Thaler (1991), we use the difference between the
return on small stocks and the return on large stocks as a proxy for investor sentiment. The
results show that the proxy for sentiment is significantly related to the discount in the expected
direction.
Overall, a handful of covariates are able to explain a reasonable portion of the cross-
sectional variation in the fund discount: they jointly explain 18.2% of the total variation in
DISCOUNT at the fund-year level with year dummies. We will include these covariates as we
proceed to analyze the relation between the discounts and activist arbitrage.
4.2. Analysis of Activist Arbitrage
4.2.1. Model Specification
The focus of the paper is the analysis of the activist arbitrage aiming at open-ending
closed-end funds. Of particular interest to us are the questions of how the improved shareholder
communication affects the pattern of arbitrage, and how the fund discount reflects the prospect
of such arbitrage.
Obviously, the occurrence of activist arbitrage and the fund discount are simultaneously
determined: we expect activists to be more likely to attack deeply discounted CEFs, as they
provide higher profitability in case of success. In the meanwhile, in a world with rational
19
expectations, CEF discounts should take into account the funds’ susceptibility to open-ending.
Thus, a simple reduced-form regression of observed attacks on observed discounts would
underestimate the sensitivity of attacks to discounts and would underplay the rational-
expectations component in both activist attacks and CEF discounts
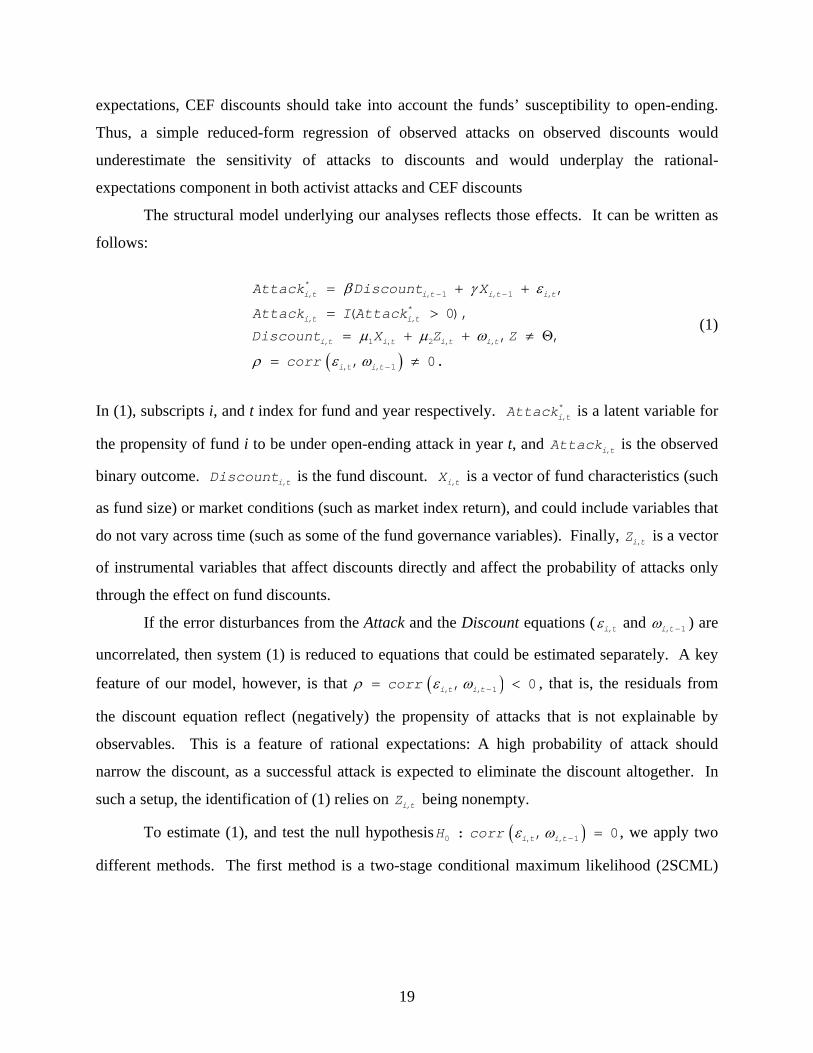
The structural model underlying our analyses reflects those effects. It can be written as
follows:
( )
*, , 1 , 1 ,
*, ,
, 1 , 2 , ,
, , 1
,
( 0),
, ,
, 0.
i t i t i t i t
i t i t
i t i t i t i t
i t i t
Attack Discount X
Attack I Attack
Discount X Z Z
corr
β γ ε
µ µ ω
ρ ε ω
− −
−
= + +
= >
= + + ≠ Θ
= ≠
(1)
In (1), subscripts i, and t index for fund and year respectively. *,i tAttack is a latent variable for
the propensity of fund i to be under open-ending attack in year t, and ,i tAttack is the observed
binary outcome. ,i tDiscount is the fund discount. ,i tX is a vector of fund characteristics (such
as fund size) or market conditions (such as market index return), and could include variables that
do not vary across time (such as some of the fund governance variables). Finally, ,i tZ is a vector
of instrumental variables that affect discounts directly and affect the probability of attacks only
through the effect on fund discounts.
If the error disturbances from the Attack and the Discount equations ( ,i tε and , 1i tω − ) are
uncorrelated, then system (1) is reduced to equations that could be estimated separately. A key
feature of our model, however, is that ( ), , 1, 0i t i tcorrρ ε ω −= < , that is, the residuals from
the discount equation reflect (negatively) the propensity of attacks that is not explainable by
observables. This is a feature of rational expectations: A high probability of attack should
narrow the discount, as a successful attack is expected to eliminate the discount altogether. In
such a setup, the identification of (1) relies on ,i tZ being nonempty.
To estimate (1), and test the null hypothesis ( )0 , , 1: , 0i t i tH corr ε ω − = , we apply two
different methods. The first method is a two-stage conditional maximum likelihood (2SCML)
20
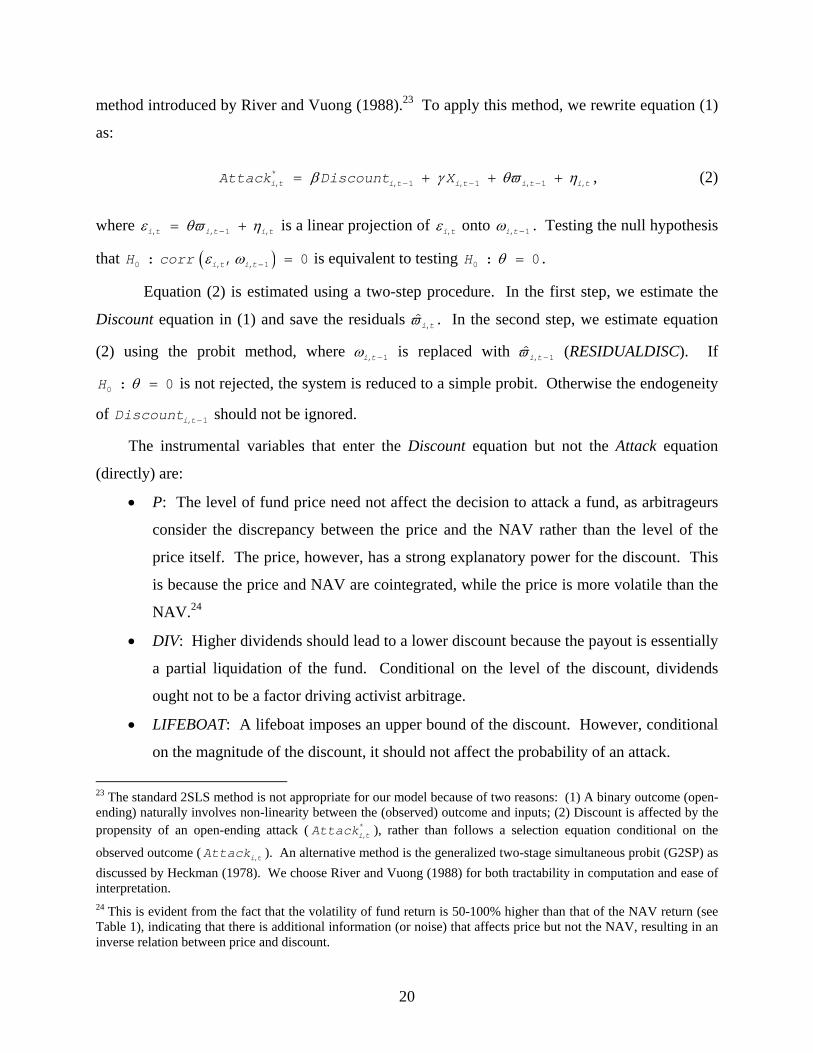
method introduced by River and Vuong (1988).23 To apply this method, we rewrite equation (1)
as:
β γ θϖ η− − −= + + +*, , 1 , 1 , 1 ,i t i t i t i t i tAttack Discount X , (2)
where , , 1 ,i t i t i tε θϖ η−= + is a linear projection of ,i tε onto , 1i tω − . Testing the null hypothesis
that ( )0 , , 1: , 0i t i tH corr ε ω − = is equivalent to testing 0 : 0H θ = .
Equation (2) is estimated using a two-step procedure. In the first step, we estimate the
Discount equation in (1) and save the residuals ,i tϖ . In the second step, we estimate equation
(2) using the probit method, where , 1i tω − is replaced with , 1i tϖ − (RESIDUALDISC). If
0 : 0H θ = is not rejected, the system is reduced to a simple probit. Otherwise the endogeneity
of −, 1i tDiscount should not be ignored.
The instrumental variables that enter the Discount equation but not the Attack equation
(directly) are:
• P: The level of fund price need not affect the decision to attack a fund, as arbitrageurs
consider the discrepancy between the price and the NAV rather than the level of the
price itself. The price, however, has a strong explanatory power for the discount. This
is because the price and NAV are cointegrated, while the price is more volatile than the
NAV.24
• DIV: Higher dividends should lead to a lower discount because the payout is essentially
a partial liquidation of the fund. Conditional on the level of the discount, dividends
ought not to be a factor driving activist arbitrage.
• LIFEBOAT: A lifeboat imposes an upper bound of the discount. However, conditional
on the magnitude of the discount, it should not affect the probability of an attack.
23 The standard 2SLS method is not appropriate for our model because of two reasons: (1) A binary outcome (open-ending) naturally involves non-linearity between the (observed) outcome and inputs; (2) Discount is affected by the propensity of an open-ending attack ( *
,i tAttack ), rather than follows a selection equation conditional on the
observed outcome ( ,i tAttack ). An alternative method is the generalized two-stage simultaneous probit (G2SP) as discussed by Heckman (1978). We choose River and Vuong (1988) for both tractability in computation and ease of interpretation. 24 This is evident from the fact that the volatility of fund return is 50-100% higher than that of the NAV return (see Table 1), indicating that there is additional information (or noise) that affects price but not the NAV, resulting in an inverse relation between price and discount.

21
The regressions include year fixed effects to capture market conditions (such as interest
rates) and noise trader sentiments. Other covariates include variables that would also appear in
the Attack equation: MV, STDNAV, AGE, TO, FEES, GOV, and INSIDER. GOV is an index (0-
3) aggregated over the existence of staggered board, supermajority, and special meeting.25 The
higher the index, the more power the managers have over outsider shareholders (thus governance
becomes worse).26 The attack equation also includes an indicator variable for the occurrence of
an open-ending attempt during the previous year, PASTATTK.
The 2SCML estimation procedure introduced above belongs to the class of limited
information maximum likelihood (LIML) methods. It is “limited” in the sense that it
incorporates simultaneous information in a sequence rather than imposing an integrated
constraint on a structural model. The LIML method is usually easy to compute and intuitive to
interpret, but is not efficient. For robustness check, we apply also the full information maximum
likelihood (FIML) method (once we identify that the feedback effect from attacks to discount is
significant).27
The FIML method relies on the conditional joint distribution of Attack and Discount.
Assume that the disturbances in the joint equation system (1) are jointly normally distributed,
each with zero mean, and covariance Σ , given by28
2
1 ρσρσ σ⎡ ⎤
Σ = ⎢ ⎥⎣ ⎦
. (3)
Rational expectations in the market suggest that ( ), ,, 0i t i tcorrρ ε ω= < . The
Appendix shows that the log likelihood for an attack for an individual fund-year observation in
our simultaneous equation model is:
25 Data also provides information about the existence of confidential voting. However, there is virtually no cross-sectional variation in this provision. 26 Special meetings are usually called by managements, and thus can be used by them to shorten the time available to dissidents to collect proxies. See Pound (1988). 27 To be more specific, the LIML estimation extracts from the data information about the conditional distributions f(Discount|X,Z) and f(Attack|Discount, X) sequentially although all variables are simultaneously determined. The FIML method, on the other hand, estimates the joint distribution f(Attack,Discount|X,Z) in a simultaneous system. 28 In binary response analyses (e.g., probit and logit), the dispersion of the error disturbances are in general not identified. Coefficients are conventionally estimated assuming unit variance error disturbance. This normalization does not affect the calculation of marginal probabilities, which are what researchers are interested in.

22
( ) ( )
( ) ( ), , , 1 , , 1
2
, 1 1 , 1 2 , 1, 1 2
, 1
ln (1 )ln 1
ln2
i t i t i t i t i t
i t i t i ti t
i t
l y u y u
Discount X Zµ µσ
σ
− −
− − −−
−
⎡ ⎤ ⎡ ⎤= Φ + − − Φ⎣ ⎦ ⎣ ⎦
− −− −
, (4)
where ,i ty is the binary dependent variable of an attack, and
( )1 2
2
/
1
Discount X Discount X Zu
β γ ρ σ µ µ
ρ
+ + − −=
−.
In (4), φ , Φ are the density and cumulative probability functions of the standard normal
distribution. The parameter set { }1 2, , , , ,µ µ β γ ρ σ is simultaneously estimable using the
maximum likelihood method. The estimates of key interest are β (the sensitivity of attacks on
discount corrected for endogeneity) and ρ .29
4.2.2. Activist Arbitrage and Discounts
Table 3 displays the results from the LIML estimation. The dependent variable in panel
A is a dummy for the occurrence of an attempted open-ending, including both successful and
unsuccessful resolutions (i.e., “strong” and “medium” activity), at the fund-year level. The
dependent variable in panel B is a dummy for actual open-ending (i.e., “strong” activity). The
mean of the two dependent variables are 15.2% and 3.9%, respectively, out of all fund-year
observations. Reported coefficients are marginal probability values in percentage points for a
unit change in the covariates around their respective mean values.
[Insert Table 3 Here]
A simple regression of Attack on Discount shows that a one percentage point increase in
the observed discount is associated with a 0.69 percentage point increase in the probability of an
attempted open-ending (column 1 of Panel A) and 0.10 percentage point increase in the
probability of an actual open-ending (column 1 of Panel B). When adding the feedback effect,
29 Evan, Oates, and Schwab (1992) use a similar method to estimate the feedback effect from peers in teenage behavior. Their case is a mirror image to ours. Their model controls for the endogenous formation of peers in order not to over-estimate the peer effects on teen pregnancy.

23
i.e., the variable RESIDUALDISC into the equation (column 2), the attack-to-discount sensitivity
increases by more than 50% to 1.25 (Panel A) and 0.31 (Panel B) percentage points, while the
coefficients on RESIDUALDISC are -0.70 (Panel A) and -0.26 (Panel B) percentage point. All
these coefficients are statistically significant at the less than 1% level. Columns 3 and 4 add
other covariates as controls. The coefficient estimates of these two key variables remain
qualitatively the same and statistically significant.
The magnitude of the coefficients in column 4 (with a full set of control variables)
implies that for a one percentage point exogenous increase in the fund discount, the probability
of an attempted (actual) open-ending increases by 0.84 (0.30) percentage point; on the other
hand, a 0.33 (0.26) percentage point increase in the anticipated probability of an attempted
(actual) open-ending is associated with a one percentage point narrowing in the current discount.
The first part suggests that arbitrageurs are indeed more attracted to funds with deeper discounts.
The latter part demonstrates the feedback effect: its significance (at less than the 5% level)
indicates that there is a rational component in the CEF discounts that incorporates the prospects
of activist arbitrage.30 In other words, anticipated arbitrage activities result in fund prices closer
to the underlying net asset values.
Table 4 lists estimates from the FIML system (4) in comparison with a simple probit
estimation disregarding the feedback effect from activist arbitrage to the discount (that is,
constraining ρ to be zero). The estimates are comparable to those in Table 3. In particular, the
marginal effect of a one percentage point increase in the fund discount is a 0.80 (0.29)
percentage point increase in the probability of an attempted (actual) open-ending. The marginal
probability estimate would drop to 0.56 (0.08) percentage point if the feedback effect is ignored.
The measure for the magnitude of this feedback effect is the estimated ρ which is -0.24 (-0.45),
significant at the 10% (1%) level. It is not surprising that the prospect of actual open-ending has
a stronger feedback effect on the discount (both in terms of the magnitude and significance)
because an ex post open-ending is more effective in eliminating the discount than an attempt
with uncertain outcome.
30 In the lack of perfect instruments that extract all variations in DISCOUNT other than the component that reflects the fund’s susceptibility to open-ending attacks, the test of the feedback effect tends to have low power because the variable RESIDUALDISC also contains some exogenous component of DISCOUNT that are positively associated with ATTACK. Therefore, finding a significantly negatively coefficient on RESIDUALDISC is a strong evidence for the feedback effect. For the same reason, the inverse of the coefficient estimate on RESIDUALDISC does not have the convenient interpretation of the sensitivity of discount to the anticipated probability of an attack.

24
[Insert Table 4 Here]
4.2.3. Communication, the Law Reform of 1992, and Activist Arbitrage
The law reform of 1992 lifted barriers on communication among shareholders during the
proxy process. Since communication is particularly important for activist arbitrage, we expect
the law reform to increase the level of such arbitrage activities. We provided preliminary
evidence of this trend in Figure 2. Regression analysis provides further support. Columns 5 and
6 of Table 3 break the sample by the dependent variable into two sub-periods: 1989-1993 (pre
law reform) and 1994-2003 (post law reform).31 Other things equal, there is an 8.48 (t-statistic =
3.58) percentage point increase in the probability of open-ending attempts during the 1994-2003
period compared to 1989-1993, calculated as the differences of attack probabilities between the
two sub-periods by setting all regressors in Table 3 to be the all-sample mean. The results
regarding the probability of actual open-ending are less striking: the probability in the second
sub-period increases by 1.22 (t-statistic = 1.13) percentage points. These results are consistent
with the evidence in Choi (2000), who examines the impact of the 1992 SEC reforms on
shareholder-sponsored corporate governance proposals. Choi (2000) finds that the reforms led to
the entry of new groups that sponsored more shareholder proposals although these proposals
were not more successful.
Other than the increase in activity, there are several other notable changes in the pattern
of activist arbitrage after the law reform (shown in Columns 5 and 6 in Table 3). First, the
feedback effect from attempted open-endings seems to have weakened during the post-law
period (in Column 6 of Panel A, the coefficient on RESIDUALDISC is not significant). This
result reflects the fact that the actual-to-attempted open-ending ratio is much lower in the second
period (see Figure 2). While the proxy reform encouraged more attacks on CEFs, the outcomes
have also become less certain. Consistent with this reasoning, the feedback effect from actual
open-ending remains significant (at the 5% level) during the post-law period (see Column 6 of
Panel B).
Second, the effect of fund governance on the tendency of activist attack is noticeably
different before and after the law change. Here, the governance is an index (0-3) aggregated
31 The sample period is split by 1993 rather than 1992 because all regressors in (2) are lagged by one year.
25
over the existence of staggered board, supermajority, and special meeting. The higher the index,
the more power the managers have over outsider shareholders. Pro-manager governance is
termed “bad” governance in the recent literature (e.g., Gompers, Ishii, and Metrick (2003), Del
Guercio, Dann, and Partch (2003)). After 1993, the addition of one of the three provisions is
associated with an increase of 3.9 percentage points in the probability of attack (significant at the
1% level). Moreover, funds with higher insider ownership invite more attacks after 1993
(significant at the 5% level). Such relations were non-existent beforehand. This evidence echoes
Choi’s (2000) finding that after the proxy reform firms with stronger management entrenchment
(as measured by insider ownership) and more pro-manager governance became more frequent
targets of proxy proposals and contests. In our view, the result provides additional support to the
role of communication: since communication among shareholders is particularly important when
managers have more power in fighting against dissidents, activist arbitrage against firms with
pro-manager governance became more prominent after the change in the law.32 Interestingly,
although high fees may also point to bad governance, we find that high-fee funds are overall less
susceptible to attacks in the post-law era (significant at the 2.5% level). This may be because
high fees dissipate the NAV quickly, and thus make activist arbitrage more costly.
Overall, we do not intend to overstate the conforming time-series pattern because it does
not uniquely identify the effect of the law change: it could also represent a trend or a
coincidental time variation of unmodeled factors that impact arbitrage activities. To further
support the role of communication, we now turn to present evidence using cross sectional
measures for the ease of communication. We consider the following proxies for communication
(COMMINICATION): CEF share turnover rate, size of trades by CEF shareholders, and
institutional ownership. Table 5 reports the results.
[Insert Table 5 here]
First, consider share turnover. High turnover makes communication more difficult for
two reasons (see also the motivation by Pound (1988)). First, given the time lag at which
32 Strong management entrenchment (higher insider ownership and more anti-takeover defenses) naturally makes it more difficult for outsider activists to carry out their agenda. The data reflects this as well. Panel B of Table 3 indicates that the probability of successful open-ending is not significantly related to insider ownership or the governance index. Combined with the latter’s positive relation to attempted attacks in the post-law era, we infer that stronger management entrenchment leads to lower success rate of activist arbitrage. Choi (2000) has similar findings.

26
account names become available to activists, the latter may not get up-to-date shareholder
contacts at high turnover funds. Second, there is a time gap, usually varying between 10 to 60
days, between the record date (which qualifies a shareholder to vote the proxy) and the actual
vote date. High turnover causes a separation of voting rights and cash flow rights for a large
number of shareholders. Investors with short holding periods (corresponding to high turnover)
may cease to be shareholders by the voting date or expect to quit the fund soon. Either way, they
do not have the incentive to cast a careful vote. Column 1 of Table 5 (repeated from Table 3)
reveals this pattern regarding turnover (TO). After 1993, a 100 percentage point increase in the
annual turnover rate is associated with a 7.9 percentage point lower probability of an attempted
(actual) open-ending, significant at the 2.5% level. Such an effect was non-existent in the earlier
period, probably because communication was severely restricted by law for all funds, so that
cross-sectional differences did not matter much for the probability of activist arbitrage. It is
interesting to note that while we identify high turnover as an impediment to activist arbitrage, it
is commonly believed that this variable encourages pure-trading arbitrage. This is because high
turnover indicates high level of liquidity. This ambivalent effect of liquidity on arbitrage is
consistent with the analysis of Kahn and Winton (1998) and Bolton and von Thadden (1998) on
regular corporations: while liquid trading enhances securities pricing efficiency, it discourages
value-improving intervention by informed shareholders.
Another natural candidate for the communication proxy would be the average
shareholder account size. CEFs in the U.S. are predominantly held by retail investors, the
median institutional holding is about 10-15% for most years (the corresponding figure for regular
COMPUSTAT firms during the same period is about 35%).33 Holding the market value of a
fund constant, the smaller the average holding per account, the more shareholders an arbitrageur
needs to contact and persuade in order to obtain a critical mass of support. Accessing a large
number of shareholders is logistically difficult, and motivating them is even more so, either
because small shareholders have a stronger tendency to free ride, or because they are not able to
make sensible votes due to lack of information or lack of financial sophistication.34
33 Gemmill and Thomas (2002) document that the CEFs in U.K. are predominantly institution-owned. 34 Open-ending is just one type of proxy proposals shareholders receive. Some proposals are dubious of pursuing sponsors’ private agenda rather than general shareholder welfare (see evidences in Choi (2000)). Managers frequently cite this reason to persuade shareholders to vote against the dissidents.
27
Direct information about individual account size with reasonable accuracy is not
available despite our effort. We hand collected from CEF’s semi-annual N-SAR reports to the
SEC the total number of shareholder accounts reported by the funds (item 74X). We were only
able to locate this information for about a third of the funds in our sample. Even this smaller
sample of collected data, however, is not an accurate proxy for the real number of accounts
because it does not separate the true individual accounts (where the beneficial owner lists
directly as a shareholder) and the omnibus account (also called the street accounts, where
numerous individuals are lumped under one account with a financial intermediary). The
identities of the shareholders in the latter accounts are not revealed to the fund, let alone to the
activists.
However, it is reasonable to assume that the size of a typical trade by an investor in a
fund is significantly positively correlated with his total holdings in the fund. (Battalio and
Mendenhall (2005) use trade size to proxy for large/small investors.) The TAQ and ISSM
databases provide information at a tick-by-tick frequency, from which we aggregate into annual
variables. In particular, we look at the average trade size (in 1,000 shares) of a fund-year, and
the proportion of trades that are more than 2,000 and 5,000 shares. The trade size measure as a
proxy for account size remains valid even if big and small shareholders do not trade at
comparable frequency,35 as long as there is no systematic cross sectional difference in the
relative trading frequency of the big and the small.
Columns 2 and 3 of Table 5 show the effect of trading size on the occurrence of activist
arbitrage. In the post-1993 period, every 1,000 share increase in the average trading size (the
mean and standard deviation are 1.26 and 0.71 thousand shares) is associated with a 3.8
percentage point increase in the probability of attempted open-ending. Using the proportion of
trades above 2,000 (5,000, not tabulated) shares yields similar results: the marginal probability
effects are 0.49 (0.85) percentage points. To appreciate the magnitude, the mean (standard
deviation) values of the two variables are 11.46% and 3.31% (6.49% and 2.89%). All the
coefficients described above are different from zero at less than the 5% significance level.
Interestingly, none of these variables shows up any significance in the earlier period.
35 For example, Barber, Lee, Liu, and Odean (2005) show that individual investors trade about 50% more frequently than institutions.

28
Finally, the share of institutional ownership in a fund is also used as a proxy for the ease
of shareholder communication. Using a dummy variable for institutional shares being greater
than 15%,36 the probability effect is 5.7 percentage points, significant at the 2.5% level. Using
the level of institutional ownership (not tabulated), a one percentage point increase in the
institutional ownership is associated with a 0.20 percentage point increase in the probability of
an open-ending attack, significant at the 2.5% level. All these evidences point to the same
message: investor communication is an important factor for activist arbitrageurs to launch their
attacks.
5. Conclusion
We document strong and frequent pressure of activist arbitrageurs against closed-end
funds since 1992. We find that this activist arbitrage is targeted mainly towards deeply
discounted funds. Moreover, the funds’ discounts reflect the possibility of this arbitrage in a
forward-looking way. We show that shareholder communication is a major determinant for the
probability of activist arbitrage. Thus, costs of communication – imposed by law, ownership
structure, or trading environment of funds – are identified as a limit to arbitrage. We believe that
communication and coordination across shareholders are relevant not only for activist arbitrage,
but also for pure-trading arbitrage.
.
36 In an interview with the authors, Phil Goldstein indicated that he tended to target funds with 15% (or more) institutional ownership to avoid retail investor apathy.

29
Appendix:
Derivation of the FIML Likelihood Function (Equation (4))
The likelihood for an individual attack in our simultaneous equation model is (the i, t
subscripts are omitted without confusion):
( ) ( )11, 0,Attack AttackL g Attack Discount g Attack Discount −= = = . (5)
The joint density function is
( )1 2( 1, ) , ,Discount X
g Attack Discount f Discount X Z dβ γ
ε µ µ ε∞
− −
= = − −∫ (6)
and
( )1 2( 0, ) , ,Discount X
g Attack Discount f Discount X Z dβ γ
ε µ µ ε− −
−∞
= = − −∫ (7)
Where ( ),f ε ϖ is the bivariate normal density function, and can be expressed as the product of
a conditional distribution and a marginal distribution:
( ) ( ) ( ), |f f fε ϖ ε ϖ ϖ= . (8)
The conditional distribution ( )|f ε ϖ is normal with mean /ρϖ σ and variance 21 ρ− .
Therefore the joint density function of (6), assuming all variables are jointly normal, can be
rewritten as
( ) ( ) 1 21,Discout X Z
g Attack Discount uµ µφ
σ− −⎛ ⎞= = Φ ⎜ ⎟
⎝ ⎠, (9)
where
( )1 2
2
/
1
Discount X Discount X Zu
β γ ρ σ µ µ
ρ
+ + − −=
−, (10)
and φ , Φ are the density and cumulative probability functions of the standard normal
distribution. Equation (7) could be rewritten analogously.
Combining Equations (3) to (10) gets us the expression of (4).

30
REFERENCE
Abreu Dilip, and Markus Brunnermeier, “Bubbles and Crashes,” Econometrica, 71 (2003), 173-
204.
Barber, Brad, Yi-Tsung Lee, Yu-Jane Liu, and Terrance Odean, “Who Loses from Trade?
Evidence from Taiwan,” working paper, University of California at Davis, 2005.
Barberis , Nicholas, and Richard Thaler (2003), “ A Survey of Behavioral Finance, ” in
Handbook of the Economics of Finance. George M. Constantinides, Milton Harris, and Rene'
Stultz editors. Elsevier Science, North Holland, Amsterdam.
Barclay, Michael, Clifford Holderness, and Jeffrey Pontiff, “Private Benefits from Block
Ownership and Discounts on Closed-End Funds,” Journal of Financial Economics, 33 (1993),
263–291.
Bebchuk, Lucian, and Oliver Hart, “Takeover Bids vs. Proxy Fights in Contests for Corporate
Control ,” working paper, Harvard University, 2001.
Battalio, Robert, and Richard Mendenhall, “Earnings Expectations, Investor Trade Size, and
Anomalous Returns around Earnings Announcements,” Journal of Financial Economics, 77
(2005), 289-320.
Bekaert, Geert, Campbell Harvey, and Chris Lundblad, "Liquidity and Expected Returns:
Lessons from Emerging Markets," working paper, Duke University, 2005.
Berk, Jonathan, and Richard Stanton, “A Rational Model of the Close-End Fund Discount,”
working paper, University of California at Berkeley, 2004.
Bolton, Patrick, and Ernst-Lugwig von Thaden, “Blocks, Liquidity, and Corporate Control,”
Journal of Finance, 53 (1998), 1-25.

31
Brauer, Greggory, “Open-Ending Closed-End Funds,” Journal of Financial Economics 13
(1984), 491–507.
Brauer, Greggory, “Closed-End Fund Shares’ Abnormal Returns and the Information Content of
Discounts and Premiums, Journal of Finance 43 (1988), 113–127.
Brav, Alon, and J.B. Heaton, “Competing Theories of Financial Anomalies,” Review of
Financial Studies, 15 (2002), 575-606.
Brunnermeier , Markus, and Stefan Nagel, “Hedge Funds and the Technology Bubble,” Journal
of finance, 59 (2004), 2013-2040.
Campbell, John and Albert Kyle, "Smart Money, Noise Trading and Stock Price Behavior,"
Review of Economic Studies, 60 (1993), 1-34.
Carleton, Willard, James Nelson, and Michael Weisbach, “The Influence of Institutions in
Corporate Governance through Private Negotiations: Evidence from TIAA-CREF,” Journal of
finance, 53 (1998), 1335-1362.
Cherkes, Martin, Jacob Sagi, and Richard Stanton, “Liquidity and Close-End Funds,” working
paper, University of California at Berkeley, 2005.
Choi, Stephen, “Proxy Issue Proposals: Impact of the SEC 1992 Proxy Reform,” Journal of
Law, Economics, and Organization, 16 (2000), 233-268.
DeAngelo, Harry, and Linda DeAngelo, “Proxy Contests and the Governance of Publicly Held
Corporations,” Journal of Financial Economics, 23 (1989), 29-59
Del Guercio, Diane, Larry Dann, and M. Megan Partch, "Governance and Boards of Directors in
Closed-end Investment Companies," Journal of Financial Economics, 69 (2003), 111-152.
32
Del Guercio, Diane, and Jennifer Hawkins, "The Motivation and Impact of Pension Fund
Activism," Journal of Financial Economics, 52 (1999), 293-340.
DeLong, Bradford, Andrei Shleifer, Lawrence Summers, and Robert Waldmann, “Noise Trader
Risk in Financial Markets,” Journal of Political Economy 98 (1990), 703–738.
Dimson, Elroy, and Carolina Minio-Kozerski, “Close-End Funds: A Survey,” Financial
Markets, Institutions & Instruments, 9 (1999), 1-41.
Dodd, Peter, and Jerold Warner, “On Corporate Governance: A Study of Proxy Contests,”
Journal of Financial Economics, 11 (1983), 401-438.
Evans, William, Wallace Oates, and Robert Schwab, “Measuring Peer Group Effects: A Study
of Teenage Behavior,” Journal of Political Economy, 100 (1992), 966-991.
Fama, Eugene, “The Behavior of Stock-Market Prices,” Journal of Business 38 (1965), 34-105.
Friedman, Milton, The Case for Flexible Exchange Rates, in: Essays in Positive Economics, 1953, University of Chicago Press, Chicago. Geczy, Chris, David Musto, and Adam Reed, “Stocks Are Special Too: An Analysis of the
Equity Lending Market,” Journal of Financial Economics 66 (2002), 241-269.
Gemmill, Gorden, and Dylon Thomas, “Noise Trading, Costly Arbitrage, and Asset Prices:
Evidence from Close-End Funds,” Journal of Finance, 57 (2002), 2571-2494.
Gillan, Stuart, and Laura Starks, “Corporate Governance Proposals and Shareholder Activism:
The Role of Institutional Investors,” Journal of Financial Economics 57 (2000), 275-305.
Gompers, Paul, Joy Ishii, and Andrew Metrick, "Corporate Governance and Equity Prices," The
Quarterly Journal of Economics, 118 (2003), 107-155.

33
Gordon, Lilli, and John Pound, “Information, Ownership Structure, and Shareholder Voting:
Evidence from Shareholder-Sponsored Corporate Governance Proposals,” Journal of Finance,
48 (1993), 697-718.
Grossman, Sanford, and Oliver Hart, "Take-Over Bids, the Free Rider Problem and the Theory
of the Corporation," Bell Journal of Economics, 11 (1980), 42-69.
Heckman, James, “Dummy Endogenous Variables in a Simultaneous Equation System,”
Econometrica, 46 (1978), 931-959.
Ikenberry, David, and Josef Lakonishok, “Corporate Governance through the Proxy Contest:
Evidence and Implications,” The Journal of Business, 66 (1993), 405-435.
Kahn, Charles, and Andrew Winton, “Ownership Structure, Speculation, and Shareholder
Intervention,” Journal of Finance, 53 (1998), 99-129.
Lamont, Owen, and Richard Thaler, "Can the Market Add and Subtract?: Mispricing in Tech-
Stock Carve-Outs" Journal of Political Economy, 111 (2003), 227-268.
Lee, Charles, Andrei Shleifer, and Richard Thaler, “Investor Sentiment and the Closed-End Fund
Puzzle,” Journal of Finance 46 (1991), 75–109.
Malkiel, Burton, “The Valuation of Closed-End Investment Company Shares,” Journal of
Finance 32 (1977), 847–859.
Maug, Ernst, “Large Shareholders as Monitors: Is There a Trade-Off between Liquidity and
Control?” Journal of Finance, 53 (1998), 65-98.
Mitchell, Mark, and Todd Pulvino, “Characteristics of Risk and Return in Risk Arbitrage,”
Journal of Finance, 56 (2001), 2135-2176.

34
Mitchell, Mark, Todd Pulvino, and Erik Stafford, “Limited Arbitrage in Equity Markets,”
Journal of Finance 57 (2002), 551-584.
Pastor, Lubos and Robert Stambaugh, "Liquidity Risk and Expected Stock Returns." Journal of
Political Economy, 111 (2003), 642-85.
Pontiff, Jeffrey, "Closed-End Fund Premia and Returns Implications for Financial Market
Equilibrium," Journal of Financial Economics, 37 (1995), 341-370.
Pontiff, Jeffrey, “Costly Arbitrage: Evidence from Close-End Funds,” Quarterly Journal of
Economics, 111(1996), 1135-1151.
Pound, John, “Proxy Contests and the Efficiency of Shareholder Oversight,” Journal of
Financial Economics, 20 (1988), 237-265.
Pound, John, “Proxy Voting and the SEC: Investor Protection versus Market Efficiency,”
Journal of Financial Economics, 29 (1991), 241-285.
Rivers, Douglas, and Quang Vuong, “Limited Information Estimators and Exogeneity Tests for
Simultaneous Probit Models,” Journal of Econometrics, 39 (1988), 347-366.
Shleifer, Andrei, and Robert Vishny, "The Limits of Arbitrage." Journal of Finance, 52 (1997),
35-55.
SEC (U.S. Securities and Exchange Commission), Securities exchange act of 1934, Release 378,
(1935).
SEC (U.S. Securities and Exchange Commission), Securities exchange act of 1934, Release
5276, (1956).
35
SEC (U.S. Securities and Exchange Commission), Securities exchange act of 1934, Release
31,326, (1992).
Stein, Jeremy, “Why Are Most Funds Open-End? Competition and the Limits of Arbitrage,”
Quarterly Journal of Economics, 120 (2005), 247-272.
Thompson, Rex, “The Information Content of Discounts and Premiums of Close-End Fund
Shares,” Journal of Financial Economics, 6 (1978), 151-186.

Panel A: Fund Characteristics
1988 1989 1990 1991 1992 1993 1994 1995 1996 1997 1998 1999 2000 2001 2002
Number of Funds 53 62 82 84 92 99 123 122 123 121 113 111 102 95 89% trading at a discount 81% 79% 83% 79% 68% 55% 71% 78% 86% 83% 82% 89% 92% 86% 88%
14.0 9.7 10.2 8.0 5.6 1.8 6.0 11.2 13.0 13.5 13.6 16.3 23.0 15.4 13.320.2 12.5 11.5 8.8 5.8 1.8 6.3 12.8 15.2 15.9 18.1 19.1 23.6 17.4 14.217.7 17.7 11.6 12.3 10.4 11.7 11.0 12.2 11.3 12.2 16.1 15.9 16.1 14.4 15.4
159 177 155 170 177 194 220 212 229 255 239 248 267 247 22269 88 85 93 98 111 133 121 125 136 105 101 123 101 102
228 234 210 245 270 276 271 277 303 349 401 448 453 435 376
60 116 95 76 80 110 102 87 87 102 96 84 78 54 5049 57 67 59 64 92 86 79 85 96 92 80 69 48 4450 171 73 77 57 108 65 47 38 56 49 45 44 28 31
3.1 4.0 3.5 4.0 3.1 2.1 2.0 1.8 2.3 2.4 3.4 2.9 3.4 3.4 2.92.6 3.3 2.4 2.7 1.8 0.8 0.9 0.6 1.2 0.9 1.0 0.9 1.1 1.3 1.33.3 3.6 3.7 3.8 3.5 3.0 2.8 2.9 3.0 3.8 5.3 4.1 5.1 4.8 4.5
1.0 1.7 1.7 4.5 2.3 2.6 1.6 3.9 2.5 2.9 1.6 6.8 4.3 7.6 7.60.1 0.2 0.1 0.1 0.1 0.1 0.1 0.1 0.1 0.1 0.1 0.3 0.0 0.7 0.41.8 3.2 4.8 12.5 6.5 9.2 7.7 15.4 9.5 10.5 4.0 11.9 9.5 12.5 14.7
12.1 13.5 11.0 13.4 12.8 12.9 11.1 13.5 15.8 20.1 19.4 19.4 20.3 22.1 22.36.6 8.0 6.7 8.6 9.1 9.9 8.7 11.9 15.7 18.4 18.5 18.0 16.9 19.5 19.5
12.3 13.2 11.3 14.8 12.6 10.8 9.7 9.0 9.8 13.6 14.0 15.3 16.4 17.5 17.7
7 7 6 6 6 7 6 7 8 9 10 11 12 14 152 2 3 3 3 4 4 5 6 7 8 9 10 11 12
13 12 11 11 11 10 10 10 10 10 10 10 11 11 11
Avg trade size (1,000 shares) 1.4 1.6 1.8 1.3 1.0 1.1 1.2 1.1 1.3 1.3 1.3 1.4 1.4 1.4 1.11.1 1.4 1.3 1.1 0.9 1.0 0.9 1.0 1.2 1.2 1.2 1.3 1.3 1.2 1.01.0 0.9 1.7 0.8 0.5 0.8 0.8 0.5 0.6 0.6 0.7 0.8 0.7 0.8 0.7
4.3 3.3 3.2 3.3 3.7 3.8 4.0 4.2 4.3 4.4 5.0 5.8 6.2 5.7 4.83.1 2.4 2.4 2.6 2.8 3.1 3.1 3.2 3.8 3.6 4.4 5.2 5.7 5.3 4.32.6 2.3 2.6 2.6 2.6 2.5 2.7 2.9 2.7 2.4 2.7 3.1 3.4 3.1 2.6
4.9 5.4 6.4 6.2 6.2 5.9 6.5 5.9 5.8 5.8 6.2 6.2 6.7 6.6 6.44.2 4.5 4.7 4.8 5.0 5.4 5.9 5.2 5.4 5.3 5.9 6.0 6.3 6.1 6.02.7 2.8 3.7 3.4 3.1 3.0 3.1 2.7 2.5 2.5 2.6 2.7 3.0 3.1 2.9
Standard deviation of fund return (in %)
Insider ownership (%)
Dividend yield (in %)
Institution ownership (%)
Fund age
Standard deviation of fund NAV (in %)
Discount
Table 1. Summary Statistics
Annual turnover (in %)
This table reports the summary statistics of the main variables. Panel A shows the mean, median, and standard deviation of each variable calculated over each year. Panel B reports the mean values of the governance variables (mostly dummy variables) over different sub-periods and separately for old and new funds. Old (new) funds are defined as funds that have existed in our sample for more than (less than or equal to) three years in our sample. Standard deviation for non-dummy variables is reported in the parentheses.
Market cap (in $Mill')
A1

Panel B: Fund Governance1988-2002All Funds Old Funds New Funds Old Funds New Funds Old Funds New Funds
Staggered board 0.38 0.09 0.03 0.42 0.30 0.67 0.47Supermajority 0.11 0.07 0.16 0.13 0.06 0.10 0.00Special meeting 0.60 0.70 0.56 0.63 0.52 0.58 0.67Lifeboat 0.53 0.44 0.57 0.54 0.54 0.52 0.60Management fees 1.79 1.45 2.01 1.62 2.03 1.90 2.22
(0.90) (0.58) (0.61) (0.86) (0.71) (1.06) (0.49)
1988-1992 1993-1998 1999-2002
A2
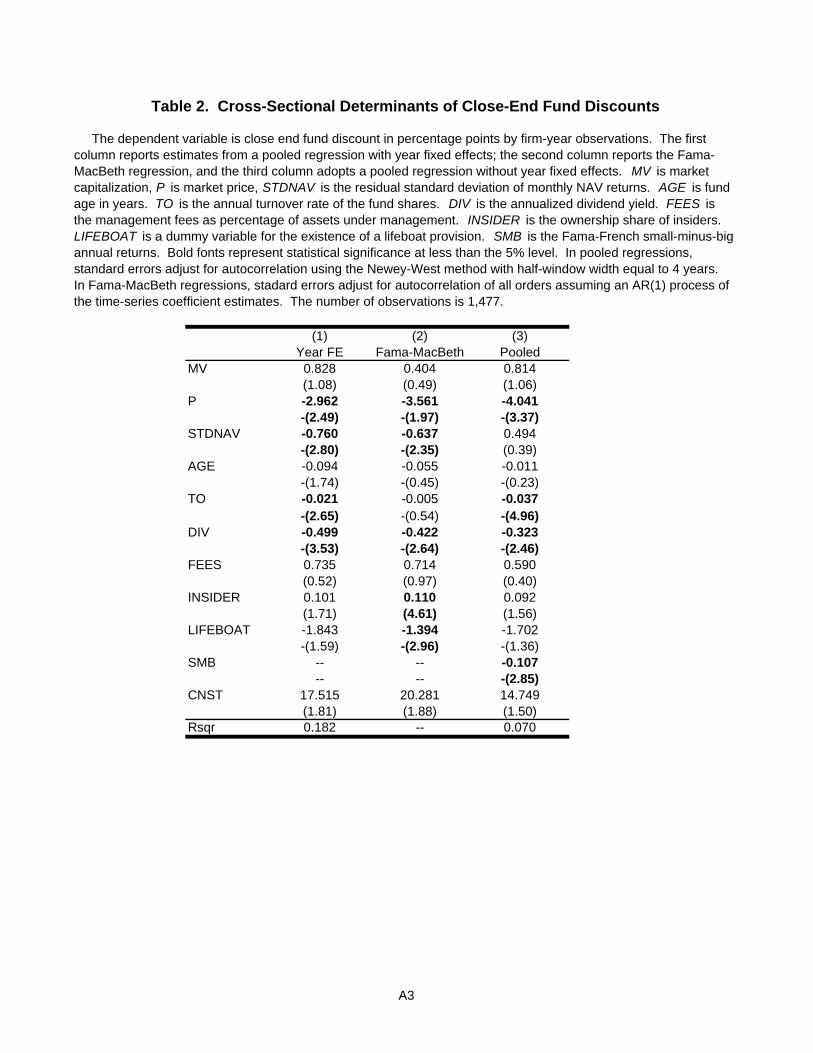
(1) (2) (3)Year FE Fama-MacBeth Pooled
MV 0.828 0.404 0.814(1.08) (0.49) (1.06)
P -2.962 -3.561 -4.041-(2.49) -(1.97) -(3.37)
STDNAV -0.760 -0.637 0.494-(2.80) -(2.35) (0.39)
AGE -0.094 -0.055 -0.011-(1.74) -(0.45) -(0.23)
TO -0.021 -0.005 -0.037-(2.65) -(0.54) -(4.96)
DIV -0.499 -0.422 -0.323-(3.53) -(2.64) -(2.46)
FEES 0.735 0.714 0.590(0.52) (0.97) (0.40)
INSIDER 0.101 0.110 0.092(1.71) (4.61) (1.56)
LIFEBOAT -1.843 -1.394 -1.702-(1.59) -(2.96) -(1.36)
SMB -- -- -0.107-- -- -(2.85)
CNST 17.515 20.281 14.749(1.81) (1.88) (1.50)
Rsqr 0.182 -- 0.070
The dependent variable is close end fund discount in percentage points by firm-year observations. The first column reports estimates from a pooled regression with year fixed effects; the second column reports the Fama-MacBeth regression, and the third column adopts a pooled regression without year fixed effects. MV is market capitalization, P is market price, STDNAV is the residual standard deviation of monthly NAV returns. AGE is fund age in years. TO is the annual turnover rate of the fund shares. DIV is the annualized dividend yield. FEES is the management fees as percentage of assets under management. INSIDER is the ownership share of insiders. LIFEBOAT is a dummy variable for the existence of a lifeboat provision. SMB is the Fama-French small-minus-big annual returns. Bold fonts represent statistical significance at less than the 5% level. In pooled regressions, standard errors adjust for autocorrelation using the Newey-West method with half-window width equal to 4 years. In Fama-MacBeth regressions, stadard errors adjust for autocorrelation of all orders assuming an AR(1) process of the time-series coefficient estimates. The number of observations is 1,477.
Table 2. Cross-Sectional Determinants of Close-End Fund Discounts
A3
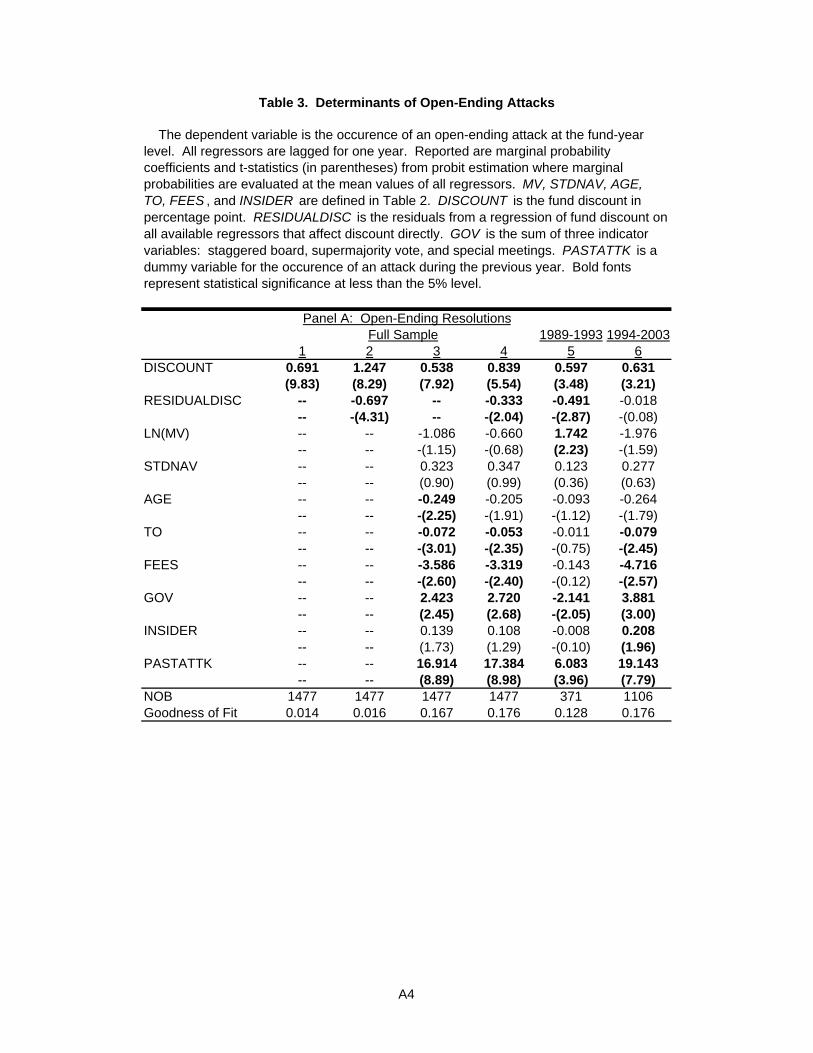
1989-1993 1994-20031 2 3 4 5 6
DISCOUNT 0.691 1.247 0.538 0.839 0.597 0.631(9.83) (8.29) (7.92) (5.54) (3.48) (3.21)
RESIDUALDISC -- -0.697 -- -0.333 -0.491 -0.018-- -(4.31) -- -(2.04) -(2.87) -(0.08)
LN(MV) -- -- -1.086 -0.660 1.742 -1.976-- -- -(1.15) -(0.68) (2.23) -(1.59)
STDNAV -- -- 0.323 0.347 0.123 0.277-- -- (0.90) (0.99) (0.36) (0.63)
AGE -- -- -0.249 -0.205 -0.093 -0.264-- -- -(2.25) -(1.91) -(1.12) -(1.79)
TO -- -- -0.072 -0.053 -0.011 -0.079-- -- -(3.01) -(2.35) -(0.75) -(2.45)
FEES -- -- -3.586 -3.319 -0.143 -4.716-- -- -(2.60) -(2.40) -(0.12) -(2.57)
GOV -- -- 2.423 2.720 -2.141 3.881-- -- (2.45) (2.68) -(2.05) (3.00)
INSIDER -- -- 0.139 0.108 -0.008 0.208-- -- (1.73) (1.29) -(0.10) (1.96)
PASTATTK -- -- 16.914 17.384 6.083 19.143-- -- (8.89) (8.98) (3.96) (7.79)
NOB 1477 1477 1477 1477 371 1106Goodness of Fit 0.014 0.016 0.167 0.176 0.128 0.176
Panel A: Open-Ending Resolutions
Table 3. Determinants of Open-Ending Attacks
Full Sample
The dependent variable is the occurence of an open-ending attack at the fund-year level. All regressors are lagged for one year. Reported are marginal probability coefficients and t-statistics (in parentheses) from probit estimation where marginal probabilities are evaluated at the mean values of all regressors. MV, STDNAV, AGE, TO, FEES , and INSIDER are defined in Table 2. DISCOUNT is the fund discount in percentage point. RESIDUALDISC is the residuals from a regression of fund discount on all available regressors that affect discount directly. GOV is the sum of three indicator variables: staggered board, supermajority vote, and special meetings. PASTATTK is a dummy variable for the occurence of an attack during the previous year. Bold fonts represent statistical significance at less than the 5% level.
A4

1989-1993 1994-20031 2 3 4 5 6
DISCOUNT 0.098 0.314 0.084 0.302 0.128 0.242(2.88) (4.08) (2.61) (4.08) (3.05) (2.84)
RESIDUALDISC -- -0.268 -- -0.264 -0.134 -0.190-- -(3.19) -- -(3.30) -(3.02) -(2.03)
LN(MV) -- -- -0.681 -0.490 0.040 -0.708-- -- -(1.34) -(1.10) (0.24) -(1.34)
STDNAV -- -- -0.166 -0.123 -0.345 -0.010-- -- -(0.82) -(0.64) -(1.99) -(0.05)
AGE -- -- -0.123 -0.153 0.011 -0.247-- -- -(1.63) -(1.99) (0.75) -(2.12)
TO -- -- -0.022 -0.022 -0.003 -0.025-- -- -(1.83) -(1.93) -(0.67) -(1.71)
FEES -- -- -0.083 -0.401 0.411 -0.804-- -- -(0.14) -(0.68) (1.31) -(1.06)
GOV -- -- 0.082 -0.172 -0.197 0.146-- -- (0.14) -(0.34) -(0.74) (0.25)
INSIDER -- -- -0.022 -0.035 -0.019 -0.005-- -- -(0.41) -(0.73) -(0.82) -(0.10)
PASTATTK -- -- 0.256 -0.376 0.181 -1.575-- -- (0.11) -(0.18) (0.33) -(0.53)
NOB 1477 1477 1478 1477 371 1106Goodness of Fit 0.002 0.007 0.008 0.016 0.114 0.015
Panel B: Open-EndingFull Sample
A4

COEF*100 t-stat Marg. Pr. COEF*100 t-stat Marg. Pr.CNST -92.91 -1.41 -- -93.64 -1.34 --LN(MV) -3.72 -0.70 -0.69 -4.50 -0.82 -0.85STDNAV 1.64 0.87 0.30 1.50 0.73 0.28AGE -1.07 -1.88 -0.20 -1.00 -1.74 -0.19TO -0.30 -2.36 -0.06 -0.24 -1.48 -0.04FEES -16.68 -2.22 -3.10 -18.16 -2.03 -3.43GOV 16.60 3.07 3.08 14.55 2.58 2.75INSIDER 0.73 1.63 0.14 0.61 1.29 0.12PASTATTK 97.76 9.39 18.14 89.78 7.16 16.94DISCOUNT 3.04 8.40 0.56 4.26 4.30 0.80Rho -- -- -- -0.24 -1.78Sigma(e2) -- -- -- 13.08 68.72LL Statistic: 13.05 P-val: 0.000
COEF*100 t-stat Marg. Pr. COEF*100 t-stat Marg. Pr.CNST -20.04 -0.23 -- -21.25 -0.26LN(MV) -11.33 -1.57 -0.74 -12.09 -1.67 -0.82STDNAV -1.79 -0.63 -0.12 -1.71 -0.66 -0.12AGE -1.84 -1.68 -0.12 -1.88 -1.57 -0.13TO -0.43 -2.20 -0.03 -0.28 -1.01 -0.02FEES -4.09 -0.42 -0.27 -8.73 -0.69 -0.60GOV 2.93 0.37 0.19 -1.69 -0.27 -0.13INSIDER -0.21 -0.29 -0.01 -0.46 -0.60 -0.03PASTATTK 5.56 0.16 0.36 16.43 0.47 1.26DISCOUNT 1.28 2.66 0.08 4.07 3.24 0.29Rho -- -- -- -0.45 -2.56Sigma(e2) -- -- -- 13.06 75.76LL Statistic: 2.54 P-val: 0.111
Table 4. FIML Estimation of Attack-Discount Simultaneous System
This table reports the estimates from the full-information maximum likelihood (FIML) system (equation (4)), where the sensitivity of open-ending attacks on fund discount takes into account the feedback effect from the possible attacks to the discounts. As a comparison, single equation probit estimation (ignoring the feedback effect) is reported side-by-side. Reported are coefficients (scaled by 100), t-statistics, and marginal probabilities (evaluated at the mean values of all covariates). Also reported are likelihood ratio statistics comparing the two sets of estimation and the corresponding p-values. Bold fonts represent statistical significance at less than the 5% level. The ATTACK variable in Panel A (Panel B) is an indicator variable for the occurence of all open-ending attacks (successful open-endings). There are 1,477 fund-year observations.
Single Equation Probit FIML Estimate
Open-Ending Attacks
Successful Open-Ending
Single Equation Probit FIML Estimate
A5

1989-1993 1994-2003 1989-1993 1994-2003 1989-1993 1994-2003 1989-1993 1994-2003
DISCOUNT 0.597 0.631 0.854 0.679 0.863 0.634 0.721 0.624(3.48) (3.21) (4.05) (3.47) (4.14) (3.20) (4.04) (3.21)
RESIDUALDISC -0.491 -0.018 -0.702 0.005 -0.713 0.046 -0.566 0.001-(2.87) -(0.08) -(3.38) (0.02) -(3.45) (0.21) -(3.23) (0.00)
COMMUNICATION -0.011 -0.079 -0.509 3.778 -0.129 0.490 -2.204 5.732-(0.75) -(2.45) -(0.58) (2.36) -(0.94) (2.63) -(1.38) (2.40)
NOB 371 1106 366 1091 366 1091 371 1106Goodness of Fit 0.128 0.176 0.241 0.183 0.244 0.185 0.241 0.186
4
Turnover
1 2 3
Table 5: Effects of Shareholder Communication
(%Institution>15%)Avg Trade Size (1,000) %(Trade > 2,000)
The dependent variable is the occurence of an open-ending attempt at the fund-year level. All regressors are the same as in Table 3 except that each column uses a different proxy for shareholder communication (COMMUNICATION ). The default measure is turnover in Column 1 (repeated from Columns 5 and 6 in Table 3 Panel A). Columns 2 and 3 use the averate trade size (in 1,000 shares) and the proportion of trades that are more than 2,000 shares (in percentage points). Column 4 uses the dummy variable equal to one if the institutional ownership exceeds 15% for the fund-year. All regressors in Table 3 enter as control but only coefficients on DISCOUNT , RESIDUALDISC , and COMMUNICATION are reported (other coefficients are repetitively similar from those in Table 3 and are thus omitted). Reported are marginal probability coefficients and t-statistics (in parentheses) from probit estimation where marginal probabilities are evaluated at the mean values of all regressors. Bold fonts represent statistical significance at less than the 5% level.
A6

A7
0%
5%
10%
15%
20%
25%
19960
1199
603
19960
5199
607
19960
9199
611
19970
1199
703
19970
5199
707
19970
9199
711
19980
1199
803
19980
5199
807
19980
9199
811
19990
1
Fund
Dis
coun
t
Shareholder open-ending proposal failed
Cargill proposed open-ending
Bankgesellschaftincreased holding and started proxy contest
Bank won contest
New board filed open-ending proposal
Fund open-ended
Figure 1: Activist Example: The Growth Fund of Spain (1996-1999)

Figure 2. Open-Ending Attacks and Successful Open-Endings 1988-2003
0
5
10
15
20
25
30
35
1988 1989 1990 1991 1992 1993 1994 1995 1996 1997 1998 1999 2000 2001 2002 2003
Freq
uenc
y in
Num
bers
and
% o
f All
Fund
s
# Success # Success/# Funds # Attemps # Attemps/# Funds
A8
Related Documents