Adequacy of Hemodialysis Data from HENNET. นน.นนนนน นนนนนนน นนนนนนนนนนนนนนน นนน.นนนนนนน 5 นน. 2556

Welcome message from author
This document is posted to help you gain knowledge. Please leave a comment to let me know what you think about it! Share it to your friends and learn new things together.
Transcript
Adequacy of Hemodialysis
Data from HENNET.
นพ.ธนชั�ย พนาพฒิ�อายรแพทย�โรคไต รพศ.ขอนแก่�น
5 ก่ค. 2556

HENNET projectHEmodialysis Network of the North-East of Thailand
นพ.ธนชั�ย พนาพฒิ� นพ.จิ�รศ�ก่ดิ์�� อนก่ลก่น�นต�ชั�ย รพ.ขอนแก่�นรศ.นพ.ทวี� ศ�ร�วีงศ� รศ.นพ.ชัลธ�ป พงศ�สก่ล รศ.พญ.ศ�ร�ร�ตน� เร$องจิ %ย รพ.ศร�นคร�นทร�นพ. พ�ส�ฐ อ�นทรวีงษ์�โชัต�รพ.หนองคายนพ. สรพงษ์� นเรนทร�พ�ท�ก่ษ์�รพ.อดิ์รธาน�นพ. ส�จิจิะ ตต�ยานพ�นธ�วีงศ� รพ.ชั�ยภู+มิ�พญ. ล�ก่ษ์มิณ ประเดิ์�มิรพ.ร%อยเอ.ดิ์นพ. ชัวีศ�ก่ดิ์�� ก่นก่ก่�ณฑ์�พงษ์� รพ.มิหาราชันครราชัส�มิาพญ. ก่รรณ�ก่าร� น�วี�ตยก่ลรพ.เลย นพ. ปก่รณ� ตงคะเสร�ร�ก่ษ์�
รพ.สร�นทร�นพ. อมิฤต สวี�ฒินศ�ลป1 รพ.มิหาสารคามิพญ . ท�ดิ์สะร�ง แก่%วีบุนมิารพ.ท�าบุ�อ

Agenda
• What is Adequacy of HD• Data from HENNET Project• Kt/V: Do we really need it ?
Dr. John T. Daugirdas
Dr. Daugirdas is Professor of Medicine at theUniversity of Illinois at Chicago.

What is Adequacy of Hemodialysis ?
Adequacy of dialysis refers to how well we remove toxins and waste products from the patient’s blood, and has a major impact on their well-being.

How do we know if a Patient is Adequately Dialyzed ?
Urea Kinetic ModelingWhy can’t I understand it ?
It can’t be that difficult !

MW 60, only slightly toxic per sea MARKER for small MW uremic toxinsUrea removal < ---> other small toxin
removal
WHY UREA ?

MW 60, only slightly toxic per sea MARKER for small MW uremic toxinsUrea removal < ---> other small toxin
removalg = rate of UREA generation
g < ---> protein catabolic rate (PCR)PCR < ---> dietary protein intake ?g can be derived from pre and post BUN
WHY UREA ?

Monitoring the patient’s ureaPredialysis BUN or Time-averaged BUN
BAD if HIGH, also BAD if too LOW!Reflect balance of urea removal vs.production
BUNpre
BUNpost
BUN(mg/dl)
Time (hour)

Monitoring the patient’s ureaPredialysis BUN or Time-averaged BUN
BAD if HIGH, also BAD if too LOW!Reflect balance of urea removal vs.production
BUNpre
BUNpost
BUN(mg/dl)
Time (hour)

TAC BUN
Monitoring the patient’s ureaPredialysis BUN or Time-averaged BUN
BAD if HIGH, also BAD if too LOW!Reflect balance of urea removal vs.production
BUNpre
BUNpost
BUN(mg/dl)
Time (hour)
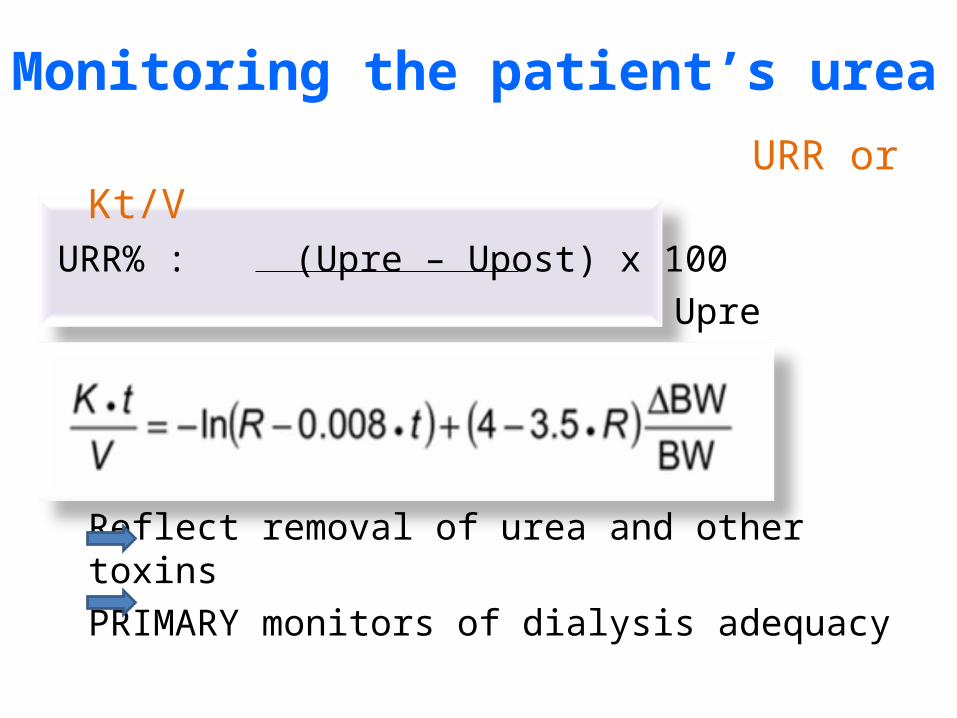
URR or Kt/VURR% : (Upre – Upost) x 100
Upre
Reflect removal of urea and other toxinsPRIMARY monitors of dialysis adequacy
Monitoring the patient’s urea

Kt/V = fractional urea clearance
K = dialyzer clearance (ml/min or L/hr)t = time (min or hr)V = distribution volume of urea (ml or L)
K x t = L/hr x hr = LITERSV = LITERSKt/V = LITERS/LITERS = ratio
What is Kt/V ?

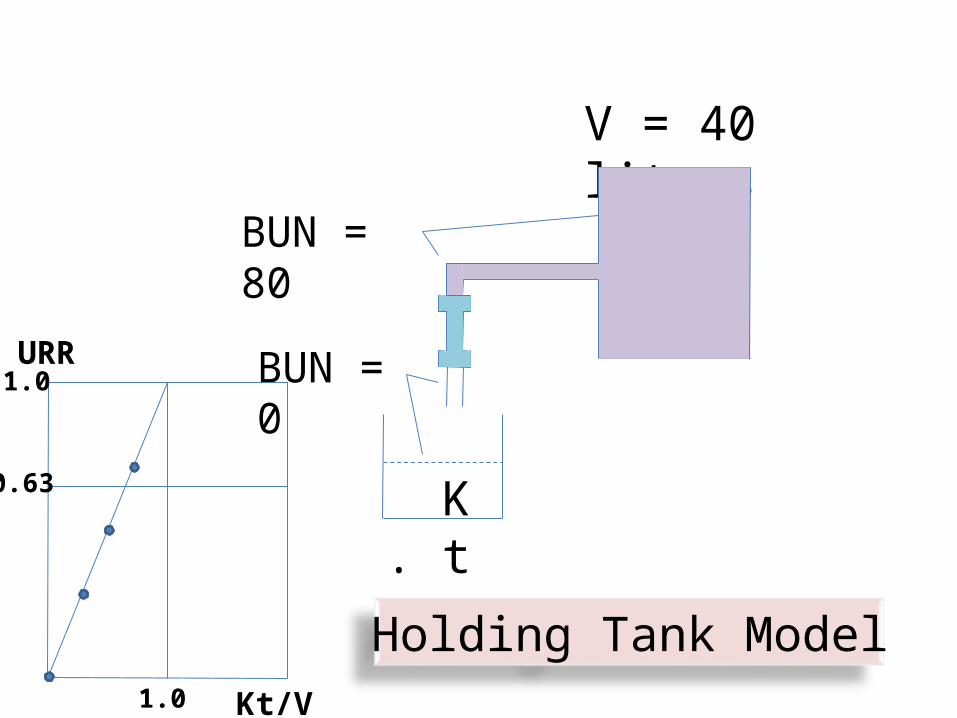
K . t
V = 40 liters
BUN = 0
BUN = 80
Holding Tank Model
K = 10 L/Hr
K . t
V = 40 liters
BUN = 0
BUN = 80
Holding Tank ModelKt/V1.0
1.0
0.63
URR

V = 40 liters
K t =
BUN = 0
BUN = 80
20 L

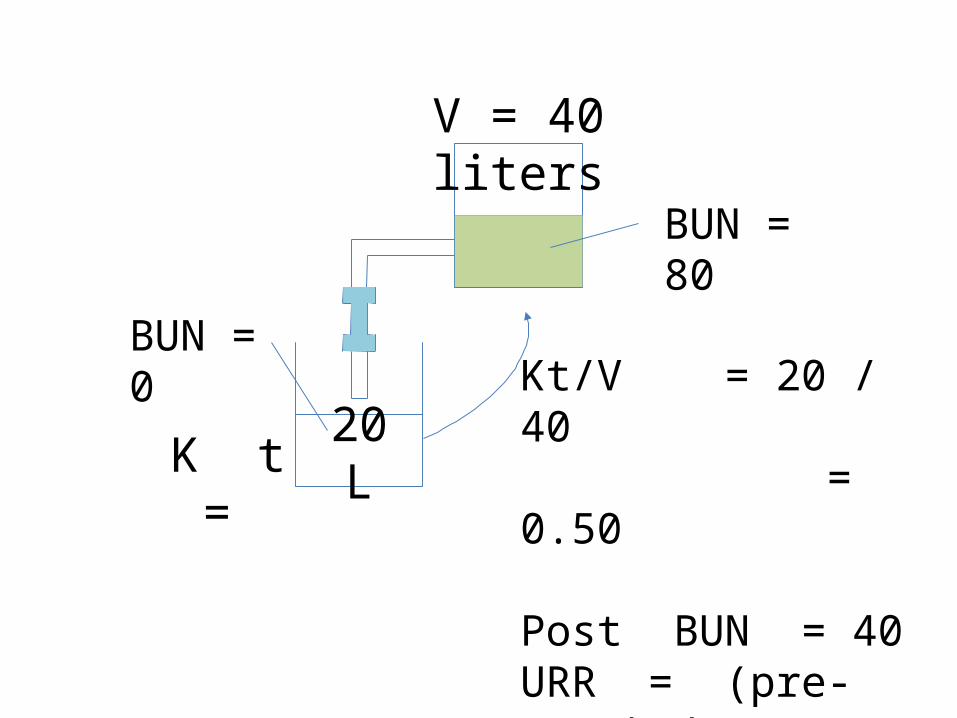
V = 40 liters
K t =
BUN = 0
BUN = 80
Kt/V = 20 / 40 = 0.50
20 L
V = 40 liters
K t =
BUN = 0
BUN = 80
Kt/V = 20 / 40 = 0.50
Post BUN = 40URR = (pre-post) / pre = (80-40) / 80 = 0.50
20 L

V = 40 liters
BUN = 0
BUN = 80, 70, 60
Dialyzer outlet fluid returned continually during dialysis
K . t

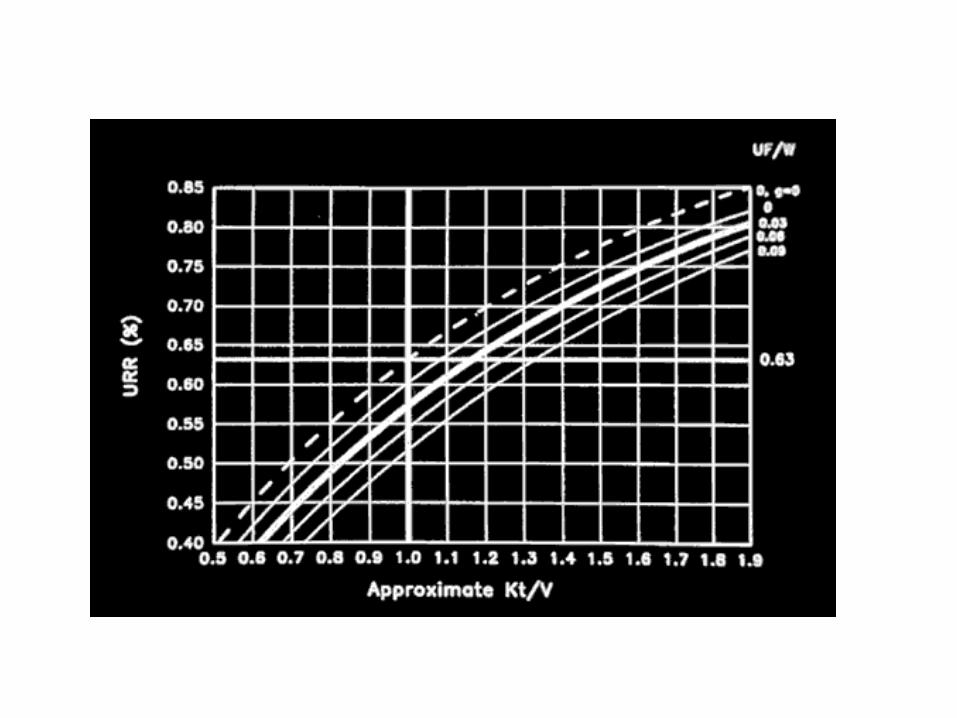
Relationship between Kt/V and URR

spKt/V = single pool
eqKt/V = equilibrated (Double pool)
Std Kt/V = weekly standard
Kt/V
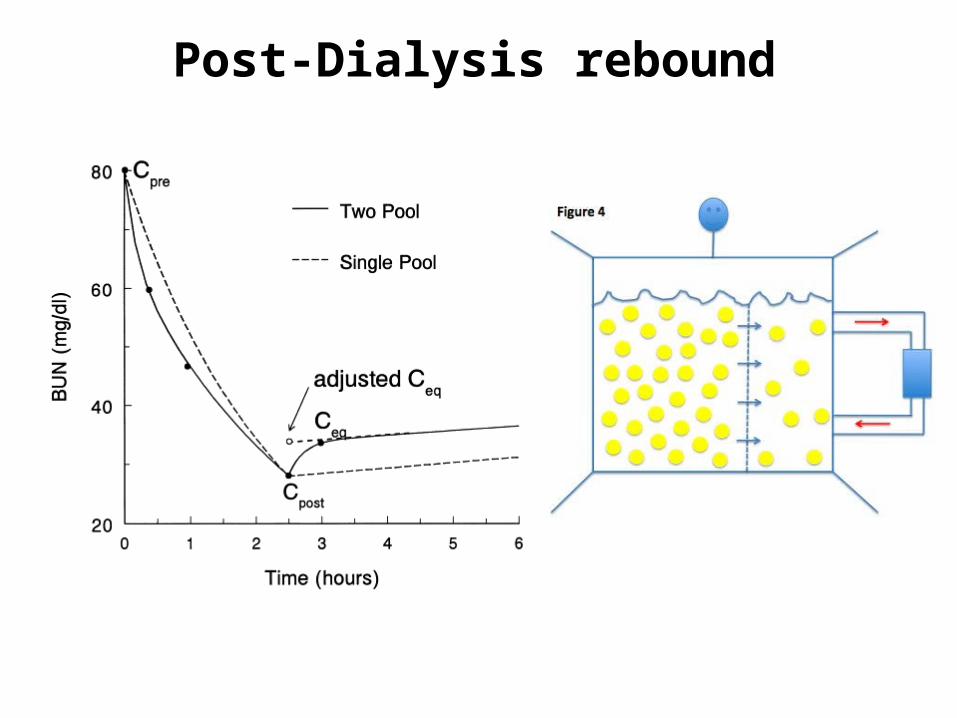
Post-Dialysis rebound

Post-Dialysis rebound
Equilibrated Kt/V
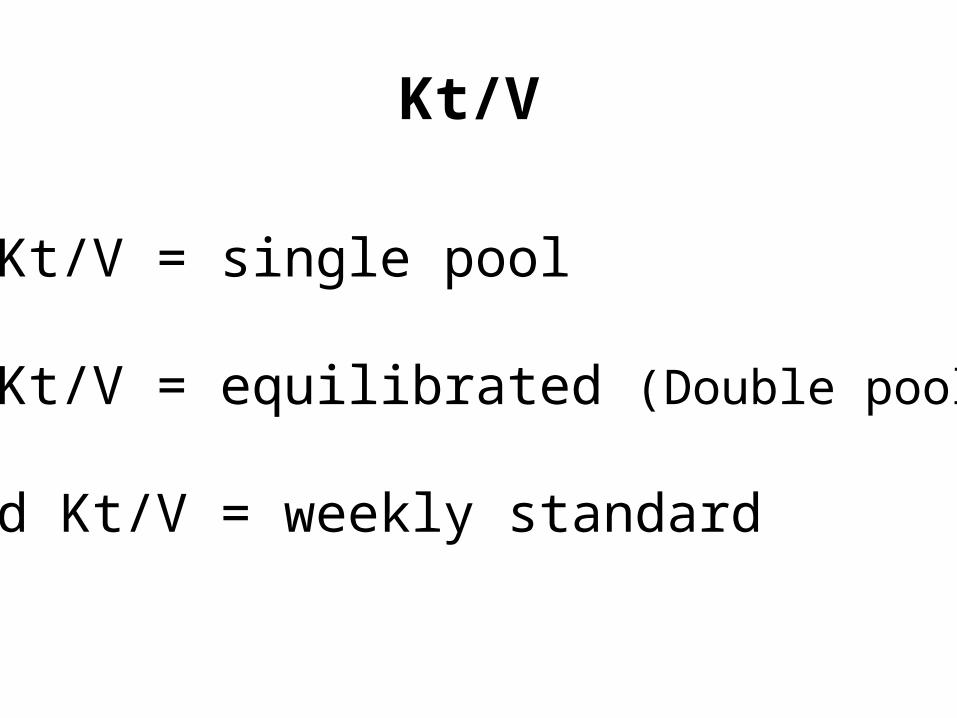
spKt/V = single pool
eqKt/V = equilibrated (Double pool)
Std Kt/V = weekly standard
Kt/V

What is the target spKt/V in 2 times/week HD patients ?

K/DOQI 2006: Minimum spKt/V
Schedule Kr<2 ml/min/1.73m2
Kr>2 ml/min/1.73m2
2x/wk Not recommended
2.0*
3x/wk 1.2 0.9
4x/wk 0.8 0.6
6x/wk 0.5 0.4
Dialyzer clearance only*not recommended unless Kr > 3
K/DOQI CPG for Hemodialysis Adequacy: update 2006. Am J Kidney Dis 2007; 37: S7-S64.
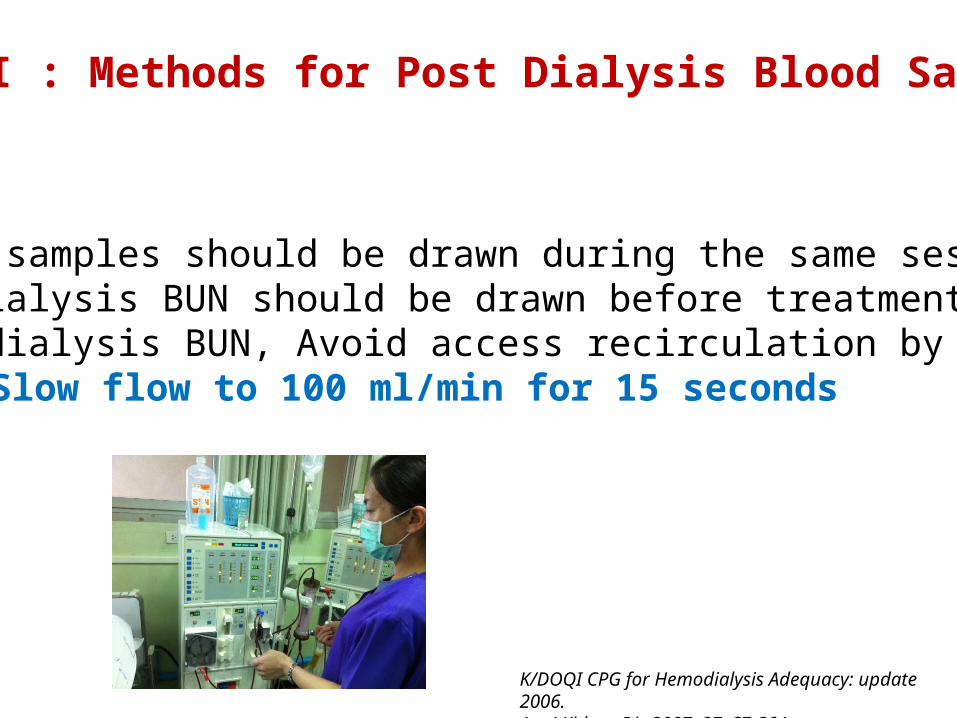
K/DOQI : Methods for Post Dialysis Blood Sampling
1. Both samples should be drawn during the same session.2. Predialysis BUN should be drawn before treatment began. 3. Postdialysis BUN, Avoid access recirculation by
Slow flow to 100 ml/min for 15 seconds
K/DOQI CPG for Hemodialysis Adequacy: update 2006. Am J Kidney Dis 2007; 37: S7-S64.
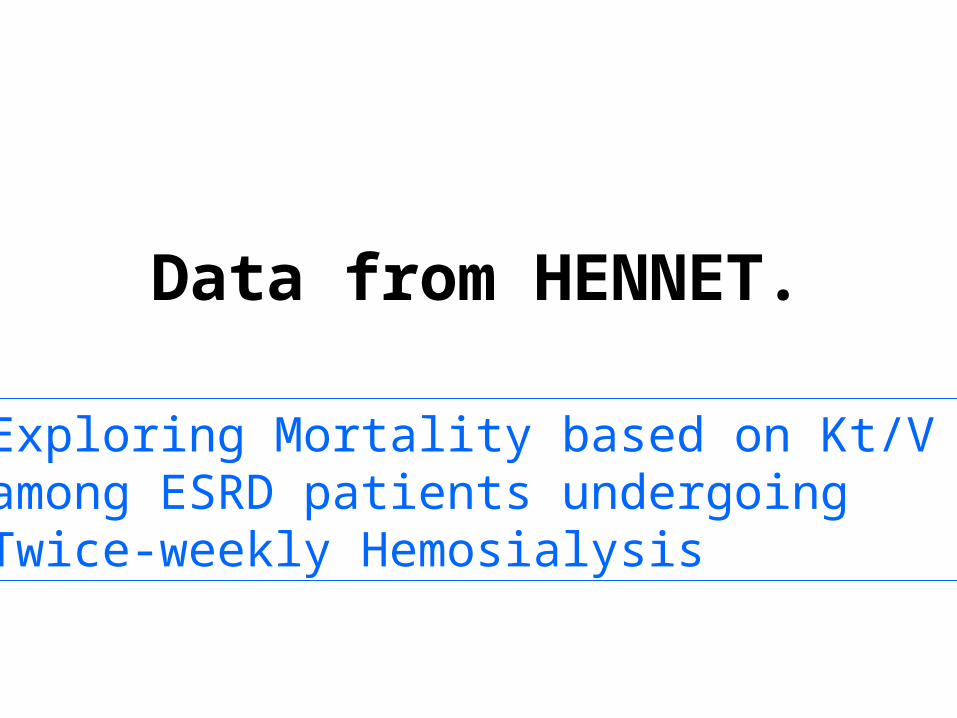
Data from HENNET.
Exploring Mortality based on Kt/V among ESRD patients undergoing Twice-weekly Hemosialysis

Setting
• 11 hemodialysis centers
• Accrual period 3 months from Feb. 2011
• Follow up period 1 years
HENNET
**
**
*
***
*
**Multi-center cohort study
Part1 BaselinePart2 Follow up Part3 Hospitalization notePart4 Discharge summary
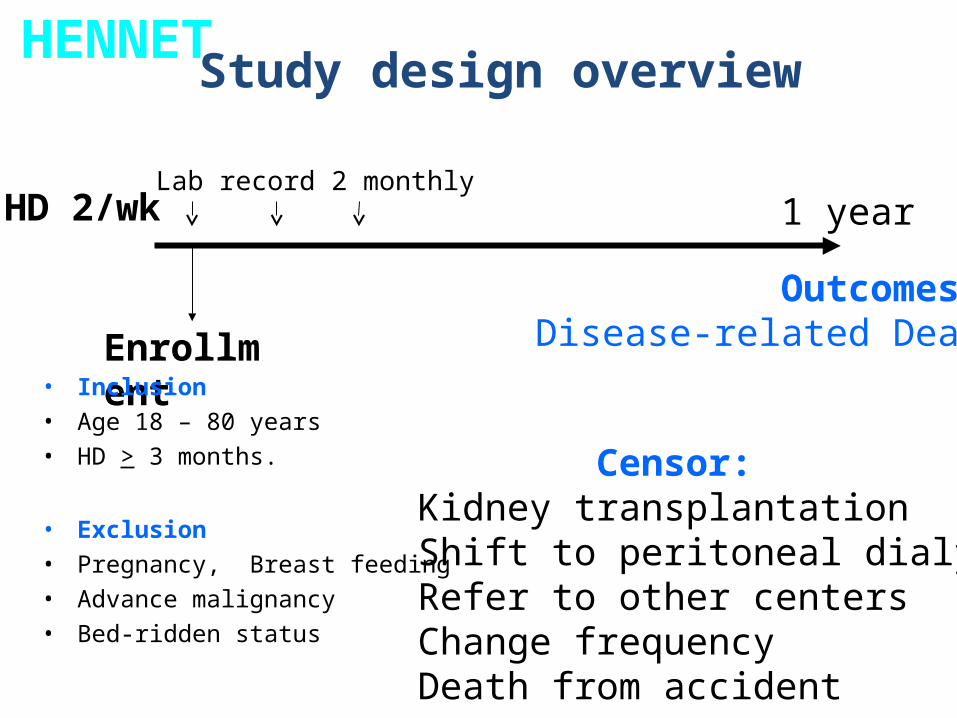
Enrollment
HD 2/wkLab record 2 monthly
Outcomes:Disease-related Death
Study design overview
• Inclusion• Age 18 – 80 years• HD > 3 months.
• Exclusion• Pregnancy, Breast feeding • Advance malignancy• Bed-ridden status
1 year
HENNET
Censor:Kidney transplantationShift to peritoneal dialysisRefer to other centersChange frequencyDeath from accident

Enrollment
504
HD 2/wk
Death33
Results
1 year
6,928 patients-months were observed.
Mortality rate 4.8 / 1,000 patient-months.
HENNET
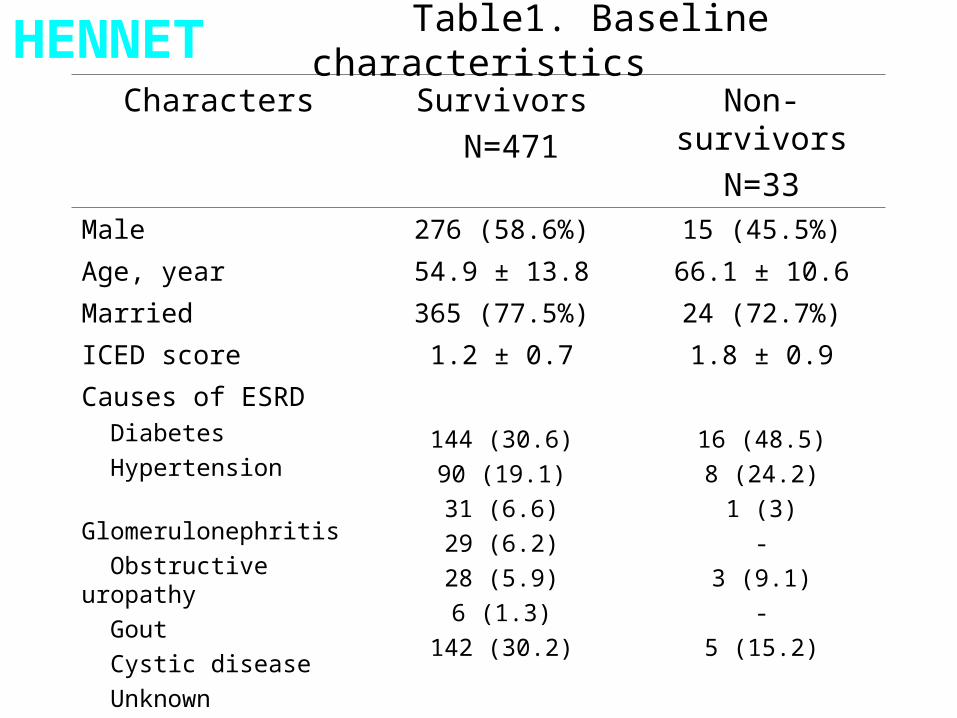
Table1. Baseline characteristics
Characters Survivors N=471
Non-survivorsN=33
Male 276 (58.6%) 15 (45.5%)
Age, year 54.9 ± 13.8 66.1 ± 10.6
Married 365 (77.5%) 24 (72.7%)
ICED score 1.2 ± 0.7 1.8 ± 0.9
Causes of ESRD Diabetes Hypertension Glomerulonephritis Obstructive uropathy Gout Cystic disease Unknown
144 (30.6)90 (19.1)31 (6.6)29 (6.2)28 (5.9)6 (1.3)
142 (30.2)
16 (48.5)8 (24.2)
1 (3)-
3 (9.1)-
5 (15.2)
Time on HD, month 40.6 ± 31.3 38.4 ± 28.0
Anuria (<100ml/day)
228 (48.4%) 15 (45.5%)
HENNET

.51
1.5
22.
53
ktv_
avg
20 40 60 80age
Kt/V by Age
1.7±0.31.7±0.4
HENNET

1
21
101
158
119
80
19
5
050
100
150
Fre
quen
cy
.5 1 1.5 2 2.5spKt/V
Distribution of Kt/V
Mean1.7±0.3
Range 0.67 – 2.83
HENNET

1
21
101
158
119
80
19
5
050
100
150
Fre
quen
cy
.5 1 1.5 2 2.5spKt/V
Distribution of Kt/V
Adequate HD20.6%
Mean1.7±0.3
Range 0.67 – 2.83
HENNET

Hemodialysis patients with adequate dialysis (URR>65%)
CMS ESRD Clinical Performance Measures Project, 2001-2002.Centers for Medicare & Medicaid Services, ESRD Clinical Performance Measures Project, 2002-2006.

HENNET
0.4
0.8
1.2
1.6
2.0
2.4
Women214(42.5%)
Men290(57.5%)
Kt/V
1.9±0.3
P < 0.001
1.6±0.3
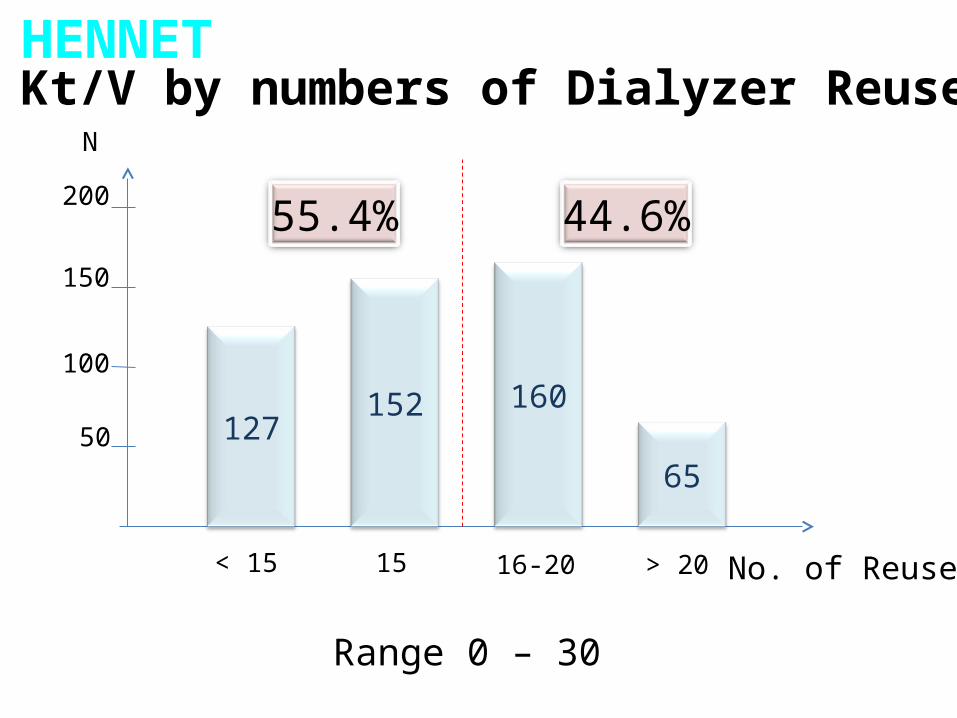
> 20< 15 No. of Reuse15
N
12765
160152
16-20
Kt/V by numbers of Dialyzer Reuse
50
100
150
44.6%200 55.4%
Range 0 – 30
HENNET
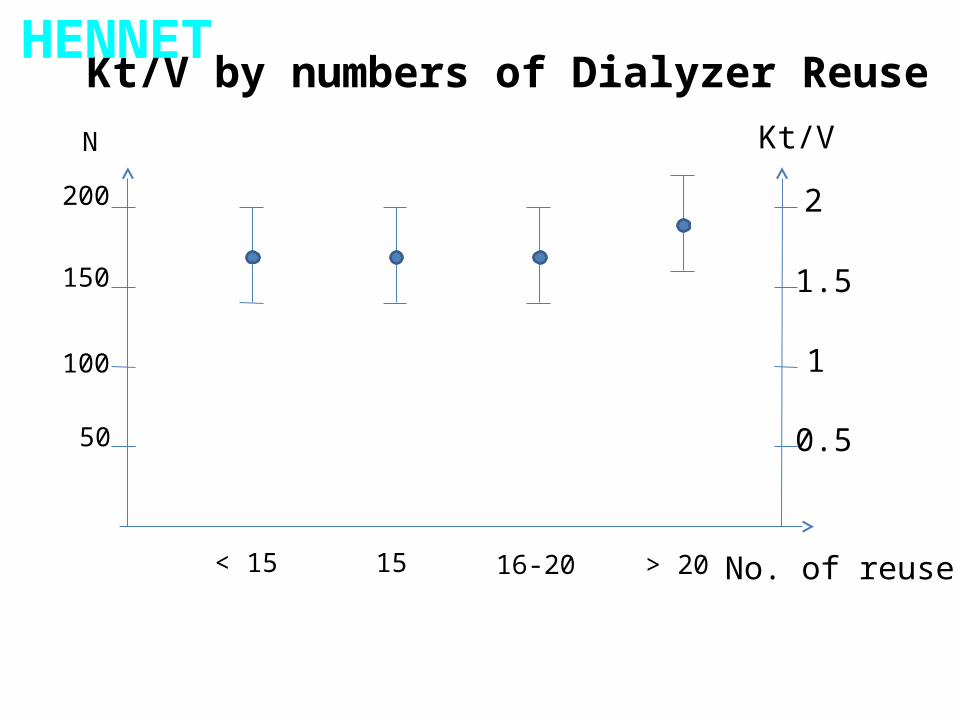
> 20< 15 No. of reuse15
N
16-20
Kt/V by numbers of Dialyzer Reuse
50
100
150
200
Kt/V
2
1
0.5
1.5
HENNET

Log
odds
of d
ead
Assessing Linearity Assumption -- Log OddsMean of c22 categories
Log odds of dead Linear prediction
10.0 15.0 20.0 25.0
-3.50
-3.00
-2.50
-2.00
Prediction of Dead by numbers of Dialyzer Reuse
< 15 15 16-20 > 20
Dead rate 0.03 0.06 0.08 0.11
No. of Reuse
HENNET

Hemodialysis Prescription Determines Adequacy
• Hemodialysis component:– Duration of Treatment– Dialyzer Urea Clearance (KOA)– Blood Flow– Dialysate Flow– Heparinization– Access
Adequacy of Treatment is Everyone’s Concern !

Improving Adequacy of Hemodialysis:It Takes a Team.

Kt/V : Do we really need it ?
0.0
0.5
1.0
1.5
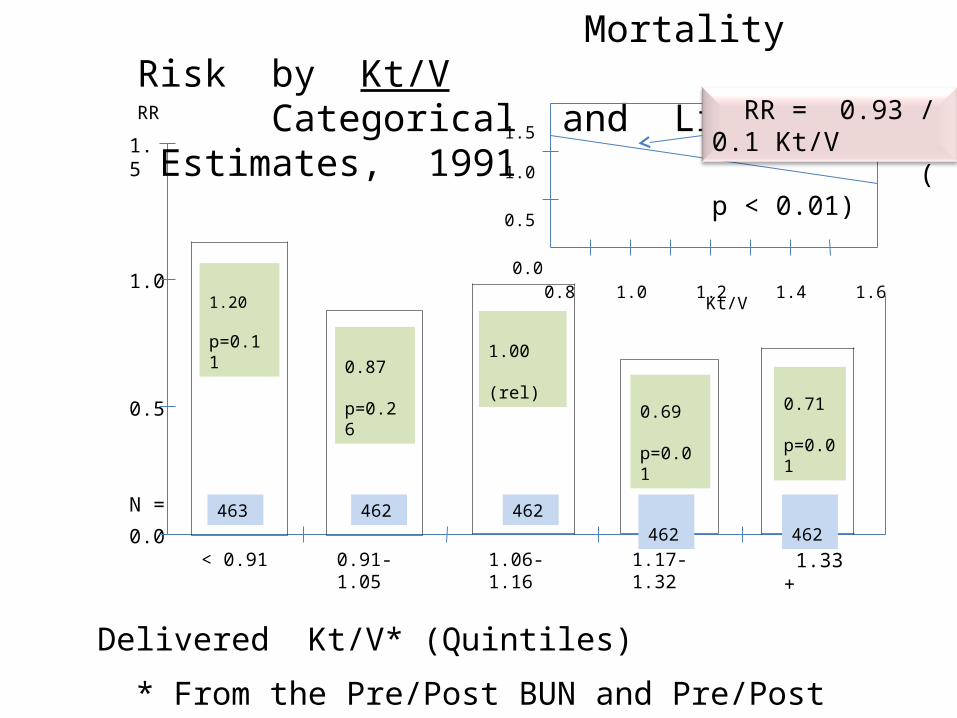
N = 463 462 462 462 462
< 0.91 0.91-1.05 1.06-1.16 1.17-1.32 1.33 +
1.20 p=0.11
0.87 p=0.26
1.00 (rel)
0.69 p=0.01
0.71 p=0.01
RR
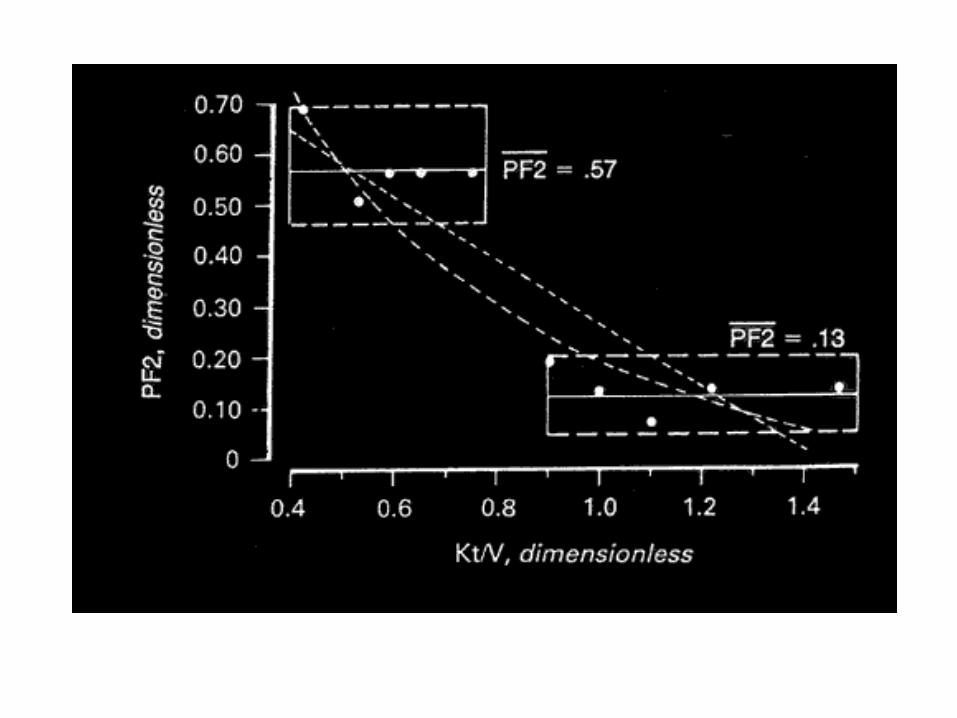
Mortality Risk by Kt/V Categorical and Linear Estimates, 1991
0.0
1.0
0.5
1.5
0.8 1.0 1.2 1.4 1.6
RR = 0.93 / 0.1 Kt/V ( p < 0.01)
Kt/V
Delivered Kt/V* (Quintiles)
* From the Pre/Post BUN and Pre/Post Weight. N = 2,311, Thrice Weekly only.
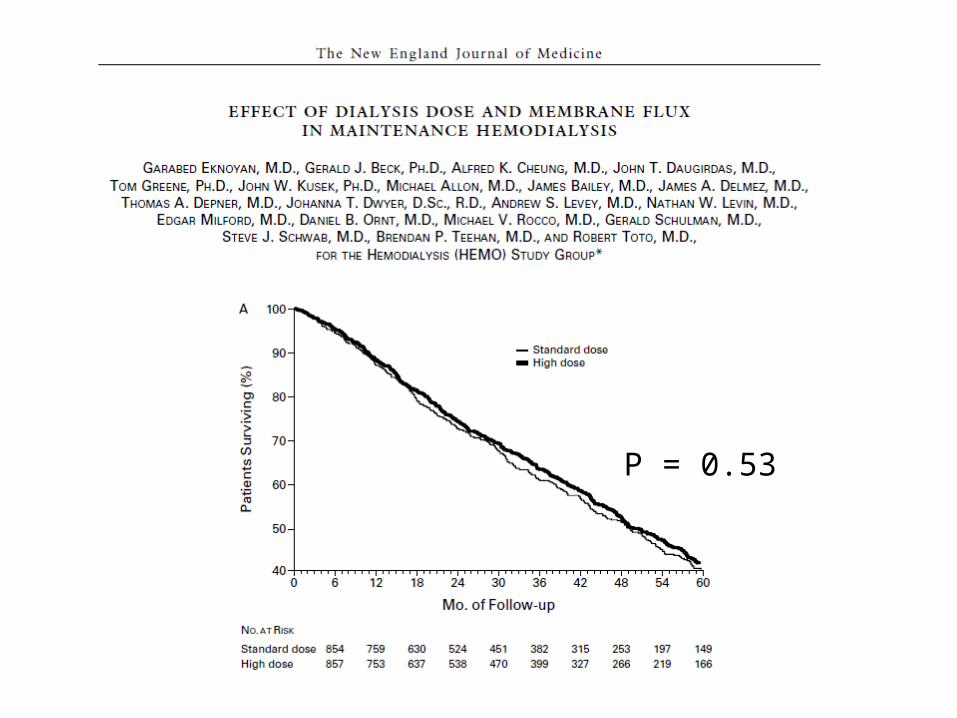
P = 0.53
HENNET
0.4
0.8
1.2
1.6
2.0
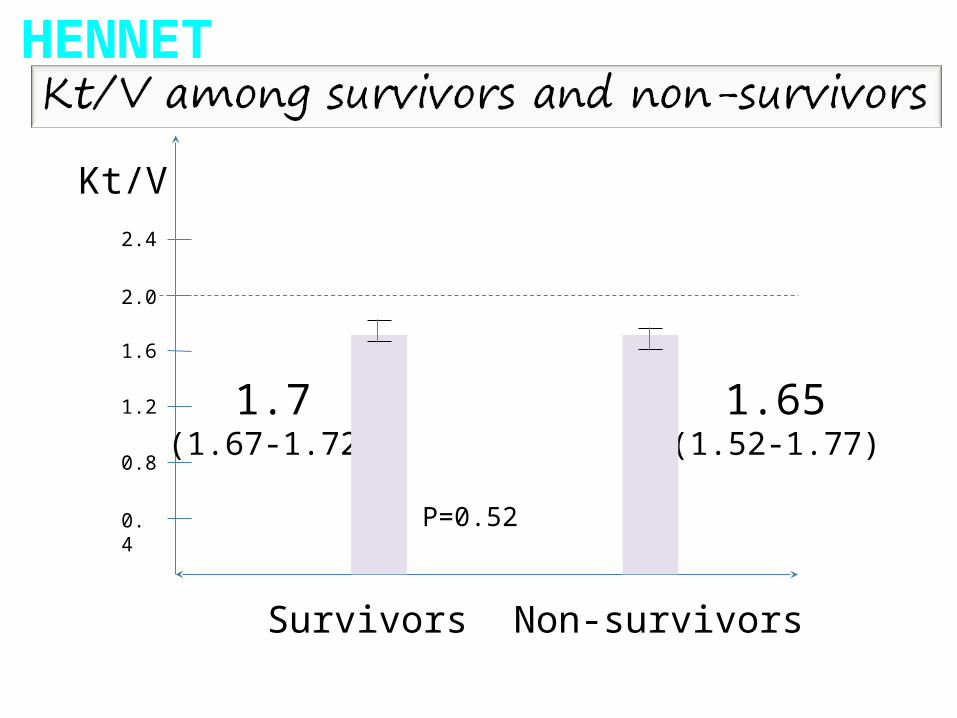
2.4
Survivors Non-survivors
Kt/V
1.65(1.52-1.77)
1.7(1.67-1.72)
P=0.52
0.0
00.2
50.5
00.7
51.0
0P
robabili
ty o
f su
rviv
al
0 5 10 15 20analysis time, months
Kt/V >= 2 Kt/V <2
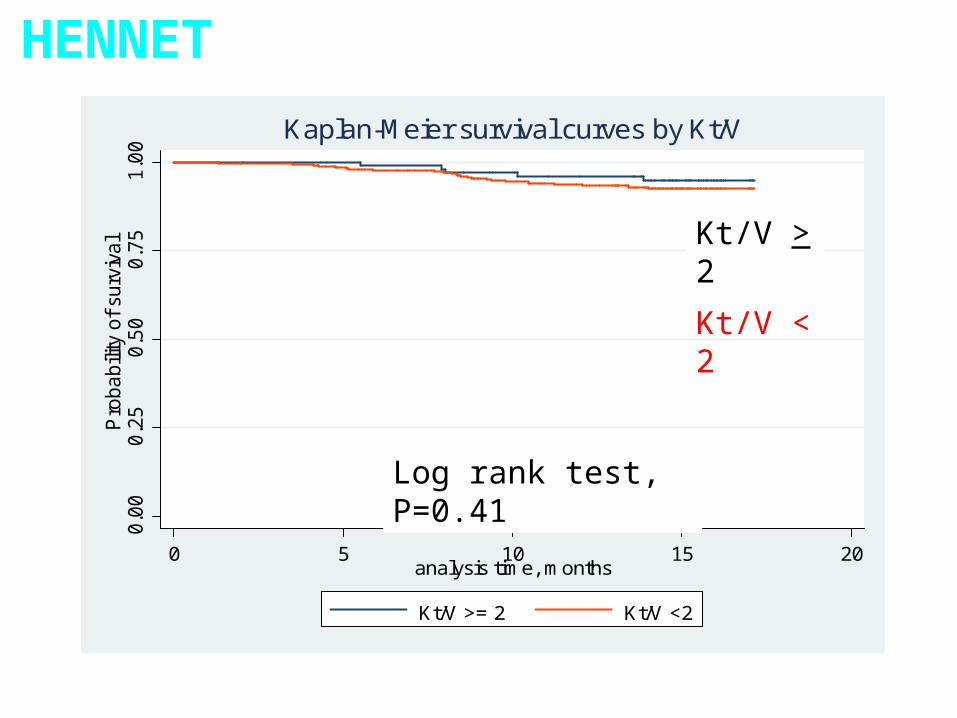
Kaplan-Meier survival curves by Kt/V
Log rank test, P=0.41
Kt/V > 2
Kt/V < 2
HENNET

0.0
00.2
50.5
00.7
51.0
0P
robabili
ty o
f su
rviv
al
0 5 10 15 20analysis time, months
Kt/V >= 2 Kt/V <2
Kaplan-Meier survival curves by Kt/V
Log rank test, P=0.41
Kt/V > 2
Kt/V < 2
HENNET
1 year survival 94%

0.00
0.25
0.50
0.75
1.00
Pro
babi
lity
of s
urvi
val
0 5 10 15 20analysis time, month
0.00
0.25
0.50
0.75
1.00
Pro
babi
lity
of s
urvi
val
0 5 10 15 20analysis time, month
Kt/V > 2
Kt/V < 2
HR 1.64 (0.38-7.13), p=0.5*
DMNon DM
Kt/V > 2
Kt/V < 2
Survival probability among patients with Kt/V>2 and <2 according to diabetic status
HR 1.0 (0.28-3.75), p=0.9*
*adjusted for age
HENNET
0.4
0.8
1.2
1.6
2.0
2.4
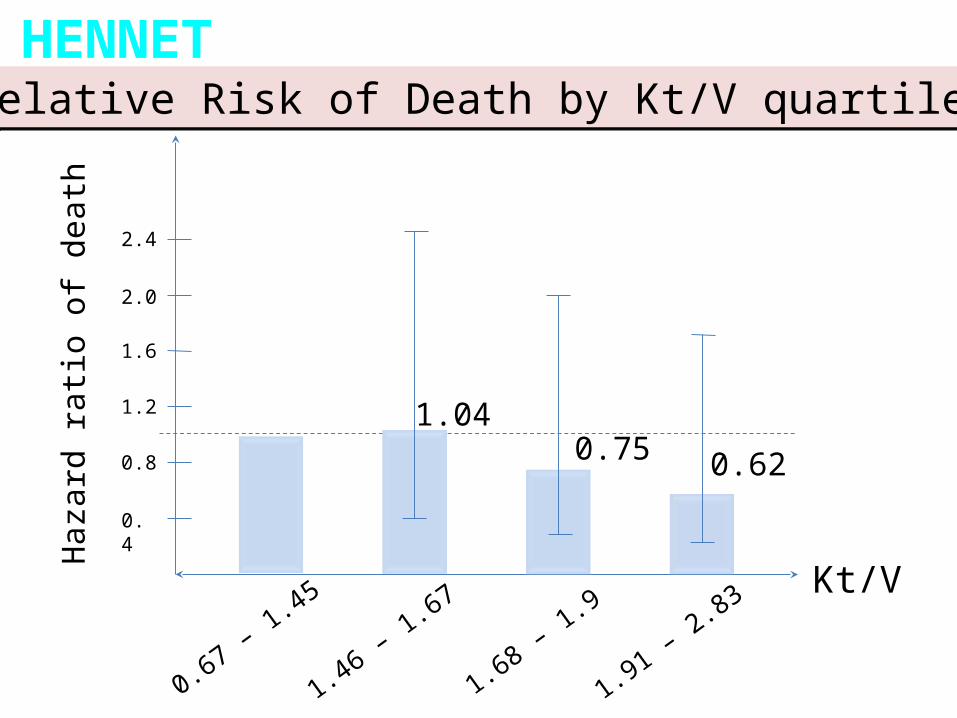
0.67 – 1.45
1.46 – 1.67
1.68 – 1.9
1.91 – 2.83Kt/V
0.62
1.040.75
Haz
ard
ratio
of d
eath
Relative Risk of Death by Kt/V quartilesRelative Risk of Death by Kt/V quartilesHENNET
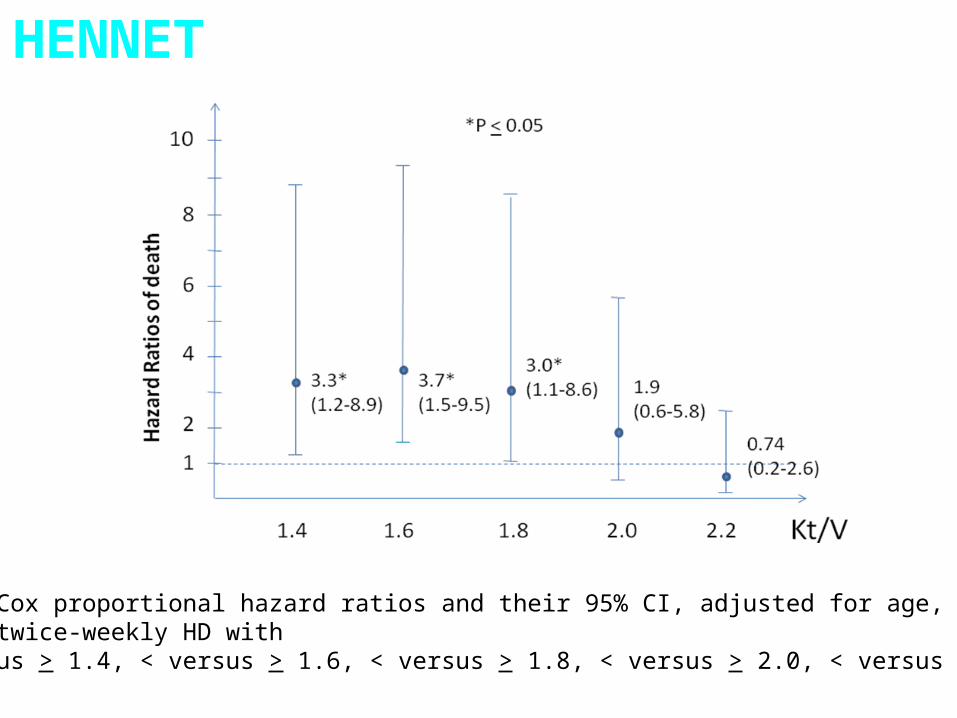
Figure 15. Cox proportional hazard ratios and their 95% CI, adjusted for age, among women undergoing twice-weekly HD with Kt/V < versus > 1.4, < versus > 1.6, < versus > 1.8, < versus > 2.0, < versus > 2.2.
HENNET
HENNET
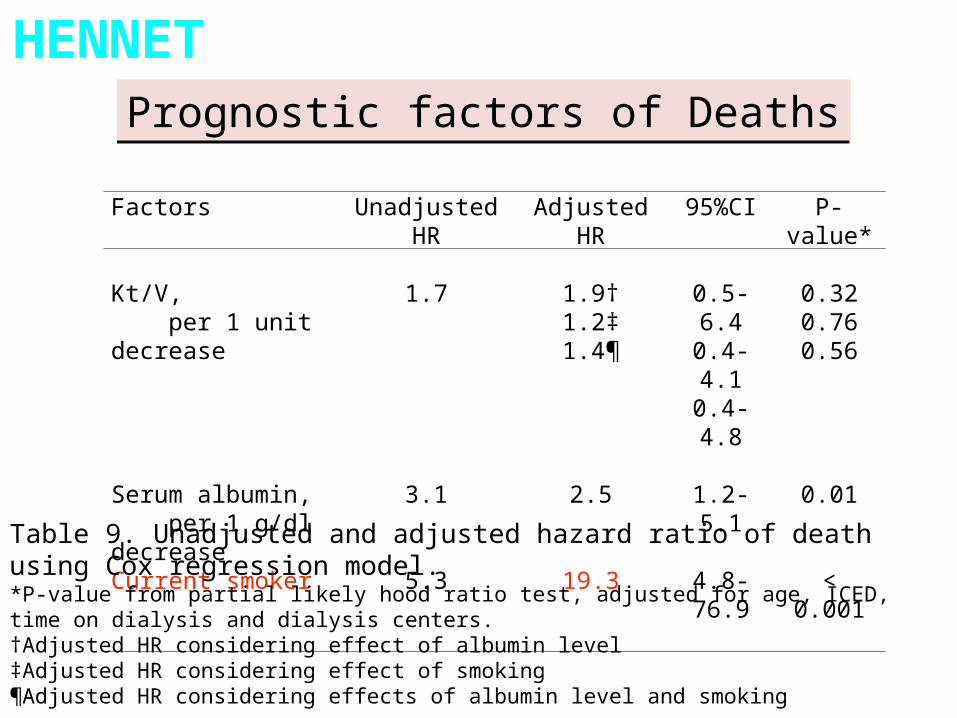
Factors Unadjusted HR Adjusted HR 95%CI P-value*
Kt/V, per 1 unit decrease
1.7 1.9†1.2‡1.4¶
0.5-6.40.4-4.10.4-4.8
0.320.760.56
Serum albumin, per 1 g/dl decrease
3.1 2.5 1.2-5.1 0.01
Current smoker 5.3 19.3 4.8-76.9 < 0.001
Table 9. Unadjusted and adjusted hazard ratio of death using Cox regression model.*P-value from partial likely hood ratio test, adjusted for age, ICED, time on dialysis and dialysis centers.†Adjusted HR considering effect of albumin level‡Adjusted HR considering effect of smoking¶Adjusted HR considering effects of albumin level and smoking
Prognostic factors of DeathsPrognostic factors of Deaths

Kt/V : Do we really need it ?
May be, there are stronger predictors of mortality.

Take Home Message !!
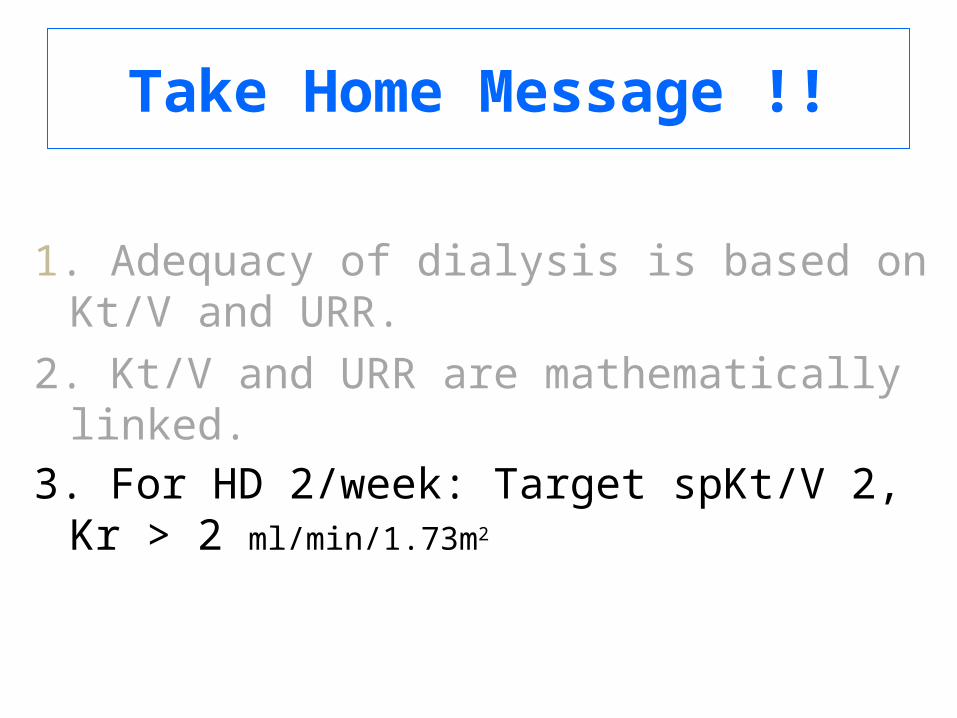
1. Adequacy of dialysis is based on Kt/V and URR.

Take Home Message !!
1. Adequacy of dialysis is based on Kt/V and URR.2. Kt/V and URR are mathematically linked.
Take Home Message !!
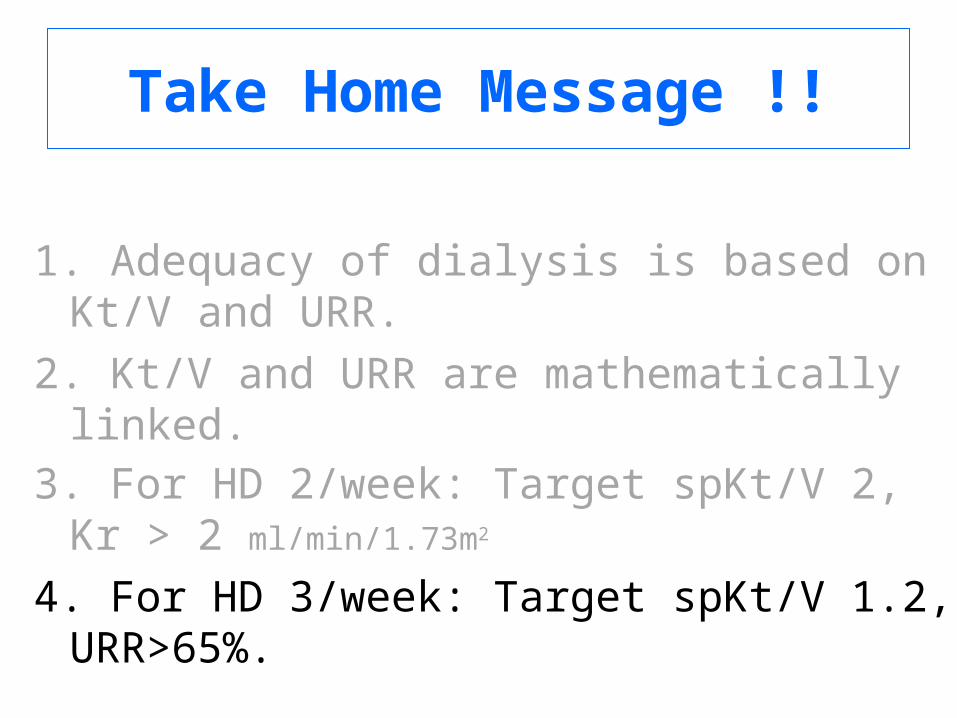
1. Adequacy of dialysis is based on Kt/V and URR.2. Kt/V and URR are mathematically linked.3. For HD 2/week: Target spKt/V 2, Kr > 2 ml/min/1.73m2
Take Home Message !!
1. Adequacy of dialysis is based on Kt/V and URR.2. Kt/V and URR are mathematically linked.3. For HD 2/week: Target spKt/V 2, Kr > 2 ml/min/1.73m2
4. For HD 3/week: Target spKt/V 1.2, URR>65%.

5. Data from– Only 20.6% is adequately dialyzed, Kt/V>2.
HENNET
Take Home Message !!

5. Data from– Only 20.6% is adequately dialyzed, Kt/V>2.– Mean Kt/V of women is significantly higher than that of
men.
HENNET
Take Home Message !!

5. Data from– Only 20.6% is adequately dialyzed, Kt/V>2.– Mean Kt/V of women is significantly higher than that of
men.– Increase No. of Reuse related to an increase mortality
in a linear prediction.
HENNET
Take Home Message !!

5. Data from– Only 20.6% is adequately dialyzed, Kt/V>2.– Mean Kt/V of women is significantly higher than that of
men.– Increase No. of Reuse related to an increase mortality
in a linear prediction.– Higher Kt/V quartiles trend to have lower RR for death.
HENNET
Take Home Message !!

5. Data from– Only 20.6% is adequately dialyzed, Kt/V>2.– Mean Kt/V of women is significantly higher than that of
men.– Increase No. of Reuse related to an increase mortality
in a linear prediction.– Higher Kt/V quartiles trend to have lower RR for death.– Suggested target Kt/V > 1.8 for Thai women on
2HD/wk.
HENNET
Take Home Message !!

5. Data from– Only 20.6% is adequately dialyzed, Kt/V>2.– Mean Kt/V of women is significantly higher than that of
men.– Increase No. of Reuse related to an increase mortality
in a linear prediction.– Higher Kt/V quartiles trend to have lower RR for death.– Suggested target Kt/V > 1.8 for Thai women on
2HD/wk.– Predictors of death are SMOKING and ALBUMIN level.
HENNET
Take Home Message !!
6. spKt/V is a current marker for monitoring HD adequacy.
Take Home Message !!

Acknowledgements : Grant supports
• The Royal College of Physician of Thailand• The Medical Association of Thailand• The Kidney Foundation of Thailand

Thank you
for your
attention
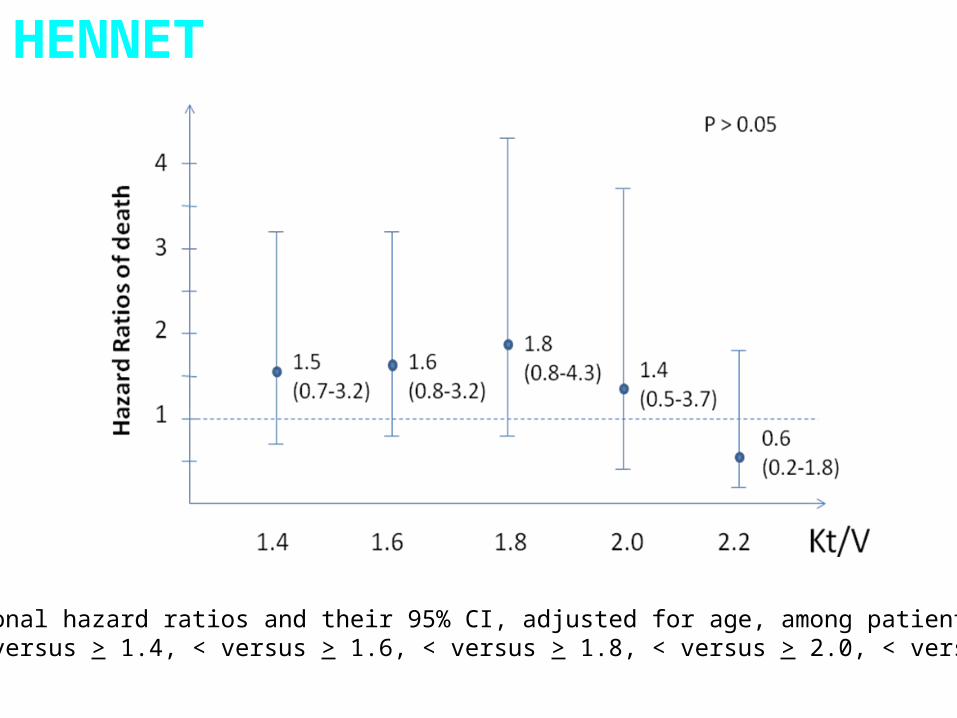
Cox proportional hazard ratios and their 95% CI, adjusted for age, among patients With Kt/V < versus > 1.4, < versus > 1.6, < versus > 1.8, < versus > 2.0, < versus > 2.2.
HENNET

Kt/V by BMI classes
Underweight
Obese
Normal
Overw
eight> 30< 18.5
BMI18.5-25
100
80
60
40
20
Percent
15.1 12.711.9
60
25-30
HENNET
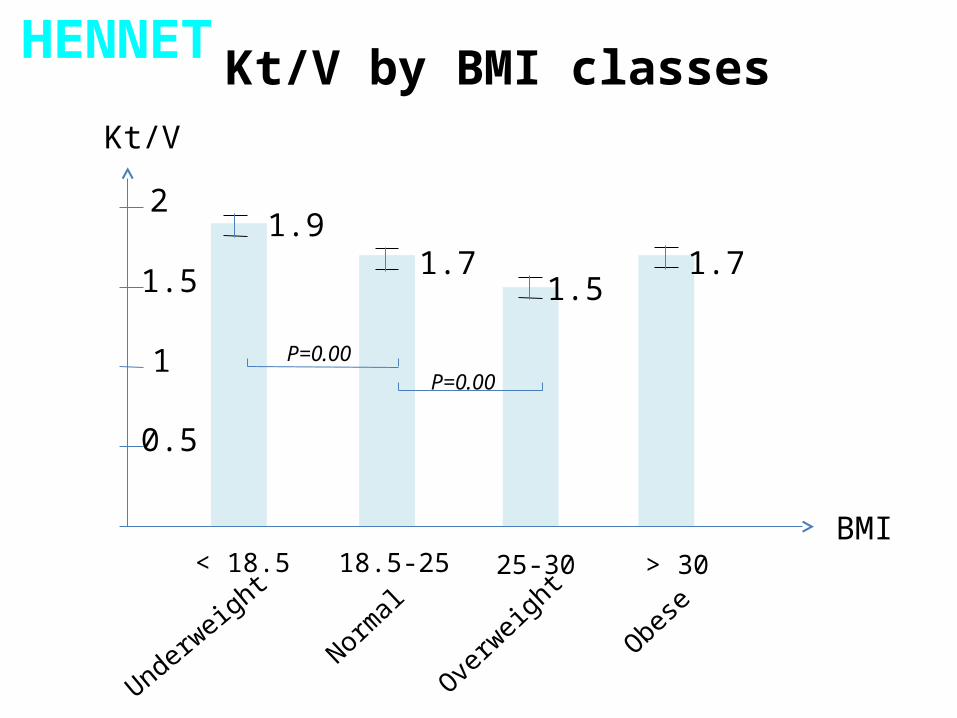
Kt/V by BMI classes
Underweight
Obese
Normal
Overw
eight> 30< 18.5
BMI18.5-25 25-30
Kt/V
2
1
0.5
1.5
1.9
1.51.71.7
P=0.00P=0.00
HENNET
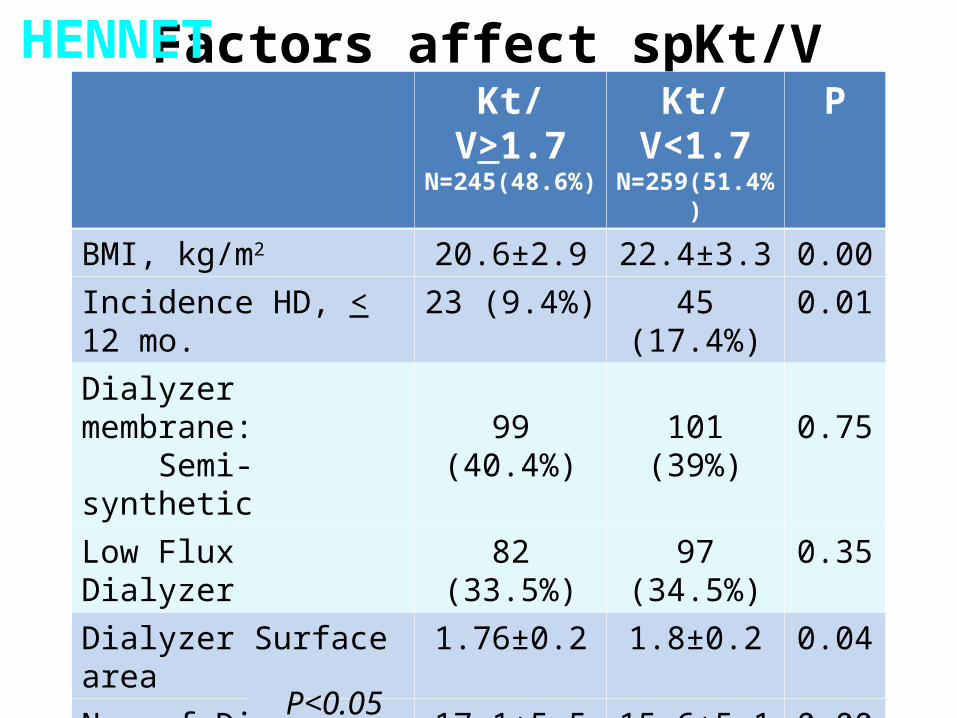
Factors affect spKt/V Kt/V>1.7N=245(48.6%)
Kt/V<1.7 N=259(51.4%)
P
BMI, kg/m2 20.6±2.9 22.4±3.3 0.00Incidence HD, < 12 mo. 23 (9.4%) 45 (17.4%) 0.01Dialyzer membrane: Semi-synthetic 99 (40.4%) 101 (39%) 0.75Low Flux Dialyzer 82 (33.5%) 97 (34.5%) 0.35Dialyzer Surface area 1.76±0.2 1.8±0.2 0.04No. of Dialyzer Reuse 17.1±5.5 15.6±5.1 0.00Blood Flow, ml/min 324.2±51 297.9±46.9 0.00Dialysate flow, ml/min 537.9±98.3 517.7±64 0.01DM 71 (28.9%) 107 (60.1%) 0.00Current Smoking 5 (2.0%) 12 (4.6%) 0.08
P<0.05
HENNET
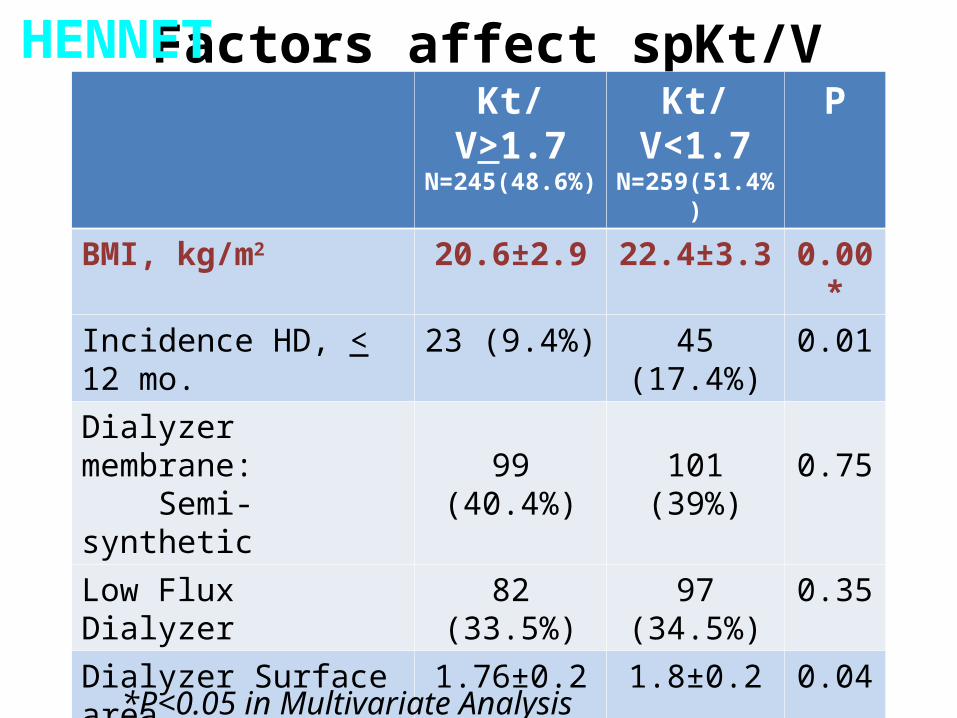
Factors affect spKt/V Kt/V>1.7N=245(48.6%)
Kt/V<1.7 N=259(51.4%)
P
BMI, kg/m2 20.6±2.9 22.4±3.3 0.00*Incidence HD, < 12 mo. 23 (9.4%) 45 (17.4%) 0.01Dialyzer membrane: Semi-synthetic 99 (40.4%) 101 (39%) 0.75Low Flux Dialyzer 82 (33.5%) 97 (34.5%) 0.35Dialyzer Surface area 1.76±0.2 1.8±0.2 0.04No. of Dialyzer Reuse 17.1±5.5 15.6±5.1 0.00*Blood Flow, ml/min 324.2±51 297.9±46.9 0.00*Dialysate flow, ml/min 537.9±98.3 517.7±64 0.01DM 71 (28.9%) 107 (60.1%) 0.00Current Smoking 5 (2.0%) 12 (4.6%) 0.08
*P<0.05 in Multivariate Analysis
HENNET

Factors affect spKt/V
Coef. 95%CI PBMI, kg/m2 0.20 0.13 to 0.27 0.000No. of Dialyzer Reuse -0.06 -0.02 to -0.10 0.003Blood Flow, ml/min -0.01 -0.006 to -0.014 0.000
Kt/V < 1.7
Every 1 increase in BMI will increase 20% of Kt/V<1.7
HENNET

NIH Hemo Study
URR of about 67% vs. about 75%spKt/V of 1.3 vs. 17eKt/V of about 1.05 vs. 1.45
Also will compare small-pore (low-flux)vs. large-pore (high flux) membranes
Endpoints: mortality, hospitalization,fall in dry weight
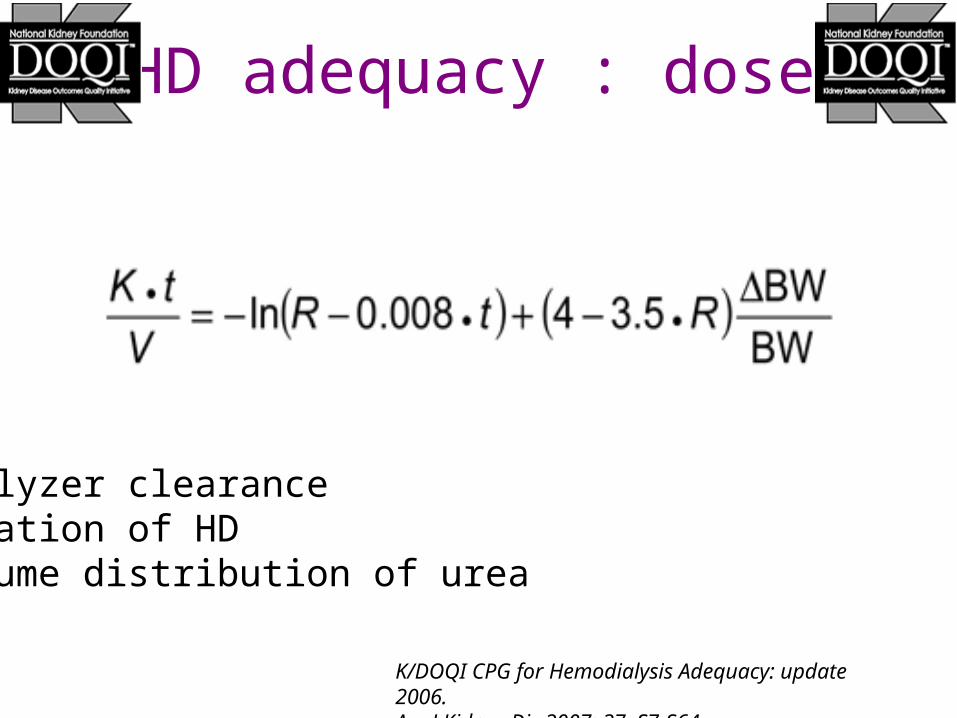
HD adequacy : dose
K/DOQI CPG for Hemodialysis Adequacy: update 2006. Am J Kidney Dis 2007; 37: S7-S64.
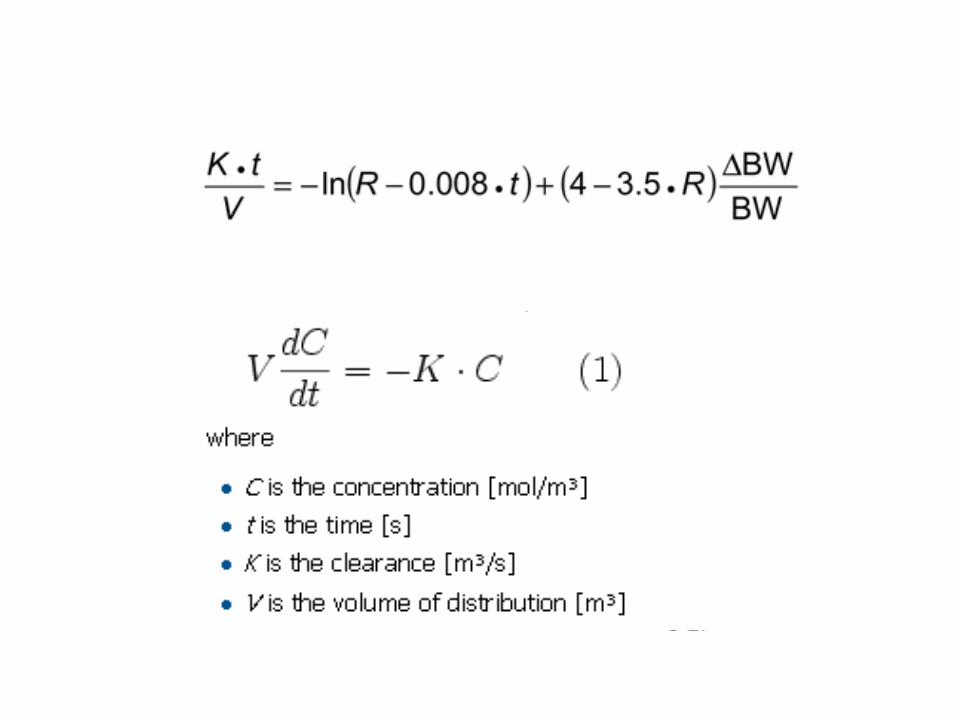
K: dialyzer clearance t: duration of HDV: volume distribution of urea

Post-Dialysis rebound

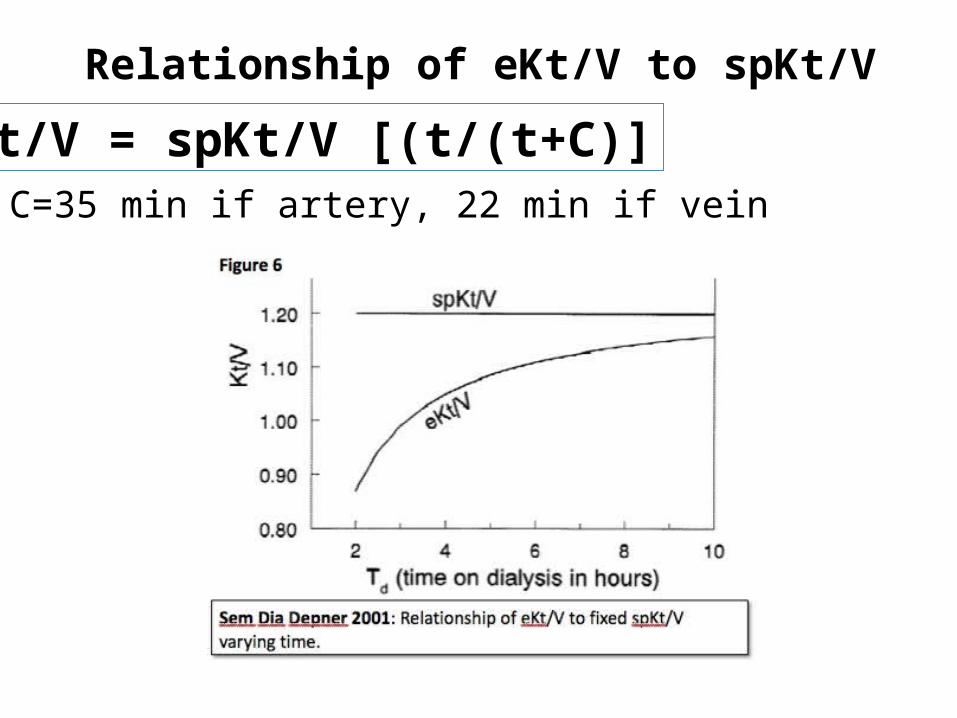
Relationship of eKt/V to spKt/V
eKt/V = spKt/V [(t/(t+C)]C=35 min if artery, 22 min if vein
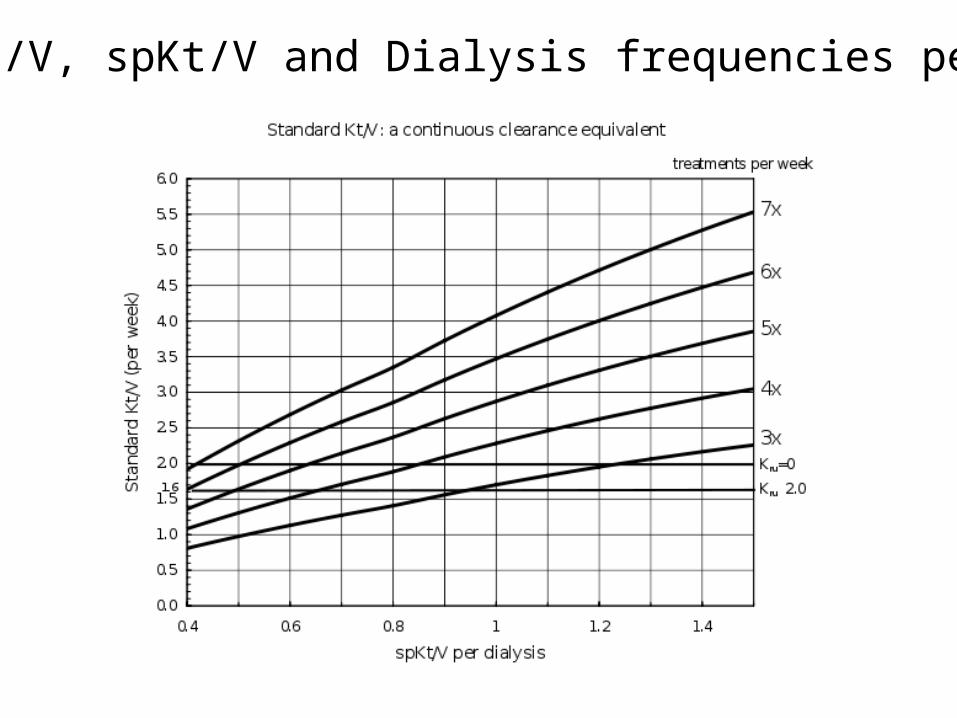
Std Kt/V, spKt/V and Dialysis frequencies per week

Associated causes of death
Causes of Death N %
Cardiovascular 14 42.4
Infection 11 33.3
Cerebrovascular 2 6.1
Malignancy 2 6.1
Other GI bleeding Bleeding diverticulosis Dialysis withdrawal Car accident
1111
3 3 3 3

Outcomes
Outcomes N %Death 33 34.7Refer to other centers 27 28.4Change frequency 13 13.7Shift to CAPD 10 10.5Kidney transplantation 6 6.3Loss to follow up 6 6.3

Indices of Urea RemovalKt/V
Reflects urea removalNCDS suggested Kt/V must be > 0.90Population studies suggest Kt/V should
be>1.2
URRAlso reflects urea removalCurrent goal is a URR > 65 %


Sample

0.8
1.0
1.2
1.4
1.6
1.8
2.0
< 0.70 0.75 0.88 1.0 1.15 1.3 >1.4
Approximate Kt/V

100
80
60
40
20
Percent
1.5
P=1.00
Incidence and Prevalence Hemodialysis
Incidence HD<= 12 mo.
Prevalence HD> 12 mo.
(13.5%)
(86.5%)
68
436
HENNET

Kt/V
2
1
0.5
1.5 1.54 (1.46 to 1.61)
P=0.00
Kt/V by Incidence and Prevalence Hemodialysis
Incidence HD<= 12 mo.
Prevalence HD> 12 mo.
1.72 (1.69 to 1.74)
HENNET
Related Documents