You can listen to today’s webinar using your computer’s speakers or you may dial into the teleconference. If you would like to join the teleconference, please dial 1.408.600.3600 and enter access code: 921 655 826 # You will be on hold until the seminar begins. HR Analytics – A Pathway to Business Impact #TMwebinar

9 18tmcornerstoneondemandfinalslides-120918160408-phpapp01
Aug 15, 2015
Welcome message from author
This document is posted to help you gain knowledge. Please leave a comment to let me know what you think about it! Share it to your friends and learn new things together.
Transcript
You can listen to today’s webinar using your computer’s speakers or you may dial into the teleconference.
If you would like to join the teleconference, please dial 1.408.600.3600 and enter access code: 921 655 826 #
You will be on hold until the seminar begins.
HR Analytics – A Pathway to Business Impact
#TMwebinar
Speaker: Charles GoretskyPrincipal ConsultantBersin & Associates
Moderator: Kellye WhitneyManaging EditorTalent Management magazine
#TMwebinar
HR Analytics – A Pathway to Business Impact
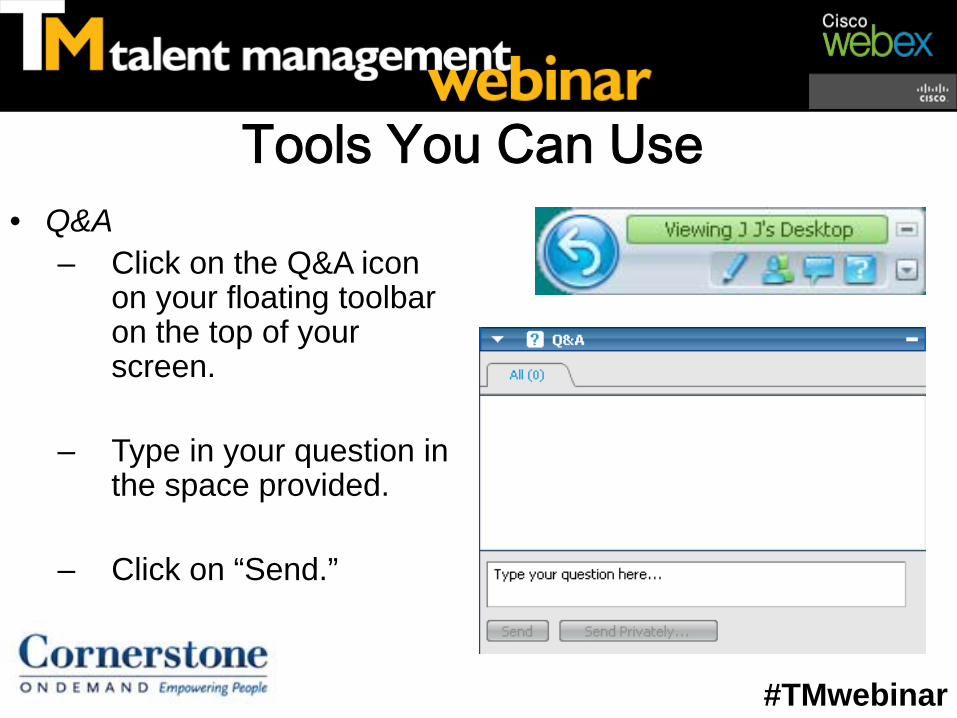
Tools You Can Use• Q&A
– Click on the Q&A icon on your floating toolbar on the top of your screen.
– Type in your question in the space provided.
– Click on “Send.”
#TMwebinar
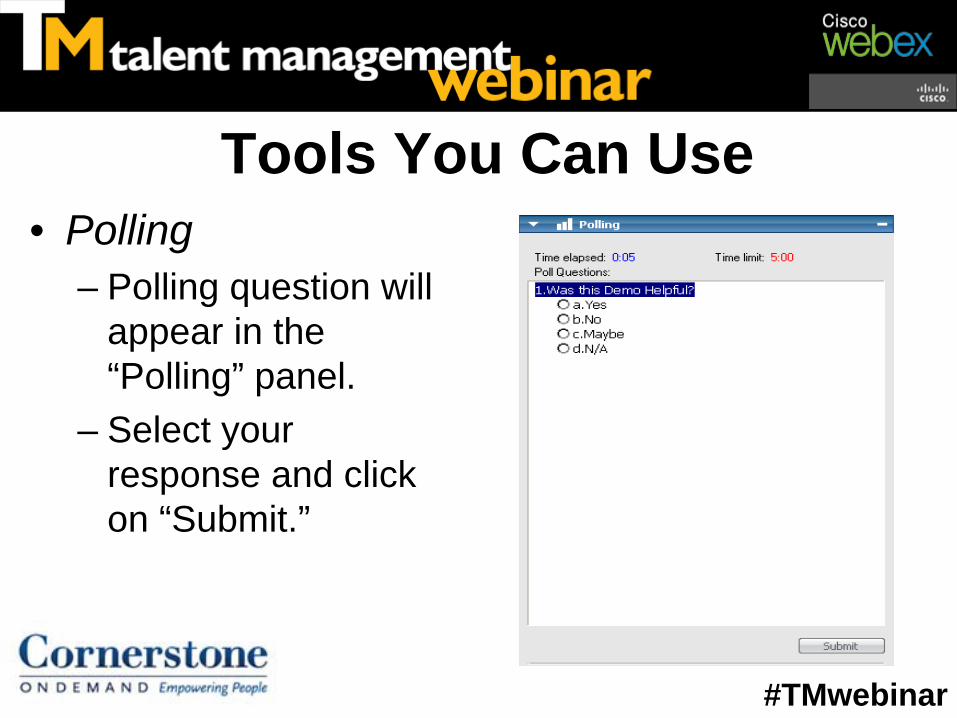
Tools You Can Use• Polling
– Polling question will appear in the “Polling” panel.
– Select your response and click on “Submit.”
#TMwebinar
Frequently Asked Questions1. Will I receive a copy of the slides after the webinar?
YES
2. Will I receive a copy of the recording after the webinar?YES
Please allow up to 2 business days to receive these materials.
#TMwebinar

#TMwebinar
Kellye WhitneyManaging EditorTalent Management magazine
HR Analytics – A Pathway to Business Impact
Copyright © 2012 Bersin & Associates. All rights reserved. Page 6
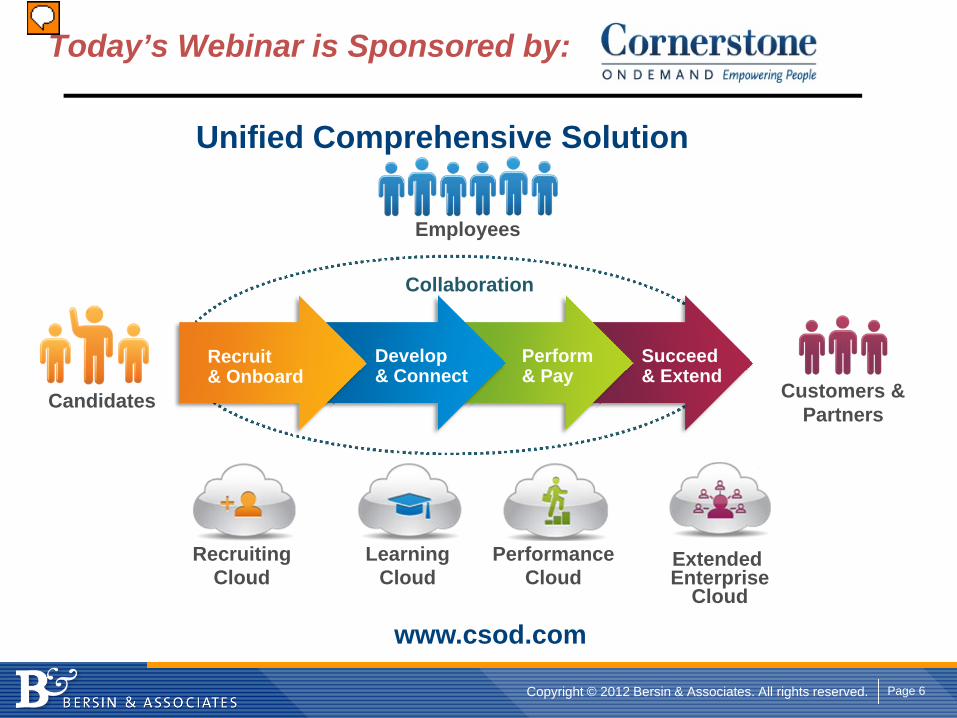
Today’s Webinar is Sponsored by:
www.csod.com
Recruit & Onboard
Develop& Connect
Perform & Pay
Succeed & Extend
Candidates
RecruitingCloud
LearningCloud
PerformanceCloud
Extended Enterprise
Cloud
Customers & Partners
Employees
Collaboration
Unified Comprehensive Solution
Presenter
Presentation Notes
Cornerstone OnDemand is a global leader of cloud-based talent management software solutions. Over 9.4 million users across 180 countries rely on Cornerstone to maximize their potential, develop their skills and foster new levels of collaboration. Cornerstone’s comprehensive solution helps organizations manage entire employee lifecycle, from hiring through retirement. The solution includes: Cornerstone Recruiting Cloud, for social recruiting, sourcing, onboarding, and planning of talent Cornerstone Performance Cloud, for managing the performance, succession and compensation of your workforce Cornerstone Learning Cloud, for training, development and certification of employee skills and expertise Cornerstone Extended Enterprise Cloud, for managing and training your extended network of customers and partners Based on Cornerstone’s pure cloud architecture, Cornerstone’s comprehensive solution helps organizations manage entire employee lifecycle, from hiring through retirement.
#TMwebinar
Charles GoretskyPrincipal ConsultantBersin & Associates
HR Analytics – A Pathway to Business Impact

Copyright © 2012 Bersin & Associates. All rights reserved. Page 8Copyright © 2012 Bersin & Associates. All rights reserved.
HR Analytics – A Pathway to Business Impact
Charles GoretskyPrincipal Consultant
September 18, 2012
Sponsored by:

Copyright © 2012 Bersin & Associates. All rights reserved. Page 9
Bersin WhatWorks® Membership Program
Learning &Development
TalentManagement
Leadership& Succession
TalentAcquisition
HumanResources
Research and ToolsFrameworks, Maturity Models, High Impact® Research Programs, Factbooks®
Scorecards, checklists, forms, RFP’s, selection guides, case studies, solution provider library
Advisory ServicesAsk the Experts®, Business Impact Workshops
Analyst Advisory Calls, Webinars
Networking and Professional DevelopmentMember Roundtables, Peer Connection®,
IMPACT Conference, Bersin Lexicon®, Analyst Blogs
Consulting ServicesStrategy Development, Executive Alignment, Benchmarking,
Systems Selection and Roadmap, Measurement Strategy and Programs
Mem
ber S
ucce
ss P
rogr
am
Presenter
Presentation Notes
CHARLIE:

Copyright © 2012 Bersin & Associates. All rights reserved. Page 10
Topics
The importance and impact of quality HR measurement on talent and business outcomesHow analytics helps address critical talent challenges organizations face todayHow to evolve and mature your analytics capabilityHow current technologies can be readily leveraged to build an analytics capability that enhances both the prioritization and outcome achievement of your human capital initiatives.
Presenter
Presentation Notes

Copyright © 2012 Bersin & Associates. All rights reserved. Page 11
Analytics is a Well-Known DisciplineBusinesses Measure What Matters
The Industrial Economy
Steel, Oil, Railroads
The Financial Economy
Conglomerates, Financials, Engineering
The Customer Economy and Web
Customer segmentation, Personalized products
The Talent Economy
Globalization, Demographics, Leadership
and Skills Shortages
Early 1900’s 1950’s- 60’s 1970’s-80’s Today
The Waves of Business Analytics
Finance & Logistics
Logistics and Supply Chain
Analytics
1980s Financial and
Budget Analytics
Integrated Supply Chain
Integrated ERP and Financial
Analytics
Recruiting, Learning, Performance Measurement
Integrated TM and Workforce
Planning
Customer Analytics – CRM (Data Warehouse)
Customer Segmentation
Shopping Basket
Web Behavior Analytics
Predictive Customer Behavior
Talent & LeadershipCustomer & Marketing
Business-driven Talent analytics
Predictive Talent Models
Copyright © 2012 Bersin & Associates. All rights reserved. Page 12
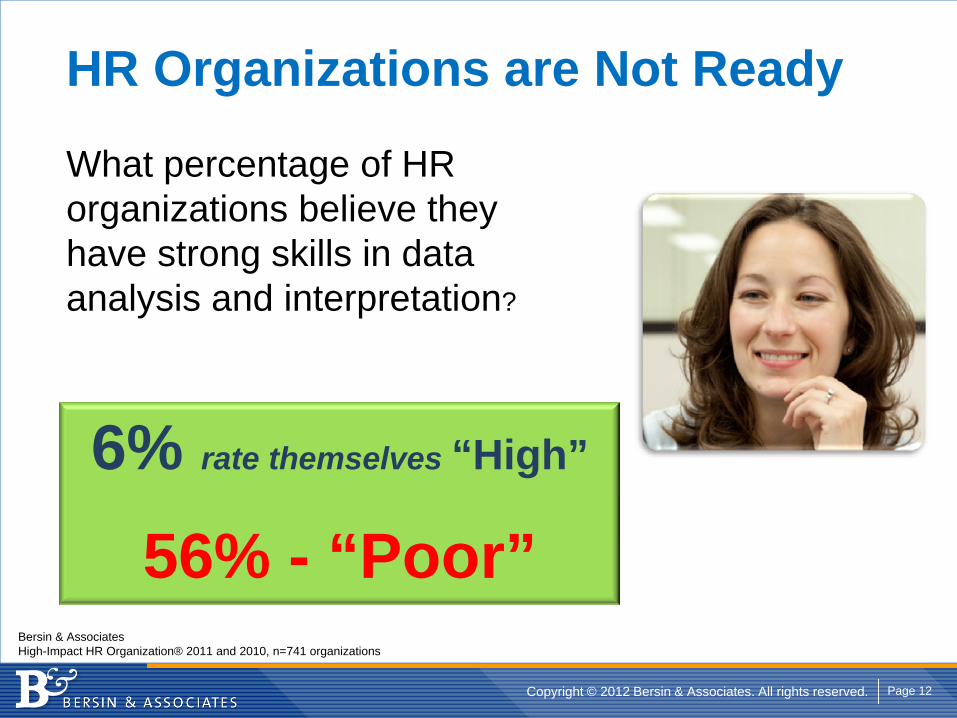
HR Organizations are Not Ready
What percentage of HR organizations believe they have strong skills in data analysis and interpretation?
6% rate themselves “High”
56% - “Poor”Bersin & AssociatesHigh-Impact HR Organization® 2011 and 2010, n=741 organizations

Copyright © 2012 Bersin & Associates. All rights reserved. Page 13
The Lowest Rated HR Skill
17%
15%
7%
6%
4%
1%
-4%
-5%
-6%
-11%
-12%
-18%
Attracting and selecting the right talent
Promoting health and wellness
Onboarding new talent
Fairly allocating compensation
Understanding skills needed by role
Encouraging innovation and collaboration
Creating a high-performance culture
Enabling a learning organization
Identifying and developing future leaders
Driving internal mobility
Developing workforce analytics for management
Measuring HR program effectiveness
Relative Strengths of HR Skills and Capabilities
Bersin & AssociatesHigh-Impact HR Organization® 2011 and 2010, n=741 organizations
Measurement and analytics are the lowest-rated
capabilities for HR teamstoday

Copyright © 2012 Bersin & Associates. All rights reserved. Page 14
Impact on HRHR Best Practices HR Framework Area HR Impact
1. Implement Governance & Planning * HR Strategy & Business Planning 39%
2. Invest in Quality Workforce Planning HR Service Models 28%3. Create the “Right” HR Philosophy HR Strategy & Business Planning 27%
4. Reduce HR BP Administrative Work HR Service Models 25%
5. Create a Flexible HR Org Structure Organization & Governance 20%
6. Improve Key Audience Facing Tools Technology and Infrastructure 19%
7. Measure Workforce & HR Ops * Measurement 19%
8. Develop Internal HR Skills * Governance & Organization 13%
9. Outsource Strategically Service Models 10%
10. Improve Line Manager Capabilities * Audience & Stakeholders 10%
•Negative impact if not implemented well
Source Bersin & Associates HIHR Survey N=720HR Impact =‘s Opportunity for improved efficiency, effectiveness, and business alignment

Copyright © 2012 Bersin & Associates. All rights reserved. Page 15
HR Business Partners Activities# 1 Differentiator of HIHR organizations over 15,000 employees
5%
15%
12%
19%
18%
16%
41%
20%
45%
37%
3%
3%
7%
10%
21%
22%
28%
28%
48%
66%
Orientation
Performance Management
Data Gathering & Reporting
HR Program Training
Employe Inquiries
Coaching executives & Managers
Manager Inquiries
Workforce Strategy
Employee Relations
Providing Decision Support
High Impact HR All Others
What does the HR Business Partner role do?
Copyright © 2012 Bersin & Associates. All rights reserved. Page 16
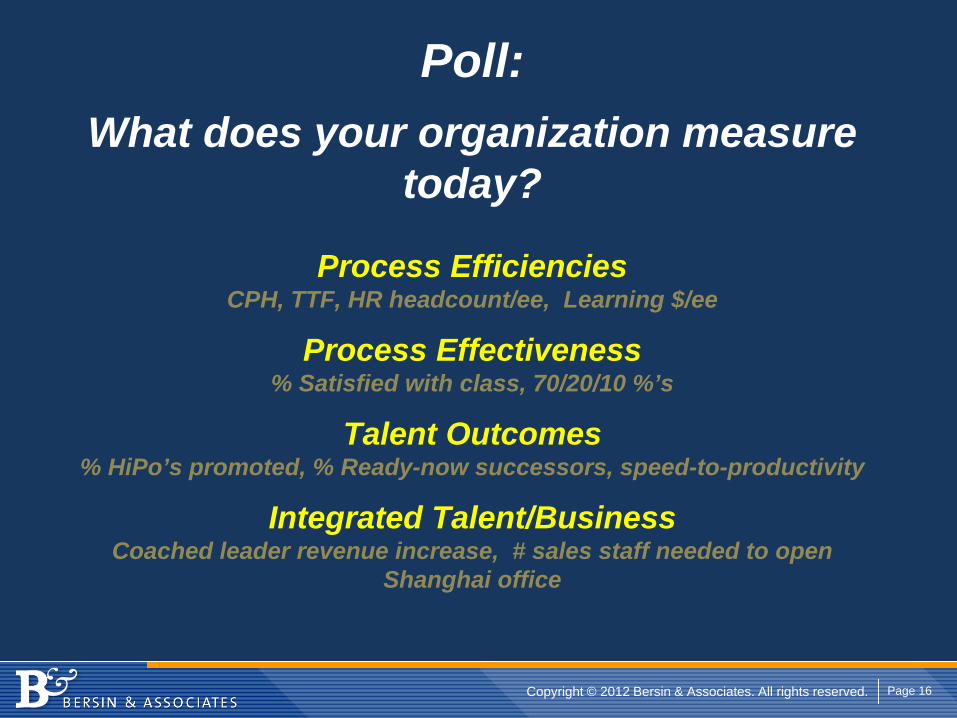
Poll: What does your organization measure
today?
Process Efficiencies CPH, TTF, HR headcount/ee, Learning $/ee
Process Effectiveness % Satisfied with class, 70/20/10 %’s
Talent Outcomes% HiPo’s promoted, % Ready-now successors, speed-to-productivity
Integrated Talent/BusinessCoached leader revenue increase, # sales staff needed to open
Shanghai office
Copyright © 2012 Bersin & Associates. All rights reserved. Page 17
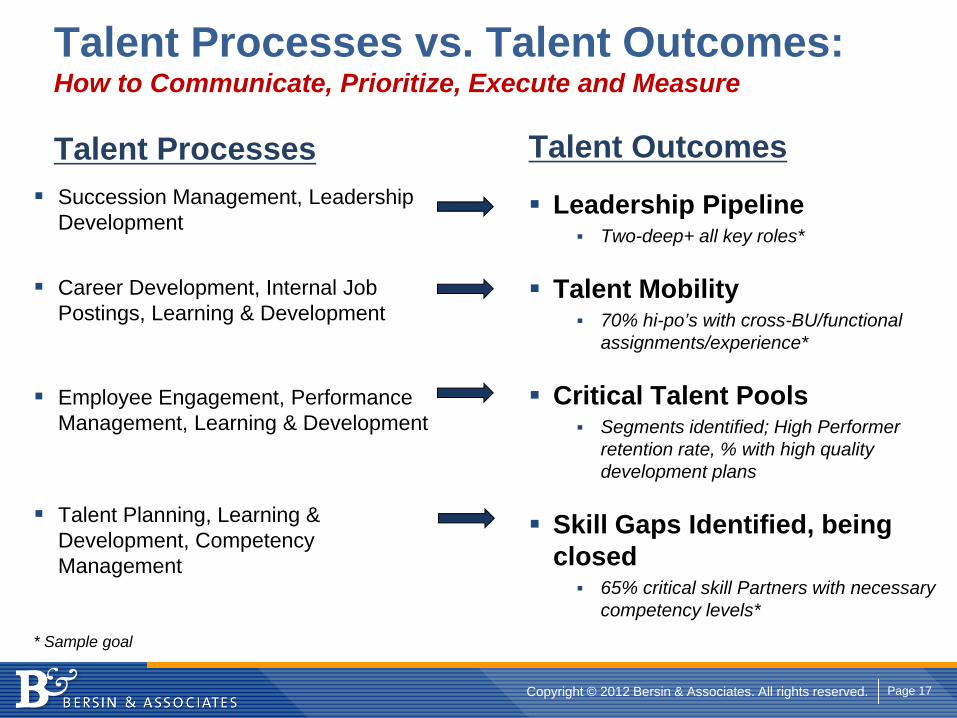
Talent Processes vs. Talent Outcomes: How to Communicate, Prioritize, Execute and Measure
Talent Outcomes
Leadership Pipeline Two-deep+ all key roles*
Talent Mobility70% hi-po’s with cross-BU/functional assignments/experience*
Critical Talent PoolsSegments identified; High Performer retention rate, % with high quality development plans
Skill Gaps Identified, being closed
65% critical skill Partners with necessary competency levels*
Talent ProcessesSuccession Management, Leadership Development
Career Development, Internal Job Postings, Learning & Development
Employee Engagement, Performance Management, Learning & Development
Talent Planning, Learning & Development, Competency Management
* Sample goal

Copyright © 2012 Bersin & Associates. All rights reserved. Page 18
Decision Support: Focus on Solving Business Problems
Why is turnover high in some areas?
What drives sales productivity?
Why is their fraud in some branches?
What sales or service processes drive account renewal?
What is the training of hiring profile we need to drive greater revenue per customer?
How do we assess the “right” candidates for sales?
What will our talent gaps be next year based on retirement rates?
Copyright © 2012 Bersin & Associates. All rights reserved. Page 19
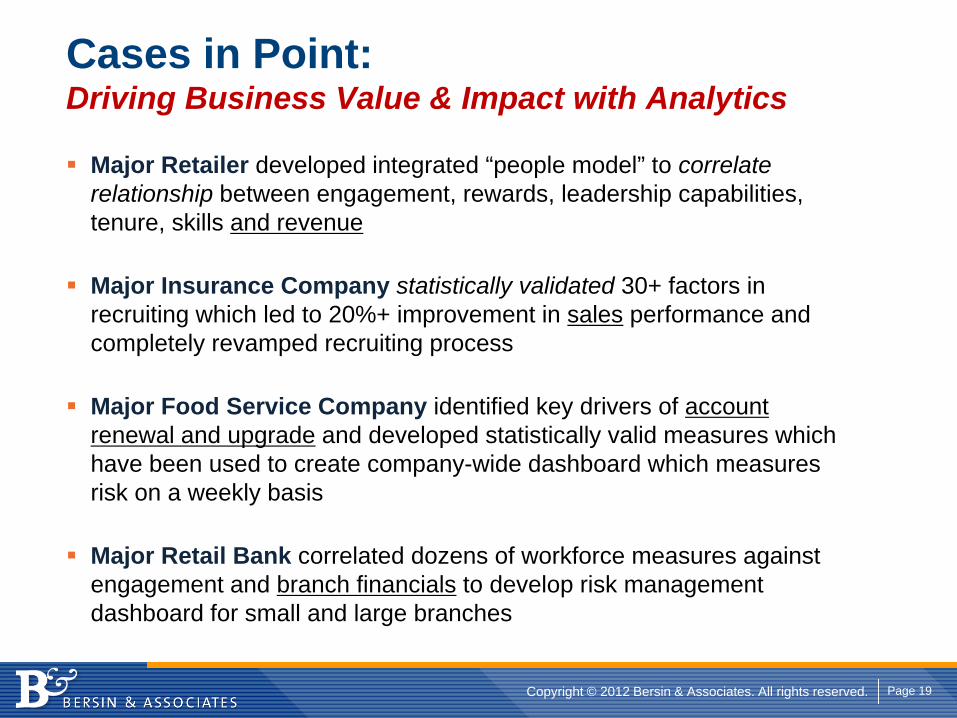
Cases in Point: Driving Business Value & Impact with Analytics
Major Retailer developed integrated “people model” to correlate relationship between engagement, rewards, leadership capabilities, tenure, skills and revenue
Major Insurance Company statistically validated 30+ factors in recruiting which led to 20%+ improvement in sales performance and completely revamped recruiting process
Major Food Service Company identified key drivers of account renewal and upgrade and developed statistically valid measures which have been used to create company-wide dashboard which measures risk on a weekly basis
Major Retail Bank correlated dozens of workforce measures against engagement and branch financials to develop risk management dashboard for small and large branches
Copyright © 2012 Bersin & Associates. All rights reserved. Page 20
THE EVOLUTION OF AN ANALYTICS CAPABILITY

Copyright © 2012 Bersin & Associates. All rights reserved. Page 21
Progression of HR/TM Measurement
HR & Talent Metricsanalyzed againstbusiness metrics
Drives business decisions &
supports forecasts
Business Metrics & Analytics
EmployeeDiversity
Learning Plans
Enterprise Recruiting
Pipelines
PerformanceRatings
Basic Workforce Metrics
Integrated TM Metrics
WorkforcePlans
Talent Plans
Competency Gaps
TalentMobility
Performance Movement
EmployeeEngagement
Career Paths
Employee Satisfaction
TurnoverHiring
Basic HR Metrics
Measure Workforce Metrics & HR Operations : Bersin’s HIHR, 2010
Develop a TM Measurement Strategy
Budget
Copyright © 2012 Bersin & Associates. All rights reserved. Page 22
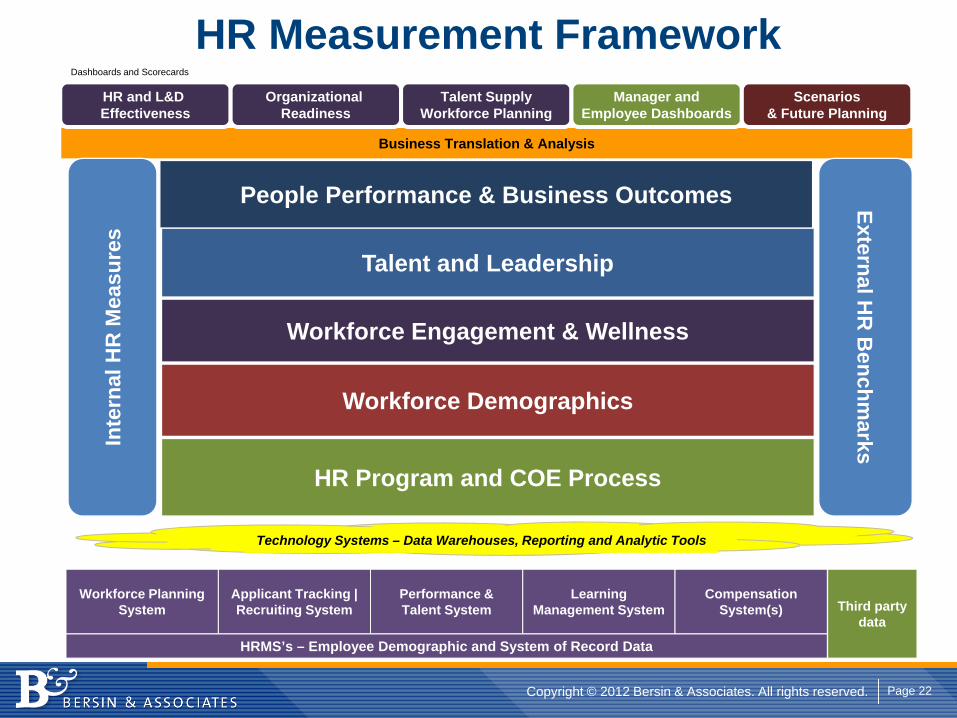
Technology Systems – Data Warehouses, Reporting and Analytic Tools
Business Translation & Analysis
Inte
rnal
HR
Mea
sure
s
HR Program and COE Process
External HR
Benchm
arks
Workforce Demographics
Talent and Leadership
People Performance & Business Outcomes
Workforce Engagement & Wellness
HR Measurement Framework
HRMS’s – Employee Demographic and System of Record Data
Applicant Tracking | Recruiting System
Performance & Talent System
Learning Management System
Compensation System(s)
Workforce Planning System Third party
data
HR and L&D Effectiveness
Organizational Readiness
Talent SupplyWorkforce Planning
Manager andEmployee Dashboards
Scenarios& Future Planning
Dashboards and Scorecards
Copyright © 2012 Bersin & Associates. All rights reserved. Page 23
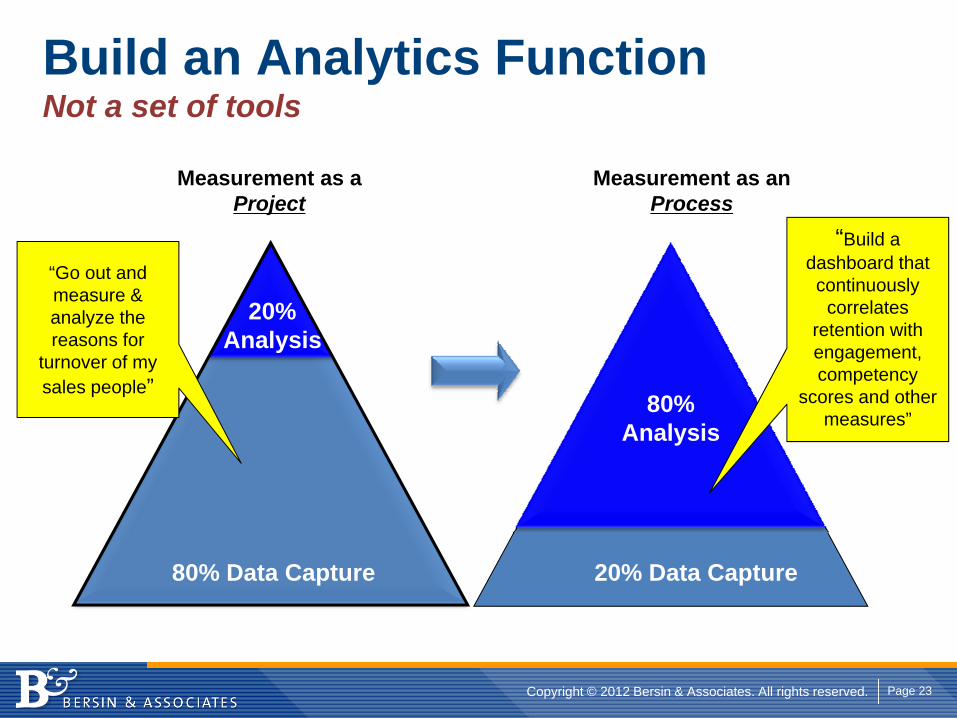
Build an Analytics FunctionNot a set of tools
80% Data Capture
20%Analysis
20% Data Capture
80%Analysis
Measurement as aProject
Measurement as anProcess
“Go out and measure & analyze the reasons for
turnover of my sales people”
“Build a dashboard that continuously
correlates retention with engagement, competency
scores and other measures”
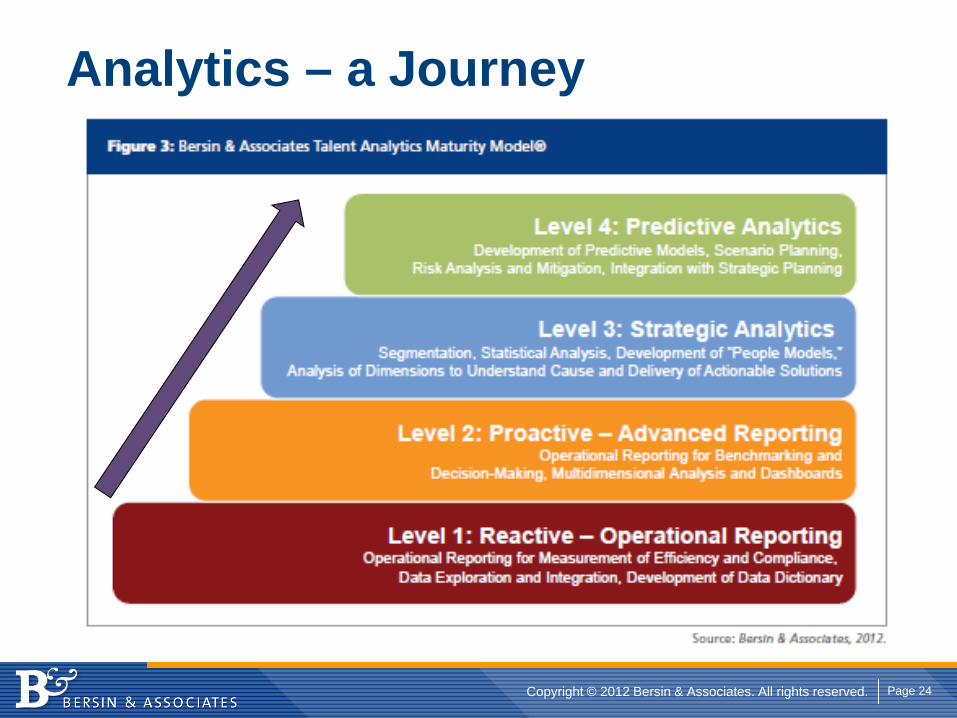
Copyright © 2012 Bersin & Associates. All rights reserved. Page 24
Analytics – a Journey
Copyright © 2012 Bersin & Associates. All rights reserved. Page 25
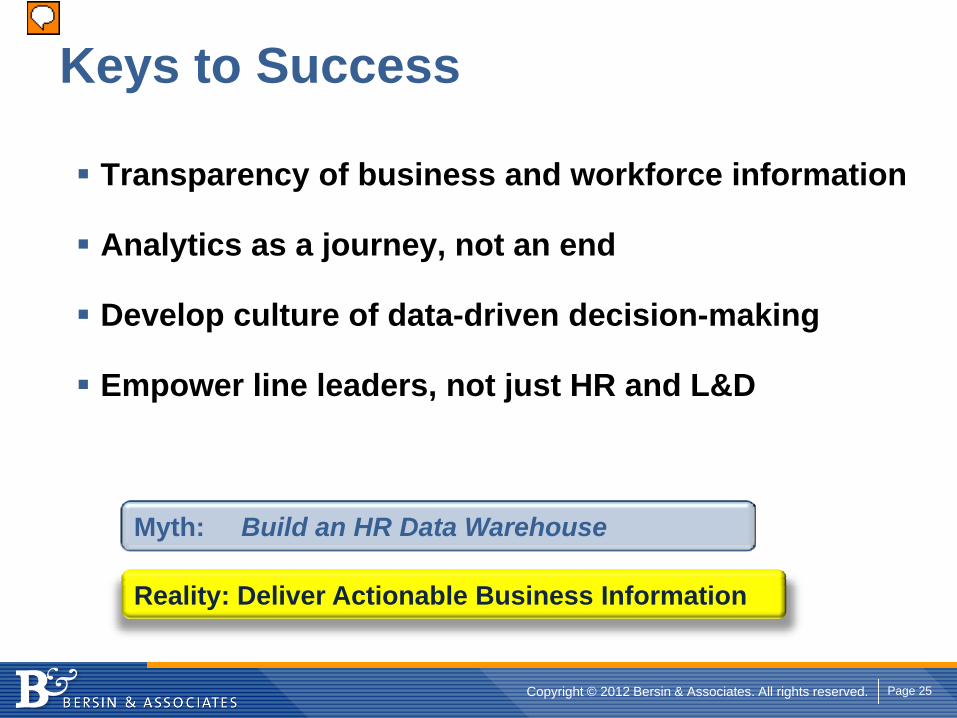
Transparency of business and workforce information
Analytics as a journey, not an end
Develop culture of data-driven decision-making
Empower line leaders, not just HR and L&D
Myth: Build an HR Data Warehouse
Reality: Deliver Actionable Business Information
Keys to Success
Presenter
Presentation Notes
Copyright © 2012 Bersin & Associates. All rights reserved. Page 26
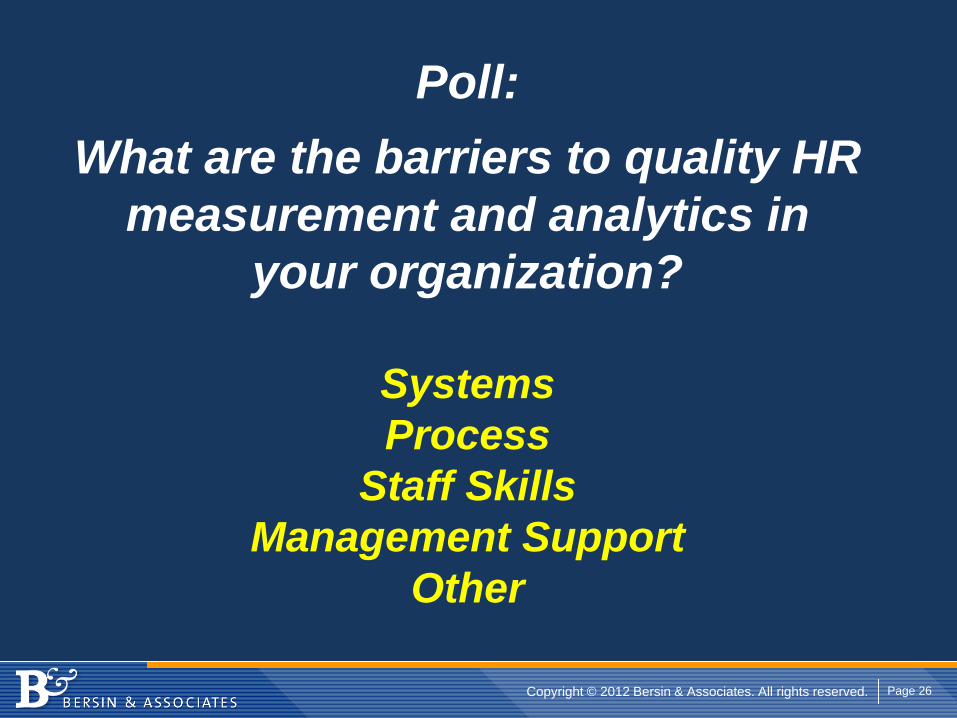
Poll: What are the barriers to quality HR
measurement and analytics in your organization?
SystemsProcess
Staff SkillsManagement Support
Other
Copyright © 2012 Bersin & Associates. All rights reserved. Page 27
SYSTEMS CAPABILITIES

Copyright © 2012 Bersin & Associates. All rights reserved. Page 28
Weakness in HR Systems Solutions
How would you rate your LMS’s ability to obtain the information you need to measure training programs?
How would you rate your Talent Management System’s ability to deliver the talent measures you need?
How would you rate your HRIS system’s ability to deliver the measures you need?
63% Fair or Poor
72% Fair or Poor
17% Good
17% Good
3% Excellent
2% Excellent
82% Fair or Poor14% Good1% Excellent
Copyright © 2012 Bersin & Associates. All rights reserved. Page 29
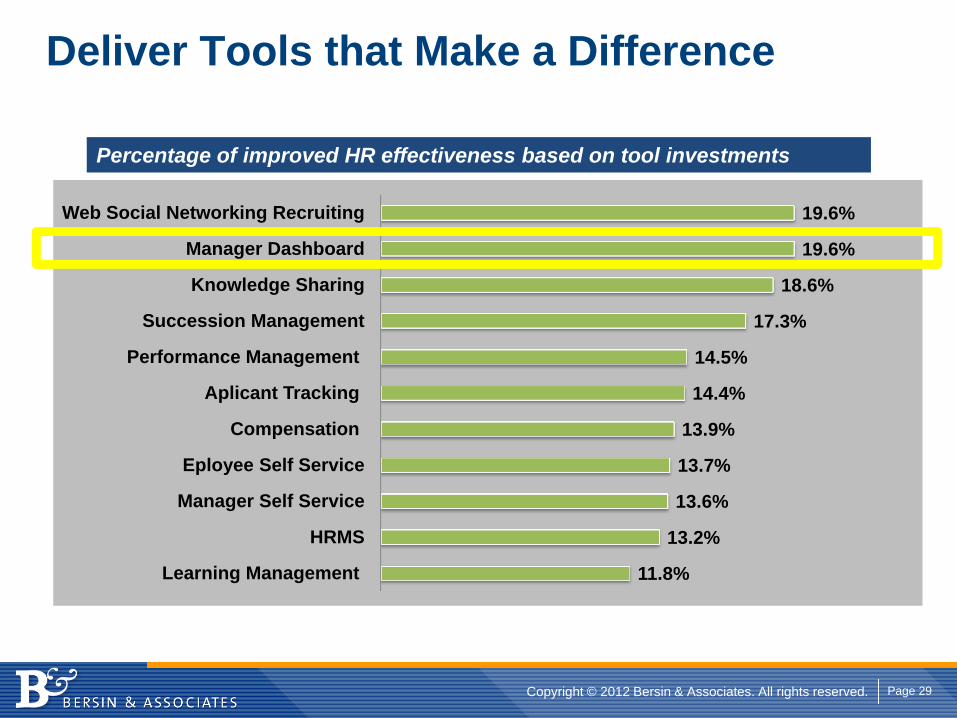
Deliver Tools that Make a Difference
11.8%
13.2%
13.6%
13.7%
13.9%
14.4%
14.5%
17.3%
18.6%
19.6%
19.6%
Learning Management
HRMS
Manager Self Service
Eployee Self Service
Compensation
Aplicant Tracking
Performance Management
Succession Management
Knowledge Sharing
Manager Dashboard
Web Social Networking Recruiting
Percentage of improved HR effectiveness based on tool investments
Copyright © 2012 Bersin & Associates. All rights reserved. Page 30
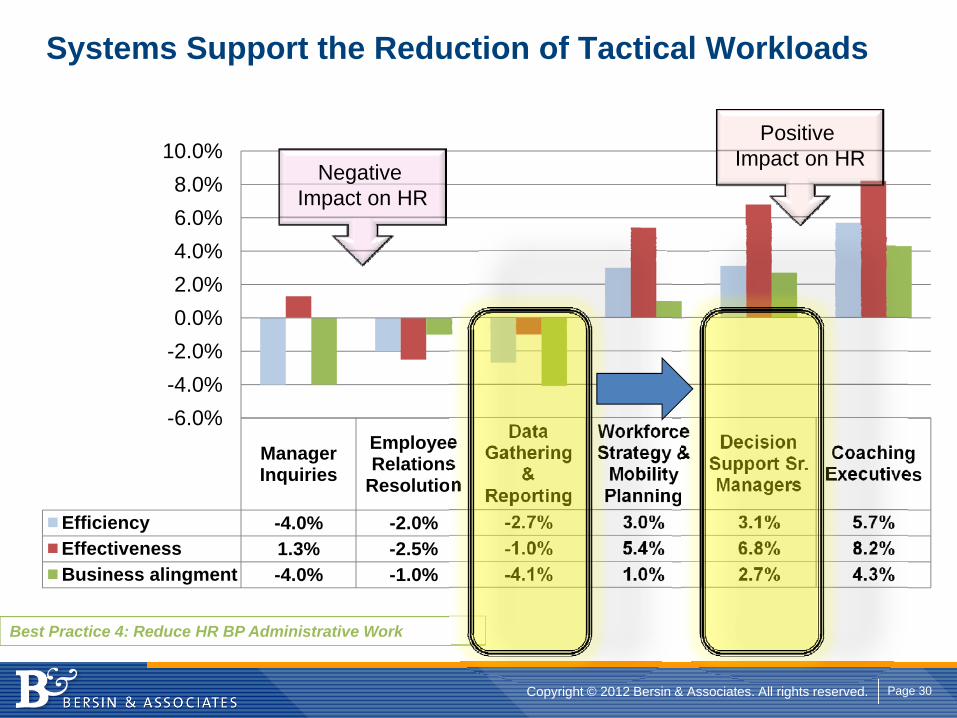
Systems Support the Reduction of Tactical Workloads
Manager Inquiries
Employee Relations
Resolution
Data Gathering
& Reporting
Workforce Strategy &
Mobility Planning
Decision Support Sr. Managers
Coaching Executives
Efficiency -4.0% -2.0% -2.7% 3.0% 3.1% 5.7%Effectiveness 1.3% -2.5% -1.0% 5.4% 6.8% 8.2%Business alingment -4.0% -1.0% -4.1% 1.0% 2.7% 4.3%
-6.0%-4.0%-2.0%0.0%2.0%4.0%6.0%8.0%
10.0%Negative
Impact on HR
Positive Impact on HR
Best Practice 4: Reduce HR BP Administrative Work
Copyright © 2012 Bersin & Associates. All rights reserved. Page 31
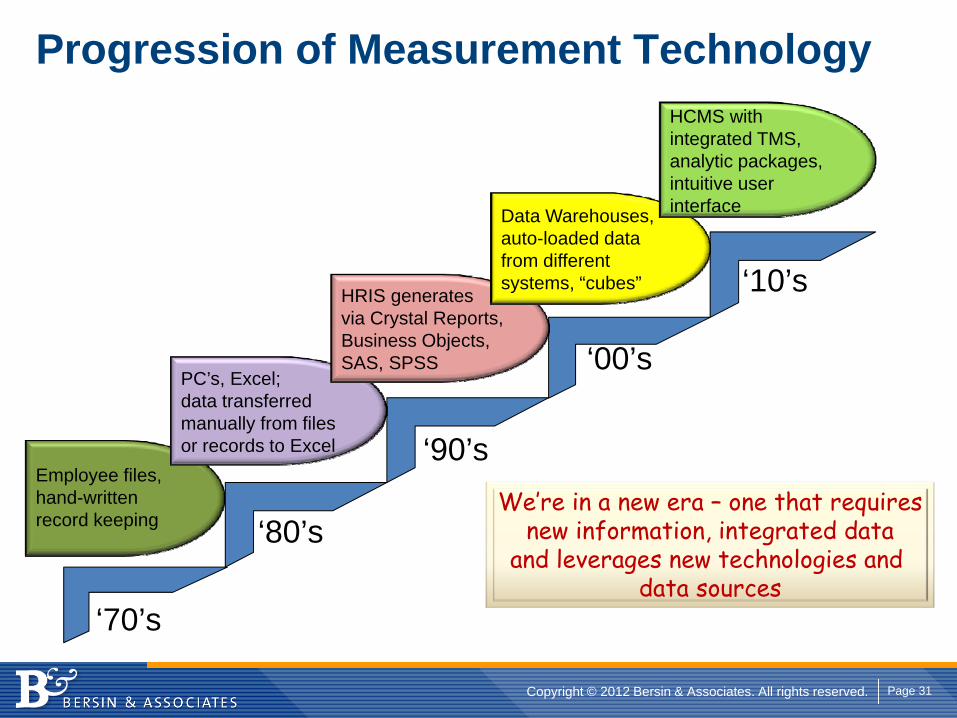
Progression of Measurement Technology
‘70’s
‘80’s
‘90’s
‘00’s
‘10’s
Employee files, hand-written record keeping
PC’s, Excel; data transferred manually from files or records to Excel
HRIS generates via Crystal Reports, Business Objects, SAS, SPSS
Data Warehouses, auto-loaded data from different systems, “cubes”
HCMS with integrated TMS, analytic packages, intuitive user interface
We’re in a new era – one that requiresnew information, integrated data
and leverages new technologies and data sources

Copyright © 2012 Bersin & Associates. All rights reserved. Page 32
0%10%20%30%40%50%60%70%80%90%
100%
Diversity Representation(As of 6/17/2011)
TBS-Non-Minority
TBS-Minority
DiversityInc-Minority
DiversityInc-Non-Minority
0%
20%
40%
60%
80%
100%
Ready Now
Ready in 6
months
Ready in 12
months
Ready in 18
months
Ready in 2 years
Ready in 3 years
Too New To Rate or N/A
Pipeline Readiness(2010 Succession Planning: VPs and Above)
Too New To Rate Under‐Performing Well‐Placed
Growth Potential Highly Promotable
TALENT MANAGEMENT SCORECARD (Q2 2011)
1. Disparity in minority population amongst leadership; non-managers and other positions split approximately 50/50
2. On average, over half of VP+ talent assessed during 2010’s Succession Planning process are ready to assume a new role within the next 12 months
3. Manager effectiveness: SVP & above below current 3.0 average- most likely due to rating scale difference (VPs and above receive either a 1, 2, or 3 numeric rating value whereas ratings for Directors and below can include a decimal value)
4. Males/females represented almost equally in leadership development programs, however, non-minorities still represent more than half of 2011 YTD participants
5. The majority of leadership development program participants experienced no change in job role after participating in one or more programs
6. Turner overall has spent less on training per employee during Q1 as compared to the ASTD/Bersin combined average benchmark (average $81.94/employee across Turner vs. $147/employee)
7. Turner is currently spending .02% of its YTD profit on learning & development; the ASTD benchmark is approximately .4% of quarterly profits
3.2
3.0
2.7
2.7
0.0 1.0 2.0 3.0 4.0 5.0
Dirs/Equivalent by Title
Mgr/Equiv by Title
SVP and above
VPs/Equivalent by Title
Average of EE Engagement, Perf. Ratings, Promos Out of Hierarchy, and Num. of
Terminations
Manager Effectiveness Index
Percentages may not add to 100% due to rounding
49%
51%
0%10%20%30%40%50%60%70%80%90%
100%
Female Male
6%18%8% 1%
66%
0%10%20%30%40%50%60%70%80%90%
100%
ASIAN BLACK HISPA
PACIF WHITE
Gender/Ethnicity Representation in LDPs(YTD 2011)
No Change
74%
Promotion20%
New Position
4%Suspensio
n1%
Job Title Change
1%
Executive Leadership Development Outcomes(YTD 2011)
0
50
100
150
200
1st Qtr 2011 - Training Expense per FTE
Dollars per FTE ASTD/Bersin Benchmark
1 2 3
4 5 6
7
Copyright © 2012 Bersin & Associates. All rights reserved. Page 33
Poll: Are you currently using a talent management technology vendor
for HR Analytics?
YesNo
Not Sure
Presenter
Presentation Notes
As opposed to a separate analytics package outside of your HR systems, such as SAS or SPSS?

Copyright © 2012 Bersin & Associates. All rights reserved. Page 34
Critical Analytics & Technology Questions
Is it easy to understand and implement?
Does it deliver reliable and credible information?
Does it deliver actionable information?
Is it inexpensive to operate and maintain?
Is it flexible to implement and change over time?
Is it relevant to your organization’s specific strategies?
What do organizations do with their HCM Metrics?
How are metrics integrated into HR & Business scorecards?
Who makes use of the HC metrics in the organization?
To whom are HR metrics reported?
Copyright © 2012 Bersin & Associates. All rights reserved. Page 35Copyright © 2012 Bersin & Associates. All rights reserved.
Thank You!Questions or Comments?
email : [email protected]: charles goretsky
For more information about our WhatWorks® Membership, contact us today at [email protected]
Presenter
Presentation Notes
Join Our Next TM Webinar
Tuesday, September 25, 2012•
TM Webinars start at 2 p.m. Eastern / 11 a.m. Pacific
Register for upcoming TM Webinars at www.talentmgt.com/events
Join the Talent Management magazine Networkhttp://network.talentmgt.com/
#TMwebinar
Effective Leadership Assessment: Strategies, Tools & Tips for Success
Related Documents