Slides Produced by Lacy Williams, Joyner Fine Properties www.RichmondHousingToday.com The Greater Richmond Real Estate Market Lacy Williams Joyner Fine Properties March 2015 1

Welcome message from author
This document is posted to help you gain knowledge. Please leave a comment to let me know what you think about it! Share it to your friends and learn new things together.
Transcript

Slides Produced by Lacy Williams, Joyner Fine Properties
www.RichmondHousingToday.com
The Greater Richmond Real
Estate MarketLacy Williams
Joyner Fine Properties
March 2015
11

Slides Produced by Lacy Williams, Joyner Fine Properties
www.RichmondHousingToday.com
Background
• This report is designed to provide information on the Richmond VA housing Market as well as the National Market.
• Graphs in this report on the National Market are obtained from Keeping Current Matters and from the National Association of Realtors (NAR). For additional information on Keeping Current Matters, or to subscribe to this service, please go to www.KeepingCurrentMatters.com. For additional information on the National Association of Realtors, go to www.realtor.org.
• The graphs and analysis of the Richmond area are produced by Lacy Williams of Joyner Fine Properties using the Central Virginia Regional Multiple Listing Service (CVRMLS) data. Data was extracted in March 2015for most of the graphs. The Greater Richmond area is defined as the city of Richmond and the counties of Henrico, Chesterfield, Hanover, Goochland and Powhatan.
22

Slides Produced by Lacy Williams, Joyner Fine Properties
www.RichmondHousingToday.com
National
Economic Data
33
Slides Produced by Lacy Williams, Joyner Fine Properties
www.RichmondHousingToday.com
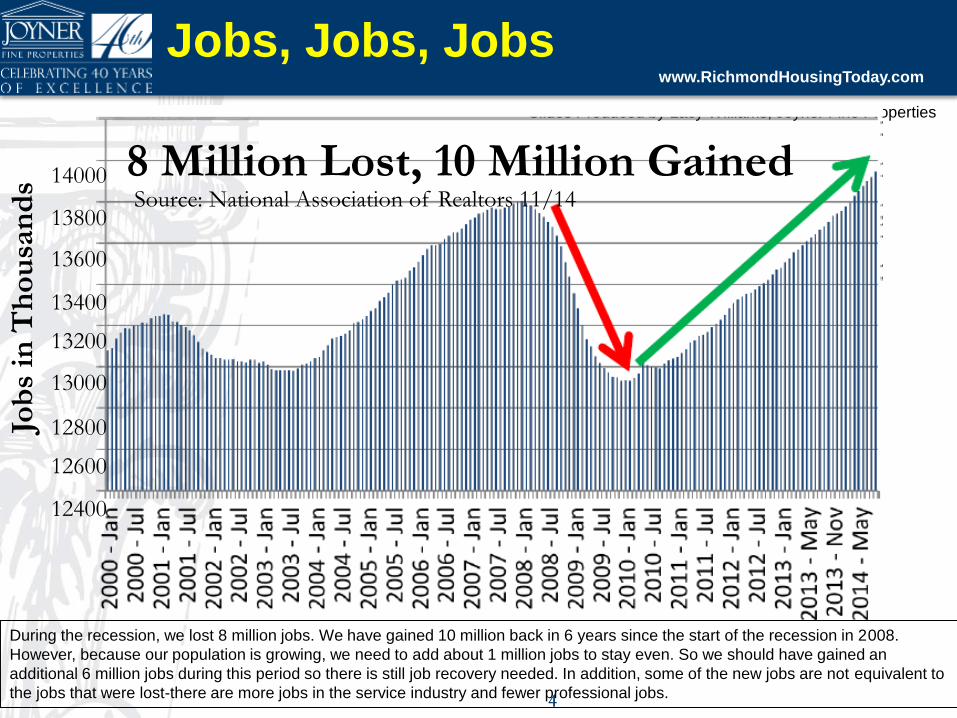
8 Million Lost, 10 Million Gained
44
Jobs, Jobs, Jobs
During the recession, we lost 8 million jobs. We have gained 10 million back in 6 years since the start of the recession in 2008.
However, because our population is growing, we need to add about 1 million jobs to stay even. So we should have gained an
additional 6 million jobs during this period so there is still job recovery needed. In addition, some of the new jobs are not equivalent to
the jobs that were lost-there are more jobs in the service industry and fewer professional jobs.
12400
13400
13200
13000
12800
12600
13800
13600
14000
Job
s in
Th
ou
san
ds
Source: National Association of Realtors 11/14

Slides Produced by Lacy Williams, Joyner Fine Properties
www.RichmondHousingToday.com
55
Employment Rate
Source: National Association of Realtors 11/14
The Employment Rate is the number of people working. It is a better indicator of the economy than the Unemployment Rate
which has to do with the number of people actually looking for a job. The Unemployment Rate does not include unemployed
people who have quit looking for jobs. The Employment Rate is significantly down since before the 2008 Recession.

Slides Produced by Lacy Williams, Joyner Fine Properties
www.RichmondHousingToday.com
66
Employment by State
Source: National Association of Realtors 11/14
Slides Produced by Lacy Williams, Joyner Fine Properties
www.RichmondHousingToday.com
77
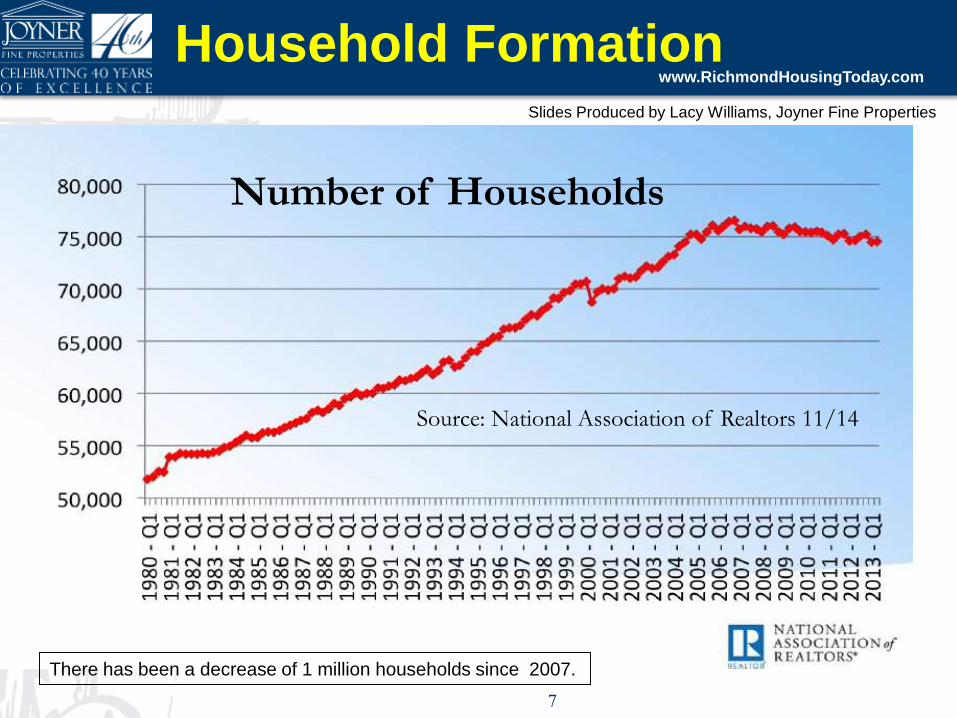
Household Formation
There has been a decrease of 1 million households since 2007.
Number of Households
Source: National Association of Realtors 11/14

Slides Produced by Lacy Williams, Joyner Fine Properties
www.RichmondHousingToday.com
1.147M
973K
-205K
2.001M
Long Term Average December 2012 December 2013 December 2014
HOUSEHOLD FORMATIONS
Source: Keeping Current Matters 2/15

Slides Produced by Lacy Williams, Joyner Fine Properties
www.RichmondHousingToday.com
99
US Oil Prices

Slides Produced by Lacy Williams, Joyner Fine Properties
www.RichmondHousingToday.com
50
55
60
65
70
75
80
85
90
95
100
2005 2006 2007 2008 2009 2010 2011 2012 2013 2014 2015
Michigan’s Surveys of Consumers
Consumer Optimism Hits 11-Year High
Source: Keeping Current Matters 2/15

Slides Produced by Lacy Williams, Joyner Fine Properties
www.RichmondHousingToday.com
National
Number of Sales
1111

Slides Produced by Lacy Williams, Joyner Fine Properties
www.RichmondHousingToday.com
NAR 1/2015
Home Sales By YearSource: NAR 2/15
National Home Sales By Year

Slides Produced by Lacy Williams, Joyner Fine Properties
www.RichmondHousingToday.com
-4.4%
8.9%
16% 15.7%
10.4%
5.2%
$0-100K $100-250K $250-500K $500-750K $750K-1M $1M+
% -4.4% 8.9% 16.0% 15.7% 10.4% 5.2%
% Change in Sales from last year
by Price Range
Source: Keeping Current Matters 2/15

Slides Produced by Lacy Williams, Joyner Fine Properties
www.RichmondHousingToday.com
Jan2012
Feb Mar Apr May Jun Jul Aug Sep Oct Nov Dec Jan2013
Feb Mar Apr May Jun Jul Aug Sep Oct Nov Dec Jan2014
Feb Mar Apr May Jun Jul Aug Sep Oct Nov Dec
Percentage of Distressed Property Sales35%
11%
NAR 1/2015
January 2012 - Today
35%
14%
Source: Keeping Current Matters 2/15
Slides Produced by Lacy Williams, Joyner Fine Properties
www.RichmondHousingToday.com
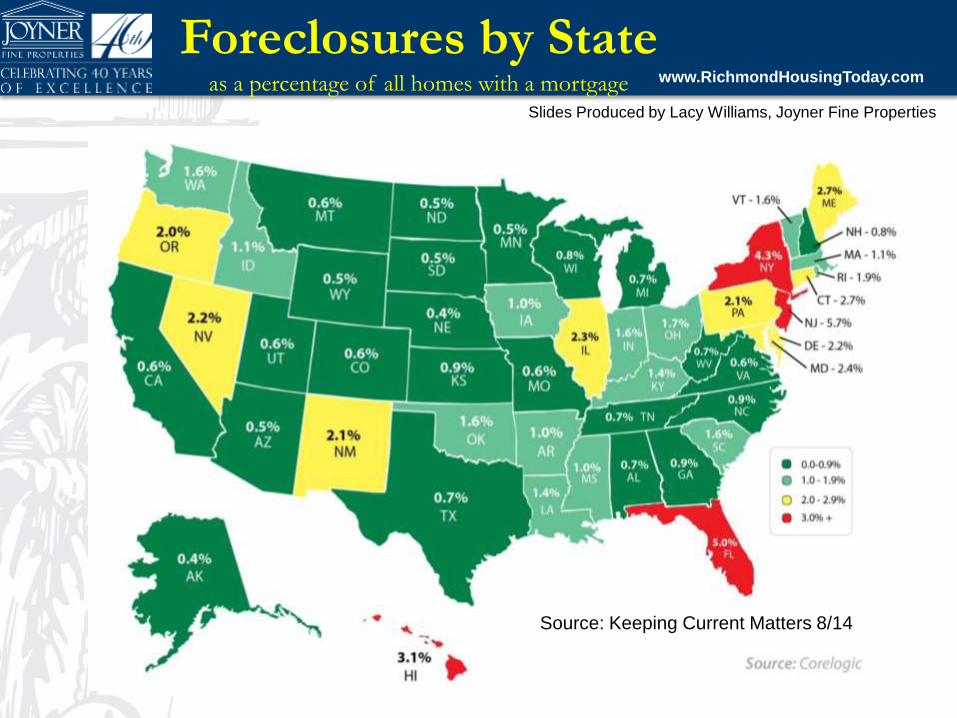
Foreclosures by Stateas a percentage of all homes with a mortgage
Source: Keeping Current Matters 8/14

Slides Produced by Lacy Williams, Joyner Fine Properties
www.RichmondHousingToday.com
1616
Single Family Housing Starts
Housing Starts
200
1400
1200
1000
800
600
400
1600
Ho
usi
ng
Sta
rts
in T
ho
usa
nd
s
Source: National Association of Realtors 11/14
New Construction is still significantly down. The
Construction industry creates many jobs. This is an
area that is expected to improve in 2015.
Slides Produced by Lacy Williams, Joyner Fine Properties
www.RichmondHousingToday.com
1717
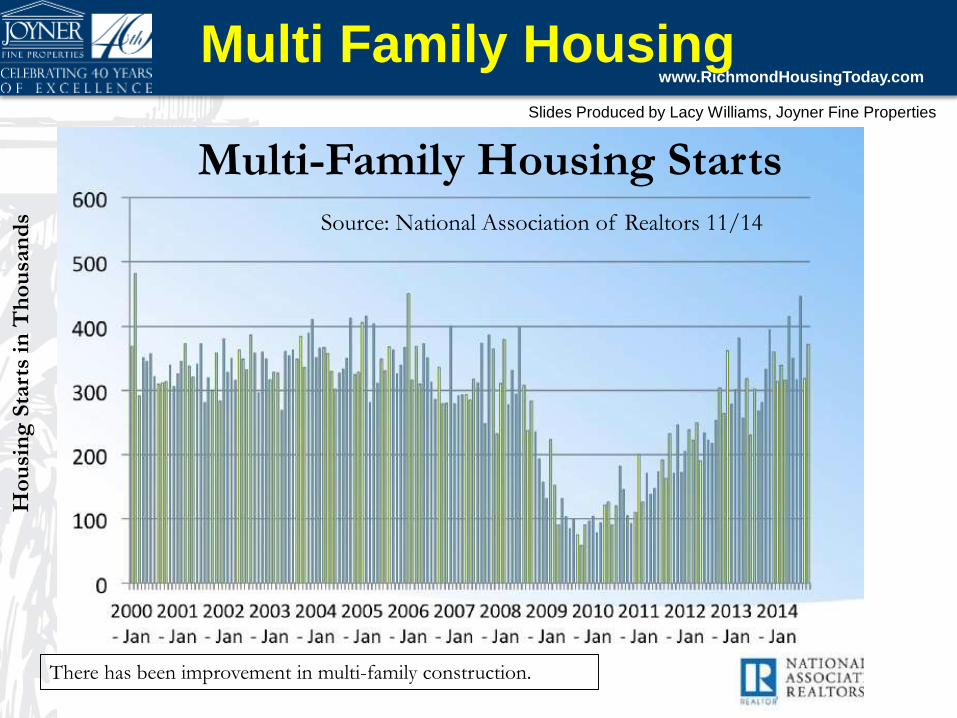
Multi Family Housing
Multi-Family Housing Starts
Ho
usi
ng
Sta
rts
in T
ho
usa
nd
s Source: National Association of Realtors 11/14
There has been improvement in multi-family construction.
Slides Produced by Lacy Williams, Joyner Fine Properties
www.RichmondHousingToday.com
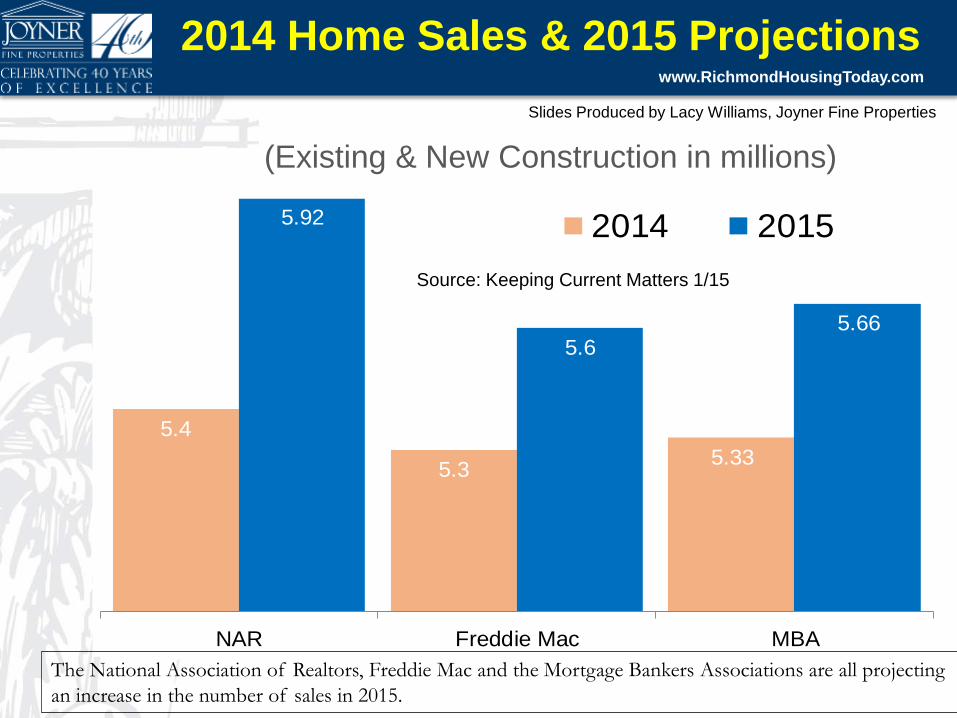
5.4
5.35.33
5.92
5.65.66
NAR Freddie Mac MBA
2014 2015
2014 Home Sales & 2015 Projections
(Existing & New Construction in millions)
Source: Keeping Current Matters 1/15
The National Association of Realtors, Freddie Mac and the Mortgage Bankers Associations are all projecting
an increase in the number of sales in 2015.

Slides Produced by Lacy Williams, Joyner Fine Properties
www.RichmondHousingToday.com
1919
Homeownership Rate
Lowest in 30+ years!.
US Homeownership Rate
Source: National Association of Realtors 11/14

Slides Produced by Lacy Williams, Joyner Fine Properties
www.RichmondHousingToday.com
2020
Rentals Have Had Huge Increases
Number of Rental Units
Source: National Association of Realtors 11/14
There has been an increase in rental households since 2004. Once these people start buying houses,
the real estate market will greatly improve..
Slides Produced by Lacy Williams, Joyner Fine Properties
www.RichmondHousingToday.com
2121
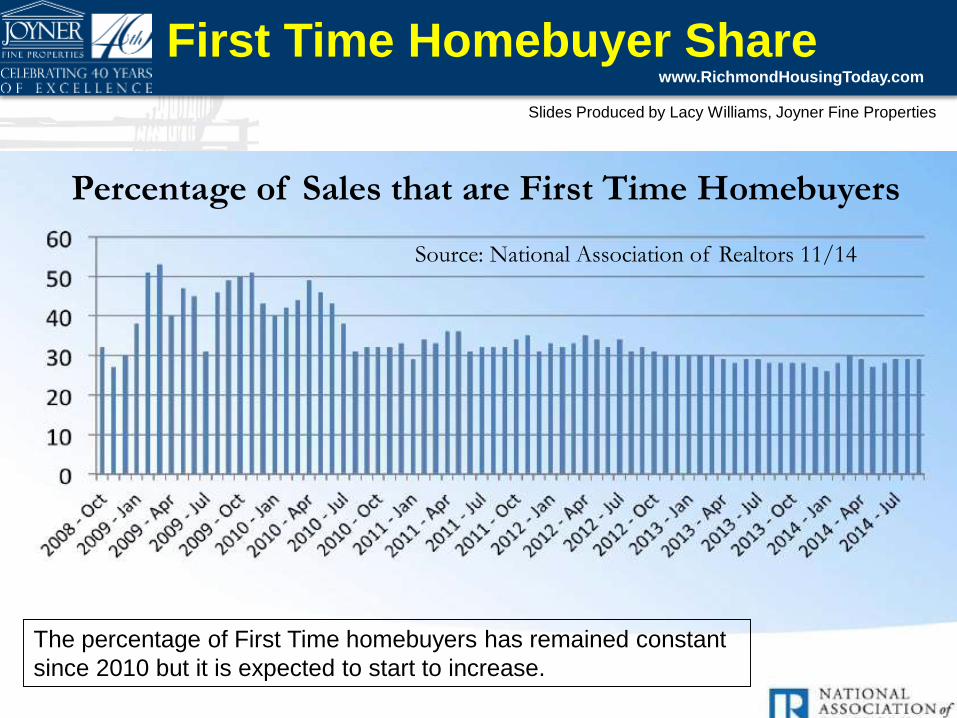
First Time Homebuyer Share
Lowest rate since 1987!
Source: National Association of Realtors 11/14
Percentage of Sales that are First Time Homebuyers
The percentage of First Time homebuyers has remained constant
since 2010 but it is expected to start to increase.
Source: National Association of Realtors 11/14

Slides Produced by Lacy Williams, Joyner Fine Properties
www.RichmondHousingToday.com
31%
47%58%
Age 18-24 Age 25-34 Age 35-44
Renters Planning on Buying a Home
Freddie Mac
in the next 3 years by age group
Source: Keeping Current Matters 2/15

Slides Produced by Lacy Williams, Joyner Fine Properties
www.RichmondHousingToday.com
4
5
6
7
8
9
10
11
2001 2002 2003 2004 2005 2006 2007 2008 2009 2010 2011 2012 2013 2014
Historically, number of years home sellers lived in their homes
Pent Up Seller Demand
Pent Up
Seller Demand
Source: Keeping Current Matters 2/15

Slides Produced by Lacy Williams, Joyner Fine Properties
www.RichmondHousingToday.com
Inventory of Homes
2424

Slides Produced by Lacy Williams, Joyner Fine Properties
www.RichmondHousingToday.com
The Impact of Monthly Housing
Inventory on Home Prices
LESS THAN
6 MONTHS
BETWEEN
6 MONTHS
GREATER THAN
7 MONTHS
SELLERS
MARKETHomes prices
will appreciate
NEUTRAL
MARKETHomes prices
will only
appreciate with
inflation
BUYERS
MARKETHomes prices
will depreciate
Source: Keeping Current Matters 7/14
Inventory is the average mount of time it takes to sell a house. A balanced market is an inventory of about 6 months. If inventory is
less than 6 months, A Sellers market occurs with appreciating prices. If inventory is above 7 months, A Buyers market occurs with
depreciating prices. .

Slides Produced by Lacy Williams, Joyner Fine Properties
www.RichmondHousingToday.com
Lawrence Yun, NAR’s Chief Economist
Months supply (Inventory) is
already low at 4.4 months.
More inventories are needed,
not less. Or else, home prices
could re-accelerate.”
Inventory and Home Prices
Source: Keeping Current Matters 2/15
Slides Produced by Lacy Williams, Joyner Fine Properties
www.RichmondHousingToday.com
Prices
2727

Slides Produced by Lacy Williams, Joyner Fine Properties
www.RichmondHousingToday.com
2828
Median Home Price
realtor.org 5/2014
*projected
Source: Keeping Current Matters 6/14
Nationwide, prices have risen for three straight years.
Slides Produced by Lacy Williams, Joyner Fine Properties
www.RichmondHousingToday.com
-10.0%
-8.0%
-6.0%
-4.0%
-2.0%
0.0%
2.0%
4.0%
6.0%
8.0%
10.0%
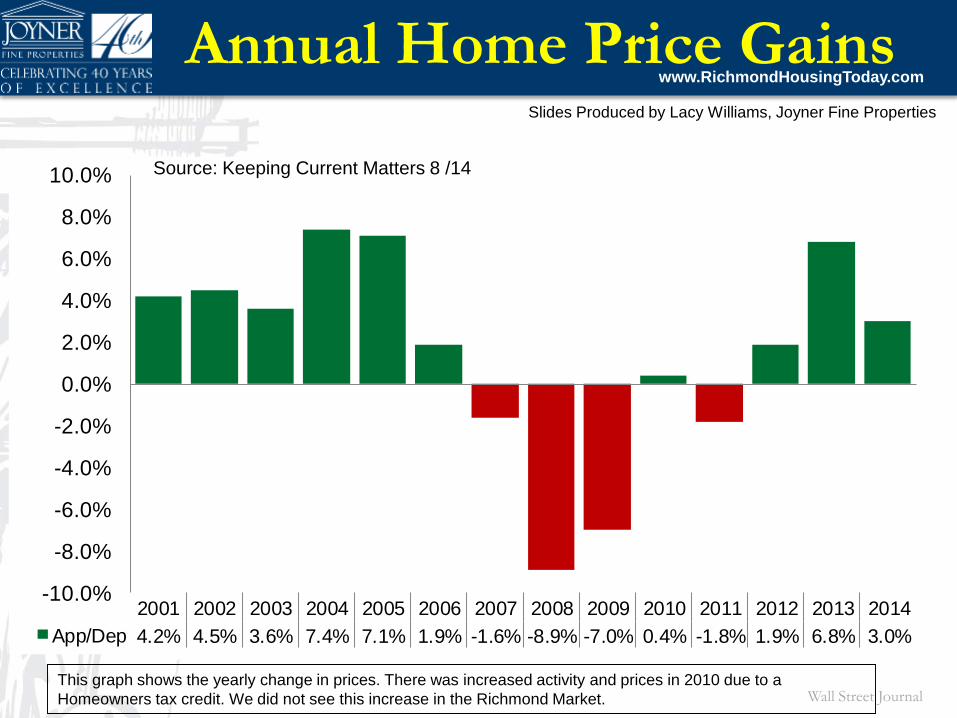
2001 2002 2003 2004 2005 2006 2007 2008 2009 2010 2011 2012 2013 2014
App/Dep 4.2% 4.5% 3.6% 7.4% 7.1% 1.9% -1.6% -8.9% -7.0% 0.4% -1.8% 1.9% 6.8% 3.0%
Annual Home Price Gains
Wall Street Journal
Source: Keeping Current Matters 8 /14
This graph shows the yearly change in prices. There was increased activity and prices in 2010 due to a
Homeowners tax credit. We did not see this increase in the Richmond Market.

Slides Produced by Lacy Williams, Joyner Fine Properties
www.RichmondHousingToday.com
12-Month Home Price Change
CoreLogic Market Pulse 8.2014
Source: Keeping Current Matters 9/14

Slides Produced by Lacy Williams, Joyner Fine Properties
www.RichmondHousingToday.com
Prices Back to 2005 1Q Prices
Case Shiller 8/2014
100
110
120
130
140
150
160
170
180
190
200
2000 2001 2002 2003 2004 2005 2006 2007 2008 2009 2010 2011 2012 2013 2014
Nationwide, prices are at 1Q 2005 prices..
Source: Keeping Current Matters 9/14

Slides Produced by Lacy Williams, Joyner Fine Properties
www.RichmondHousingToday.com
Prices & Time Since The Peak
CoreLogic Market Pulse 8.2014
Source: Keeping Current Matters 9/14
In some states, prices are still significantly down from
peak prices.

Slides Produced by Lacy Williams, Joyner Fine Properties
www.RichmondHousingToday.com
3333 Home Price Expectation Survey 2014 2Q
PROJECTED Percentage Appreciation
Source: Keeping Current Matters 6/14
A panel of 100 leading housing experts has projected normal price rises for the next five years.
Slides Produced by Lacy Williams, Joyner Fine Properties
www.RichmondHousingToday.com
The Interest Rate
3434

Slides Produced by Lacy Williams, Joyner Fine Properties
www.RichmondHousingToday.com
QuarterFannie
Mae
Freddie
MacMBA NAR
Average of all four
2015 1Q 3.9% 3.9% 3.9% 3.8% 3.88%
2015 2Q 4.0% 4.1% 4.3% 4.0% 4.10%
2015 3Q 4.1% 4.3% 4.7% 4.3% 4.35%
2015 4Q 4.2% 4.5% 4.8% 4.7% 4.55%
Mortgage Rate Projections
1/2015
Source: Keeping Current Matters 2/15
Slides Produced by Lacy Williams, Joyner Fine Properties
www.RichmondHousingToday.com
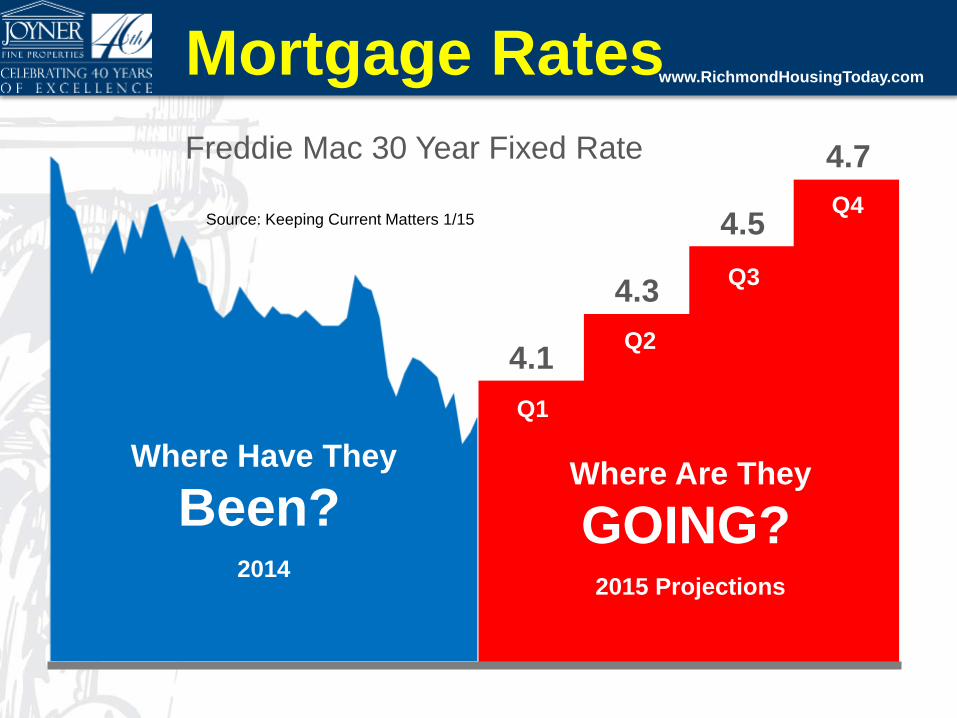
4.1
4.3
4.5
4.7
Where Are They
GOING?2015 Projections
Q1
Q2
Q3
Q4
Where Have They
Been?2014
Mortgage Rates
Freddie Mac 30 Year Fixed Rate
Source: Keeping Current Matters 1/15
Slides Produced by Lacy Williams, Joyner Fine Properties
www.RichmondHousingToday.com
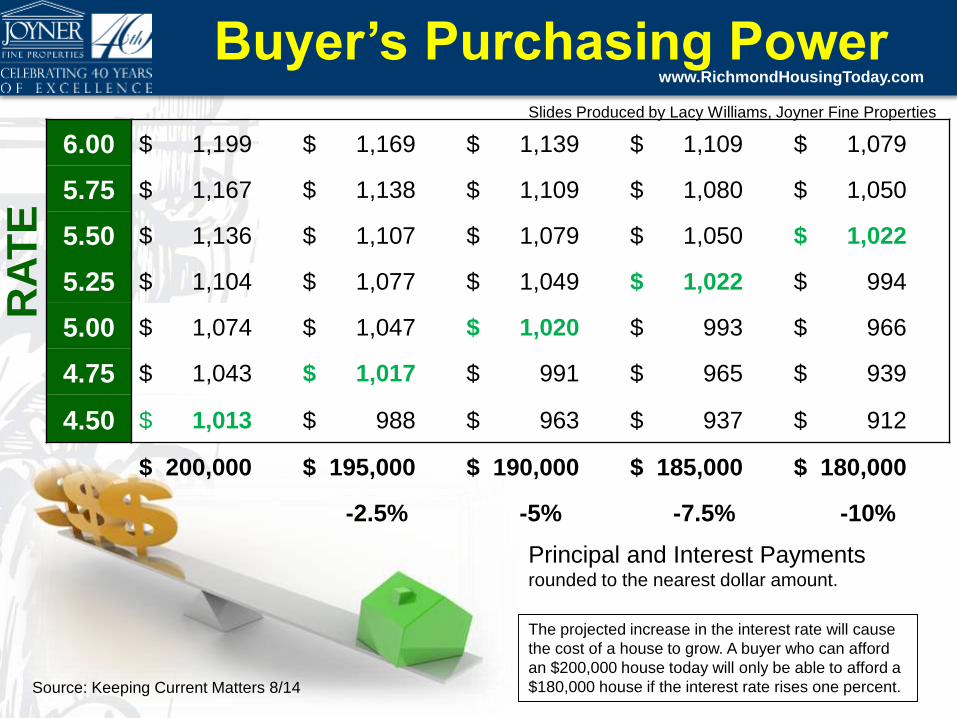
6.00 $ 1,199 $ 1,169 $ 1,139 $ 1,109 $ 1,079
5.75 $ 1,167 $ 1,138 $ 1,109 $ 1,080 $ 1,050
5.50 $ 1,136 $ 1,107 $ 1,079 $ 1,050 $ 1,022
5.25 $ 1,104 $ 1,077 $ 1,049 $ 1,022 $ 994
5.00 $ 1,074 $ 1,047 $ 1,020 $ 993 $ 966
4.75 $ 1,043 $ 1,017 $ 991 $ 965 $ 939
4.50 $ 1,013 $ 988 $ 963 $ 937 $ 912
$ 200,000 $ 195,000 $ 190,000 $ 185,000 $ 180,000
-2.5% -5% -7.5% -10%
Buyer’s Purchasing PowerR
AT
E
Principal and Interest Payments rounded to the nearest dollar amount.
The projected increase in the interest rate will cause
the cost of a house to grow. A buyer who can afford
an $200,000 house today will only be able to afford a
$180,000 house if the interest rate rises one percent.Source: Keeping Current Matters 8/14

Slides Produced by Lacy Williams, Joyner Fine Properties
www.RichmondHousingToday.com
38
All-Cash Buyers Have Stayed High … even when mortgages are cheap
38
(Cash share as % of total home sales) Source: National Association of Realtors
Even though the interest rate is historically low, the number of cash buyers has stayed well above the historical average.
Slides Produced by Lacy Williams, Joyner Fine Properties
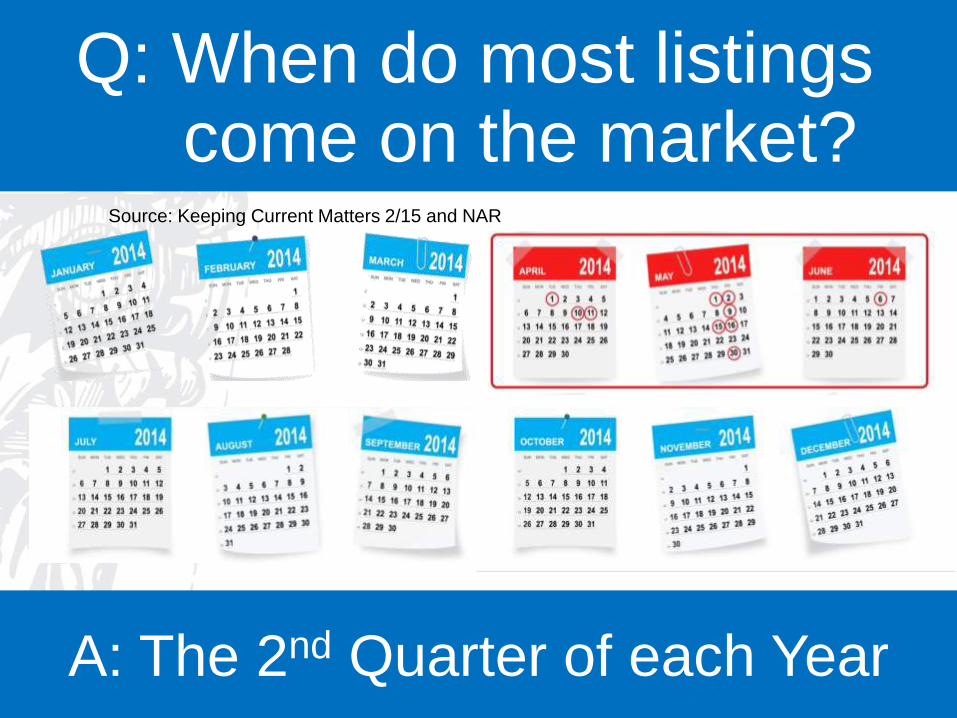
www.RichmondHousingToday.comQ: When do most listingscome on the market?
A: The 2nd Quarter of each Year
Source: Keeping Current Matters 2/15 and NAR

Slides Produced by Lacy Williams, Joyner Fine Properties
www.RichmondHousingToday.com
Greater Richmond
Housing Market
4040
Note: All Greater Richmond graphs include the city of
Richmond and the counties of Henrico, Hanover, Chesterfield,
Goochland and Powhatan. All data is taken from the Central
Virginia Regional Multiple List Service (CVRMLS)
Slides Produced by Lacy Williams, Joyner Fine Properties
www.RichmondHousingToday.com
Market Indicator #1:
Sales are Up!!!
4141

Slides Produced by Lacy Williams, Joyner Fine Properties
www.RichmondHousingToday.com
12737
15262 15533
16450
15074
12644
94829069
85749051
1017710545
11400
0
2000
4000
6000
8000
10000
12000
14000
16000
18000
2002 2003 2004 2005 2006 2007 2008 2009 2010 2011 2012 2013 2014
No
of
Clo
sed
Sale
s
Year
Greater Richmond Single Family Sales by Year
Number of Single Family House Sales by Year
4242
The number of single sales dropped every year from 2005 to 2010. The number of sales in 2010 was approximately half
of the number of sales in 2005. After 5 straight years of declining sales, the number of sales in 2011 was 5.5% higher than
2010 and 2012 sales were 12.5 % higher than 2011 sales. Between 2010 and 2013, sales increased 23%. And Sales in
2014 were 8% higher than 2013!!
Source: CVRMLS data 1/15/15

Slides Produced by Lacy Williams, Joyner Fine Properties
www.RichmondHousingToday.com
Greater Richmond Single Family Sales
2014 sales have been slightly more than 2013 sales with monthly variations. Note: the sharp drop in sales in July 2010 was
when the Federal Homebuyers tax credit expired. The tax credit was in effect in the first half of 2010.
Source: CVRMLS data
400
500
600
700
800
900
1000
1100
1200
1300
1400
Jan Feb Mar Apr May Jun Jul Aug Sept Oct Nov Dec
Greater Richmond Single Family Sales by Month and Year
2012
2013
2014
2015
Slides Produced by Lacy Williams, Joyner Fine Properties
www.RichmondHousingToday.com
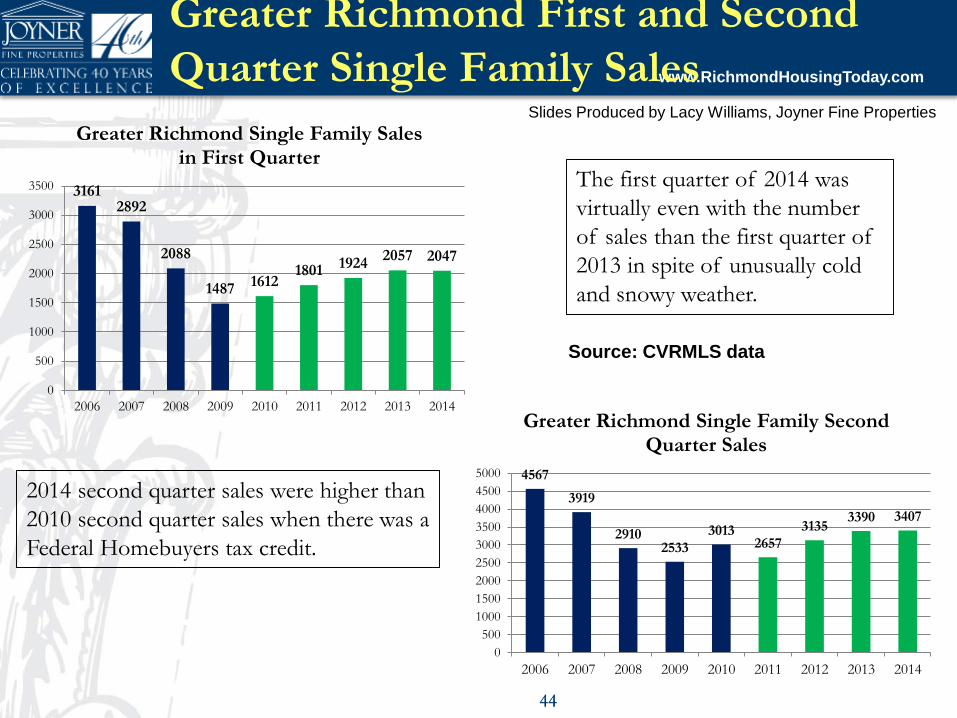
4444
The first quarter of 2014 was
virtually even with the number
of sales than the first quarter of
2013 in spite of unusually cold
and snowy weather.
Greater Richmond First and Second
Quarter Single Family Sales
2014 second quarter sales were higher than
2010 second quarter sales when there was a
Federal Homebuyers tax credit.
Source: CVRMLS data
31612892
2088
1487 16121801 1924
2057 2047
0
500
1000
1500
2000
2500
3000
3500
2006 2007 2008 2009 2010 2011 2012 2013 2014
Greater Richmond Single Family Sales in First Quarter
4567
3919
29102533
30132657
31353390 3407
0
500
1000
1500
2000
2500
3000
3500
4000
4500
5000
2006 2007 2008 2009 2010 2011 2012 2013 2014
Greater Richmond Single Family Second Quarter Sales

Slides Produced by Lacy Williams, Joyner Fine Properties
www.RichmondHousingToday.com
Greater Richmond Single Family Third
and Fourth Quarter Sales
4545
Sales in the third quarter of 2014
were slightly lower than 2013
sales but are 60% higher than
2010 third quarter sales.
Sales in the fourth quarter of
2014 were higher than the past
seven years and 8% higher than
2012 fourth quarter sales.
Source: CVRMLS data
3222
2362
1707
2357
18472134
23472547 2672
0
500
1000
1500
2000
2500
3000
3500
2006 2007 2008 2009 2010 2011 2012 2013 2014
Greater Richmond Single Family Fourth Quarter Sales
4111
3421
25262692
1999
25082793
3304 3274
0
500
1000
1500
2000
2500
3000
3500
4000
4500
2006 2007 2008 2009 2010 2011 2012 2013 2014
Clo
sed
Sale
s
Year
Greater Richmond Single Family Third Quarter Sales

Slides Produced by Lacy Williams, Joyner Fine Properties
www.RichmondHousingToday.com
Condominium Sales in Greater Richmond
4646
In the condominium/townhouse market, after 4 years of dropping sales, sales have increased
for three years and 2014 sales were just under 2013 sales.
Source: CVRMLS data 1/15/15
914
1147
1383
1761
2035
1757
1382
11541093
1201
1420
1623 1587
0
500
1000
1500
2000
2500
2002 2003 2004 2005 2006 2007 2008 2009 2010 2011 2012 2013 2014
Greater Richmond Condominium/Townhouse Sales by Year

Slides Produced by Lacy Williams, Joyner Fine Properties
www.RichmondHousingToday.com
Condominium Sales:
First and Second Quarters
4747
Condominium sales in the first quarter
of 2014 were down from the first
quarter of 2013 but still higher than
2009, 2010 and 2011. The first quarter
of 2014 had very cold and snowy
weather that affected the real estate
market.
Condominium sales in the second
quarter of 2014 were higher than the
past 6 years including 2010 when there
was a Federal homebuyers tax credit.
Source: CVRMLS data
428
376
310
190 189
242275
298280
0
50
100
150
200
250
300
350
400
450
2006 2007 2008 2009 2010 2011 2012 2013 2014
Greater Richmond First Quarter Condominium Sales
601
529
420
324
431
344
402
464 478
0
100
200
300
400
500
600
700
2006 2007 2008 2009 2010 2011 2012 2013 2014
Greater Richmond Townhouse/Condominium Sales for Second Quarter

Slides Produced by Lacy Williams, Joyner Fine Properties
www.RichmondHousingToday.com
4848
Source: CVRMLS data
Third quarter sales in 2014 were slightly
lower than 2013 third quarter sales.. Third
quarter sales in 2013 were 103% higher
than third quarter sales in 2010.
Sales in the fourth quarter of 2014 were
23 less than the fourth quarter of 2013
and 65% more sales than the fourth
quarter of 2010. Note that there was a
Homebuyers tax credit in the later part of
2009
Condominium Sales – Third and Fourth Quarters
578499
355 345
219
325393
466 457
0
100
200
300
400
500
600
700
2006 2007 2008 2009 2010 2011 2012 2013 2014
Greater Richmond Third Quarter Condominium/Townhouse Sales
424
339
233288
225
287338
395 372
0
50
100
150
200
250
300
350
400
450
2006 2007 2008 2009 2010 2011 2012 2013 2014
No
of
Clo
sed
Sale
s
Year
Fourth Quarter Greater Richmond Condominium Sales

Slides Produced by Lacy Williams, Joyner Fine Properties
www.RichmondHousingToday.com
Year Over Year Change in Number of Sales
4949
Source: CVRMLS 1/15/15
Greater Richmond Year Over Year Sales By
Price Range
1/13-
12/13
1/14-
12-14 Change
0-$249,000 7048 6710 -4.80%
$250,000-$499,000 3508 3801 8.35%
$500,000-$749,000 623 617 -0.96%
$750,000-$999,999 125 164 31.20%
$1,000,000+ 49 73 48.98%
Single Family and Condominium/Townhouse
sales by price range show that there was a
decline in the number of sales at the lower
price points. This is thought to be due to the
decline of Distressed Sales. Note that in both
Single Family and Townhouse.Condo sales,
there is a dramatic increase in sales at the
highest price points.
Greater Richmond Year Over Year
Condo/Townhouse Sales By Price Range
1/13-
12/13
1/14-
12/14 Change
0-249,000 1102 1049 -4.81%
$250,000-$499,000 447 451 0.89%
$500,000+ 68 83 22.06%

Slides Produced by Lacy Williams, Joyner Fine Properties
www.RichmondHousingToday.com
0
1000
2000
3000
4000
5000
6000
2004 2005 2006 2007 2008 2009 2010 2011 2012 2013 2014
43854694
3917
2913
20951624 1428 1380 1537
2022 1981
757
1062
1183
1419
1079
655675 573
591
741606
No
of
Clo
sin
gs
(Jan
-Ju
n)
Year
New Home Closings in Richmond Area Market Condo/Townhouse
Single Family
2437
2054
New Home Price 7%
New Home Sales
5050
Source: HBAR
No of Closings 6%
No of Permits 8%
Slides Produced by Lacy Williams, Joyner Fine Properties
www.RichmondHousingToday.com
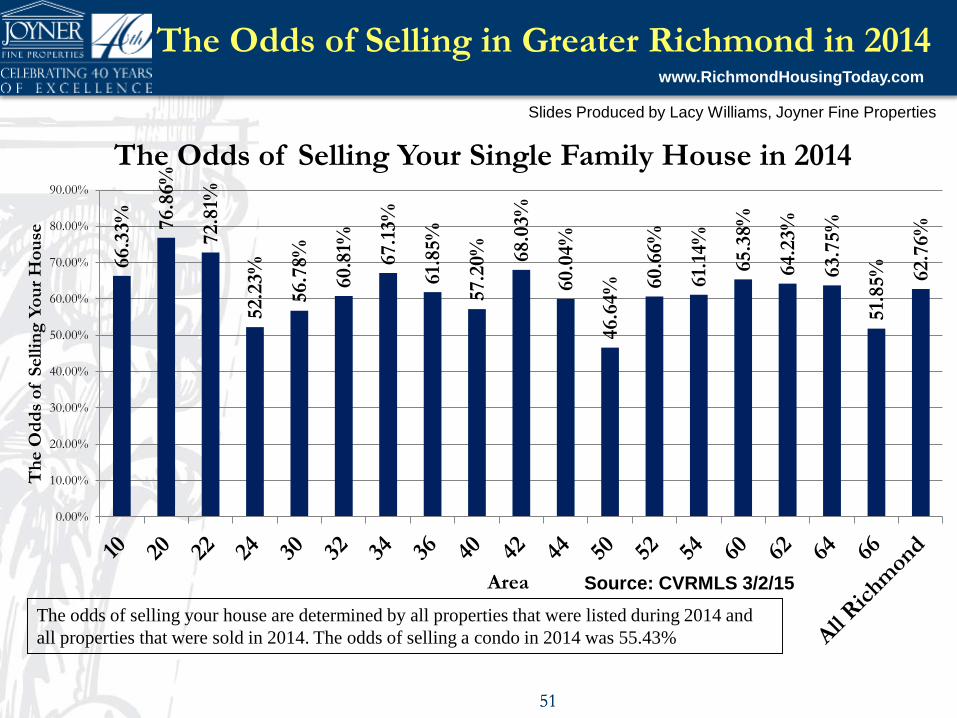
The Odds of Selling in Greater Richmond in 2014
5151
66.3
3% 76.8
6%
72.8
1%
52.2
3%
56.7
8%
60.8
1%
67.1
3%
61.
85%
57.2
0% 68.0
3%
60.0
4%
46.6
4% 6
0.6
6%
61.
14%
65.3
8%
64.2
3%
63.7
5%
51.
85% 62.7
6%
0.00%
10.00%
20.00%
30.00%
40.00%
50.00%
60.00%
70.00%
80.00%
90.00%
Th
e O
dd
s o
f S
ell
ing
Yo
ur
Ho
use
Area
The Odds of Selling Your Single Family House in 2014
Source: CVRMLS 3/2/15
The odds of selling your house are determined by all properties that were listed during 2014 and
all properties that were sold in 2014. The odds of selling a condo in 2014 was 55.43%

Slides Produced by Lacy Williams, Joyner Fine Properties
www.RichmondHousingToday.com
Market Indicator #2:
Inventory is Low!!!
5252

Slides Produced by Lacy Williams, Joyner Fine Properties
www.RichmondHousingToday.com
Inventory of Single Family Houses by Month in Greater Richmond
5353
The supply (inventory) of houses is determined by the number of active listings divided by the monthly sales rate for the
past year. After 2+ years of inventory between 8 and 10 months, inventory began to drop in the later months of 2011 and
has continued to drop in 2012 and 2013. Inventory now is less than half of what it was three years ago. 2013, 2014 and
2015 have had very similar inventory levels.
Source: CVRMLS data
0.0
2.0
4.0
6.0
8.0
10.0
12.0
Jan Feb Mar Apr May Jun Jul Aug Sept Oct Nov Dec
Mo
nth
s o
f In
ven
tory
Month
Inventory of Greater Richmond Single Family Houses
2010
2012
2014
2015
Slides Produced by Lacy Williams, Joyner Fine Properties
www.RichmondHousingToday.com
2.8 2.7
3.74.2
5.0
3.63.3
0.0
1.0
2.0
3.0
4.0
5.0
6.0
Richmond Henrico Chesterfield Hanover Goochland Powhatan AllRichmond
Mo
nth
s o
f In
ven
tory
Area
Greater Richmond Single Family Inventory By Area
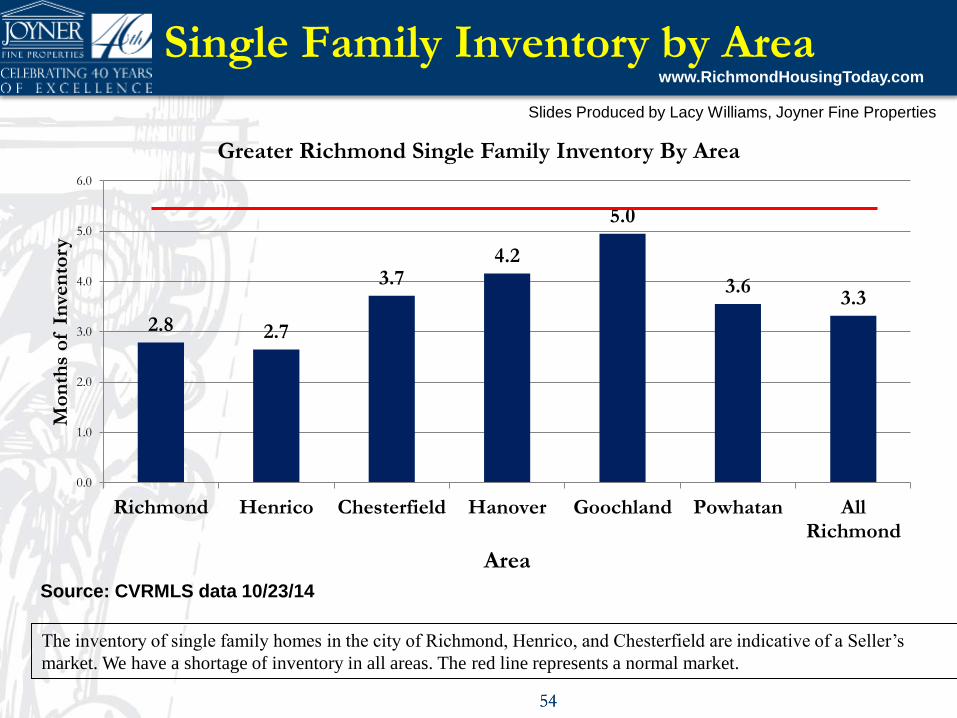
Single Family Inventory by Area
5454
Source: CVRMLS data 10/23/14
The inventory of single family homes in the city of Richmond, Henrico, and Chesterfield are indicative of a Seller’s
market. We have a shortage of inventory in all areas. The red line represents a normal market.

Slides Produced by Lacy Williams, Joyner Fine Properties
www.RichmondHousingToday.com
5555
Townhouse/Condominium Inventory by Month
The inventory of townhouses and condominiums started dropping in the second half of 2011 and continued to drop
through 2013. 2014 inventory was very close to 2013 inventory.
Source: CVRMLS data
0.0
2.0
4.0
6.0
8.0
10.0
12.0
Jan Feb Mar Apr May Jun Jul Aug Sept Oct Nov Dec
Inventory of Townhouse/Condominiums
2010
2011
2012
2013
2014
2015

Slides Produced by Lacy Williams, Joyner Fine Properties
www.RichmondHousingToday.com
Single Family Inventory by Price Range
Condominium Inventory By Price
Range
Price Range Inventory
0-249,000 3.6
$250,000-$499,000
3.2
$500,000+ 4.4
Single Family Inventory by Price
Range
Price Range Inventory
0-$249,000 2.7
$250,000-$499,000 3.6
$500,000-$749,000 6.0
$750,000-$999,999 7.5
$1,000,000+ 9.7
5656
Source: CVRMLS data 3/2/15
Inventory is low at all price points but increases at the higher price points.

Slides Produced by Lacy Williams, Joyner Fine Properties
www.RichmondHousingToday.com
Market Indicator #3:
Prices are rising!!!
5757
Slides Produced by Lacy Williams, Joyner Fine Properties
www.RichmondHousingToday.com
5858
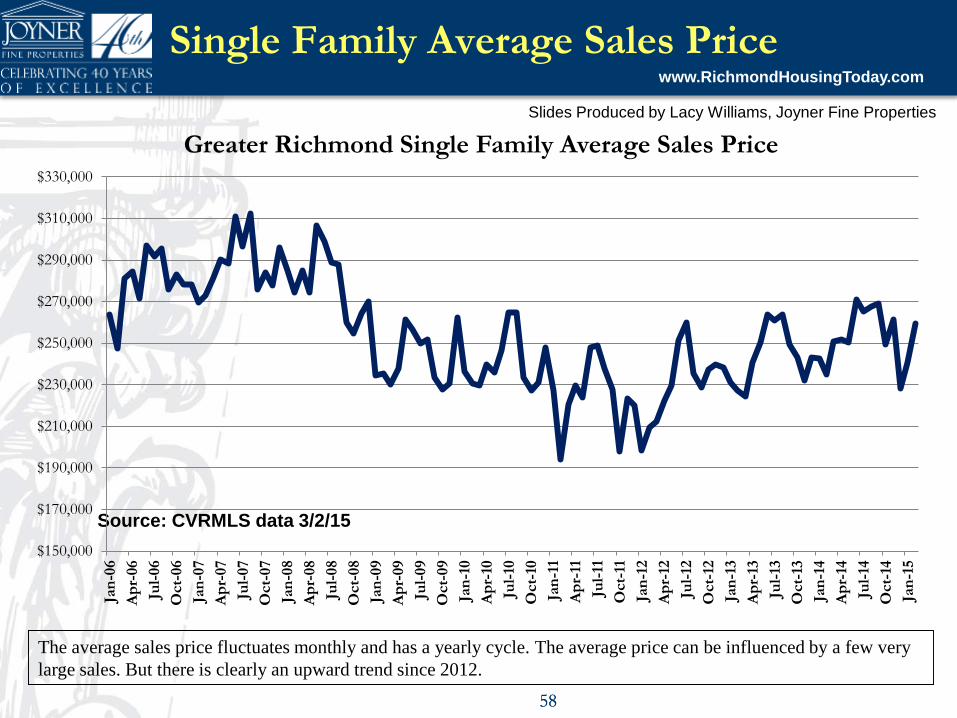
The average sales price fluctuates monthly and has a yearly cycle. The average price can be influenced by a few very
large sales. But there is clearly an upward trend since 2012.
Single Family Average Sales Price
Source: CVRMLS data 3/2/15
$150,000
$170,000
$190,000
$210,000
$230,000
$250,000
$270,000
$290,000
$310,000
$330,000
Jan
-06
Ap
r-06
Jul-
06
Oct-
06
Jan
-07
Ap
r-07
Jul-
07
Oct-
07
Jan
-08
Ap
r-08
Jul-
08
Oct-
08
Jan
-09
Ap
r-09
Jul-
09
Oct-
09
Jan
-10
Ap
r-10
Jul-
10
Oct-
10
Jan
-11
Ap
r-11
Jul-
11
Oct-
11
Jan
-12
Ap
r-12
Jul-
12
Oct-
12
Jan
-13
Ap
r-13
Jul-
13
Oct-
13
Jan
-14
Ap
r-14
Jul-
14
Oct-
14
Jan
-15
Greater Richmond Single Family Average Sales Price

Slides Produced by Lacy Williams, Joyner Fine Properties
www.RichmondHousingToday.com
Single Family Price Per Square Foot
5959
Price per square foot is a better indication of what is really happening. Note that the trend is definitely upward since 2012.
There are always seasonal variations with lower prices during the winter months.
Source: CVRMLS data 3/2/15
$80.00
$90.00
$100.00
$110.00
$120.00
$130.00
$140.00
$150.00
Jan
-06
Ap
r-06
Jul-
06
Oct
-06
Jan
-07
Ap
r-07
Jul-
07
Oct
-07
Jan
-08
Ap
r-08
Jul-
08
Oct
-08
Jan
-09
Ap
r-09
Jul-
09
Oct
-09
Jan
-10
Ap
r-10
Jul-
10
Oct
-10
Jan
-11
Ap
r-11
Jul-
11
Oct
-11
Jan
-12
Ap
r-12
Jul-
12
Oct
-12
Jan
-13
Ap
r-13
Jul-
13
Oct
-13
Jan
-14
Ap
r-14
Jul-
14
Oct
-14
Jan
-15
Greater Richmond Single Family Average Price Per Square Foot

Slides Produced by Lacy Williams, Joyner Fine Properties
www.RichmondHousingToday.com
$92.3
7
$99.6
5 $10
7.6
0
$12
3.3
8 $13
5.8
2
$13
9.6
4
$13
2.4
3
$11
7.8
2
$11
2.2
4
$10
4.9
8
$10
6.1
6
$11
3.0
2
$11
4.5
8
$11
4.5
8
$60.00
$70.00
$80.00
$90.00
$100.00
$110.00
$120.00
$130.00
$140.00
$150.00
2002 2003 2004 2005 2006 2007 2008 2009 2010 2011 2012 2013 2014 2015(Thru3/2)
Greater Richmond Single Family Price by Year
Single Family Price by Year
6060
Greater Richmond 2014 prices are 11.6% higher than 2011 prices and 3.6% higher than 2013 prices. With a 25%
decrease in prices between 2007 and 2011, prices are still between 2004 and 2005 levels as indicated in the red line on
this graph. 2014 prices are 16%% below 2007 prices.
Source: CVRMLS data
Slides Produced by Lacy Williams, Joyner Fine Properties
www.RichmondHousingToday.com
Single Family Year over Year Price Change
6161
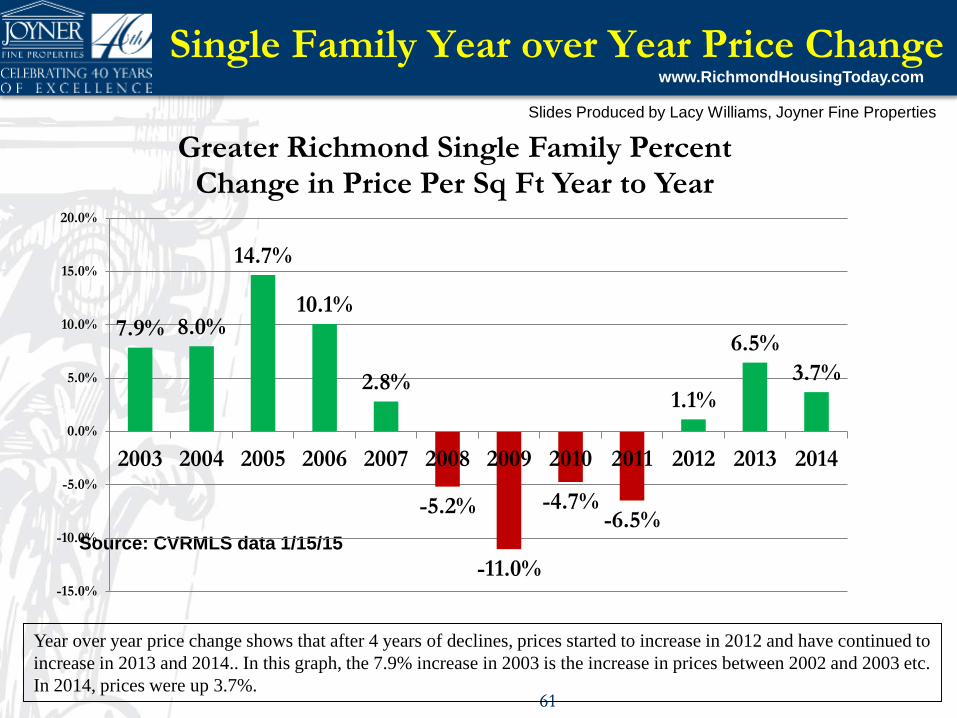
Year over year price change shows that after 4 years of declines, prices started to increase in 2012 and have continued to
increase in 2013 and 2014.. In this graph, the 7.9% increase in 2003 is the increase in prices between 2002 and 2003 etc.
In 2014, prices were up 3.7%.
Source: CVRMLS data 1/15/15
7.9% 8.0%
14.7%
10.1%
2.8%
-5.2%
-11.0%
-4.7%-6.5%
1.1%
6.5%
3.7%
-15.0%
-10.0%
-5.0%
0.0%
5.0%
10.0%
15.0%
20.0%
2003 2004 2005 2006 2007 2008 2009 2010 2011 2012 2013 2014
Greater Richmond Single Family Percent Change in Price Per Sq Ft Year to Year

Slides Produced by Lacy Williams, Joyner Fine Properties
www.RichmondHousingToday.comPrices for Condominiums
6262
Condominiums and townhouse are showing a similar trend as single family homes with prices trending up for the past
three years.
Source: CVRMLS data 3/2/15
$80.00
$90.00
$100.00
$110.00
$120.00
$130.00
$140.00
$150.00
$160.00
$170.00
$180.00
Jan
-06
Ap
r-06
Jul-
06
Oct
-06
Jan
-07
Ap
r-07
Jul-
07
Oct
-07
Jan
-08
Ap
r-08
Jul-
08
Oct
-08
Jan
-09
Ap
r-09
Jul-
09
Oct
-09
Jan
-10
Ap
r-10
Jul-
10
Oct
-10
Jan
-11
Ap
r-11
Jul-
11
Oct
-11
Jan
-12
Ap
r-12
Jul-
12
Oct
-12
Jan
-13
Ap
r-13
Jul-
13
Oct
-13
Jan
-14
Ap
r-14
Jul-
14
Oct
-14
Jan
-15
Pri
ce P
er
Sq
Ft
for
Clo
sed
Sale
s
Month
Price Per Square Foot for Condominium/Townhouse Sales

Slides Produced by Lacy Williams, Joyner Fine Properties
www.RichmondHousingToday.com
$91
$100
$113
$133
$149$154 $153
$136$132
$119 $121
$130
$139$134
$60.00
$70.00
$80.00
$90.00
$100.00
$110.00
$120.00
$130.00
$140.00
$150.00
$160.00
2002 2003 2004 2005 2006 2007 2008 2009 2010 2011 2012 2013 2014 2015(thru3/2)
Pri
ce P
er
Sq
uare
Fo
ot
Year
Condominium/Townhouse Prices
Condominium/Townhouse Prices
6363
Condominium prices in 2014 were 6.2% higher than 2013 and 15.8% higher than 2011 prices. There was a 23%
decrease in prices between 2007 and 2011. Current prices are above 2005 prices as shown in the red line..
Source: CVRMLS data 11/414

Slides Produced by Lacy Williams, Joyner Fine Properties
www.RichmondHousingToday.comRichmond Real Estate Areas
6464
The Richmond Association of
Realtors (RAR) uses Real estate areas
as shown in the graph. The following
analysis covers areas 10, 20, 22, 24,
30, 32, 34, 40, 42, 44, 50, 52, 54, 60,
62, 64 and 66 shown on the map.

Slides Produced by Lacy Williams, Joyner Fine Properties
www.RichmondHousingToday.com
134
36
170
11185 86
209228
142
98
216
112
343
439
133
347
148175
0
50
100
150
200
250
300
350
400
450
500
10 20 22 24 30 32 34 36 40 42 44 50 52 54 60 62 64 66
No
of
Acti
ve L
isti
ng
s
Area
Single Family Active Listings By Area (3/2/15)
Active Single Family Listings By Area
6565
The number of active listings by area as shown. Inventory varies by area with area 54 having the highest number of
homes for sale and Area 20 having the lowest.
Source: CVRMLS data 3/2/15
Slides Produced by Lacy Williams, Joyner Fine Properties
www.RichmondHousingToday.com
$270,8
71
$439,4
28
$346,0
88
$425,4
13
$17
5,1
16
$15
8,6
40
$336,2
98
$304,9
78
$15
5,0
11
$11
7,2
45
$244,5
70
$67,8
44
$18
6,3
30
$227,0
52
$208,2
93
$274,7
76
$349,3
54
$278,0
67
$259,6
42
$0
$50,000
$100,000
$150,000
$200,000
$250,000
$300,000
$350,000
$400,000
$450,000
$500,000
10 20
22
24
30
32
34
36
40
42
44
50
52
54
60
62
64
66
All
Ric
hm
on
d
Ave
rag
e S
ale
s P
rice
Area
Average Sales Price By Area (3/14-2/15)
Single Family Greater Richmond
Sales Price by Area
6666
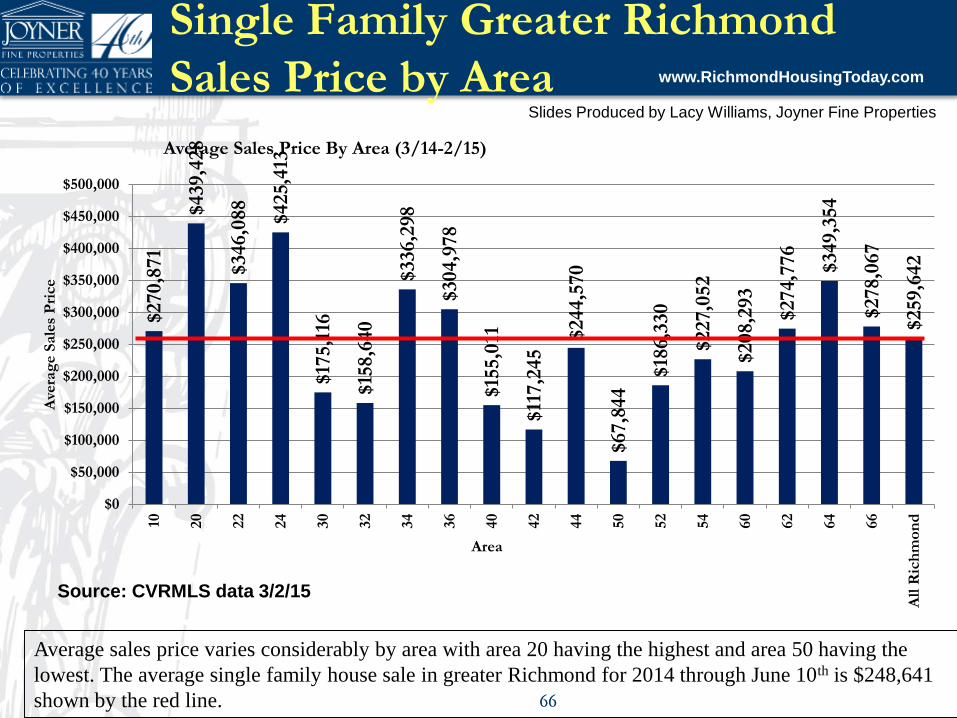
Average sales price varies considerably by area with area 20 having the highest and area 50 having the
lowest. The average single family house sale in greater Richmond for 2014 through June 10th is $248,641
shown by the red line.
Source: CVRMLS data 3/2/15

Slides Produced by Lacy Williams, Joyner Fine Properties
www.RichmondHousingToday.com
Greater Richmond Single Family Price per
Square Foot 3/14-2/15)
6767Source: CVRMLS data 3/2/15
$14
3.7
7
$19
4.3
5
$14
1.09
$15
1.23
$98.3
2
$94.6
0 $13
2.0
4
$12
3.1
7
$89.5
5
$76.6
8 $11
5.5
8
$51.
16
$91.
25
$10
2.7
4
$10
8.7
1
$11
2.1
1
$12
2.7
1
$12
5.6
5
$11
8.0
7
$0.00
$50.00
$100.00
$150.00
$200.00
$250.00
Pri
ce p
er
Sq
uare
Fo
ot
Area
Price per Square Foot By Area (3/14-2/15)

Slides Produced by Lacy Williams, Joyner Fine Properties
www.RichmondHousingToday.com
3.2
2.02.8
7.5
4.5 4.43.9
6.0 5.7
4.2
5.3
8.3
5.0 5.34.3 4.3 4.3
8.1
4.6
0.0
1.0
2.0
3.0
4.0
5.0
6.0
7.0
8.0
9.0
Mo
nth
s o
f In
ven
tory
Area
Greater Richmond Single Family Inventory by Area
Inventory of Single Family Houses
6868
As shown above, the supply of houses varies greatly in Greater Richmond. Generally, the areas that are further out have the largest supply of
houses while those that are closer in have lower inventories of houses. Goochland (Area 24) and Powhatan (Area 66) have the higher
supplies of houses. Area 50 had a lot of foreclosures and it still has a higher inventory. The average inventory in Greater Richmond is 4.4
months which is better than an normal market.
Source: CVRMLS data 10/23/14

Slides Produced by Lacy Williams, Joyner Fine Properties
www.RichmondHousingToday.com
Top 10 Greater Richmond 2014 Single
Family Sales
Address Area Sales Price Sq Ft
Price/
Square/
Foot
1 5901 River Rd 22 $3,622,506 9023 $401.47
2 12671 River Rd 22 $3,450,000 10113 $341.15
3 1000 Huguenot Trail 66 $3,045,000 6242 $487.82
4 12001 N Enon Church Rd 52 $2,000,000 9971 $200.58
5 210 Virginia Ave 20 $1,950,000 5946 $327.95
6 745 River Rd West 24 $1,900,000 6225 $305.22
7 455 Rivergate Dr 24 $1,895,000 6900 $274.64
8 12830 River Rd 54 $1,870,000 6000 $311.67
9 745 River Rd 24 $1,845,000 6300 $292.86
10 1180 Yellow Gate Ln 24 $1,765,975 7898 $223.60
6969
Source: CVRMLS 1/15/15

Slides Produced by Lacy Williams, Joyner Fine Properties
www.RichmondHousingToday.com
Top Condominium/Townhouse Sales in 2014
Address Area Subdivision Sale Price
Square
Ft
Price/Sq/
ft
1 1 Bankside Mews 40 Rocketts Landing $1,324,173 4260 $310.84
2 5225 Monument Ave 22 Monument Square $1,226,548 3378 $363.10
3 5217 Monument Ave 22 Monument Square $1,216,190 3378 $360.03
4 5 Bankside Mews 40 Rocketts Landing $1,096,015 4415 $248.25
5 3 Bankside Mews 40 Rocketts Landing $1,024,711 4120 $248.72
6 9505 Tatton Park 22 Grayson Hill $816,914 3200 $255.29
7 707 Southwark Ln 22 Grayson Hill $722,142 3700 $195.17
8 1119 Marney Ct 22 Grayson Hill $715,424 3500 $204.41
9 1121 Marney Ct 22 Grayson Hill $689,096 3500 $196.88
10 701 Southwark Ln 22 Grayson Hill $685,754 3700 $185.34
7070
Top 10 Greater Richmond 2014
Condominium/Townhouse Sales
Source: CVRMLS 1/15/15
Slides Produced by Lacy Williams, Joyner Fine Properties
www.RichmondHousingToday.com
Summary
7171

Slides Produced by Lacy Williams, Joyner Fine Properties
www.RichmondHousingToday.com
NAR Economic Forecast
7272Source: National Association of Realtors11/14
2013 2014
Likely
2015
Forecast
2016
Forecast
GDP Growth 2.2% 2.2% 2.7% 2.9%
Job Growth +2.3 M +2.5 M +2.5 M +2.6 M
CPI Inflation 1.5% 1.6% 2.7% 3.3%
Consumer
Confidence
73 87 95 98
10-year
Treasury
2.5% 2.6% 3.2% 4.3%
Slides Produced by Lacy Williams, Joyner Fine Properties
www.RichmondHousingToday.com
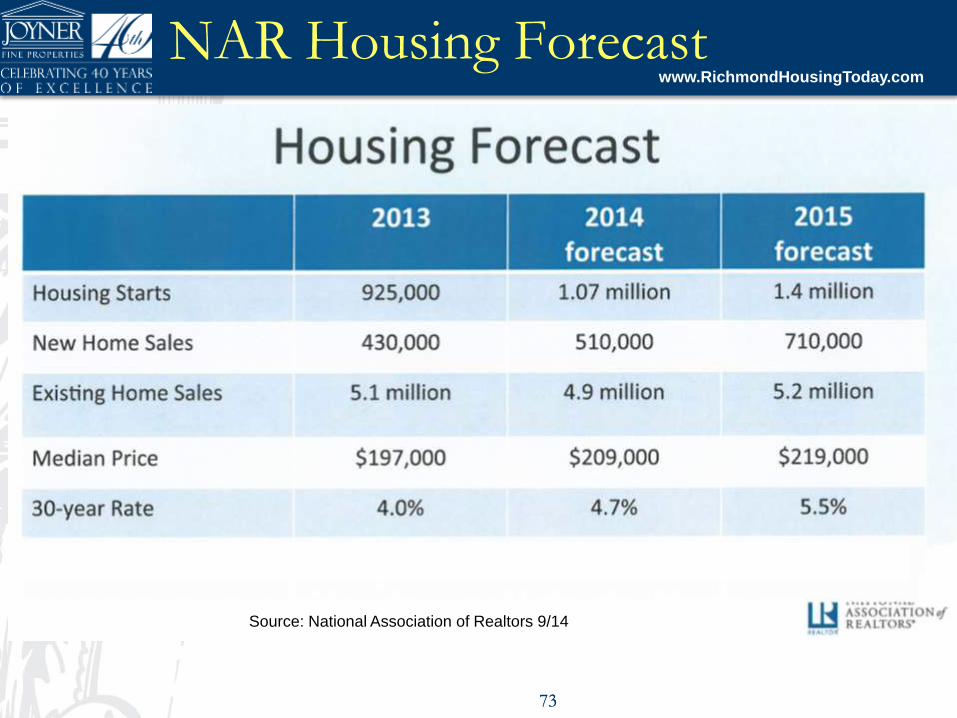
NAR Housing Forecast
7373
Source: National Association of Realtors 9/14
Slides Produced by Lacy Williams, Joyner Fine Properties
www.RichmondHousingToday.com
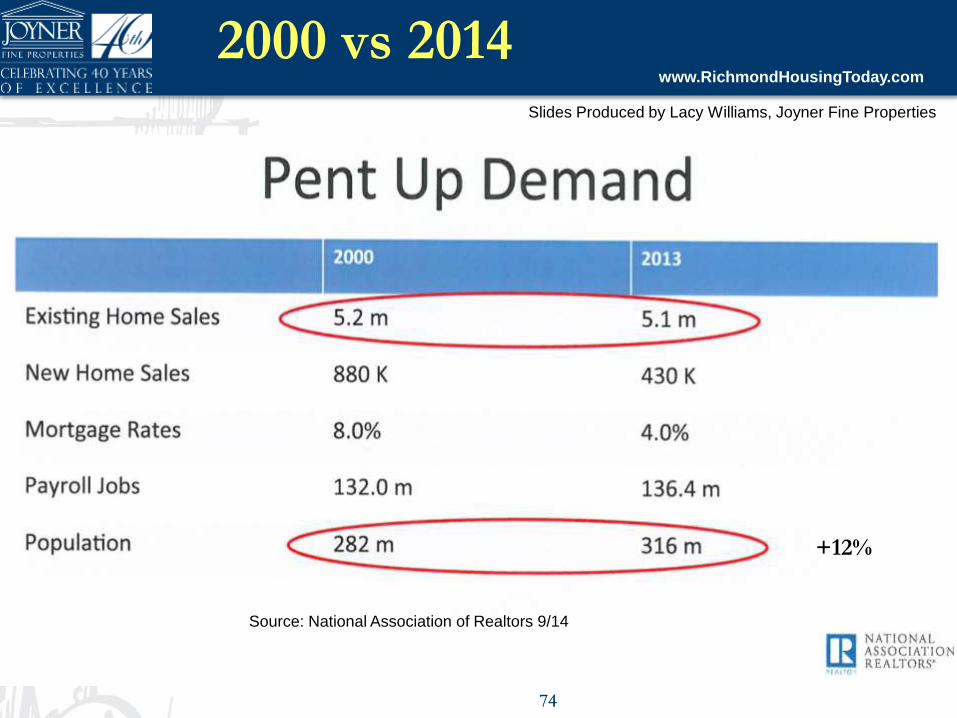
2000 vs 2014
7474
Source: National Association of Realtors 9/14
+12%

Slides Produced by Lacy Williams, Joyner Fine Properties
www.RichmondHousingToday.com
Summary
• Sales are up
• Inventory is low
• Prices are rising
• The interest rate is rising
7575

Slides Produced by Lacy Williams, Joyner Fine Properties
www.RichmondHousingToday.com
For all Your Real
Estate Needs:[email protected]
Lacy Williams
Joyner Fine Properties
804-864-0316
7676
Related Documents