Provider Reimbursement Recommendations
January 13, 2015
Milliman Client Report
Milliman Client Report
Workers’ Compensation
Provider Reimbursement Recommendations
All Service Types
Prepared for:
Nevada Division of Industrial Relations
TABLE OF CONTENTS
1. Introduction ............................................................................................................................. ..... 3
2. Physician Benchmarking and Recommendations Including Substance Abuse...................... 7
3. Relative Value Units................................................................................................................... 14
4. Hospital And Other Inpatient Services .................................................................................... 15
5. Dental Services ........................................................................................................................... 21
6. Ambulatory Surgery Centers .................................................................................................... 22
7. Pharmacy ............................................................................................................................. ....... 25
8. Ambulance, DME and Prosthetics............................................................................................ 28
9. Independent Medical Exams and Permanent Partial Disability ........................................... 30
10. Remaining Miscellaneous Services ........................................................................................... 32
11. Bundling of Charges .................................................................................................................. 36
12. Methodology ............................................................................................................................. .. 39
13. Limitations and Considerations ................................................................................................ 44
Exhibits ............................................................................................................................. .................... 45

Milliman Client Report
Provider Reimbursement Recommendations
January 13, 2015 3
1. INTRODUCTION
The Nevada Division of Industrial Relations (DIR) requires assistance evaluating and revising its
current Medical Fee Schedule (MFS). Based on the Request for Proposal (RFP) 3088, Milliman has
analyzed prevailing reimbursement for Medicare, commercial, and Workers’ Compensation (Workers’
Comp). This report provides Milliman’s recommendations for updating the MFS. Milliman’s analysis
is based in part on data provided by the National Council on Compensation Insurance (NCCI), The
data provided by NCCI included a summary of Nevada Workers’ Comp statewide utilization and
payments by procedure, which, where possible, has been used to weight results and to reflect the
Nevada-specific Workers’ Comp mix of services. In 2002, Milliman performed a similar analysis
providing benchmarks and recommendations for DIR to update the MFS at the time. The analysis is
being updated, not only to include recent reimbursement information, but also to consider updated
methodologies and additional services. As requested in the RFP, the analysis includes the following
services:
� Physician
� Hospital and Other Inpatient Services
� Dental Services
� Ambulatory Surgery Centers
� Miscellaneous Services
o Emergency
o Ambulance
o Pharmacy
o Alcohol/Drug Testing
o Drug Detoxification
o Home Health
o Durable Medical Equipment (DME) including Prosthetics/Orthotics
o Permanent Partial Disability Evaluations
o Independent Medical Exams
Milliman Client Report
Provider Reimbursement Recommendations
January 13, 2015
4
o Functional Capacity Evaluations
o Work Hardening Programs
o Back School
Market Considerations
The competing interests of stakeholders in the Workers’ Comp system complicate the creation of an
appropriate fee schedule. Among the issues are:
1) Providers seek a premium to treat Workers’ Comp patients because of the regulatory framework
and the perception of additional reporting requirements and scrutiny.
2) Employees want to ensure that they have access to the providers that they need to receive the
treatment that their condition requires.
3) Employers seek to restrain provider payment levels, since the cost of Workers’ Comp claims is a
business expense.
Regulators seek to balance these competing interests, and have other issues to address as well. A
healthy Workers’ Comp system provides appropriate care to injured workers, and encourages business
growth, and hence job growth.
Commercial fee schedule analysis provides a good starting point for the development of a Workers’
Comp fee schedule. Such analysis, however, must recognize the difference in the delivery system and
in the treated population. For example, care provided to Workers’ Comp patients tends to be less
organized than care delivered by commercial or Medicare Advantage delivery systems, in part because
of the nature of the conditions treated. Health payers have developed provider networks, incorporating
provider incentive payment systems and provider evaluation processes. Workers’ Comp payers
traditionally have lagged behind their commercial counterparts, in part because of the different
regulatory environment.
The differences between the delivery systems notwithstanding, the methodology used to develop
commercial fee schedules serves as a good starting point for delivery of fee schedules for Workers’
Comp programs.
Milliman Client Report
Provider Reimbursement Recommendations
January 13, 2015
5
Maximum Allowable vs. Paid Amounts
Workers’ Comp claims are administered through Nevada payers. Frequently, payers will reimburse
providers under existing contracts with those providers and the payment may be lower than the MFS.
This is consistent with the use of the MFS as a maximum allowable payment basis where all payments
under that schedule are less than or equal to the state schedule. Note that this can be seen in the
nationwide Workers’ Comp benchmarking data set where the reported paid amounts are occasionally
lower than allowed (as discussed in Section 2 of this report), which should not be the case since
member cost sharing is not permitted on Workers’ Comp claims, but rather because allowed likely
represents the MFS maximum and paid likely represents additional reductions due to local payer
contracts. For this reason, the paid amount from the nationwide Workers’ Comp data is used as the
proxy for actual allowed in this analysis. For the commercial and Medicare benchmark data, the
allowed amounts are used as is, since the difference between allowed and paid in these data sets
generally represents member cost sharing, rather than provider contractual adjustments.
In evaluating market reimbursement, the MFS was compared to the market reimbursement
information. The recommendations were based heavily on our analysis of commercial reimbursement
levels, recognizing that the final payment to Workers Comp providers under payer contracts, may not
equal the commercial level.
Deliverables
Through the course of this analysis, several analyses have been provided to the DIR representing the
different deliverables specified under the RFP. The first was a physician benchmarking analysis
provided on September 4, 2014. The second, provided on October 24th
, contained benchmarking and
recommendations for all types of service indicated above with the exception of Physician and a subset
of the Miscellaneous Services categories. The last analysis, sent on December 9th
, contained
benchmarking and recommendations for Physician and the remaining Miscellaneous Services
categories. This current analysis represents the final recommendations for all types of service
specified in the RFP.
Impact of Recommendations
We note that our recommendations result in significant changes to the maximum reimbursement for
many categories of care. This is attributable, in part, to the migration to Resource-Based Relative
Value Scale (RBRVS) units from the current Relative Values for Physicians units, but primarily to the
significant time lapse since the most recent update. The DIR should consider whether a change of this
magnitude would create dislocations in the State’s Workers’ Compensation delivery system and
employer community. If so, the DIR could phase in the recommended changes over sufficient time to
reduce disruption.
Milliman Client Report
Provider Reimbursement Recommendations
January 13, 2015
6
It is our understanding that the DIR has taken steps since the last full update to the MFS to maintain
the timeliness of the schedule. We recommend that the State fully reevaluate and update its fee
schedule more frequently to prevent such dislocations.
Milliman Client Report
Provider Reimbursement Recommendations
January 13, 2015
7
2. PHYSICIAN BENCHMARKING AND RECOMMENDATIONS INCLUDING SUBSTANCE
ABUSE
Reimbursement for physician services was analyzed at the CPT/HCPCS procedure code level and by
the current MFS categories, with the addition of a category for Substance Abuse. The analysis
followed the same approach for all categories:
� Anesthesia
� Surgery
� Radiology
� Pathology & Lab
� Evaluation and Management
� Medicine
� Substance Abuse
Physician reimbursement is typically based on the use of relative value units (RVUs), which represent
expected payment differences between procedures based on the complexity and type of service
performed. A conversion factor is multiplied by the RVUs for a particular service to determine the
ultimate dollar reimbursement. Under this structure, the two components needed to determine a
physician fee schedule are: (1) selecting an appropriate catalogue of RVUs and (2) setting the
conversion factor used to scale those RVUs to ultimate reimbursement levels. We provide
recommendations for both of these items in this section. In addition to physician services, we
recommend using the same RVU schedules and conversion factor methodology for Substance Abuse
services.
Current MFS reimbursement is based on proprietary Relative Values for Physicians (RVP) RVUs,
which are maintained and published by Optum. For this analysis we evaluated the data under both
RVP and the CMS RBRVS RVUs, which are used to determine Medicare reimbursement. For
Anesthesia, both the MFS and RBRVS use RVUs from the American Society of Anesthesiologists.
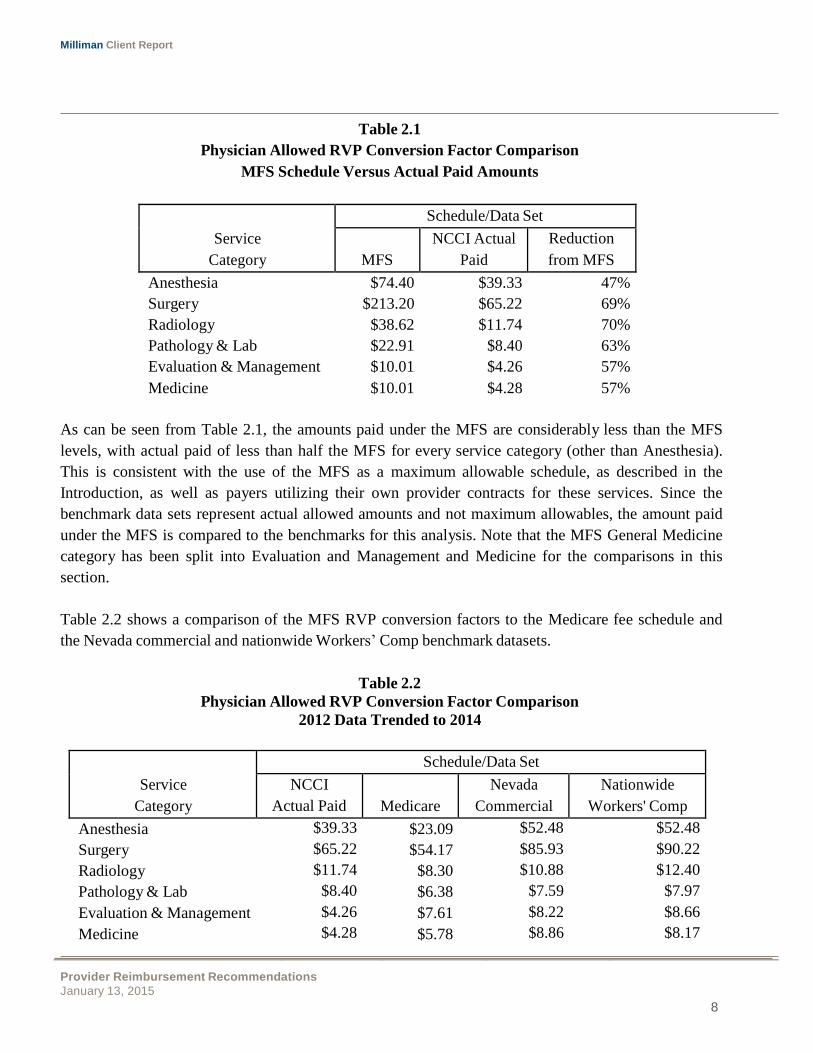
Utilizing the physician payment data provided by NCCI, amounts paid under the MFS were compared
to the MFS on a composite RVP conversion factor basis. Each composite value represents the average
conversion factor that would have to be applied to the RBRVS units for all the procedures in that
service category to match the aggregate allowed amount across all services in that service category.
Note that this reproduces the allowed amount only in total, and the results for any procedure could
vary. Table 2.1 provides this comparison:
Milliman Client Report
Provider Reimbursement Recommendations
January 13, 2015
8
Service
Category
Schedule/Data Set
MFS
NCCI Actual
Paid
Reduction
from MFS
Service
Category
Schedule/Data Set
NCCI
Actual Paid
Medicare
Nevada
Commercial
Nationwide
Workers' Comp
Table 2.1
Physician Allowed RVP Conversion Factor Comparison
MFS Schedule Versus Actual Paid Amounts
Anesthesia $74.40 $39.33 47%
Surgery $213.20 $65.22 69%
Radiology $38.62 $11.74 70%
Pathology & Lab $22.91 $8.40 63%
Evaluation & Management $10.01 $4.26 57%
Medicine $10.01 $4.28 57%
As can be seen from Table 2.1, the amounts paid under the MFS are considerably less than the MFS
levels, with actual paid of less than half the MFS for every service category (other than Anesthesia).
This is consistent with the use of the MFS as a maximum allowable schedule, as described in the
Introduction, as well as payers utilizing their own provider contracts for these services. Since the
benchmark data sets represent actual allowed amounts and not maximum allowables, the amount paid
under the MFS is compared to the benchmarks for this analysis. Note that the MFS General Medicine
category has been split into Evaluation and Management and Medicine for the comparisons in this
section.
Table 2.2 shows a comparison of the MFS RVP conversion factors to the Medicare fee schedule and
the Nevada commercial and nationwide Workers’ Comp benchmark datasets.
Table 2.2
Physician Allowed RVP Conversion Factor Comparison
2012 Data Trended to 2014
Anesthesia $39.33 $23.09 $52.48 $52.48
Surgery $65.22 $54.17 $85.93 $90.22
Radiology $11.74 $8.30 $10.88 $12.40
Pathology & Lab $8.40 $6.38 $7.59 $7.97
Evaluation & Management $4.26 $7.61 $8.22 $8.66
Medicine $4.28 $5.78 $8.86 $8.17
Milliman Client Report
Provider Reimbursement Recommendations
January 13, 2015
9
Service
Category
Schedule/Data Set
NCCI
Actual Paid
Medicare
Nevada
Commercial
Nationwide
Workers' Comp
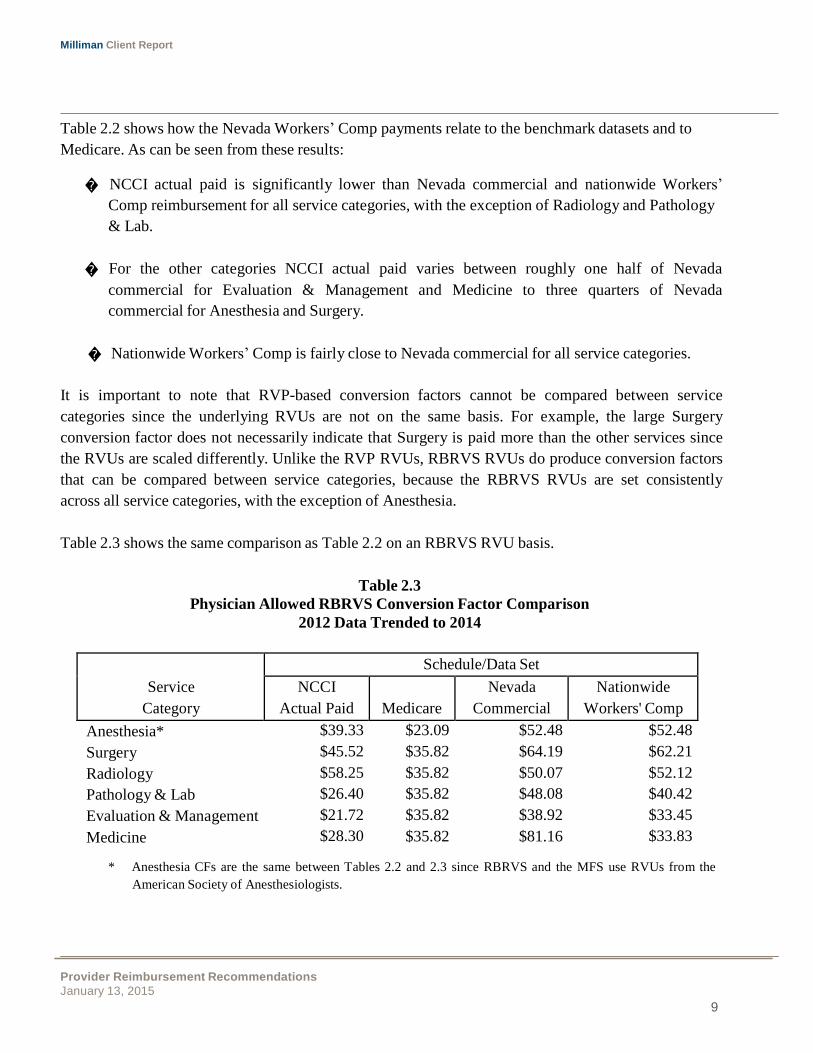
Table 2.2 shows how the Nevada Workers’ Comp payments relate to the benchmark datasets and to
Medicare. As can be seen from these results:
� NCCI actual paid is significantly lower than Nevada commercial and nationwide Workers’
Comp reimbursement for all service categories, with the exception of Radiology and Pathology
& Lab.
� For the other categories NCCI actual paid varies between roughly one half of Nevada
commercial for Evaluation & Management and Medicine to three quarters of Nevada
commercial for Anesthesia and Surgery.
� Nationwide Workers’ Comp is fairly close to Nevada commercial for all service categories.
It is important to note that RVP-based conversion factors cannot be compared between service
categories since the underlying RVUs are not on the same basis. For example, the large Surgery
conversion factor does not necessarily indicate that Surgery is paid more than the other services since
the RVUs are scaled differently. Unlike the RVP RVUs, RBRVS RVUs do produce conversion factors
that can be compared between service categories, because the RBRVS RVUs are set consistently
across all service categories, with the exception of Anesthesia.
Table 2.3 shows the same comparison as Table 2.2 on an RBRVS RVU basis.
Table 2.3
Physician Allowed RBRVS Conversion Factor Comparison
2012 Data Trended to 2014
Anesthesia* $39.33 $23.09 $52.48 $52.48
Surgery $45.52 $35.82 $64.19 $62.21
Radiology $58.25 $35.82 $50.07 $52.12
Pathology & Lab $26.40 $35.82 $48.08 $40.42
Evaluation & Management $21.72 $35.82 $38.92 $33.45
Medicine $28.30 $35.82 $81.16 $33.83
* Anesthesia CFs are the same between Tables 2.2 and 2.3 since RBRVS and the MFS use RVUs from the
American Society of Anesthesiologists.
Milliman Client Report
Provider Reimbursement Recommendations
January 13, 2015
10
Service
Category
Nevada
Workers’ Comp
Distribution*
NCCI
Actual Paid
Nevada
Commercial
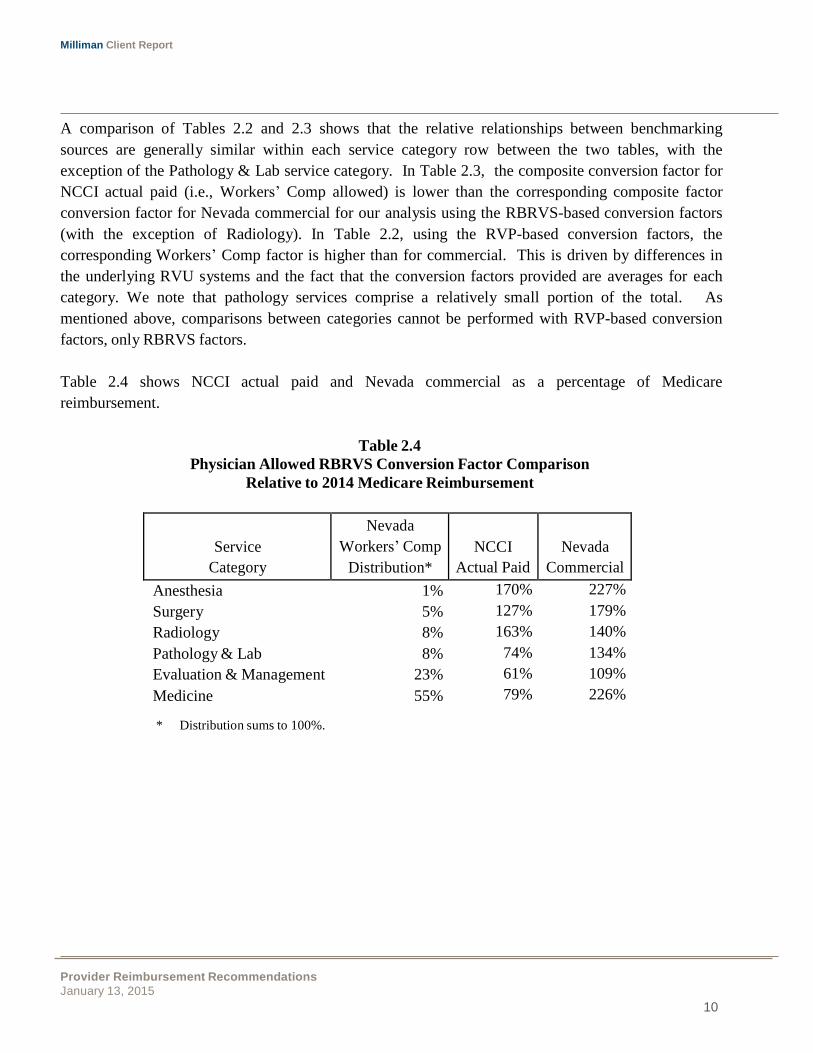
A comparison of Tables 2.2 and 2.3 shows that the relative relationships between benchmarking
sources are generally similar within each service category row between the two tables, with the
exception of the Pathology & Lab service category. In Table 2.3, the composite conversion factor for
NCCI actual paid (i.e., Workers’ Comp allowed) is lower than the corresponding composite factor
conversion factor for Nevada commercial for our analysis using the RBRVS-based conversion factors
(with the exception of Radiology). In Table 2.2, using the RVP-based conversion factors, the
corresponding Workers’ Comp factor is higher than for commercial. This is driven by differences in
the underlying RVU systems and the fact that the conversion factors provided are averages for each
category. We note that pathology services comprise a relatively small portion of the total. As
mentioned above, comparisons between categories cannot be performed with RVP-based conversion
factors, only RBRVS factors.
Table 2.4 shows NCCI actual paid and Nevada commercial as a percentage of Medicare
reimbursement.
Table 2.4
Physician Allowed RBRVS Conversion Factor Comparison
Relative to 2014 Medicare Reimbursement
Anesthesia 1% 170% 227%
Surgery 5% 127% 179%
Radiology 8% 163% 140%
Pathology & Lab 8% 74% 134%
Evaluation & Management 23% 61% 109%
Medicine 55% 79% 226%
* Distribution sums to 100%.
Milliman Client Report
Provider Reimbursement Recommendations
January 13, 2015
11
Doctor
Current
Payment
Maximum
Allowable
Adjusted
by Maximum
1 $130.00 $82.00
2 $95.00 $82.00
3 $87.00 $82.00
$82.00
$82.00
$82.00
Maximum Allowable Reimbursement
The conversion factors considered in this section are based on market averages. For professional
services, the DIR is interested in setting maximum allowable reimbursement that would act as an
upper limit on reimbursement. All amounts over the maximum allowable would be dropped down to
the maximum allowable level, but all amounts below the maximum allowable level would remain the
same and not have to be adjusted. For example, if the maximum allowable level were set at the 75th
percentile based on the distribution of allowed amounts. That means that fees for 75% of the
physicians would remain as is while the top 25% of physicians would be adjusted down to the 75th
percentile level.
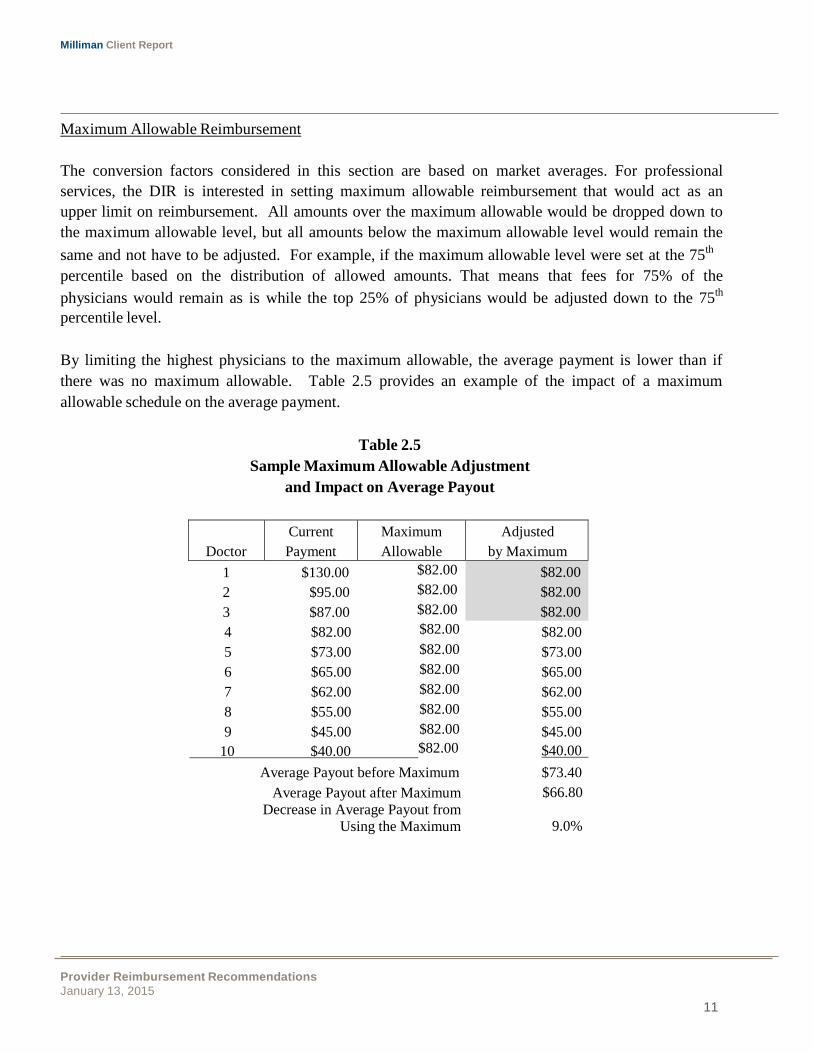
By limiting the highest physicians to the maximum allowable, the average payment is lower than if
there was no maximum allowable. Table 2.5 provides an example of the impact of a maximum
allowable schedule on the average payment.
Table 2.5
Sample Maximum Allowable Adjustment
and Impact on Average Payout
4
$82.00 $82.00
$82.00
5 $73.00 $82.00 $73.00
6 $65.00 $82.00 $65.00
7 $62.00 $82.00 $62.00
8 $55.00 $82.00 $55.00
9 $45.00 $82.00 $45.00
10 $40.00 $82.00 $40.00
Average Payout before Maximum $73.40
Average Payout after Maximum
Decrease in Average Payout from
Using the Maximum
$66.80
9.0%

Milliman Client Report
Provider Reimbursement Recommendations
January 13, 2015
12
The current payment column represents a sample distribution of payments for ten doctors. A
maximum allowable level of $82.00 is applied such that payments over that level are paid at the
maximum. All payments below that level remain unchanged. The average payout is calculated before
and after the maximum is applied and the reduction determined. Table 2.5 shows that the use of this
maximum causes a reduction of 9.0% to the average payout in this example. These values are
illustrative only,
To estimate the appropriate maximum allowable levels, the distribution of commercial allowed
charges was looked at for a set of high-volume procedure codes. The impact on total payout was
estimated for using different percentile levels as the maximum. A final adjustment is recommended
below to develop the maximum allowable schedule.
Recommendations
We recommend setting professional conversion factors at 120% of the Nevada commercial market
reimbursement to produce a maximum allowable schedule. This adjustment is in the range of the 70th
to 75th
percentile from the Nevada commercial data distribution. We estimate that these maximum
allowable levels would produce a reduction of around 8% in the average payment according to the
commercial data distribution. Actual reduction for Workers’ Comp claims will most likely be less than
8% because the historical Workers’ Comp paid reimbursement in our NCCI data has been lower than
commercial reimbursement and would be less impacted by the maximum allowable.
Table 2.6 shows the recommendations under RVP and RBRVS RVU bases after adjusting to
maximum allowable levels. This recommendation represents a significant decrease from the current
MFS maximum allowable schedule, but an increase from the amounts actually paid under the MFS.
Given that payers can be expected to utilize their own provider contracts for Workers’ Comp claims, it
is likely the payout under a schedule using commercial reimbursement levels will continue to be much
lower than those commercial levels.

Milliman Client Report
Provider Reimbursement Recommendations
January 13, 2015
13
Service
Category
Recommended CFs
RVP RBRVS
Table 2.6
Recommended Maximum Allowable Conversion Factors
Under RVP and RBRVS
Anesthesia $52.44 $62.98
Surgery $103.11 $77.03
Radiology $13.05 $60.08
Pathology & Lab $9.10 $57.69
Evaluation & Management $9.86 $46.70
Medicine $10.63 $97.37
Substance Abuse
(set equal to Medicine)
$10.63 $97.37
Additionally, we recommend transitioning to an RBRVS RVU basis. RBRVS has several advantages
over RVP, including provider and carrier familiarity because of its prevalence in Medicare payment
system. Since RBRVS is maintained by CMS, annual updates will be available for the DIR to use and
keep the schedule current.
For Substance Abuse services we recommend using the same methodology used for physician
services. RVUs should be assigned based on the procedure code and modifier and the appropriate
conversion factor from Table 2.6 should be used to determine reimbursement levels. Substance Abuse
and Mental Health services are often considered together and can be reimbursed under the same
methodology.
Milliman Client Report
Provider Reimbursement Recommendations
January 13, 2015
14
3. RELATIVE VALUE UNITS
Prior to this project, Milliman developed a product called GlobalRVUs™ that has been used for the
benchmarking and recommendations for several service types analyzed for the DIR. The GlobalRVUs
are a relative value unit (RVU) system that covers the entire range of medical and prescription drug
services, including hospital and physician. These RVUs are on a similar relative basis to RBRVS
units so that RVUs for the different service types are comparable to each other. For example, the
RVUs assigned to an inpatient admission versus a physician office visit represent the expected cost
differences between those services. This is an attribute consistent with Medicare’s RBRVS that has all
physician service types on the same relative basis, but the GlobalRVUs expand the concept to apply to
all healthcare services (which excludes Dental). This differs from RVP whose RVUs are on a
different basis between major physician service types.
GlobalRVUs have also been defined relative to Medicare’s RBRVS. In fact, the physician portion of
GlobalRVUs is based on RBRVS and uses its RVUs directly so the RVUs developed for other types
of services are therefore consistent with RBRVS. The following link describes the GlobalRVUs in
more detail:
http://us.milliman.com/uploadedFiles/Solutions/Products/2011-globalrvus-whitepaper.pdf
Exhibit 1 provides GlobalRVUs for physician services excluding Anesthesia which is assumed to
remain on the same basis as the MFS that uses RVUs from the American Society of Anesthesiologists
(ASA). RBRVS also uses ASA RVUs. Note that other factors are reflected in reimbursement for
anesthesia, including time and patient status. The MFS reimburses physician on an RVU basis and we
are recommending the DIR move from RVP RVUs to RBRVS, which are consistent with
GlobalRVUs, and which are more universally adopted.
Milliman Client Report
Provider Reimbursement Recommendations
January 13, 2015
15
4. HOSPITAL AND OTHER INPATIENT SERVICES
Reimbursement for hospital and other inpatient services was analyzed at the detailed DRG level and
by the following categories specified in the combination of the current MFS and the RFP:
� Medical-Surgical Categories
o Short-Term Acute Care – Short-term acute care facilities were identified in the
Medicare benchmark data using the facility’s Medicare ID. Since the data does not
identify individual hospitals, acute care facilities were identified as those with an
average length of stay of less than 25 days.
o Long-Term Acute Care – Long-term acute care facilities were identified in the
Medicare benchmark data using the facility’s Medicare ID. The commercial and
Workers’ Comp data does not identify individual hospitals, so long-term acute care
facilities were identified as those with an average length of stay of at least 25 days.
o Observation Care – Observation is identified by revenue code 0762.
o Step-Down Units – Step-down units include both intensive care and cardiac step down
units. These were identified by revenue codes 0206 and 0214.
o Medical-Surgical Cardiac Care – Cardiac care unit stays were identified by revenue
codes 0210 to 0213, and 0219.
o Medical-Surgical Intensive Care – Intensive care unit stays were identified by revenue
codes 0174, 0175, 0200 to 0204 and 0207 to 0209.
� Burn Care – Burn care admits were identified by DRGs 927 to 929 and 933 to 935.
� Psychiatric Care – Substance Abuse and Mental Health admits were identified by DRGs 880 to
887 and 894 to 897.
� Rehabilitation Care – Rehabilitation admits were identified by DRGs 945 and 946.
� Skilled Nursing Facility Care – Skilled Nursing Facility admits were identified by provider
type.
Milliman Client Report
Provider Reimbursement Recommendations
January 13, 2015
16
Service Mix
MFS
Benchmark Dataset
Nevada Commercial
Nationwide Workers' Comp
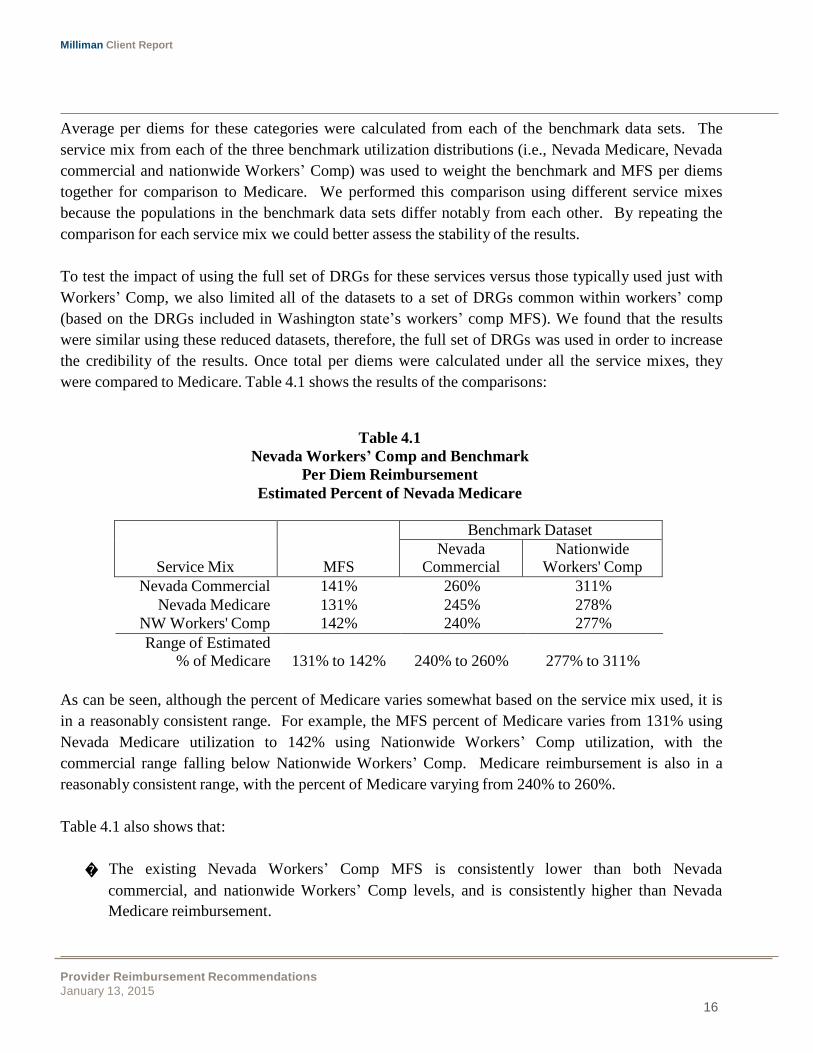
Average per diems for these categories were calculated from each of the benchmark data sets. The
service mix from each of the three benchmark utilization distributions (i.e., Nevada Medicare, Nevada
commercial and nationwide Workers’ Comp) was used to weight the benchmark and MFS per diems
together for comparison to Medicare. We performed this comparison using different service mixes
because the populations in the benchmark data sets differ notably from each other. By repeating the
comparison for each service mix we could better assess the stability of the results.
To test the impact of using the full set of DRGs for these services versus those typically used just with
Workers’ Comp, we also limited all of the datasets to a set of DRGs common within workers’ comp
(based on the DRGs included in Washington state’s workers’ comp MFS). We found that the results
were similar using these reduced datasets, therefore, the full set of DRGs was used in order to increase
the credibility of the results. Once total per diems were calculated under all the service mixes, they
were compared to Medicare. Table 4.1 shows the results of the comparisons:
Table 4.1
Nevada Workers’ Comp and Benchmark
Per Diem Reimbursement
Estimated Percent of Nevada Medicare
Nevada Commercial 141% 260% 311%
Nevada Medicare 131% 245% 278%
NW Workers' Comp 142% 240% 277%
Range of Estimated % of Medicare
131% to 142%
240% to 260%
277% to 311%
As can be seen, although the percent of Medicare varies somewhat based on the service mix used, it is
in a reasonably consistent range. For example, the MFS percent of Medicare varies from 131% using
Nevada Medicare utilization to 142% using Nationwide Workers’ Comp utilization, with the
commercial range falling below Nationwide Workers’ Comp. Medicare reimbursement is also in a
reasonably consistent range, with the percent of Medicare varying from 240% to 260%.
Table 4.1 also shows that:
� The existing Nevada Workers’ Comp MFS is consistently lower than both Nevada
commercial, and nationwide Workers’ Comp levels, and is consistently higher than Nevada
Medicare reimbursement.

Milliman Client Report
Provider Reimbursement Recommendations
January 13, 2015
17
� Relative reimbursement between the benchmark data sets and MFS is fairly consistent
regardless of the service mix used for the calculation. The rank order of the relative
reimbursement is unchanged moving across the three bases.
Table 4.2 shows the average per diems for the detailed service categories:
Table 4.2
Average Per Diem Rate by Inpatient Category
2012 Data Trended to 2014
Category
Average Allowed Per Diem(1)
Nevada Medicare
Nevada Commercial
Nationwide Workers’ Comp
Medical-Surgical
Short-Term Acute Care $3,025 $4,661 $5,274
Long-Term Acute Care $1,727 N/A N/A
Observation $3,978 $5,059 N/A
Step-Down Units $2,715 $6,463 N/A
Cardiac Care Unit $3,580 N/A N/A
Intensive Care Unit $3,442 $7,031 N/A
Burn Care $1,735 N/A N/A
Psychiatric Care $972 $1,150 N/A
Rehabilitation Care $1,804 $1,144 N/A
Skilled Nursing Facility $565 $950 N/A
1) Nevada Commercial data was not credible for Long-Term Acute Care, Cardiac Care Unit and Burn Care.
Nationwide Workers’ Comp data was only credible for Short-Term Acute Care..
As Table 4.2 shows:
� Per diem reimbursement for long-term acute care is about 57% of short term, with observation
care at higher levels.
� Relative reimbursement for step down units varies significantly between the Medicare and
commercial datasets. For Medicare, step down unit reimbursement is roughly 90% of short
term acute care, but for commercial step down unit reimbursement is nearly 140% of short
term, which is considered a more reasonable relationship given the increased severity of
services expected in a Step-Down Unit.
� Medicare per diems are consistently and significantly lower than commercial levels for all
categories except for rehabilitation.
Milliman Client Report
Provider Reimbursement Recommendations
January 13, 2015
18
� Short term acute per diem reimbursement for the nationwide Workers’ Comp population is
13% higher than the Nevada commercial levels, and nearly 175% of Nevada Medicare.
However, as mentioned above it is important to consider the difference in service mix between these
populations when comparing per diem reimbursement levels.
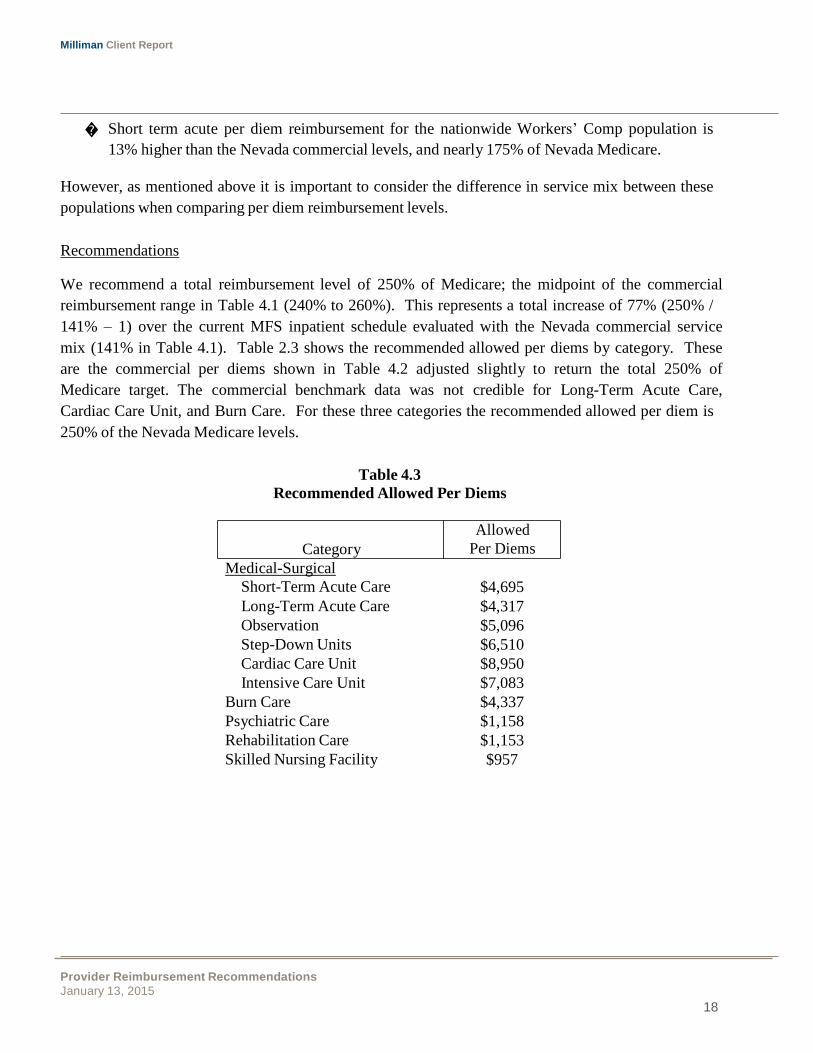
Recommendations
We recommend a total reimbursement level of 250% of Medicare; the midpoint of the commercial
reimbursement range in Table 4.1 (240% to 260%). This represents a total increase of 77% (250% /
141% – 1) over the current MFS inpatient schedule evaluated with the Nevada commercial service
mix (141% in Table 4.1). Table 2.3 shows the recommended allowed per diems by category. These
are the commercial per diems shown in Table 4.2 adjusted slightly to return the total 250% of
Medicare target. The commercial benchmark data was not credible for Long-Term Acute Care,
Cardiac Care Unit, and Burn Care. For these three categories the recommended allowed per diem is
250% of the Nevada Medicare levels.
Table 4.3
Recommended Allowed Per Diems
Allowed
Category Per Diems
Medical-Surgical
Short-Term Acute Care $4,695
Long-Term Acute Care $4,317
Observation $5,096
Step-Down Units $6,510
Cardiac Care Unit $8,950
Intensive Care Unit $7,083
Burn Care $4,337
Psychiatric Care $1,158
Rehabilitation Care $1,153
Skilled Nursing Facility $957
Milliman Client Report
Provider Reimbursement Recommendations
January 13, 2015
19
Alternate DRG Methodology
We also recommend that the State consider an alternate reimbursement methodology, such as
reimbursement at a multiple of Medicare levels, or at least DRG-level payments. MFS’ current
structure has two primary drawbacks:
1) Broad payment categories, and
2) Per diem reimbursement.
For item 1), the use of DRG payments means the payment will be more specific to the type of service
performed. The use of broad payment categories can produce under or over payments for hospitals
depending on their case mix. Aligning the payment with the type of service performed will remove
some of this case mix bias.
For item 2), per diem reimbursement rewards the provider for longer lengths of stay. The use of case
rate payments on a DRG basis provides a single payment for the entire stay and does not incentivize
the provider to keep the patient longer than necessary.
We understand there are concerns with moving to a Medicare-based reimbursement system due to the
administrative difficulties inherent with Medicare. Many payers avoid those complexities by using a
simplified version of Medicare, focusing primarily on the use of a base rate applied to CMS’ DRG
weights – an approach very similar to the use of conversion factors with RVUs that the MFS applies
for physician services. The 250% of Medicare target recommendation could be applied directly to
these simpler DRG-based payments. This DRG basis will be very familiar to the majority of payers
due to their familiarity with Medicare which can help ease the transition to the new payment
methodology.
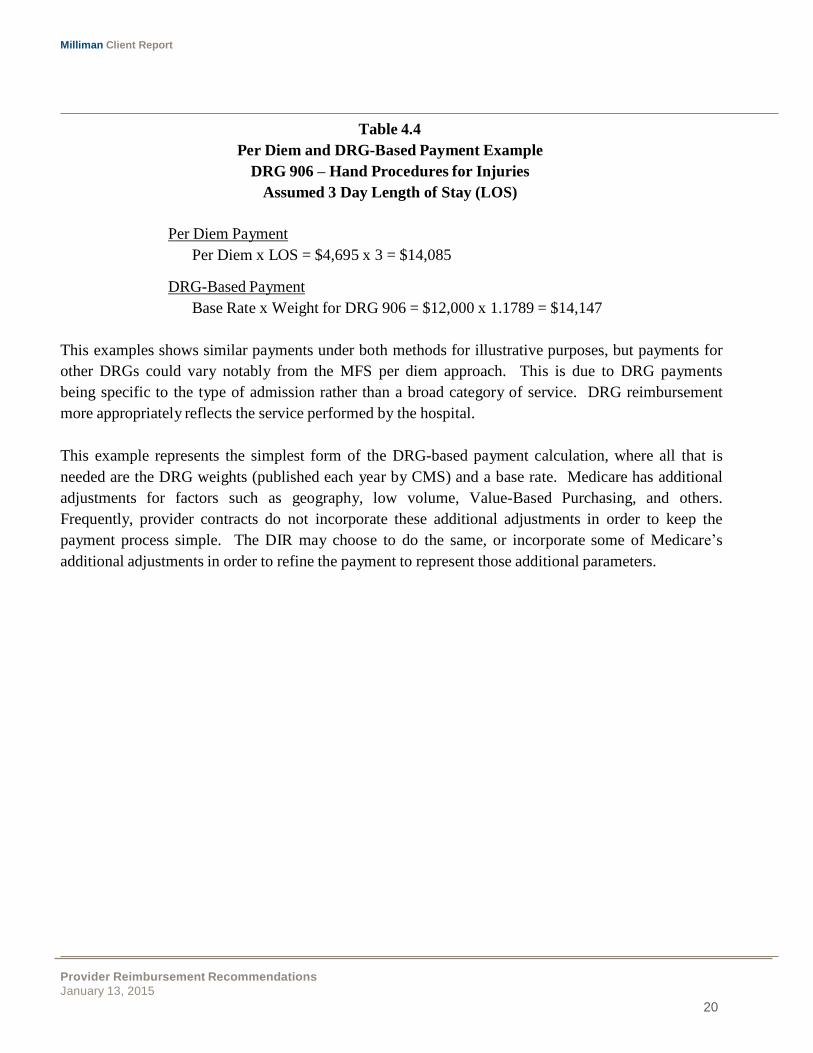
Table 4.4 provides a sample calculation for DRG and per diem-based payments. It uses the Short-
Term Acute recommended per diem of $4,695 from Table 4.3. For the DRG payment, an assumed
DRG base rate of $12,000 is used for illustrative purposes along with the FY2015 Medicare weight for
the sample DRG:
Milliman Client Report
Provider Reimbursement Recommendations
January 13, 2015
20
Table 4.4
Per Diem and DRG-Based Payment Example
DRG 906 – Hand Procedures for Injuries
Assumed 3 Day Length of Stay (LOS)
Per Diem Payment
Per Diem x LOS = $4,695 x 3 = $14,085
DRG-Based Payment
Base Rate x Weight for DRG 906 = $12,000 x 1.1789 = $14,147
This examples shows similar payments under both methods for illustrative purposes, but payments for
other DRGs could vary notably from the MFS per diem approach. This is due to DRG payments
being specific to the type of admission rather than a broad category of service. DRG reimbursement
more appropriately reflects the service performed by the hospital.
This example represents the simplest form of the DRG-based payment calculation, where all that is
needed are the DRG weights (published each year by CMS) and a base rate. Medicare has additional
adjustments for factors such as geography, low volume, Value-Based Purchasing, and others.
Frequently, provider contracts do not incorporate these additional adjustments in order to keep the
payment process simple. The DIR may choose to do the same, or incorporate some of Medicare’s
additional adjustments in order to refine the payment to represent those additional parameters.
Milliman Client Report
Provider Reimbursement Recommendations
January 13, 2015
21
5. DENTAL SERVICES
The Dental benchmarking and recommendations focused primarily on commercial reimbursement
levels. Dental claims information was not available from the benchmark databases and the MFS does
not specify dental payment levels. Instead, target reimbursement was developed using a combination
of two data sources:
� Milliman Health Cost Guidelines
™ (HCGs), Dental Volume – Milliman's HCGs incorporate
over 50 years of research and consulting practice into an industry gold standard used by
insurers, managed care organizations, and third-party administrators to estimate expected claim
costs and model health care utilization. More than 100 insurers rely on our proprietary
methodologies and comprehensive data, compiled from published and unpublished, private and
public data sources, to adjust national average healthcare costs for specific geographic areas,
benefits, reimbursement structures, and plan characteristics.
� Milliman Dental Discount Model – The discount model provides discounts by American
Dental Association (ADA) procedure code and class. The model was developed using
calendar year 2011 data from a combination of Milliman client data and Fairhealth data.
Statewide Nevada billed charges by ADA code were determined from the Dental HCGs and the
statewide commercial discounts applied. This produced a schedule of estimated commercial
reimbursement which is provided in Exhibit 2. We recommend the DIR use this schedule for Dental
services in the MFS.

Milliman Client Report
Provider Reimbursement Recommendations
January 13, 2015
22
ASC
Group
State of Nevada MFS as %
of Medicaid MFS(1)
Medicaid(2)
6. AMBULATORY SURGERY CENTERS
Reimbursement for Ambulatory Surgical Centers (ASCs) was analyzed using the current structure in
the MFS which pays using the nine ASC service groupings. Under this system, surgical HCPCS codes
map to these groupings and a payment is received for each mapped procedure performed during a
surgery. If multiple surgical services are performed during a single surgery, payment reductions apply
for the additional procedures.
This system was last used by Medicare in 2007 and then replaced by Medicare’s current Outpatient
Prospective Payment System (OPPS). Many institutions continue to use the ASC groupings for
reimbursement, and have maintained the HCPCS to ASC group mappings, updating them for new
surgical codes. One such institution is the State of Nevada Medicaid program, which was used as a
reference point in the ASC benchmarking analysis. Table 6.1 shows a comparison of the payments by
ASC for the MFS and the State of Nevada Medicaid fee schedule:
Table 6.1
Comparison of MFS and Medicaid ASC Schedules
ASC 1 $771.27 $399.60 193%
ASC 2 $988.78 $535.20 185%
ASC 3 $1,194.83 $612.00 195%
ASC 4 $1,478.14 $756.00 196%
ASC 5 $1,572.61 $860.40 183%
ASC 6 $1,854.49 $991.20 187%
ASC 7 $1,923.19 $1,167.60 165%
ASC 8 $1,923.19 $1,194.00 161%
ASC 9 $1,923.19 $1,606.80 120%
Unknown(3)
$1,923.19 $1,194.00 161%
1) Workers’ Comp pays the initial procedure at 100%, second at 50%, and subsequent ones at 25%.
2) Medicaid pays the initial procedure at 100%, second at 50%, third at 25%, fourth at 10%, and subsequent
ones at 5%.
3) A payment for unknown (i.e., unmapped) surgical procedures was not available in the MFS. The state
confirmed the use of the ASC 9 payment amount for this category.
With the exception of ASC 9, the Workers’ Comp schedule is roughly 60% to 95% higher than
Medicaid. The difference in final payments is even larger than this comparison suggests since
Medicaid has greater payment reductions for multiple procedures than the MFS.
Milliman Client Report
Provider Reimbursement Recommendations
January 13, 2015
23
Nevada Medicare
158%
92%
172%
Nevada Commercial 62% 33% 189%
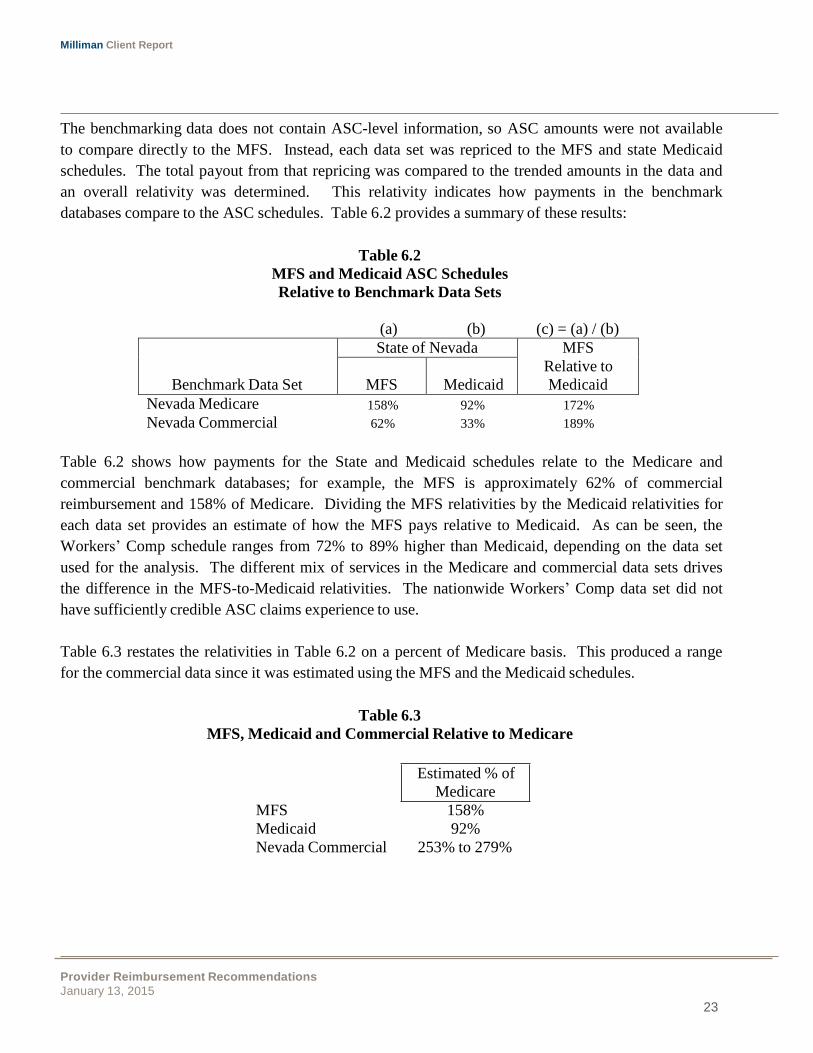
The benchmarking data does not contain ASC-level information, so ASC amounts were not available
to compare directly to the MFS. Instead, each data set was repriced to the MFS and state Medicaid
schedules. The total payout from that repricing was compared to the trended amounts in the data and
an overall relativity was determined. This relativity indicates how payments in the benchmark
databases compare to the ASC schedules. Table 6.2 provides a summary of these results:
Table 6.2
MFS and Medicaid ASC Schedules
Relative to Benchmark Data Sets
(a) (b) (c) = (a) / (b)
Benchmark Data Set
State of Nevada MFS
Relative to
Medicaid
MFS
Medicaid
Table 6.2 shows how payments for the State and Medicaid schedules relate to the Medicare and
commercial benchmark databases; for example, the MFS is approximately 62% of commercial
reimbursement and 158% of Medicare. Dividing the MFS relativities by the Medicaid relativities for
each data set provides an estimate of how the MFS pays relative to Medicaid. As can be seen, the
Workers’ Comp schedule ranges from 72% to 89% higher than Medicaid, depending on the data set
used for the analysis. The different mix of services in the Medicare and commercial data sets drives
the difference in the MFS-to-Medicaid relativities. The nationwide Workers’ Comp data set did not
have sufficiently credible ASC claims experience to use.
Table 6.3 restates the relativities in Table 6.2 on a percent of Medicare basis. This produced a range
for the commercial data since it was estimated using the MFS and the Medicaid schedules.
Table 6.3
MFS, Medicaid and Commercial Relative to Medicare
Estimated % of
Medicare
MFS 158%
Medicaid 92%
Nevada Commercial 253% to 279%
Milliman Client Report
Provider Reimbursement Recommendations
January 13, 2015
24
ASC Group
Recommended ASC Schedule
% of Current MFS
% of Medicaid
As can be seen, Medicaid reimbursement is below Medicare, which is fairly common for state
Medicaid programs. Commercial ASC reimbursement is notably higher, in the range of 253% to
279%, with 253% representing the value estimated with the MFS.
Recommendations
We recommend a target reimbursement level of 250% of Medicare; approximately the commercial
level estimated using the MFS. This represents a total increase of 58% (250% / 158% – 1) over the
current MFS ASC schedule.
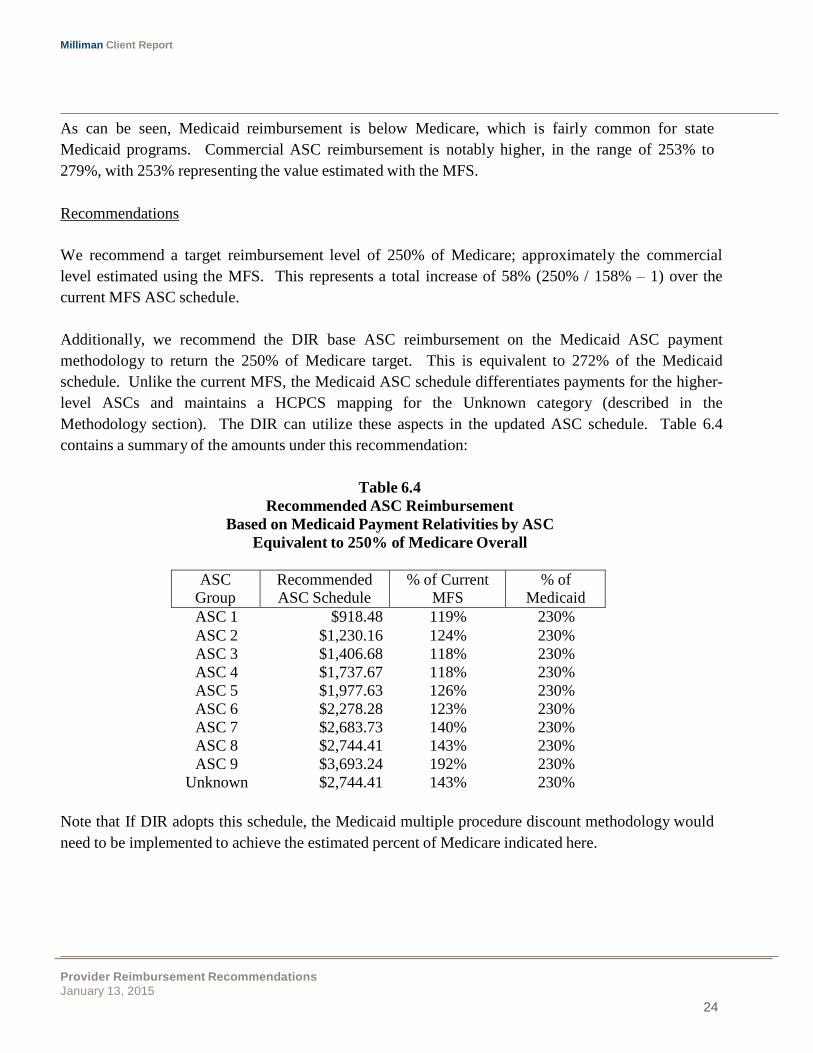
Additionally, we recommend the DIR base ASC reimbursement on the Medicaid ASC payment
methodology to return the 250% of Medicare target. This is equivalent to 272% of the Medicaid
schedule. Unlike the current MFS, the Medicaid ASC schedule differentiates payments for the higher-
level ASCs and maintains a HCPCS mapping for the Unknown category (described in the
Methodology section). The DIR can utilize these aspects in the updated ASC schedule. Table 6.4
contains a summary of the amounts under this recommendation:
Table 6.4
Recommended ASC Reimbursement
Based on Medicaid Payment Relativities by ASC
Equivalent to 250% of Medicare Overall
ASC 1 $918.48 119% 230%
ASC 2 $1,230.16 124% 230%
ASC 3 $1,406.68 118% 230%
ASC 4 $1,737.67 118% 230%
ASC 5 $1,977.63 126% 230%
ASC 6 $2,278.28 123% 230%
ASC 7 $2,683.73 140% 230%
ASC 8 $2,744.41 143% 230%
ASC 9 $3,693.24 192% 230%
Unknown $2,744.41 143% 230%
Note that If DIR adopts this schedule, the Medicaid multiple procedure discount methodology would
need to be implemented to achieve the estimated percent of Medicare indicated here.
Milliman Client Report
Provider Reimbursement Recommendations
January 13, 2015
25
7. PHARMACY
Reimbursement for pharmacy was analyzed at the National Drug Code (NDC) level and in total for
brand drugs and generic drugs. The commercial and nationwide Workers’ Comp benchmark datasets
were compared to one another, to the NCCI pharmacy payment amounts and to the September 2014
Average Wholesale Price (AWP) schedule published by MediSpan. The Medicare benchmark
database does not include pharmacy data and was excluded from the analysis.
Due to the different components of utilization for pharmaceuticals such as drug units, number of
scripts and days supply, all allowed amounts analyzed in this study were converted to a units per
package basis consistent with the MediSpan AWP schedule. Rebates are not part of the claims data or
reimbursement terms analyzed, and therefore are not considered in this analysis. We are effectively
assuming that the same rebates would be provided for workers’ comp scripts as for other types.
MFS reimbursement for pharmacy is the lesser of 100% of AWP and Usual and Customary (U&C)
charges plus a $10.01 dispensing fee. Information was not available for U&C levels in Nevada so a
comparison was done between 100% AWP and the average ingredient costs by NDC from the
benchmark databases.
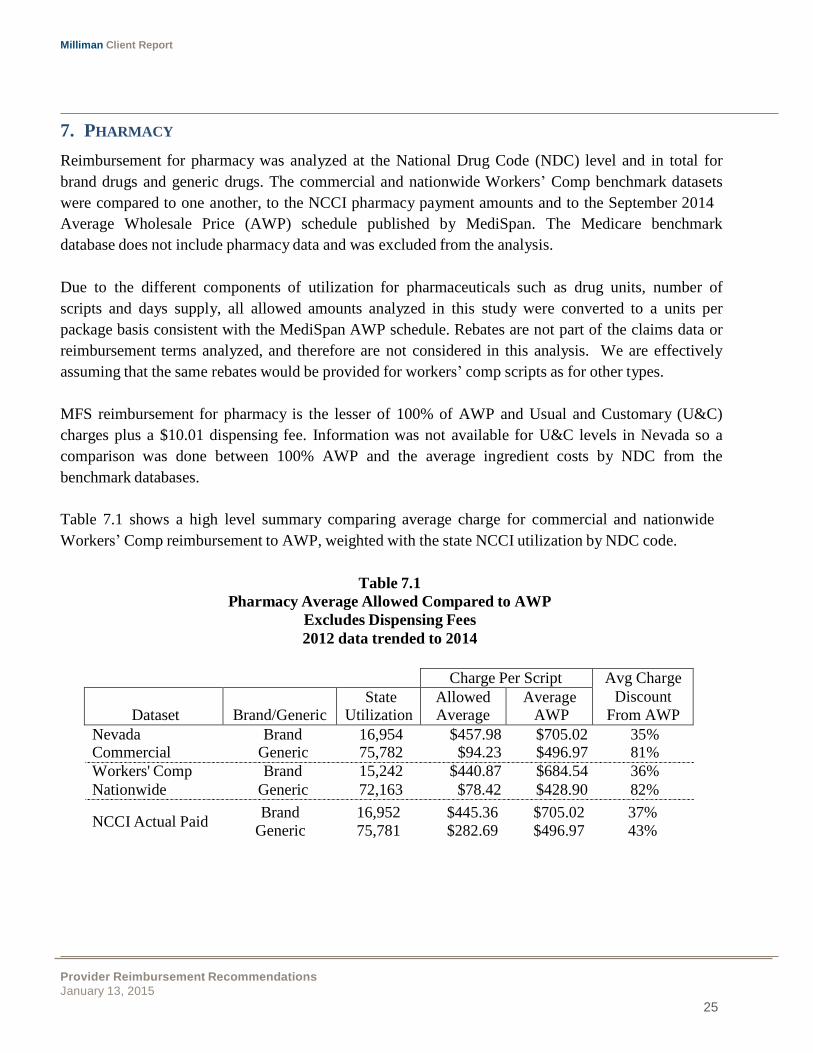
Table 7.1 shows a high level summary comparing average charge for commercial and nationwide
Workers’ Comp reimbursement to AWP, weighted with the state NCCI utilization by NDC code.
Table 7.1
Pharmacy Average Allowed Compared to AWP
Excludes Dispensing Fees
2012 data trended to 2014
Charge Per Script Avg Charge
Discount
From AWP
Dataset
Brand/Generic State
Utilization Allowed Average
Average AWP
Nevada Commercial
Workers' Comp
Nationwide
Brand 16,954 $457.98 $705.02 35% Generic 75,782 $94.23 $496.97 81%
Brand 15,242 $440.87 $684.54 36%
Generic 72,163 $78.42 $428.90 82%
NCCI Actual Paid Brand 16,952 $445.36 $705.02 37%
Generic 75,781 $282.69 $496.97 43%
Milliman Client Report
Provider Reimbursement Recommendations
January 13, 2015
26
As Table 7.1 shows, average charges for all three data sets are lower than AWP for both brand and
generic drugs. Nevada commercial and nationwide Workers’ Comp discounts from AWP are similar,
with generic discounts of around 80% and brand around 35%. The NCCI Actual Paid has a similar
brand discount, but generic is significantly different with average charges that are more than double
the commercial and nationwide Workers’ Comp schedule, producing a discount of 43% of AWP.
The difference between AWP and NCCI Actual Paid in Table 7.1 demonstrates that amounts lower
than AWP are typical. Whether this difference is driven by lower payer contracts like physician
reimbursement or by lower provider U&C amounts cannot be determined.. However this AWP
maximum allowable may be driving the high payments for generic drugs.
Other states’ Workers’ Comp medical fee schedules appear to use varied forms of pharmacy
reimbursement:
� Arizona has a separate maximum for brand and generic, with AWP less five percent for brand
and AWP less fifteen percent for generic.
� California follows the Medi-Cal fee schedule with a $7.25 surcharge.
� Utah pays at cost plus 15%.
Recommendations
AWP is still commonly used in the marketplace although its amounts are frequently discounted. To
maintain consistency, we recommend the DIR continue using AWP as the schedule basis, but employ
discounts to achieve reimbursement levels similar to the commercial and nationwide Workers’ Comp
levels shown in 7.1.
For brand drugs, discounts already appear to be fairly consistent with the market; however, discounts
on generic drugs are half the market resulting in considerably higher payments for Nevada Workers’
Comp. Based on this, we recommend separate reimbursement terms for brand and generic drugs:
� Brand reimbursement: lesser of 100% of AWP and U&C
� Generic reimbursement: lesser of 80% of AWP and U&C

Milliman Client Report
Provider Reimbursement Recommendations
January 13, 2015
27
This approach of varying reimbursement between brand and generic is commonly used amongst
Pharmacy Benefit Managers (PMBs). Using 80% of AWP may not necessarily achieve the same
discounts shown for commercial Nevada and nationwide Workers’ Comp, but it should bring the
payout closer and additional discounts may be built in over time as the DIR moves closer to market
reimbursement for pharmacy.
Dispensing Fees
We compared dispensing fees for the Nevada Commercial and the Nationwide Workers’ Comp data to
the current MFS reimbursement. For the mix of drugs utilized in the NCCI data, dispensing fees are
similar between the two benchmarks with an average of $7.72 for Commercial and $7.91 for
Nationwide Workers’ Comp. The current MFS dispensing fee of $10.01 is notably higher than these
benchmarks. We recommend reducing MFS dispensing fees to $7.91 to be consistent with
Commercial reimbursement.
Pharmacy Compounding
Pharmacy compounds submitted to payers should be adjudicated as a single Rx with all ingredients
combined and not with each ingredient billed separately. There are override codes used to inform the
payer of compounded claims to reimburse specifically for the covered products, and to exclude
payment for any non-covered excluded items (e.g., sterile water, Diluents, compounding vehicles, etc).
Depending on each specific contract, the payer should reimburse based upon the covered products
submitted plus any compounding fees negotiated under their contract. Given the special nature of
compounds, we recommend the DIR not have explicit provisions for these in the pharmacy schedule,
but instead rely on the local payer contracts.
Milliman Client Report
Provider Reimbursement Recommendations
January 13, 2015
28
8. AMBULANCE, DME AND PROSTHETICS
Ambulance, DME and Prosthetics reimbursement was analyzed using Milliman GlobalRVUsTM
. The
GlobalRVUs are a system of relative value units (RVUs) developed by Milliman to cover the entire
range of medical and prescription drug services, including hospital and physician in the same RVU
system. GlobalRVUs are described in more detail in the Relative Value Units section.
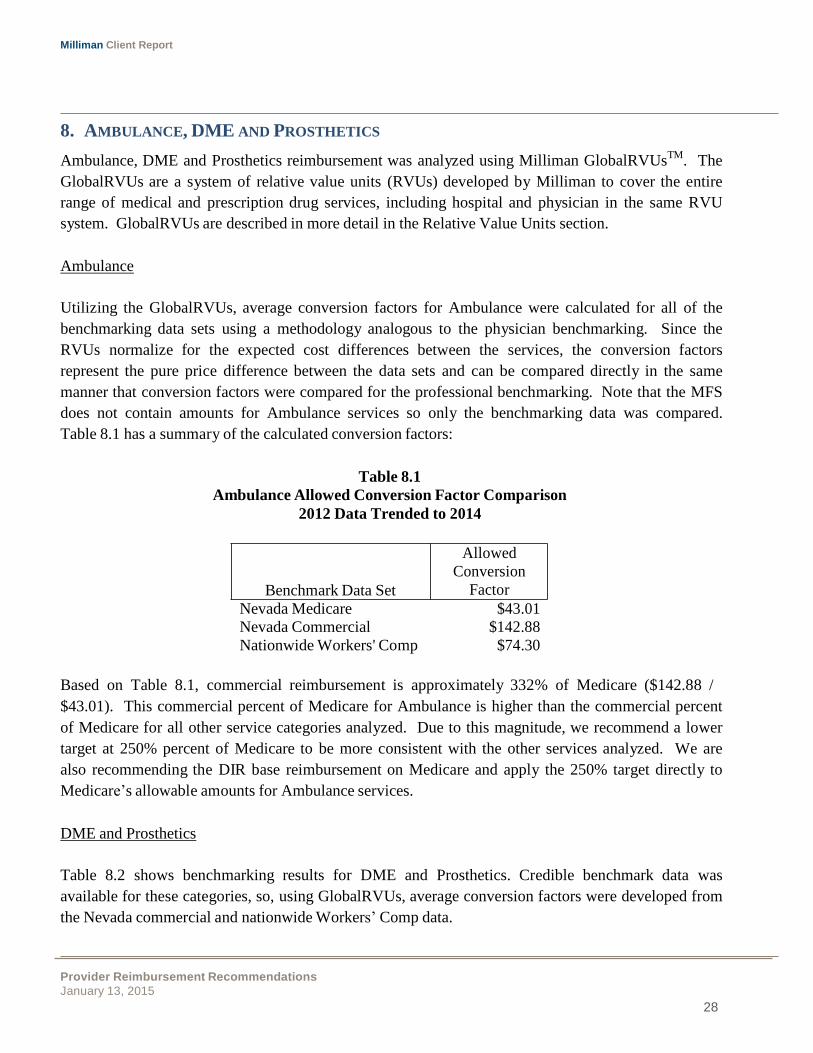
Ambulance
Utilizing the GlobalRVUs, average conversion factors for Ambulance were calculated for all of the
benchmarking data sets using a methodology analogous to the physician benchmarking. Since the
RVUs normalize for the expected cost differences between the services, the conversion factors
represent the pure price difference between the data sets and can be compared directly in the same
manner that conversion factors were compared for the professional benchmarking. Note that the MFS
does not contain amounts for Ambulance services so only the benchmarking data was compared.
Table 8.1 has a summary of the calculated conversion factors:
Table 8.1
Ambulance Allowed Conversion Factor Comparison
2012 Data Trended to 2014
Benchmark Data Set
Allowed
Conversion
Factor
Nevada Medicare $43.01
Nevada Commercial $142.88
Nationwide Workers' Comp $74.30
Based on Table 8.1, commercial reimbursement is approximately 332% of Medicare ($142.88 /
$43.01). This commercial percent of Medicare for Ambulance is higher than the commercial percent
of Medicare for all other service categories analyzed. Due to this magnitude, we recommend a lower
target at 250% percent of Medicare to be more consistent with the other services analyzed. We are
also recommending the DIR base reimbursement on Medicare and apply the 250% target directly to
Medicare’s allowable amounts for Ambulance services.
DME and Prosthetics
Table 8.2 shows benchmarking results for DME and Prosthetics. Credible benchmark data was
available for these categories, so, using GlobalRVUs, average conversion factors were developed from
the Nevada commercial and nationwide Workers’ Comp data.

Milliman Client Report
Provider Reimbursement Recommendations
January 13, 2015
29
Table 8.2
DME Reimbursement
GlobalRVUs Allowed Conversion Factors
Nevada Nationwide
Service Category Commercial Workers' Comp
DME $34.04 $31.17
Prosthetics $39.65 $59.45
DME reimbursement are fairly similar for the Nevada commercial and nationwide Workers’ Comp,
but, Prosthetics nationwide reimbursement is roughly 50% higher than commercial. The MFS
currently pays DME at cost plus 20%. We do not have benchmark data on DME costs, so we were not
able to compare DME reimbursement to the benchmark results.
For DME and Prosthetics, we recommend the DIR follow a similar RVU-based reimbursement
approach using the GlobalRVUs for DME and Prosthetics along with the commercial conversion
factors shown in Table 8.2 to calculate reimbursement. Exhibit 3 contains GlobalRVUs for each of the
DME and Prosthetics procedure codes.
Given the additional complexity of preparing Custom Orthotics, we recommend defining
reimbursement for these services as 20% higher than the Prosthetics level. Keying off the commercial
conversion factor in Table 8.2, this means payment using a conversion factor of $47.58 (1.2 x $39.65),
when RBRVS units are available. For custom orthotics without RBRVS units assigned, we
recommend maintaining the existing basis (Medicare plus 40%). We observe that this is a relatively
new and rapidly changing service category. It may be several years before sufficient data exists upon
which to base reliable reimbursement recommendations.
Milliman Client Report
Provider Reimbursement Recommendations
January 13, 2015
30
9. INDEPENDENT MEDICAL EXAMS AND PERMANENT PARTIAL DISABILITY
The DIR requested consideration be given to how Independent Medical Exams (IMEs) and Permanent
Partial Disability Exams (PPDs) are reimbursed. We note that the payment for independent medical
examinations is not a normal component of Medicare’s RBRVS. We have examined the payment
systems for a number of states and have concluded that it could be advantageous for the payment for
IME's to be split into three components:
1) Review and Report
2) Additional review needed for a complex case; and
3) A complexity factor
Review and Report
The first component should include and examination of the patient, a review of up to 50 pages of
medical records, and the preparation of an appropriate report. We recommend that the base rate be set
in the range of $500 to $600, to be set based on input from stakeholders.
Additional Review Needed for Complex Cases
The second component recognizes the quantity of work required to review a complex case. We note
that, at times, a straightforward case will have very lengthy medical records that require extensive time
to review. We believe the most logical way to quantify the amount of work required is the actual page
count of the file that is reviewed by the physician. The current alternative of including the time spent
reviewing records can and has been difficult to verify. The page count can instead be measured
accurately by the scanner of the payer requesting the review.
We recommend that a blended rate be used, since there is a wide spectrum of types of medical records
to review, reflecting a wide disparity in the density of detail, and hence a variation in the effort
required to review. Some types of medical records would include dense information, such as seen in
consultant’s reports. At the other end of the spectrum is a hospital record, which includes the vast
amount of information recorded in the hourly management of a hospitalized patient. By using a
blended rate between the two extreme types of files, a fair, reasonable and accurate compensation rate
may be established. Since both the payer and the consultant are aware of the exact size of the file,
disagreements should be minimized.
Having examined payments for IMEs in other states, we recommend that the rate be $250 per 100 to
200 pages of medical records, beyond the initial 50 pages included in the base rate. The exact number
should be determined by the DIR, with input from stakeholders.
Milliman Client Report
Provider Reimbursement Recommendations
January 13, 2015
31
Complexity Factor
The complexity of each case can be reflected in a modification of the first payment (for Review and
Report). One potential approach is to reflect the complexity in the number of body parts pertinent to
each claim, beyond the first. The modifier could be either an add-on or a multiplier of the first
payment factor. Considering each method, we believe an add-on would be preferable and would lead
to greater uniformity and to fewer disagreements. We specifically recommend an additional additive
factor of between 20% and 50% (to be determined in discussions with stakeholders) of the original
Review and Report charge for the third accepted body part. We recommend that an additive factor of
between 10% and 30% for each additional body part beyond the third. It is our understanding that you
have defined what may be counted as a body part with sufficient clarify and that setting a maximum to
the total complexity payment is not necessary.
The additive complexity factors would be added to the sum of the base and “additional” medical
record compensation to achieve the final payment.
PPDs
Regarding payment for PPDs, modifications may not be desired. If changes are made however, we
believe the above methodology would work well for the payment of PPDs as well.
Milliman Client Report
Provider Reimbursement Recommendations
January 13, 2015
32
ER Severity
Level
NCCI State Utilization
Distribution
Nevada
Medicare
Nevada
Commercial
Nationwide
Workers' Comp
10.REMAINING MISCELLANEOUS SERVICES
Emergency Room
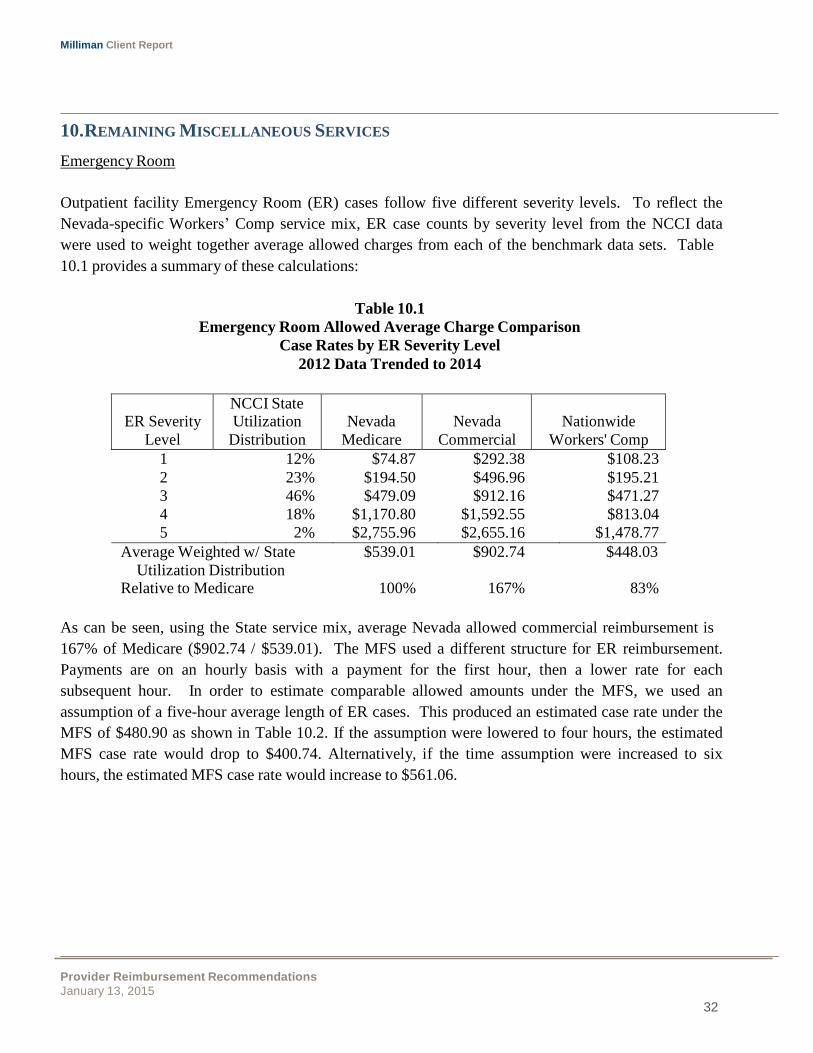
Outpatient facility Emergency Room (ER) cases follow five different severity levels. To reflect the
Nevada-specific Workers’ Comp service mix, ER case counts by severity level from the NCCI data
were used to weight together average allowed charges from each of the benchmark data sets. Table
10.1 provides a summary of these calculations:
Table 10.1
Emergency Room Allowed Average Charge Comparison
Case Rates by ER Severity Level
2012 Data Trended to 2014
1 12% $74.87 $292.38 $108.23
2 23% $194.50 $496.96 $195.21
3 46% $479.09 $912.16 $471.27
4 18% $1,170.80 $1,592.55 $813.04
5 2% $2,755.96 $2,655.16 $1,478.77
Average Weighted w/ State
Utilization Distribution $539.01 $902.74 $448.03
Relative to Medicare 100% 167% 83%
As can be seen, using the State service mix, average Nevada allowed commercial reimbursement is
167% of Medicare ($902.74 / $539.01). The MFS used a different structure for ER reimbursement.
Payments are on an hourly basis with a payment for the first hour, then a lower rate for each
subsequent hour. In order to estimate comparable allowed amounts under the MFS, we used an
assumption of a five-hour average length of ER cases. This produced an estimated case rate under the
MFS of $480.90 as shown in Table 10.2. If the assumption were lowered to four hours, the estimated
MFS case rate would drop to $400.74. Alternatively, if the time assumption were increased to six
hours, the estimated MFS case rate would increase to $561.06.
Milliman Client Report
Provider Reimbursement Recommendations
January 13, 2015
33
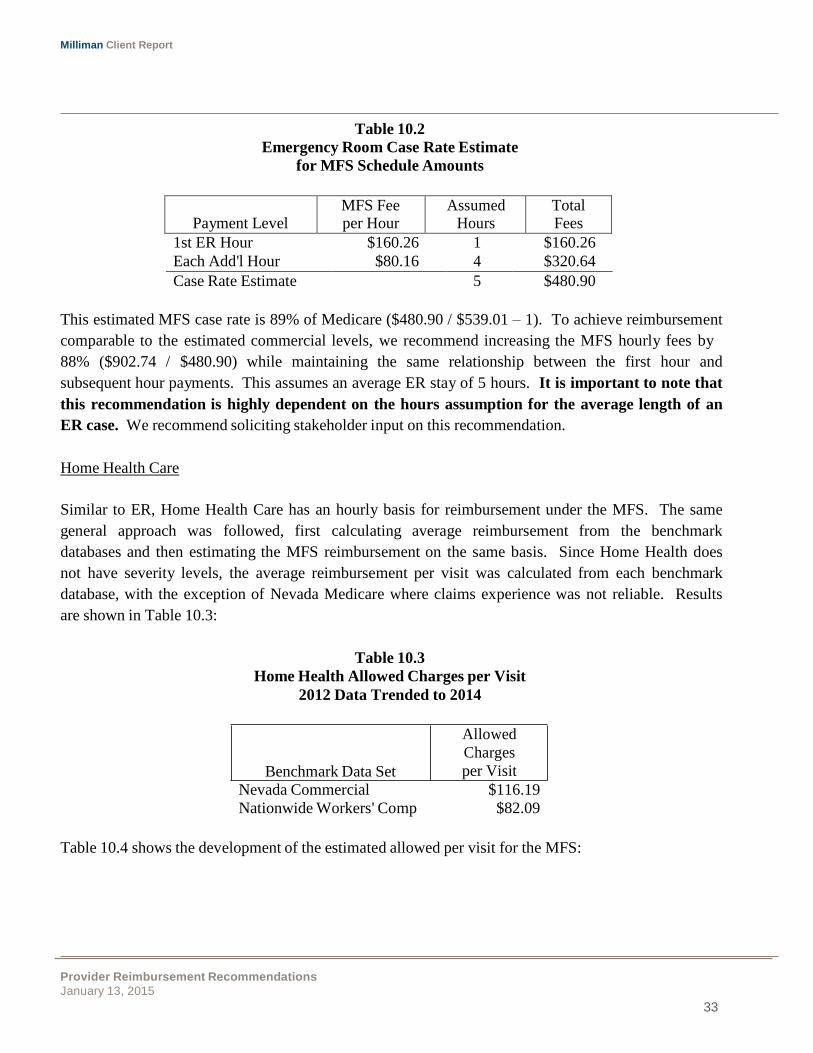
Payment Level
MFS Fee per Hour
Assumed Hours
Total Fees
Table 10.2
Emergency Room Case Rate Estimate
for MFS Schedule Amounts
1st ER Hour $160.26 1 $160.26
Each Add'l Hour $80.16 4 $320.64
Case Rate Estimate 5 $480.90
This estimated MFS case rate is 89% of Medicare ($480.90 / $539.01 – 1). To achieve reimbursement
comparable to the estimated commercial levels, we recommend increasing the MFS hourly fees by
88% ($902.74 / $480.90) while maintaining the same relationship between the first hour and
subsequent hour payments. This assumes an average ER stay of 5 hours. It is important to note that
this recommendation is highly dependent on the hours assumption for the average length of an
ER case. We recommend soliciting stakeholder input on this recommendation.
Home Health Care
Similar to ER, Home Health Care has an hourly basis for reimbursement under the MFS. The same
general approach was followed, first calculating average reimbursement from the benchmark
databases and then estimating the MFS reimbursement on the same basis. Since Home Health does
not have severity levels, the average reimbursement per visit was calculated from each benchmark
database, with the exception of Nevada Medicare where claims experience was not reliable. Results
are shown in Table 10.3:
Table 10.3
Home Health Allowed Charges per Visit
2012 Data Trended to 2014
Benchmark Data Set
Allowed
Charges
per Visit
Nevada Commercial $116.19
Nationwide Workers' Comp $82.09
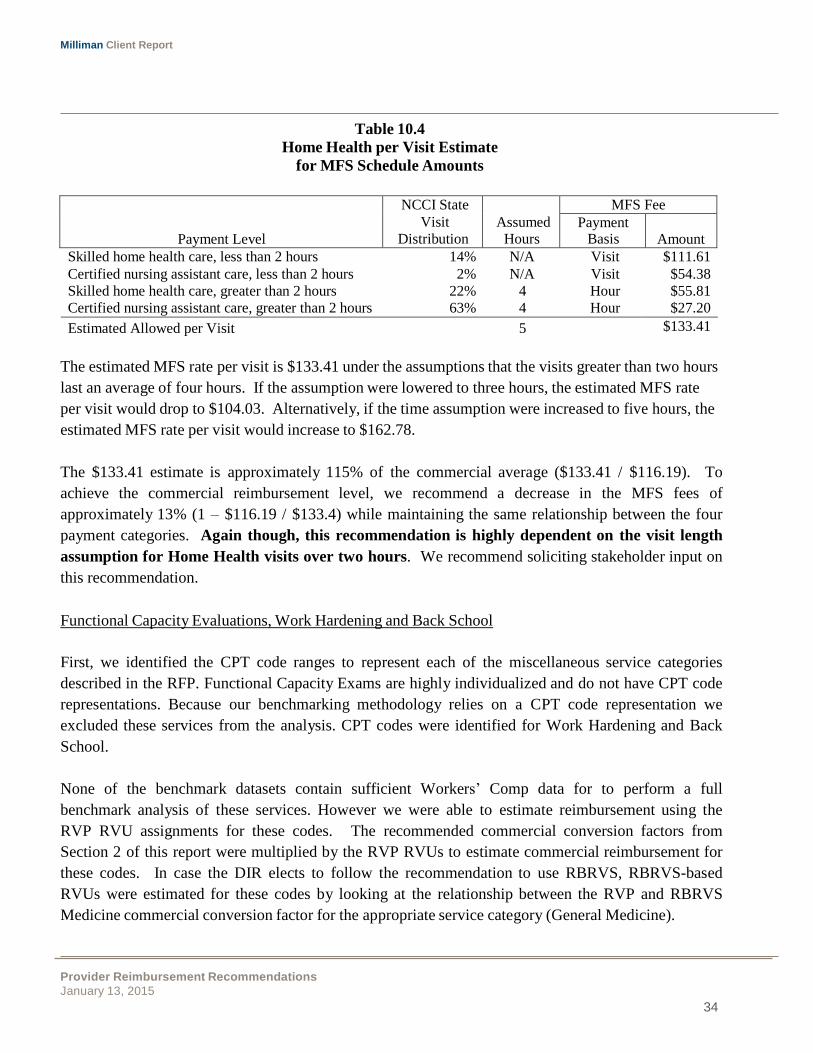
Table 10.4 shows the development of the estimated allowed per visit for the MFS:
Milliman Client Report
Provider Reimbursement Recommendations
January 13, 2015
34
Payment Level
NCCI State
Visit
Distribution
Assumed
Hours
MFS Fee
Payment Basis
Amount
Table 10.4
Home Health per Visit Estimate
for MFS Schedule Amounts
Skilled home health care, less than 2 hours 14% N/A Visit $111.61
Certified nursing assistant care, less than 2 hours 2% N/A Visit $54.38
Skilled home health care, greater than 2 hours 22% 4 Hour $55.81
Certified nursing assistant care, greater than 2 hours 63% 4 Hour $27.20
Estimated Allowed per Visit 5 $133.41
The estimated MFS rate per visit is $133.41 under the assumptions that the visits greater than two hours
last an average of four hours. If the assumption were lowered to three hours, the estimated MFS rate
per visit would drop to $104.03. Alternatively, if the time assumption were increased to five hours, the
estimated MFS rate per visit would increase to $162.78.
The $133.41 estimate is approximately 115% of the commercial average ($133.41 / $116.19). To
achieve the commercial reimbursement level, we recommend a decrease in the MFS fees of
approximately 13% (1 – $116.19 / $133.4) while maintaining the same relationship between the four
payment categories. Again though, this recommendation is highly dependent on the visit length
assumption for Home Health visits over two hours. We recommend soliciting stakeholder input on
this recommendation.
Functional Capacity Evaluations, Work Hardening and Back School
First, we identified the CPT code ranges to represent each of the miscellaneous service categories
described in the RFP. Functional Capacity Exams are highly individualized and do not have CPT code
representations. Because our benchmarking methodology relies on a CPT code representation we
excluded these services from the analysis. CPT codes were identified for Work Hardening and Back
School.
None of the benchmark datasets contain sufficient Workers’ Comp data for to perform a full
benchmark analysis of these services. However we were able to estimate reimbursement using the
RVP RVU assignments for these codes. The recommended commercial conversion factors from
Section 2 of this report were multiplied by the RVP RVUs to estimate commercial reimbursement for
these codes. In case the DIR elects to follow the recommendation to use RBRVS, RBRVS-based
RVUs were estimated for these codes by looking at the relationship between the RVP and RBRVS
Medicine commercial conversion factor for the appropriate service category (General Medicine).
Milliman Client Report
Provider Reimbursement Recommendations
January 13, 2015
35
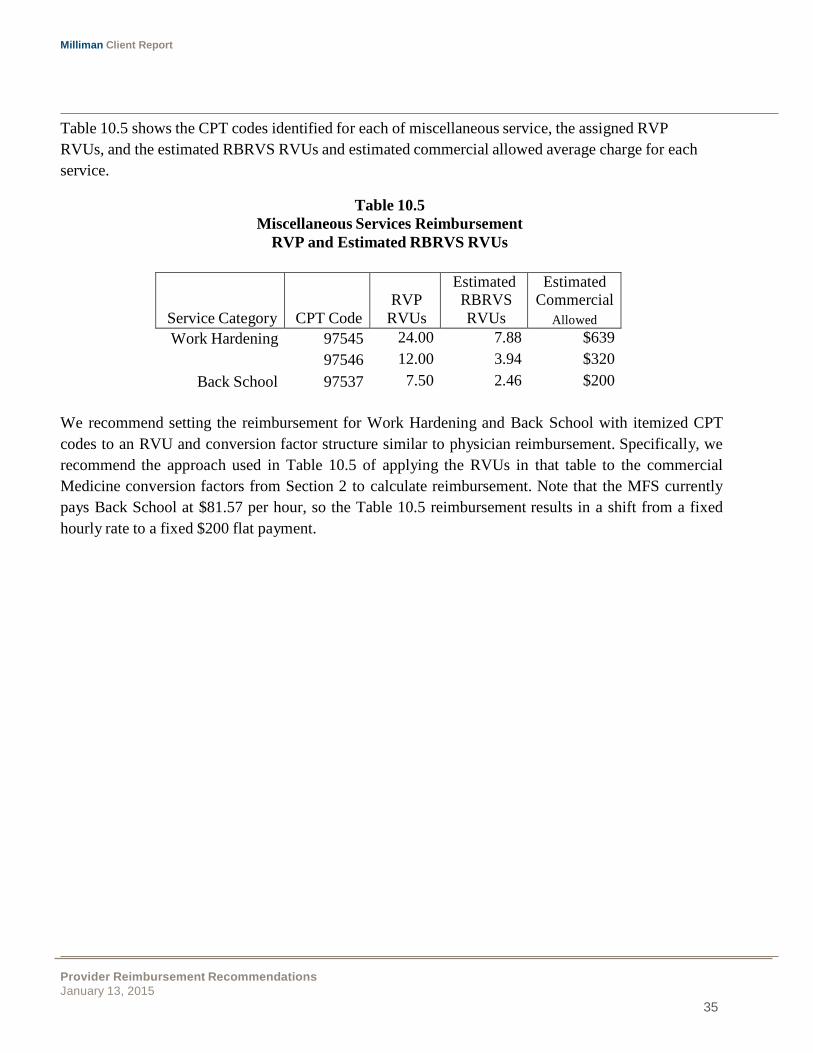
Service Category
CPT Code
RVP
RVUs
Estimated RBRVS
RVUs
Estimated Commercial
Allowed
Table 10.5 shows the CPT codes identified for each of miscellaneous service, the assigned RVP
RVUs, and the estimated RBRVS RVUs and estimated commercial allowed average charge for each
service.
Table 10.5
Miscellaneous Services Reimbursement
RVP and Estimated RBRVS RVUs
Work Hardening 97545 24.00 7.88 $639
97546 12.00 3.94 $320
Back School 97537 7.50 2.46 $200
We recommend setting the reimbursement for Work Hardening and Back School with itemized CPT
codes to an RVU and conversion factor structure similar to physician reimbursement. Specifically, we
recommend the approach used in Table 10.5 of applying the RVUs in that table to the commercial
Medicine conversion factors from Section 2 to calculate reimbursement. Note that the MFS currently
pays Back School at $81.57 per hour, so the Table 10.5 reimbursement results in a shift from a fixed
hourly rate to a fixed $200 flat payment.
Milliman Client Report
Provider Reimbursement Recommendations
January 13, 2015
36
11.BUNDLING OF CHARGES
Bundling services for payment is a common practice in the industry and can vary from the discounting
of individual services when performed with other services, to full episode-based payments that cover
all services (e.g., hospital, physician, drugs) related to a particular condition such as hip replacement
or coronary bypass surgery.
In both instances, the intent is to lower costs by recognizing and encouraging efficiencies gained when
these services are performed and/or coordinated with each other. Bundling is an improvement over
regular fee-for-service (FFS) reimbursement because it discourages unnecessary services and
improves coordination of care across providers. Compared to capitation, which is on the other end of
the managed care spectrum from FFS reimbursement, bundling focuses on a set payment for an
instance of care. It does not penalize a provider if multiple instances occur for a member but rather
rewards efficiencies for each instance.
Bundling does present challenges such as determining what services can be bundled and what the
bundled payment should be. These challenges are most prevalent with episode-based reimbursement
since it covers all services associated with an episode. Separating the services for that episode from
other non-related services can be a complex process for some conditions (e.g., diabetes). There are
different grouper methodologies in the market, such as Episode Treatment Groups (ETGs), each with
its own grouper software needed to determine the episode groupings.
The MFS already utilizes a simpler form of bundling with its Ambulatory Surgical Center (ASC)
payment groups. When multiple reimbursable services are performed during an outpatient surgery,
the non-primary services are paid at a discounted rate. The MFS currently discounts them as 50% for
the second procedure and 75% for each successive procedure (ranked based on payment amount, with
the procedure with the highest reimbursement level assumed to be primary). These discounts
represent a type of bundling whereby the payment for the additional procedures reflects the reduced
effort to perform them when done with the primary procedure.
Medicare contains multiple examples of bundling worth considering. Examples are provided below
by type of service:
� Professional
o A set of procedures in RBRVS are flagged for bundled payment only. These services
are only performed along with other services and Medicare provides no separate
payment for them.
Milliman Client Report
Provider Reimbursement Recommendations
January 13, 2015
37
o Multiple and bilateral surgeries have a payment reduction. These are identified by the
modifiers on the surgical services and it is expected that the MFS already considers
them.
o For surgery-related services performed preoperatively and postoperatively by the
surgeon, Medicare provides no additional payments. It is assumed that the payment for
the surgical procedures include these additional services.
� Outpatient – The majority of Medicare outpatient services are now reimbursed on an
Ambulatory Payment Classification (APC) basis. APCs are similar to the ASC payment
groups in that procedures are assigned to payment categories and if multiple payment
categories occur on a single claim, the non-primary procedures are discounted. However, the
APC system is much more extensive and covers most outpatient services, including surgery. It
is our understanding that the ASC methodology has worked well for Nevada, and we do not
recommend changing to APCs, due to the complexity.
� Inpatient – Inpatient facility payments are made on a Diagnostic Related Group (DRG) basis.
Each inpatient admission is assigned a single DRG and receives a case payment based on that
DRG that covers the entire admit. An additional, outlier payment may also occur, but admits
are primarily covered by the single DRG payment.
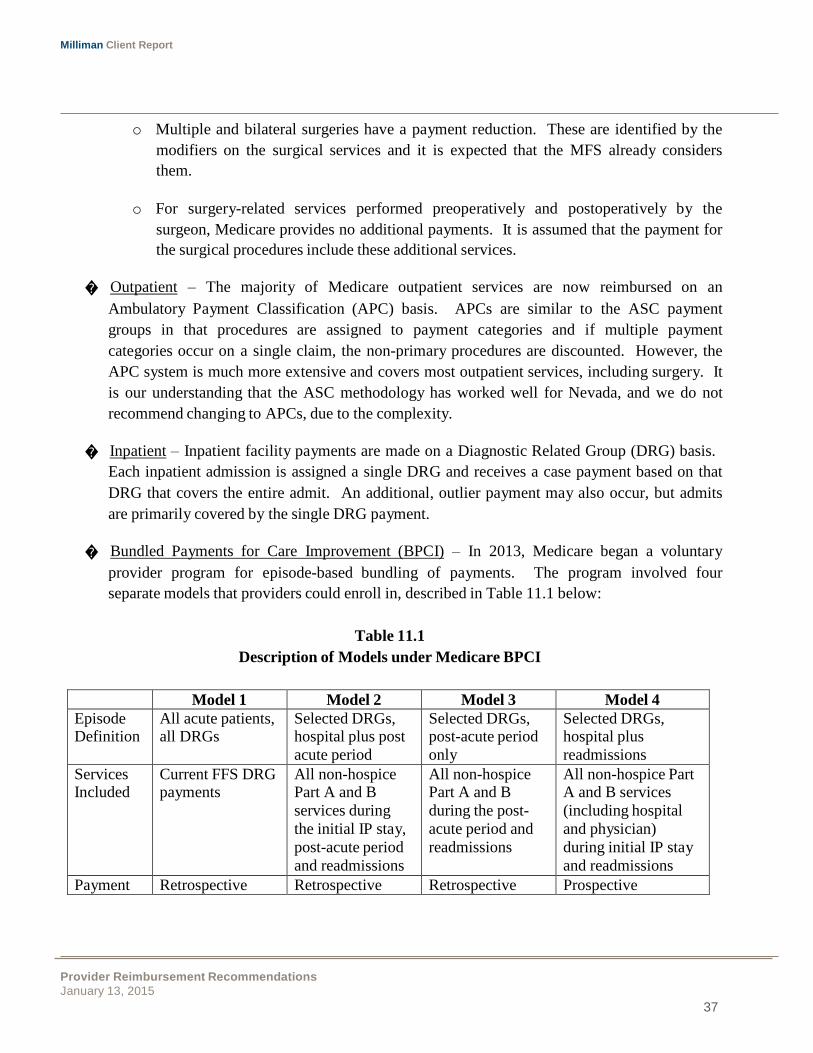
� Bundled Payments for Care Improvement (BPCI) – In 2013, Medicare began a voluntary
provider program for episode-based bundling of payments. The program involved four
separate models that providers could enroll in, described in Table 11.1 below:
Table 11.1
Description of Models under Medicare BPCI
Model 1 Model 2 Model 3 Model 4
Episode Definition
All acute patients, all DRGs
Selected DRGs, hospital plus post
acute period
Selected DRGs, post-acute period
only
Selected DRGs, hospital plus
readmissions
Services Included
Current FFS DRG payments
All non-hospice Part A and B
services during
the initial IP stay,
post-acute period
and readmissions
All non-hospice Part A and B
during the post-
acute period and
readmissions
All non-hospice Part A and B services
(including hospital
and physician)
during initial IP stay
and readmissions
Payment Retrospective Retrospective Retrospective Prospective
Milliman Client Report
Provider Reimbursement Recommendations
January 13, 2015
38
The program continues today and is still on a voluntary basis. Provider participation varies
notably between the different models, with the large majority enrolled in Model 4. If deemed
successful, these programs may result in fundamental changes to Medicare payments. The
DIR should monitor these programs and consider revising their schedule if necessary. The
following website contains more information on the BPCI program:
http://innovation.cms.gov/initiatives/bundled-payments/
Recommendations
Our current MFS recommendations already include some bundling aspects. For physician, we
recommend the use of RBRVS which identifies specific services that are bundled and have no separate
payments. Additionally for physician, the DIR should consider implementing the other Medicare
payments rules such as the surgery-related items regarding multiple/bilateral procedures and pre and
postoperative care; however, it is likely that the local payers administering the professional are already
considering these items. We recommend confirming that is the case.
For inpatient, our MFS recommendations include the use of DRGs which are a bundled case rate
payment for the entire admit. DRGs encourage hospitals to be more efficient in providing the care
since there is no financial incentive for a hospital to keep the patient longer than necessary. Such an
incentive exists with the current MFS per diem-based payments.
Although we have no further bundling recommendations, the DIR should still consider other bundling
options due to the potential savings and administrative simplifications.
Milliman Client Report
Provider Reimbursement Recommendations
January 13, 2015
39
12.METHODOLOGY
The data sources and steps taken in the analysis are described in detail in this section.
Data Sources
Multiple data sources were used to assess reimbursement levels in Nevada, including:
� Commercial/Workers’ Comp – A 2012 database with detailed commercial and Workers’ Comp
claims information for all areas of the country was used. The database contains allowed
amounts that reflect the provider contracted amount before member cost sharing, and paid
amounts after member cost sharing. Providers and payers are blinded in the data. For the state
of Nevada, the commercial data was sufficiently credible to be analyzed as a separate data set
in the benchmarking. The Workers’ Comp data for Nevada however was not credible, so the
full nationwide Workers’ Comp data from the database was used.
� Medicare Fee-for-Service (FFS) –Medicare FFS data was available for 2012. The claims
information contained billed, allowed and paid amounts.
� NCCI Nevada Workers’ Comp – The NCCI provided a summary of 2012 utilization and
payments by procedure for Workers’ Comp claims in Nevada. Information was at the statewide
level. Due to variations in coding by the different state payers that administered the claims, the
NCCI information could only be used in the analysis for a subset of the services analyzed (e.g.,
professional, Emergency Room).
� Milliman’s GlobalRVUs
TM – This source was described in detail in the body of the report.
As requested, the billed, allowed and paid amounts from each data set are defined as follows:
� Billed – Corresponds to the charges the health care provider bills for medical services
provided.
� Allowed – For commercial, the allowed amount generally represents the contracted/allowed
amount agreed upon with the provider which considers the discount from billed. This would
also typically be the maximum reimbursement relevant to the appropriate MFS per date of
service. For Workers’ Comp, some carriers may be using this field to identify the maximum
amount payable under the MFS.
� Paid – Reflects actual payment made to the health care provider. For commercial and
Medicare, these may also be considered allowed amounts excluding member cost sharing.
Milliman Client Report
Provider Reimbursement Recommendations
January 13, 2015
40
Calculation Steps
The following steps were taken in the calculations:
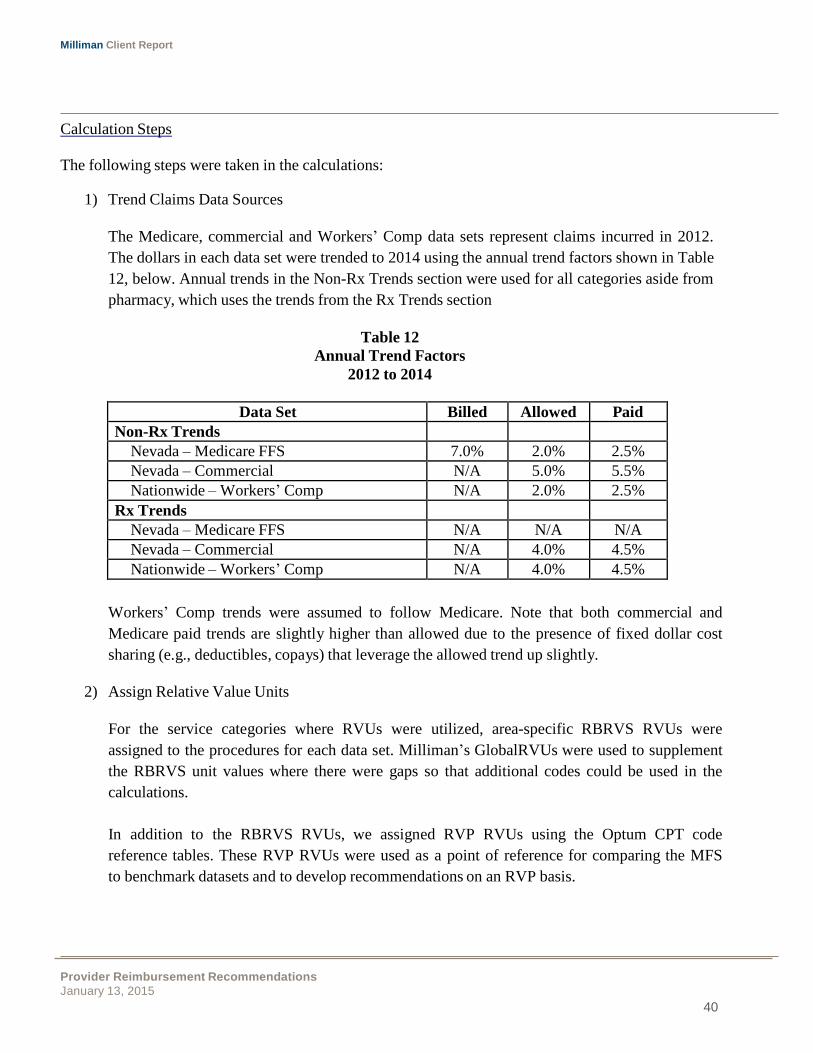
1) Trend Claims Data Sources
The Medicare, commercial and Workers’ Comp data sets represent claims incurred in 2012.
The dollars in each data set were trended to 2014 using the annual trend factors shown in Table
12, below. Annual trends in the Non-Rx Trends section were used for all categories aside from
pharmacy, which uses the trends from the Rx Trends section
Table 12
Annual Trend Factors
2012 to 2014
Data Set Billed Allowed Paid
Non-Rx Trends
Nevada – Medicare FFS 7.0% 2.0% 2.5%
Nevada – Commercial N/A 5.0% 5.5%
Nationwide – Workers’ Comp N/A 2.0% 2.5%
Rx Trends
Nevada – Medicare FFS N/A N/A N/A
Nevada – Commercial N/A 4.0% 4.5%
Nationwide – Workers’ Comp N/A 4.0% 4.5%
Workers’ Comp trends were assumed to follow Medicare. Note that both commercial and
Medicare paid trends are slightly higher than allowed due to the presence of fixed dollar cost
sharing (e.g., deductibles, copays) that leverage the allowed trend up slightly.
2) Assign Relative Value Units
For the service categories where RVUs were utilized, area-specific RBRVS RVUs were
assigned to the procedures for each data set. Milliman’s GlobalRVUs were used to supplement
the RBRVS unit values where there were gaps so that additional codes could be used in the
calculations.
In addition to the RBRVS RVUs, we assigned RVP RVUs using the Optum CPT code
reference tables. These RVP RVUs were used as a point of reference for comparing the MFS
to benchmark datasets and to develop recommendations on an RVP basis.
Milliman Client Report
Provider Reimbursement Recommendations
January 13, 2015
41
3) Summarize Average Dollars by Procedure, DRG or Category
The summarization process varied based on the type of service analyzed, as described below:
Physician Services Including Substance Abuse
For the commercial, Workers’ Comp and Medicare claims data sets, average dollars were
summarized by procedure code (HCPCS) and modifier. For the Medicare data, this consisted
of average billed, allowed and paid amounts. For commercial and Workers’ Comp, only
allowed and paid amounts were available for both the commercial and Workers’ Comp data.
To estimate maximum allowable reimbursement levels, we analyzed the distribution of
commercial allowed charges for a set of high-volume procedure codes. We calculated the
distribution of allowed payments for each of these codes and then estimated the impact that
applying a maximum allowable at different levels has on the final average allowed payments.
Using these results, we developed an adjustment factor to transform benchmark dataset
averages to our final maximum allowable recommendations.
Dental
Benchmark data was not available for Dental services, so a commercial schedule was
determined through the combination of billed charges from the Milliman Health Cost
Guidelines, Dental Volume and commercial discounts.
Hospital and Other Inpatient
For the commercial, Workers’ Comp and Medicare claims data sets, average dollars (billed,
allowed and paid) were summarized by DRG and by inpatient category (definitions provided in
Section 4).
The NCCI coding available for the inpatient data was insufficient to assign category. Therefore
state utilization was not used to reweight the data for this analysis. The service category
results reflect the service utilization mix of the benchmark populations.
Ambulatory Surgery Centers
Ambulatory Surgery Center reimbursement was analyzed under the current structure in the
state schedule where payments are made under nine ASC services groupings. This structure is
based on a surgical HCPCS mapping that is in use by Nevada Medicaid.
Milliman Client Report
Provider Reimbursement Recommendations
January 13, 2015
42
The benchmark claims data were repriced under both the MFS and Medicaid’s ASC schedule
using those schedules’ payment rates and multiple procedure payment reductions. This was
done by assigning ASC service grouping based on HCPCS code, looking up appropriate
payments from the two schedules, and applying additional payment rules as required. Note
that the Medicaid schedule did not have an amount specified for unknown procedures so the
amount for ASC group 8 was used based on our experience with other ASC schedules and their
payment relationships.
Prescription Drug
The Medicare claims dataset was excluded from the analysis because it does not contain
pharmacy claims. For the commercial, Workers’ Comp and Medicare claims data sets, average
dollars were summarized by NDC. For commercial and Workers’ Comp, we analyzed allowed
dollars net of dispensing fees for both the commercial and Workers’ Comp data.
After the data were summarized, the average units per package were calculated and compared
to the units per package assumed in the MediSpan AWP reference table. When necessary, the
average per-prescription charges were adjusted to normalize units per script to match the AWP
reference.
The NCCI utilization data for Nevada Workers’ Comp was used to weight the average charges
for high level summaries of brand and generic drugs in total.
We assumed that the paid amounts in the NCCI pharmacy data do not include dispensing fees.
This assumption is based on the low average paid amounts that appear in the NCCI data for
some drugs, which suggest that dispensing fees are excluded.
Ambulance, DME, ER and Home Health
For the commercial and Workers’ Comp claims data sets, average dollars were summarized by
HCPCS and modifier. For the Medicare data, this consisted of average billed, allowed and
paid amounts. Only allowed and paid amounts were available for both the commercial and
Workers’ Comp data. We categorized claims according based on claim line level into the
miscellaneous service categories using logic consistent with the Milliman Health Cost
Guidelines. The categories included are:

Milliman Client Report
Provider Reimbursement Recommendations
January 13, 2015
43
� Ambulance,
� Durable Medical Equipment,
� Emergency Room Facility, and
� Home Health
The NCCI utilization data for Nevada Workers’ Comp was used to weight the average charges
for each of the data sets. This reflects the state’s mix of services in all of the calculations. For
Ambulance and DME, the utilization mix was used to determine composite values for each
RVU type/service category cell and calculate the composite conversion factors. For ER and
Home Health, additional calculations and assumptions were necessary to put the MFS on a
comparable basis with the summarized benchmark data.
Work Hardening and Back School
The volume of data in all of the benchmark datasets was insufficient to analyze Work
Hardening and Back School. Instead, RVP RVUs were assigned at the CPT code level and
applied to the Medicine conversion factors calculated in the physician analysis.
4) Develop Recommendations
The process for developing recommendations varied by type of service, but recommendations
generally followed commercial reimbursement levels. Reimbursement for each benchmarking
dataset was estimated as a percent of Medicare and compared to the MFS when possible. This
helped gage the reasonability of the reimbursement levels and advise recommendations. Final
reimbursement recommendations were then made for each type of service.
Milliman Client Report
Provider Reimbursement Recommendations
January 13, 2015 44
13.LIMITATIONS AND CONSIDERATIONS
Any opinions expressed in this report are solely those of the authors.
We recognize that our recommendations for some service categories reflect significant changes from
existing reimbursement for those services under the existing fee schedule. While this may be partially
attributable to the change in recommended relative value units for physician services, it is likely that
the significant time since our prior analysis for the DIR is a major cause. We recommend that the DIR
carefully evaluate the potential impact of our recommendations for the potential dislocations in
services provided because of the changing reimbursement levels. We also recommend requesting
input from the stakeholders in the system. The DIR may wish to implement the larger changes in
stages, carefully reviewing the impact of each change before progressing to the next stage.
Any reader of this report must possess a certain level of expertise in areas relevant to this analysis to
appreciate the significance of the approaches and assumptions and the impact of these approaches and
assumptions on the results. The reader should be advised by their own actuaries or other qualified
professionals competent in the subject matter of this report, so as to properly interpret the material.
This report is not intended to benefit third parties. Regarding the contents of this report, Milliman
makes no representations or warranties to third parties. Third parties are to place no reliance upon this
report that would result in the creation of any duty or liability for Milliman or its employees to third
parties, under any theory of law. Third parties receiving this report must rely on their own experts to
draw conclusions about the report’s contents.
As documented in the report, this analysis has relied extensively on historical data. The data were
reviewed for reasonableness, but no independent audits were performed. Should errors or omissions be
discovered in the source data, the results of our analysis would need to be modified. Future results will
differ from the historic estimates in this report.
Mr. Baldwin is a member of the American Academy of Actuaries, and meets its qualification
standards to issue this report.

Provider Reimbursement Recommendations
January 13, 2015
45
EXHIBITS


![ACOs, GLOBAL PAYMENTS AND CAPITATION REIMBURSEMENT · PDF file1 Chapter 17 ACOs, GLOBAL PAYMENTS AND CAPITATION REIMBURSEMENT [Eliminating Fee-For-Service Physician Compensation] David](https://static.cupdf.com/doc/110x72/5aa95fd37f8b9a72188ccbbd/acos-global-payments-and-capitation-reimbursement-chapter-17-acos-global-payments.jpg)