Bild 1
Wihlborgs Fastigheter ABYear End Report 2015
Anders Jarl, CEO and Arvid Liepe, CFO
9 February, 2016
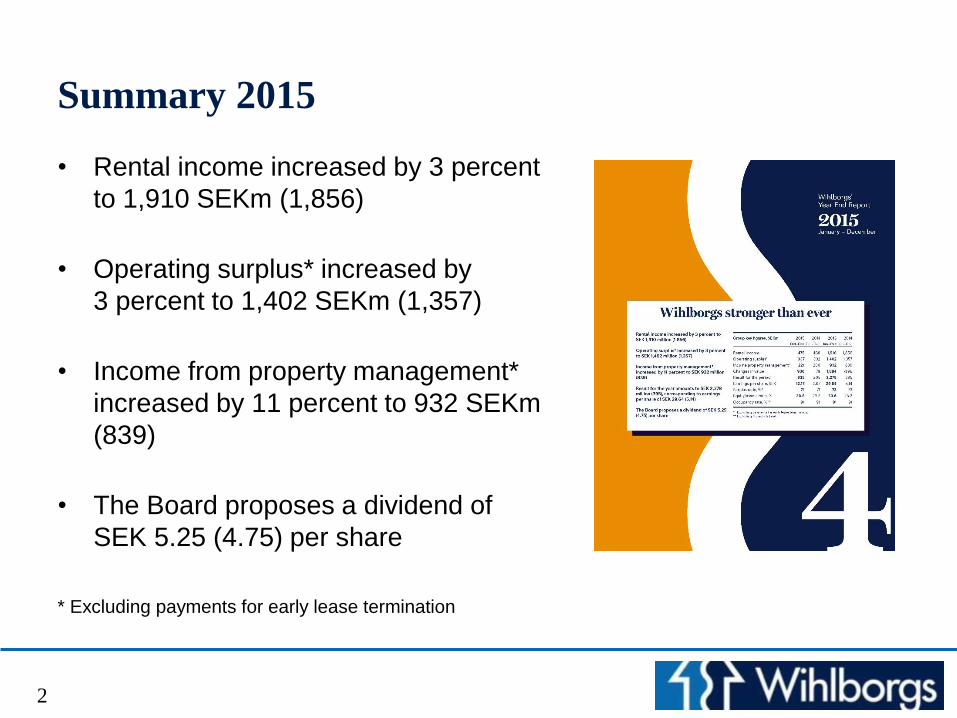
Summary 2015
• Rental income increased by 3 percent
to 1,910 SEKm (1,856)
• Operating surplus* increased by
3 percent to 1,402 SEKm (1,357)
• Income from property management*
increased by 11 percent to 932 SEKm
(839)
• The Board proposes a dividend of
SEK 5.25 (4.75) per share
* Excluding payments for early lease termination
2
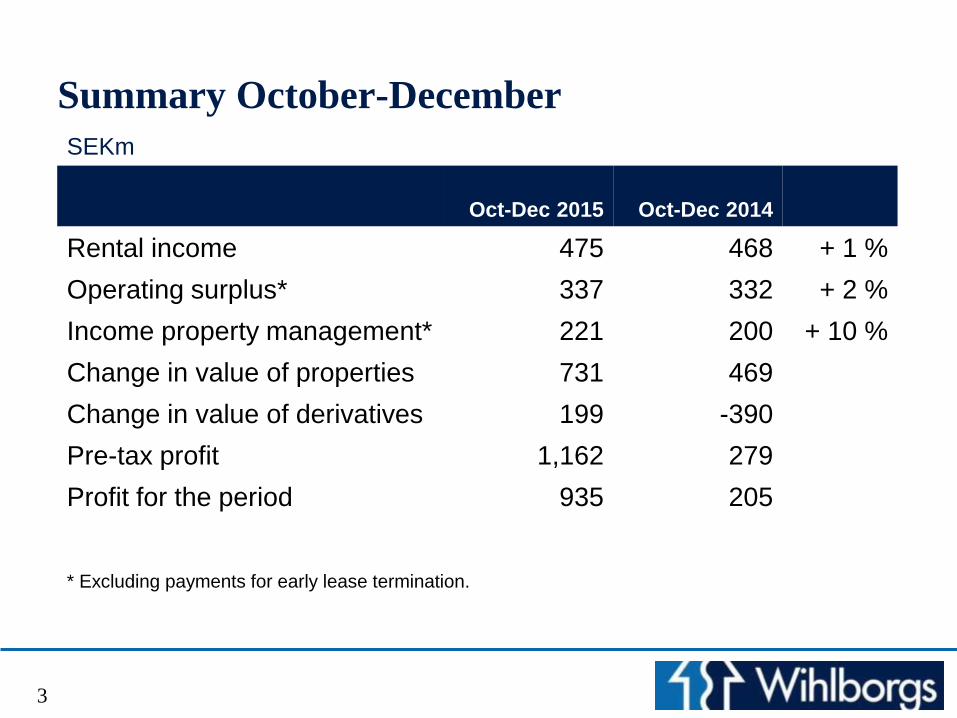
Oct-Dec 2015 Oct-Dec 2014
Rental income 475 468 + 1 %
Operating surplus* 337 332 + 2 %
Income property management* 221 200 + 10 %
Change in value of properties 731 469
Change in value of derivatives 199 -390
Pre-tax profit 1,162 279
Profit for the period 935 205
3
SEKm
Summary October-December
* Excluding payments for early lease termination.

Jan-Dec 2015 Jan-Dec 2014
Rental income 1,910 1,856 + 3 %
Operating surplus* 1,402 1,357 + 3 %
Income property management* 932 839 +11 %
Change in value of properties 1,615 642
Change in value of derivatives 269 -1,038
Pre-tax profit 2,859 492
Profit for the period 2,278 395
4
Summary 2015
* Excluding payments for early lease termination.
SEKm

Increasing income from property management
0
200
400
600
800
1 000
1 200
2005 2006 2007 2008 2009 2010 2011 2012 2013 2014 2015
SE
Km
5

0
1
2
3
4
5
6
7
8
9
10
11
12
13
2005 2006 2007 2008 2009 2010 2011 2012 2013 2014 2015
6
SE
K
Income from property managementPer share

Business model, outcome 2015
232 SEKm
975 SEKm
Profit from projects
Profit from
property management
7
Total: 1,207 SEKm

-
50
100
150
200
250
300
2005 2006 2007 2008 2009 2010 2011 2012 2013 2014 2015
SE
Km
Profit from project
8

Q4
2015
Q4
2014
Jan-Dec
2015
Jan-Dec
2014
New leases 53 52 199 213
Terminations 33 48 175 194
Net leasing 20 4 24 19
Positive net letting
9
SEKm

-60
-40
-20
0
20
40
60
80
100
2008 2009 2010 2011 2012 2013 2014 2015
10
New leases
Terminations
Net
Positive net letting

Axis
City of Helsingborg
City of Malmö
Customs Service
Danske Bank
QlikTech
SAAB Kockums
Skåne Regional Council
Swedish Tax Agency
ÅF
of rental income
22 %
19 %Governmental tenants
11
Solid customers

01-01-2016
SEKm
01-01-2015
SEKm Percent
Rental value 2,259 2,058 9,7
Rental income 1,983 1,863 6,4
Rental growth for the entire property stock
12

01-01-2016
SEKm
01-01-2015
SEKm Percent
Rental value 1,393 1,387 +0.4
Rental income 1,295 1,278 +1.3
Rental growth for like for like offices, Sweden
13

¹ excluding property management
14
Wihlborgs’ portfolio 1 January 2016
Office properties,
Ort
Market value,
SEKm
Op. surplus,
SEKm¹
Yield,
%¹
Occupancy
rate, %
Malmö 10,494 546 5.2 92
Helsingborg 3,505 209 6.0 95
Lund 5,046 286 5.7 91
Copenhagen 2,706 158 5.8 93
Totalt 21,751 1,199 5.6 93
15
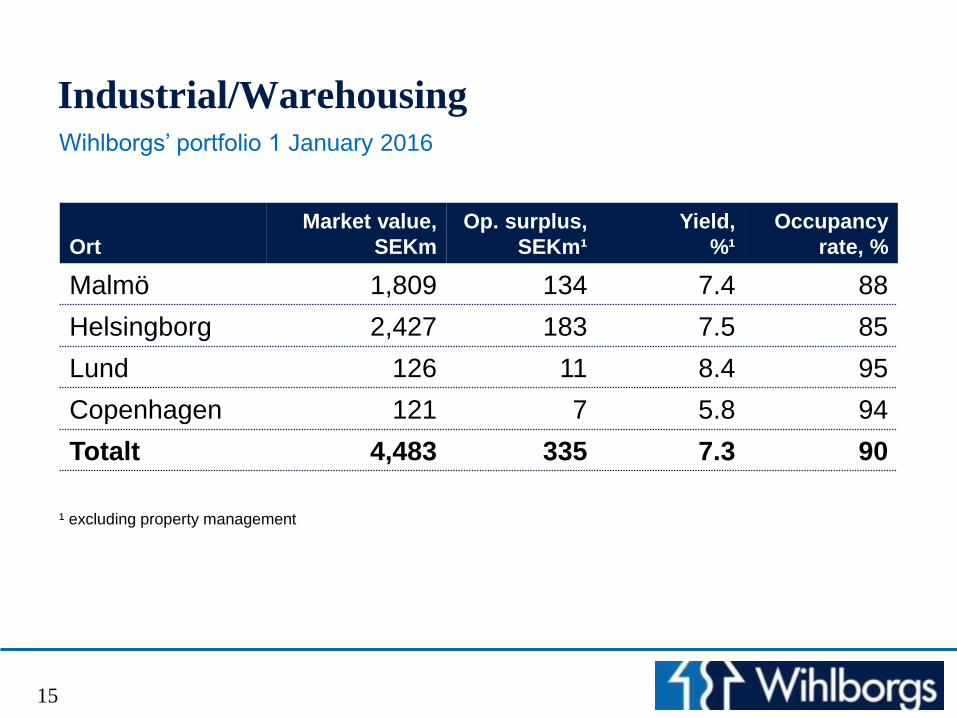
Industrial/Warehousing
Ort
Market value,
SEKm
Op. surplus,
SEKm¹
Yield,
%¹
Occupancy
rate, %
Malmö 1,809 134 7.4 88
Helsingborg 2,427 183 7.5 85
Lund 126 11 8.4 95
Copenhagen 121 7 5.8 94
Totalt 4,483 335 7.3 90
Wihlborgs’ portfolio 1 January 2016
¹ excluding property management
16
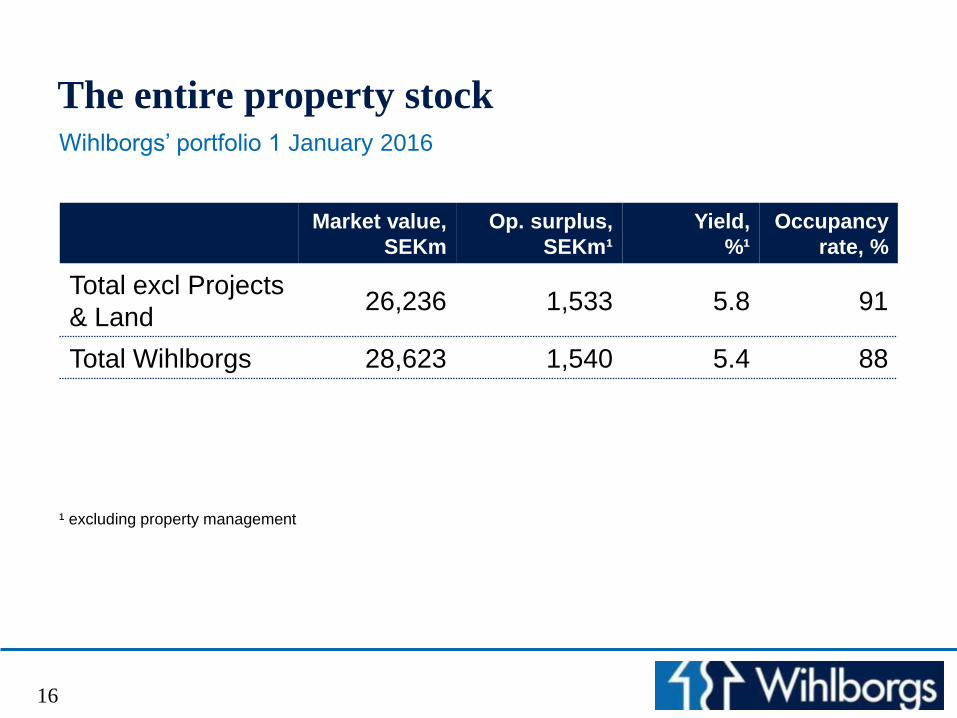
The entire property stock
Market value,
SEKm
Op. surplus,
SEKm¹
Yield,
%¹
Occupancy
rate, %
Total excl Projects
& Land26,236 1,533 5.8 91
Total Wihlborgs 28,623 1,540 5.4 88
Wihlborgs’ portfolio 1 January 2016
¹ excluding property management

716,000 m2
537,000 m2
205,000 m2
287,000 m2
Percent of the market value
17
50
22
1810
A focused portfolio in a growing region,

SE
Km
18
0
5 000
10 000
15 000
20 000
25 000
30 000
2005 2006 2007 2008 2009 2010 2011 2012 2013 2014 2015
Increased value in the portfolio

SEKm
Carrying amount 1 January 2015 24,299
Acquisitions 2,155
Investments 1,047
Properties sold1 -411
Changes in value 1,615
Currency translations -82
Carrying amount 31 Dec 2015 28,623
Changes in Investment Properties
19
1 These figures include insurance compensation for total losses on buildings, and profits from external projects.
January - December 2015
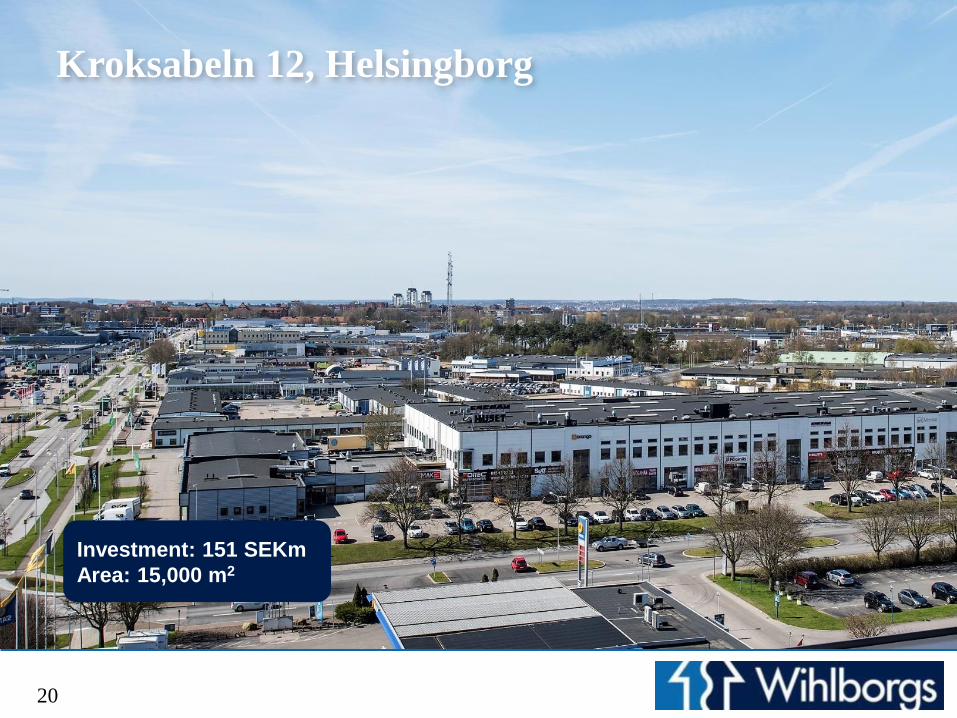
Investment: 151 SEKm
Area: 15,000 m2
Kroksabeln 12, Helsingborg
20

Musköten 17, Helsingborg
Investment: 38 SEKm
Area: 5,000 m2
21

Stattena 7, Helsingborg
Investment: 58 SEKm
Area: 6,200 m2
22

Polstjärnan1 and Polstjärnan 2, Malmö
Area: 11,000 m2
23

24
Karin 11, Nora 11 Malmö
Karin 11 and Nora 11, Malmö
Investment: SEK 1 billion
Area: 45,000 m2

Bild 25
Investment: 78,1 SEKm
Area: 9,700 m2
Stenåldern 1, Malmö

Stationsalléen 40-46, Herlev
Investment: 38 SEKm
Area: 5,600 m2
26

Bild 27
Ejby Industrivej 41, Glostrup
Investment: 800 DKKm (incl. Girostrøget)
Area: 50,000 m2

Bild 28
Girostrøget 1, Høje-Taastrup
Investment: 800 DKKm (incl. Ejby)
Area: 60,000 m2

Employees 122
Properties 276
Lettable area, m2 1,746,000
Rental value, SEKm 2,259
Property value, SEKm 28,623
Rental income, SEKm 1,983
Economic occupancy rate, %* 91
* Excluding Projects & Land
Wihlborgs in brief
29
1 January 2016

No. of shares,
thousands
Proportion
of equity, %
Erik Paulsson (incl.family) 7,790 10.1
Länsförsäkringar Funds 3,645 4.7
SEB Funds 3,365 4.4
SHB Funds 2,216 2.9
Qviberg family 2,162 2.8
Norges Bank 1,555 2.0
DnB – Carlson Fund 840 1.1
Tibia Konsult 813 1.1
Skandia Fonder 619 0.8
Avanza Pension 601 0.8
Other shareholders reg. in Sweden 24,546 32.0
Other shareholders reg. abroad 28,705 37.3
Total outstanding shares 76,857 100.0
Largest shareholders 31 Dec 2015
39 %
shareholders
reg. abroad
30

Jan – Dec 2015 Jan – Dec 2014
Rental income 1,910 1,856
Other revenues 43 49
Operating costs -508 -499
Operating surplus 1,445 1,406
Central administration -43 -41
Net interest -427 -477
Income from property management 975 888
Changes in value of properties 1,615 642
Changes in value of derivatives 269 -1,038
Pre-tax profit 2,859 492
Current tax -4 -5
Deferred tax -577 -92
Profit for the period 2,278 395
Consolidated income statement
31
SEKm

2015 2014
Income tax 4 5
Property tax 94 87
Non-deductible VAT 14 30
Stamp duty 16 12
Energy tax 20 20
Total 148 154
Percentage tax paid 14 % 15 %
32
Tax paid
SEKm

31 December 2015 31 December 2014
Investment properties 28,623 24,299
Other fixed assets 247 197
Current receivables 88 111
Liquid assets 75 71
Total assets 29,033 24,678
Equity 8,876 6,967
Deferred tax liability 2,199 1,627
Borrowings 16,265 14,148
Derivatives 879 1,148
Other long-term liabilities 54 53
Current liabilities 760 735
Total equity and liabilities 29,033 24,678
Consolidated balance sheet
33
SEKm

Jan – Dec
2015
Jan – Dec
2014
Equity/assets ratio, percent 30.6 28.2
Leverage properties, percent 56.8 58.2
Interest coverage ratio, multiple 3.2 2.8
Surplus ratio, percent 73 73
Per share, SEK
Equity 22 percent tax 115.49 90.65
Equity 0 percent tax 144.10 111.82
EPRA net asset value 155.54 126.76
Earnings 29.64 5.14
Income from property management 12.69 11.55
34
Key figures

EPRA net asset value
35
Per share
0
20
40
60
80
100
120
140
160
180
2009 2010 2011 2012 2013 2014 2015
SE
K

0%
5%
10%
15%
20%
25%
30%
2010 2011 2012 2013 2014 2015
Growth in EPRA net asset value
36
Average: 17 percent
Adjusted for dividend

Structure of interest and loan maturities
Interest maturity Loan maturity
Matures, year Loan amount, SEKm Av. interest rate, %
Cred agreement
SEKm Utilised, SEKm
2016 5,842 1.14 2,106 1,679
2017 300 0.80 4,875 4,727
2018 0 0 6,768 6,418
2019 0 0 1,290 1,290
2020 1,000 3.00 0 0
>2020 9,123 3.79 2,150 2,150
Total 16,265 2.73 17,189 16,265
Average fixed interest period: 4,8 years (6.0)
Average loan maturity: 4.1 years (4.1)
37
31 December 2015

Current financing, December 2015
Swedish banks
67 %
Danish banks
17 %
Bonds 16 %
38

Derivatives 31 December 2015
Amount,
SEKm Interest , % Can be closed End date
500 2.63 quarterly 2026
500 2.72 ” 2026
500 2.34 ” 2026
500 2.58 ” 2027
1,000 1.96 ” 2021
2,000 2.70 2021
1,000 2.04 2022
1,000 2.01 2022
1,000 3.40 2024
500 3.32 2024
1,000 3.07 Threshold 4.75 2021
Cancellable swaps
Interest-rate swaps
Threshold swap
39

Cancellable swaps -235
Threshold swap -115
Fixed rate swaps -529
Sum -879
Deficit 31-12-2014 -1.148
Net 2015 269
Deficit in interest rate derivatives portfolio
31 December 2015, SEKm
40

Dividend 2005-2015
41
0
1
2
3
4
5
6
2005 2006 2007 2008 2009 2010 2011 2012 2013 2014 2015
SE
K
Investments in progress
42

SEKm
Investments 1,047
Projects in progress 1,288
Invested by period end -789
Remains to invest 499
Project investments
43
2015

Gängtappen 1, Malmö
44
Area: 14,000 m2
Completion: Q2, 2016
Investment: 242 SEKm
45
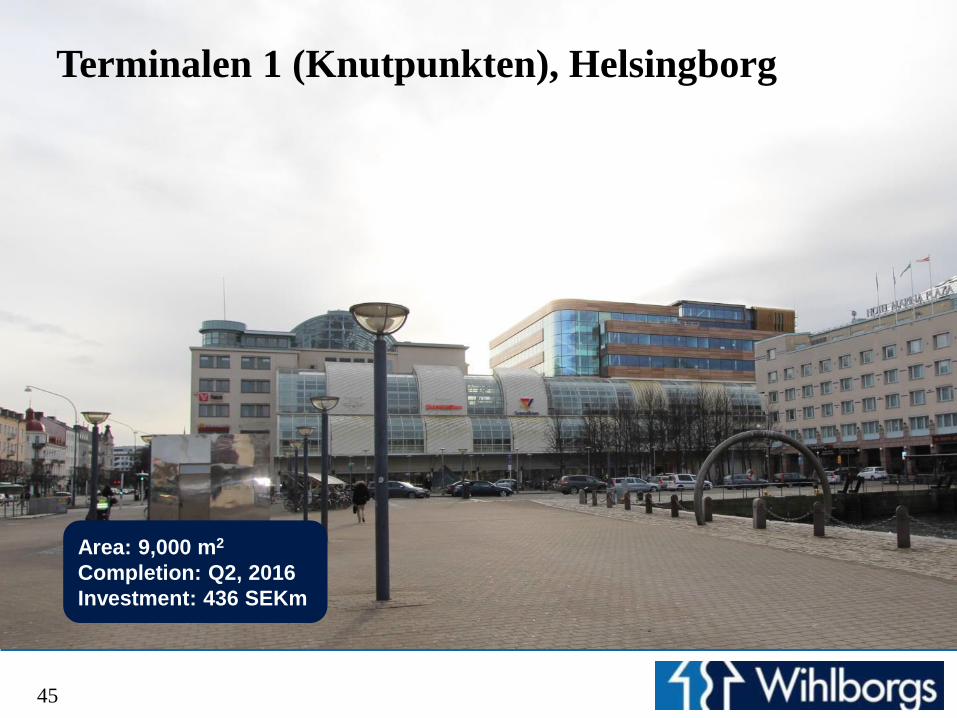
Area: 9,000 m2
Completion: Q2, 2016
Investment: 436 SEKm
Terminalen 1 (Knutpunkten), Helsingborg
46
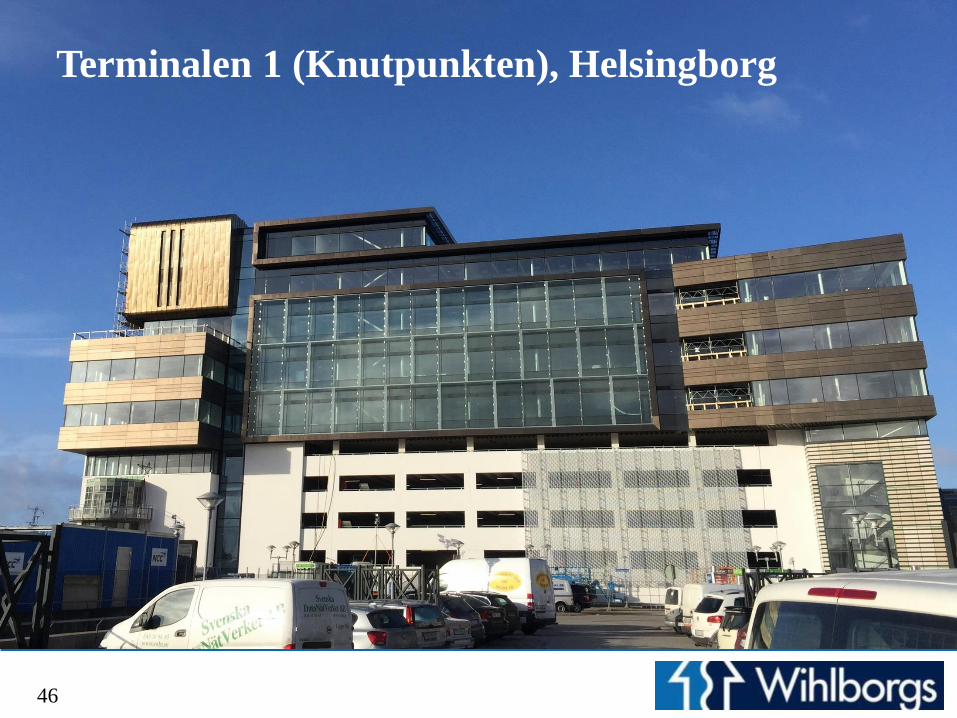
Terminalen 1 (Knutpunkten), Helsingborg

47
Area: 12,300 m2
Completion: Q2, 2016
Investment: 127 SEKm
Kranen 8, Malmö

48
Area: 12,000 m2
Completion: Q3, 2016
Investment: 142 SEKm
Nora 11, Malmö

Investments in pipeline
49

50
Area: 7,000 m2
Start: Q1, 2016
Investment: 250 SEKm
Sirius, Malmö

51
Area: 11,000 m2
Start: Q1, 2016
Investment: 347 SEKm
Postterminalen, Lund

52
Area: 4,000 m2
Start: Q2, 2016
Investment: 190 SEKm
Polisen 1, Helsingborg
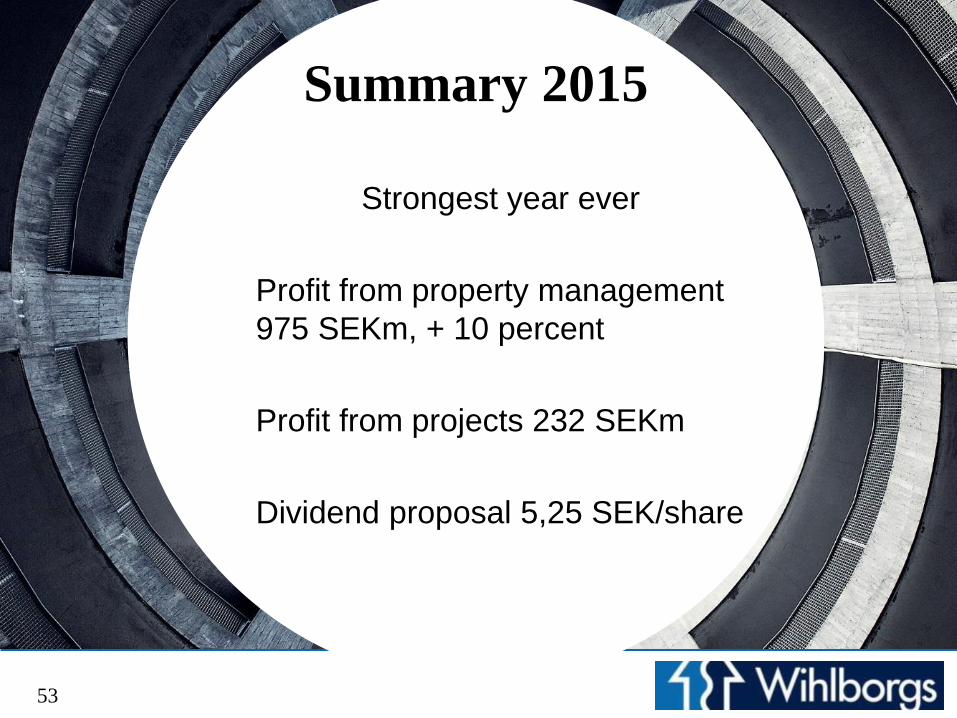
Summary 2015
Strongest year ever
Profit from property management
975 SEKm, + 10 percent
Profit from projects 232 SEKm
Dividend proposal 5,25 SEK/share
53

Outlook 2016
The business will continue to grow
- Property Management
- Projects
54

Hos oss bor arbetsglädjen