+1.5°C
+0°C
+2°C
+3°C
+4°C Policies & action
+2.7°C
+3.6°C
+2.0°C
Pledges &targets
+2.1°C+2.6°C
+1.7°C
2030 targets
only
+2.4°C
+3.0°C
+1.9°C
Optimisticscenario
+1.8°C
+2.4°C
+1.5°C
ClimateActionTracker
Warming Projections Global Update
Climate Action Tracker
November 2021
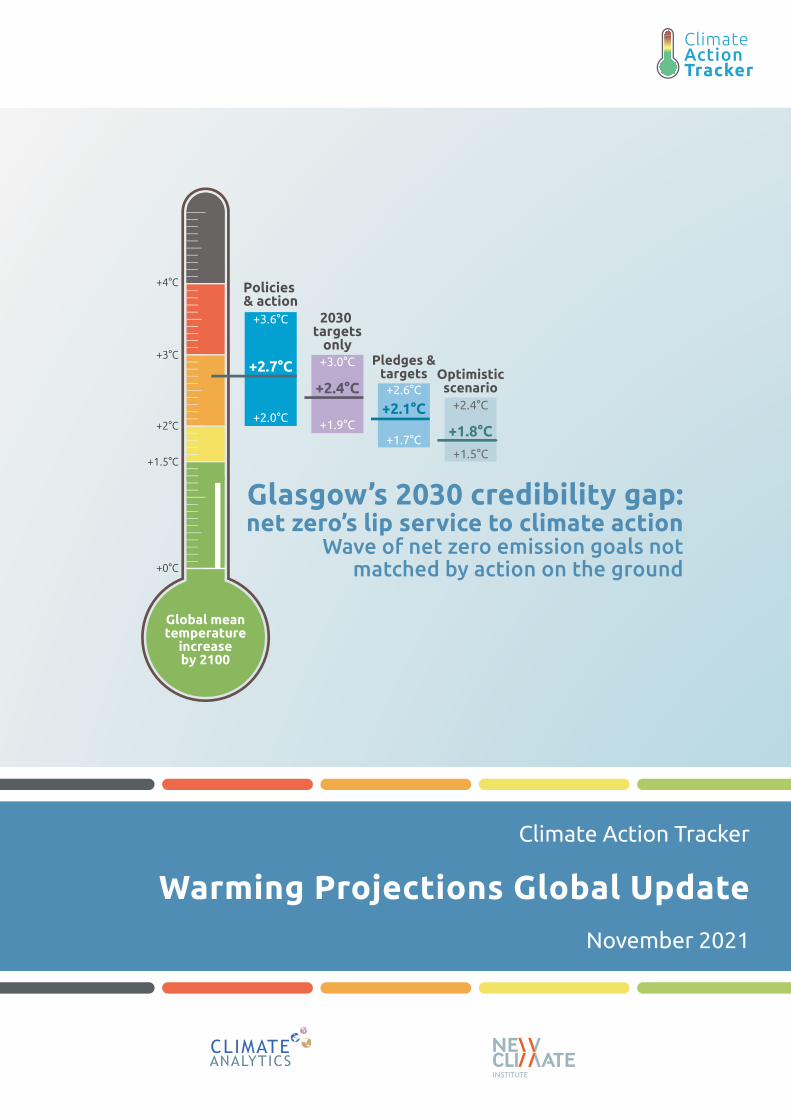
Glasgow’s 2030 credibility gap: net zero’s lip service to climate action
Wave of net zero emission goals not matched by action on the ground

Climate Action Tracker | Warming Projections Global Update - November 2021 i
In Paris, all governments solemnly promised to come to COP26, with more ambitious 2030 commitments to close the massive 2030 emissions gap that was already evident in 2015. Three years later the IPCC Special Report on 1.5°C reinforced the scientific imperative, and earlier this year it called a climate “code red.” Now, at the midpoint of Glasgow, it is clear there is a massive credibility, action and commitment gap that casts a long and dark shadow of doubt over the net zero goals put forward by more than 140 countries, covering 90% of global emissions.
Policy implementation on the ground is advancing at a snail’s pace. Under current policies, we estimate end-of-century warming to be 2.7°C. While this temperature estimate has fallen since our September 2020 assessment, major new policy developments are not the driving factor. We need to see a profound effort in in all sectors, in this decade, to decarbonise the world to be in line with 1.5°C.
Targets for 2030 remain totally inadequate: the current 2030 targets1 (without long-term pledges) put us on track for a 2.4°C temperature increase by the end of the century.2 Since the April 2021 Biden Leaders’ Summit, our standard “pledges and targets” scenario temperature estimate of all NDCs and submitted or binding long-term targets has dropped by 0.3°C to 2.1°C, but this improvement is due primarily to the inclusion of the US and China’s net zero targets, now that both countries have submitted their long-term strategies to the UNFCCC.
1 For weak targets, we take a country’s estimated 2030 level under current policies, if that level is lower than the target.
2 Normally, the CAT bases its temperature estimates on all binding targets, including both 2030 and longer-term net zero targets; however, as more and more countries adopt their net zero targets in domestic law or submit long-term strategies to the UNFCCC, we felt the need to include this new temperature estimate to highlight the growing credibility gap between targets in 2030 and net zero targets for 2050 or later.
Summary
Policies & actionReal world action based on current policies
2030 targets onlyFull implementation of 2030 NDC targets*
If 2030 NDC targets are weaker than projected emissions levels under policies & action, we use levels from policy & action
Optimistic scenarioBest case scenario and assumes full implementation of all announced targets including net zero targets, LTSs and NDCs*
Pledges & targetsFull implementation of submitted and binding long-term targets and 2030 NDC targets*
CAT warming projections Global temperature increase by 2100
November 2021 UpdatePRE-INDUSTRIAL AVERAGE
1.5°C PARIS AGREEMENT GOAL+1.5°C
+0°C
+2°C
+3°C
+4°C
WE ARE HERE1.2°C Warming in 2021
Policies & action
+2.7°C
+3.6°C
+2.0°C
Pledges &targets
+2.1°C+2.6°C
+1.7°C
2030 targets
only
+2.4°C
+3.0°C
+1.9°C
Optimisticscenario
+1.8°C
+2.4°C
+1.5°C

Climate Action Tracker | Warming Projections Global Update - November 2021 ii
There has been insufficient momentum from leaders and governments to increase 2030 climate targets ahead of, and at, Glasgow: NDC improvements submitted over the last year have reduced the emissions gap in 2030 by only 15-17%. The biggest absolute contributions to this narrowing come from China, EU and the US, though other countries with lower emissions levels have also improved their NDCs.
Contrary to the Paris Agreement’s requirement that each NDC update is a progression beyond the last, several governments have only resubmitted the same target as 2015 (Australia, Indonesia, Russia, Singapore, Switzerland, Thailand, Viet Nam), or submitted an even less ambitious target (Brazil, Mexico). Some have not made new submissions at all (Turkey and Kazakhstan), and Iran has yet to ratify the Paris Agreement. Even with all new Glasgow pledges for 2030, we will emit roughly twice as much in 2030 as required for 1.5°. Therefore, all governments need to reconsider their targets.
Globally, around 90% of emissions are now covered by net zero targets. While these targets are an important signal, and some have accelerated governments’ climate action, the quality of most remains questionable. If all the announced net zero commitments or targets under discussion are implemented, this would bring our temperature estimate for this “optimistic scenario” down to 1.8°C by 2100, with peak warming of 1.9°C. But this is only IF these targets are fully implemented, and it’s a big IF. Our analysis, covering 40 countries, shows only 6% of global emissions are covered by targets with an “acceptable” net zero rating for target comprehensiveness.
No single country that we analyse has sufficient short-term policies in place to put itself on track to its net zero target. The net zero CAT assessment also includes announcements made by governments which are not backed up by any national legislation, nor plans. Some lack critical information to allow for a full evaluation of the target’s likely impact, including whether net-zero is defined as CO2 only or covers all greenhouse gases. It also needs to be emphasised that our ‘optimistic’ assessment of end-of-century median warming of about 1.8°C is not Paris Agreement compatible and that warming of 2.4°C or more cannot be ruled out.
2030 actions and targets are more often than not inconsistent with net zero goals, so that the gap between current policies and net zero goals is now 0.9°C. This, we consider, is the credibility gap that Glasgow needs to address.
The key drivers for this appalling outlook are coal and gas.
Coal To meet the Paris Agreement’s 1.5˚C warming limit, coal must be phased out of the power sector by 2030 in the OECD, and globally by 2040. But in spite of political momentum and clear benefits beyond climate change mitigation, there is still a huge amount of coal in the pipeline, for example in China, India, Indonesia and Viet Nam, and too many countries, including Japan, South Korea, Australia, still have plans centered around coal as a major contributor to electricity generation in 2030. Some also continue funding coal projects abroad. While some of these governments have committed in Glasgow to phasing out coal, we need to see that reflected on the ground at home.
Natural gasThe increasing use of natural gas is not Paris Agreement compatible, yet we are seeing the gas industry push and promote their product, supported by governments across the world. In the six years since the Paris Agreement, CO2 emissions from gas grew by 9%, whereas emissions from coal and oil are down. Gas for electricity generation, as with coal, needs to peak in this decade, and largely be phased out globally in the coming decades, and for other applications

Climate Action Tracker | Warming Projections Global Update - November 2021 iii
soon after, if the world is to reach net zero CO2 by 2050. In Southeast Asia, heavily coal-depend-ent countries are now considering a switch from coal to gas (e.g. Viet Nam), rather than directly to renewables, large infrastructure for natural gas is also under development in Europe (Nord Stream 2 for imports from Russia), Canada (expansions of pipelines for export), Australia and the USA (LNG exports), and multiple African countries are promoting the increased production and use of natural gas.
Methane and forestry Global methane and forestry initiatives announced in Glasgow support important actions, but these must go beyond existing national targets to be impactful: the Global Methane Pledge – of reducing methane emissions by 30% in 2030 – has the maximum potential to reduce the 2030 emissions gap by 14%, and warming by -0.12°C by 2100. But much of this potential is already included in existing climate pledges. The US is a prime example: the methane reduction target is already partially included in its long-term strategy, which we have already included the effect of in our ‘Pledges and Targets’ temperature estimate. Similarly, the Global Forestry Finance pledge can result in additional climate mitigation only if this finance is additional to the current promised funding and does not cut funding for other mitigation measures. Since the USD 100bn goal has not yet been met, the additionality of this new initiative is questiona-ble, at best.
Glasgow must address the credibility gap
While the warming outlook has improved since Paris, the bottom line is that despite all the net zero promises, inadequate real-world action unable to deliver the kind of climate action that is aligned to the 1.5˚C temperature limit: in 2015, ahead of the Paris Agreement, the CAT estimated current policies would lead to warming of 3.6°C, and the submitted targets (NDCs) would lead to 2.7°C. Six years later, the warming from current policies has now come down to 2.7°C. If governments were to achieve their 2030 NDC targets and binding long-term targets (LTS), temperature increase could be limited to 2.1°C.
If governments are serious about the Paris Agreement’s temperature limit and their own net-zero goals, they need to translate those long-term goals into net-zero aligned ambitious 2030 targets and implement the necessary policies today. Developed countries will also significantly increase the climate finance available to support the transition. Until this happens, there is no cause for celebration.

Climate Action Tracker | Warming Projections Global Update - November 2021 iv
ContentsSummary ....................................................................................................................................................................i
1 2030 targets are totally inadequate and put achieving 1.5°C at risk ..............................................1
2 NDCs updates are not in line with the Paris Agreement ...................................................................3
3 Implementation gap is growing – and doing better is not enough ..................................................6
4 Sector and gas initiatives must go beyond existing national targets to be impactful ..............8
5 Net zero targets – inching closer to 1.5°C – but credibility is questionable ................................8
6 Warming outlook has improved since Paris ......................................................................................... 12
7 Country snapshots ..................................................................................................................................... 13
Annex ...................................................................................................................................................................... 17
A1 Scenario definition .......................................................................................................................................17
A2 Detailed overview of net zero target assessments ...........................................................................19
A3 Optimistic Temperature Estimate Assumptions .................................................................................21
A4 Differences between Climate Action Tracker, UNFCCC Synthesis Report & UNEP Gap Report ..................................................................................28
Table of Contents
Climate Action Tracker | Warming Projections Global Update - November 2021 1
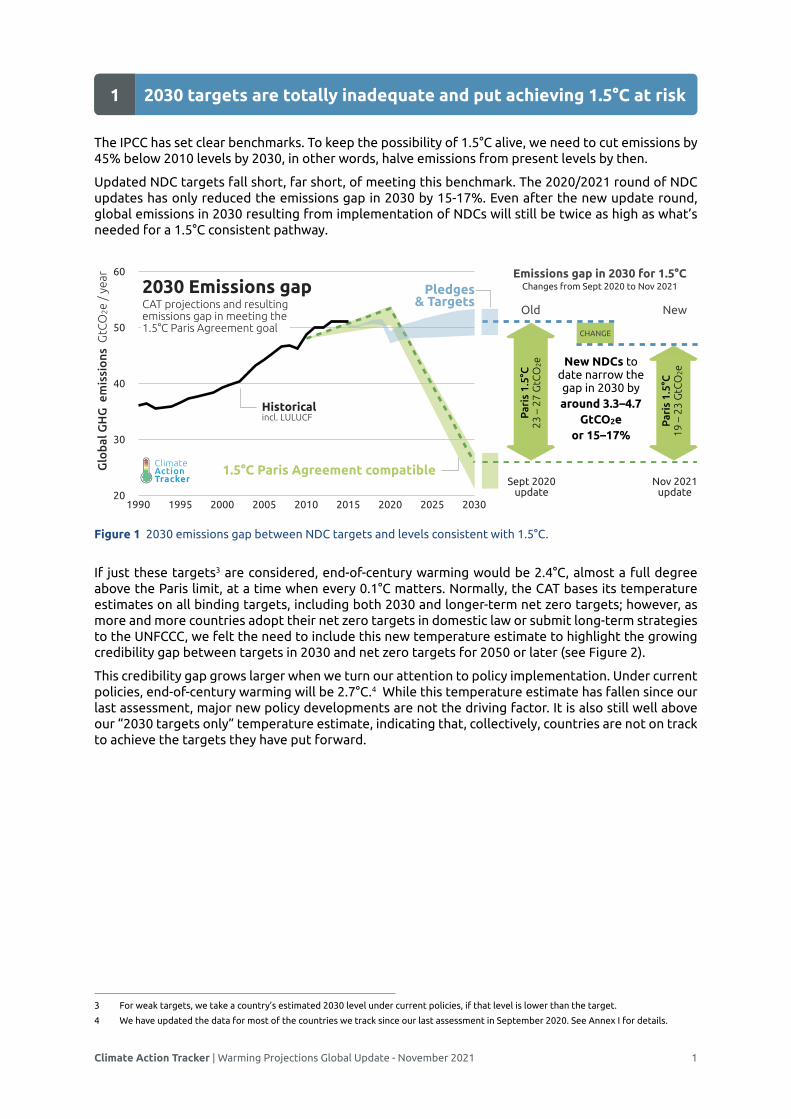
2030 targets are totally inadequate and put achieving 1.5°C at risk1
The IPCC has set clear benchmarks. To keep the possibility of 1.5°C alive, we need to cut emissions by 45% below 2010 levels by 2030, in other words, halve emissions from present levels by then.
Updated NDC targets fall short, far short, of meeting this benchmark. The 2020/2021 round of NDC updates has only reduced the emissions gap in 2030 by 15-17%. Even after the new update round, global emissions in 2030 resulting from implementation of NDCs will still be twice as high as what’s needed for a 1.5°C consistent pathway.
If just these targets3 are considered, end-of-century warming would be 2.4°C, almost a full degree above the Paris limit, at a time when every 0.1°C matters. Normally, the CAT bases its temperature estimates on all binding targets, including both 2030 and longer-term net zero targets; however, as more and more countries adopt their net zero targets in domestic law or submit long-term strategies to the UNFCCC, we felt the need to include this new temperature estimate to highlight the growing credibility gap between targets in 2030 and net zero targets for 2050 or later (see Figure 2).
This credibility gap grows larger when we turn our attention to policy implementation. Under current policies, end-of-century warming will be 2.7°C.4 While this temperature estimate has fallen since our last assessment, major new policy developments are not the driving factor. It is also still well above our “2030 targets only” temperature estimate, indicating that, collectively, countries are not on track to achieve the targets they have put forward.
3 For weak targets, we take a country’s estimated 2030 level under current policies, if that level is lower than the target.
4 We have updated the data for most of the countries we track since our last assessment in September 2020. See Annex I for details.
20
30
40
50
60
1990 1995 2000 2005 2010 2015 2020 2025 2030
Emissions gap in 2030 for 1.5°C
Old
Glo
bal G
HG
em
issi
ons
GtC
O2e
/ y
ear
2030 Emissions gap
ClimateActionTracker Sept 2020
update
Historical incl. LULUCF
Pledges & Targets
1.5°C Paris Agreement compatible
CAT projections and resulting emissions gap in meeting the 1.5°C Paris Agreement goal
New
Par
is 1
.5°C
23 –
27
GtC
O2e
Nov 2021 update
New NDCs to date narrow the gap in 2030 by around 3.3–4.7
GtCO2e or 15–17%
Par
is 1
.5°C
19 –
23
GtC
O2e
CHANGE
Changes from Sept 2020 to Nov 2021
Page width 16cm
Figure 1 2030 emissions gap between NDC targets and levels consistent with 1.5°C.
Climate Action Tracker | Warming Projections Global Update - November 2021 2
16cm
2100 WARMING PROJECTIONS Emissions and expected warming based on pledges and current policies
Warming projected by 2100
-20
-10
0
10
20
30
40
50
60
70
1990 2000 2010 2020 2030 2040 2050 2060 2070 2080 2090 2100
Historical
Glo
bal G
HG
em
issi
ons
GtC
O2e
/ y
ear
ClimateActionTracker
Nov 2021 update
Pledges & targets+2.1°C
Policies & action+2.5 – 2.9°C
Optimistic scenario+1.8°C
2030 targets only+2.4°C
1.5°C consistent+1.3°C
! 2030 ambition gap19–23 GtCO2e
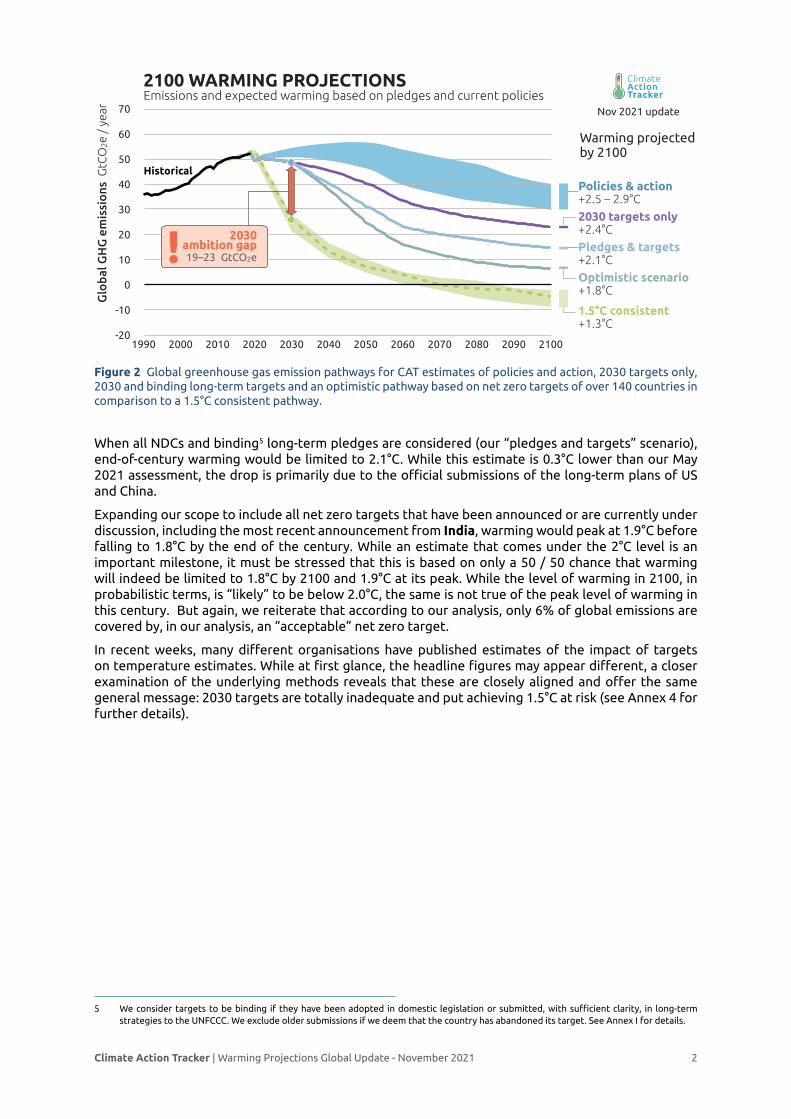
Figure 2 Global greenhouse gas emission pathways for CAT estimates of policies and action, 2030 targets only, 2030 and binding long-term targets and an optimistic pathway based on net zero targets of over 140 countries in comparison to a 1.5°C consistent pathway.
When all NDCs and binding5 long-term pledges are considered (our “pledges and targets” scenario), end-of-century warming would be limited to 2.1°C. While this estimate is 0.3°C lower than our May 2021 assessment, the drop is primarily due to the official submissions of the long-term plans of US and China.
Expanding our scope to include all net zero targets that have been announced or are currently under discussion, including the most recent announcement from India, warming would peak at 1.9°C before falling to 1.8°C by the end of the century. While an estimate that comes under the 2°C level is an important milestone, it must be stressed that this is based on only a 50 / 50 chance that warming will indeed be limited to 1.8°C by 2100 and 1.9°C at its peak. While the level of warming in 2100, in probabilistic terms, is “likely” to be below 2.0°C, the same is not true of the peak level of warming in this century. But again, we reiterate that according to our analysis, only 6% of global emissions are covered by, in our analysis, an “acceptable” net zero target.
In recent weeks, many different organisations have published estimates of the impact of targets on temperature estimates. While at first glance, the headline figures may appear different, a closer examination of the underlying methods reveals that these are closely aligned and offer the same general message: 2030 targets are totally inadequate and put achieving 1.5°C at risk (see Annex 4 for further details).
5 We consider targets to be binding if they have been adopted in domestic legislation or submitted, with sufficient clarity, in long-term strategies to the UNFCCC. We exclude older submissions if we deem that the country has abandoned its target. See Annex I for details.

Climate Action Tracker | Warming Projections Global Update - November 2021 3
NDCs updates are not in line with the Paris Agreement 2
The majority of countries have submitted NDC updates, but emission cuts in 2030 remain woefully inadequate.
With the announced update from India, more than three-quarters of countries, representing near global emissions coverage (over 95%) and close to 90% of the population, have announced or submitted updates. Turkey is the only G20 country to not have submitted an update, having only ratified the Paris Agreement in October 2021.
While the number of NDC updates is high, the quality of the submissions varies greatly, with a great majority not raising ambition enough, and, in several cases, not raising ambition at all.
Since our last update in May, some countries have submitted stronger targets, with a few going beyond their initial announcements.
SOUTH AFRICA heeded the call of its Presidential Climate Commission and submitted a stronger NDC target in September 2021 than it had originally proposed earlier in the year. The bottom end of this range is knocking on the door of 1.5°C compatibility.
MOROCCO strengthened its NDC targets in June 2021, its unconditional target is 1.5°C compatible, while its conditional target, for which it will need support to meet, is within striking distance of the 1.5°C limit.
UKRAINE also submitted a stronger target, adopting the bottom end of the range it originally announced in December 2020. It still has some way to go to be 1.5°C compatible, but if the Ukraine fully implements all the policies it has planned, it could exceed its updated target.
ARGENTINA submitted the slightly stronger it announced at Biden’s Leaders’ Summit in April 2021. With this strengthening, Argentina’s domestic target is now compatible with a 2°C world, but it is still far off from 1.5°C compatible or doing its fair share.
NEW ZEALAND’S new target appears to be continuing with its long history of creative accounting tricks that obscure its effective reductions, and it is still far from doing its fair share.
CANADA and JAPAN have officially submitted the targets they announced at Biden’s Leaders’ Summit: while both domestic targets are getting closer, they still fall short of 1.5°C compatibility.
CHINA officially submitted the stronger targets it had announced last year. While an improvement, these targets are still within the expected emissions level in 2030 under current policies, meaning that China can achieve these targets without further measures. China has yet to commit to a peaking year for carbon dioxide emissions before 2030, nor set absolute emission reduction targets, which leads to uncertainty around its emissions trajectory to 2030. It is also far off a 1.5°C compatible pathway
SOUTH KOREA announced a stronger NDC target during the Glasgow World Leaders Summit. This announced domestic target has halved the distance to becoming 2°C compatible, but it is still far off from 1.5°C compatible or doing its fair share.
IMPROVEMENTS

UNCERTAIN
UNCHANGED
Climate Action Tracker | Warming Projections Global Update - November 2021 4
For others, it has been harder to assess whether the targets are stronger, given the lack of details.
INDIA announced updated NDC targets during the World Leaders Summit, but provided few details. Its new intensity target is unlikely to have any real-world effect, as it falls above India’s likely 2030 emission level under current policies, while its 500GW non-fossil target will, at most, have a small impact on real-world emissions. Prime Minister Modi promised net zero by 2070, but did not mention any plans to phase out coal, despite having one of the highest coal capacities and pipelines in the world. Recent CAT analysis shows the early retirement of the existing capacity and a reduction of its pipeline could enable India to meet its fair share and save a quarter of a million premature deaths.
SAUDI ARABIA has submitted an updated NDC with a seemingly stronger target, although it is difficult to assess this, as it has not communicated the baseline emissions upon which the reduction is based. The updated NDC retains its ‘escape clause’: the emissions reduction pledge is contingent on continued and significant oil and gas exports, without which Saudi Arabia reserves itself the right to revisit its target.
Unfortunately, it is quite clear that the laggards are still lagging.
AUSTRALIA resubmitted its 2030 target unchanged. It claimed that this will be exceeded by up to 9%. The Paris Agreement requires countries to increase their ambition with each update: claiming that you will overachieve your target without actually committing to a stronger target does not cut it. Based on our assessment of current policies, the government may meet the lower bound of its 2030 target, but not overachieve it. Australia’s new 2050 net zero target is also questionable (more on that in the net zero section below).
BRAZIL continues to obfuscate with creative accounting tricks. While the headline reduction target has increased from 43% to 50%, changes in the baseline mean that this target is still less ambitious than the first NDC on an absolute basis. As of 4 November 2021, Brazil had also not submitted this update to the UNFCCC. MEXICO did a similar thing with its update last year.
INDONESIA submitted an updated NDC in July 2021 but did not strengthen its 2030 target. It now joins the “submitted the same or a weaker target” club, along with RUSSIA, SINGAPORE, SWITZERLAND, THAILAND and VIET NAM, contrary to the Paris Agreement’s requirement that each NDC must result in lower emissions than its predecessor.
TURKEY finally ratified the Paris Agreement on 11 October 2021 at which time it officially submitted its 2015 INDC to the UNFCCC. This target is very weak and Turkey has been on track to overachieve it for some time. It needs to submit a much stronger updated target.
IRAN has still not ratified the Paris Agreement, nor updated its 2030 target.
KAZAKHSTAN has still not submitted an update target.
Climate Action Tracker | Warming Projections Global Update - November 2021 5
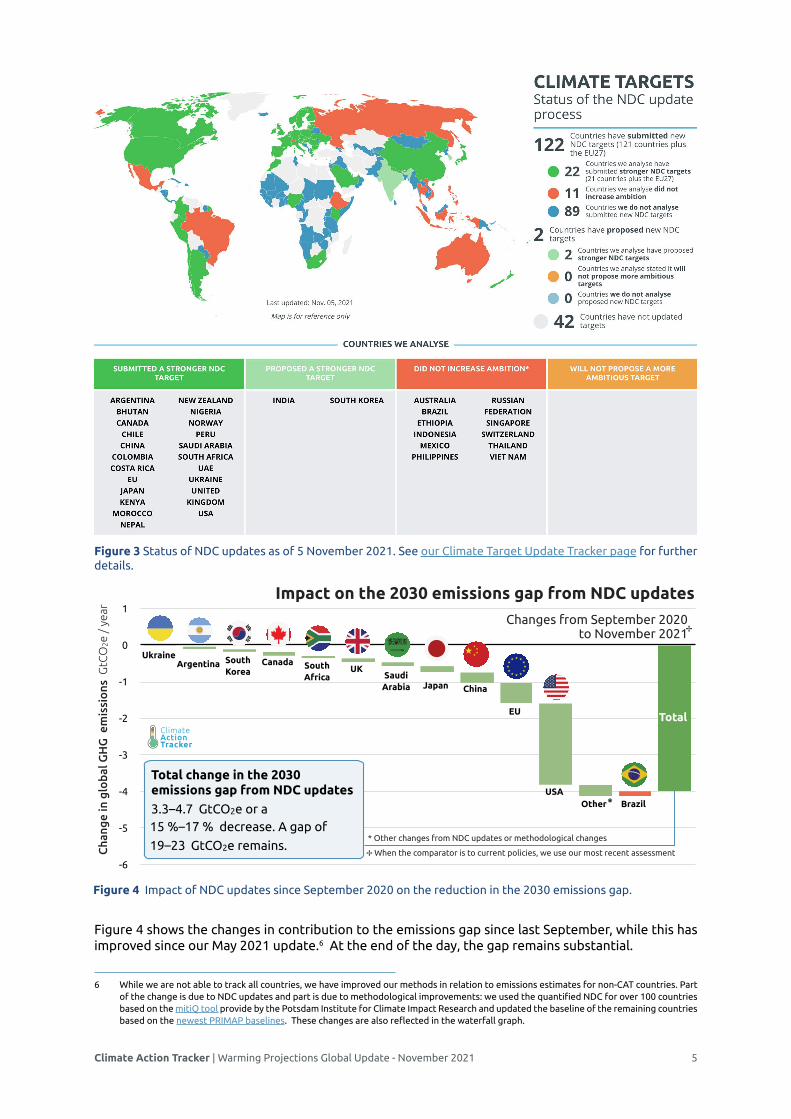
Figure 4 shows the changes in contribution to the emissions gap since last September, while this has improved since our May 2021 update.6 At the end of the day, the gap remains substantial.
6 While we are not able to track all countries, we have improved our methods in relation to emissions estimates for non-CAT countries. Part of the change is due to NDC updates and part is due to methodological improvements: we used the quantified NDC for over 100 countries based on the mitiQ tool provide by the Potsdam Institute for Climate Impact Research and updated the baseline of the remaining countries based on the newest PRIMAP baselines. These changes are also reflected in the waterfall graph.
Figure 3 Status of NDC updates as of 5 November 2021. See our Climate Target Update Tracker page for further details.
Page width 16cmLONGER VERSION - 13 COLUMNS
-6
-5
-4
-3
-2
-1
0
1Impact on the 2030 emissions gap from NDC updates
Japan
Cha
nge
in g
loba
l GH
G e
mis
sio
ns G
tCO
2e /
yea
r
South Africa
CanadaUkraine
China
Other Brazil
Total change in the 2030 emissions gap from NDC updates3.3–4.7 GtCO2e or a
EU
USA
Total
15 %–17 % decrease. A gap of
ClimateActionTracker
South Korea
*
19–23 GtCO2e remains.
UKSaudi
Arabia
Argentina
✢ When the comparator is to current policies, we use our most recent assessment
Changes from September 2020 to November 2021
* Other changes from NDC updates or methodological changes
✢
Figure 4 Impact of NDC updates since September 2020 on the reduction in the 2030 emissions gap.

Climate Action Tracker | Warming Projections Global Update - November 2021 6
Implementation gap is growing – and doing better is not enough3
While our estimate of temperature warming based on real world action has fallen, the pace is still not fast enough to achieve the Paris Agreement temperature goal and countries are risking a lock-in in coal and gas infrastructure.
Coal Kicking the coal habit should be on the top of everyone’s policy agenda. Globally, we need to phase out coal-fired power generation by 2040, and by 2030 in developed countries, to keep the Paris temperature limit within reach. The COP26 presidency supports those targets through the Powering Past Coal Alliance, and has set accelerating the transition from coal to clean power as a key objective for COP26. Before and during Glasgow, multiple countries have strengthened or announced coal phase-out targets and other initiatives, including the first of its kind partnership to support the transition in a developing country away from coal, the Just Energy Transition Partnership of UK, EU, Germany, France and South Africa.
Phasing out coal has a number of benefits beyond climate protection. CAT analysis shows that faster coal plant retirements and reducing the new plant pipeline could avoid hundreds of thousands of premature deaths in the next decade in India and Indonesia alone. If India were to eliminate its coal pipeline and retire plants 18 years or older, it would reduce emissions enough to be making its fair share contribution to climate change. Electricity generation with existing coal-fired power plants is very often more expensive than building new renewable energy, calling into question the economic sensibility of new coal plants.
Despite the political momentum and clear benefits beyond climate change mitigation, there is still a huge amount of coal in the pipeline, for example in China and India. And too many countries still plan for coal to be a major contributor to electricity generation in 2030 (e.g. Japan 19%, South Korea 30%), although they have revised their energy sector planning. Some countries also continue to fund coal projects — public money spent on infrastructure at risk of becoming a stranded asset. China tops the list of countries financing coal projects interna-tionally (but has announced it will stop doing so), followed by Japan, Czech Republic, Russia, and South Korea.
Natural gasThe increasing use of natural gas is not Paris Agreement compatible, yet we are seeing this pushed and promoted by the gas industry and supported by governments across the world. While, for example, Chile’s progress to reduce coal-fired power generation is remarkable, it is not enough for 1.5°C. Chile’s plans for retrofitting include the option of switching to natural gas. Gas reduces the emissions intensity compared to coal, but risks locking in higher emissions levels than required for 1.5°C, and increases dependency on energy imports. Gas for electricity generation, similarly to coal, needs to largely be phased out globally in the coming decades.
We are seeing similar developments in Southeast Asia, where heavily coal-dependent countries are now considering a switch from coal to gas, next to expanding renewables. Large infrastruc-ture for natural gas is also under development in Europe (Nord Stream 2 for imports from Russia), Canada (expansions of pipelines for export), and USA (LNG exports), and multiple African countries are promoting the increased production and use of natural gas (e.g. Nigeria).
The recent gas price hikes in Europe illustrate the vulnerability of gas dependence. The answer to such a crisis is building up renewable energy and improving energy efficiency, actions that contribute to a sustainable pathway in the long term and are, to a large extent, independent of geopolitical developments - not the further expansion of gas infrastructure to improve the supply.
The CAT had already warned in 2017 about relying on gas in the transition towards 1.5°C pathways. Since then, research has become even clearer on the required decrease of the role of gas and the associated risks of investing in gas infrastructure, including the limitations of repurposing gas infrastructure for green gases later on.
If governments are serious about the Paris Agreement’s temperature limit and their own net

Climate Action Tracker | Warming Projections Global Update - November 2021 7
zero goals, they need to realise what those long-term goals require in terms of short-term action, to guarantee the least disruptive pathway possible. Increasing ambition for 2030 follows naturally from such considerations.
Climate financeTo accelerate implementation globally, and ensure that all countries benefit from the transition to 1.5°C, developed countries need to massively increase international climate finance. Sufficient climate finance is critical to ensure that developing countries are able to meet their targets. None of the developed countries the CAT tracks have put forward sufficient climate finance (Figure 5). Recent analysis shows that the USD 100bn goal will only be met in 2023. While the goal is projected to be met around 2023, the anticipated level of USD 113-117bn in 2025 is still far below what would represent a fair contribution, but also what is needed. The Just Energy Transition Partnership for South Africa is a promising development, while details on the terms and quality of the financing are still outstanding.
Eliminating the provision of finance for fossil fuel developments internationally goes hand-in-hand with increasing climate finance, and stopping fossil fuel subsidies. The world already has sufficient oil and gas supply and no new field development is needed if we are serious about reaching net zero globally. Financing, or otherwise supporting such projects, in developing countries puts them at great risk for stranded assets, undermining efforts for sustainable development.
CRITICALLY INSUFFICIENT
HIGHLY INSUFFICIENT INSUFFICIENT ALMOST
SUFFICIENT GOOD
AUSTRALIA CANADA EU z z
JAPAN NEW ZEALAND GERMANY z z
RUSSIA SWITZERLAND NORWAY z z
USA UK z z z
z z z z z
z z z z z
z z z z z
z z z z z
z z z z z
z z z z z
z z z z z
z z z z z
z z z z z
z z z z z
z z z z z
z z z z z
z z z z z
z z z z z
z z z z z
z z z z z
z z z z z
z z z z z
z z z z z
z z z z z
z z z z z
z z z z z
z z z z z
z z z z z
z z z z z
z z z z z
z z z z z
z z z z z
z z z z z
z z z z z
z z z z z
z z z z z
z z z z z
z z z z z
z z z z z
z z z z z
16cm
Sept 2021Update
CLIMATE FINANCE RATINGS
Ratings based on levels of international finance for emissions reductions
Figure 5 CAT climate finance ratings of developed countries.
Climate Action Tracker | Warming Projections Global Update - November 2021 8
Sector and gas initiatives must go beyond existing national targets to be impactful4
The Global Methane and Global Forest Finance Pledges made headlines in Glasgow, but their additional impact on the atmosphere is uncertain.
An increasing number of countries have joined the Global Methane Pledge to cut 30% of methane emissions by 2030 and the Global Forestry Finance Pledge.
Global methane emissions are projected to increase in the next decade by 4% under the current NDCs (7-12% under current policies). Any effort to reduce this gas emissions, in both the short and long term, will have a positive effect on the climate and contribute to slowing the global temperature increase.
One rapid assessment has estimated that the Global Methane Pledge has the maximal potential to reduce the 2030 emissions gap –the difference between current pledges and where we would need to be for 1.5°C in 2030—by 3GtCO2e (14% reduction). A different study attributed a maximum warming reduction of -0.12°C by end of the century. Both studies considered all countries in the world, not only those that have signed the Pledge, and considered all methane reductions as additional to existing activities.
The actual impact of the Global Methane Pledge is likely much lower. The pledge can only have a larger contribution to climate change mitigation if it is additional to the actions already committed by governments to meet NDCs and long-term strategies. However, this might not be the case for most countries. A prominent example is the US, which has already partially included the 30% methane reduction pledge by 2030 in its recently-submitted long-term strategy. The CAT temperature projections, discussed earlier in this briefing, do not consider additional emissions reductions from the Global Methane Pledge. We will only include them in future assessments, if they are shown to be additional to existing national climate pledges.
The same is likely the case for the Global Forest Finance Pledge, which was signed by most G20 countries, to provide finance to halt deforestation, promote forests restoration, and improve forest management. While stopping deforestation is important, governments should not solely rely on the forestry sector to capture emissions, but instead seek to decarbonise all sectors by implementing concrete measures. Currently, CO2 emissions from land-use, land-use change and forestry make up roughly 5% (1 GtCO2e) of the emission gap in 2030.
The Global Forest Finance Pledge will result in additional climate mitigation only if this finance is additional to the current levels of funding promised and does not cut other mitigation measures. Since the 100bn goal has not yet been met, the additionality of this initiative is questionable.
Net zero targets – inching closer to 1.5°C – but credibility is questionable 5
While NDCs, and their present level of implementation, lead to warming well above 2°C, the picture appears brighter when one considers all recently announced net zero targets, but their credibility is questionable.
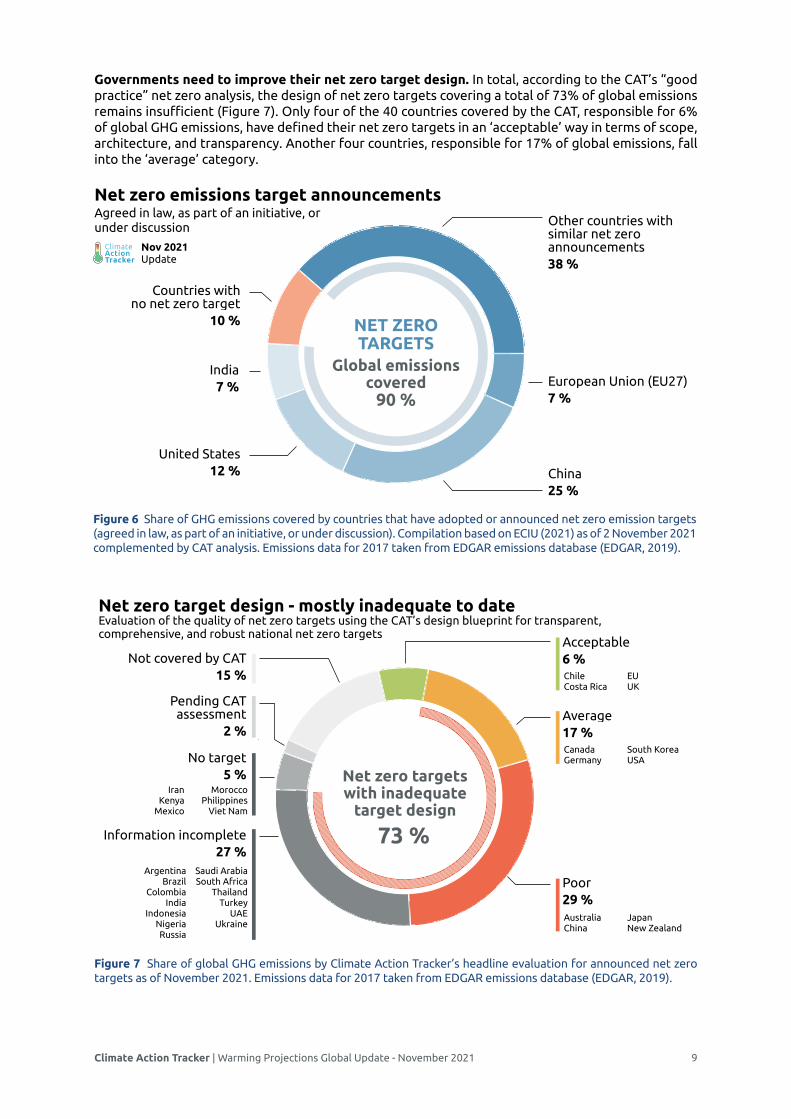
Around 90% of global emissions now fall under net zero targets (Figure 6). India is the most recent major emitter to announce a net zero goal. Together with China, the EU, and USA, these four countries represent more than half of global greenhouse gas emissions. Even countries with a poor track record in fighting climate change, such as Australia, Russia, Saudi Arabia, Turkey and the United Arab Emirates, have felt obliged to also commit to net zero emissions. As of 2 November 2021, over 140 countries had announced or are considering net zero targets, covering 90% of global emissions (Figure 6), compared to the 130 countries, covering about 70% emissions, in May 2021.
Our ‘optimistic scenario’ now shows that if all governments were to fully implement their net zero targets, global temperature increase can be as low as 1.8°C, a 0.2°C improvement on our May 2021 estimate. While going below the 2°C level is an important milestone, it must be stressed that this estimate is based on only a 50 / 50 chance that warming will, indeed, be limited to 1.8°C. In probabil-istic terms, warming is likely below 2.0°C. And, while words are good, one must judge governments by their actions.
Climate Action Tracker | Warming Projections Global Update - November 2021 9
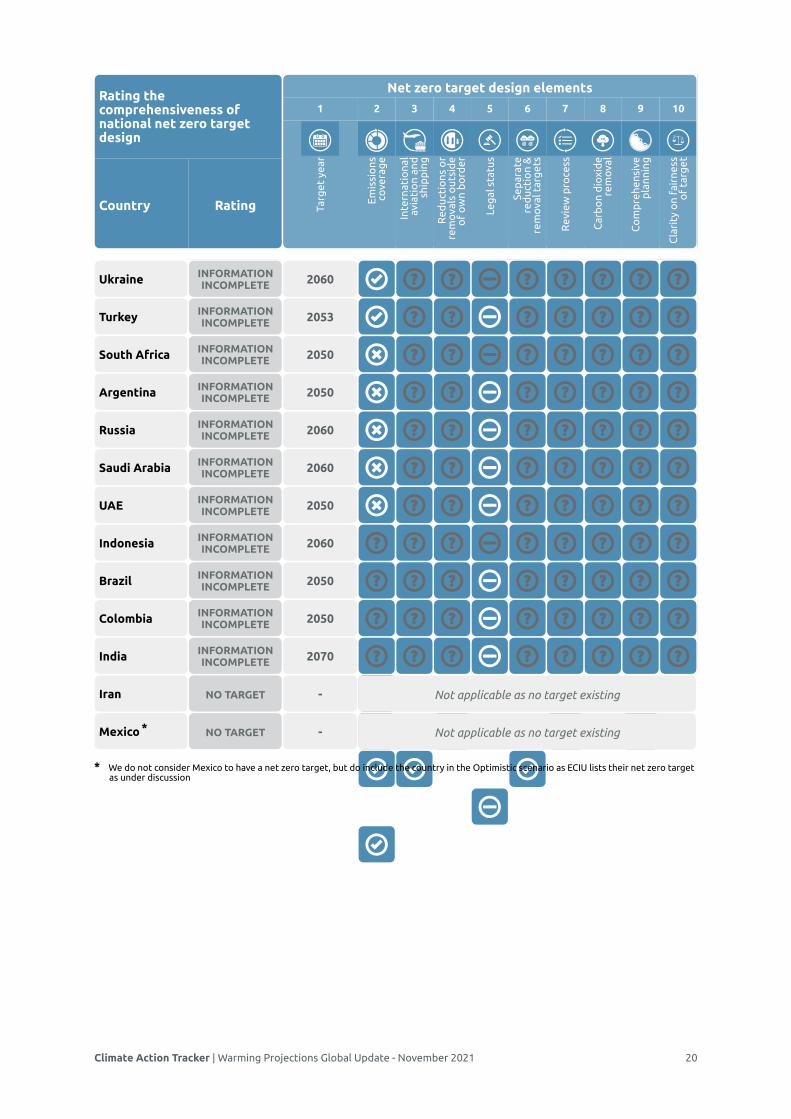
Governments need to improve their net zero target design. In total, according to the CAT’s “good practice” net zero analysis, the design of net zero targets covering a total of 73% of global emissions remains insufficient (Figure 7). Only four of the 40 countries covered by the CAT, responsible for 6% of global GHG emissions, have defined their net zero targets in an ‘acceptable’ way in terms of scope, architecture, and transparency. Another four countries, responsible for 17% of global emissions, fall into the ‘average’ category.
73 %
Acceptable6 %
Page width 16cm
Average17 %
Poor29 %
Information incomplete27 %
Pending CAT assessment
2 %
Net zero targets with inadequate
target design
No target5 %
Not covered by CAT15 %
Net zero target design - mostly inadequate to date Evaluation of the quality of net zero targets using the CAT’s design blueprint for transparent, comprehensive, and robust national net zero targets
Chile Costa Rica
EU UK
Canada Germany
South Korea USA
Australia China
Japan New Zealand
Argentina Brazil
Colombia India
Indonesia Nigeria Russia
Saudi Arabia South Africa
Thailand Turkey
UAE Ukraine
Iran Kenya
Mexico
Morocco Philippines
Viet Nam
Figure 7 Share of global GHG emissions by Climate Action Tracker’s headline evaluation for announced net zero targets as of November 2021. Emissions data for 2017 taken from EDGAR emissions database (EDGAR, 2019).
90 %
Other countries with similar net zero announcements38 %
Page width 16cm
European Union (EU27) 7 %
China25 %
United States12 %
Countries with no net zero target
10 %
Net zero emissions target announcements Agreed in law, as part of an initiative, or under discussion
NET ZERO TARGETS
Global emissions covered
India7 %
ClimateActionTracker
Nov 2021 Update
Figure 6 Share of GHG emissions covered by countries that have adopted or announced net zero emission targets (agreed in law, as part of an initiative, or under discussion). Compilation based on ECIU (2021) as of 2 November 2021 complemented by CAT analysis. Emissions data for 2017 taken from EDGAR emissions database (EDGAR, 2019).
Climate Action Tracker | Warming Projections Global Update - November 2021 10
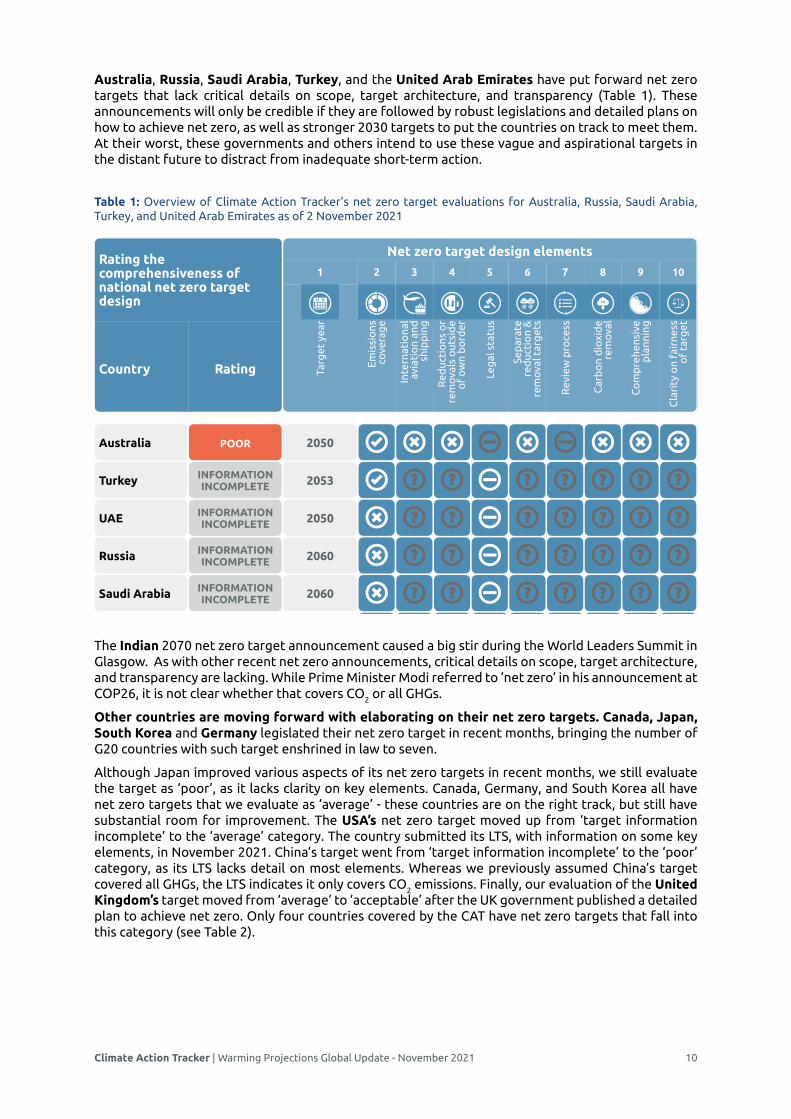
Australia, Russia, Saudi Arabia, Turkey, and the United Arab Emirates have put forward net zero targets that lack critical details on scope, target architecture, and transparency (Table 1). These announcements will only be credible if they are followed by robust legislations and detailed plans on how to achieve net zero, as well as stronger 2030 targets to put the countries on track to meet them. At their worst, these governments and others intend to use these vague and aspirational targets in the distant future to distract from inadequate short-term action.
The Indian 2070 net zero target announcement caused a big stir during the World Leaders Summit in Glasgow. As with other recent net zero announcements, critical details on scope, target architecture, and transparency are lacking. While Prime Minister Modi referred to ‘net zero’ in his announcement at COP26, it is not clear whether that covers CO2 or all GHGs.
Other countries are moving forward with elaborating on their net zero targets. Canada, Japan, South Korea and Germany legislated their net zero target in recent months, bringing the number of G20 countries with such target enshrined in law to seven.
Although Japan improved various aspects of its net zero targets in recent months, we still evaluate the target as ‘poor’, as it lacks clarity on key elements. Canada, Germany, and South Korea all have net zero targets that we evaluate as ‘average’ - these countries are on the right track, but still have substantial room for improvement. The USA’s net zero target moved up from ‘target information incomplete’ to the ‘average’ category. The country submitted its LTS, with information on some key elements, in November 2021. China’s target went from ‘target information incomplete’ to the ‘poor’ category, as its LTS lacks detail on most elements. Whereas we previously assumed China’s target covered all GHGs, the LTS indicates it only covers CO2 emissions. Finally, our evaluation of the United Kingdom’s target moved from ‘average’ to ‘acceptable’ after the UK government published a detailed plan to achieve net zero. Only four countries covered by the CAT have net zero targets that fall into this category (see Table 2).
16cm
Rating the comprehensiveness of national net zero target design
Net zero target design elements
1 2 3 4 5 6 7 8 9 10
Country Rating
Australia POOR 2050a c c b c b c c c
Turkey INFORMATION INCOMPLETE 2053
a d d e d d d d d
UAE INFORMATION INCOMPLETE 2050
c d d e d d d d d
Russia INFORMATION INCOMPLETE 2060
c d d e d d d d d
Saudi Arabia INFORMATION INCOMPLETE 2060
c d d e d d d d d
Targ
et y
ear
Emis
sio
ns
cove
rag
e
Inte
rnat
iona
l av
iati
on
and
sh
ipp
ing
Red
ucti
ons
or
rem
ova
ls o
utsi
de
of
ow
n b
ord
er
Leg
al s
tatu
s
Sep
arat
e re
duc
tio
n &
re
mo
val t
arg
ets
Rev
iew
pro
cess
Car
bo
n d
ioxi
de
rem
ova
l
Co
mp
rehe
nsiv
e p
lann
ing
Cla
rity
on
fair
ness
o
f ta
rget
Table 1: Overview of Climate Action Tracker’s net zero target evaluations for Australia, Russia, Saudi Arabia, Turkey, and United Arab Emirates as of 2 November 2021

Climate Action Tracker | Warming Projections Global Update - November 2021 11
A complete overview of our in-depth assessment can be found in Annex 2. These evaluations aim to provide a nuanced assessment of national net zero targets to understand their scope, architecture, and transparency. Without such scrutiny, there is a risk that poorly backed up net zero claims could render these targets meaningless.7
7 We do not consider Mexico to have a net zero target, but do include the country in the Optimistic scenario as ECIU lists their net zero target as under discussion (see Annex 1 and 3 for details).
Table 2: Overview of Climate Action Tracker’s net zero target evaluations for G20 member countries (excluding non-CAT countries France and Italy) and selected others as of November 2021.
Chile ACCEPTABLE 0 ACCEPTABLE CHL
Costa Rica ACCEPTABLE 0 ACCEPTABLE CRI
EU ACCEPTABLE 0 ACCEPTABLE EU27
UK AVERAGE -1 ACCEPTABLE GBR
Canada AVERAGE 0 AVERAGE CAN
Germany AVERAGE 2 AVERAGE DEU
South Korea POOR -1 AVERAGE KOR
USA INFORMATION INCOMPLETE -1 AVERAGE USA
Australia 0 POOR AUS
China INFORMATION INCOMPLETE 2 POOR CHN
Japan POOR 2 POOR JPN
New Zealand POOR 0 POOR NZL
Argentina INFORMATION INCOMPLETE 0 INFORMATION INCOMPLETE ARG
Brazil INFORMATION INCOMPLETE 0 INFORMATION INCOMPLETE BRA
Colombia INFORMATION INCOMPLETE 0 INFORMATION INCOMPLETE COL
South Africa INFORMATION INCOMPLETE 0 INFORMATION INCOMPLETE ZAF
Ukraine ASSESSMENT IN PROGRESS 0 INFORMATION INCOMPLETE UKR
India INFORMATION INCOMPLETE IND
Indonesia INFORMATION INCOMPLETE IDN
Russia INFORMATION INCOMPLETE RUS
Saudi Arabia INFORMATION INCOMPLETE SAU
Turkey INFORMATION INCOMPLETE TUR
UAE INFORMATION INCOMPLETE ARE
Iran 0 NO TARGET IRN
Mexico 0 NO TARGET MEX
4 4 7
CountryPrevious assessment Status as of Sept 2021
New assessment Status as of Nov 2021
CAT Net zero evaluation of comprehensiveness of target design
16cm
7

Climate Action Tracker | Warming Projections Global Update - November 2021 12
Warming outlook has improved since Paris6
In 2015, ahead of the Paris Agreement, the CAT estimated current policies would lead to warming of 3.6°C, and the submitted targets (NDCs) would lead to 2.7˚C. Six years later, the warming from current policies has now come down to 2.7°C. If governments were to achieve all their submitted NDC pledges and long-term targets, temperature increase could be limited to 2.1°C. Adding all the net zero targets announced and discussed, this would even lead to 1.8°C. The Paris Agreement ratchet-ing-up mechanism is working, but not fast enough.
1°C
1.5°C
2°C
2.5°C
3°C
3.5°C
4°C
4.5°C
5°C
5.5°C
2009 2012 2015 2017 2020 2021
Global temperature
increase in 2100
IMPACT OF THE PARIS AGREEMENT Changes to the estimated global temperature increase in 2100
Year of temperature estimate
ClimateActionTracker
Nov 2021 Update
Effect of implemented policies0.9°Creduction
Effect of long-term targets0.3°C
Effect of all Paris pledges & targets
1.4°Creduction
Effect of Paris 2030
targets only1.1°Creduction
16 cm
2021
reduction
(India, etc)
Effect of additional net zero announcements
0.3°C reduction
Roll back of USA & Russia
Lead up to Paris
Policies & action with range
Paris Agreement Dec 2015
Overachievement of national targets
2nd round targets
Pledges & targets with range
2030 targets only
Optimistic scenario
Figure 9 Impact of the Paris Agreement on the estimated global temperature increase in 2100. Figure shows the estimates of the Climate Action Tracker from 2009-2021 for “pledges and targets” and “current policies”.8 In this update, we have also added a temperature estimate for 2030 targets only.
8
8 The Climate Action Tracker is continuously updating and refining its methodology. As a result, the temperature estimates in this figure cannot solely be attributed to target improvements or real-world action; however, the figure does show the overall progression of our estimates.

Climate Action Tracker | Warming Projections Global Update - November 2021 13
Country snapshots 7
ARGENTINA submitted an updated and slightly more ambitious NDC in November 2021 based on the announcement in May 2021. Argentina continues to prioritise oil and gas exploita-tion in its energy strategy—in “Vaca Muerta”, the world’s second largest shale gas reserve—jeopardising the achievement of its climate objectives.
AUSTRALIA refused to strengthen its 2030 climate target, while claiming it could exceed it. Its continued strategy supporting fossil fuels (especially gas) over renewable energy is of major concern and makes its new net zero claim not credible. Australia has put forward a net zero target that lacks critical details on its scope, target architecture, and transparency.
BHUTAN submitted a second NDC in June 2021, which reiterated its goal to remain carbon neutral. However, increasing energy and industry emissions could put Bhutan in a difficult position in the long-term and risk breaking its carbon neutrality.
BRAZIL’S new announced 2030 target is only stronger on paper and, at best, only reverts some of the damage caused by the 2020 NDC update. Lack of clarity on the references used makes the target emissions level uncertain.
CANADA has updated its NDC, but needs to focus on implementing the policies to achieve it as it is currently far off-track. It continues to fund fossil fuel pipelines, exceeding the capacity need. Raising transport emissions are also a concern.
CHILE has increased the speed of its coal phase-out and approved a new energy efficiency law that could bring emissions under current policies downward. If all planned policies are implemented Chile could peak emissions two years before planned, in 2023. It has recently submitted a long-term strategy.
CHINA submitted only a mildly more ambitious NDC, which will make net zero CO2 emissions by 2060 difficult to achieve. China is giving mixed signals about coal. While signals to “phase down” coal consumption are welcome, coal power increased by a net 29.8GW in 2020, 76% of the world’s new coal plants.
COLOMBIA adopted a stronger target in its NDC update, but needs stronger action across the board. It must increase renewables and abandon coal, fracking plans – especially as coal mining investors are leaving the country. Deforestation is of great concern as LULUCF are 30% of its emissions.
COSTA RICA updated its NDC in December 2020, slightly increasing the ambition of its 2030 climate target and improving its target architecture. It outlined various sectoral measures and targets, and could improve further by specifying the sectoral breakdown.
ETHIOPIA submitted an NDC update in July 2021 committing to its first unconditional emissions target. It will achieve both targets if current policies are fully implemented.
The EUROPEAN UNION member states’ policies are far from sufficient to meet the emissions reduction target of “at least 55%” below 1990. Some of its members are pushing for continued public funding of natural gas infrastructure – all while paying the price for the EU’s high reliance on fossil fuel imports amidst the current energy crisis. The EU needs to step up ambition at home, and provide international finance to support decarbonisation abroad.
Climate Action Tracker | Warming Projections Global Update - November 2021 14
GERMANY’S updated target for 2030 and coal phase-out by 2038 is inconsistent with 1.5˚ C. It has a large and growing emissions gap in the transport sector. Renewables will not reach its 65% by 2030 target, which is, by itself, too low.
INDIA’S announced NDC will, at most, mildly improve emission reductions beyond current policies. Its 2070 net zero target is welcome, but it is difficult to evaluate due to a lack of clarity over its gas coverage. This target is incompatible with India’s huge coal pipeline and this issue needs to be addressed. Its first COVID19 recovery package prioritised fossil fuels, but the second has some stimulus aimed at a green recovery.
INDONESIA’S coal pipeline is huge, while renewables face many regulatory hurdles. In 2020 alone, fossil fuel subsidies were a massive USD 7bn. Forests are still in decline, amid rollbacks of environmental regulation. Indonesia submitted an NDC in July 2021 but did not strengthen its 2030 target. In Glasgow, Indonesia joined the list of countries promising to phase out coal.
IRAN is the only country out of the 40 we assess that has yet to ratify the Paris Agreement. It is expected to overachieve its INDC due to an inflated baseline. This OPEC member’s economy is dominated by fossil fuels despite having huge renewables potential.
JAPAN’S new 2030 target level is now close to being 1.5˚C-compatible. Government policies reduce emissions, but not enough to match the 46% emissions reduction target. Reducing coal to 19% share of power mix in 2030 is better, but it needs to be zero.
KAZAKHSTAN has yet to update its 2030 climate target. The failure to increase its mitigation ambition for 2030 does not comply with the Paris Agreement’s requirement that each successive NDC should present a progression beyond the current one.
KENYA updated its NDC in December 2020, where it slightly increased its 2030 targets and provided an unconditional target.
MEXICO’S government continues to show a lack of commitment to climate change by refusing to update its climate target, rolling back regulation meant to foster investment in renewable energy, and favouring fossil fuels over renewables.
MOROCCO strengthened its unconditional and conditional 2030 emissions reductions targets in June 2021. It has one of the highest levels of renewable energy capacity in Africa, but it also continues to heavily rely on coal to meet its electricity needs.
NEPAL submitted its second NDC on December 2020, which, for the first time, included part of their energy-related targets as unconditional commitments. The submission also strengthened the conditional target’s transparency, included more quantifiable targets and reference to a net zero target.
NEW ZEALAND is exempting methane from its 2050 target, with no policies to address 40% of its emissions (agriculture). Its emissions reduction plan must focus on high emitting sectors, not forests. It plans to meet a full two thirds of its new NDC by buying international credits.
NIGERIA has an ambitious 2030 renewable energy target, which it is not on track to achieve, due to slow implementation. Nigeria should reconsider policies to revive its coal sector and expand its gas market. These policies run the risk of stranded assets and are at odds with the Paris Agreements 1.5°C limit.
NORWAY was the world’s ninth largest natural gas and eleventh largest oil producer in 2020—with no end in sight for continued exploration. Its 2020 NDC will cut emissions by at least 50% by 2030 and aims for a 55% emissions reduction below 1990 levels. If Norway were to drop the 50% target and move to the 55% target, consistent with the EU’s update goal, its target would become 1.5°C compatible when compared to the minimum it needs to cut emissions within its own borders.
Climate Action Tracker | Warming Projections Global Update - November 2021 15
PERU’S updated NDC will result in 2030 emissions that are 6% lower than its predecessor. We estimate that Peru can reach this target with existing policies, and could therefore increase its climate targets. The updated NDC includes a goal to reach carbon neutrality by 2050.
THE PHILIPPINES increased its conditional target from 70% to 75% below BAU; and has proposed an unconditional target in its updated NDC for the first time. The uncondi-tional target is well above emissions projections under current policies, and thus does not strengthen the country’s own ambition. To achieve the conditional target, the Philippines would need international support for its planned policies as well as to adopt additional measures.
RUSSIA’S Energy Strategy focuses almost exclusively on promoting fossil fuels: extraction, consumption and exports. Its renewable target is negligible. It also intends to use unmanaged forests in its accounting, violating UN guidelines. This makes the new net zero pledge not credible.
SAUDI ARABIA’S updated 2030 target is contingent on a significant contribution of oil and gas exports to its economy, and it reserves itself the right to update its NDC target should exports decline as a result of other governments implementing the Paris Agreement. Despite numerous announcements and targets since 2013, renewables supply only 0.1% of electricity generation—far from the 50% target by 2030 in the NDC. There are still several uncertainties about the newly announced 2060 net zero target.
SINGAPORE updated its NDC in March 2020. While it improved the form of its target, moving from an emissions intensity target to an absolute cap on emissions and adopting the latest IPCC reporting guidelines, as well as gas coverage, the level at which Singapore will limit emissions remains unchanged.
SOUTH AFRICA’S submitted a stronger 2030 target in September 2021. The uncertainty around the successful implementation of the Integrated Resource Plan (IRP2019) remains high, given state-owned utility giant Eskom’s unresolved financial and operational problems and government’s poor past performance in managing the energy transition.
SOUTH KOREA is making slow progress in climate change mitigation and energy sector planning. It has cut coal, but is replacing it with gas, still a fossil fuel that must be phased out. The share of fossil fuels in power sector is still at 67%. South Korea’s government appears to have backpedalled on its vow to stop funding international coal. At COP26, South Korea proposed a more ambitious NDC to reduce emissions by 40% by 2030 and has progressed on the development of its net-zero target, which is now enshrined in law.
SWITZERLAND rejected its amended CO2 Act in a June 2021 referendum and did not submit a more ambitious target, a significant setback to progressing its climate action. Putting forward an alternative set of policies and regulations should now be a top priority.
THAILAND is shifting out of coal, but its huge push towards gas is a highly risky investment for the climate & stranded assets. We estimate that Thailand will not reach its weak 2030 target with current policies. In good news: Thailand has shown recent intent to get on track.
THE GAMBIA proposes more action in its second NDC but higher historical and baseline emissions means absolute emissions are higher, may impact CAT rating, full analysis to come.
TURKEY has ratified the Paris Agreement and set a 2053 net zero target, but details on how it will reach this target are lacking. It has not updated its very unambitious 2030 target and still has a large pipeline of planned coal power plants.

Climate Action Tracker | Warming Projections Global Update - November 2021 16
The UNITED ARAB EMIRATES was the first Gulf country to update its NDC in December 2020, setting the UAE’s first economy-wide emissions reduction target for 2030. It has also recently announced a net zero target for 2050. The 2050 National Energy Strategy foresees expansion plans for coal and natural gas, which is inconsistent with global decarbonisation by 2050.
The UNITED KINGDOM’S Net Zero Strategy maps out several potential scenarios to achieve its 2050 target, but details on how it will achieve its 2030 and 2035 targets are still lacking.
UKRAINE submitted an updated NDC in July 2021, including a target of 65% reduction below 1990 levels by 2030 – a significant improvement from its previous target of at least 40% reduction below 1990 by 2030, and an announcement of climate neutrality no later than 2060.
The UNITED STATES OF AMERICA’S emissions will remain relatively high, reaching 16-18% below 2005 levels in 2030, far short of its 50-52% reduction target, without new policies. On November 5, the US passed one of two major bills before Congress, each with considerable steps forward on climate action. Together, both bills represent a major step forward for the US in bringing its 2030 target within reach. The US also submitted a long-term strategy at the beginning of COP26.
VIET NAM has the world’s third largest coal pipeline, after China & India, & massive plans for gas. While it has supported some renewables, it has the potential to become a regional leader for solar energy & offshore wind.

Climate Action Tracker | Warming Projections Global Update - November 2021 17
Annex
What’s included in the various temperature scenario?
Table 3: Overview of what is included for each country under the various Climate Action Tracker’s temperature projections for 2100 (November 2021 update).
Scenario definitionA1
Country 2030 targets only*
Pledges & Targets Optimistic scenario Policies & action data from2030 NDC
target*Net Zero targets
NZT included?
Method
Argentina Updated NDC (Nov. 2021)
Updated NDC (Nov. 2021)
No Yes Conservative global estimate
July 2020
Australia Current policies Current policies Yes (max) Yes (min) CAT estimate Nov. 2021
Bhutan Current policies Current policies No Yes Conservative global estimate
Nov. 2021
Brazil Announced NDC (Nov. 2021)
Announced NDC (Nov. 2021)
No Yes CAT estimate Nov. 2021
Canada Updated NDC (July 2021)
Updated NDC (July 2021)
Yes (max) Yes (min) CAT estimate Sept. 2021
Chile Updated NDC (April 2020)
Updated NDC (April 2020)
Yes Yes CAT estimate Nov. 2021
China Updated NDC (Oct. 2021)
Updated NDC (Oct. 2021)
Yes (max) Yes (min) CAT estimate Sept. 2021
Colombia Updated NDC (Dec. 2020)
Updated NDC (Dec. 2020)
No Yes CAT estimate Sept. 2021
Costa Rica Updated NDC (Dec. 2020)
Updated NDC (Dec. 2020)
Yes (max) Yes (min) CAT estimate July 2020
Ethiopia Current policies Current policies No Yes Conservative global estimate
Sept. 2021
EU27 Updated NDC (Dec. 2020
Updated NDC (Dec. 2020)
Yes (max) Yes (min) CAT estimate Sept. 2021
Germany Covered in EU27
India Current policies Current policies No Yes CAT estimate Sept. 2021
Indonesia Current policies Current policies No Yes CAT estimate Nov. 2021
Iran Current policies Current policies No No -- Sept. 2021
Japan NDC (Oct. 2021) NDC (Oct. 2021) Yes (max) Yes (min) CAT estimate Sept. 2021
Kazakhstan First NDC (Dec. 2016)
First NDC (Dec. 2016)
No Yes CAT estimate Nov. 2021
Kenya Current policies Current policies No No -- Nov. 2020
Mexico Updated NDC (Dec. 2020)
Updated NDC (Dec. 2020)
No Yes Conservative global estimate
Sept. 2020
Morocco Updated NDC (June 2021)
Updated NDC (June 2021)
No No -- July 2020
Nepal Current policies Current policies No Yes Conservative global estimate
Nov. 2020

Climate Action Tracker | Warming Projections Global Update - November 2021 18
Country 2030 targets only*
Pledges & Targets Optimistic scenario Policies & action data from2030 NDC
target*Net Zero targets
NZT included?
Method
New Zealand
Updated NDC (Nov. 2021)
Updated NDC (Nov. 2021)
Yes (max) Yes (min) CAT estimate Sept. 2021
Nigeria Updated NDC (July 2021)
Updated NDC (July 2021)
No Yes CAT estimate Sept. 2021
Norway Updated NDC (Feb. 2020)
Updated NDC (Feb. 2020)
Yes (max) Yes (min) CAT estimate Sept. 2021
Peru Current policies Current policies No Yes Conservative global estimate
Nov. 2020
Philippines Current policies Current policies No No -- Nov. 2020
Russian Federation
Current policies Current policies No Yes CAT estimate Oct. 2021
Saudi Arabia
Current policies Current policies No Yes CAT estimate Sept. 2021
Singapore Current policies Current policies Yes Yes CAT estimate July 2020
South Africa
Updated NDC (Sept. 2021)
Updated NDC (Sept. 2021)
Yes Yes CAT estimate Sept. 2021
South Korea
Announced NDC (Nov. 2021)
Announced NDC (Nov. 2021)
Yes Yes CAT estimate Nov. 2021
Switzerland Updated NDC (Dec. 2020)
Updated NDC (Dec. 2020)
Yes Yes CAT estimate Sept. 2021
Thailand Updated NDC (Oct. 2020)
Updated NDC (Oct. 2020)
No Yes Conservative global estimate
Sept. 2021
The Gambia**
First NDC (Nov. 2016)
First NDC (Nov. 2016)
No Yes Conservative global estimate
Nov. 2020
Turkey Current policies Current policies No Yes CAT estimate Oct. 2021
UAE Updated NDC (Dec. 2020)
Updated NDC (Dec. 2020)
No Yes CAT estimate Nov. 2020
UK Updated NDC (Dec. 2020)
Updated NDC (Dec. 2020)
Yes Yes CAT estimate Sept. 2021
Ukraine Updated NDC (July 2021)
Updated NDC (July 2021)
No Yes CAT estimate Nov. 2021
USA Updated NDC (April 2021)
Updated NDC (April 2021)
Yes (max) Yes (min) CAT estimate Sept. 2021
Viet Nam Current policies Current policies No No -- Oct. 2021
* For weak targets, we take a country’s estimated 2030 level under current policies, if that level is lower than the target.
** The Gambia submitted its second NDC in September 2021. We will incorporate its updated NDC in subsequent assessments.
CAT temperature estimates are done using the MAGICC climate model. More information on the model is available here.

Climate Action Tracker | Warming Projections Global Update - November 2021 19
Detailed overview of net zero target assessmentsA2
Rating the comprehensiveness of national net zero target design
Net zero target design elements
1 2 3 4 5 6 7 8 9 10
Country Rating
EU ACCEPTABLE 2050a b a a c a a a c
UK ACCEPTABLE 2050a a c a c a a a b
Chile ACCEPTABLE 2050a c a b a b a a c
Costa Rica ACCEPTABLE 2050a c a b a b a a c
Germany AVERAGE 2045a c c a a a c b b
South Korea AVERAGE 2050c c a a a b a b c
Canada AVERAGE 2050a c a a c a c b c
USA AVERAGE 2050a c c b c b a b c
Japan POOR 2050a c c a c a c b c
New Zealand POOR 2050c c c a c a c b c
Australia POOR 2050a c c b c b c c c
China POOR 2060c c c b c c c b b
Ukraine INFORMATION INCOMPLETE 2060
a d d b d d d d d
Turkey INFORMATION INCOMPLETE 2053
a d d e d d d d d
South Africa INFORMATION INCOMPLETE 2050
c d d b d d d d d
Argentina INFORMATION INCOMPLETE 2050
c d d e d d d d d
Russia INFORMATION INCOMPLETE 2060
c d d e d d d d d
Saudi Arabia INFORMATION INCOMPLETE 2060
c d d e d d d d d
UAE INFORMATION INCOMPLETE 2050
c d d e d d d d d
Indonesia INFORMATION INCOMPLETE 2060
d d d b d d d d d
Brazil INFORMATION INCOMPLETE 2050
d d d e d d d d d
Colombia INFORMATION INCOMPLETE 2050
d d d e d d d d d
India INFORMATION INCOMPLETE 2070
d d d e d d d d d
Iran NO TARGET -Z Z Z Z Z Z Z Z Z
Mexico NO TARGET -Z Z Z Z Z Z Z Z Z
16cm
Targ
et y
ear
Emis
sio
ns
cove
rag
e
Inte
rnat
iona
l av
iati
on
and
sh
ipp
ing
Red
ucti
ons
or
rem
ova
ls o
utsi
de
of
ow
n b
ord
er
Leg
al s
tatu
s
Sep
arat
e re
duc
tio
n &
re
mo
val t
arg
ets
Rev
iew
pro
cess
Car
bo
n d
ioxi
de
rem
ova
l
Co
mp
rehe
nsiv
e p
lann
ing
Cla
rity
on
fair
ness
o
f ta
rget
Not applicable as no target existing
Not applicable as no target existing
* We do not consider Mexico to have a net zero target, but do include the country in the Optimistic scenario as ECIU lists their net zero target as under discussion
*
Table 4: Overview of Climate Action Tracker’s net zero target evaluations for G20 member countries (excluding France and Italy as both not separately analysed by the CAT) and selected other countries per key elements as of November 2021
Climate Action Tracker | Warming Projections Global Update - November 2021 20
Rating the comprehensiveness of national net zero target design
Net zero target design elements
1 2 3 4 5 6 7 8 9 10
Country Rating
EU ACCEPTABLE 2050a b a a c a a a c
UK ACCEPTABLE 2050a a c a c a a a b
Chile ACCEPTABLE 2050a c a b a b a a c
Costa Rica ACCEPTABLE 2050a c a b a b a a c
Germany AVERAGE 2045a c c a a a c b b
South Korea AVERAGE 2050c c a a a b a b c
Canada AVERAGE 2050a c a a c a c b c
USA AVERAGE 2050a c c b c b a b c
Japan POOR 2050a c c a c a c b c
New Zealand POOR 2050c c c a c a c b c
Australia POOR 2050a c c b c b c c c
China POOR 2060c c c b c c c b b
Ukraine INFORMATION INCOMPLETE 2060
a d d b d d d d d
Turkey INFORMATION INCOMPLETE 2053
a d d e d d d d d
South Africa INFORMATION INCOMPLETE 2050
c d d b d d d d d
Argentina INFORMATION INCOMPLETE 2050
c d d e d d d d d
Russia INFORMATION INCOMPLETE 2060
c d d e d d d d d
Saudi Arabia INFORMATION INCOMPLETE 2060
c d d e d d d d d
UAE INFORMATION INCOMPLETE 2050
c d d e d d d d d
Indonesia INFORMATION INCOMPLETE 2060
d d d b d d d d d
Brazil INFORMATION INCOMPLETE 2050
d d d e d d d d d
Colombia INFORMATION INCOMPLETE 2050
d d d e d d d d d
India INFORMATION INCOMPLETE 2070
d d d e d d d d d
Iran NO TARGET -Z Z Z Z Z Z Z Z Z
Mexico NO TARGET -Z Z Z Z Z Z Z Z Z
16cm
Targ
et y
ear
Emis
sio
ns
cove
rag
e
Inte
rnat
iona
l av
iati
on
and
sh
ipp
ing
Red
ucti
ons
or
rem
ova
ls o
utsi
de
of
ow
n b
ord
er
Leg
al s
tatu
s
Sep
arat
e re
duc
tio
n &
re
mo
val t
arg
ets
Rev
iew
pro
cess
Car
bo
n d
ioxi
de
rem
ova
l
Co
mp
rehe
nsiv
e p
lann
ing
Cla
rity
on
fair
ness
o
f ta
rget
Not applicable as no target existing
Not applicable as no target existing
* We do not consider Mexico to have a net zero target, but do include the country in the Optimistic scenario as ECIU lists their net zero target as under discussion
*

Climate Action Tracker | Warming Projections Global Update - November 2021 21
Optimistic Temperature Estimate AssumptionsA3
We had to make several assumptions to assess the impact of net zero targets on the global temperature increase by 2100. These relate to (1) the emissions covered by the various targets, (2) land-use, land-use change and forestry (LULUCF) emissions by 2050, (3) the trajectory of non-CO2 emissions and (4) the importance of 2030 targets.
Table 5 provides an overview of all net zero targets assessed for which the Climate Action Tracker has developed estimates. Table 5 lists all net zero targets included in the modelling runs for the CAT’s temperature estimate in November 2020.
Table 5: List of net zero targets for which CAT has developed estimates
Country Type of net zero target
Target year
Assumption on LULUCF Assumptions on GHG emissions excluding LULUCF
Australia Net zero GHGs
2050 N/A We use the estimates for the scenarios excluding offsets contained in the government’s long-term strategy, converted these values into AR4 GWP and assumed a linear decline between 2030 and 2050.
The top end of the range is used in our standard pledges and targets pathway, the bottom end is used in the Optimistic pathway.
Brazil Net zero GHGs
2050 We used an estimate from the Fórum Brasileiro de Mudança do Clima, a government advisory body, for 2050 LULUCF emissions.
We assumed a linear decline in total GHGs between 2030 and 2050 to balance LULUCF emissions in 2050.
Canada Net zero GHGs
2050 The government has not provided any detail on how it intends to meet its 2050 target; therefore, we use the same LULUCF as for its NDC.
We assumed a linear decline in total GHGs between 2030 and 2050 to balance LULUCF emissions in 2050.
The top end of the range is used in our standard pledges and targets pathway, the bottom end is used in the Optimistic pathway.
Chile Net zero GHGs
2050 We used national projections for 2050 presented in the updated NDC and Climate Neutrality Plan of 2020 and assumed LULUCF emissions to be -65 MtCO2e.
We used national projections for all GHG emission 2050 presented in the updated NDC and Climate Neutrality Plan of 2020 to balance LULUCF sinks in 2050.
China Net zero CO2
2060 We used a ten-year historical average based on GHG inventory data from 2005 to 2014. The average of LULUCF emissions in those years is –783 MtCO2e, which we assumed as a value for 2050 and 2060. This estimate is consistent with the scenarios from Tsinghua University, which show agricultural and forestry sinks of 700-780 MtCO2e in 2050.
We apply a linear interpolation for economy-wide CO2 emissions (excl. LULUCF) from 2030 emission levels expected under achievement of the NDC targets, to zero CO2 emissions in 2060, expected under the carbon neutrality target.
We assume that non-CO2 gases, significant in China, will lag behind but still be phased out indirectly through carbon neutrality efforts. We apply linear interpolation between the 2030 economy-wide non-CO2 emissions (excl. LULUCF) expected under achievement of NDCs to zero in 2080.
For 2030 values, we use the average of the NDC non-fossil fuel and the NDC peaking pledge as the starting point.
We assume LULUCF sinks will be in the order of 783 MtCO2e in mid-century and beyond, and expect it to be used to counterbalance hard-to-abate emissions.
The top end of the range is used in our standard pledges and targets pathway, the bottom end is used in the optimistic pathway.

Climate Action Tracker | Warming Projections Global Update - November 2021 22
Country Type of net zero target
Target year
Assumption on LULUCF Assumptions on GHG emissions excluding LULUCF
Colombia Net zero GHGs
2050 In the beginning of 2021, Colombia announced their target to reach “carbonon neutralidad” assumed to be net zero GHG emissions by 2050, for which the strategy is still in the works.
Projections for LULUCF emissions in 2050 are taken here from the background modelling document used in the updated NDC. In even the most ambitious scenario, Colombia does not create a substantial land-based sink of emissions in 2050. We assume no contribution from LULUCF to the target.
We assume emissions are zero in 2050, with a linear decline from 2030 levels.
Costa Rica Net zero GHGs
2050 We used national projections for 2050, as provided for in the 2018 Decarbonization Strategy submitted to the UNFCCC.
We used national projections for 2050, as provided for in the 2018 Decarbonization Strategy, to balance LULUCF sinks in 2050. We use the upper limited of the NDC in 2030 as the starting point.
The top end of the range is used in our standard pledges and targets pathway, the bottom end is used in the Optimistic pathway.
European Union
Net zero GHGs
2050 See assumptions for EU’s for 2050 excluding LULUCF on the right.
We used the EU’s own projections for 2050 excluding LULUCF, from the 1.5LIFE and 1.5TECH scenarios, adjusted to the EU27.
The top end of the range is used in our standard pledges and targets pathway, the bottom end is used in the Optimistic pathway.
India Net zero GHGs
2070 The government has not provided any detail on how it intends to meet its 2070 target, nor the reliance on the land sector.
In its first NDC, India committed to enhancing its sink by an additional 2.5 to 3bn tonnes by 2030. Assuming those figures represent a cumulative 15-year total (2016-2030), India’s LULUCF sink would grow to around 500 MtCO2 in 2030 (from a historic level of around 300MtCO2e in 2016). In the absence of any other estimate, we have used this figure for its sink in 2070.
We assume the target covers all gases and that there is a linear decline in total GHGs between 2030 and 2070 to balance LULUCF emissions in 2070.
Indonesia Net zero GHGs
2060 The Indonesian government assumes a LULUCF sink of 299 MtCO2e in the LCCP scenario presented in the LTS submitted to the UNFCCC. We keep this value constant for 2060.
We assumed a linear decline in total GHGs between 2030 and 2060 to balance LULUCF emissions in 2060.
Japan Net zero GHGs
2050 We extrapolated the 2009-2019 trend to 2030, followed by a constant sink to 2050, and took the average sink for the 2009-2019 period to create a range for LULUCF.
We applied a linear interpolation of all GHG emission between 2030 and 2050 to balance LULUCF sinks in 2050.
The top end of the range is used in our standard pledges and targets pathway, the bottom end is used in the Optimistic pathway.

Climate Action Tracker | Warming Projections Global Update - November 2021 23
Country Type of net zero target
Target year
Assumption on LULUCF Assumptions on GHG emissions excluding LULUCF
Kazakhstan Net zero GHGs
2060 As the government announced an extensive reforestation plan, we assumed that by 2060 LULUCF emissions will equal the lowest level between 1990 and 2020. We assumed that LULUCF emissions will linearly decrease between 2020 and 2060.
We assumed a linear decline in total GHGs between 2030 and 2060.
New Zealand
Net zero GHG, with the exception of CH4 from agriculture and waste
2050 We used national projection for 2050, harmonised to historical data.
We calculate the methane reduction target separately and then assume a linear decline in emissions between 2030 and 2050, to balance LULUCF removals in 2050.
The top end of the range is used in our standard pledges and targets pathway, the bottom end is used in the Optimistic pathway.
Nigeria Net zero GHGs
Second half of the century*
We make no assumptions about LULUCF given the limited data available.
We quantified the 2050 target referenced in Nigeria’s final NDC update of 50% below currently levels (which we took to be 2018). We did not explicitly calculation a net zero target during the second half of the century, but used our model’s pathway extension from the 2050 value.
*Note: Nigeria announced a 2060 net zero target during the World Leaders Summit. We will update our analysis for Nigeria to take this development into account in our next assessment.
Norway GHGs reduce by 90-95%, compared to 1990. We assumed that LULUCF emissions are included in this target.
2050 We used a projection from NIBIO, which gives a sink in 2050 of 20 MtCO2.
We assume a linear decline in GHG emissions excluding LULUCF between 2030 and 2050, such that total emissions in 2050 including LULUCF are 90-95% below 1990 levels.
The top end of the range is used in our standard pledges and targets pathway, the bottom end is used in the Optimistic pathway.
Russian Federation
Net zero CO2
2060 Russia does not have 2060 LULUCF projections. We have used the most ambitious 2050 sink scenario in its draft long-term strategy.
We assumed that CO2 emissions will decline at a linear rate between 2030 and 2060 to balance LULUCF removals in 2060.
We assume that non-CO2 emission follow a linear decline to zero by 2070 based on the 2030 value in Russia’s 4th Biennial Update Report ‘with measures’ scenario.
Saudi Arabia
Net zero CO2
2060 The Saudi government has announced to achieve a sink of 200 MtCO2 from 2030 onwards, which we assume to stay constant towards 2060.
We assumed that CO2 emissions will decline at a linear rate between 2030 and 2060 to balance LULUCF sinks in 2060. We assume that non-CO2 emissions will decline at a linear rate between 2030 and 2080 in line with the IPCC SR1.5 pathways.
Singapore Net zero GHGs
Second half of the century
We make no assumptions as LULUCF is negligible.
We use Singapore’s 2050 target to peak emissions at 32MtCO2e in 2050 (converted from AR5 GWP values to AR4). We make no further assumptions about when the net zero target will be met later in the century.
South Africa
Net zero CO2
2050 We used a ten-year historical average based on national inventory data from 2005-2015 resulting in -16 MtCO2e.
We assumed that CO2 emissions will decline at a linear rate between 2030 and 2050 to balance LULUCF sinks in 2050. We assume that non-CO2 emissions will decline at a linear rate between 2030 and 2080 in line with the IPCC SR1.5 pathways.
South Korea
Net zero GHGs
2050 The government of South Korea projects a LULUCF sink of 25MtCO2e by 2050 in its 2050 Carbon Neutral Scenario report.
We assumed a linear decline in total GHGs between 2030 (announced NDC level) and 2050 to balance LULUCF emissions in 2050.

Climate Action Tracker | Warming Projections Global Update - November 2021 24
Country Type of net zero target
Target year
Assumption on LULUCF Assumptions on GHG emissions excluding LULUCF
Switzerland Net zero GHGs
2050 We used the “with existing measures” projection for 2030 from the 4th Biennial Report and assumed the same value for 2050.
We assumed a linear decline in total GHGs between 2030 and 2050 to balance LULUCF emissions in 2050.
Turkey Net zero GHGs
2053 We used the government projection for 2030 under the “with existing measures” scenario in the 4th Biennial Report as Turkey does not have a 2053 LULUCF projection.
We assumed a linear decline in total GHGs between 2030 and 2053 to balance LULUCF emissions in 2053.
Ukraine Net zero GHGs
2060 We used the government’s LULUCF projection for 2050, as described in the modelling report that informed Ukraine’s updated NDC. As the report provides no data point for 2060, we assumed the LULUCF sink remains stable between 2050 and 2060, at -36 MtCO2e.
We assumed that GHG emissions decrease linearly between 2030 and 2060. By 2060, emissions amount to 36 MtCO2e, so Ukraine’s net emissions are zero.
United Arab Emirates
Net zero CO2
2050 We used a ten-year historical average based on national inventory data from 2004-2015 resulting in -11 MtCO2e.
We assumed that CO2 emissions will decline at a linear rate between 2030 and 2050 to balance LULUCF sinks in 2050. We assume that non-CO2 emissions will decline at a linear rate between 2030 and 2080 in line with the IPCC SR1.5 pathways.
United Kingdom
Net zero GHGs
2050 We used the 2050 LULUCF projection from the ‘balanced net zero pathway’ scenario in the UK Centre for Ecology and Hydrology’s Updated quantifica-tion of the impact of future land use scenarios to 2050 and beyond final report (-19 MtCO2e).
We assumed that GHG emissions decrease linearly between 2030 and 2050 from the emissions level implied by the UK’s 2030 target to balance the projected 2050 LULUCF sink.
United States
Net zero GHGs
2050 Our LULUCF assumptions are based on data extracted from the graphs in the US’s long-term strategy. We use the LULUCF projection range for our assumptions on the sink by 2050.
We assumed that GHG emissions will decline at a linear rate between 2030 and 2050 to balance LULUCF removals in 2050.
The top end of the range is used in our standard pledges and targets pathway, the bottom end is used in the Optimistic pathway
Table 6: List of all net zero targets included in the ‘optimistic scenario’ modelling runs for the global aggregation based on the ECIU (2021) complemented by CAT analysis as of 2 November 2021.
Country Status Year
Afghanistan Target Under Discussion 2050
Andorra In Policy Document 2050
Angola Target Under Discussion 2050
Antigua and Barbuda Target Under Discussion 2050
Argentina Target Under Discussion 2050
Armenia In Policy Document 2050
Australia In Policy Document 2050
Austria* In Policy Document 2040
Bahamas (the) Target Under Discussion 2050
Bahrain Target Under Discussion 2060
Bangladesh Target Under Discussion 2050
Barbados Target Under Discussion 2050

Climate Action Tracker | Warming Projections Global Update - November 2021 25
Country Status Year
Belgium* Target Under Discussion 2050
Belize Target Under Discussion 2050
Benin Target Under Discussion 2050
Bhutan Achieved
Brazil In Policy Document 2050
Bulgaria* Target Under Discussion 2050
Burkina Faso Target Under Discussion 2050
Burundi Target Under Discussion 2050
Cabo Verde Target Under Discussion 2050
Cambodia Target Under Discussion 2050
Canada In Law 2050
Central African Republic (the) Target Under Discussion 2050
Chad Target Under Discussion 2050
Chile Proposed Legislation 2050
China In Policy Document 2060
Colombia Target Under Discussion 2050
Comoros (the) Target Under Discussion 2050
Congo (the Democratic Republic of the) Target Under Discussion 2050
Cook Islands (the) Target Under Discussion 2050
Costa Rica In Policy Document 2050
Croatia Target Under Discussion 2050
Cyprus Target Under Discussion 2050
Czechia Target Under Discussion 2050
Denmark* In Law 2050
Djibouti Target Under Discussion 2050
Dominica Target Under Discussion 2050
Dominican Republic (the) Target Under Discussion 2050
Ecuador Target Under Discussion 2050
Eritrea Target Under Discussion 2050
Estonia* Target Under Discussion 2050
Ethiopia Target Under Discussion 2050
European Union Proposed Legislation 2050
Fiji Proposed Legislation 2050
Finland* In Policy Document 2035
France* In Law 2050
Gambia (the) Target Under Discussion 2050
Germany* In Policy Document 2050
Greece Target Under Discussion 2050
Grenada Target Under Discussion 2050
Guinea Target Under Discussion 2050
Guinea-Bissau Target Under Discussion 2050
Guyana Target Under Discussion 2050
Haiti Target Under Discussion 2050
Hungary* In Law 2050
Iceland In Policy Document 2040
India Target Under Discussion 2070
Indonesia In Policy Document 2060
Ireland* In Policy Document 2050
Israel Target Under Discussion 2050
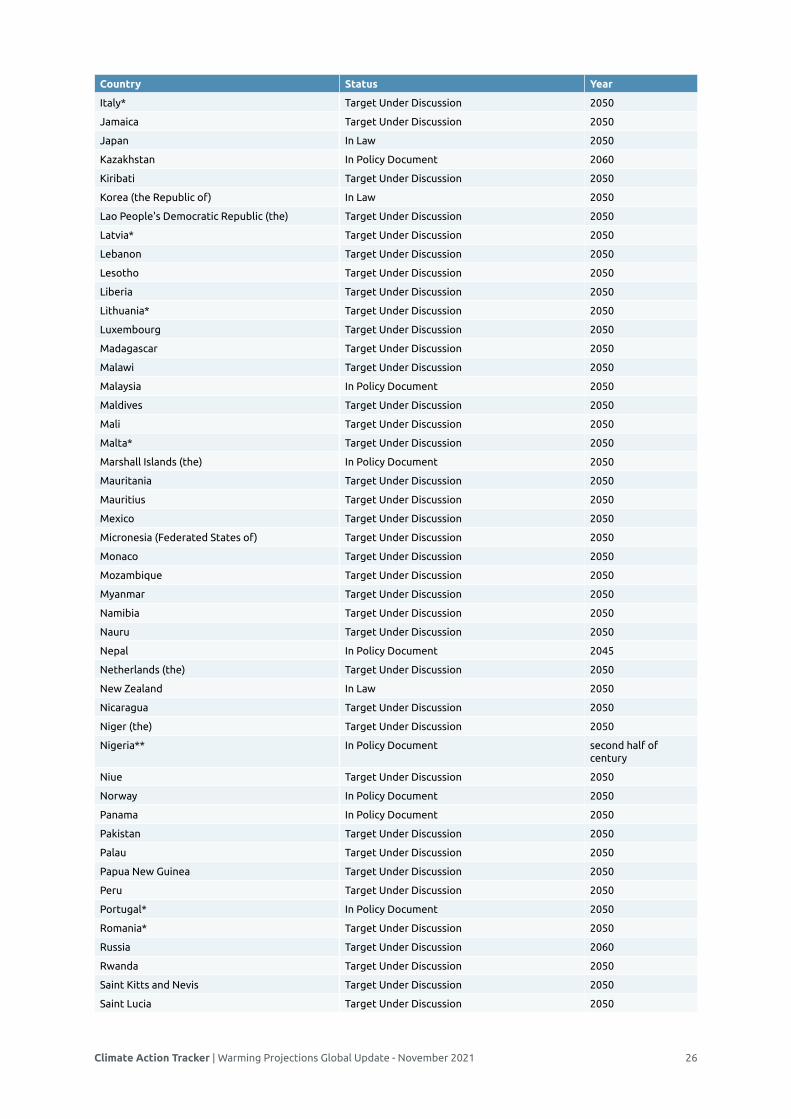
Climate Action Tracker | Warming Projections Global Update - November 2021 26
Country Status Year
Italy* Target Under Discussion 2050
Jamaica Target Under Discussion 2050
Japan In Law 2050
Kazakhstan In Policy Document 2060
Kiribati Target Under Discussion 2050
Korea (the Republic of) In Law 2050
Lao People's Democratic Republic (the) Target Under Discussion 2050
Latvia* Target Under Discussion 2050
Lebanon Target Under Discussion 2050
Lesotho Target Under Discussion 2050
Liberia Target Under Discussion 2050
Lithuania* Target Under Discussion 2050
Luxembourg Target Under Discussion 2050
Madagascar Target Under Discussion 2050
Malawi Target Under Discussion 2050
Malaysia In Policy Document 2050
Maldives Target Under Discussion 2050
Mali Target Under Discussion 2050
Malta* Target Under Discussion 2050
Marshall Islands (the) In Policy Document 2050
Mauritania Target Under Discussion 2050
Mauritius Target Under Discussion 2050
Mexico Target Under Discussion 2050
Micronesia (Federated States of) Target Under Discussion 2050
Monaco Target Under Discussion 2050
Mozambique Target Under Discussion 2050
Myanmar Target Under Discussion 2050
Namibia Target Under Discussion 2050
Nauru Target Under Discussion 2050
Nepal In Policy Document 2045
Netherlands (the) Target Under Discussion 2050
New Zealand In Law 2050
Nicaragua Target Under Discussion 2050
Niger (the) Target Under Discussion 2050
Nigeria** In Policy Document second half of century
Niue Target Under Discussion 2050
Norway In Policy Document 2050
Panama In Policy Document 2050
Pakistan Target Under Discussion 2050
Palau Target Under Discussion 2050
Papua New Guinea Target Under Discussion 2050
Peru Target Under Discussion 2050
Portugal* In Policy Document 2050
Romania* Target Under Discussion 2050
Russia Target Under Discussion 2060
Rwanda Target Under Discussion 2050
Saint Kitts and Nevis Target Under Discussion 2050
Saint Lucia Target Under Discussion 2050

Climate Action Tracker | Warming Projections Global Update - November 2021 27
Country Status Year
Saint Vincent and the Grenadines Target Under Discussion 2050
Samoa Target Under Discussion 2050
Sao Tome and Principe Target Under Discussion 2050
Saudi Arabia Target Under Discussion 2060
Senegal Target Under Discussion 2050
Seychelles Target Under Discussion 2050
Sierra Leone Target Under Discussion 2050
Singapore In Policy Document 2060
Slovakia* Target Under Discussion 2050
Slovenia* In Policy Document 2050
Solomon Islands Target Under Discussion 2050
Somalia Target Under Discussion 2050
South Africa In Policy Document 2050
South Sudan Target Under Discussion 2050
Spain* Proposed Legislation 2050
Sri Lanka In Policy Document 2050
Sudan (the) Target Under Discussion 2050
Suriname Achieved
Sweden* In Law 2045
Switzerland In Policy Document 2050
Tanzania, United Republic of Target Under Discussion 2050
Thailand In Policy Document 2070
Timor-Leste Target Under Discussion 2050
Togo Target Under Discussion 2050
Tonga Target Under Discussion 2050
Trinidad and Tobago Target Under Discussion 2050
Turkey Target Under Discussion 2053
Tuvalu Target Under Discussion 2050
Uganda Target Under Discussion 2050
Ukraine In Policy Document 2060
United Arab Emirates Target Under Discussion 2050
United Kingdom of Great Britain and Northern Ireland (the)
In Law 2050
United States of America (the) In Policy Document 2050
Uruguay Target Under Discussion 2030
Vanuatu Target Under Discussion 2050
Yemen Target Under Discussion 2050
Zambia Target Under Discussion 2050
* Note: All Member States of the EU27 are included in the modelling runs through EU27, not individually.
** Nigeria announced a 2060 net zero target during the World Leaders Summit. We will update our analysis for Nigeria to take this development into account in our next assessment.
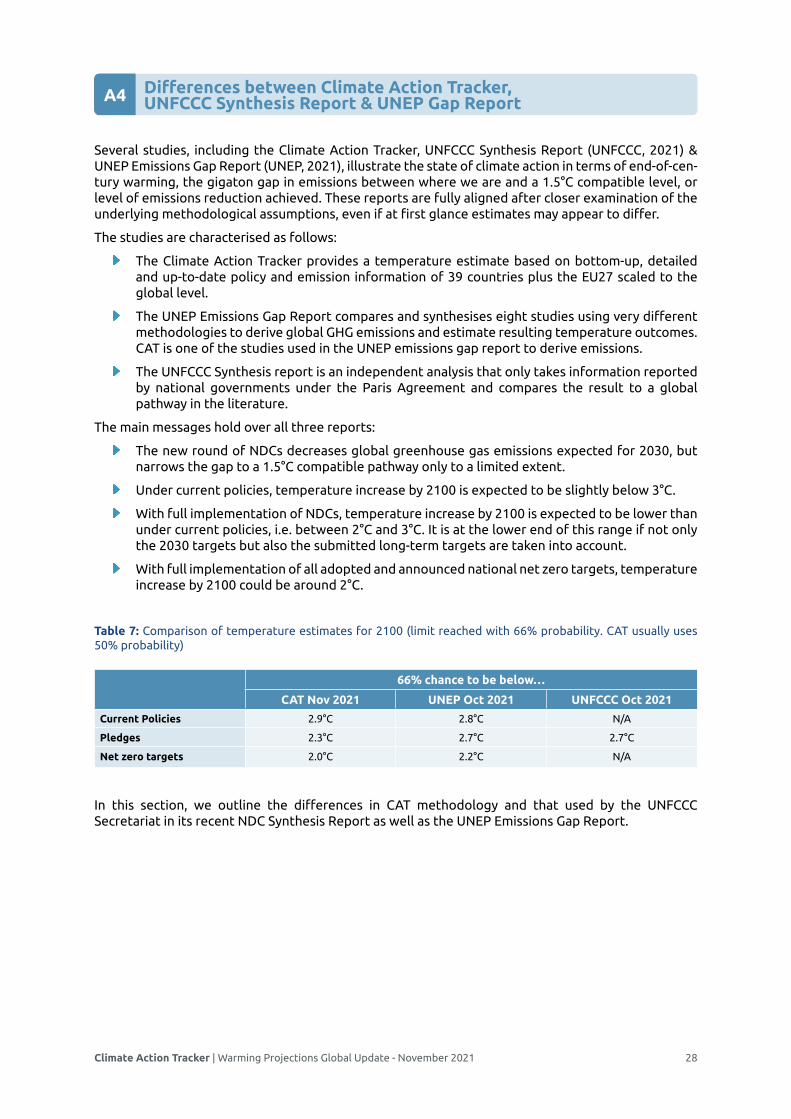
Climate Action Tracker | Warming Projections Global Update - November 2021 28
Differences between Climate Action Tracker, UNFCCC Synthesis Report & UNEP Gap Report A4
Several studies, including the Climate Action Tracker, UNFCCC Synthesis Report (UNFCCC, 2021) & UNEP Emissions Gap Report (UNEP, 2021), illustrate the state of climate action in terms of end-of-cen-tury warming, the gigaton gap in emissions between where we are and a 1.5°C compatible level, or level of emissions reduction achieved. These reports are fully aligned after closer examination of the underlying methodological assumptions, even if at first glance estimates may appear to differ.
The studies are characterised as follows:
The Climate Action Tracker provides a temperature estimate based on bottom-up, detailed and up-to-date policy and emission information of 39 countries plus the EU27 scaled to the global level.
The UNEP Emissions Gap Report compares and synthesises eight studies using very different methodologies to derive global GHG emissions and estimate resulting temperature outcomes. CAT is one of the studies used in the UNEP emissions gap report to derive emissions.
The UNFCCC Synthesis report is an independent analysis that only takes information reported by national governments under the Paris Agreement and compares the result to a global pathway in the literature.
The main messages hold over all three reports:
The new round of NDCs decreases global greenhouse gas emissions expected for 2030, but narrows the gap to a 1.5°C compatible pathway only to a limited extent.
Under current policies, temperature increase by 2100 is expected to be slightly below 3°C.
With full implementation of NDCs, temperature increase by 2100 is expected to be lower than under current policies, i.e. between 2°C and 3°C. It is at the lower end of this range if not only the 2030 targets but also the submitted long-term targets are taken into account.
With full implementation of all adopted and announced national net zero targets, temperature increase by 2100 could be around 2°C.
Table 7: Comparison of temperature estimates for 2100 (limit reached with 66% probability. CAT usually uses 50% probability)
66% chance to be below…
CAT Nov 2021 UNEP Oct 2021 UNFCCC Oct 2021
Current Policies 2.9°C 2.8°C N/A
Pledges 2.3°C 2.7°C 2.7°C
Net zero targets 2.0°C 2.2°C N/A
In this section, we outline the differences in CAT methodology and that used by the UNFCCC Secretariat in its recent NDC Synthesis Report as well as the UNEP Emissions Gap Report.

Climate Action Tracker | Warming Projections Global Update - November 2021 29
Estimation of emissions in 2030 based on NDCsOne major difference is how the studies estimate the impact of NDCs on resulting 2030 emissions and an emissions gap in GtCO2e. The Climate Action Tracker and UNEP Emissions Gap Report use more optimistic assumptions (including announcements and taking into account overachievement of NDCs) and therefore derive a slightly lower emissions gap in 2030 than the UNFCCC synthesis report.
Table 8: Methodological differences that affect the estimation of the 2030 emissions gap
Climate Action Tracker
UNEP Emissions Gap Report
UNFCCC synthesis report
Including official submissions or announcements
Also includes announcements that are not yet submitted to UNFCCC (e.g.Republic of Korea)
(Lower emissions)
Summarising studies, some of which some include announcements, others do not
(Lower emissions)
Only officially submitted information
(Higher emissions)
Overachievements of NDCs Takes the current policy scenario for countries that overachieve their NDCs with current policies
(Lowest emissions)
Takes the average current policy scenario from studies for countries that overachieve their NDCs with current policies
(Lower emissions)
Assesses only the NDCs
(Higher emissions)
Emissions in 2030 compatible with 1.5°C
26 GtCO2e 25 GtCO2e 29 GtCO2e
Gap between unconditional NDCs and a 1.5°C compatible pathway
19-23 GtCO2e
(November 2021 analysis)
22-28 GtCO2e
(October 2021 analysis)
27 GtCO2e
(October 2021 analysis)
The UNFCCC Synthesis Report released in October 2021 found that emissions under the current NDCs are set to be 16% higher than emissions levels in 2010. But this assumes that countries with very weak NDCs will grow their emissions to grow beyond what a business-as-usual trajectory based on current policies suggests. The Climate Action Tracker’s analysis removes this ‘hot air’ and uses likely 2030 emission levels based on current policies, and finds that by 2030 emissions are set to rise by 1% from 2010 levels. This is still far short of the halving of emissions seen in 1.5°C compatible pathways, but at least suggests that emissions are flatlining, not continuing to rise.
Current policy estimatesThe estimation of current policy projections for 2030 differs for the studies:
The CAT includes the latest developments, which are usually trends that lead to decreasing emissions, including the faster uptake of renewables and the dip due to the COVID-19 pandemic in its estimate for 2030 emissions under current policies and action.
UNEP compares and synthesises a set of studies. Not all studies used in the UNEP report include these latest developments. The CAT’s estimate is the lowest of all the studies considered by UNEP.
The UNFCCC synthesis report does not include a current policies projection.
This also has an effect on the estimate of pledges and targets, because several large countries are likely to overachieve their pledges (India, Russia), and in such cases the overachieving policies are assumed also in the “pledge” scenario in CAT results (see NDC estimates above).

Climate Action Tracker | Warming Projections Global Update - November 2021 30
Long term and net zero targets
Temperature increase by 2100 is significantly influenced by the emissions after 2030 and therefore by the inclusion of long term targets of countries. The methods of CAT and UNEP are compared in more detail in a paper in Nature Climate Change (Höhne et al., 2021).
Table 9: Long-term targets considered when estimating temperature increase
Climate Action Tracker
UNEP Emissions Gap Report
UNFCCC synthesis report
NDC scenario Includes 2050 targets submitted to the UNFCCC
(lower temperature)
Does not include any 2050 targets
(higher temperature)
Does not include any 2050 targets
(higher temperature)
Net zero scenario Includes announced and agreed net zero targets of over 140 countries, including CO2 and non-CO2.
Includes net zero targets of selected countries and CO2 effect only
(Does not include a Net Zero scenario)
Climate system uncertaintyAll studies have large uncertainty bands for the uncertainty of the climate system, and how it reacts to increased greenhouse gas concentrations. These bands are wider than the difference between the estimates of the individual studies.
The studies also differ in which value of the full band they report as the default:
The CAT uses the “best guess” (median) estimate, i.e. temperature level at which there is a 50% chance that it is above and a 50% that it is below that level.
UNEP uses a “likely below” estimate, i.e. there is a “likely” chance (66%) that the temperature is below this level.
UNFCCC synthesis report also uses a “likely below” estimate, i.e. there is a “likely” chance (66%) that the temperature is below this level.
Comparison of temperature estimatesAll three estimates can be translated in the same metric (see table below). Differences between estimates should be compared at the same probability level.
Table 10: Comparison of temperature estimates for 2100
50% chance to be below… 66% chance to be below…
CAT Nov 2021
UNEP UNFCCC CAT Nov 2021
UNEP Oct 2021
UNFCCC Oct 2021
Current Policies 2.7°C N/A N/A 2.9°C 2.8°C N/A
Pledges 2.1°C N/A N/A 2.3°C 2.7°C 2.7°C
Net zero targets 1.8°C N/A N/A 2.0°C 2.2°C N/A
ReferencesHöhne, N., Gidden, M. J., den Elzen, M., Hans, F., Fyson, C., Geiges, A., Jeffery, M. L., Gonzales-Zuñiga, S., Mooldijk,
S., Hare, W., & Rogelj, J. (2021). Wave of net zero emission targets opens window to meeting the Paris Agreement. Nature Climate Change, 11(10), 820–822. https://doi.org/10.1038/s41558-021-01142-2
UNEP. (2021). UNEP Emissions Gap Report 2021. https://www.unep.org/resources/emissions-gap-report-2021
UNFCCC. (2021). Nationally determined contributions under the Paris Agreement Revised synthesis report by the secretariat, FCCC/PA/CMA/2021/8/Rev.1. In English. https://unfccc.int/sites/default/files/resource/cma2021_08rev01_adv.pdf

Authors
The Consortium
Climate AnalyticsClaire StockwellAndreas GeigesDeborah Ramalope Matthew GiddenBill Hare
NewClimate Institute is a non-profit institute established in 2014. NewClimate Institute supports research and implementation of action against climate change around the globe, covering the topics international climate negotiations, tracking climate action, climate and development, climate finance and carbon market mechanisms. NewClimate Institute aims at connecting up-to-date research with the real world decision making processes.
Contact: Prof. Dr. Niklas Höhne, +49 173 715 2279
newclimate.org
NewClimate InstituteMaria José de Villafranca Casas Mia MoisioFrederic Hans Silke MooldijkNiklas HöhneHanna Fekete
Editing and DesignCindy BaxterCarly MerrettFoteini SpagopouloMatt Beer
Climate Analytics is a non-profit climate science and policy institute based in Berlin, Germany with offices in New York, USA, Lomé, Togo and Perth, Australia, which brings together interdisciplinary expertise in the scientific and policy aspects of climate change. Climate Analytics aims to synthesise and advance scientific knowledge in the area of climate, and by linking scientific and policy analysis provide state-of-the-art solutions to global and national climate change policy challenges.
Contact: Dr. h.c. Bill Hare, +61 468 372 179
climateanalytics.org
The Climate Action Tracker (CAT) is an independent scientific analysis produced by two research organisations tracking climate action since 2009. We track progress towards the globally agreed aim of holding warming well below 2°C, and pursuing efforts to limit warming to 1.5°C.
climateactiontracker.org
ClimateActionTracker