Market Insight
Friday, 11 November, 2016
16795/03/2013(031743) www.bisonline.com.my
www.bimbsec.com.my BIMB Securities| 1
Major Highlights Local & Global Economic News
Petronas Chemicals awards RM1.39bn job to Tecnimont,
China Huanqiu
Stronger Q3 financial performance by Westports
Sapura Industrial’s 3Q net profit rises 17.3%, declares 3 sen
dividend
UMW Oil & Gas secures contract from Ophir field developer
Barakah wins Sabah Shell’s contract worth RM25m
Scientex to invest US$25m for stretch film plant in US
Malaysia's Oct palm oil inventory growth slows
Malaysia-China RM144 bn deal involves three components
China pushes Asia-Pacific trade deals as Trump win dashes
TPP hopes
New Zealand's CB cuts rates, signals may be done easing
Asia seen continuing to be centre of growth
Indonesia to 'optimise' domestic growth as US may turn
protectionist — finmin
Philippine CB keeps policy rate steady, as expected
Bursa Malaysia
Bursa Malaysia Close Change +/- Change % FBMKLCI 1,652.74 5.12 0.31
FBMEMAS 11,632.82 56.56 0.49
FBM100 11,342.93 50.15 0.44
FBMEMAS Shariah 12,195.81 40.88 0.34
FBM Hijrah Shariah 13,600.00 18.68 0.14
Volume (mn) 1,639.94 -866.84 -34.58
Value (RMmn) 2,089.14 -304.53 -12.72
FBMKLCI YTD Chg -2.35 Scoreboard
Close Change +/- Change % Gainers 653 483 284.12
Losers 204 -598 -74.56
Unchanged 308 43 16.23 Regional Indices
Close Change
+/- Change %
YTD Change
(%) DJIA 18,807.88 218.19 1.17 7.94
NASDAQ 5,208.80 -42.28 -0.81 4.02
S&P 500 2,167.48 4.22 0.20 6.04
FTSE 100 6,827.98 -83.86 -1.21 9.38
Nikkei 225 17,344.42 1,092.88 6.72 -8.88
HSI 22,839.11 423.92 1.89 4.22
SHCOMP 3,171.28 42.91 1.37 -10.40
KOSPI 2,002.60 44.22 2.26 2.11
TWSE 9,152.18 208.98 2.34 9.76
STI 2,834.09 44.21 1.58 -1.69
JCI 5,450.31 35.99 0.66 18.67
SET 1,514.26 4.83 0.32 17.56
PSEi 7,181.87 62.83 0.88 3.31 Market Valuation (PER) FY16 FY17 5Y Average FBMKLCI 16.92 15.77 16.60
SHCOMP 14.89 13.15 11.08
HSI 12.62 11.53 11.05
JCI 17.93 15.07 15.23
SET 15.71 14.18 13.71
STI 13.69 13.07 13.91
PSEi 18.19 16.74 17.40 The Research Team
03-2613 1738
Sector Indices
Close Change +/- Change % Industrial 3,127.15 -9.59 -0.31 Consumer 596.19 -0.30 -0.05 Industrial Products 145.73 0.62 0.43 Construction 291.66 4.21 1.46 Finance 14,481.04 145.05 1.01 Property 1,169.54 10.07 0.87 Plantation 7,733.89 27.83 0.36 Technology 22.44 0.24 1.08 KLCI Futures
Contracts Nov-16 Dec-16 High 1,659.50 1,658.50 Low 1,643.00 1,644.50 Last 1,644.00 1,644.50 Volume 9,448.00 613.00 Commodities (Most Recent Close)
Close Change +/- (+/- %) % Brent Crude (USD/bbl) 46.36 -0.68 -1.47 WTI Crude (USD/bbl) 44.66 -0.61 -1.35 Gold (USD/ounce) 1,258.93 0.02 0.00 CPO (RM/MT) 2,894.00 49.00 1.72 SMR 20 (sen/kg) 672.00 19.50 2.99 Latex (sen/kg) 518.50 7.00 1.37 Soybean Oil 34.77 0.46 1.34 Forex
(per USD1) Close Change +/- Change % MYR 4.2802 0.0785 1.87 JPY 106.8300 1.1600 1.10 EUR 0.9180 0.0013 0.14 SGD 1.4116 0.0124 0.89
KLCI Performance
KLCI Year-End Target: 1,720 points
1500
1550
1600
1650
1700
1750
1800
1850
1900
Mar
-15
Ap
r-15
May
-15
Jun
-15
Jul-
15
Au
g-15
Sep
-15
Oct
-15
No
v-15
Dec
-15
Jan
-16
Feb
-16
Mar
-16
Ap
r-16
May
-16
Jun
-16
Jul-
16
Au
g-16
Sep
-16
Oct
-16

www.bimbsec.com.my | 2
Market Insight
Major Rates
KLIBOR 3-mth 3.40% KLIBOR 6-mth 3.52% KLIBOR 12-mth 3.62% 5-yr MGS 3.40% 10-yr MGS 3.78%
Active Stock
Close Change+/- (+/- %)
Vivocom 0.18 0.01 5.88
TA Global 0.26 0.01 2.00
RGB International 0.24 0.01 2.17
Borneo Oil 0.17 0.01 3.03 CIMB Group 4.97 0.17 3.54
Top Gainers
Close Change+/- (+/- %)
Dutch Lady 59.14 0.74 1.27
Aeon Credit 14.44 0.46 3.29
KESM Industries 9.15 0.35 3.98 Perusahaan Sadur Timah Malay
7.09 0.22 3.20
Scientex 6.80 0.20 3.03
Top Losers
Close Change+/- (+/- %)
BAT 46.42 -1.50 -3.13
KLK 23.46 -0.14 -0.59
Bintulu Port 6.36 -0.14 -2.15
Petronas Gas 21.84 -0.14 -0.64
United Plantations 27.10 -0.10 -0.37
Daily Participation
Participation
(%) Bought (RMm)
Sold (RMm)
Net (RMm)
Local Inst 61.1 1,372.8 1,181.8 191.0
Local Retail 14.8 272.2 346.5 -74.3
Foreign 24.1 444.2 560.9 -116.7
Total 100.0 2,089.2 2,089.2 0.0
www.bimbsec.com.my | 3
Market Insight
LOCAL CORPORATE NEWS Petronas Chemicals awards RM1.39bn job to Tecnimont, China Huanqiu PetChem has awarded a US$328m (RM1.391bn) contract to a Italy's Tecnimont SpA and China Huanqiu Contracting and Engineering Co. for a polyethylene production plant in Johor. Its unit PRPC Polymers SB had awarded an engineering, procurement, construction and commissioning contract for Package 27 to the consortium. The plant would be within the Refinery and petrochemical integrated development project (RAPID) in southern Johor and work would start on Nov 10 and completed by July 2019. (Source: StarBiz) Stronger Q3 financial performance by Westports Westports reported a stronger set of financial results for its 3QFY16 boosted by higher container throughput and revision in container tariff. The 3Q earnings rose 16.1% to RM151.03m from RM130.04m. Revenue increased by 18.3% to RM474.41m from RM400.77m. EPS were higher at 4.43 sen compared with 3.81 sen. Container throughput has increased by 9% from 2.29m to 2.49m 20-foot equivalent units (TEUs) for the period under review. For the 9MFY16, its earnings rose 29.4% to RM481.98m from RM372.32m in the previous corresponding period. (Source: StarBiz) Sapura Industrial’s 3Q net profit rises 17.3%, declares 3 sen dividend Sapura Industrial’s net profit rose 17.3% to RM1.59m for the 3QFY17, from RM1.36m a year earlier. Revenue grew marginally by 0.3%, from RM55.95m to RM56.13m. For the 9MFY17 however, Sapura Industrial’s net profit dipped 1.9% to RM2.58m, from 2.63m in 9MFY16. Revenue slid 7.5% to RM150.89m, from RM163.17m a year earlier. The drop in YTD revenue and profit, according to Sapura Industrial, was due to lower domestic volume for certain vehicle models. The group is involved in the automotive components manufacturing business. (Source: The Edge) UMW Oil & Gas secures contract from Ophir field developer UMW Oil & Gas indirect unit UMW Offshore Drilling SB has clinched a contract to provide a jack-up drilling rig and services for the Ophir oil field, offshore Terengganu. The contract was from Ophir Production SB, a joint venture owned by Australia-based Octanex Pte Ltd (50%), Scomi D&P SB (30%) and Petronas owned Vestigo Petroleum SB (20%). The UMW-OG group will assign its UMW Naga 2 for the contract, which involves drilling 3 firm wells for a minimum duration of 50 days starting in the 2Q of 2017. (Source: StarBiz) Barakah wins Sabah Shell’s contract worth RM25m Barakah has bagged a contract worth more than RM25m from Sabah Shell Petroleum Co Ltd to replace effluent discharge pipeline at the Labuan Crude Oil Terminal (LCOT). The 2-year contract, which took effect in October, was secured via its wholly-owned subsidiary, PBJV Group SB. The contract would contribute positively towards the group’s earnings and net assets per share during its duration. The LCOT, operated by Sabah Shell, receives, dehydrates, stores and exports crude from offshore Sabah’s fields which are run by Sabah Shell, Petronas Carigali and Repsol. (Source: Bernama) Scientex to invest US$25m for stretch film plant in US Packaging manufacturer and property developer Scientex Bhd will set up its first stretch film manufacturing plant overseas with an investment of US$25m or RM106.37m in Arizona, US. Its unit Scientex Phoenix, LLC will undertake the new venture there to produce quality stretch film to target the North, Central and South American markets. The plant would tap into these huge markets, and take advantage of the anticipated ample supply of shale gas-based resin for its raw materials. (Source: StarBiz) PUNB allocates RM40m to help bumi entrepreneurs in auto sector PUNB will give out up to 20%, or RM40m, from its 2017 loan allocation of RM200m, to help bumiputra entrepreneurs in the motor vehicle sector. A portion of the allocation could be for modernisation of selected workshops and towards improvement of services rendered by bumiputra mechanics. It’s hard now to get bumiputra mechanics in the niche market to repair modern, advanced and high-performance cars like Mercedes, BMW and Porshe. The assistance will enable capable bumiputra mechanics to equip their workshops with suitable equipment needed to allow repair of such models. About 300 bumiputra car entrepreneurs attended the forum. (Source: Bernama)
www.bimbsec.com.my | 4
Market Insight
LOCAL AND GLOBAL ECONOMIC NEWS Malaysia's Oct palm oil inventory growth slows Malaysia's October palm oil inventory rose 1.79% to 1.57m tonnes from the preceding month, as output fell at a faster pace than exports. The CPO production fell 2.17% to 1.68m tonnes, while total palm oil exports dropped 1.39% to 1.43m tonnes. Palm oil inventory includes CPO and processed palm oil. October inventory's 1.79% growth slowed from a rise in September. In September, palm oil inventory rose 5.62% to 1.55m tonnes, from a month earlier. (Source: The Edge) Malaysia-China RM144bn deal involves three components The deals entered between companies from both, Malaysia and China back then can be categoried in 3 components, namely investment, soft loan and collaboration. One of the agreements they entered into is the collaboration between Matrade and Alibaba Group — this is important, because as of now, there are already 10,000 Malaysia SME listed on Alibaba's platform, which enables them to penetrate overseas market. Secondly is investment, which involve Hebei Xinwuan Steel Group investing US$2bn into a steel plant in Sarawak. Thirdly is the soft loan that includes East Coast Rail Line, which was about RM50bn (Source: The Edge) China pushes Asia-Pacific trade deals as Trump win dashes TPP hopes China will seek support for a Beijing-led Asia-Pacific FTA at a regional summit in Peru, after Donald Trump's U.S. election win dashed hopes for a U.S.-led free trade pact. During his election campaign Trump took a protectionist stance on trade issues and labelled the TPP championed by President Barack Obama a "disaster". There is now little chance of it coming up for vote in Washington before his inauguration in January. Obama had framed TPP, which excluded China, as an effort to write Asia's trade rules before Beijing could, establishing U.S. economic leadership in the region as part of his "pivot to Asia". (Source: Reuters) New Zealand's CB cuts rates, signals may be done easing International factors, including U.S. political uncertainty, were the major risks to the NZ's economy after it lowered interest rates to a record low of 1.75%. The Reserve Bank of New Zealand (RBNZ) indicated that future rate cuts were unlikely after its 3
rd cut this year, as it forecast inflation heading back into its target range, but did not rule them out entirely. There's lots
of issues around debt accumulation in China, particularly around corporate debt. The bank's policymakers met again to review the planned 25 basis point cut, following the election of Donald Trump as the next US President, and affirmed the cut was the right decision. The RBNZ was lobbying the government to add further macroprudential measures to its arsenal in the form of debt-to-income ratio limits (DTI), as it struggles to get to grips with stubbornly low inflation without stoking an already hot housing market. (Source: Reuters) Asia seen continuing to be centre of growth Despite the outcome of Donald Trump’s presidency, Asia is expected to be the centre of growth, ultimately driven by domestic demand. Domestic demand in the region is improving and strengthening, as there are more regional integration and strengthening of ties between China and South-East Asia. With initiatives like ‘One Belt, One Road’, domestic demand will continue to play a greater role in this part of the region. The biggest uncertainty lies in Asia, in view that Trump pledged to renegotiate trade deals scrap the TPPA and clamp down on immigration. Countries like China, Japan and Korea have larger trade surpluses with US, which stand to be Trump’s targets for potential tariffs. (Source: StarBiz) Indonesia to 'optimise' domestic growth as US may turn protectionist — finmin Indonesia will seek to "optimise" its domestic sources of economic growth due to the risk of the US becoming more protectionist under the presidency of Donald Trump. Under Trump, the US may review its commitment to the TPP, a trade agreement among 12 Pacific Rim countries, as well as its trade relations with other countries such as China. If the US becomes protectionist, the risk of a global weakening will become more real. The US is the biggest market for Indonesia's non-oil and gas products, taking US$11.6bn worth of exports from the Southeast Asian country in the 1
st 9 months of this
year. (Source: Reuters) Philippine CB keeps policy rate steady, as expected The Philippine CB kept its benchmark interest rate steady at 3.0% as expected. The CB kept the overnight borrowing rate steady at 3.0%, the level set by the monetary authority after it moved to an interest rate corridor on June 3. It also kept the floor and ceiling rates in the corridor at 2.5% and 3.5%, respectively. All 17 economists had predicted the CB, which holds a rate-setting meeting every 6 weeks, would stand pat on rates. (Source: Reuters)
www.bimbsec.com.my | 5
Market Insight
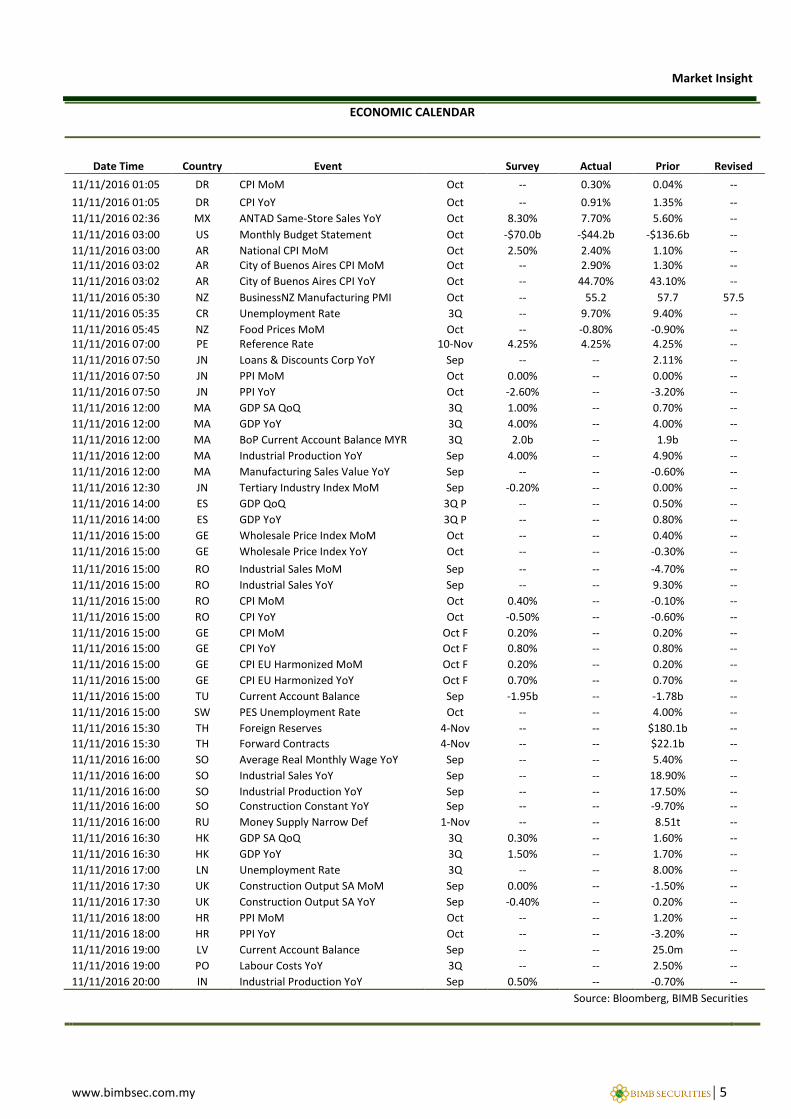
ECONOMIC CALENDAR
Date Time Country Event Survey Actual Prior Revised
11/11/2016 01:05 DR CPI MoM Oct -- 0.30% 0.04% --
11/11/2016 01:05 DR CPI YoY Oct -- 0.91% 1.35% --
11/11/2016 02:36 MX ANTAD Same-Store Sales YoY Oct 8.30% 7.70% 5.60% --
11/11/2016 03:00 US Monthly Budget Statement Oct -$70.0b -$44.2b -$136.6b --
11/11/2016 03:00 AR National CPI MoM Oct 2.50% 2.40% 1.10% -- 11/11/2016 03:02 AR City of Buenos Aires CPI MoM Oct -- 2.90% 1.30% --
11/11/2016 03:02 AR City of Buenos Aires CPI YoY Oct -- 44.70% 43.10% --
11/11/2016 05:30 NZ BusinessNZ Manufacturing PMI Oct -- 55.2 57.7 57.5
11/11/2016 05:35 CR Unemployment Rate 3Q -- 9.70% 9.40% --
11/11/2016 05:45 NZ Food Prices MoM Oct -- -0.80% -0.90% -- 11/11/2016 07:00 PE Reference Rate 10-Nov 4.25% 4.25% 4.25% --
11/11/2016 07:50 JN Loans & Discounts Corp YoY Sep -- -- 2.11% --
11/11/2016 07:50 JN PPI MoM Oct 0.00% -- 0.00% --
11/11/2016 07:50 JN PPI YoY Oct -2.60% -- -3.20% --
11/11/2016 12:00 MA GDP SA QoQ 3Q 1.00% -- 0.70% --
11/11/2016 12:00 MA GDP YoY 3Q 4.00% -- 4.00% --
11/11/2016 12:00 MA BoP Current Account Balance MYR 3Q 2.0b -- 1.9b --
11/11/2016 12:00 MA Industrial Production YoY Sep 4.00% -- 4.90% --
11/11/2016 12:00 MA Manufacturing Sales Value YoY Sep -- -- -0.60% --
11/11/2016 12:30 JN Tertiary Industry Index MoM Sep -0.20% -- 0.00% --
11/11/2016 14:00 ES GDP QoQ 3Q P -- -- 0.50% --
11/11/2016 14:00 ES GDP YoY 3Q P -- -- 0.80% --
11/11/2016 15:00 GE Wholesale Price Index MoM Oct -- -- 0.40% --
11/11/2016 15:00 GE Wholesale Price Index YoY Oct -- -- -0.30% --
11/11/2016 15:00 RO Industrial Sales MoM Sep -- -- -4.70% --
11/11/2016 15:00 RO Industrial Sales YoY Sep -- -- 9.30% --
11/11/2016 15:00 RO CPI MoM Oct 0.40% -- -0.10% --
11/11/2016 15:00 RO CPI YoY Oct -0.50% -- -0.60% --
11/11/2016 15:00 GE CPI MoM Oct F 0.20% -- 0.20% --
11/11/2016 15:00 GE CPI YoY Oct F 0.80% -- 0.80% --
11/11/2016 15:00 GE CPI EU Harmonized MoM Oct F 0.20% -- 0.20% --
11/11/2016 15:00 GE CPI EU Harmonized YoY Oct F 0.70% -- 0.70% --
11/11/2016 15:00 TU Current Account Balance Sep -1.95b -- -1.78b --
11/11/2016 15:00 SW PES Unemployment Rate Oct -- -- 4.00% --
11/11/2016 15:30 TH Foreign Reserves 4-Nov -- -- $180.1b --
11/11/2016 15:30 TH Forward Contracts 4-Nov -- -- $22.1b --
11/11/2016 16:00 SO Average Real Monthly Wage YoY Sep -- -- 5.40% --
11/11/2016 16:00 SO Industrial Sales YoY Sep -- -- 18.90% --
11/11/2016 16:00 SO Industrial Production YoY Sep -- -- 17.50% -- 11/11/2016 16:00 SO Construction Constant YoY Sep -- -- -9.70% --
11/11/2016 16:00 RU Money Supply Narrow Def 1-Nov -- -- 8.51t --
11/11/2016 16:30 HK GDP SA QoQ 3Q 0.30% -- 1.60% --
11/11/2016 16:30 HK GDP YoY 3Q 1.50% -- 1.70% --
11/11/2016 17:00 LN Unemployment Rate 3Q -- -- 8.00% --
11/11/2016 17:30 UK Construction Output SA MoM Sep 0.00% -- -1.50% --
11/11/2016 17:30 UK Construction Output SA YoY Sep -0.40% -- 0.20% --
11/11/2016 18:00 HR PPI MoM Oct -- -- 1.20% --
11/11/2016 18:00 HR PPI YoY Oct -- -- -3.20% --
11/11/2016 19:00 LV Current Account Balance Sep -- -- 25.0m --
11/11/2016 19:00 PO Labour Costs YoY 3Q -- -- 2.50% --
11/11/2016 20:00 IN Industrial Production YoY Sep 0.50% -- -0.70% --
Source: Bloomberg, BIMB Securities
www.bimbsec.com.my | 6
Market Insight
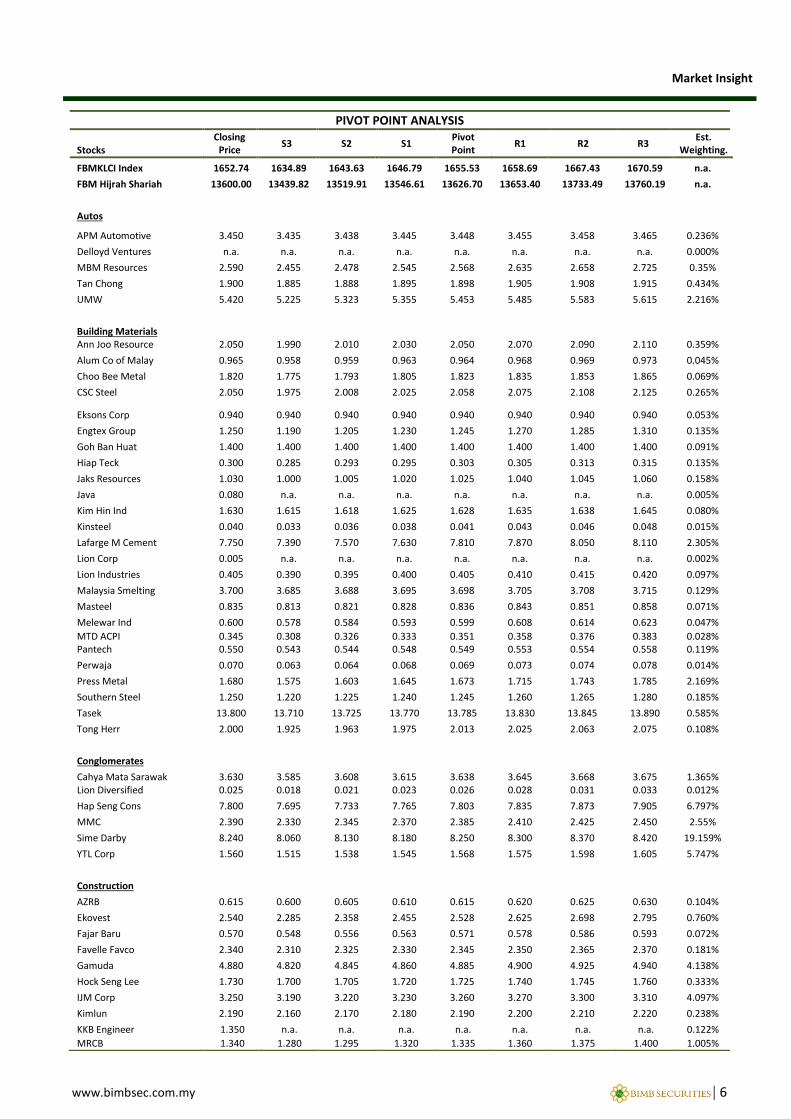
PIVOT POINT ANALYSIS
Stocks Closing
Price S3 S2 S1
Pivot Point
R1 R2 R3 Est.
Weighting.
FBMKLCI Index 1652.74 1634.89 1643.63 1646.79 1655.53 1658.69 1667.43 1670.59 n.a.
FBM Hijrah Shariah 13600.00 13439.82 13519.91 13546.61 13626.70 13653.40 13733.49 13760.19 n.a.
Autos
APM Automotive 3.450 3.435 3.438 3.445 3.448 3.455 3.458 3.465 0.236%
Delloyd Ventures n.a. n.a. n.a. n.a. n.a. n.a. n.a. n.a. 0.000%
MBM Resources 2.590 2.455 2.478 2.545 2.568 2.635 2.658 2.725 0.35%
Tan Chong 1.900 1.885 1.888 1.895 1.898 1.905 1.908 1.915 0.434%
UMW 5.420 5.225 5.323 5.355 5.453 5.485 5.583 5.615 2.216%
Building Materials Ann Joo Resource 2.050 1.990 2.010 2.030 2.050 2.070 2.090 2.110 0.359%
Alum Co of Malay 0.965 0.958 0.959 0.963 0.964 0.968 0.969 0.973 0.045%
Choo Bee Metal 1.820 1.775 1.793 1.805 1.823 1.835 1.853 1.865 0.069%
CSC Steel 2.050 1.975 2.008 2.025 2.058 2.075 2.108 2.125 0.265%
Eksons Corp 0.940 0.940 0.940 0.940 0.940 0.940 0.940 0.940 0.053%
Engtex Group 1.250 1.190 1.205 1.230 1.245 1.270 1.285 1.310 0.135%
Goh Ban Huat 1.400 1.400 1.400 1.400 1.400 1.400 1.400 1.400 0.091%
Hiap Teck 0.300 0.285 0.293 0.295 0.303 0.305 0.313 0.315 0.135%
Jaks Resources 1.030 1.000 1.005 1.020 1.025 1.040 1.045 1.060 0.158%
Java 0.080 n.a. n.a. n.a. n.a. n.a. n.a. n.a. 0.005%
Kim Hin Ind 1.630 1.615 1.618 1.625 1.628 1.635 1.638 1.645 0.080%
Kinsteel 0.040 0.033 0.036 0.038 0.041 0.043 0.046 0.048 0.015%
Lafarge M Cement 7.750 7.390 7.570 7.630 7.810 7.870 8.050 8.110 2.305%
Lion Corp 0.005 n.a. n.a. n.a. n.a. n.a. n.a. n.a. 0.002%
Lion Industries 0.405 0.390 0.395 0.400 0.405 0.410 0.415 0.420 0.097%
Malaysia Smelting 3.700 3.685 3.688 3.695 3.698 3.705 3.708 3.715 0.129%
Masteel 0.835 0.813 0.821 0.828 0.836 0.843 0.851 0.858 0.071%
Melewar Ind 0.600 0.578 0.584 0.593 0.599 0.608 0.614 0.623 0.047%
MTD ACPI 0.345 0.308 0.326 0.333 0.351 0.358 0.376 0.383 0.028% Pantech 0.550 0.543 0.544 0.548 0.549 0.553 0.554 0.558 0.119%
Perwaja 0.070 0.063 0.064 0.068 0.069 0.073 0.074 0.078 0.014%
Press Metal 1.680 1.575 1.603 1.645 1.673 1.715 1.743 1.785 2.169%
Southern Steel 1.250 1.220 1.225 1.240 1.245 1.260 1.265 1.280 0.185%
Tasek 13.800 13.710 13.725 13.770 13.785 13.830 13.845 13.890 0.585%
Tong Herr 2.000 1.925 1.963 1.975 2.013 2.025 2.063 2.075 0.108%
Conglomerates
Cahya Mata Sarawak 3.630 3.585 3.608 3.615 3.638 3.645 3.668 3.675 1.365% Lion Diversified 0.025 0.018 0.021 0.023 0.026 0.028 0.031 0.033 0.012%
Hap Seng Cons 7.800 7.695 7.733 7.765 7.803 7.835 7.873 7.905 6.797%
MMC 2.390 2.330 2.345 2.370 2.385 2.410 2.425 2.450 2.55%
Sime Darby 8.240 8.060 8.130 8.180 8.250 8.300 8.370 8.420 19.159%
YTL Corp 1.560 1.515 1.538 1.545 1.568 1.575 1.598 1.605 5.747%
Construction
AZRB 0.615 0.600 0.605 0.610 0.615 0.620 0.625 0.630 0.104%
Ekovest 2.540 2.285 2.358 2.455 2.528 2.625 2.698 2.795 0.760%
Fajar Baru 0.570 0.548 0.556 0.563 0.571 0.578 0.586 0.593 0.072%
Favelle Favco 2.340 2.310 2.325 2.330 2.345 2.350 2.365 2.370 0.181%
Gamuda 4.880 4.820 4.845 4.860 4.885 4.900 4.925 4.940 4.138%
Hock Seng Lee 1.730 1.700 1.705 1.720 1.725 1.740 1.745 1.760 0.333%
IJM Corp 3.250 3.190 3.220 3.230 3.260 3.270 3.300 3.310 4.097%
Kimlun 2.190 2.160 2.170 2.180 2.190 2.200 2.210 2.220 0.238%
KKB Engineer 1.350 n.a. n.a. n.a. n.a. n.a. n.a. n.a. 0.122%
MRCB 1.340 1.280 1.295 1.320 1.335 1.360 1.375 1.400 1.005%

www.bimbsec.com.my | 7
Market Insight
Stocks Closing Price
S3 S2 S1 Pivot Point
R1 R2 R3 Est.
Weighting
Mudajaya 0.925 0.903 0.914 0.918 0.929 0.933 0.944 0.948 0.17%
Muhibbah 2.220 2.160 2.190 2.200 2.230 2.240 2.270 2.280 0.37%
Naim Hold 1.380 1.305 1.338 1.355 1.388 1.405 1.438 1.455 0.11%
Sunway Hldgs 3.050 2.975 3.003 3.025 3.053 3.075 3.103 3.125 2.171%
TRC Synergy 0.440 0.425 0.428 0.435 0.438 0.445 0.448 0.455 0.074% TSR Capital 0.465 0.458 0.461 0.463 0.466 0.468 0.471 0.473 0.028%
Zelan 0.155 0.148 0.151 0.153 0.156 0.158 0.161 0.163 0.046%
Consumer/Retail
Aeon Co (M) 2.850 2.820 2.825 2.840 2.845 2.860 2.865 2.880 1.400%
Ajinomoto 13.540 13.090 13.245 13.390 13.545 13.690 13.845 13.990 0.288%
Apollo Food 6.020 5.990 5.995 6.010 6.015 6.030 6.035 6.050 0.169%
Bonia 0.590 0.568 0.579 0.583 0.594 0.598 0.609 0.613 0.166%
CI 2.580 2.580 2.580 2.580 2.580 2.580 2.580 2.580 0.146%
Cocoaland 2.040 1.935 1.953 2.005 2.023 2.075 2.093 2.145 0.163%
Dutch Lady 59.140 58.750 58.945 59.010 59.205 59.270 59.465 59.530 1.325%
Guan Chong 1.160 1.115 1.123 1.145 1.153 1.175 1.183 1.205 0.194%
Hai-O Ent 3.710 3.620 3.650 3.680 3.710 3.740 3.770 3.800 0.251%
Hovid 0.370 0.363 0.364 0.368 0.369 0.373 0.374 0.378 0.106%
Hup seng Inds 1.220 1.175 1.193 1.205 1.223 1.235 1.253 1.265 0.342%
K-Star Sports 0.075 0.060 0.068 0.070 0.078 0.080 0.088 0.090 0.007%
Multi Sports n.a. n.a. n.a. n.a. n.a. n.a. n.a. n.a. 0.000%
Padini 2.850 2.790 2.810 2.830 2.850 2.870 2.890 2.910 0.656%
Parkson 0.740 0.725 0.733 0.735 0.743 0.745 0.753 0.755 0.279%
Pelikan International 0.910 0.895 0.898 0.905 0.908 0.915 0.918 0.925 0.175%
Poh Kong 0.480 0.450 0.455 0.470 0.475 0.490 0.495 0.510 0.069%
QL Resources 4.450 4.375 4.413 4.425 4.463 4.475 4.513 4.525 1.944%
Silver Bird n.a. n.a. n.a. n.a. n.a. n.a. n.a. n.a. 0.000%
Three-A Resource 1.240 1.225 1.233 1.235 1.243 1.245 1.253 1.255 0.171%
Xingquan Int’l 0.095 0.088 0.091 0.093 0.096 0.098 0.101 0.103 0.020%
Yee Lee Corp 2.280 2.235 2.253 2.265 2.283 2.295 2.313 2.325 0.150%
Zhulian 1.320 1.290 1.305 1.310 1.325 1.330 1.345 1.350 0.213%
Education
HELP Int’l n.a. n.a. n.a. n.a. n.a. n.a. n.a. n.a. 0.000%
Masterskill n.a. n.a. n.a. n.a. n.a. n.a. n.a. n.a. 0.000%
SEG Int’l 1.110 1.080 1.090 1.100 1.110 1.120 1.130 1.140 0.280%
Finance
BIMB Hold. 4.280 4.235 4.253 4.265 4.283 4.295 4.313 4.325 2.380%
Syarikat Takaful 4.240 4.180 4.190 4.220 4.230 4.260 4.270 4.300 1.218%
Healthcare
Apex Healthcare 4.600 4.450 4.475 4.550 4.575 4.650 4.675 4.750 0.189%
CCM Duopharma 2.120 n.a. n.a. n.a. n.a. n.a. n.a. n.a. 0.207%
KPJ Healthcare 4.200 4.185 4.188 4.195 4.198 4.205 4.208 4.215 1.540%
Faber Group n.a. n.a. n.a. n.a. n.a. n.a. n.a. n.a. 0.000%
Manufacturing
CBIP 1.980 1.950 1.960 1.970 1.980 1.990 2.000 2.010 0.363%
Chin Well 1.680 1.650 1.655 1.670 1.675 1.690 1.695 1.710 0.176%
Daibochi Plastic 2.280 1.995 2.108 2.185 2.298 2.375 2.488 2.565 0.217%
Evergreen Fibre 1.020 0.975 0.988 1.005 1.018 1.035 1.048 1.065 0.302%
George Kent 2.790 2.610 2.640 2.730 2.760 2.850 2.880 2.970 0.367%
Guh 0.830 0.800 0.815 0.820 0.835 0.840 0.855 0.860 0.077%
Hil Industries 0.810 0.795 0.803 0.805 0.813 0.815 0.823 0.825 0.078%
Hong Leong Ind 9.790 9.625 9.658 9.735 9.768 9.845 9.878 9.955 1.095%
www.bimbsec.com.my | 8
Market Insight
Stocks Closing Price
S3 S2 S1 Pivot Point
R1 R2 R3 Est.
Weighting
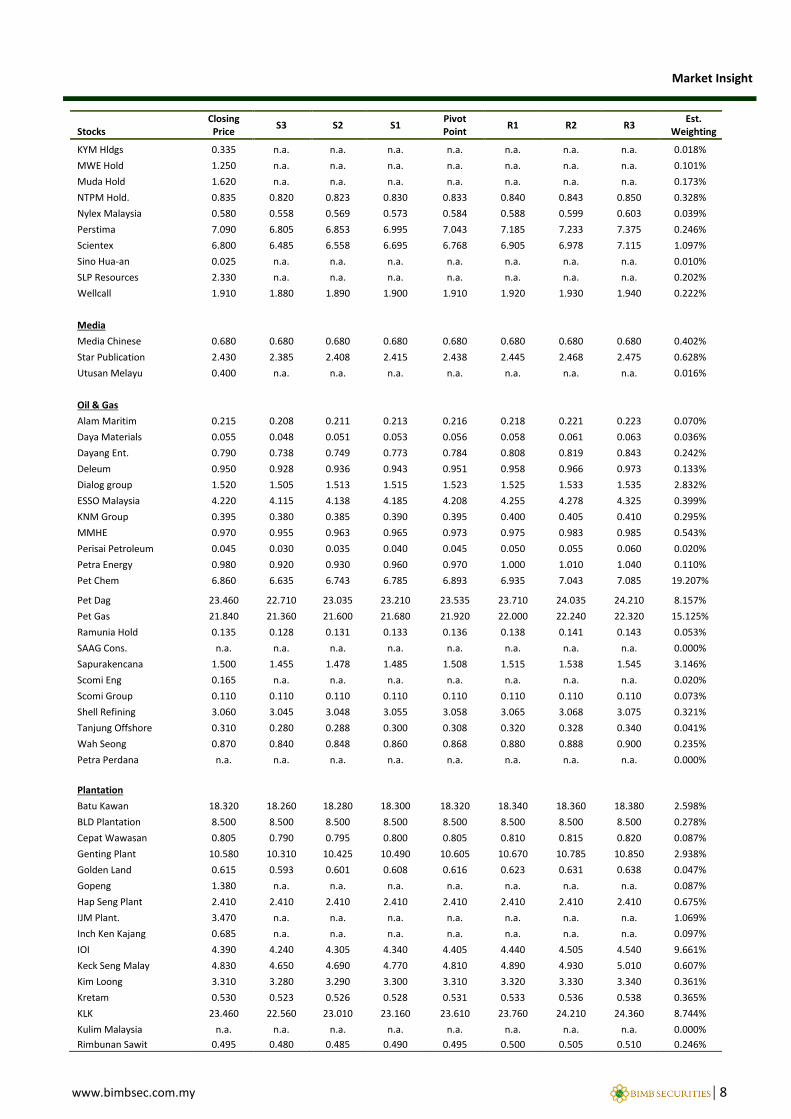
KYM Hldgs 0.335 n.a. n.a. n.a. n.a. n.a. n.a. n.a. 0.018%
MWE Hold 1.250 n.a. n.a. n.a. n.a. n.a. n.a. n.a. 0.101%
Muda Hold 1.620 n.a. n.a. n.a. n.a. n.a. n.a. n.a. 0.173%
NTPM Hold. 0.835 0.820 0.823 0.830 0.833 0.840 0.843 0.850 0.328%
Nylex Malaysia 0.580 0.558 0.569 0.573 0.584 0.588 0.599 0.603 0.039%
Perstima 7.090 6.805 6.853 6.995 7.043 7.185 7.233 7.375 0.246%
Scientex 6.800 6.485 6.558 6.695 6.768 6.905 6.978 7.115 1.097%
Sino Hua-an 0.025 n.a. n.a. n.a. n.a. n.a. n.a. n.a. 0.010%
SLP Resources 2.330 n.a. n.a. n.a. n.a. n.a. n.a. n.a. 0.202%
Wellcall 1.910 1.880 1.890 1.900 1.910 1.920 1.930 1.940 0.222%
Media
Media Chinese 0.680 0.680 0.680 0.680 0.680 0.680 0.680 0.680 0.402%
Star Publication 2.430 2.385 2.408 2.415 2.438 2.445 2.468 2.475 0.628%
Utusan Melayu 0.400 n.a. n.a. n.a. n.a. n.a. n.a. n.a. 0.016%
Oil & Gas
Alam Maritim 0.215 0.208 0.211 0.213 0.216 0.218 0.221 0.223 0.070%
Daya Materials 0.055 0.048 0.051 0.053 0.056 0.058 0.061 0.063 0.036%
Dayang Ent. 0.790 0.738 0.749 0.773 0.784 0.808 0.819 0.843 0.242%
Deleum 0.950 0.928 0.936 0.943 0.951 0.958 0.966 0.973 0.133%
Dialog group 1.520 1.505 1.513 1.515 1.523 1.525 1.533 1.535 2.832%
ESSO Malaysia 4.220 4.115 4.138 4.185 4.208 4.255 4.278 4.325 0.399%
KNM Group 0.395 0.380 0.385 0.390 0.395 0.400 0.405 0.410 0.295%
MMHE 0.970 0.955 0.963 0.965 0.973 0.975 0.983 0.985 0.543%
Perisai Petroleum 0.045 0.030 0.035 0.040 0.045 0.050 0.055 0.060 0.020%
Petra Energy 0.980 0.920 0.930 0.960 0.970 1.000 1.010 1.040 0.110%
Pet Chem 6.860 6.635 6.743 6.785 6.893 6.935 7.043 7.085 19.207%
Pet Dag 23.460 22.710 23.035 23.210 23.535 23.710 24.035 24.210 8.157%
Pet Gas 21.840 21.360 21.600 21.680 21.920 22.000 22.240 22.320 15.125%
Ramunia Hold 0.135 0.128 0.131 0.133 0.136 0.138 0.141 0.143 0.053%
SAAG Cons. n.a. n.a. n.a. n.a. n.a. n.a. n.a. n.a. 0.000%
Sapurakencana 1.500 1.455 1.478 1.485 1.508 1.515 1.538 1.545 3.146%
Scomi Eng 0.165 n.a. n.a. n.a. n.a. n.a. n.a. n.a. 0.020%
Scomi Group 0.110 0.110 0.110 0.110 0.110 0.110 0.110 0.110 0.073%
Shell Refining 3.060 3.045 3.048 3.055 3.058 3.065 3.068 3.075 0.321%
Tanjung Offshore 0.310 0.280 0.288 0.300 0.308 0.320 0.328 0.340 0.041%
Wah Seong 0.870 0.840 0.848 0.860 0.868 0.880 0.888 0.900 0.235%
Petra Perdana n.a. n.a. n.a. n.a. n.a. n.a. n.a. n.a. 0.000%
Plantation
Batu Kawan 18.320 18.260 18.280 18.300 18.320 18.340 18.360 18.380 2.598%
BLD Plantation 8.500 8.500 8.500 8.500 8.500 8.500 8.500 8.500 0.278%
Cepat Wawasan 0.805 0.790 0.795 0.800 0.805 0.810 0.815 0.820 0.087%
Genting Plant 10.580 10.310 10.425 10.490 10.605 10.670 10.785 10.850 2.938%
Golden Land 0.615 0.593 0.601 0.608 0.616 0.623 0.631 0.638 0.047%
Gopeng 1.380 n.a. n.a. n.a. n.a. n.a. n.a. n.a. 0.087%
Hap Seng Plant 2.410 2.410 2.410 2.410 2.410 2.410 2.410 2.410 0.675%
IJM Plant. 3.470 n.a. n.a. n.a. n.a. n.a. n.a. n.a. 1.069%
Inch Ken Kajang 0.685 n.a. n.a. n.a. n.a. n.a. n.a. n.a. 0.097%
IOI 4.390 4.240 4.305 4.340 4.405 4.440 4.505 4.540 9.661%
Keck Seng Malay 4.830 4.650 4.690 4.770 4.810 4.890 4.930 5.010 0.607%
Kim Loong 3.310 3.280 3.290 3.300 3.310 3.320 3.330 3.340 0.361%
Kretam 0.530 0.523 0.526 0.528 0.531 0.533 0.536 0.538 0.365%
KLK 23.460 22.560 23.010 23.160 23.610 23.760 24.210 24.360 8.744%
Kulim Malaysia n.a. n.a. n.a. n.a. n.a. n.a. n.a. n.a. 0.000%
Rimbunan Sawit 0.495 0.480 0.485 0.490 0.495 0.500 0.505 0.510 0.246%
www.bimbsec.com.my | 9
Market Insight
Stocks Closing Price
S3 S2 S1 Pivot Point
R1 R2 R3 Est.
Weighting
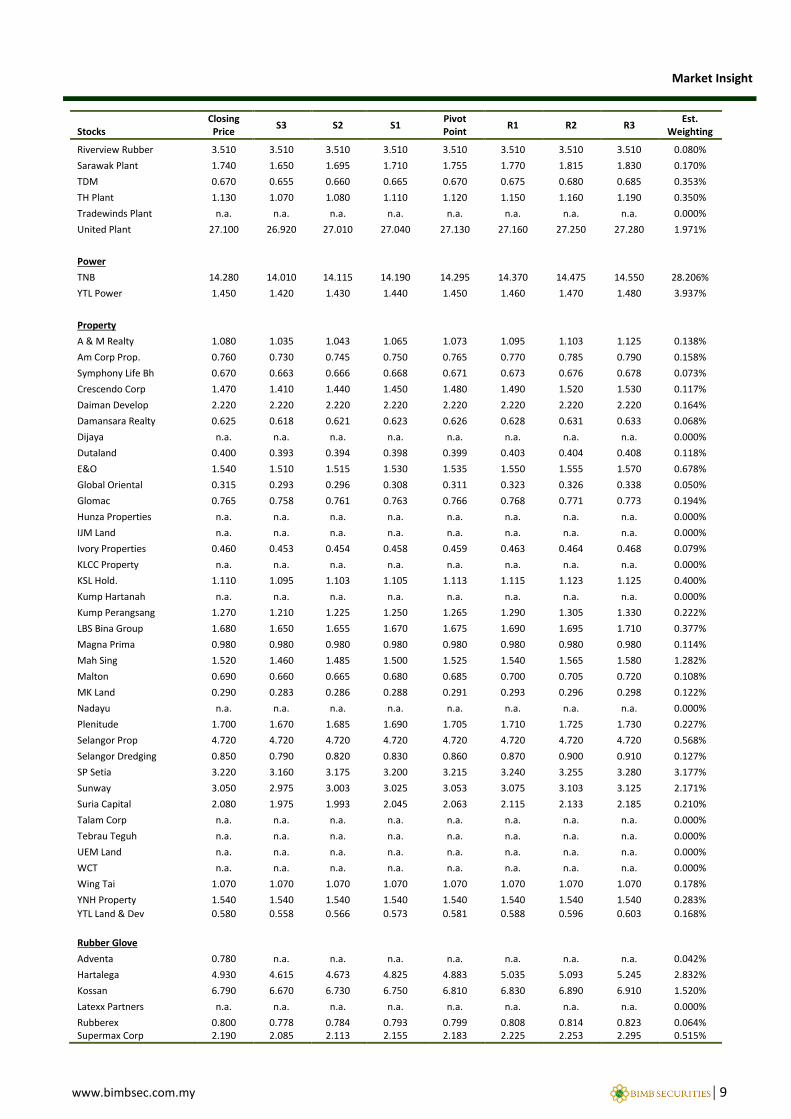
Riverview Rubber 3.510 3.510 3.510 3.510 3.510 3.510 3.510 3.510 0.080%
Sarawak Plant 1.740 1.650 1.695 1.710 1.755 1.770 1.815 1.830 0.170%
TDM 0.670 0.655 0.660 0.665 0.670 0.675 0.680 0.685 0.353%
TH Plant 1.130 1.070 1.080 1.110 1.120 1.150 1.160 1.190 0.350%
Tradewinds Plant n.a. n.a. n.a. n.a. n.a. n.a. n.a. n.a. 0.000%
United Plant 27.100 26.920 27.010 27.040 27.130 27.160 27.250 27.280 1.971%
Power
TNB 14.280 14.010 14.115 14.190 14.295 14.370 14.475 14.550 28.206%
YTL Power 1.450 1.420 1.430 1.440 1.450 1.460 1.470 1.480 3.937%
Property
A & M Realty 1.080 1.035 1.043 1.065 1.073 1.095 1.103 1.125 0.138%
Am Corp Prop. 0.760 0.730 0.745 0.750 0.765 0.770 0.785 0.790 0.158%
Symphony Life Bh 0.670 0.663 0.666 0.668 0.671 0.673 0.676 0.678 0.073%
Crescendo Corp 1.470 1.410 1.440 1.450 1.480 1.490 1.520 1.530 0.117%
Daiman Develop 2.220 2.220 2.220 2.220 2.220 2.220 2.220 2.220 0.164%
Damansara Realty 0.625 0.618 0.621 0.623 0.626 0.628 0.631 0.633 0.068%
Dijaya n.a. n.a. n.a. n.a. n.a. n.a. n.a. n.a. 0.000%
Dutaland 0.400 0.393 0.394 0.398 0.399 0.403 0.404 0.408 0.118%
E&O 1.540 1.510 1.515 1.530 1.535 1.550 1.555 1.570 0.678%
Global Oriental 0.315 0.293 0.296 0.308 0.311 0.323 0.326 0.338 0.050%
Glomac 0.765 0.758 0.761 0.763 0.766 0.768 0.771 0.773 0.194%
Hunza Properties n.a. n.a. n.a. n.a. n.a. n.a. n.a. n.a. 0.000%
IJM Land n.a. n.a. n.a. n.a. n.a. n.a. n.a. n.a. 0.000%
Ivory Properties 0.460 0.453 0.454 0.458 0.459 0.463 0.464 0.468 0.079%
KLCC Property n.a. n.a. n.a. n.a. n.a. n.a. n.a. n.a. 0.000%
KSL Hold. 1.110 1.095 1.103 1.105 1.113 1.115 1.123 1.125 0.400%
Kump Hartanah n.a. n.a. n.a. n.a. n.a. n.a. n.a. n.a. 0.000%
Kump Perangsang 1.270 1.210 1.225 1.250 1.265 1.290 1.305 1.330 0.222%
LBS Bina Group 1.680 1.650 1.655 1.670 1.675 1.690 1.695 1.710 0.377%
Magna Prima 0.980 0.980 0.980 0.980 0.980 0.980 0.980 0.980 0.114%
Mah Sing 1.520 1.460 1.485 1.500 1.525 1.540 1.565 1.580 1.282%
Malton 0.690 0.660 0.665 0.680 0.685 0.700 0.705 0.720 0.108%
MK Land 0.290 0.283 0.286 0.288 0.291 0.293 0.296 0.298 0.122%
Nadayu n.a. n.a. n.a. n.a. n.a. n.a. n.a. n.a. 0.000%
Plenitude 1.700 1.670 1.685 1.690 1.705 1.710 1.725 1.730 0.227%
Selangor Prop 4.720 4.720 4.720 4.720 4.720 4.720 4.720 4.720 0.568%
Selangor Dredging 0.850 0.790 0.820 0.830 0.860 0.870 0.900 0.910 0.127%
SP Setia 3.220 3.160 3.175 3.200 3.215 3.240 3.255 3.280 3.177%
Sunway 3.050 2.975 3.003 3.025 3.053 3.075 3.103 3.125 2.171%
Suria Capital 2.080 1.975 1.993 2.045 2.063 2.115 2.133 2.185 0.210%
Talam Corp n.a. n.a. n.a. n.a. n.a. n.a. n.a. n.a. 0.000%
Tebrau Teguh n.a. n.a. n.a. n.a. n.a. n.a. n.a. n.a. 0.000%
UEM Land n.a. n.a. n.a. n.a. n.a. n.a. n.a. n.a. 0.000%
WCT n.a. n.a. n.a. n.a. n.a. n.a. n.a. n.a. 0.000%
Wing Tai 1.070 1.070 1.070 1.070 1.070 1.070 1.070 1.070 0.178%
YNH Property 1.540 1.540 1.540 1.540 1.540 1.540 1.540 1.540 0.283%
YTL Land & Dev 0.580 0.558 0.566 0.573 0.581 0.588 0.596 0.603 0.168%
Rubber Glove
Adventa 0.780 n.a. n.a. n.a. n.a. n.a. n.a. n.a. 0.042%
Hartalega 4.930 4.615 4.673 4.825 4.883 5.035 5.093 5.245 2.832%
Kossan 6.790 6.670 6.730 6.750 6.810 6.830 6.890 6.910 1.520%
Latexx Partners n.a. n.a. n.a. n.a. n.a. n.a. n.a. n.a. 0.000%
Rubberex 0.800 0.778 0.784 0.793 0.799 0.808 0.814 0.823 0.064% Supermax Corp 2.190 2.085 2.113 2.155 2.183 2.225 2.253 2.295 0.515%
www.bimbsec.com.my | 10
Market Insight
Stocks Closing Price
S3 S2 S1 Pivot Point
R1 R2 R3 Est.
Weighting
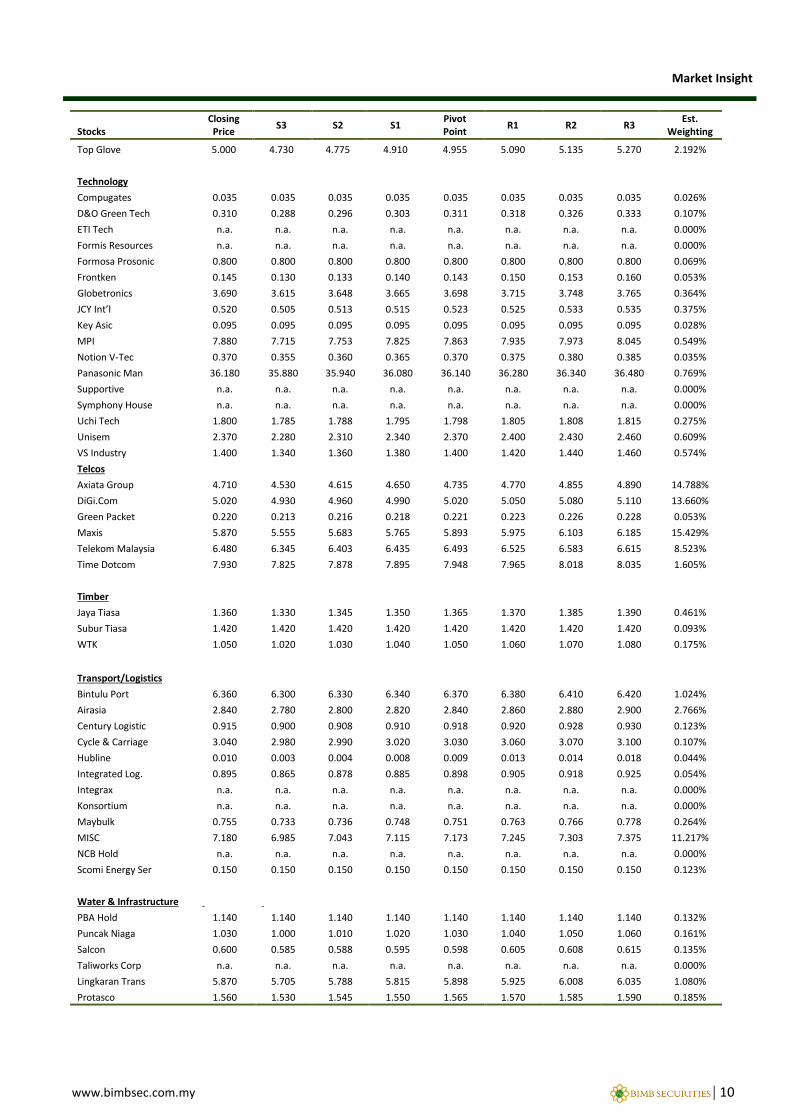
Top Glove 5.000 4.730 4.775 4.910 4.955 5.090 5.135 5.270 2.192%
Technology
Compugates 0.035 0.035 0.035 0.035 0.035 0.035 0.035 0.035 0.026%
D&O Green Tech 0.310 0.288 0.296 0.303 0.311 0.318 0.326 0.333 0.107%
ETI Tech n.a. n.a. n.a. n.a. n.a. n.a. n.a. n.a. 0.000%
Formis Resources n.a. n.a. n.a. n.a. n.a. n.a. n.a. n.a. 0.000%
Formosa Prosonic 0.800 0.800 0.800 0.800 0.800 0.800 0.800 0.800 0.069%
Frontken 0.145 0.130 0.133 0.140 0.143 0.150 0.153 0.160 0.053%
Globetronics 3.690 3.615 3.648 3.665 3.698 3.715 3.748 3.765 0.364%
JCY Int’l 0.520 0.505 0.513 0.515 0.523 0.525 0.533 0.535 0.375%
Key Asic 0.095 0.095 0.095 0.095 0.095 0.095 0.095 0.095 0.028%
MPI 7.880 7.715 7.753 7.825 7.863 7.935 7.973 8.045 0.549%
Notion V-Tec 0.370 0.355 0.360 0.365 0.370 0.375 0.380 0.385 0.035%
Panasonic Man 36.180 35.880 35.940 36.080 36.140 36.280 36.340 36.480 0.769%
Supportive n.a. n.a. n.a. n.a. n.a. n.a. n.a. n.a. 0.000%
Symphony House n.a. n.a. n.a. n.a. n.a. n.a. n.a. n.a. 0.000%
Uchi Tech 1.800 1.785 1.788 1.795 1.798 1.805 1.808 1.815 0.275%
Unisem 2.370 2.280 2.310 2.340 2.370 2.400 2.430 2.460 0.609%
VS Industry 1.400 1.340 1.360 1.380 1.400 1.420 1.440 1.460 0.574%
Telcos
Axiata Group 4.710 4.530 4.615 4.650 4.735 4.770 4.855 4.890 14.788%
DiGi.Com 5.020 4.930 4.960 4.990 5.020 5.050 5.080 5.110 13.660%
Green Packet 0.220 0.213 0.216 0.218 0.221 0.223 0.226 0.228 0.053%
Maxis 5.870 5.555 5.683 5.765 5.893 5.975 6.103 6.185 15.429%
Telekom Malaysia 6.480 6.345 6.403 6.435 6.493 6.525 6.583 6.615 8.523%
Time Dotcom 7.930 7.825 7.878 7.895 7.948 7.965 8.018 8.035 1.605%
Timber
Jaya Tiasa 1.360 1.330 1.345 1.350 1.365 1.370 1.385 1.390 0.461%
Subur Tiasa 1.420 1.420 1.420 1.420 1.420 1.420 1.420 1.420 0.093%
WTK 1.050 1.020 1.030 1.040 1.050 1.060 1.070 1.080 0.175%
Transport/Logistics
Bintulu Port 6.360 6.300 6.330 6.340 6.370 6.380 6.410 6.420 1.024%
Airasia 2.840 2.780 2.800 2.820 2.840 2.860 2.880 2.900 2.766%
Century Logistic 0.915 0.900 0.908 0.910 0.918 0.920 0.928 0.930 0.123%
Cycle & Carriage 3.040 2.980 2.990 3.020 3.030 3.060 3.070 3.100 0.107%
Hubline 0.010 0.003 0.004 0.008 0.009 0.013 0.014 0.018 0.044%
Integrated Log. 0.895 0.865 0.878 0.885 0.898 0.905 0.918 0.925 0.054%
Integrax n.a. n.a. n.a. n.a. n.a. n.a. n.a. n.a. 0.000%
Konsortium n.a. n.a. n.a. n.a. n.a. n.a. n.a. n.a. 0.000%
Maybulk 0.755 0.733 0.736 0.748 0.751 0.763 0.766 0.778 0.264%
MISC 7.180 6.985 7.043 7.115 7.173 7.245 7.303 7.375 11.217%
NCB Hold n.a. n.a. n.a. n.a. n.a. n.a. n.a. n.a. 0.000%
Scomi Energy Ser 0.150 0.150 0.150 0.150 0.150 0.150 0.150 0.150 0.123%
Water & Infrastructure
PBA Hold 1.140 1.140 1.140 1.140 1.140 1.140 1.140 1.140 0.132%
Puncak Niaga 1.030 1.000 1.010 1.020 1.030 1.040 1.050 1.060 0.161%
Salcon 0.600 0.585 0.588 0.595 0.598 0.605 0.608 0.615 0.135%
Taliworks Corp n.a. n.a. n.a. n.a. n.a. n.a. n.a. n.a. 0.000%
Lingkaran Trans 5.870 5.705 5.788 5.815 5.898 5.925 6.008 6.035 1.080%
Protasco 1.560 1.530 1.545 1.550 1.565 1.570 1.585 1.590 0.185%
www.bimbsec.com.my | 11
Market Insight
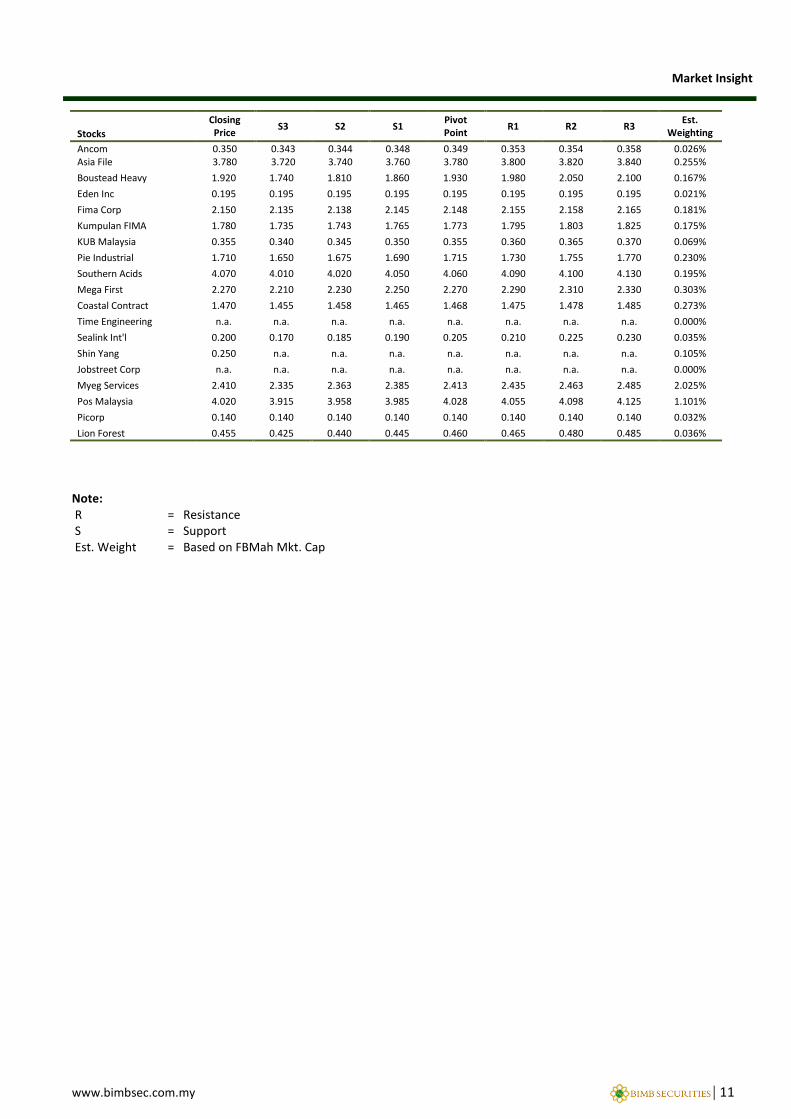
Note: R = Resistance S = Support Est. Weight = Based on FBMah Mkt. Cap
Stocks
Closing Price
S3 S2 S1 Pivot Point
R1 R2 R3 Est.
Weighting
Ancom 0.350 0.343 0.344 0.348 0.349 0.353 0.354 0.358 0.026% Asia File 3.780 3.720 3.740 3.760 3.780 3.800 3.820 3.840 0.255%
Boustead Heavy 1.920 1.740 1.810 1.860 1.930 1.980 2.050 2.100 0.167%
Eden Inc 0.195 0.195 0.195 0.195 0.195 0.195 0.195 0.195 0.021%
Fima Corp 2.150 2.135 2.138 2.145 2.148 2.155 2.158 2.165 0.181%
Kumpulan FIMA 1.780 1.735 1.743 1.765 1.773 1.795 1.803 1.825 0.175%
KUB Malaysia 0.355 0.340 0.345 0.350 0.355 0.360 0.365 0.370 0.069%
Pie Industrial 1.710 1.650 1.675 1.690 1.715 1.730 1.755 1.770 0.230%
Southern Acids 4.070 4.010 4.020 4.050 4.060 4.090 4.100 4.130 0.195%
Mega First 2.270 2.210 2.230 2.250 2.270 2.290 2.310 2.330 0.303%
Coastal Contract 1.470 1.455 1.458 1.465 1.468 1.475 1.478 1.485 0.273%
Time Engineering n.a. n.a. n.a. n.a. n.a. n.a. n.a. n.a. 0.000%
Sealink Int'l 0.200 0.170 0.185 0.190 0.205 0.210 0.225 0.230 0.035%
Shin Yang 0.250 n.a. n.a. n.a. n.a. n.a. n.a. n.a. 0.105%
Jobstreet Corp n.a. n.a. n.a. n.a. n.a. n.a. n.a. n.a. 0.000%
Myeg Services 2.410 2.335 2.363 2.385 2.413 2.435 2.463 2.485 2.025%
Pos Malaysia 4.020 3.915 3.958 3.985 4.028 4.055 4.098 4.125 1.101%
Picorp 0.140 0.140 0.140 0.140 0.140 0.140 0.140 0.140 0.032%
Lion Forest 0.455 0.425 0.440 0.445 0.460 0.465 0.480 0.485 0.036%
www.bimbsec.com.my | 12
Market Insight
DEFINITION OF RATINGS BIMB Securities uses the following rating system: STOCK RECOMMENDATION BUY Total return (price appreciation plus dividend yield) is expected to exceed 10% in the next 12 months. TRADING BUY Share price may exceed 15% over the next 3 months, however longer-term outlook remains uncertain. HOLD Share price may fall within the range of +/- 10% over the next 12 months TAKE PROFIT Target price has been attained. Fundamentals remain intact. Look to accumulate at lower levels. TRADING SELL Share price may fall by more than 15% in the next 3 months. SELL Share price may fall by more than 10% over the next 12 months. NOT RATED Stock is not within regular research coverage. SECTOR RECOMMENDATION OVERWEIGHT The Industry as defined by the analyst’s coverage universe, is expected to outperform the relevant primary market
index over the next 12 months NEUTRAL The Industry as defined by the analyst’s coverage universe, is expected to perform in line with the relevant primary
market index over the next 12 months UNDERWEIGHT The Industry as defined by the analyst’s coverage universe, is expected to underperform the relevant primary
market index over the next 12 months Applicability of ratings The respective analyst maintains a coverage universe of stocks, the list of which may be adjusted according to needs. Investment ratings are only applicable to the stocks which form part of the coverage universe. Reports on companies which are not part of the coverage do not carry investment ratings as we do not actively follow developments in these companies. Disclaimer The investments discussed or recommended in this report may not be suitable for all investors. This report has been prepared for information purposes only and is not an offer to sell or a solicitation to buy any securities. The directors and employees of BIMB Securities Sdn may from time to time have a position in or either the securities mentioned herein. Members of the BIMB Group and their affiliates may provide services to any company and affiliates of such companies whose securities are mentioned herein. The information herein was obtained or derived from sources that we believe are reliable, but while all reasonable care has been taken to ensure that stated facts are accurate and opinions fair and reasonable, we do not represent that it is accurate or complete and it should not be relied upon as such. No liability can be accepted for any loss that may arise from the use of this report. All opinions and estimates included in this report constitute our judgements as of this date and are subject to change without notice. BIMB Securities Sdn accepts no liability for any direct, indirect or consequential loss arising from use of this report.
Published by
BIMB SECURITIES SB (290163-X) A Participating Organisation of Bursa Malaysia Securities Level 32, Menara Multi Purpose, Capital Square, No. 8 Jalan Munshi Abdullah, 50100 Kuala Lumpur Tel: 03-2613 1600 Fax: 03-2613 1799 Azharuddin Nordin http://www.bimbsec.com.my Head of Research
The investments discussed or recommended in this report may not be suitable for all investors. This report has been prepared for information purposes only and is not an offer to sell or a solicitation to buy any securities. The directors and employees of BIMB Securities Sdn Bhd may from time to time have a position in or with the securities mentioned herein. Members of the BIMB Group and their affiliates may provide services to any company and affiliates of such companies whose securities are mentioned herein. The information herein was obtained or derived from sources that we believe are reliable, but while all reasonable care has been taken to ensure that stated facts are accurate and opinions fair and reasonable, we do not represent that it is accurate or complete and it should not be relied upon as such. No liability can be accepted for any loss that may arise from the use of this report. All opin-ions and estimates included in this report constitute our judgement as of this date and are subject to change without notice..
The investments discussed or recommended in this report may not be suitable for all investors. This report has been prepared for information purposes only and is not an offer to sell or a solicitation to buy any securities. The directors and employees of BIMB Securities Sdn Bhd may from time to time have a position in or with the securities mentioned herein. Members of the BIMB Group and their affiliates may provide services to any company and affiliates of such companies whose securities are mentioned herein. The information herein was obtained or derived from sources that we believe are reliable, but while all reasonable care has been taken to ensure that stated facts are accurate and opinions fair and reasonable, we do not represent that it is accurate or complete and it should not be relied upon as such. No liability can be accepted for any loss that may arise from the use of this report. All opin-ions and estimates included in this report constitute our judgement as of this date and are subject to change without notice..
The investments discussed or recommended in this report may not be suitable for all investors. This report has been prepared for information purposes only and is not an offer to sell or a solicitation to buy any securities. The directors and employees of BIMB Securities Sdn Bhd may from time to time have a position in or with the securities mentioned herein. Members of the BIMB Group and their affiliates may provide services to any company and affiliates of such companies whose securities are mentioned herein. The information herein was obtained or derived from sources that we believe are reliable, but while all reasonable care has been taken to ensure that stated facts are accurate and opinions fair and reasonable, we do not represent that it is accurate or complete and it should not be relied upon as such. No liability can be accepted for any loss that may arise from the use of this report. All opin-ions and estimates included in this report constitute our judgement as of this date and are subject to change without notice..