1
Variations in liveweight gains, milk yield and composition of Red Sokoto goats fed crop-1
residue based supplements in the subhumid zone of Nigeria2
3
B.S. Malau-Aduli1, L.O. Eduvie, C.A.M. Lakpini and A.E.O. Malau-Aduli*4
National Animal Production Research I nstitute, Ahmadu Bello University, PMB 1096 Zaria, Nigeria.5
1. Department of Animal Science, Ahmadu Bello University, PMB 1044 Zaria, Nigeria.6
*Present address of corresponding author: Laboratory of Animal Breeding and Reproduction,7
National Agricultural Research Centre for Western Region,8
60 Yoshinaga, Kawai, Oda, Shimane 694 -0013, Japan.9
E-mail: [email protected], [email protected]
Tel: +81-90-6837-1953, +81-854-82-128511
Fax: +81-854-82-228012
131415161718192021
RUNNING TITLE: VARIATIONS IN WEIGHT GAIN, MILK YIELD AND COMPOSITION OF RED SOKOTO GOATS222324252627282930313233
2
Abstract1
Variations in weight gain, milk yield, milk composition, nutrient intake and digestibility of Red2
Sokoto goats supplemented with crop -residue based rations during the long -dry period were3
investigated. Ration A, the conventional concentrate ration, was used as the positive control,4
Rations B and C were the two crop -residue test diets, while Ration D the unsupplemented5
treatment, was used as the negative control. Each of the supplementation rati ons was fed at 16
and 2% of the goat’s body weight (designated as 1A, 2A, 1B, 2B and 1C, 2C respectively) . The7
supplemented group of goats had significantly higher (P<0.05) dry matter (DM) and crude8
protein (CP) intakes as well as nutrient digestibilities than the unsupplemented groups. DM9
digestibility improved with supplementation by a range of 4.1 to 27.9%, while CP digestibility10
improved by 17.1 to 42.2%, the highest value being in does on Ration A. It was evident that11
supplementation significantly (P<0.01) influenced weight gains and milk yield of dams. Goats12
on ration 2C recorded the highest average daily gains of 39.29 g/day while their counterparts13
fed rations 1B and D lost 28.57 and 92.86 g/day respectively. Ration 1C which comprised14
mainly of crop residue with much lesser protein levels than the concentrate ration , produced 5415
kg of milk over a 90-day lactation period averaging 0.60 kg per day. Goats on Ration D had16
the shortest lactation length of 41 days and the least total and average daily milk yields o f 10.217
and 0.25 kg respectively. Milk from does on ration 2A contained the highest percentages of fat18
(6%), protein (6.33%), total solids (21.85%) and solids -not-fat (15.85%). Milk from goats on19
ration D ranked least with respect to all parameters studied. It was concluded that the goats20
made appreciable gains in the long dry season on crop -residue based diets that compared21
favourably with the conventional concentrate rations. Ration C fed at 1% level was a good22
supplementary feed package for increased live weight gains and milk production in Red Sokoto23
goats.24
Keywords: Red Sokoto goats, crop residue, supplementation, weight gains, milk yield , milk composition25

3
1. Introduction1
Between 40-100% of patients allergic to cow milk tolerate goat milk (Park, 1994). Goat milk2
has been recommended as a substitute for those who suffer from allergies to cow milk or other3
food sources (Van der Horst, 1976). Therefore, there is a growing awareness of the4
importance of goats as a source of milk for man (Prakash and Jenness , 1968) and world-wide,5
more people drink goat milk than milk from other species (Park and Chukwu , 1989). The6
potential for increased use of goats as the most effective animals for milk production in many7
developing countries is quite high. The Northern regions of Nigeria are concentrated with most8
of the nation’s ruminant livestock. However, these areas are characterised by a long and9
pronounced dry season (6 -9 months), and this often causes serious shortage of feed for the10
ruminants. The problem of dry seas on livestock feeding in particular, has directed research11
efforts towards harnessing and enhanc ing the utilization of arable by-products and crop12
residues. The abundance of crop residues makes them cheap sources of nutrients for13
ruminants. Nevertheless, they are generally low in nutrients (Nicholson, 1984). Various14
strategies have been adopted to improve their nutrients and utilisation (Leng, 1990). One of15
such is by judicious supplementation to provide the most limiting nutrients (Preston, 1982;16
Alhassan, 1988). However, appropriate feeding packages for improved liveweight gains and17
milk production to guide small ruminant producers in Nigeria have not been developed. Also,18
relevant information on cheap, alternative sources of feeds crucial to dry season feeding in19
Nigeria’s subhumid zone has not been passed on to small ruminant producers. Therefore, this20
study was undertaken to determi ne the nutrient composition, intakes , digestibilities and21
affordability of some locally available crop residue feed resources and their impact on22
liveweight gain, milk yield and composition of Red Sokoto goats in the sub -humid zone of23
Nigeria, in comparison with the conventional concentrate supplementation ration.24
25
4
2. Materials and methods1
2.1 Location and management of experime ntal animals2
The experiments were conducted during the dry seasons (between October and March) in the3
Experimental Unit of the Small Ruminant Research Programme of the National Animal4
Production Research Institute, Shika, Zaria, Nigeria. Shika falls betwee n latitudes 11 and 12N5
and between longitudes 7 and 8 E, with an altitude of 640m above sea level. Shika is located6
within the Northern Guinea Savannah Zone with an average annual rainfall and temperature of7
1,107 mm and 24.4C respectively. The seasonal distribution of the annual rainfall is8
approximately 0.1% (11.0 mm) in the late -dry season (January-March), 25.8% (285.6 mm) in9
the early-wet season (April-June), 69.6% (770.4 mm) in the late -wet season (July-September)10
and 4.5 % (49.8 mm) in the early dry season (October-December). The animals were routinely11
dewormed with anthelmintic drugs and dipped in an acaricide (Asuntol) solution against12
ectoparasites. The animals were housed in well -ventilated pens during the night.13
14
2.2 Digestibility trial: Twenty-eight adult Red Sokoto does ranging between 24.6 and 26.4 kg15
were used for this experiment. The animals were balanced for weight and blocked into seven16
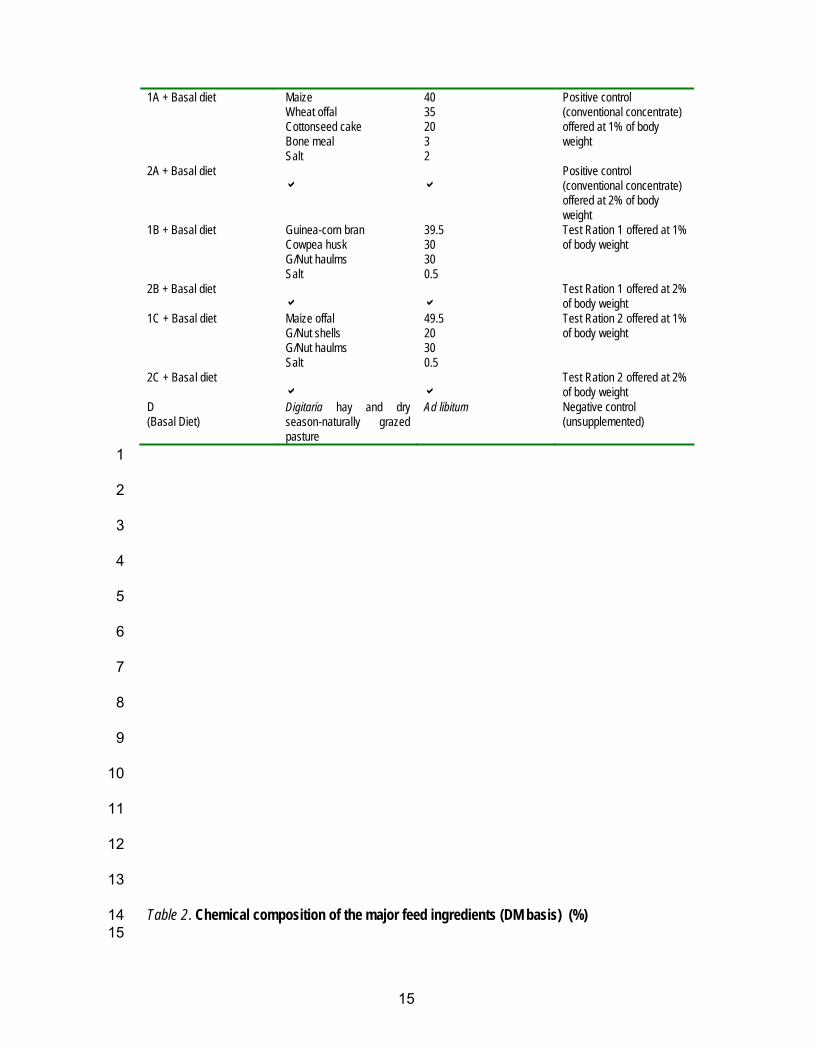
groups with four animals per group. The component ingredients in the different rations are17
shown in Table 1. Each doe was individually offered its appropriate corresponding ration to18
evaluate the digestibility of the diets. The study comprised a two -week preliminary period of19
realimentation and adjustment, and one week of sample collection. The animals were housed20
in individual metabolism cages with facilities for separate collection of faeces and urine. The21
animals were weighed at the beginning and end of the study. F aeces were collected each22
morning just before feeding. A sample of 10% of each daily faecal output was collected for23
chemical analyses. Samples of the different rations fed were taken daily and bulked, from24
which sub-samples were taken for laboratory analysis. Also, samples of the individual feed25

5
ingredients were analysed in the laboratory. Water was made available to the animals ad1
libitum. The inventory, abundance and palatability of the plant species in the grazed paddock2
was conducted as described by Lakpini et al. (1997).3
4
2.3 Milk yield and composition: Measurements for milk yield and composition commenced5
from day 7 postpartum to allow kids access to all their dams’ colostrum. Thereafter, the kids6
were separated from their dams and moved to the bucket -fed unit. The two halves of the udder7
of each lactating doe were hand -milked early in the morning and in the evenings. The quantity8
of milk collected at each milking was recorded and does were monitored from a week after9
delivery to the last day of milk let -down when the total lactation length was recorded. Daily milk10
yield was bulked from Weeks 2 to 6 for laboratory analysis to determine milk composition using11
AOAC (1980) procedures.12
13
2.4 Laboratory analyses : Proximate analyses of feed and faecal samples were carried out by14
the AOAC (1980) methods. Dry matter of samples was determined by drying the samples in an15
oven at 105C for 48 hours. Nitrogen determination was by the Micro Kjedahl method, while16
the Soxhlet extraction procedure was used for ether extraction. Crude fibre was determined by17
alternate refluxing with weak solutions of H 2SO4 and KOH. The detergent fibre fractions18
(Neutral detergent fibre, acid detergent fibre and lignin) were determined according to Goering19
and Van Soest (1970). Dry matter intake (DMI) was determined using the following equation:20
DMI (g/day) = %DM/100 x feed intake .21
Dry matter digestibility (DMD (%)) was calculated as:22
100 – [DM output (g)/DM intake (g)] x 100.23
The other digestibilities were calculated as above.24
6
2.5 Statistical analysis: Differences in feed intake, digestibility, liveweight gain, milk yield and1
composition were analysed using the Generalised Linear Models Pro cedure (PROC GLM) of2
SAS (1987). The effect of treatment was tested and significant differences between treatment3
means established by Duncan ’s Multiple Range Test.4
5
3. Results6
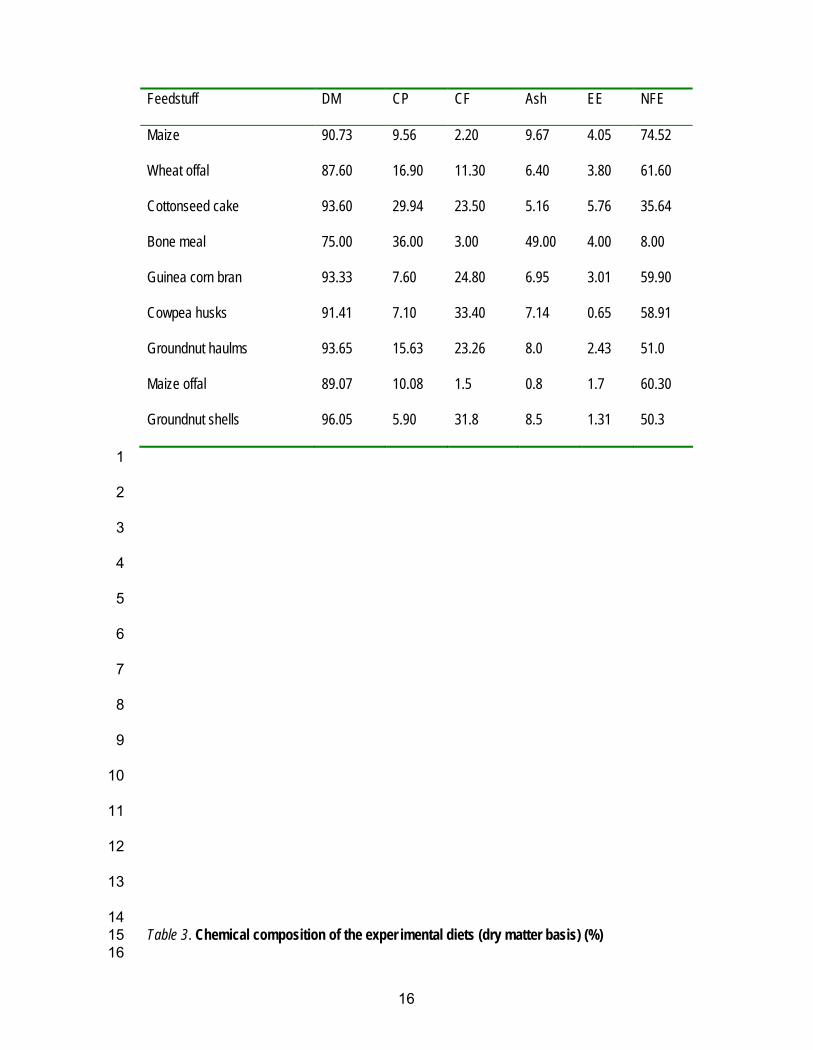
The chemical composition of the individual feed ingredients and the experimental diets are7
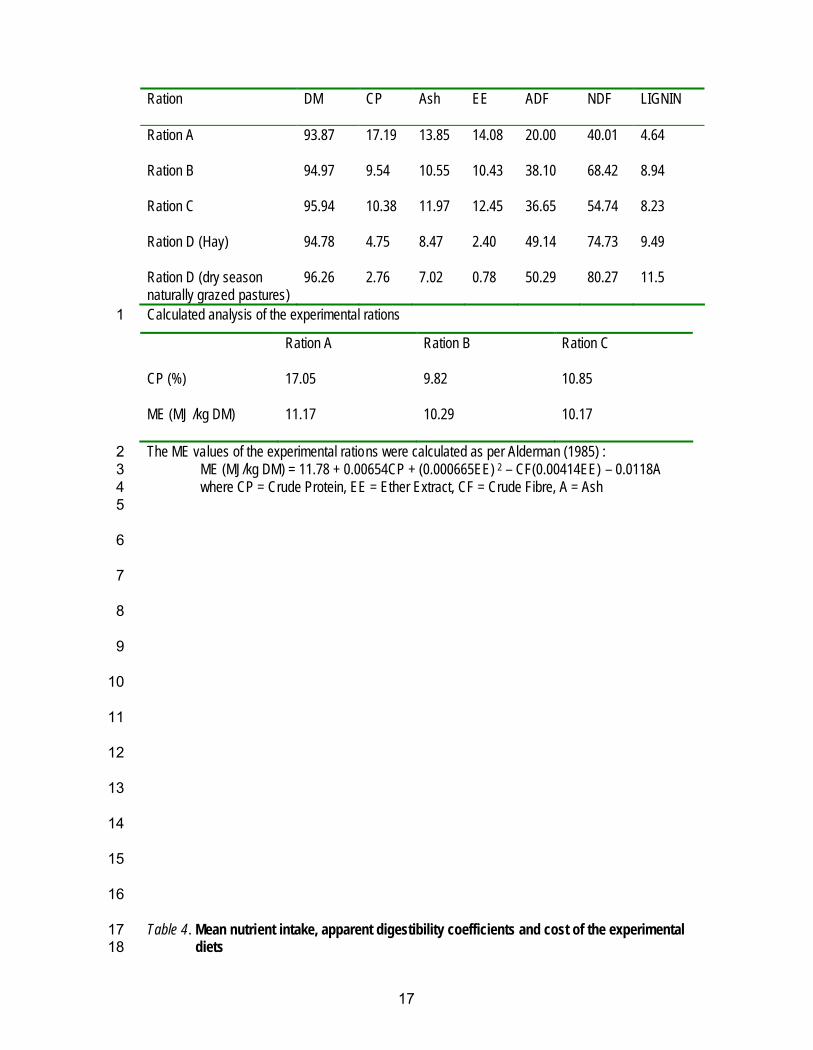
shown in Tables 2 and 3 respectively. Table 3 shows that all the rations had high dry matter8
(DM) contents with a mean value of about 95%. Ration A had the highest crude protein (CP )9
followed by Rations B and C, respectively. The CP value of the dry season-grazed pastures10
was the lowest. The least ash content value was obtained in Ration D : hay (8.47%) and grazed11
pasture (7.02%). The highest ash content was obtained in Ration A. Rati on A also had the12
highest ether extract (EE) and Ration D, the least . Acid detergent fibre (ADF), neutral13
detergent fibre (NDF) and lignin contents were least in Ration A . Ration D on the other hand,14
contained the highest ADF, NDF and lignin values. The ca lculated chemical analysis of the15
experimental rations (Table 3) revealed that Ration A had a CP content of 17.05% while the16
test rations B and C had 9.82 and 10.85%, respectively. Ration A also had a metabolisable17
energy (ME) of 11.17 MJ/kg DM, while Rati ons B and C had 10.29 and 10.17 MJ/kg DM18
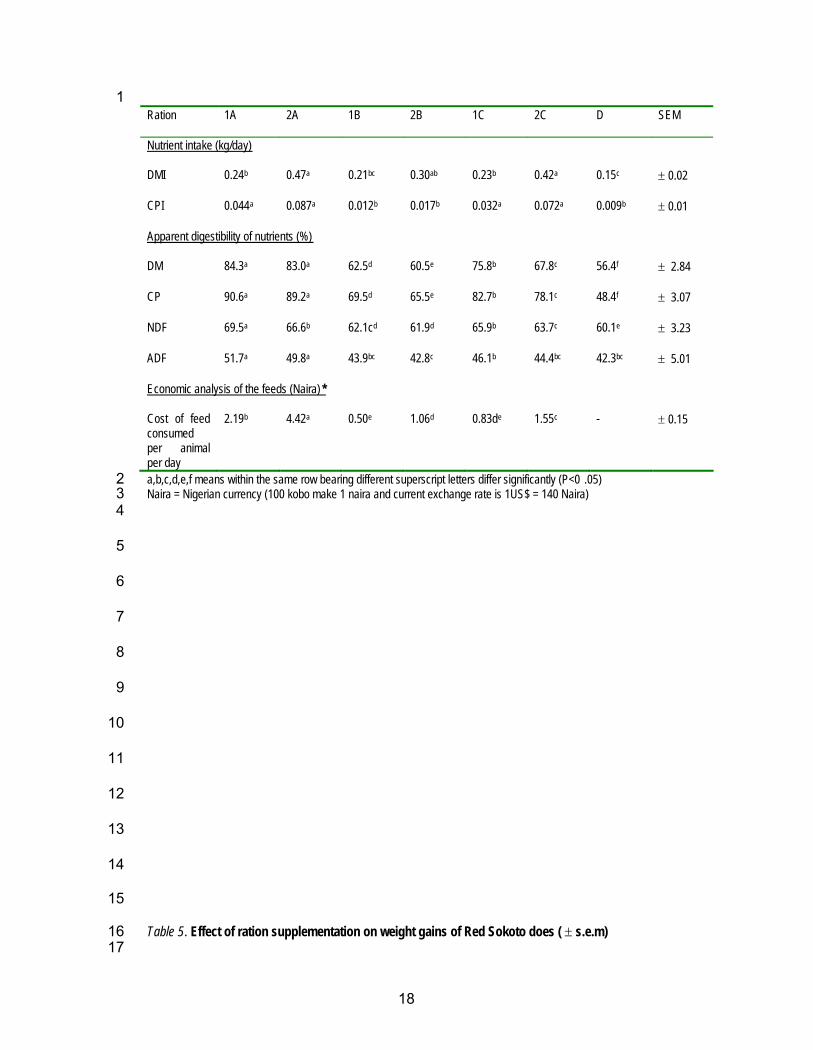
respectively. Table 4 shows the DM and CP intakes and digestibilities of the nutrients. The19
Table shows that generally, the supplemented groups had significantly higher (P<0.05) DM20
and CP intakes and digestibilities than the unsupplemented group except animals on Ration B21
that had similar values to the unsupplemented group. It was also evident that increasing the22
level of supplementation also resulted in significantly (P<0.05) increased DM and CP intakes. It23
was also observed that supplementation increased the digestibility of all the nutrients. However,24
animals on Ration B recorded very poor digestibility values and their counterparts in the25

7
unsupplemented group had the least. Even though the digestibility of nutrien ts decreased with1
increasing levels of supplementation, these decreases were not significant (P>0.05). Ration 1A2
(the conventional concentrate at 1% of body weight) gave the highest digestibility values. A3
comparison of the unsupplemented animals with all the other treatment groups reveals that4
DM digestibility improved by a range of 4.1 to 27.9% and CP digestibility by 17.1 to 42.2%, the5
highest being in animals on Ration A at 1% level. Similar improvements trends were also6
noticeable for neutral detergent fibre (NDF) and acid detergent fibre (ADF). A simple economic7
analysis (Table 4) revealed that the conventional concentrate feed was the most expensive for8
supplementation particularly, at the 2% level (4.42 naira per animal per day). Of the two tested9
crop-residue rations, Ration 1B was significantly cheaper (P<0.05) than Rations 2B and 2C,10
but similar to Ration 1C.11
The effect of ration supplementation on weight gains and average daily gains of the12
dams are depicted on Table 5. It shows that by the end of the study, dams fed rations 1B and13
D lost weights (2.0 and 6.5 Kg , mean loss of 28.57 and 92.86g/day respectively), while those14
on ration 2C gained the highest weight of 2.75 Kg , mean gain of 39.29 g/day. This was15
followed by rations 2A and 1C with 1.5 Kg weight gain each, mean gain of 21.43 g/day.16
Table 6 shows results of the lactation length, total milk yield and average daily milk17
yield of does on different rations. D ams on Rations 1A and 2A lactated for 80 and 88 days,18
gave total milk yields of 38.4 an d 54.5 kg and averaging 0.48 and 0.62 kg /day, respectively.19
Interestingly, Ration 1C which comprised of mainly crop residue with much lesser protein20
levels produced 54 kg of milk over a 90 -day lactation length averaging 0.60 kg per day. At the21
other extreme, dams that fed on the negative control ration D comprising of Digitaria hay and22
natural grazed pastures, had the shortest lactation length and therefore least total and average23
daily milk yields (Table 6).24

8
Results of the milk composition of Red Sokoto d oes is shown in Table 7. It was evident1
that in absolute terms, milk from does on Ration 2A contained the highest percentages of fat,2
protein, total solids and SNF. As expected, milk from does on the negative control ration3
ranked least with respect to all the parameters studied. Figure 1 shows that all phenotypic4
correlations between the milk components (total solids, crude protein, fat and solids -not-fat)5
were positive, and the highest correlation of 0.84 was between total solids and crude protein6
(excluding the perfect correlation of 1.00 between a variable and itself). This indicates a very7
strong relationship between these components in which there is a corresponding increase in8
crude protein as total solids percentage increases and vice -versa. However, between solids-9
not-fat and fat, though positive, was not significant (0.38).10
11
4. Discussion12
The quantity and type of ingredients used in formulating the rations influenced their chemical13
compositions. In Ration A, the inclusion of wheat offal and cotton seed cake boosted the14
protein level of the ration giving it a value of 17.19%. This value is higher than the15
recommended CP level of 15% for optimum maintenance of production by Nuru (1985) and 8.916
– 16.0% by NRC (1975). The metabolisable energy (ME) value of Ration A (11.17 MJ/kg DM)17
is also higher than the 9.5 MJ/kg DM recommended for maintenance by INRA (1988), but18
lower than the latter’s recommended value for pregnant and lactating goats. Rations B and C19
had similar CP and ME values indicating that they are isocaloric and isonitrogenous rations.20
The preponderance of crop residues in Rations B and C was responsible for their high crude21
fibre and lignin levels. The current study showed that inspite of Rations B and C being22
isocaloric and isonitrogenous, an imals on Ration C had better intakes and digestibilities than23
those on Ration B, possibly due to the low palatability, hence low voluntary intake, and poor24
digestibility of Ration B.25

9
The observed higher digestibilities of DM, CP, NDF and ADF at 1% level (rations 1A,1
1B, 1C) in comparison to 2% level (rations 2A, 2B, 2C) can be attributed to the higher feed2
intake at the 2% level of inclusion. It has been established that higher feed intake results in a3
faster rate of passage of digesta from the reticulo -rumen (Swan and Lamming, 1967). This4
does not allow for effective degradation, hence lowering the digestibility of feed. Increasing the5
level of crop residue in the diet also increased the amount of lignin, which depresse d the6
digestibility of the ration (McDonald et al., 1988), because the rate of microbial colonisation of7
a feed with high fibre content is comparatively lower (Silva and Orskov, 1988). The poor intake8
and digestibility values obtained for the unsupplemented animals is due to the fact that Ra tion9
D had crude protein levels that are below the recommended minimum values for maintenance.10
This shows that there is the need for dry season supplementation in goats because the11
available feeds at that time are limiting in crude protein.12
Of the two tested rations, Ration C seemed to have produced better intakes and13
digestibilities in the animals, possibly due to the composition of the rations. It contained maize14
offal which has very low fibre content (Alawa and Umunna, 1993), groundnut haulms which15
have been demonstrated to be better quality roughages than Digitaria smutsii hay and contain16
adequate protein to maintain ruminants without any form of supplementation during the periods17
of feed scarcity (Ikhatua and Adu, 1984). The groundnut shells fed to the animals were also18
crushed before inclusion into the ration as suggested by Alawa and Umunna (1993). This must19
have aided their consumption and digestibility. Even though Ration B contained groundnut20
haulms, the combination of Guinea corn bran and cowpea h usk which had low crude protein21
percentages, must have reduced the intake and digestibility of the ration. Alhassan et al.22
(1984) observed lower digestibility values in sheep and goats (48.8 and 56.3% respectively)23
compared with cattle (73.6%) when they fe d them cowpea vines. This might imply that cattle24
do better on cowpea residues than small ruminants. From the economic analysis, the high cost25

10
of the conventional concentrate ration shows that it is beyond the reach of a typical smallholder1
goat farmer, whereas the crop-residue based rations seem quite affordable. Even though2
Ration B had the least cost, it was obvious that it had lower intake and digestibility compared3
to Ration C, indicating in essence, that Ration C had a better efficiency of utilisation4
The effects of various crop residues on feed intake, liveweight gains and5
growth performance of ruminants have been reported by Adu and Lakpini (1983b) and Ikhatua6
and Adu (1984). Adu and Lakpini (1983b) obtained liveweight gains of 90.2 g per day in7
Yankasa lambs fed sole diet of unchopped groundnut haulms. In the study by Ikhatua and Adu8
(1984), supplementation of groundnut haulms with concentrate further enhanced intake and9
performance of the animals. Similar effects of supplementation have been observ ed in this10
study.11
The efficiency of conversion of feed to meat as reflected by liveweight gains, was12
highest in does fed ration 2C and lowest in those fed rations D and 1B. The better weight gains13
of does fed ration 2C over those fed the conventional conc entrate ration (1A and 2A) indicate14
that does in the latter groups converted more of their feed to milk rather than meat as15
evidenced by their higher milk yield values. The observed liveweight gains in this study were16
lower than those reported by Adeneye and Oyenuga (1976), Adu and Lakpini (1983a, 1983b)17
and Ikhatua and Adu (1984). However, they agree d with the report of Adebowale (1989) who18
included 40% untreated maize cobs in the diets of goats and obtained 24.9 g/day weight gain.19
The weight losses observed in does fed rations 1B and D could be attributed to the low20
palatability, low intake and poor digestibility of the feeds.21
The milk yield, lactation length and milk compositi on values in the present study we re22
in agreement with those of other experiment s with goats reported by Prakash and Jenness23
(1968), Ramos and Juarez (1981) and Sibanda et al. (1990). This study also confirmed that24
the milk yield of goats could be improved by supplementing their pasture diets with some25
11
concentrates (Garmo, 1986). The observed values of total milk yield, lactation length and1
average daily yield in goats fed rations 2A and 1C were higher than those reported by Adu et2
al. (1979), Akinsoyinu et al. (1982) and Ehoche and Buvanendran (1983) . This increase in milk3
yield may be due to improvement as a result of selection over the years within the Red Sokoto4
breed. The inference that can be drawn from this observation is that feeding lactating does on5
ration 1C irrespective of the fact that it wa s a mainly crop residue ration, gave just as good a6
result in terms of average daily and total milk yields, as full concentrate rations. This holds7
hope for smallholders interested in improving the milk yield of their Red Sokoto dams without8
necessarily embarking on an expensive concentr ate ration. It was observed that although the9
animals on rations B and D had diets with high crude fibre (CF), ADF and NDF, the fat levels of10
their milk compositions were the least. This did not conform to the reports by Sachdeva et al.11
(1974) and Abdel-Rahman and Mehaia (1996), possibly because the diets in this study were12
not as palatable as the other diets and therefore were not consumed well enough.13
The significantly strong and positive correlations (P<0.001) between the percentages14
of milk crude protein, total solids, fat and solids -not-fat obtained in this study agree d with the15
findings of Mba et al. (1975), Akinsoyinu et al. (1982), Ehoche and Buvanendran (1983) (for fat16
and protein), Fajemisin and Mohammed (1990) (unpublished paper) and Malau-Aduli and17
Anlade (2001, 2002). The observed highly positive correlations between the milk components18
will aid genetic improvement by incorporating these traits in a selection index.19
In conclusion, goats are able to subsist and make appreciable gains even in the long dry20
seasons of the sub-humid zone of Nigeria on crop -residue based diets. This study has also21
demonstrated that ration C elicited as much favourable response in the liveweight gain, milk22
yield and composition of Red Sokoto goats as the conventional c oncentrate ration A, which23
may be too expensive for the local farmer to purchase. Furthermore, Ration C was a better24
package than Ration B and is therefore recommended at 1% level of inclusion, to small25
12
ruminant farmers due to its high intake and digestibi lity as well as its affordability than at 2%1
level of inclusion.2
Acknowledgement3
The authors gratefully acknowledge the support of the International Atomic Energy Agency4
(IAEA) Vienna, Austria , in partly funding this project through the supply of chemicals , and to5
the Director of the National Animal Production Research Institute, Ahmadu Bello University6
Shika-Zaria for permission to publish this work7
References8Abdel-Rahman, J., Mehaia, M., 1996. Influence of feeding different crude fibre levels on milk9
yield and composition of Najdi ewes. Small Rum. Res. 19, 137-141.10Adebowale, E.A., 1989. Response of West African Dwarf sheep and goats fed maize cobs treated11
with different concentrations of caustic soda. Trop. Agric. (Trinidad) 66, 213-216.12Adeneye, J.A., Oyenuga, V.A., 1976. Energy and protein requirements of West African Dwarf13
sheep: 1. Effects of feeding four levels of dietary energy to sheep. E. African Agric. J. 42, 89-97.14Adu, I.F., Buvanendran, V., Lakpini, C.A.M., 1979. The reproductive performance of Red Sokoto15
goats in Nigeria. J. Agric. Sci. (Cambridge) 93, 563-566.16Adu, I.F., Lakpini, C.A.M., 1983a. The utilisation of dried poultry as protein supplement for17
growing Yankasa sheep. J. Anim. Prod. Res. 3, 49-56.18Adu, I.F., Lakpini, C.A.M., 1983b. Effect of feeding chopped and unchopped groundnut haulms19
(“Harawa”) on nutrient utilisation and the production of rumen metabolites in Yankasa lambs.20Nigerian J. Anim. Prod. 10, 110-113.21
Ahmed, M.M.M., El Hag, F.M., Wahab, F.S. , Salih, S.F., 2001. Feeding strategies during22summer for lactating desert goats in a rain -fed area under tropical conditions. Small Rum.23Res. 39, 161-166.24
Akinsoyinu, A.O., Tewe, O.O., Ngere, L. O., Mba, A. U., 1982. Milk composition and yield of the Red25Sokoto (Maradi) goats. Dairy Sci. Abstr. 43, 83-84.26
Alawa, J.P., Umunna, N.N., 1993. Alternative feed formulation in the developing countries:27Prospects for utilisation of agro -industrial by-products. J. Anim. Prod Res. 13, 63-98.28
Alderman, G., 1985. Prediction of the energy value of compound feeds. In: Recent advances in29animal nutrition. W. Haresign and D.J.A. Cole (eds), Butterworths, London, UK.30
Alhassan, W.S., Ehoche, O.W., Adu, I.F., Obilara, T.A., Kallah, M.S., 1984. Crop residue potential31of agricultural development projects : Nutritive value and residue management. NAPRI32Annual Report, National Animal Production Research Institute, Shika, Nigeria, pp 35-45.33
AOAC 1980. Association of Official Analytical Chemists. Official Methods of Analysis, 13 th Edition,34Washington D.C., USA.35
Ehoche, O.W., Buvanendran, V., 1983. The yield and composition of milk and pre -weaning growth36rate of Red Sokoto goats in Nigeria. World Rev. Anim. Prod. 19, 19-24.37
Garmo, T.H., 1986. Dairy goat grazing on mountain pasture. I. Effect of supplementary fe eding.38 Neld. No. 2, Landbzukshwegsk 241, 1-19.39
Goering, H.K., Van Soest, P.J., 1970. Forage fibre analysis (apparatus, reagents, procedures and40some applications). Agricultural Handbook 379, ARS, USDA, Washington D.C.41

13
Ikhatua, U.I., Adu, I.F., 1984. A comparative evaluation of the utilization of groundnut haulms and1Digitaria hay by Red Sokoto goats. J. Anim. Prod. Res. 4, 145-152.2
INRA 1988. Institut National de la Recherché Agronomique. Alimentation des bovins, ovins et3caprins, INRA, Paris, France.4
Lakpini, C.A.M., Balogun, B.I., Alawa, J.P., Onifade, O.S., Otaru, S.M., 1997. Effects of graded5levels sun-dried cassava peels in supplement diets fed to Red Sokoto goats in the first6trimester of pregnancy. Anim. Feed Sci. Technol. 67, 197-204.7
Leng, R.A., 1990. Factors affecting the utilisation of poor quality forages by ruminants particularly8under tropical conditions. Nutrition Res. Rev. 3, 277-303.9
Malau-Aduli, A.E.O., Anlade, Y.R., 2001. Variations and correlations in the composition of10bovine, ovine and caprine milk. Proc. Nigerian Soc. Anim. Prod. 26, 7-9.11
Malau-Aduli, A.E.O., Anlade, Y.R., 2002. Comparative study of milk compositions of cattle, sheep12and goats in Nigeria. Animal Science J. 73, 541 -544.13
Mba, A.U., Boyo, B.S., Oyenuga, V. A., 1975. Studies on the milk composition of West African14Dwarf, Red Sokoto and Saanen goats at different stages of lactation. J. Dairy Res. 42,15217-226.16
McDonald, P., Edwards, R.A., Greenhalgh, J.F.D., 1988. Animal Nutrition (4 th Edition). Longman17Scientific and Technical, England, UK.18
Nicholson, J.W.G., 1984. Digestibility, nutritive values and intake. In: Sundstol F, Owen E (eds),19Straw and other fibrous feeds , Chapter 12, Elsevier Publishers, Amsterdam, Netherlands.20
NRC 1975. National Research Council. Nutrient re quirements of domestic animals 5 th Edition),21Nutrient requirements of sheep, NRC Washington DC, USA.22
Nuru, S., 1985. Strategies for improved production of fresh foods in Nigeria. Nigerian Institute of23Food Science and Technology, Federal Industrial Research Organisation (FIRO), Oshodi,24Lagos, Nigeria, 12pp.25
Park, Y.W., 1994. Hypo-allergic and therapeutic significance of goat milk. Small Rum. Res. 14,151-158.26Park, Y.W., Chukwu, H.I., 1989. Trace minerals and Anglo-Nubian breeds during the first five27
months of lactation. J. Food Comp. Anal . 2, 161-167.28Prakash, S., Jenness, R., 1968. The composition and characteristics of goat milk. Dairy Sci. Abstr.29
30, 67-68.30Preston, T.R., 1982. Nutritional limitations associated with the feeding of tropical forages. J. Anim. Sci.31
54, 877-884.32Ramos, N.M.M., Juarez, M., 1981. The composition of ewes’ and goats’ milk. International Dairy33
Federation Bulletin, Document 140.34
Sachdeva, K.K., Sengar, O.P.S., Singh, S.N., Lindahl, I.L., 1974. Studies on goats. 2. Effect of35plane of nutrition on milk production and composition. Milchwissenschaft 29, 471-475.36
SAS 1987. Statistical Analysis System, SAS Institute, Cary, North Carolina, USA.37Sibanda, L.M., Ndlovu, L.R. , Bryant, M.J., 1999. Effects of a low plane nutrition during pregnancy38
and lactation on the performance of Matebele does and their kids. Small Rum. Res. 32,39243-250.40
Silva, A.T., Orskov, E.R., 1988. The effect of five different supplements on the degradation of straw41in sheep given untreated barley straw. Anim. Feed Sci. Technol. 19, 289-298.42
Swan, H, Lamming, G.E., 1967. Studies on the nutrition of ruminants: II. The effect of crude fibre43in maize-based rations on the carcass composition of Friesian steers. Anim. Prod. 9, 203-208.44
Van der Horst, R.L., 1976. Foods of infants allergic to cow milk. South African Med. J. 5, 927-932.4546
14
123456789101112131415161718192021222324252627282930313233343536373839404142434445
Table 1. Component ingredients in the different rations4647
Ration Ingredients % inclusion Remarks
15
1A + Basal diet MaizeWheat offalCottonseed cakeBone mealSalt
40352032
Positive control(conventional concentrate)offered at 1% of bodyweight
2A + Basal diet
Positive control(conventional concentrate)offered at 2% of bodyweight
1B + Basal diet Guinea-corn branCowpea huskG/Nut haulmsSalt
39.530300.5
Test Ration 1 offered at 1%of body weight
2B + Basal diet
Test Ration 1 offered at 2%of body weight
1C + Basal diet Maize offalG/Nut shellsG/Nut haulmsSalt
49.520300.5
Test Ration 2 offered at 1%of body weight
2C + Basal diet
Test Ration 2 offered at 2%of body weight
D(Basal Diet)
Digitaria hay and dryseason-naturally grazedpasture
Ad libitum Negative control(unsupplemented)
1
2
3
4
5
6
7
8
9
10
11
12
13
Table 2. Chemical composition of the major feed ingredients (DM basis) (%)1415
16
Feedstuff DM CP CF Ash EE NFE
Maize 90.73 9.56 2.20 9.67 4.05 74.52
Wheat offal 87.60 16.90 11.30 6.40 3.80 61.60
Cottonseed cake 93.60 29.94 23.50 5.16 5.76 35.64
Bone meal 75.00 36.00 3.00 49.00 4.00 8.00
Guinea corn bran 93.33 7.60 24.80 6.95 3.01 59.90
Cowpea husks 91.41 7.10 33.40 7.14 0.65 58.91
Groundnut haulms 93.65 15.63 23.26 8.0 2.43 51.0
Maize offal 89.07 10.08 1.5 0.8 1.7 60.30
Groundnut shells 96.05 5.90 31.8 8.5 1.31 50.3
1
2
3
4
5
6
7
8
9
10
11
12
13
14Table 3. Chemical composition of the exper imental diets (dry matter basis) (%)15
16
17
Ration DM CP Ash EE ADF NDF LIGNIN
Ration A 93.87 17.19 13.85 14.08 20.00 40.01 4.64
Ration B 94.97 9.54 10.55 10.43 38.10 68.42 8.94
Ration C 95.94 10.38 11.97 12.45 36.65 54.74 8.23
Ration D (Hay) 94.78 4.75 8.47 2.40 49.14 74.73 9.49
Ration D (dry seasonnaturally grazed pastures)
96.26 2.76 7.02 0.78 50.29 80.27 11.5
Calculated analysis of the experimental rations1
Ration A Ration B Ration C
CP (%) 17.05 9.82 10.85
ME (MJ /kg DM) 11.17 10.29 10.17
The ME values of the experimental rations were calculated as per Alderman (1985) :2ME (MJ/kg DM) = 11.78 + 0.00654CP + (0.000665EE) 2 – CF(0.00414EE) – 0.0118A3where CP = Crude Protein, EE = Ether Extract, CF = Crude Fibre, A = Ash4
5
6
7
8
9
10
11
12
13
14
15
16
Table 4. Mean nutrient intake, apparent digestibility coefficients and cost of the experimental17diets18
18
1Ration 1A 2A 1B 2B 1C 2C D SEM
Nutrient intake (kg/day)
DMI 0.24b 0.47a 0.21bc 0.30ab 0.23b 0.42a 0.15c 0.02
CPI 0.044a 0.087a 0.012b 0.017b 0.032a 0.072a 0.009b 0.01
Apparent digestibility of nutrients (%)
DM 84.3a 83.0a 62.5d 60.5e 75.8b 67.8c 56.4f 2.84
CP 90.6a 89.2a 69.5d 65.5e 82.7b 78.1c 48.4f 3.07
NDF 69.5a 66.6b 62.1cd 61.9d 65.9b 63.7c 60.1e 3.23
ADF 51.7a 49.8a 43.9bc 42.8c 46.1b 44.4bc 42.3bc 5.01
Economic analysis of the feeds (Naira) *
Cost of feedconsumedper animalper day
2.19b 4.42a 0.50e 1.06d 0.83de 1.55c - 0.15
a,b,c,d,e,f means within the same row bearing different superscript letters differ significantly (P<0 .05)2Naira = Nigerian currency (100 kobo make 1 naira and current exchange rate is 1US$ = 140 Naira)3
4
5
6
7
8
9
10
11
12
13
14
15
Table 5. Effect of ration supplementation on weight gains of Red Sokoto does ( s.e.m)1617

19
Ration Initial WT (Kg) Final weight (Kg) WT gain (Kg) ADG (g/day)
1A 29.00 29.25a 0.25d 3.57d
2A 27.50 29.00a 1.50b 21.43b
1B 29.75 27.75b -2.00e -28.57e
2B 28.75 29.75a 1.00c 14.28c
1C 27.25 28.75b 1.50b 21.43b
2C 26.75 29.50a 2.75a 39.29a
D 27.25 20.75c -6.5f -92.86f
s.e.m 4.25 4.30 0.12 1.82
Column means bearing different superscripts differ from each other significantly (P<0.01)123456789101112131415161718192021
22Table 6. Effect of ration supplementation on lactation length, total milk yield and average23
daily milk yield ( s.e.m.) in Red Sokoto does24

20
1Ration Lactation Length (days) Total Milk Yield (Kg) Ave. Daily Yield (Kg)1A 80a 38.4b 0.48b
2A 88a 54.5a 0.62a
1B 48c 12.9d 0.27d
2B 64b 23.0c 0.36c
1C 90a 54.0a 0.60a
2C 72b 35.5b 0.45b
D 41c 10.2d 0.25d
s.e.m. 4.7 3.3 0.03Column means bearing different superscripts are significantly different (P<0.05)2
34
5
6
7
8
9
10
11
12
13
14
15
16
17
18
19
2021
Table 7. Effect of ration supplementation on the milk composition of Red Sokoto22does (%) ( s.e.m.)23

21
1Ration Fat Protein SNF Total solids Ash1A 5.66a 6.00a 15.75a 21.41a 0.812A 6.00a 6.33a 15.85a 21.85a 0.831B 3.50d 3.67b 10.75c 14.25c 0.762B 3.75d 4.90b 13.75b 17.50b 0.791C 4.33c 6.00a 15.66a 19.99a 0.802C 5.25b 6.67a 16.00a 21.25a 0.82D 2.33e 3.25c 10.00c 12.33c 0.75 s.e.m. 0.7 0.8 1.3 1.8 0.05Column means bearing different superscripts are significantly different (P<0.05)2
3
4