Sokoto State Education Accounts Report Public Sector Subaccount Academic Years: 2015 / 2016 & 2016 / 2017 DISCLAIMER This document was produced for review by the United States Agency for International Development. It was prepared by Creative Associates International.

Welcome message from author
This document is posted to help you gain knowledge. Please leave a comment to let me know what you think about it! Share it to your friends and learn new things together.
Transcript
Sokoto State Education Accounts Report Public Sector Subaccount Academic Years: 2015 / 2016 & 2016 / 2017
DISCLAIMER
This document was produced for review by the United States Agency for International Development. It was prepared by Creative Associates International.
Sokoto State Education Accounts 2015/16 & 2016/17 Report ii
Sokoto State Education Accounts - Public Sector Subaccount
Academic Years: 2015/16 & 2016/17
Submission Date: January 17, 2019 Prepared by: Sokoto State Ministry of Basic and Secondary Education In Collaboration with: Nigeria Northern Education Initiative Program (The Initiative) Creative Associates International: 5301 Wisconsin Ave, NW, Suite 700, Washington DC, 20015, USA. Tel: 202-966-5804 With support from: United States Agency for International Development, Nigeria Submitted by: The Northern Education Initiative Plus 38 Mike Akhigbe Street, Jabi, Abuja, Nigeria Contract Number: AID-620-C-15-00002 October 26, 2015 – October 25, 2020 COR: Olawale Samuel
Sokoto State Education Accounts 2015/16 & 2016/17 Report iii
List of Authors Prepared by the State Working Group, under guidance of the Steering Committee, and with support from the Technical Assistance (TA) team. See list below: Prepared with support from TA team: Creative Associates International (The Initiative Project):
• Prof. Olakunle Frank Odumosu • Dr. Deepika Chawla • Dr. Adebayo Ajala • Abba Wali Abdullahi
Prepared by the Sokoto SEA IV (Public sector subaccount) State Working Group: SWG ORGANIZATION Umar Ahmad Sokoto Ministry of Basic and Secondary Education Muhammad Shamsudeen Sambo Ministry of Basic and Secondary Education Sani Abdullahi Tureta Ministry of Basic and Secondary Education Abubakar Muhammad Alkammu Ministry of Basic and Secondary Education Mamuda Galadima State Universal Basic Education Board Umaru Mohammad Yabo State Universal Basic Education Board Mustapha Haliru State Universal Basic Education Board Abdullahi Adamu State Universal Basic Education Board Aminu Arzika Bodinga Ministry of Finance Sharu Modi Dogondaji Ministry of Finance Mairo Ismail Universal Basic Education Commission, Sokoto Muhammad Chika Saidu Teachers Service Board Sulaiman Dikko State Library Board Ibrahim Ahmad Ministry of Women Affairs and Child Development Kabiru Magayaki Ministry for Local Govt and Community Development Bilyaminu Yakubu Abubakar CSACEFA Attahiru A Jigara Ministry of Science and Technology Umar B Sa’ad Ministry of Budget and Economic Planning Ibrahim Salisu Katuru Arabic and Islamic Education Board Umar Abubakar Imam Shehu Shagari College of Education Abubakar Shehu Sokoto State Agency for Nomadic Education Abdulkadir Malami Sokoto State Agency for Mass Education Zayyanu Bello Sifawa Ministry for Higher Education Bashiru Garba, Dr. Usmanu Danfodio University Murtala Bawa Shehu Shagari College of Education Abubakar Shehu Yabo Ministry of Health Wadata A. Shuaibu State Scholarship Board Muhammad D. Umar Nahantsi Chairman, Education Secretaries Forum Baba Abu Abdullahi Reading Association of Nigeria Fatima B. Attahiru FOMWAN Umar Muhammad The Initiative, Sokoto
Sokoto State Education Accounts 2015/16 & 2016/17 Report iv
Under Guidance of Sokoto State Basic Education Steering Committee Hon. Commissioner, Ministry of Basic and Secondary Education Permanent Secretary, Ministry of Basic and Secondary Education Chairman, House Committee on Education, State House of Assembly Hon. Commissioner, Ministry of Budget and Economic Planning Hon. Commissioner, Ministry of Women and Children Affairs Hon. Commissioner, Ministry of Finance Hon. Commissioner, Ministry of Information Hon. Commissioner, Ministry of Religious Affairs Hon. Commissioner, Ministry for Local Government and Community Development Hon. Commissioner, Ministry of Science and Technology Hon. Commissioner, Ministry for Higher Education SA to Governor, State Agency for Mass Education Executive Chairman, State Universal Basic Education Board Secretary, State Universal Basic Education Board DPRS, State Universal Basic Education Board Chairman TWG MEAR, State Universal Basic Education Board Provost, Shehu Shagari College of Education Chairman, Education Secretaries Forum State Chairman, Private Schools Proprietors Sarkin Yakin Gagi, Sultanate Council Executive Director, State Agency for Nomadic Education Special Advisor, Female Education Board Program Director, Agency for Mass Education State Project Coordinator, Nigeria Partnership for Education Project (NIPEP) The Initiative State Team Leader, Co-Secretary
Sokoto State Education Accounts 2015/16 & 2016/17 Report v
Foreword State Education Account (SEA) is a tool that collects and provides information on the expenditure on education in its totality within a given period of time. It is a tool through which the state could measure its expenditure on education and prioritize depending on the needs of a given sector. The current Sokoto State Education Account (SOKSEA) survey reports on the public sector expenditure in education within the 2015/16 and 2016/17 Academic Session. Thus, the survey covered two (2) academic sessions and three (3) financial years, September 2015 to August 2017. The survey on the SOKSEA collected information on the public expenditure only at all levels of formal and non-formal education sector. It addressed areas such as financing education, kind of institutions being financed, type of services being financed and the beneficiaries. The State Education Account (SEA) analysis, I strongly feel, is a very important tool for the successful delivery of education, bearing in mind the fact that it assists in guiding policy formulation, resource allocation, identification of financing mechanism, resource utilization, among others. This is what informed the decision of the Ministry to undertake the conduct of another analysis for the fourth time with a view to identifying the State Government’s financial commitments in education in the state within the given period. The SOKSEA development passed through a number of challenges that include non-availability of some vital information especially from some non-state institutions serving within the state. This slowed the production of the report to a large extent. However, the process still went ahead and took some time to complete. The report developed has given a fairly accurate and reliable analysis of the flow of funds from financing sources to agents, providers and uses. The effort of International Consultants from the Creative Associates, National Consultants from the Association for Education Development Options (AEDO) as well as the Government Partners involved in the development of the report is highly commended and appreciated. This SOKSEA survey report is divided into five chapters as follows: 1. Chapter One briefly introduced the justification for a State Education Accounts. 2. Chapter Two examines the context of the educational system in Nigeria as well as the need for the conduct of the survey in Sokoto State. It focuses attention on understanding the Nigerian Education System providing an overview of the formal education system (public) at national and state levels. It further provides an insight into the education financing and priorities in Sokoto State. 3. Chapter Three enumerates the SOKSEA survey methodology which covers the objectives and goals of the project, strategies adopted in organizing and conducting the study. It provides information on data sources, boundaries and classifications as well as methods used in the data collection and analysis. 4. Chapter Four provides information on financing education and flow of funds in Sokoto State. Highlights on the state effort on education taking into consideration sources of funds for financing education, flow of the funds from source to financing agents, providers and uses are provided. 5. Chapter Five includes an analysis of financing effort for formal education in Sokoto State. It includes an account of the average expenditure per child at all levels of education in Sokoto State and an analysis of gender expenditure on education in the State. It examines the aspect of access, quality and effectiveness of education delivery in the state and provides a comparison of the expenditures on education in Sokoto State with the expenditures at the
Sokoto State Education Accounts 2015/16 & 2016/17 Report vi
national level. 6. Chapter Six concludes with a summary of findings and recommendations. Considering the effort in bringing out state commitment in the delivery of education and the content, scope and in-depth analysis of the report, I feel obliged to recommend it to every stakeholder in the education sector. The document is very useful for education Policy Makers, Administrators, Development Partners, NGOs and Research Institutions among others. It is my hope that the report will serve as a reliable reference material for researchers. Finally, the Ministry of Basic and Secondary Education, Sokoto highly appreciates the support from the USAID through the Northern Education Initiative (NEI) Plus for the survey and the development of the report. Professor Aisha Madawaki Isah, MFR Honorable Commissioner Ministry of Basic and Secondary Education Sokoto State Nigeria
Sokoto State Education Accounts 2015/16 & 2016/17 Report vii
Acknowledgements The development of the fourth Sokoto State Education Account (SOKSEA) Survey Report for 2015/16 and 2016/17 sessions was tasking and time consuming but less cumbersome than the previous three indicating improvements in the process. However, with the support and contributions from a number of organizations and individuals, it became a reality. The Sokoto State Working Group (SWG) on SOKSEA would like to seize this opportunity to acknowledge the valuable contributions made by those who contributed towards the successful completion of the exercise and the compilation of the report. I would like, on behalf of the State Working Group, to seize this opportunity to express the Group’s profound appreciation to the Ministry of Basic and Secondary Education for providing both enabling environment and financial support that complemented the efforts of the Initiative. We are equally appreciative to the United States Agency for International Development (USAID) through the Nigeria Northern Education Initiative (NEI) Plus, the principal initiators of the project, as well as the staff of the Creative Associates International for their insight, concern and professional commitment to the project. We would like to acknowledge the efforts of NEI Plus staff, especially Musa Salami, Dr. Saheed Salawu, Attahiru Muhammad Ahmad and Umar Muhammad, for facilitating this exercise. The Group is particularly grateful to Dr. Deepika Chawla from Creative Associates who has demonstrated outstanding concern and professionalism towards the successful completion of this project. The Nigerian Technical Assistance Team (TAT) comprising Prof. Olakunle Frank Odumosu, Dr. Adebayo Ajala and Alhaji Abba Wali Abdullahi deserve mention for steering the working group, brilliantly. This work would not have been possible without the total cooperation of the staff of the various ministries and agencies that conducted the study. These officers constituted the State Working Group (SWG) that actually conducted the surveys. The level of commitment and zeal demonstrated by the members of the SWG is deeply appreciated. In particular, the contributions of the core SWG are exceptionally noted due to the various technical insights they provided on data integrity and focus which conferred higher reliability on the data collected. Mamuda Galadima Chairman SOKSEA SWG
Sokoto State Education Accounts 2015/16 & 2016/17 Report viii
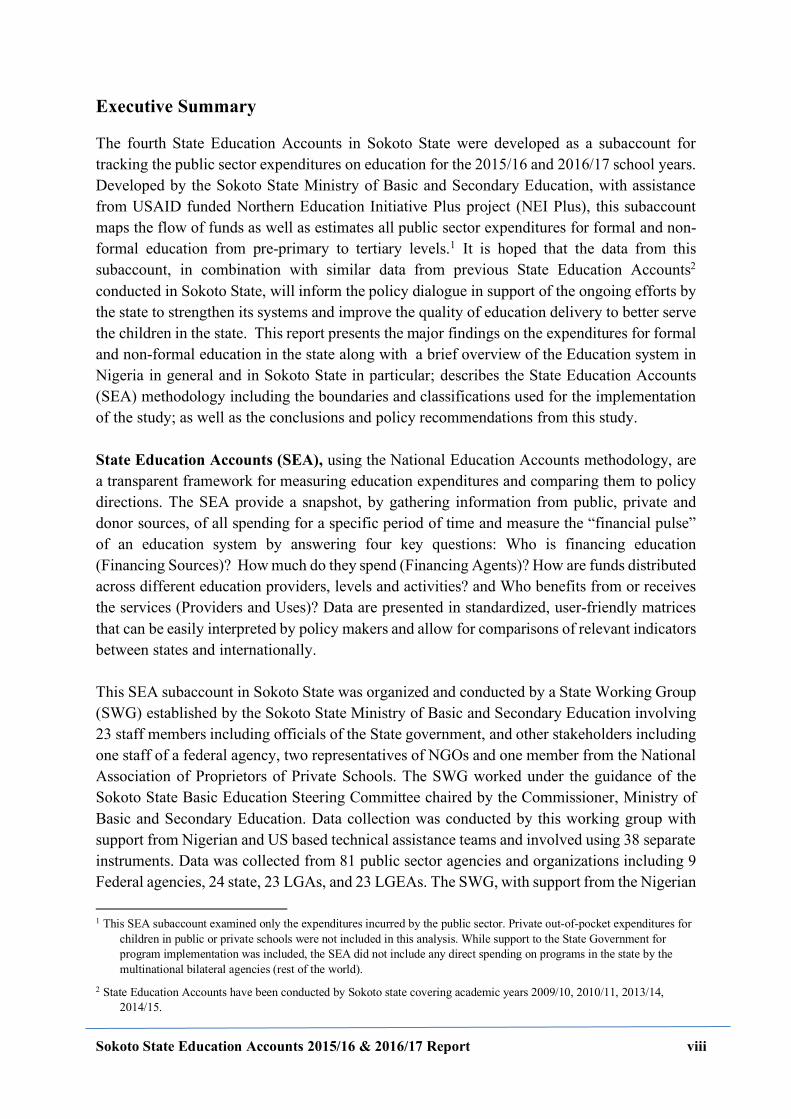
Executive Summary The fourth State Education Accounts in Sokoto State were developed as a subaccount for tracking the public sector expenditures on education for the 2015/16 and 2016/17 school years. Developed by the Sokoto State Ministry of Basic and Secondary Education, with assistance from USAID funded Northern Education Initiative Plus project (NEI Plus), this subaccount maps the flow of funds as well as estimates all public sector expenditures for formal and non-formal education from pre-primary to tertiary levels.1 It is hoped that the data from this subaccount, in combination with similar data from previous State Education Accounts2 conducted in Sokoto State, will inform the policy dialogue in support of the ongoing efforts by the state to strengthen its systems and improve the quality of education delivery to better serve the children in the state. This report presents the major findings on the expenditures for formal and non-formal education in the state along with a brief overview of the Education system in Nigeria in general and in Sokoto State in particular; describes the State Education Accounts (SEA) methodology including the boundaries and classifications used for the implementation of the study; as well as the conclusions and policy recommendations from this study. State Education Accounts (SEA), using the National Education Accounts methodology, are a transparent framework for measuring education expenditures and comparing them to policy directions. The SEA provide a snapshot, by gathering information from public, private and donor sources, of all spending for a specific period of time and measure the “financial pulse” of an education system by answering four key questions: Who is financing education (Financing Sources)? How much do they spend (Financing Agents)? How are funds distributed across different education providers, levels and activities? and Who benefits from or receives the services (Providers and Uses)? Data are presented in standardized, user-friendly matrices that can be easily interpreted by policy makers and allow for comparisons of relevant indicators between states and internationally. This SEA subaccount in Sokoto State was organized and conducted by a State Working Group (SWG) established by the Sokoto State Ministry of Basic and Secondary Education involving 23 staff members including officials of the State government, and other stakeholders including one staff of a federal agency, two representatives of NGOs and one member from the National Association of Proprietors of Private Schools. The SWG worked under the guidance of the Sokoto State Basic Education Steering Committee chaired by the Commissioner, Ministry of Basic and Secondary Education. Data collection was conducted by this working group with support from Nigerian and US based technical assistance teams and involved using 38 separate instruments. Data was collected from 81 public sector agencies and organizations including 9 Federal agencies, 24 state, 23 LGAs, and 23 LGEAs. The SWG, with support from the Nigerian 1 This SEA subaccount examined only the expenditures incurred by the public sector. Private out-of-pocket expenditures for
children in public or private schools were not included in this analysis. While support to the State Government for program implementation was included, the SEA did not include any direct spending on programs in the state by the multinational bilateral agencies (rest of the world).
2 State Education Accounts have been conducted by Sokoto state covering academic years 2009/10, 2010/11, 2013/14, 2014/15.
Sokoto State Education Accounts 2015/16 & 2016/17 Report ix
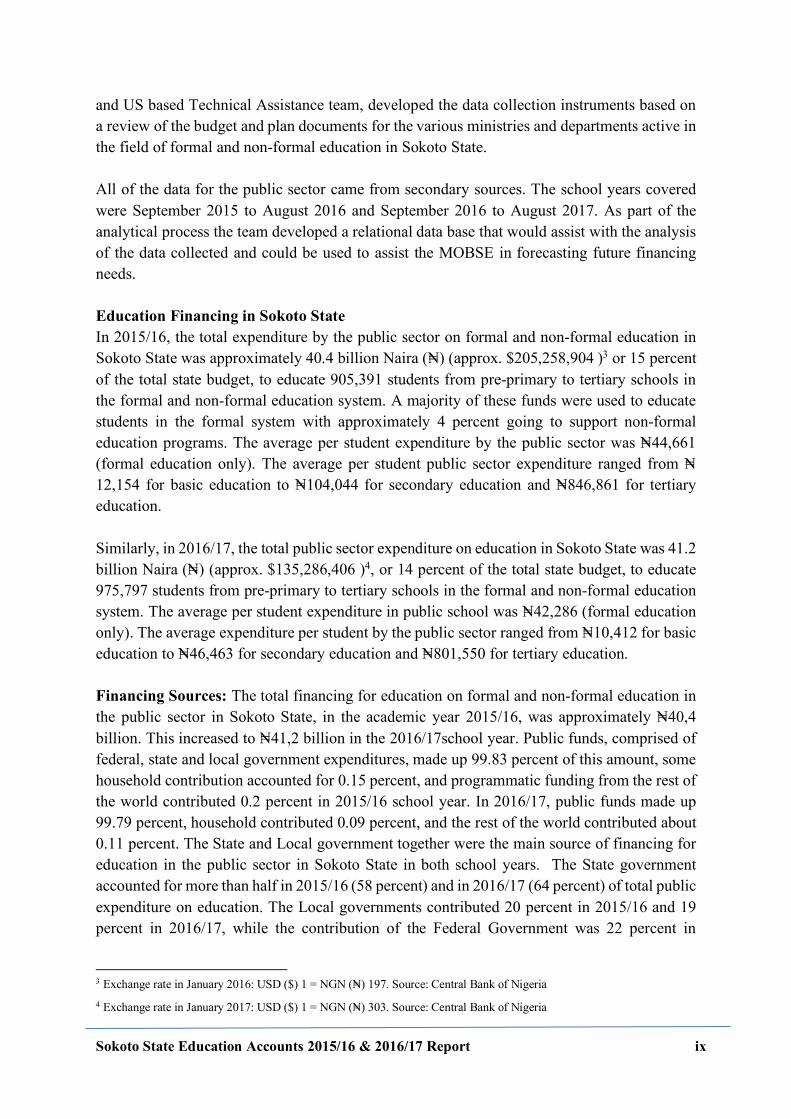
and US based Technical Assistance team, developed the data collection instruments based on a review of the budget and plan documents for the various ministries and departments active in the field of formal and non-formal education in Sokoto State. All of the data for the public sector came from secondary sources. The school years covered were September 2015 to August 2016 and September 2016 to August 2017. As part of the analytical process the team developed a relational data base that would assist with the analysis of the data collected and could be used to assist the MOBSE in forecasting future financing needs. Education Financing in Sokoto State In 2015/16, the total expenditure by the public sector on formal and non-formal education in Sokoto State was approximately 40.4 billion Naira (N=) (approx. $205,258,904 )3 or 15 percent of the total state budget, to educate 905,391 students from pre-primary to tertiary schools in the formal and non-formal education system. A majority of these funds were used to educate students in the formal system with approximately 4 percent going to support non-formal education programs. The average per student expenditure by the public sector was N=44,661 (formal education only). The average per student public sector expenditure ranged from N=12,154 for basic education to N=104,044 for secondary education and N=846,861 for tertiary education. Similarly, in 2016/17, the total public sector expenditure on education in Sokoto State was 41.2 billion Naira (N=) (approx. $135,286,406 )4, or 14 percent of the total state budget, to educate 975,797 students from pre-primary to tertiary schools in the formal and non-formal education system. The average per student expenditure in public school was N=42,286 (formal education only). The average expenditure per student by the public sector ranged from N=10,412 for basic education to N=46,463 for secondary education and N=801,550 for tertiary education. Financing Sources: The total financing for education on formal and non-formal education in the public sector in Sokoto State, in the academic year 2015/16, was approximately N=40,4 billion. This increased to N=41,2 billion in the 2016/17school year. Public funds, comprised of federal, state and local government expenditures, made up 99.83 percent of this amount, some household contribution accounted for 0.15 percent, and programmatic funding from the rest of the world contributed 0.2 percent in 2015/16 school year. In 2016/17, public funds made up 99.79 percent, household contributed 0.09 percent, and the rest of the world contributed about 0.11 percent. The State and Local government together were the main source of financing for education in the public sector in Sokoto State in both school years. The State government accounted for more than half in 2015/16 (58 percent) and in 2016/17 (64 percent) of total public expenditure on education. The Local governments contributed 20 percent in 2015/16 and 19 percent in 2016/17, while the contribution of the Federal Government was 22 percent in
3 Exchange rate in January 2016: USD ($) 1 = NGN (N=) 197. Source: Central Bank of Nigeria 4 Exchange rate in January 2017: USD ($) 1 = NGN (N=) 303. Source: Central Bank of Nigeria
Sokoto State Education Accounts 2015/16 & 2016/17 Report x
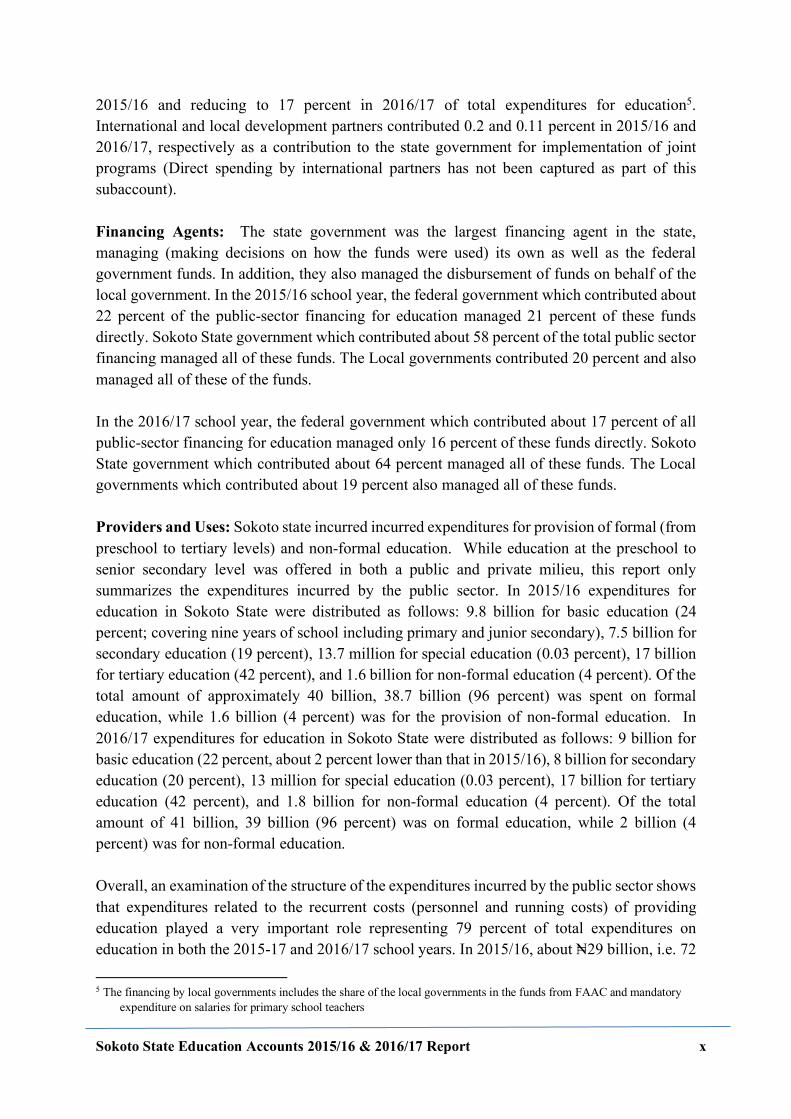
2015/16 and reducing to 17 percent in 2016/17 of total expenditures for education5. International and local development partners contributed 0.2 and 0.11 percent in 2015/16 and 2016/17, respectively as a contribution to the state government for implementation of joint programs (Direct spending by international partners has not been captured as part of this subaccount). Financing Agents: The state government was the largest financing agent in the state, managing (making decisions on how the funds were used) its own as well as the federal government funds. In addition, they also managed the disbursement of funds on behalf of the local government. In the 2015/16 school year, the federal government which contributed about 22 percent of the public-sector financing for education managed 21 percent of these funds directly. Sokoto State government which contributed about 58 percent of the total public sector financing managed all of these funds. The Local governments contributed 20 percent and also managed all of these of the funds. In the 2016/17 school year, the federal government which contributed about 17 percent of all public-sector financing for education managed only 16 percent of these funds directly. Sokoto State government which contributed about 64 percent managed all of these funds. The Local governments which contributed about 19 percent also managed all of these funds. Providers and Uses: Sokoto state incurred incurred expenditures for provision of formal (from preschool to tertiary levels) and non-formal education. While education at the preschool to senior secondary level was offered in both a public and private milieu, this report only summarizes the expenditures incurred by the public sector. In 2015/16 expenditures for education in Sokoto State were distributed as follows: 9.8 billion for basic education (24 percent; covering nine years of school including primary and junior secondary), 7.5 billion for secondary education (19 percent), 13.7 million for special education (0.03 percent), 17 billion for tertiary education (42 percent), and 1.6 billion for non-formal education (4 percent). Of the total amount of approximately 40 billion, 38.7 billion (96 percent) was spent on formal education, while 1.6 billion (4 percent) was for the provision of non-formal education. In 2016/17 expenditures for education in Sokoto State were distributed as follows: 9 billion for basic education (22 percent, about 2 percent lower than that in 2015/16), 8 billion for secondary education (20 percent), 13 million for special education (0.03 percent), 17 billion for tertiary education (42 percent), and 1.8 billion for non-formal education (4 percent). Of the total amount of 41 billion, 39 billion (96 percent) was on formal education, while 2 billion (4 percent) was for non-formal education. Overall, an examination of the structure of the expenditures incurred by the public sector shows that expenditures related to the recurrent costs (personnel and running costs) of providing education played a very important role representing 79 percent of total expenditures on education in both the 2015-17 and 2016/17 school years. In 2015/16, about N=29 billion, i.e. 72
5 The financing by local governments includes the share of the local governments in the funds from FAAC and mandatory
expenditure on salaries for primary school teachers
Sokoto State Education Accounts 2015/16 & 2016/17 Report xi
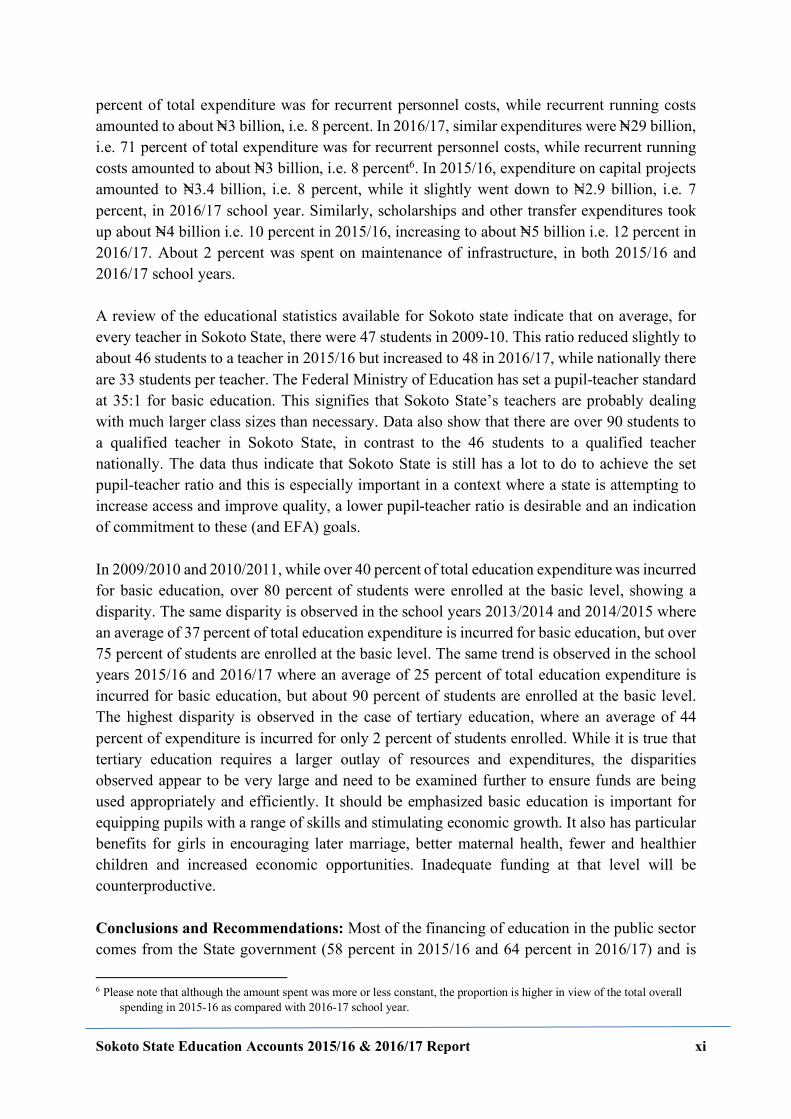
percent of total expenditure was for recurrent personnel costs, while recurrent running costs amounted to about N=3 billion, i.e. 8 percent. In 2016/17, similar expenditures were N=29 billion, i.e. 71 percent of total expenditure was for recurrent personnel costs, while recurrent running costs amounted to about N=3 billion, i.e. 8 percent6. In 2015/16, expenditure on capital projects amounted to N=3.4 billion, i.e. 8 percent, while it slightly went down to N=2.9 billion, i.e. 7 percent, in 2016/17 school year. Similarly, scholarships and other transfer expenditures took up about N=4 billion i.e. 10 percent in 2015/16, increasing to about N=5 billion i.e. 12 percent in 2016/17. About 2 percent was spent on maintenance of infrastructure, in both 2015/16 and 2016/17 school years. A review of the educational statistics available for Sokoto state indicate that on average, for every teacher in Sokoto State, there were 47 students in 2009-10. This ratio reduced slightly to about 46 students to a teacher in 2015/16 but increased to 48 in 2016/17, while nationally there are 33 students per teacher. The Federal Ministry of Education has set a pupil-teacher standard at 35:1 for basic education. This signifies that Sokoto State’s teachers are probably dealing with much larger class sizes than necessary. Data also show that there are over 90 students to a qualified teacher in Sokoto State, in contrast to the 46 students to a qualified teacher nationally. The data thus indicate that Sokoto State is still has a lot to do to achieve the set pupil-teacher ratio and this is especially important in a context where a state is attempting to increase access and improve quality, a lower pupil-teacher ratio is desirable and an indication of commitment to these (and EFA) goals. In 2009/2010 and 2010/2011, while over 40 percent of total education expenditure was incurred for basic education, over 80 percent of students were enrolled at the basic level, showing a disparity. The same disparity is observed in the school years 2013/2014 and 2014/2015 where an average of 37 percent of total education expenditure is incurred for basic education, but over 75 percent of students are enrolled at the basic level. The same trend is observed in the school years 2015/16 and 2016/17 where an average of 25 percent of total education expenditure is incurred for basic education, but about 90 percent of students are enrolled at the basic level. The highest disparity is observed in the case of tertiary education, where an average of 44 percent of expenditure is incurred for only 2 percent of students enrolled. While it is true that tertiary education requires a larger outlay of resources and expenditures, the disparities observed appear to be very large and need to be examined further to ensure funds are being used appropriately and efficiently. It should be emphasized basic education is important for equipping pupils with a range of skills and stimulating economic growth. It also has particular benefits for girls in encouraging later marriage, better maternal health, fewer and healthier children and increased economic opportunities. Inadequate funding at that level will be counterproductive. Conclusions and Recommendations: Most of the financing of education in the public sector comes from the State government (58 percent in 2015/16 and 64 percent in 2016/17) and is
6 Please note that although the amount spent was more or less constant, the proportion is higher in view of the total overall
spending in 2015-16 as compared with 2016-17 school year.
Sokoto State Education Accounts 2015/16 & 2016/17 Report xii
used to support formal education with a very small proportion (about 4 percent in both school years) used to finance non-formal education programs. The State government as the financing agent for the largest share of public sector financing (59 percent in 2015/16 and 64 percent in 2016/17), manages the funds and drives the policy for use of these funds in the state. The Sokoto State expended 15 percent of their total budget on education during School Year 2015/16 and 13.5 percent in 2016/1. However, the amount of spending on education in Sokoto state has gone down as compared with 2009/10 school year when the state was spending 26 percent of its budget on education. Though still far from the UNESCO standard of 26 percent of the budget committed to education, the state government is spending a significant amount on education indicating the State government’s commitment to education. An examination of the breakdown of expenditures indicates that they are in line with the state efforts to meet the goals of universal access and high quality of education. In both school years examined, the state government spent over 95 percent of available funds on the provision of formal education with a small proportion (about 4 percent) going towards non-formal education. Within the formal education, the largest recipient category (from all sources) was basic education, with secondary and tertiary levels competing for the next position. However, given the large number of students enrolled at the basic education level (90 percent), especially in the lower grades (primary school level), this level of education is underfunded (with only 25 percent of total funding) and overstressed (with pupil teacher ratios of 46:1; 90:1 for every qualified teacher ) to the point where it cannot provide quality education for all enabling the state to meet its EFA goals. The gender parity index of 0.63 also indicates that female students are not in school, indicating a need for further improvement in access and participation of this group. Even after recognizing that provision of tertiary education is more expensive than the provision of basic education, there is still a need to re-examine the distribution of expenditures in light of the proportion of students enrolled at each level of education. Data on public sector expenditures obtained through the SEA can be used to support a review of the state policies to ensure that the expenditures are in line with the stated policies of the state. For instance, as is evident from the data, there is a need in Sokoto state to focus on improving the gender parity, reducing the teacher pupil ratio, improving teacher quality through increased spending on teacher training, etc. Future Conduct of SEA – Some Thoughts As with SEA III, the process of preparing the SEA subaccount was very inclusive involving personnel not only from the Sokoto State Ministry of Basic and Secondary Education and the State Universal Basic Education Board (SUBEB) but also significant stakeholders. The stakeholders included the President of the National Association of Proprietors of Private Schools (NAPPS), the Commissioner of the Ministry of Local Government Affairs as well as representatives from parastatal organizations. The involvement of all these people assured the SEA Working Group (SWG) of access to data as well as a profound understanding of that data. Because of this involvement of stakeholders, the team was better able to collect data and
Sokoto State Education Accounts 2015/16 & 2016/17 Report xiii
include expenditures that had not been picked up in other studies. The Sokoto SWG observe that they were able to utilize past learning to facilitate their data collection, which explains why there was a better performance under SEA IV subaccount. It was noted with satisfaction the participation of the State and LGC Computer staff as another strategy that ensured the success of the team and is a step towards institutionalization of the SEA. The SWG thus express confidence on the reliability and validity of the data collected. However, a few challenges were also noted in terms of availability of data and the detail at which the records are maintained. The team recommends that future SEAs be conducted annually and be made a part of the expenditure reconciliation process of the government. It is also recommended that, at the Ministry level, the data be made more easily available and at greater levels of granularity. A simultaneous effort should also be made to support and strengthen the collection of more complete data on school statistics. This will allow for tracking of progress towards the current goals and priorities of the state government and provide an opportunity to collect data to inform policy decisions on issues of special interest.
Sokoto State Education Accounts 2015/16 & 2016/17 Report xiv
Sokoto State Education Accounts – Public Sector Subaccount Table of Contents FOREWORD ................................................................................................................................................ V
ACKNOWLEDGEMENTS ....................................................................................................................... VII
EXECUTIVE SUMMARY ....................................................................................................................... VIII
TABLE OF CONTENTS .......................................................................................................................... XIV
LIST OF TABLES ........................................................................................................................................ XVI LIST OF FIGURES ...................................................................................................................................... XVII
1 INTRODUCTION ................................................................................................................................. 1
2 NIGERIAN EDUCATION SYSTEM – AN OVERVIEW .................................................................... 2
2.1 EDUCATION SYSTEM IN NIGERIA – A BRIEF DESCRIPTION ................................................................... 3 2.2 EDUCATION FINANCING IN NIGERIA ................................................................................................. 4 2.3 SOKOTO STATE EDUCATION SYSTEM AND ITS FINANCING - BRIEF DESCRIPTION................................. 5
2.3.1 Education System in Sokoto State – some numbers ....................................................................... 6
3 STATE EDUCATION ACCOUNTS METHODOLOGY .................................................................... 9
3.1 NATIONAL EDUCATION ACCOUNTS .................................................................................................. 9 3.2 STATE EDUCATION ACCOUNTS ....................................................................................................... 11 3.3 BOUNDARIES AND CLASSIFICATIONS FOR SEA- PUBLIC SECTOR SUBACCOUNT IN SOKOTO STATE .... 12
3.3.1 Education Expenditures............................................................................................................. 12 3.3.2 Education Boundaries and Definitions in Sokoto State ............................................................... 13
3.4 CONDUCTING SEA IV PUBLIC SECTOR SUBACCOUNT IN SOKOTO STATE.......................................... 15 3.4.1 Identification of a Working Group and the Steering Committee .................................................. 16 3.4.2 Sources of Data ......................................................................................................................... 16 3.4.3 Data Collection ......................................................................................................................... 16 3.4.4 Data Quality Process ................................................................................................................ 17 3.4.5 Data Analysis ............................................................................................................................ 18
4 FINANCING OF EDUCATION AND FLOW OF FUNDS IN SOKOTO STATE ............................ 20
4.1 SOKOTO STATE EFFORT FOR EDUCATION ........................................................................................ 20 4.2 SOURCES OF FINANCING FOR EDUCATION ....................................................................................... 21
4.2.1 Distribution of Sources of Financing ......................................................................................... 21 4.2.2 Sources of Financing by Type .................................................................................................... 22
4.2.2.1 Distribution of Federal Sources of Financing .................................................................................... 25 4.3 FLOW OF FUNDS FROM SOURCES OF FINANCING TO FINANCING AGENTS .......................................... 27 4.4 FLOW OF FUNDS FROM FINANCING AGENTS TO EDUCATION PROVIDERS .......................................... 33
4.4.1 Financing Agent to Education Providers in Public Schools ........................................................ 33 4.4.1.1 Financing Agent to Education Providers by Level of Education ......................................................... 33 4.4.1.2 Financing Agents to Education Providers by Location (Rural/Urban)................................................. 39 4.4.1.3 Financing Agents to Education Providers by Type of School (Religious or Secular) ........................... 39
4.4.2 Flow of Funds from Education Providers to Uses ...................................................................... 39
5 SECTORAL ANALYSIS..................................................................................................................... 44
5.1 SIGNIFICANCE OF EXPENDITURES .................................................................................................... 44 5.1.1 Average Expenditure per Pupil .................................................................................................. 45
5.2 TEACHER TRAINING ....................................................................................................................... 46 5.3 ACCESS ......................................................................................................................................... 47 5.4 GENDER ANALYSIS ........................................................................................................................ 47 5.5 EXPENDITURE ON EDUCATION BY SCHOOL TYPE IN SOKOTO STATE ................................................. 48 5.6 COMPARISON OF SOKOTO SEA IV TO OTHER SEAS ......................................................................... 48
Sokoto State Education Accounts 2015/16 & 2016/17 Report xv
5.6.1 Comparative Expenditure on Education in Sokoto State: A Macro Perspective ........................... 49 5.7 EDUCATION EXPENDITURE, QUALITY AND STUDENT OUTCOMES IN SOKOTO STATE: A MACRO-PERSPECTIVE.............................................................................................................................................. 51
6 CONCLUSIONS AND RECOMMENDATIONS OF SOKOTO SEA ............................................... 57
6.1 CONCLUSIONS - SIGNIFICANCE OF FINDINGS ................................................................................... 57 6.2 CHALLENGES AND RECOMMENDATIONS ......................................................................................... 59
6.2.1 Recommendations for data collection ........................................................................................ 59 6.2.2 Recommendations for Institutionalization of SEA ....................................................................... 60 6.2.3 Recommendations for Improvement of Quality of Education ...................................................... 61
REFERENCES ............................................................................................................................................ 62
ANNEXES .................................................................................................................................................... 64
ANNEX 1: EDUCATION CONTEXT IN NIGERIA WITH A FOCUS ON SOKOTO STATE ...................................... 64 ANNEX 2: EDUCATION FINANCING IN NIGERIA ....................................................................................... 81 ANNEX 3: LIST OF SEA STEERING COMMITTEE AND SWG MEMBERS ...................................................... 85 ANNEX 4: CATEGORIES AND CLASSIFICATIONS FOR SOKOTO SEA IV ...................................................... 87 ANNEX 5: DATA MATRICES ................................................................................................................... 93
Sokoto State Education Accounts 2015/16 & 2016/17 Report xvi
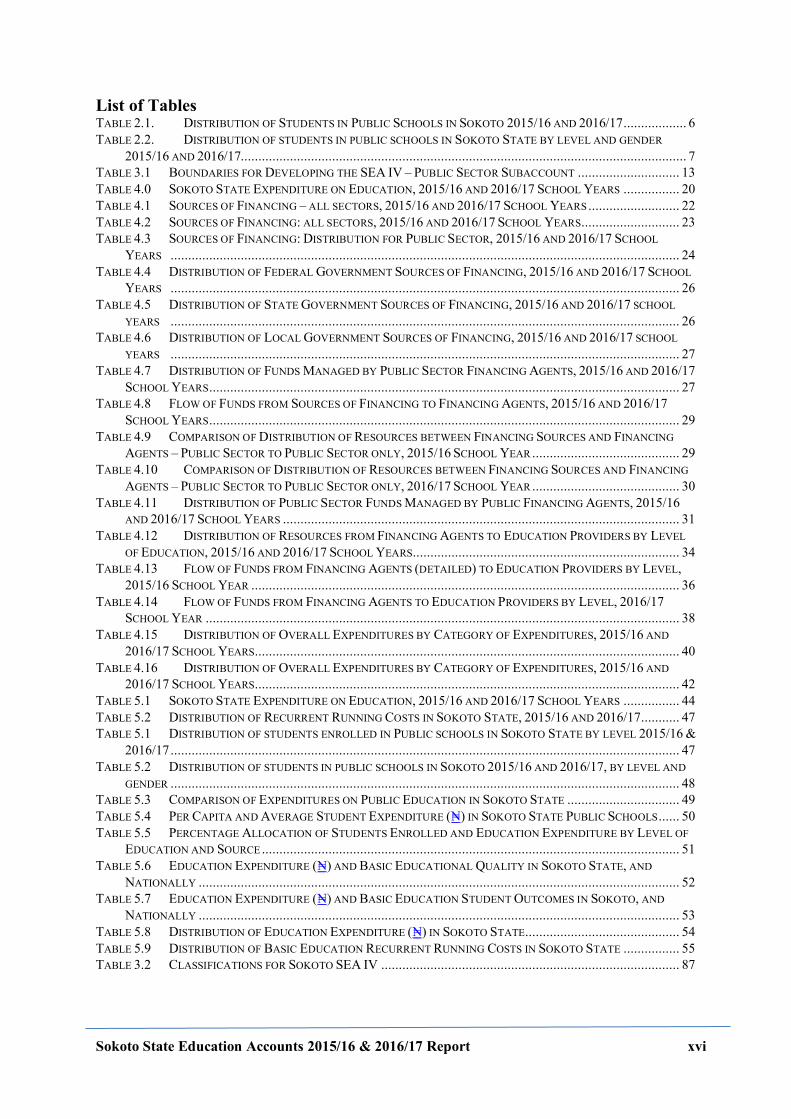
List of Tables TABLE 2.1. DISTRIBUTION OF STUDENTS IN PUBLIC SCHOOLS IN SOKOTO 2015/16 AND 2016/17 .................. 6 TABLE 2.2. DISTRIBUTION OF STUDENTS IN PUBLIC SCHOOLS IN SOKOTO STATE BY LEVEL AND GENDER
2015/16 AND 2016/17............................................................................................................................... 7 TABLE 3.1 BOUNDARIES FOR DEVELOPING THE SEA IV – PUBLIC SECTOR SUBACCOUNT ............................. 13 TABLE 4.0 SOKOTO STATE EXPENDITURE ON EDUCATION, 2015/16 AND 2016/17 SCHOOL YEARS ................ 20 TABLE 4.1 SOURCES OF FINANCING – ALL SECTORS, 2015/16 AND 2016/17 SCHOOL YEARS .......................... 22 TABLE 4.2 SOURCES OF FINANCING: ALL SECTORS, 2015/16 AND 2016/17 SCHOOL YEARS............................ 23 TABLE 4.3 SOURCES OF FINANCING: DISTRIBUTION FOR PUBLIC SECTOR, 2015/16 AND 2016/17 SCHOOL
YEARS ................................................................................................................................................. 24 TABLE 4.4 DISTRIBUTION OF FEDERAL GOVERNMENT SOURCES OF FINANCING, 2015/16 AND 2016/17 SCHOOL
YEARS ................................................................................................................................................. 26 TABLE 4.5 DISTRIBUTION OF STATE GOVERNMENT SOURCES OF FINANCING, 2015/16 AND 2016/17 SCHOOL
YEARS ................................................................................................................................................. 26 TABLE 4.6 DISTRIBUTION OF LOCAL GOVERNMENT SOURCES OF FINANCING, 2015/16 AND 2016/17 SCHOOL
YEARS ................................................................................................................................................. 27 TABLE 4.7 DISTRIBUTION OF FUNDS MANAGED BY PUBLIC SECTOR FINANCING AGENTS, 2015/16 AND 2016/17
SCHOOL YEARS ...................................................................................................................................... 27 TABLE 4.8 FLOW OF FUNDS FROM SOURCES OF FINANCING TO FINANCING AGENTS, 2015/16 AND 2016/17
SCHOOL YEARS ...................................................................................................................................... 29 TABLE 4.9 COMPARISON OF DISTRIBUTION OF RESOURCES BETWEEN FINANCING SOURCES AND FINANCING
AGENTS – PUBLIC SECTOR TO PUBLIC SECTOR ONLY, 2015/16 SCHOOL YEAR .......................................... 29 TABLE 4.10 COMPARISON OF DISTRIBUTION OF RESOURCES BETWEEN FINANCING SOURCES AND FINANCING
AGENTS – PUBLIC SECTOR TO PUBLIC SECTOR ONLY, 2016/17 SCHOOL YEAR .......................................... 30 TABLE 4.11 DISTRIBUTION OF PUBLIC SECTOR FUNDS MANAGED BY PUBLIC FINANCING AGENTS, 2015/16
AND 2016/17 SCHOOL YEARS ................................................................................................................. 31 TABLE 4.12 DISTRIBUTION OF RESOURCES FROM FINANCING AGENTS TO EDUCATION PROVIDERS BY LEVEL
OF EDUCATION, 2015/16 AND 2016/17 SCHOOL YEARS............................................................................ 34 TABLE 4.13 FLOW OF FUNDS FROM FINANCING AGENTS (DETAILED) TO EDUCATION PROVIDERS BY LEVEL,
2015/16 SCHOOL YEAR .......................................................................................................................... 36 TABLE 4.14 FLOW OF FUNDS FROM FINANCING AGENTS TO EDUCATION PROVIDERS BY LEVEL, 2016/17
SCHOOL YEAR ....................................................................................................................................... 38 TABLE 4.15 DISTRIBUTION OF OVERALL EXPENDITURES BY CATEGORY OF EXPENDITURES, 2015/16 AND
2016/17 SCHOOL YEARS......................................................................................................................... 40 TABLE 4.16 DISTRIBUTION OF OVERALL EXPENDITURES BY CATEGORY OF EXPENDITURES, 2015/16 AND
2016/17 SCHOOL YEARS......................................................................................................................... 42 TABLE 5.1 SOKOTO STATE EXPENDITURE ON EDUCATION, 2015/16 AND 2016/17 SCHOOL YEARS ................ 44 TABLE 5.2 DISTRIBUTION OF RECURRENT RUNNING COSTS IN SOKOTO STATE, 2015/16 AND 2016/17 ........... 47 TABLE 5.1 DISTRIBUTION OF STUDENTS ENROLLED IN PUBLIC SCHOOLS IN SOKOTO STATE BY LEVEL 2015/16 &
2016/17 ................................................................................................................................................. 47 TABLE 5.2 DISTRIBUTION OF STUDENTS IN PUBLIC SCHOOLS IN SOKOTO 2015/16 AND 2016/17, BY LEVEL AND
GENDER ................................................................................................................................................. 48 TABLE 5.3 COMPARISON OF EXPENDITURES ON PUBLIC EDUCATION IN SOKOTO STATE ................................ 49 TABLE 5.4 PER CAPITA AND AVERAGE STUDENT EXPENDITURE (N=) IN SOKOTO STATE PUBLIC SCHOOLS ...... 50 TABLE 5.5 PERCENTAGE ALLOCATION OF STUDENTS ENROLLED AND EDUCATION EXPENDITURE BY LEVEL OF
EDUCATION AND SOURCE ....................................................................................................................... 51 TABLE 5.6 EDUCATION EXPENDITURE (N=) AND BASIC EDUCATIONAL QUALITY IN SOKOTO STATE, AND
NATIONALLY ......................................................................................................................................... 52 TABLE 5.7 EDUCATION EXPENDITURE (N=) AND BASIC EDUCATION STUDENT OUTCOMES IN SOKOTO, AND
NATIONALLY ......................................................................................................................................... 53 TABLE 5.8 DISTRIBUTION OF EDUCATION EXPENDITURE (N=) IN SOKOTO STATE............................................ 54 TABLE 5.9 DISTRIBUTION OF BASIC EDUCATION RECURRENT RUNNING COSTS IN SOKOTO STATE ................ 55 TABLE 3.2 CLASSIFICATIONS FOR SOKOTO SEA IV ..................................................................................... 87
Sokoto State Education Accounts 2015/16 & 2016/17 Report xvii
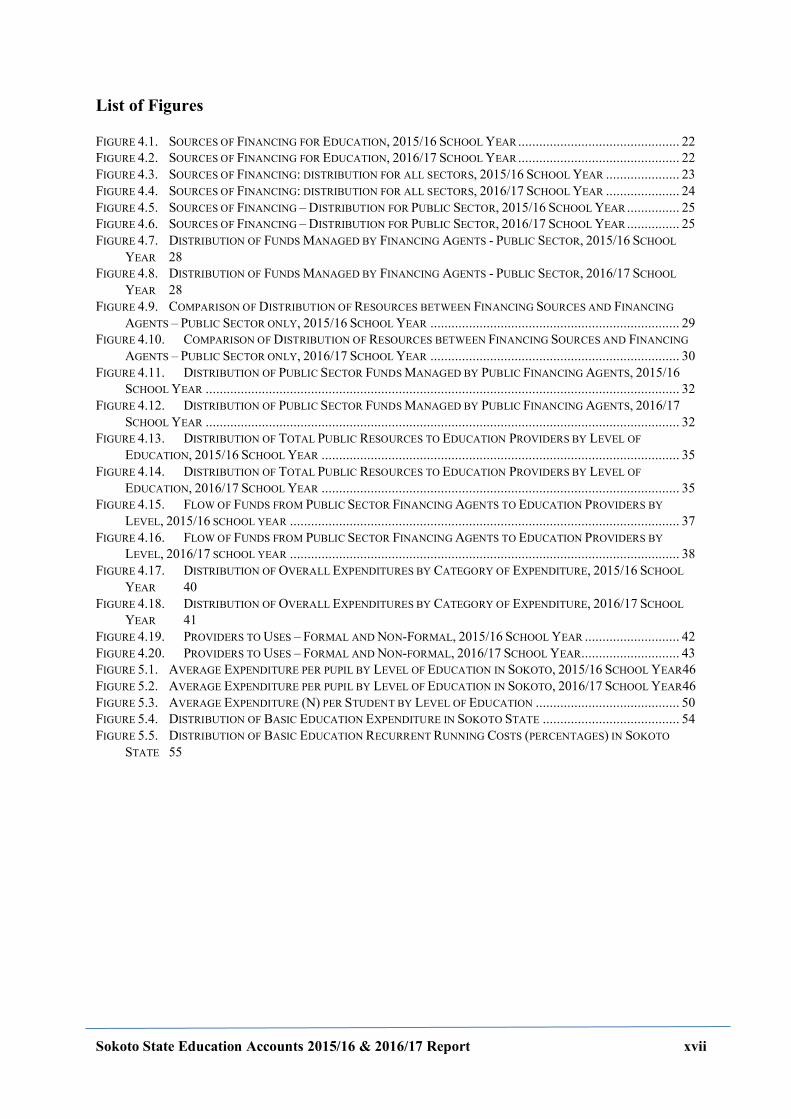
List of Figures FIGURE 4.1. SOURCES OF FINANCING FOR EDUCATION, 2015/16 SCHOOL YEAR .............................................. 22 FIGURE 4.2. SOURCES OF FINANCING FOR EDUCATION, 2016/17 SCHOOL YEAR .............................................. 22 FIGURE 4.3. SOURCES OF FINANCING: DISTRIBUTION FOR ALL SECTORS, 2015/16 SCHOOL YEAR ..................... 23 FIGURE 4.4. SOURCES OF FINANCING: DISTRIBUTION FOR ALL SECTORS, 2016/17 SCHOOL YEAR ..................... 24 FIGURE 4.5. SOURCES OF FINANCING – DISTRIBUTION FOR PUBLIC SECTOR, 2015/16 SCHOOL YEAR ............... 25 FIGURE 4.6. SOURCES OF FINANCING – DISTRIBUTION FOR PUBLIC SECTOR, 2016/17 SCHOOL YEAR ............... 25 FIGURE 4.7. DISTRIBUTION OF FUNDS MANAGED BY FINANCING AGENTS - PUBLIC SECTOR, 2015/16 SCHOOL
YEAR 28 FIGURE 4.8. DISTRIBUTION OF FUNDS MANAGED BY FINANCING AGENTS - PUBLIC SECTOR, 2016/17 SCHOOL
YEAR 28 FIGURE 4.9. COMPARISON OF DISTRIBUTION OF RESOURCES BETWEEN FINANCING SOURCES AND FINANCING
AGENTS – PUBLIC SECTOR ONLY, 2015/16 SCHOOL YEAR ....................................................................... 29 FIGURE 4.10. COMPARISON OF DISTRIBUTION OF RESOURCES BETWEEN FINANCING SOURCES AND FINANCING
AGENTS – PUBLIC SECTOR ONLY, 2016/17 SCHOOL YEAR ....................................................................... 30 FIGURE 4.11. DISTRIBUTION OF PUBLIC SECTOR FUNDS MANAGED BY PUBLIC FINANCING AGENTS, 2015/16
SCHOOL YEAR ....................................................................................................................................... 32 FIGURE 4.12. DISTRIBUTION OF PUBLIC SECTOR FUNDS MANAGED BY PUBLIC FINANCING AGENTS, 2016/17
SCHOOL YEAR ....................................................................................................................................... 32 FIGURE 4.13. DISTRIBUTION OF TOTAL PUBLIC RESOURCES TO EDUCATION PROVIDERS BY LEVEL OF
EDUCATION, 2015/16 SCHOOL YEAR ...................................................................................................... 35 FIGURE 4.14. DISTRIBUTION OF TOTAL PUBLIC RESOURCES TO EDUCATION PROVIDERS BY LEVEL OF
EDUCATION, 2016/17 SCHOOL YEAR ...................................................................................................... 35 FIGURE 4.15. FLOW OF FUNDS FROM PUBLIC SECTOR FINANCING AGENTS TO EDUCATION PROVIDERS BY
LEVEL, 2015/16 SCHOOL YEAR ............................................................................................................... 37 FIGURE 4.16. FLOW OF FUNDS FROM PUBLIC SECTOR FINANCING AGENTS TO EDUCATION PROVIDERS BY
LEVEL, 2016/17 SCHOOL YEAR ............................................................................................................... 38 FIGURE 4.17. DISTRIBUTION OF OVERALL EXPENDITURES BY CATEGORY OF EXPENDITURE, 2015/16 SCHOOL
YEAR 40 FIGURE 4.18. DISTRIBUTION OF OVERALL EXPENDITURES BY CATEGORY OF EXPENDITURE, 2016/17 SCHOOL
YEAR 41 FIGURE 4.19. PROVIDERS TO USES – FORMAL AND NON-FORMAL, 2015/16 SCHOOL YEAR ........................... 42 FIGURE 4.20. PROVIDERS TO USES – FORMAL AND NON-FORMAL, 2016/17 SCHOOL YEAR............................ 43 FIGURE 5.1. AVERAGE EXPENDITURE PER PUPIL BY LEVEL OF EDUCATION IN SOKOTO, 2015/16 SCHOOL YEAR46 FIGURE 5.2. AVERAGE EXPENDITURE PER PUPIL BY LEVEL OF EDUCATION IN SOKOTO, 2016/17 SCHOOL YEAR46 FIGURE 5.3. AVERAGE EXPENDITURE (N) PER STUDENT BY LEVEL OF EDUCATION ......................................... 50 FIGURE 5.4. DISTRIBUTION OF BASIC EDUCATION EXPENDITURE IN SOKOTO STATE ....................................... 54 FIGURE 5.5. DISTRIBUTION OF BASIC EDUCATION RECURRENT RUNNING COSTS (PERCENTAGES) IN SOKOTO
STATE 55
Sokoto State Education Accounts – Public Sector Subaccount: 2015/16 & 2016/17 1
1 Introduction The Northern Education Initiative Plus project (The Initiative), funded by United States Agency for International Development (USAID), is supporting the Sokoto State Ministry of Basic and Secondary Education with improving access to and the quality of education in the primary grades with a focus on early grade reading. The project aims to do so by strengthening the quality of teaching as well as strengthening the systems in the state to enable the state offer variety of options that better serve the pupils within and outside the system. Recognizing the fragmented nature of the available data as well as cognizant of the usefulness of data from past State Education Accounts, the Sokoto State Ministry of Basic and Secondary Education, with support from The Initiative project, has developed a subaccount of the State Education Accounts (SEA) that is focused only on the public sector expenditures on formal and non-formal education in the state. The data from this subaccount, in combination with similar SEA data from previous years, will inform the policy dialogue in support of the ongoing efforts by the state to strengthen its systems and improve the quality of education delivery to better serve the children in the state. 7 It will do so by providing a snapshot of the current levels of spending by all public sector agencies in the state. The data was collected for two school years – 2015/16 and 2016/17 – to enable more realistic estimates of public sector spending on education.
This document provides the context and the methodology used for the conduct of State Education Accounts – subaccount for public sector spending – in Sokoto State and reports on the findings. The rest of the report is organized as follows: Chapter 2 provides a brief overview of the context and the education system in Nigeria, with special reference to Sokoto State. Chapter 3 provides a description of the National and State Education Accounts, the boundaries and classifications for SEA as well as the conduct of SEA in Sokoto State. Chapter 4 maps the flow of funds within the education sector. Chapter 5 provides an analysis of education expenditures in the State. Chapter 6 concludes with a summary of findings and recommendations. The annexes include the detailed SEA matrices (detailed data tables), a list of the members of the State working group and the Steering Committee, as well as a more detailed description of the education context – education system and its financing - than is included in the report.
7 State Education Accounts have been conducted by Sokoto State covering academic years 2009/10, 2010/11, 2013/14,
2014/15.
Sokoto State Education Accounts – Public Sector Subaccount: 2015/16 & 2016/17 2
2 Nigerian Education System – An Overview Nigeria has had a long history of providing education for its citizens and was considered a leader in the field of education in Africa until the mid-twentieth century. The attainment of independence from the British in 1960 led to a condemnation of the objectives of colonial primary education. The clamour for an education system that reflected Nigerian realities reached a crescendo during the oil boom of the 1970s. Since the 1970s, numerous federal and state government initiatives to widen access and improve the quality of education delivery have recorded gains in some aspects, including a general increase in gross enrolment ratio (GER) at the junior secondary school (JSS) level and both gross and net enrolment ratios (NER) for girls. The recent decrease in out-of-school children in Nigeria from 10.5 million to under 9 million by the UNESCO Institute of Statistics (UIS) could be a product of these interventions.8 Despite this progress, however, Nigeria has the highest population of out-of-school children (OOSC) in the world. In 1976, the quest to design something indigenous, coupled with the need to observe the right of the child to education, led to the declaration of the Universal Primary Education (UPE). This policy ushered in a tremendous increase in enrolment as well as extensive community efforts to develop primary education. There was so much enthusiasm that primary education became the major sector for extending government presence to many villages, towns, and communities. However, with it came increased costs and funding needs. In 1977, the Nigerian government promulgated a National Policy on Education to provide the basis for an improved curriculum to meet the nation's development needs. Many lofty ideals were laid down without adequate planning on the assumption that funds would be available indefinitely to meet the needs of the sub-sector. When policy implementation commenced in the 1980s, however, economic recession had set in. Implementation of the policy, combined with the federal and state government initiatives to increase access to schools, at a time of economic recession meant that as the economy declined, the school population and number of schools grew. As a result, classrooms became over-crowded, structures fell into disrepair, and teaching facilities were grossly inadequate. In addition, the dearth of data for effective planning and management became acute as teachers’ competences could not meet the needs of increased responsibilities. Despite the many reforms initiated by successive governments since then, the pressures on education financing have not been alleviated and financing continues to remain a major issue in the Nigerian education system. Education in Nigeria is financed by both public and private sources, but data on education spending – including public spending – continues to be fragmented and unreliable. On the public side, the problem seems to be the quantum of financial resources committed by the different tiers of government to education. The financial commitment and the priority given to education by governments are usually reflected in budgetary allocations, but the decentralized governance system does not allow this data to be picked up with accuracy and ease. A brief description of the Nigerian education system as it stands today and its financing, with a special reference to Sokoto State is presented below. Additional details are included in Annexes 1 and 2.
8 http://www.uis.unesco.org/_LAYOUTS/UNESCO/oosci-data-tool/index-en.html#en/cover.
Sokoto State Education Accounts – Public Sector Subaccount: 2015/16 & 2016/17 3
2.1 Education System in Nigeria – A Brief Description The government of Nigeria has declared education as one of its priorities. The goal is to have a reformed system of education that will provide access at all levels of education and to improve the quality and efficiency of the entire education system by strengthening: (1) the institutional management of education; (2) access and equity; (3) standard and quality assurance; (4) teacher education and development; (5) technical and vocational education and training; and (6) funding, partnerships, and resource mobilization,9 making it an instrument for transformation and socio-economic empowerment. Since independence, the Nigerian education system – which comprised of three distinct systems: the indigenous system, the Quranic schools, and formal European-style education institutions – has undergone a range of reforms. Through its National Policy on Education, which was first introduced in 1977 and was last updated in 201310, the government has tried to transform the education system from its British Colonial structure to a structure that is more relevant to the culture and life of the Nigerians, and in line with its development aspirations expressed in Vision 20:2020. The National policy includes four key objectives: (1) provision of universal access to basic education, (2) expansion of the publicly financed secondary and tertiary education, (3) outlining national language policy and (4) building national capacity in science and technology. The policy provides for both formal and non-formal education and stipulates a 1-6-3-3-4 structure (also known as the 1-9-3-4 structure) that offers nine years of basic compulsory education, (including six years of primary education and three years of junior secondary education, starting at 6 years of age), three years of senior secondary and four years of higher education (FRN, 2013). Constitutionally, both Federal and State governments legislate on the planning, organization and management of education. Primary education, secondary education, adult and non-formal education are managed by the LGAs and the states. The Federal government is responsible for policy making and the enforcement of standards at the primary and secondary levels11 but also owns and manages many tertiary institutions. States also establish and manage universities and tertiary institutions. The National Council on Education is the highest policy making organ and its members include the Federal Minister of Education and all state Commissioners of Education. It approves a national curriculum for primary and secondary education, determines policies on all aspects and levels of education and receives feedback on the delivery of EFA. It also sets standards for quality assurance and guidelines for national examinations for primary and secondary schools. It advised the government to establish the Universal Basic Education Commission (UBEC) and the State Universal Basic Education Boards (SUBEBs) to ensure effective implementation of EFA. The UBEC is the national agency in charge of the disbursement of federal intervention funds for primary and junior secondary education and the monitoring of standards in the basic education sector, while the SUBEBs oversee the delivery and management of primary and junior secondary education at state level.
9 (FMOE 2012). 10 Federal Republic of Nigeria, National Policy on Education – 6th Edition (2013), Nigerian Educational Research and Development Council, Lagos, Nigeria 11 The only exception to this is the 102 Federal Government Colleges i.e. the Unity Secondary Schools owned and managed by the Federal government
Sokoto State Education Accounts – Public Sector Subaccount: 2015/16 & 2016/17 4
2.2 Education Financing in Nigeria Education is a concurrent responsibility of the federal, state and local governments under the Constitution of Nigeria, which provides the legal framework for educational management in Nigeria and stipulates that the government provide basic education free of charge for all citizens. The fact that education is on the concurrent legislative list means that although a few functions are exclusively assigned to the federal, state or local government, most of the functions and responsibilities are in fact shared by the three tiers of government. Education in the public sector is funded primarily through government sources with a small proportion coming from households and the donor agencies (rest of the world). In the private sector however, the distribution is reversed with the private sector (households, community, foundations, etc.) contributing the bulk of the funds. A brief overview of education financing in Nigeria is below, with a more detailed description included in Annex 2. Since 1979, University education has been assigned to both federal and state governments. Other areas of tertiary education such as polytechnics and teacher training colleges are also managed and financed by both of these tiers of government. Except for the 96 Federal Government Colleges (Unity Schools and Federal Technical Colleges) which are spread across the country, all secondary education is managed and financed by the state governments. In general, the financing and management processes for secondary and tertiary education have been stable. However, this has not been the case for primary schooling. All three tiers of government – Federal, State, and Local – fund primary education. The Federal government provides financing mainly for capital expenditure through the UBE program and several targeted intervention funds. The State governments provide money for capital expenditure and for recurrent costs for the SUBEB, Local Government Education Authorities (LGEAs), and primary schools. Local governments provide money (indirectly through deduction at the state level as a first charge) for primary school teachers’ salaries and allowances. With both the Federal government and the State Ministry of Education (MOE) vying for control over basic education, there is some confusion over the attribution of responsibility, leading to an overlap and duplication in the services provided. With local governments providing financing for teacher salaries, through the state government, there is also confusion over who (state or local government) makes the decision on how those funds are to be used. While most of the public sector funds are distributed through budgetary allocations, the federal government also uses several targeted intervention funds, such as the Tertiary Education Trust Fund (TETFund), debt relief grant (DRG/MDGs), and constituency projects of federal legislators to target expenditures such as those on construction, federal schools and universities. However, due to the decentralized nature of spending on education, there is a lack of accurate and complete information making estimates of education related expenditures difficult. There is also some evidence that actual expenditures are significantly below budgeted amounts. In the case of Sokoto, for example, there are huge differences in amounts approved versus amounts released.12 In addition, there are significant financial inputs from the private sector, including households, and from the donor community. However, because of the confusing roles and responsibilities, low management capacity, as well as complex reporting arrangements, there is a dearth of accurate data on public and private spending on education. This lack of data imposes severe limitations on both individual and organizational capacity for policy making, planning, and management. There is a need for more transparency in the allocation of funds,
12 Based on a review of approved Budget Plan documents from 2009 to 2017. The amount of funds released are a function of factors such as the total funds released to the state government, the approved budget, competing or new priorities of the state, the salary budget, etc.
Sokoto State Education Accounts – Public Sector Subaccount: 2015/16 & 2016/17 5
and for an accountability system that will enable the Nigerian government to more effectively and efficiently allocate resources in accordance with their national, state and local policies. Recognizing that the information base is very weak for debates on such fundamental issues as the adequacy of funding for education, sources of funding, efficiency and equity of the use of public funds, costs of system expansion and the appropriate mix of public and private (household) expenditures, the Sokoto State Ministry of Basic and Secondary Education (MOBSE) is using the State Education Account (SEA) to study the flow of funds from sources-to-users within the education sector and to have a basis for decision-making. Effect of the Nigerian Economy on Education Financing As reported by National Bureau of Statistics (2016)13, the turmoil in global commodity markets, witnessed in the second half of 2014 brought their full weight to bear on the Nigerian economy in 2015. Oil prices fell 66.8% from $114/barrel recorded in June 2014, to $38/barrel by December 2015. Prices fell even further in 2016, to $32.6 as of 3rd February, 2016. Beyond commodity markets, recent developments in the global economy created a trifecta of headwinds that the nation has to contend with. Given that the Nigerian economy is largely oil dependent, the fall in prices has affected the entire economy. The fall in crude oil price has resulted in declining government expenditure and its multiplier effect is having an impact on all sectors in the country, including the education sector. Although as reported by the National Bureau of Statistics (NBS), Nigeria has exited its worst economic recession in more than two decades, notching up growth of 0.55 per cent in the second quarter of 2017, this is yet to have an impact on education funding. 2.3 Sokoto State Education System and its Financing - Brief Description During academic years 2015/16 and 2016/17, the years under review, Sokoto State was committed to achieving the EFA goals and MDGs in an effort to improve the wellbeing of its citizens and to accelerate the socio-economic development of the state. In an attempt to support the attainment of the vision of the Sokoto State Government, the education sector, after thoughtful deliberations, adopted the following vision and mission statements to guide its medium-term targets and aspirations as part of its 2015-2017 MTSS: Vision: To provide equitable, accessible and quality education for all children at all levels. Mission: To create ideal and appropriate practices that will adequately meet educational needs at all levels. Key Priorities:
1. Provide equitable access and quality basic education for all children of school age a) Ensure that appropriate practices are adapted to meet the needs of all children of
school age b) Establish efficient management and standards of operation for quality service
delivery to Basic Education c) Enhance financial and material support to relevant sectors in-charge of basic
education service delivery 2. Provide equitable access and functional education to all eligible children
a) Provide equal access and opportunity to all eligible learners for successful completion of secondary education
b) Improve the quality of teaching and learning outcomes at secondary school level c) Increase equal access and opportunities in secondary schools for learners with
13 National Bureau of Statistics (2016) The Nigerian Economy: Past, Present and Future.
Sokoto State Education Accounts – Public Sector Subaccount: 2015/16 & 2016/17 6
special needs 3. Increase and support the inclusion of out- of- school children, those with special needs
and from disadvantaged socio-economic backgrounds a) Provide equitable access to out- of -school children to attain minimum level of
competency in numeracy, literacy and improved relevant skills b) Improve the quality of teaching for learners to obtain minimal academic and self-
development skills. 4. Ensure equitable access to quality tertiary education that provide appropriate
professional skills for graduates a) Provide opportunity to all students to embark on and complete higher education for
employability b) Provide efficient and skilled manpower development for the present and future
needs of the State workforce. c) Provide effective and qualitative Technical Education for the present and future
needs of the state. 5. Improve the efficacy of the policy, planning and management framework for effective
education service delivery system a) Enhance capacity of relevant stakeholders for effective management of service
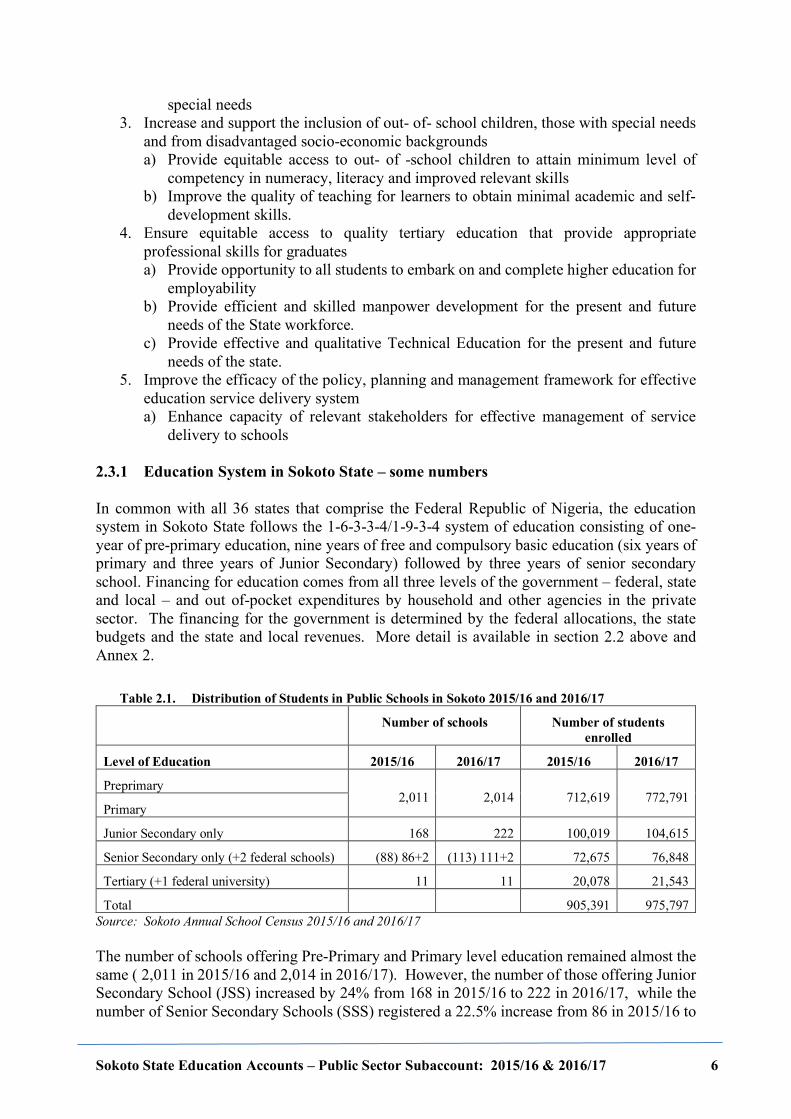
delivery to schools 2.3.1 Education System in Sokoto State – some numbers In common with all 36 states that comprise the Federal Republic of Nigeria, the education system in Sokoto State follows the 1-6-3-3-4/1-9-3-4 system of education consisting of one-year of pre-primary education, nine years of free and compulsory basic education (six years of primary and three years of Junior Secondary) followed by three years of senior secondary school. Financing for education comes from all three levels of the government – federal, state and local – and out of-pocket expenditures by household and other agencies in the private sector. The financing for the government is determined by the federal allocations, the state budgets and the state and local revenues. More detail is available in section 2.2 above and Annex 2.
Table 2.1. Distribution of Students in Public Schools in Sokoto 2015/16 and 2016/17
Number of schools Number of students enrolled
Level of Education 2015/16 2016/17 2015/16 2016/17
Preprimary 2,011 2,014 712,619 772,791
Primary
Junior Secondary only 168 222 100,019 104,615
Senior Secondary only (+2 federal schools) (88) 86+2 (113) 111+2 72,675 76,848
Tertiary (+1 federal university) 11 11 20,078 21,543
Total 905,391 975,797 Source: Sokoto Annual School Census 2015/16 and 2016/17 The number of schools offering Pre-Primary and Primary level education remained almost the same ( 2,011 in 2015/16 and 2,014 in 2016/17). However, the number of those offering Junior Secondary School (JSS) increased by 24% from 168 in 2015/16 to 222 in 2016/17, while the number of Senior Secondary Schools (SSS) registered a 22.5% increase from 86 in 2015/16 to
Sokoto State Education Accounts – Public Sector Subaccount: 2015/16 & 2016/17 7
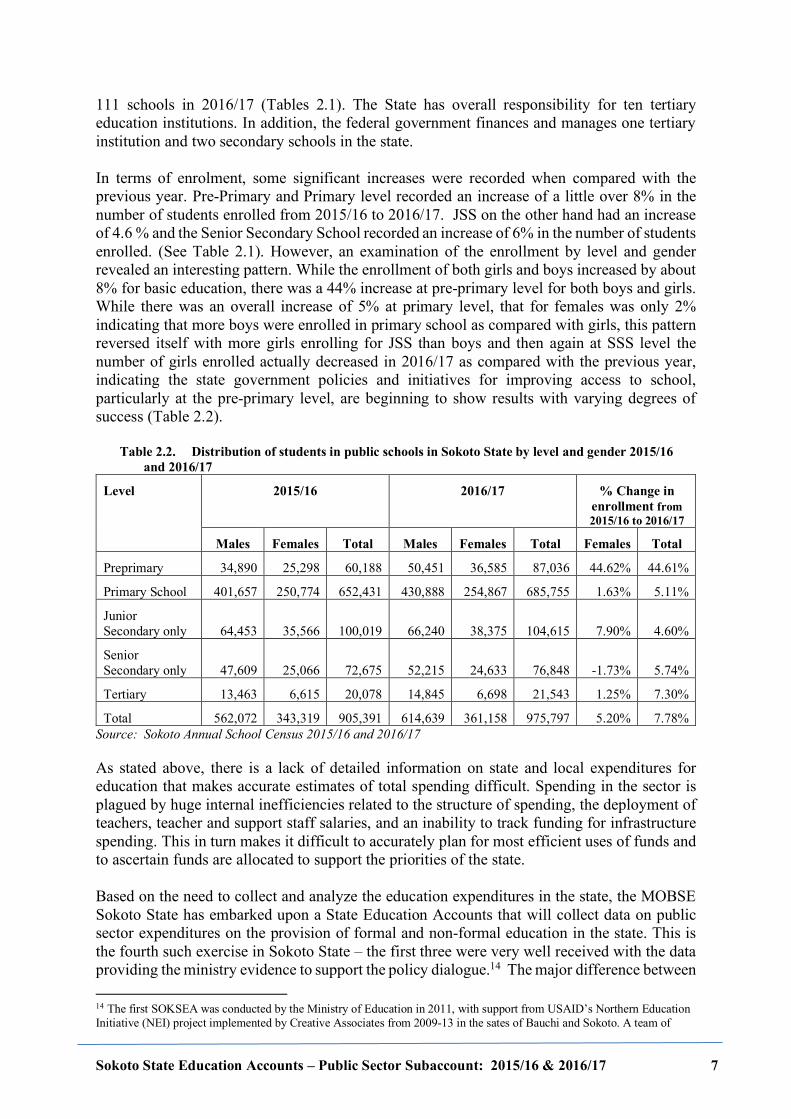
111 schools in 2016/17 (Tables 2.1). The State has overall responsibility for ten tertiary education institutions. In addition, the federal government finances and manages one tertiary institution and two secondary schools in the state. In terms of enrolment, some significant increases were recorded when compared with the previous year. Pre-Primary and Primary level recorded an increase of a little over 8% in the number of students enrolled from 2015/16 to 2016/17. JSS on the other hand had an increase of 4.6 % and the Senior Secondary School recorded an increase of 6% in the number of students enrolled. (See Table 2.1). However, an examination of the enrollment by level and gender revealed an interesting pattern. While the enrollment of both girls and boys increased by about 8% for basic education, there was a 44% increase at pre-primary level for both boys and girls. While there was an overall increase of 5% at primary level, that for females was only 2% indicating that more boys were enrolled in primary school as compared with girls, this pattern reversed itself with more girls enrolling for JSS than boys and then again at SSS level the number of girls enrolled actually decreased in 2016/17 as compared with the previous year, indicating the state government policies and initiatives for improving access to school, particularly at the pre-primary level, are beginning to show results with varying degrees of success (Table 2.2).
Table 2.2. Distribution of students in public schools in Sokoto State by level and gender 2015/16 and 2016/17
Level 2015/16 2016/17 % Change in enrollment from 2015/16 to 2016/17
Males Females Total Males Females Total Females Total
Preprimary 34,890 25,298 60,188 50,451 36,585 87,036 44.62% 44.61%
Primary School 401,657 250,774 652,431 430,888 254,867 685,755 1.63% 5.11%
Junior Secondary only 64,453 35,566 100,019 66,240 38,375 104,615 7.90% 4.60%
Senior Secondary only 47,609 25,066 72,675 52,215 24,633 76,848 -1.73% 5.74%
Tertiary 13,463 6,615 20,078 14,845 6,698 21,543 1.25% 7.30%
Total 562,072 343,319 905,391 614,639 361,158 975,797 5.20% 7.78% Source: Sokoto Annual School Census 2015/16 and 2016/17 As stated above, there is a lack of detailed information on state and local expenditures for education that makes accurate estimates of total spending difficult. Spending in the sector is plagued by huge internal inefficiencies related to the structure of spending, the deployment of teachers, teacher and support staff salaries, and an inability to track funding for infrastructure spending. This in turn makes it difficult to accurately plan for most efficient uses of funds and to ascertain funds are allocated to support the priorities of the state. Based on the need to collect and analyze the education expenditures in the state, the MOBSE Sokoto State has embarked upon a State Education Accounts that will collect data on public sector expenditures on the provision of formal and non-formal education in the state. This is the fourth such exercise in Sokoto State – the first three were very well received with the data providing the ministry evidence to support the policy dialogue.14 The major difference between 14 The first SOKSEA was conducted by the Ministry of Education in 2011, with support from USAID’s Northern Education Initiative (NEI) project implemented by Creative Associates from 2009-13 in the sates of Bauchi and Sokoto. A team of
Sokoto State Education Accounts – Public Sector Subaccount: 2015/16 & 2016/17 8
the first two efforts and the current effort is that the first two collected data from all sources – public, private and the rest of the world – in the state, while the third round and this round are subaccounts focused exclusively on the public sector expenditures. Any other sources of financing that may have been included are because they are providing funding that is expended by the government to support programs. A description of the State Education Accounts (SEA) tool and its methodology is included in the next section.
international and Nigerian consultants provided technical assistance to the Ministry of Education and built capacity within the Ministry for the conduct of SEA. Round I of SOKSEA collected data on the education expenditures in 2009-2010 school year. A follow-up SOKSEA (Round II) was conducted in 2013 using data for the school year 2010-2011. The third round of SEA was conducted in 2017 and collected data for the school years 2013-2014 and 2014- 2015.
Sokoto State Education Accounts – Public Sector Subaccount: 2015/16 & 2016/17 9
3 State Education Accounts Methodology State Education Accounts (SEA) are a subaccount of National Education Accounts and provide a framework for measuring total – public, private, and donor – education expenditures in the state. Conducted at the state level, SEA provides a snapshot of education spending in the state and organizes, tabulates, and presents information on education spending using a standard set of tables and a user-friendly format that can be easily understood and interpreted by policymakers. The rest of this chapter presents a description of National Education Accounts, and how the subaccounts relate to the larger whole. 3.1 National Education Accounts National Education Accounts (NEA) were developed as a tool for improved financial information within the context of comprehensive education reform programs. The NEAs provide a picture of the flows and uses of funds throughout the education system and identify roles played by central government, local district governments, international and indigenous donors, private contributors and households in financing education.
The National Education Accounts can be described as a transparent method for collecting and analyzing data on actual allocations and expenditures of resources and linking those expenditures and allocation to system reforms. National Education Accounts (NEA) provides a framework for measuring total – public, private, and donor – national education expenditures. Using a standard classification for data, NEA organizes, tabulates, and presents information on education spending in a standard set of tables, in a user-friendly format that can be easily understood and interpreted by policymakers, including those without a background in economics, and allows for international comparisons and in-country comparisons over time. The National Education Accounts (NEA) framework combines the methodology developed for National Health Accounts (NHA) with the International Standard Classification of Education (ISCED) classifications used in the UOE (UIS/OECD/EUROSTAT) framework.15 16 Data are collected and analyzed using the basic categories and matrices developed for the NEA. ISCED classifications of expenditure categories are used to ensure completeness of data collected and to allow for eventual international comparisons. While the data collected are entered into a standard set of tables there is some flexibility to add in subcategories to allow for collection and analysis of data that are specific to each country. The NEA can contribute to evidence-based policy decisions and enable more transparency that promotes stakeholder involvement. Simply put, the NEA provides a snapshot of the education system by measuring the flow of funds through four categories of entities and answering four key questions:
1. Sources of Financing: Where does the money come from? The NEA examines all sources of financing such as the Ministry of Finance, households, and donors.
2. Financing Agents: What is the flow of funds? The NEA examines financing agents, the intermediaries who receive funds from all sources and use them to pay for services,
15 World Health Organization. (2003). Guide to producing national health accounts with special applications for low-income and middle income countries. 16 Schmidt, Pascala. A short guide to Educational expenditure statistics. Eurostat - education, training and culture. European Commission. 2003. Accessed from the following URL: http://forum.europa.eu.int/Public/irc/dsis/edtcs/library?l=/public/unesco_collection/methodology.
Sokoto State Education Accounts – Public Sector Subaccount: 2015/16 & 2016/17 10
such as a Ministry of Education, district governments, communities or denominational and private school networks.
3. Providers: To whom did the money go? The NEA examines providers of services or activities related to education, such as schools, tutors, universities, and LGEAs.
4. Functions: What service was actually produced? The NEA examines functions or services or activities that providers deliver, such as classroom education, textbooks, tutoring, etc.
In addition to determining how much each financing source spends on education, NEAs carefully track the flow of funds from one actor to another, such as the distribution of funds from the Ministry of Education (MOE) to each government education provider and by level of education. The flexibility of the NEA framework also allows for specific detailed analyses of education spending on targeted populations or specific levels of education, such as services provided for basic education. The NEA essentially measures the “financial pulse” of a national education system by answering questions such as:
• Who in the country is financing education services? • How much do they spend? • How are funds distributed across different education providers, levels and
activities? • Who benefits from these services? (E.g. are urban populations benefiting more than
rural groups?) Simply put, NEA allows for greater transparency of expenditures in the country’s education systems. Reports that are typically generated using the data estimated in NEA are matrices that describe flows of funds as follows:
1. From sources to financing agents 2. From financing agents to providers of services; 3. From providers to functions (levels of education, e.g., primary, junior and senior
secondary, tertiary education, administration) 4. From providers to uses (e.g., salaries, textbooks, uniforms, meal plans, etc.) 5. From provider types to categories of beneficiaries (e.g., age/sex groups, geographic
locations, special initiatives) The convention used is to estimate the quantity of the flow of funds (for a particular year) and to insert that quantity in a table cell, where the column is the source of the funds and the row is the recipient of the funds. The total of all flows from each source is the column total, and the total of all flows to each use is the row total. The grand total in each matrix should be identical to that of all other matrices. By providing valuable information such as status reports on the current use of financial resources, monitoring education expenditure trends, and reporting on globally accepted indicators to allow for comparison of the country’s education system performance relative to that of other countries, the NEA can contribute significantly to the decision making process. NEA methodology can also be used to make financial projections of a country’s education systems’ needs and highlight equity imbalances in distribution of expenditures. NEA estimates for a particular year provide a snapshot of the flow of funds through the education system for that year. Once NEA has been completed for two or more years, it would
Sokoto State Education Accounts – Public Sector Subaccount: 2015/16 & 2016/17 11
be possible to estimate and analyze the trends in spending by the various sources, financing agents, uses, etc., enabling policymakers to understand the dynamics of financing in the education sector. NEA reports are not intended to serve as solely academic exercises that may or may not be used by policymakers or that may collect dust in the office shelves of government officials; rather, they are intended to be an integral part, as are the national census and other government surveys, to the policy process and debate in a country. By revealing the actual “financial health” of a country’s education system, especially when assessed in combination with other types of data (e.g. poverty levels, geographic distribution, enrollment figures, etc.), NEA can provide the data needed to help decision-makers determine, based on “evidence,” whether their country education funds are being spent efficiently, effectively, and equitably. Since NEA is an internationally utilized and recognized methodology, using a standard classification for all expenditure categories, a country’s assessment of its education spending patterns can be compared to its own spending and to that of other countries and to its own spending over time. This comparative information is of particular value to policymakers because they can learn from the spending patterns and education system outcomes of countries with similar socio-economic backgrounds when setting performance objectives and benchmarks. Implemented on a regular basis, NEA can track trends in financing of education. Such temporal data is useful for monitoring and evaluation purposes and for making financial projections of a country’s education financing needs. 3.2 State Education Accounts The State Education Accounts (SEA), a subaccount of the NEA, are a transparent method for collecting and analyzing data on actual allocations and expenditures of resources in the education sector and linking those allocations and expenditures system reforms at the state level. In fact, NEAs can be thought of as an aggregation of several SEAs. The SEA framework closely follows the National Education Account (NEA) framework, and like the NEA, it too maps the flow of funds from sources to intermediary or financing agents and finally to the providers of service. The State Education Accounts help detail expenditures by different players in the education sector within the state boundaries and thus provide a more complete and transparent view of total spending, both public and private, on education in the state. Like the NEA, SEA is a tool that facilitates assessment and evaluation of the performance of the education system. SEA does this in several ways, most importantly by providing information on the overall level of resources (public, private and external), how these resources flow through the education system and how they are used. SEA provides the data for evaluation of sources and uses of education funding (public, private and external) against a set of policy objectives, thereby providing evidence-based methods of determining if education funds are being spent in support of these objectives. The use of SEA involves official stakeholders in determining which aspect of the sources and uses is important, and provides the means to measure policy impact on a factual rather than an anecdotal basis. SEA uses standard classification of data, which contributes to benchmarking performance and sharing information more easily between countries and between states and regions within the country. The main objective of the State Education Accounts is to create a standard format of accounting for educational expenditures within a state that establishes the platform for technical analysis of the performance of the education sector and permits comparisons of relevant indicators between states and internationally.
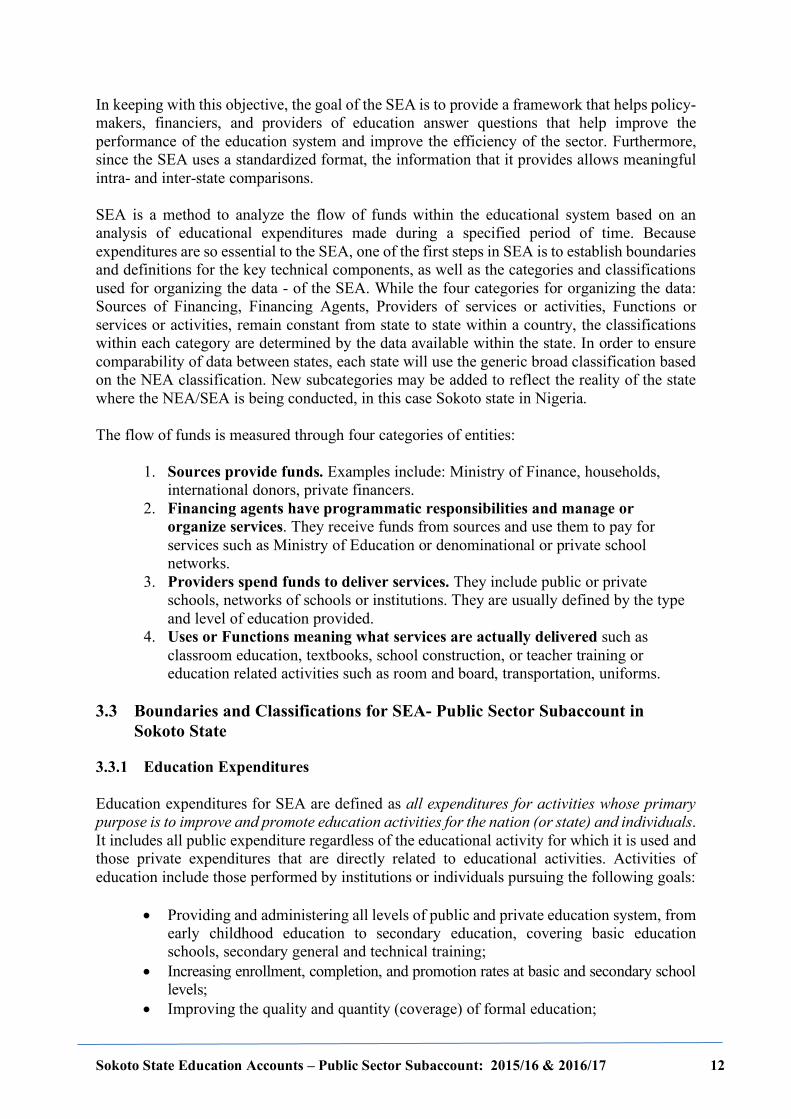
Sokoto State Education Accounts – Public Sector Subaccount: 2015/16 & 2016/17 12
In keeping with this objective, the goal of the SEA is to provide a framework that helps policy-makers, financiers, and providers of education answer questions that help improve the performance of the education system and improve the efficiency of the sector. Furthermore, since the SEA uses a standardized format, the information that it provides allows meaningful intra- and inter-state comparisons. SEA is a method to analyze the flow of funds within the educational system based on an analysis of educational expenditures made during a specified period of time. Because expenditures are so essential to the SEA, one of the first steps in SEA is to establish boundaries and definitions for the key technical components, as well as the categories and classifications used for organizing the data - of the SEA. While the four categories for organizing the data: Sources of Financing, Financing Agents, Providers of services or activities, Functions or services or activities, remain constant from state to state within a country, the classifications within each category are determined by the data available within the state. In order to ensure comparability of data between states, each state will use the generic broad classification based on the NEA classification. New subcategories may be added to reflect the reality of the state where the NEA/SEA is being conducted, in this case Sokoto state in Nigeria. The flow of funds is measured through four categories of entities:
1. Sources provide funds. Examples include: Ministry of Finance, households, international donors, private financers.
2. Financing agents have programmatic responsibilities and manage or organize services. They receive funds from sources and use them to pay for services such as Ministry of Education or denominational or private school networks.
3. Providers spend funds to deliver services. They include public or private schools, networks of schools or institutions. They are usually defined by the type and level of education provided.
4. Uses or Functions meaning what services are actually delivered such as classroom education, textbooks, school construction, or teacher training or education related activities such as room and board, transportation, uniforms.
3.3 Boundaries and Classifications for SEA- Public Sector Subaccount in
Sokoto State 3.3.1 Education Expenditures Education expenditures for SEA are defined as all expenditures for activities whose primary purpose is to improve and promote education activities for the nation (or state) and individuals. It includes all public expenditure regardless of the educational activity for which it is used and those private expenditures that are directly related to educational activities. Activities of education include those performed by institutions or individuals pursuing the following goals:
• Providing and administering all levels of public and private education system, from early childhood education to secondary education, covering basic education schools, secondary general and technical training;
• Increasing enrollment, completion, and promotion rates at basic and secondary school levels;
• Improving the quality and quantity (coverage) of formal education;
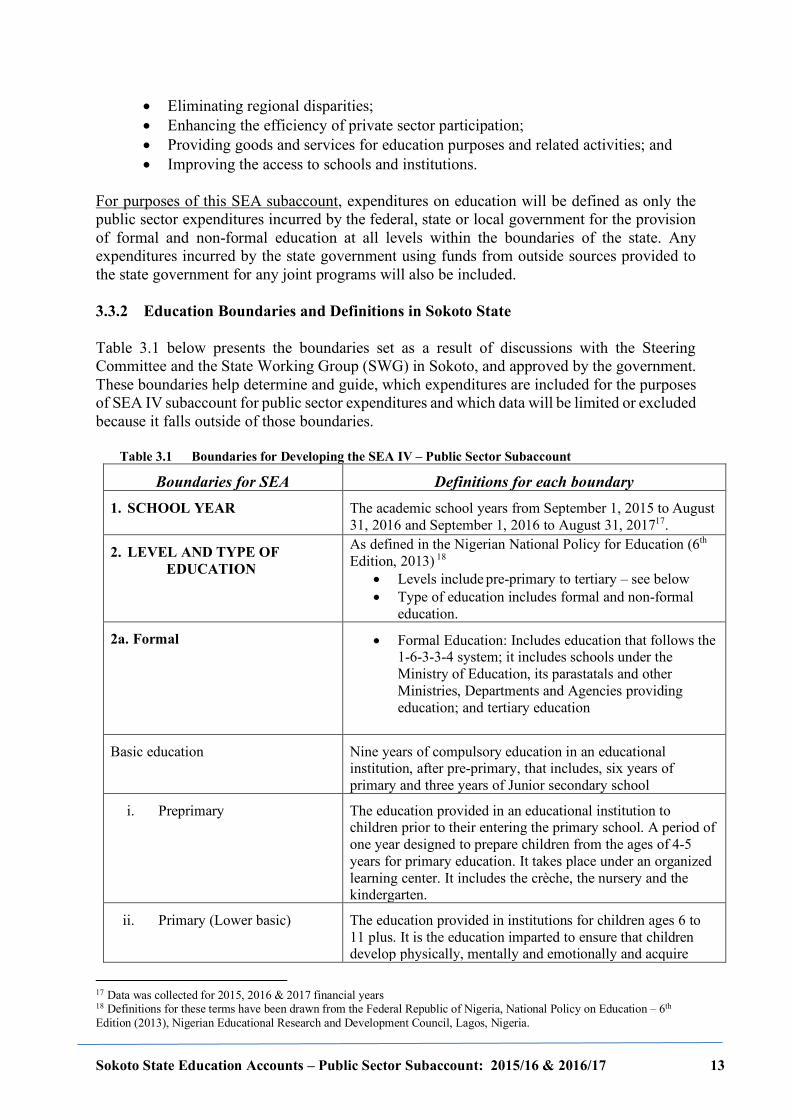
Sokoto State Education Accounts – Public Sector Subaccount: 2015/16 & 2016/17 13
• Eliminating regional disparities; • Enhancing the efficiency of private sector participation; • Providing goods and services for education purposes and related activities; and • Improving the access to schools and institutions.
For purposes of this SEA subaccount, expenditures on education will be defined as only the public sector expenditures incurred by the federal, state or local government for the provision of formal and non-formal education at all levels within the boundaries of the state. Any expenditures incurred by the state government using funds from outside sources provided to the state government for any joint programs will also be included. 3.3.2 Education Boundaries and Definitions in Sokoto State Table 3.1 below presents the boundaries set as a result of discussions with the Steering Committee and the State Working Group (SWG) in Sokoto, and approved by the government. These boundaries help determine and guide, which expenditures are included for the purposes of SEA IV subaccount for public sector expenditures and which data will be limited or excluded because it falls outside of those boundaries.
Table 3.1 Boundaries for Developing the SEA IV – Public Sector Subaccount
Boundaries for SEA Definitions for each boundary 1. SCHOOL YEAR The academic school years from September 1, 2015 to August
31, 2016 and September 1, 2016 to August 31, 201717.
2. LEVEL AND TYPE OF EDUCATION
As defined in the Nigerian National Policy for Education (6th Edition, 2013) 18
• Levels include pre-primary to tertiary – see below • Type of education includes formal and non-formal
education.
2a. Formal • Formal Education: Includes education that follows the 1-6-3-3-4 system; it includes schools under the Ministry of Education, its parastatals and other Ministries, Departments and Agencies providing education; and tertiary education
Basic education Nine years of compulsory education in an educational institution, after pre-primary, that includes, six years of primary and three years of Junior secondary school
i. Preprimary The education provided in an educational institution to children prior to their entering the primary school. A period of one year designed to prepare children from the ages of 4-5 years for primary education. It takes place under an organized learning center. It includes the crèche, the nursery and the kindergarten.
ii. Primary (Lower basic) The education provided in institutions for children ages 6 to 11 plus. It is the education imparted to ensure that children develop physically, mentally and emotionally and acquire
17 Data was collected for 2015, 2016 & 2017 financial years 18 Definitions for these terms have been drawn from the Federal Republic of Nigeria, National Policy on Education – 6th Edition (2013), Nigerian Educational Research and Development Council, Lagos, Nigeria.
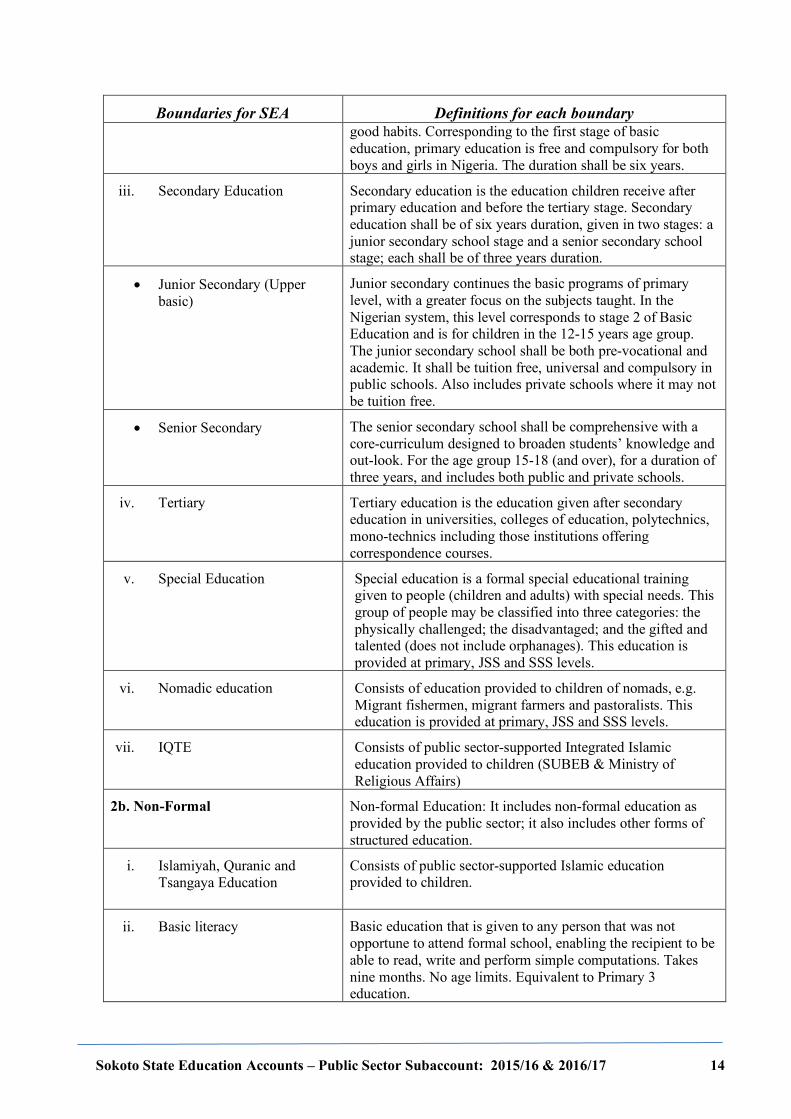
Sokoto State Education Accounts – Public Sector Subaccount: 2015/16 & 2016/17 14
Boundaries for SEA Definitions for each boundary good habits. Corresponding to the first stage of basic education, primary education is free and compulsory for both boys and girls in Nigeria. The duration shall be six years.
iii. Secondary Education Secondary education is the education children receive after primary education and before the tertiary stage. Secondary education shall be of six years duration, given in two stages: a junior secondary school stage and a senior secondary school stage; each shall be of three years duration.
• Junior Secondary (Upper basic)
Junior secondary continues the basic programs of primary level, with a greater focus on the subjects taught. In the Nigerian system, this level corresponds to stage 2 of Basic Education and is for children in the 12-15 years age group. The junior secondary school shall be both pre-vocational and academic. It shall be tuition free, universal and compulsory in public schools. Also includes private schools where it may not be tuition free.
• Senior Secondary The senior secondary school shall be comprehensive with a core-curriculum designed to broaden students’ knowledge and out-look. For the age group 15-18 (and over), for a duration of three years, and includes both public and private schools.
iv. Tertiary Tertiary education is the education given after secondary education in universities, colleges of education, polytechnics, mono-technics including those institutions offering correspondence courses.
v. Special Education Special education is a formal special educational training given to people (children and adults) with special needs. This group of people may be classified into three categories: the physically challenged; the disadvantaged; and the gifted and talented (does not include orphanages). This education is provided at primary, JSS and SSS levels.
vi. Nomadic education Consists of education provided to children of nomads, e.g. Migrant fishermen, migrant farmers and pastoralists. This education is provided at primary, JSS and SSS levels.
vii. IQTE Consists of public sector-supported Integrated Islamic education provided to children (SUBEB & Ministry of Religious Affairs)
2b. Non-Formal Non-formal Education: It includes non-formal education as provided by the public sector; it also includes other forms of structured education.
i. Islamiyah, Quranic and Tsangaya Education
Consists of public sector-supported Islamic education provided to children.
ii. Basic literacy Basic education that is given to any person that was not opportune to attend formal school, enabling the recipient to be able to read, write and perform simple computations. Takes nine months. No age limits. Equivalent to Primary 3 education.
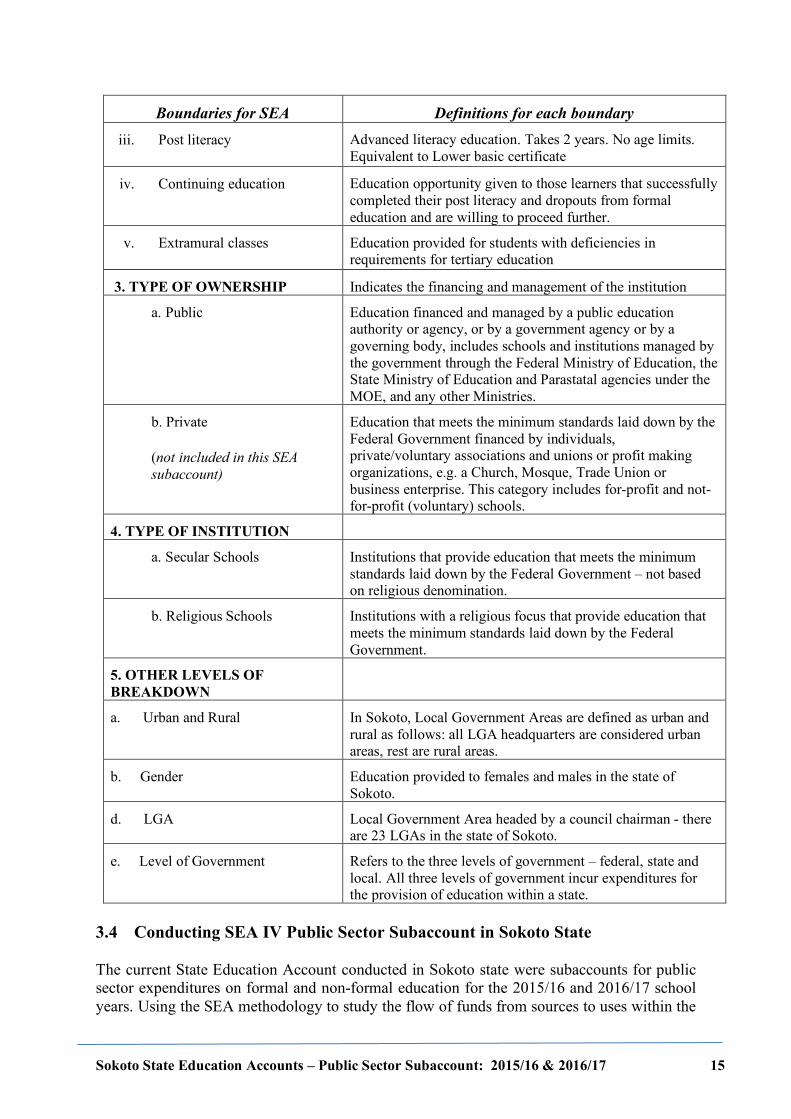
Sokoto State Education Accounts – Public Sector Subaccount: 2015/16 & 2016/17 15
Boundaries for SEA Definitions for each boundary iii. Post literacy Advanced literacy education. Takes 2 years. No age limits.
Equivalent to Lower basic certificate
iv. Continuing education Education opportunity given to those learners that successfully completed their post literacy and dropouts from formal education and are willing to proceed further.
v. Extramural classes Education provided for students with deficiencies in requirements for tertiary education
3. TYPE OF OWNERSHIP Indicates the financing and management of the institution
a. Public Education financed and managed by a public education authority or agency, or by a government agency or by a governing body, includes schools and institutions managed by the government through the Federal Ministry of Education, the State Ministry of Education and Parastatal agencies under the MOE, and any other Ministries.
b. Private
(not included in this SEA subaccount)
Education that meets the minimum standards laid down by the Federal Government financed by individuals, private/voluntary associations and unions or profit making organizations, e.g. a Church, Mosque, Trade Union or business enterprise. This category includes for-profit and not-for-profit (voluntary) schools.
4. TYPE OF INSTITUTION
a. Secular Schools Institutions that provide education that meets the minimum standards laid down by the Federal Government – not based on religious denomination.
b. Religious Schools Institutions with a religious focus that provide education that meets the minimum standards laid down by the Federal Government.
5. OTHER LEVELS OF BREAKDOWN
a. Urban and Rural In Sokoto, Local Government Areas are defined as urban and rural as follows: all LGA headquarters are considered urban areas, rest are rural areas.
b. Gender Education provided to females and males in the state of Sokoto.
d. LGA Local Government Area headed by a council chairman - there are 23 LGAs in the state of Sokoto.
e. Level of Government Refers to the three levels of government – federal, state and local. All three levels of government incur expenditures for the provision of education within a state.
3.4 Conducting SEA IV Public Sector Subaccount in Sokoto State The current State Education Account conducted in Sokoto state were subaccounts for public sector expenditures on formal and non-formal education for the 2015/16 and 2016/17 school years. Using the SEA methodology to study the flow of funds from sources to uses within the
Sokoto State Education Accounts – Public Sector Subaccount: 2015/16 & 2016/17 16
State data on public sector expenditures were collected, as appropriate, at the national, state and local levels. Below is a brief description of the implementation of the SEA, the identification and organization of data, collection of data, and analysis and dissemination. 3.4.1 Identification of a Working Group and the Steering Committee Keeping in view the fact that SEA is a tool for use by the government for a systematic assessment of the flow of funds in the education system, the technical team helped put together a steering committee to provide oversight to the process and a working group to actually conduct the activity. The Initiative project has put together a Sokoto State Basic Education Steering Committee (SBESC) comprised primarily of official policy makers and other high-level stakeholders such as academics and civil society representatives to guide the project as a whole. The SEA team has adopted the same steering committee as they have a full understanding of the context and can facilitate the SEA process as well as help make connections between the SEA and various activities of The Initiative project. These stakeholders were engaged at various points throughout the SEA project activities to help identify data sources, to facilitate data collection and review data collected, as well as to use SEA results to develop or implement education policies. Representatives of stakeholder groups were oriented to the SEA process and included as necessary for the successful implementation of the SEA process. The Steering Committee decided to maintain some of the previously identified members of the SEA Working Group (SWG) with additions from relevant MDAs. The SWG, responsible for most of the detailed technical work, was comprised of representatives from various government agencies whose assignments relate to education and public finance. It included officials from the Ministries of Basic and Secondary Education, Ministry of Finance, Ministry for Local Government Affairs, Ministry of Health, Ministry for Higher Education, SUBEB, etc. A list of members of the Steering Committee and the State Working Group who participated in the SEA (and are authors of this report) is included in Annex 3. 3.4.2 Sources of Data The data for SEA IV – the public sector subaccount – come from secondary sources. The Public-sector data includes government records from relevant agencies at all three levels – Federal, State and Local – of government. Each is described in turn.
(i) At the Federal level, it included agencies such as the Federal Ministry of Finance, Federal Ministry of Education, Tertiary Education Trust Fund (TETfund), and Universal Basic Education Commission (UBEC).
(ii) At the state level, the agencies included are the state ministries of Finance (MOF), Basic and Secondary Education (MOBSE), Higher Education (MHE), Health (MOH), and all parastatals that provide education related services. These parastatals can be broadly grouped into those associated with the MOBSE like SUBEB, Teachers Service Board, State Agency for Mass Education, etc., and those associated with MOH.
(iii) At the local government level, the data includes the expenditures on education by the local government councils and the local education authorities.
3.4.3 Data Collection Under the stewardship of the Steering Committee, the State Working Group (SWG) and the TAT, a number of surveys and administrative sources of data have been used to build the State
Sokoto State Education Accounts – Public Sector Subaccount: 2015/16 & 2016/17 17
Education Accounts IV for Sokoto State. Data was collected from the following organizations and agencies:
1) Federal Ministry of Finance, Federal Ministry of Education, UBEC, TETFund, etc.; 2) State Ministry of Finance, Ministry of Basic and Secondary Education and all its
parastatals, Ministry of Higher Education, Ministry of Health and its parastatals; 3) Ministry for Local Government and Community Development, Local Government
Councils; and 4) All public tertiary institutions in Sokoto State.
Separate survey instruments were developed for each source of data. A total of 38 instruments were developed made up of 9 for Federal agencies, 24 for state, 1 for LGCs, 1 for LGEAs. The SWG, with the assistance of the TAT, developed the instruments based on a review of the budget and plan documents for the various ministries and departments. Data was collected from 81 public sector agencies and organizations including 9 Federal agencies, 24 state, 23 LGAs, and 23 LGEAs. All public-sector data were collected by members of the SWG and the TAT. Members of the TAT trained the SWG members in data collection methodology to ensure consistency in the collection of data and supported them throughout the process. Unlike most SEAs that collect data for only one year and provide a snap shot of that period, it was decided with the SWG and the SSC that the SEA IV public sector subaccount would be conducted for the school years 2015/16 and 2016/17. These years were selected as these were the latest period of time for which most complete data are available and they spanned a time period after the onset of recession in Nigeria. Selecting a time period after the onset of recession would provide a snapshot of the impact, if any, of the recession on education spending in the state. This time period spans three financial years (FY): January to December 2015, January to December 2016 and January to December 2017. To make all expenditure data consistent with the school year, expenditure data was collected from FY 2015, 2016, and FY 2017, and then combined together based on a proportional allocation – one third from FY 2015 and two-thirds from FY 2016 for the academic year 2015/16 and one third from FY 2016 and two-thirds from FY 2017 for the academic year 2016/17 and presented as such in this report. The SEA tables, therefore, represent spending on education in Sokoto State over the school years 2015 to 2016 and 2016 to 2017. Apart from the data collected through a survey of the government agencies, the SEA also used information from the publicly available 2015 to 2017 budget data (audited actual expenditures) obtained from Ministry of Budget and Economic Planning, as well as school census and the school statistics and records as maintained by the state-based Education Management Information Systems. The different sources of data used permitted triangulation and cross-verification of expenditure and receipt data recorded by the spending and receiving institutions. Several cross flows in the education system were verified and triangulated. In instances where discrepancies were discovered, precedence was given to ‘Final Accounts’ of public institutions, including Ministry of Basic and Secondary Education and SUBEB, to ascertain the government’s expenditures on education. 3.4.4 Data Quality Process The Chairman of the SWG has the responsibility of managing the data collectors and the data
Sokoto State Education Accounts – Public Sector Subaccount: 2015/16 & 2016/17 18
collection process. The core team of the SWG is also deeply involved in managing the data collection. The TAT provides technical advice, training on development of tools and collection of data, as well as oversight to ensure that data is collected as per the SEA methodology. The TAT also supports the SWG in the validation and triangulation of data as well as its analysis. Various strategies were put in place to ensure data quality, including:
• Training was provided before the data collection to ensure that data collectors were familiar with and understood every single item in the data collection instrument and the protocols for data collection.
• Data collection responsibilities were shared with the consent of all the data collectors • All necessary data collection logistic support was provided. • Contact addresses of all data collectors and TAT members were shared to enable easy
access in case further clarification was required on any issue. • Progress in the field was monitored through follow-up phone calls and in-person
meetings with the TAT. • Data collectors identified to need support were visited in the field. Such visits were
found to be very helpful in explaining the purpose of the data collection to the organizations visited.
• Completed survey instruments were reviewed and validated. Few cases of incorrect entries observed were brought to the attention of the data collectors and the officers providing the data and revised as needed.
Additional strategies for ensuring data quality and validity were:
• A quality control section was built into the data collection instrument itself. The person that provides the data was required to SIGN and STAMP the form with official stamp of their office on the last page of the instrument (the data validation page). This ensures and provides verification that the data is genuine and was collected from the organization where the data is located.
• To further authenticate the data collected, the Chairman of the Core team was also required to review the completed instrument for the purpose of ensuring that the data collected is valid and reliable and approve it. The Chairman is familiar with the environment and the general pattern of expenditures in the state, and therefore is in a good position to validate the data collected.
• Finally, the TAT members also review the instruments for completeness and countersign the data validation page indicating the instrument has gone through all of the processes put in place for ensuring data quality.
3.4.5 Data Analysis Data collected from all sources for the development of SEA IV (public sector subaccount) was entered into a relational database specifically developed for the SEA. This allowed for the data to be analyzed with desired degrees of detail or aggregation. The SEA tables, also called the SEA Matrices, have been designed to meet the requirements of most of the information needs on educational expenditures and provide information disaggregated, to the extent possible, by the sources of financing, financing agents, providers of services and categories of expense and present it in a standardized format. This enables the determination of:
• The total level of expenditures for education that can be compared to socio-economic aggregates (GDP, public expenditures, population, number of pupils).
• The financing structure (for financing of education).in the state • The effort devoted to education by financing agents and by each source of financing
Sokoto State Education Accounts – Public Sector Subaccount: 2015/16 & 2016/17 19
(flow of funds from source of financing to financing agents). • Cost of different levels of education by environment (public) and the structure of
financing (flow from financing agents to educational levels). • Cost of production of education by the various education service providers (public) by
location and type of school (flow from financing agents to educational service providers).
• Cost of production of services by category of expenditure, by the level of service provider, and by category of expenditure (type of expenditures of service providers)
• The average level of financing and average expenditure by level of school. The next sections report on the data from the SEA matrices and provide a sectoral analysis of the data as well as an analysis from a macro-economic and comparative perspective.
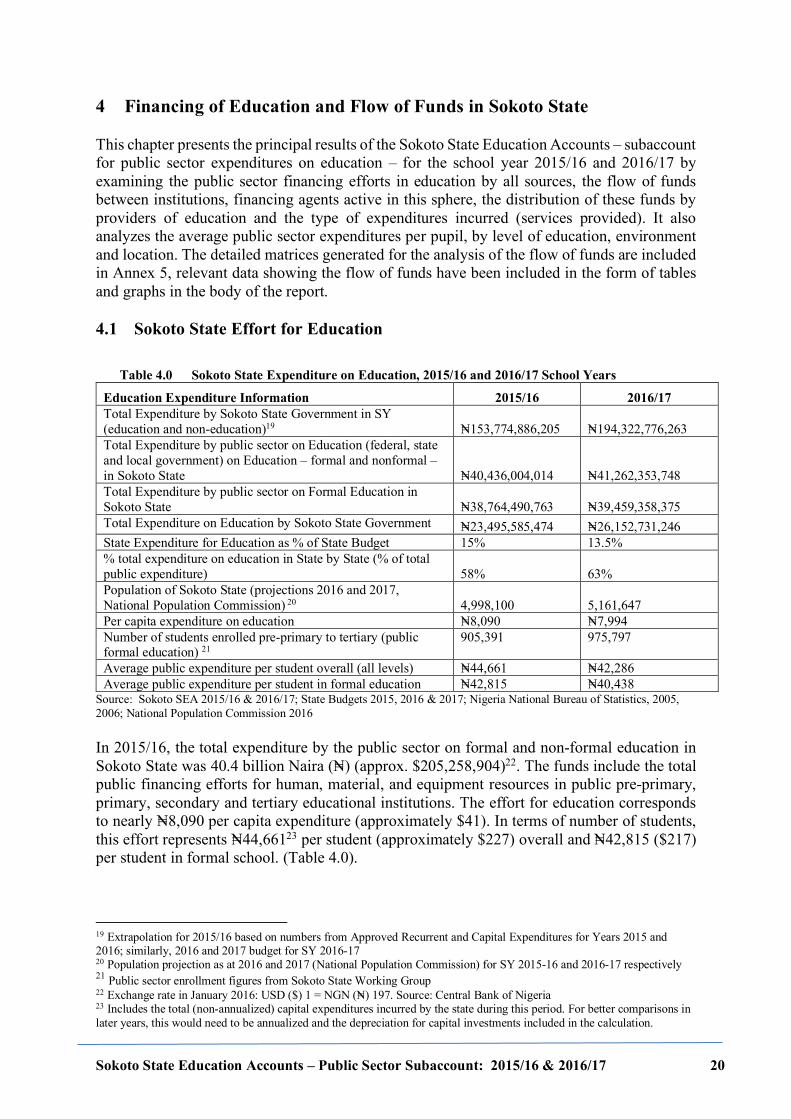
Sokoto State Education Accounts – Public Sector Subaccount: 2015/16 & 2016/17 20
4 Financing of Education and Flow of Funds in Sokoto State This chapter presents the principal results of the Sokoto State Education Accounts – subaccount for public sector expenditures on education – for the school year 2015/16 and 2016/17 by examining the public sector financing efforts in education by all sources, the flow of funds between institutions, financing agents active in this sphere, the distribution of these funds by providers of education and the type of expenditures incurred (services provided). It also analyzes the average public sector expenditures per pupil, by level of education, environment and location. The detailed matrices generated for the analysis of the flow of funds are included in Annex 5, relevant data showing the flow of funds have been included in the form of tables and graphs in the body of the report. 4.1 Sokoto State Effort for Education
Table 4.0 Sokoto State Expenditure on Education, 2015/16 and 2016/17 School Years
Education Expenditure Information 2015/16 2016/17 Total Expenditure by Sokoto State Government in SY (education and non-education)19 N=153,774,886,205 N=194,322,776,263 Total Expenditure by public sector on Education (federal, state and local government) on Education – formal and nonformal – in Sokoto State N=40,436,004,014 N=41,262,353,748 Total Expenditure by public sector on Formal Education in Sokoto State N=38,764,490,763 N=39,459,358,375 Total Expenditure on Education by Sokoto State Government N=23,495,585,474 N=26,152,731,246 State Expenditure for Education as % of State Budget 15% 13.5% % total expenditure on education in State by State (% of total public expenditure) 58% 63% Population of Sokoto State (projections 2016 and 2017, National Population Commission) 20 4,998,100 5,161,647 Per capita expenditure on education N=8,090 N=7,994 Number of students enrolled pre-primary to tertiary (public formal education) 21
905,391 975,797
Average public expenditure per student overall (all levels) N=44,661 N=42,286 Average public expenditure per student in formal education N=42,815 N=40,438
Source: Sokoto SEA 2015/16 & 2016/17; State Budgets 2015, 2016 & 2017; Nigeria National Bureau of Statistics, 2005, 2006; National Population Commission 2016 In 2015/16, the total expenditure by the public sector on formal and non-formal education in Sokoto State was 40.4 billion Naira (N=) (approx. $205,258,904)22. The funds include the total public financing efforts for human, material, and equipment resources in public pre-primary, primary, secondary and tertiary educational institutions. The effort for education corresponds to nearly N=8,090 per capita expenditure (approximately $41). In terms of number of students, this effort represents N=44,66123 per student (approximately $227) overall and N=42,815 ($217) per student in formal school. (Table 4.0).
19 Extrapolation for 2015/16 based on numbers from Approved Recurrent and Capital Expenditures for Years 2015 and 2016; similarly, 2016 and 2017 budget for SY 2016-17 20 Population projection as at 2016 and 2017 (National Population Commission) for SY 2015-16 and 2016-17 respectively 21 Public sector enrollment figures from Sokoto State Working Group 22 Exchange rate in January 2016: USD ($) 1 = NGN (N=) 197. Source: Central Bank of Nigeria 23 Includes the total (non-annualized) capital expenditures incurred by the state during this period. For better comparisons in later years, this would need to be annualized and the depreciation for capital investments included in the calculation.
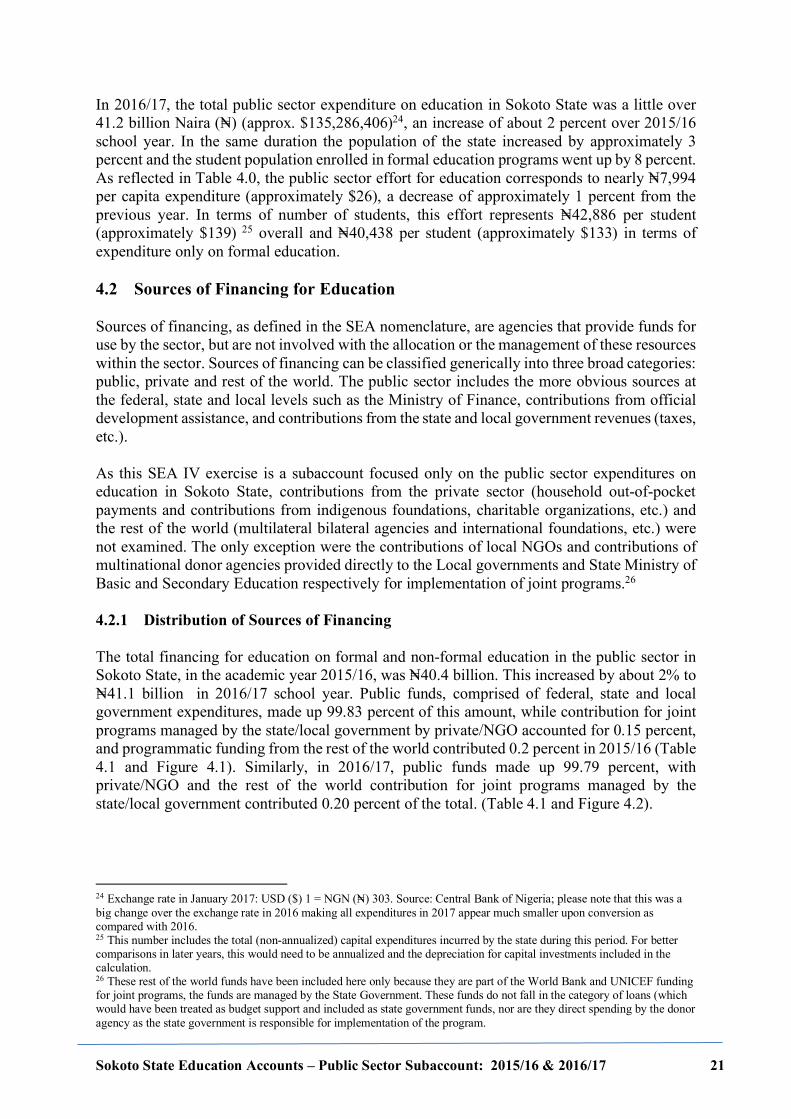
Sokoto State Education Accounts – Public Sector Subaccount: 2015/16 & 2016/17 21
In 2016/17, the total public sector expenditure on education in Sokoto State was a little over 41.2 billion Naira (N=) (approx. $135,286,406)24, an increase of about 2 percent over 2015/16 school year. In the same duration the population of the state increased by approximately 3 percent and the student population enrolled in formal education programs went up by 8 percent. As reflected in Table 4.0, the public sector effort for education corresponds to nearly N=7,994 per capita expenditure (approximately $26), a decrease of approximately 1 percent from the previous year. In terms of number of students, this effort represents N=42,886 per student (approximately $139) 25 overall and N=40,438 per student (approximately $133) in terms of expenditure only on formal education. 4.2 Sources of Financing for Education Sources of financing, as defined in the SEA nomenclature, are agencies that provide funds for use by the sector, but are not involved with the allocation or the management of these resources within the sector. Sources of financing can be classified generically into three broad categories: public, private and rest of the world. The public sector includes the more obvious sources at the federal, state and local levels such as the Ministry of Finance, contributions from official development assistance, and contributions from the state and local government revenues (taxes, etc.). As this SEA IV exercise is a subaccount focused only on the public sector expenditures on education in Sokoto State, contributions from the private sector (household out-of-pocket payments and contributions from indigenous foundations, charitable organizations, etc.) and the rest of the world (multilateral bilateral agencies and international foundations, etc.) were not examined. The only exception were the contributions of local NGOs and contributions of multinational donor agencies provided directly to the Local governments and State Ministry of Basic and Secondary Education respectively for implementation of joint programs.26 4.2.1 Distribution of Sources of Financing The total financing for education on formal and non-formal education in the public sector in Sokoto State, in the academic year 2015/16, was N=40.4 billion. This increased by about 2% to N=41.1 billion in 2016/17 school year. Public funds, comprised of federal, state and local government expenditures, made up 99.83 percent of this amount, while contribution for joint programs managed by the state/local government by private/NGO accounted for 0.15 percent, and programmatic funding from the rest of the world contributed 0.2 percent in 2015/16 (Table 4.1 and Figure 4.1). Similarly, in 2016/17, public funds made up 99.79 percent, with private/NGO and the rest of the world contribution for joint programs managed by the state/local government contributed 0.20 percent of the total. (Table 4.1 and Figure 4.2).
24 Exchange rate in January 2017: USD ($) 1 = NGN (N=) 303. Source: Central Bank of Nigeria; please note that this was a big change over the exchange rate in 2016 making all expenditures in 2017 appear much smaller upon conversion as compared with 2016. 25 This number includes the total (non-annualized) capital expenditures incurred by the state during this period. For better comparisons in later years, this would need to be annualized and the depreciation for capital investments included in the calculation. 26 These rest of the world funds have been included here only because they are part of the World Bank and UNICEF funding for joint programs, the funds are managed by the State Government. These funds do not fall in the category of loans (which would have been treated as budget support and included as state government funds, nor are they direct spending by the donor agency as the state government is responsible for implementation of the program.
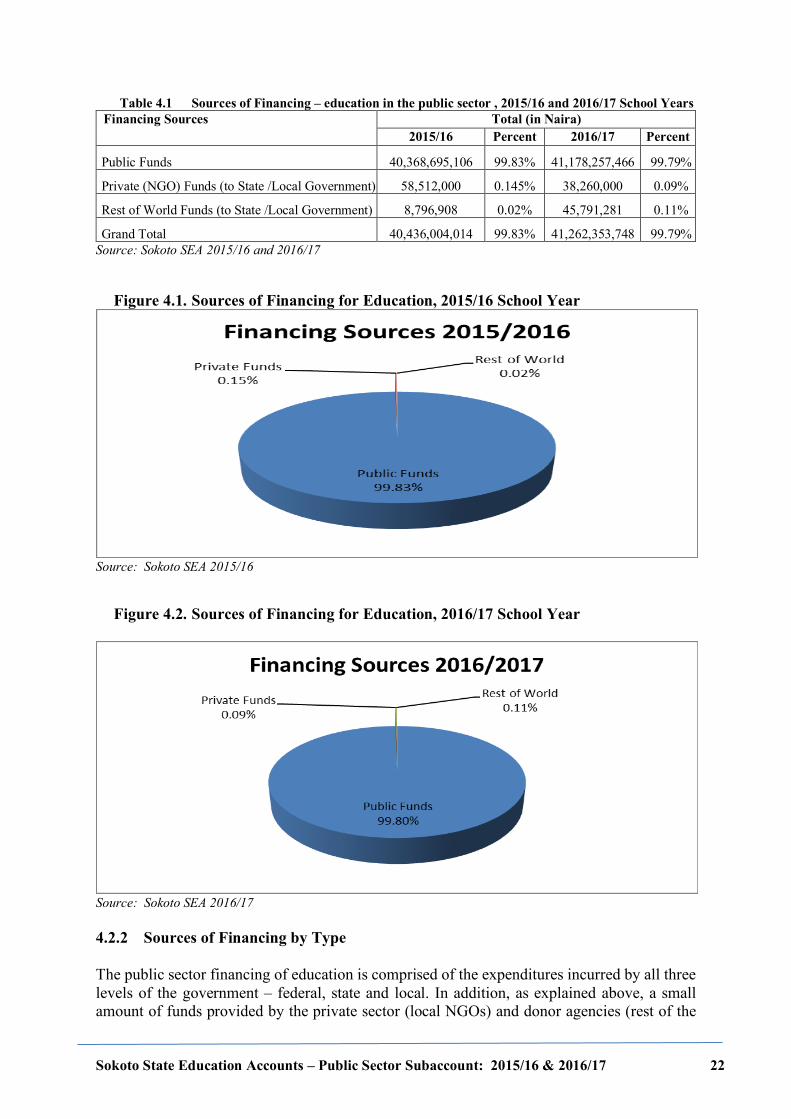
Sokoto State Education Accounts – Public Sector Subaccount: 2015/16 & 2016/17 22
Table 4.1 Sources of Financing – education in the public sector , 2015/16 and 2016/17 School Years Financing Sources Total (in Naira)
2015/16 Percent 2016/17 Percent
Public Funds 40,368,695,106 99.83% 41,178,257,466 99.79%
Private (NGO) Funds (to State /Local Government) 58,512,000 0.145% 38,260,000 0.09%
Rest of World Funds (to State /Local Government) 8,796,908 0.02% 45,791,281 0.11%
Grand Total 40,436,004,014 99.83% 41,262,353,748 99.79% Source: Sokoto SEA 2015/16 and 2016/17
Figure 4.1. Sources of Financing for Education, 2015/16 School Year
Source: Sokoto SEA 2015/16
Figure 4.2. Sources of Financing for Education, 2016/17 School Year
Source: Sokoto SEA 2016/17 4.2.2 Sources of Financing by Type The public sector financing of education is comprised of the expenditures incurred by all three levels of the government – federal, state and local. In addition, as explained above, a small amount of funds provided by the private sector (local NGOs) and donor agencies (rest of the
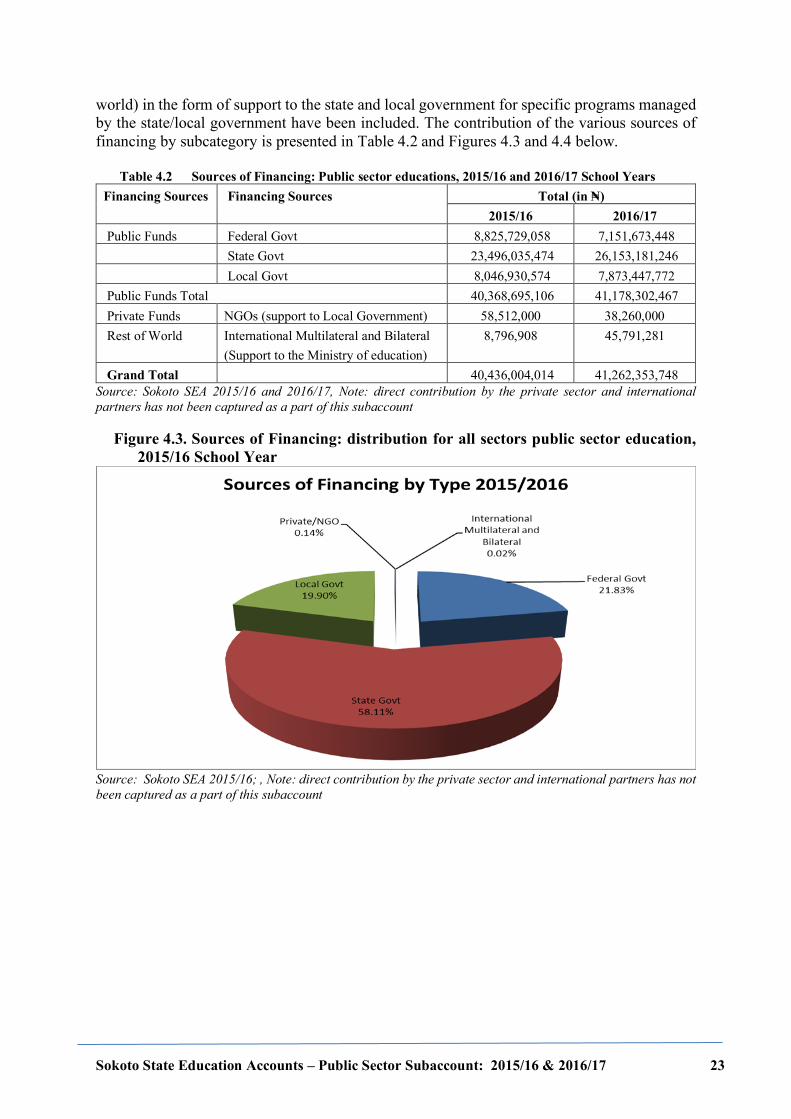
Sokoto State Education Accounts – Public Sector Subaccount: 2015/16 & 2016/17 23
world) in the form of support to the state and local government for specific programs managed by the state/local government have been included. The contribution of the various sources of financing by subcategory is presented in Table 4.2 and Figures 4.3 and 4.4 below.
Table 4.2 Sources of Financing: Public sector educations, 2015/16 and 2016/17 School Years Financing Sources Financing Sources Total (in N=)
2015/16 2016/17 Public Funds Federal Govt 8,825,729,058 7,151,673,448 State Govt 23,496,035,474 26,153,181,246 Local Govt 8,046,930,574 7,873,447,772 Public Funds Total 40,368,695,106 41,178,302,467 Private Funds NGOs (support to Local Government) 58,512,000 38,260,000 Rest of World International Multilateral and Bilateral
(Support to the Ministry of education) 8,796,908 45,791,281
Grand Total 40,436,004,014 41,262,353,748 Source: Sokoto SEA 2015/16 and 2016/17, Note: direct contribution by the private sector and international partners has not been captured as a part of this subaccount
Figure 4.3. Sources of Financing: distribution for all sectors public sector education, 2015/16 School Year
Source: Sokoto SEA 2015/16; , Note: direct contribution by the private sector and international partners has not been captured as a part of this subaccount
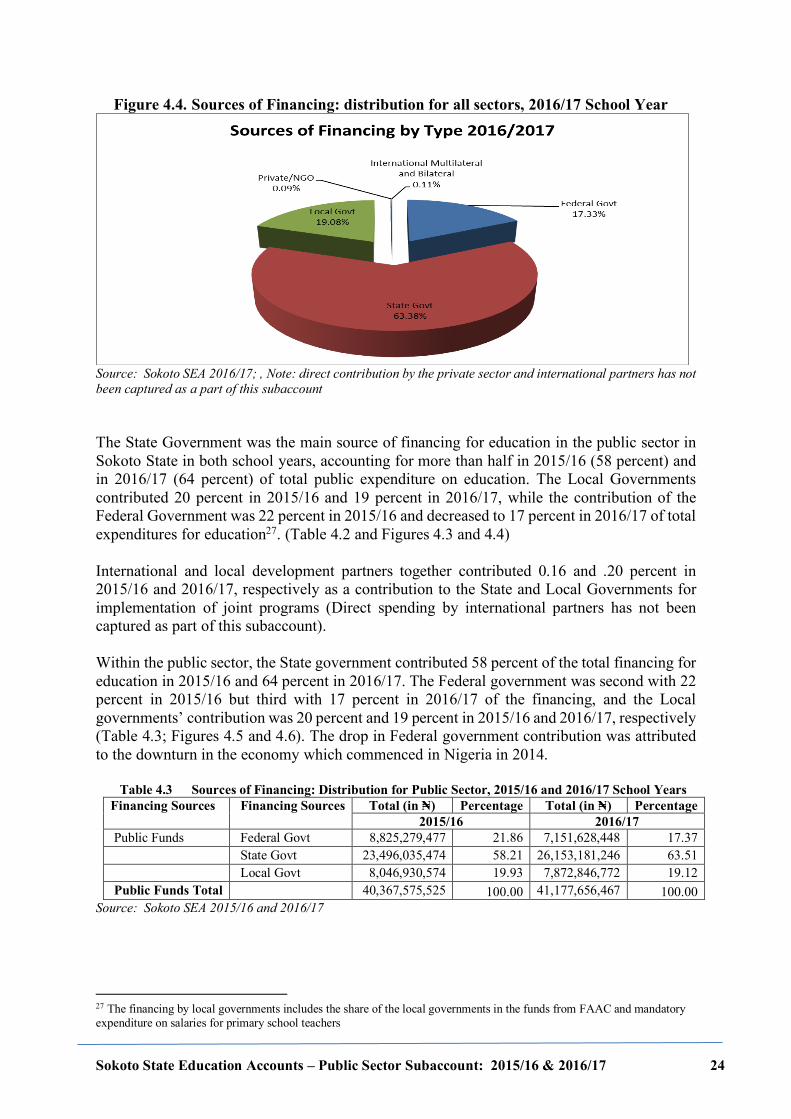
Sokoto State Education Accounts – Public Sector Subaccount: 2015/16 & 2016/17 24
Figure 4.4. Sources of Financing: distribution for all sectors, 2016/17 School Year
Source: Sokoto SEA 2016/17; , Note: direct contribution by the private sector and international partners has not been captured as a part of this subaccount The State Government was the main source of financing for education in the public sector in Sokoto State in both school years, accounting for more than half in 2015/16 (58 percent) and in 2016/17 (64 percent) of total public expenditure on education. The Local Governments contributed 20 percent in 2015/16 and 19 percent in 2016/17, while the contribution of the Federal Government was 22 percent in 2015/16 and decreased to 17 percent in 2016/17 of total expenditures for education27. (Table 4.2 and Figures 4.3 and 4.4) International and local development partners together contributed 0.16 and .20 percent in 2015/16 and 2016/17, respectively as a contribution to the State and Local Governments for implementation of joint programs (Direct spending by international partners has not been captured as part of this subaccount). Within the public sector, the State government contributed 58 percent of the total financing for education in 2015/16 and 64 percent in 2016/17. The Federal government was second with 22 percent in 2015/16 but third with 17 percent in 2016/17 of the financing, and the Local governments’ contribution was 20 percent and 19 percent in 2015/16 and 2016/17, respectively (Table 4.3; Figures 4.5 and 4.6). The drop in Federal government contribution was attributed to the downturn in the economy which commenced in Nigeria in 2014.
Table 4.3 Sources of Financing: Distribution for Public Sector, 2015/16 and 2016/17 School Years Financing Sources Financing Sources Total (in N=) Percentage Total (in N=) Percentage
2015/16 2016/17 Public Funds Federal Govt 8,825,279,477 21.86 7,151,628,448 17.37 State Govt 23,496,035,474 58.21 26,153,181,246 63.51 Local Govt 8,046,930,574 19.93 7,872,846,772 19.12 Public Funds Total 40,367,575,525 100.00 41,177,656,467 100.00
Source: Sokoto SEA 2015/16 and 2016/17
27 The financing by local governments includes the share of the local governments in the funds from FAAC and mandatory expenditure on salaries for primary school teachers
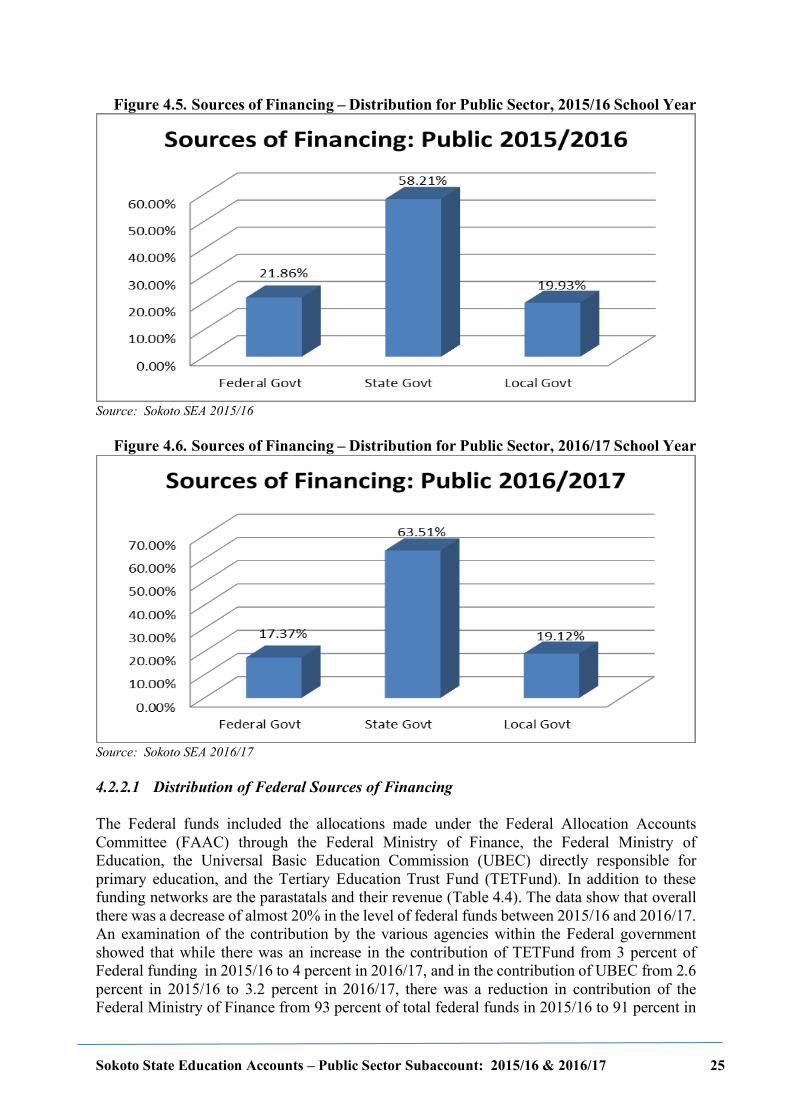
Sokoto State Education Accounts – Public Sector Subaccount: 2015/16 & 2016/17 25
Figure 4.5. Sources of Financing – Distribution for Public Sector, 2015/16 School Year
Source: Sokoto SEA 2015/16
Figure 4.6. Sources of Financing – Distribution for Public Sector, 2016/17 School Year
Source: Sokoto SEA 2016/17 4.2.2.1 Distribution of Federal Sources of Financing The Federal funds included the allocations made under the Federal Allocation Accounts Committee (FAAC) through the Federal Ministry of Finance, the Federal Ministry of Education, the Universal Basic Education Commission (UBEC) directly responsible for primary education, and the Tertiary Education Trust Fund (TETFund). In addition to these funding networks are the parastatals and their revenue (Table 4.4). The data show that overall there was a decrease of almost 20% in the level of federal funds between 2015/16 and 2016/17. An examination of the contribution by the various agencies within the Federal government showed that while there was an increase in the contribution of TETFund from 3 percent of Federal funding in 2015/16 to 4 percent in 2016/17, and in the contribution of UBEC from 2.6 percent in 2015/16 to 3.2 percent in 2016/17, there was a reduction in contribution of the Federal Ministry of Finance from 93 percent of total federal funds in 2015/16 to 91 percent in
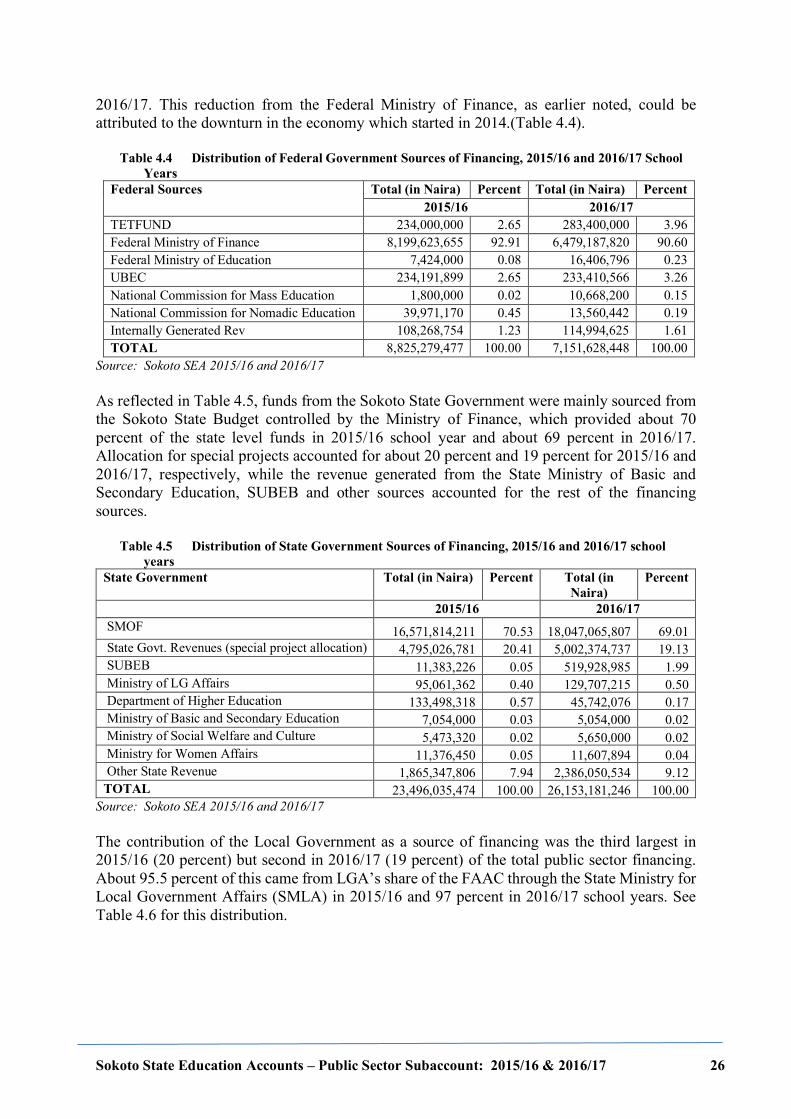
Sokoto State Education Accounts – Public Sector Subaccount: 2015/16 & 2016/17 26
2016/17. This reduction from the Federal Ministry of Finance, as earlier noted, could be attributed to the downturn in the economy which started in 2014.(Table 4.4).
Table 4.4 Distribution of Federal Government Sources of Financing, 2015/16 and 2016/17 School Years
Federal Sources Total (in Naira) Percent Total (in Naira) Percent 2015/16 2016/17
TETFUND 234,000,000 2.65 283,400,000 3.96 Federal Ministry of Finance 8,199,623,655 92.91 6,479,187,820 90.60 Federal Ministry of Education 7,424,000 0.08 16,406,796 0.23 UBEC 234,191,899 2.65 233,410,566 3.26 National Commission for Mass Education 1,800,000 0.02 10,668,200 0.15 National Commission for Nomadic Education 39,971,170 0.45 13,560,442 0.19 Internally Generated Rev 108,268,754 1.23 114,994,625 1.61 TOTAL 8,825,279,477 100.00 7,151,628,448 100.00
Source: Sokoto SEA 2015/16 and 2016/17 As reflected in Table 4.5, funds from the Sokoto State Government were mainly sourced from the Sokoto State Budget controlled by the Ministry of Finance, which provided about 70 percent of the state level funds in 2015/16 school year and about 69 percent in 2016/17. Allocation for special projects accounted for about 20 percent and 19 percent for 2015/16 and 2016/17, respectively, while the revenue generated from the State Ministry of Basic and Secondary Education, SUBEB and other sources accounted for the rest of the financing sources.
Table 4.5 Distribution of State Government Sources of Financing, 2015/16 and 2016/17 school years
State Government Total (in Naira) Percent Total (in Naira)
Percent
2015/16 2016/17 SMOF 16,571,814,211 70.53 18,047,065,807 69.01 State Govt. Revenues (special project allocation) 4,795,026,781 20.41 5,002,374,737 19.13 SUBEB 11,383,226 0.05 519,928,985 1.99 Ministry of LG Affairs 95,061,362 0.40 129,707,215 0.50 Department of Higher Education 133,498,318 0.57 45,742,076 0.17 Ministry of Basic and Secondary Education 7,054,000 0.03 5,054,000 0.02 Ministry of Social Welfare and Culture 5,473,320 0.02 5,650,000 0.02 Ministry for Women Affairs 11,376,450 0.05 11,607,894 0.04 Other State Revenue 1,865,347,806 7.94 2,386,050,534 9.12 TOTAL 23,496,035,474 100.00 26,153,181,246 100.00
Source: Sokoto SEA 2015/16 and 2016/17 The contribution of the Local Government as a source of financing was the third largest in 2015/16 (20 percent) but second in 2016/17 (19 percent) of the total public sector financing. About 95.5 percent of this came from LGA’s share of the FAAC through the State Ministry for Local Government Affairs (SMLA) in 2015/16 and 97 percent in 2016/17 school years. See Table 4.6 for this distribution.
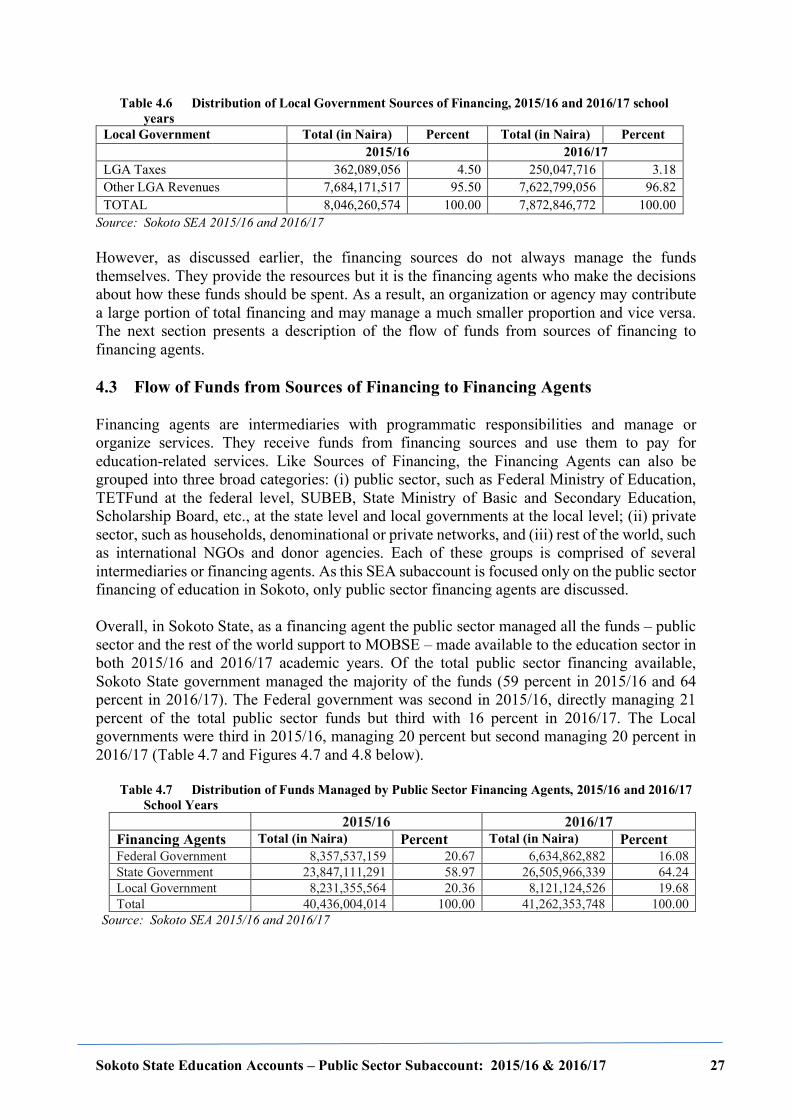
Sokoto State Education Accounts – Public Sector Subaccount: 2015/16 & 2016/17 27
Table 4.6 Distribution of Local Government Sources of Financing, 2015/16 and 2016/17 school years
Local Government Total (in Naira) Percent Total (in Naira) Percent 2015/16 2016/17 LGA Taxes 362,089,056 4.50 250,047,716 3.18 Other LGA Revenues 7,684,171,517 95.50 7,622,799,056 96.82 TOTAL 8,046,260,574 100.00 7,872,846,772 100.00
Source: Sokoto SEA 2015/16 and 2016/17 However, as discussed earlier, the financing sources do not always manage the funds themselves. They provide the resources but it is the financing agents who make the decisions about how these funds should be spent. As a result, an organization or agency may contribute a large portion of total financing and may manage a much smaller proportion and vice versa. The next section presents a description of the flow of funds from sources of financing to financing agents. 4.3 Flow of Funds from Sources of Financing to Financing Agents Financing agents are intermediaries with programmatic responsibilities and manage or organize services. They receive funds from financing sources and use them to pay for education-related services. Like Sources of Financing, the Financing Agents can also be grouped into three broad categories: (i) public sector, such as Federal Ministry of Education, TETFund at the federal level, SUBEB, State Ministry of Basic and Secondary Education, Scholarship Board, etc., at the state level and local governments at the local level; (ii) private sector, such as households, denominational or private networks, and (iii) rest of the world, such as international NGOs and donor agencies. Each of these groups is comprised of several intermediaries or financing agents. As this SEA subaccount is focused only on the public sector financing of education in Sokoto, only public sector financing agents are discussed. Overall, in Sokoto State, as a financing agent the public sector managed all the funds – public sector and the rest of the world support to MOBSE – made available to the education sector in both 2015/16 and 2016/17 academic years. Of the total public sector financing available, Sokoto State government managed the majority of the funds (59 percent in 2015/16 and 64 percent in 2016/17). The Federal government was second in 2015/16, directly managing 21 percent of the total public sector funds but third with 16 percent in 2016/17. The Local governments were third in 2015/16, managing 20 percent but second managing 20 percent in 2016/17 (Table 4.7 and Figures 4.7 and 4.8 below).
Table 4.7 Distribution of Funds Managed by Public Sector Financing Agents, 2015/16 and 2016/17 School Years
2015/16 2016/17 Financing Agents Total (in Naira) Percent Total (in Naira) Percent Federal Government 8,357,537,159 20.67 6,634,862,882 16.08 State Government 23,847,111,291 58.97 26,505,966,339 64.24 Local Government 8,231,355,564 20.36 8,121,124,526 19.68 Total 40,436,004,014 100.00 41,262,353,748 100.00
Source: Sokoto SEA 2015/16 and 2016/17
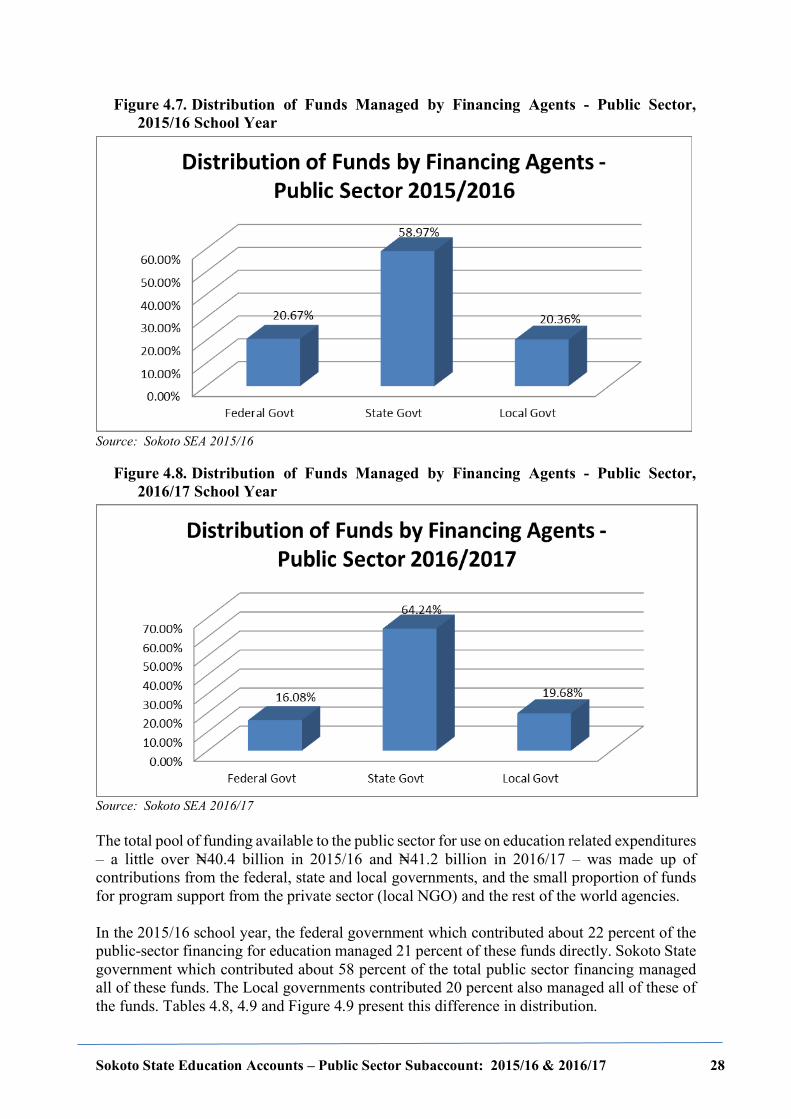
Sokoto State Education Accounts – Public Sector Subaccount: 2015/16 & 2016/17 28
Figure 4.7. Distribution of Funds Managed by Financing Agents - Public Sector, 2015/16 School Year
Source: Sokoto SEA 2015/16
Figure 4.8. Distribution of Funds Managed by Financing Agents - Public Sector, 2016/17 School Year
Source: Sokoto SEA 2016/17 The total pool of funding available to the public sector for use on education related expenditures – a little over N=40.4 billion in 2015/16 and N=41.2 billion in 2016/17 – was made up of contributions from the federal, state and local governments, and the small proportion of funds for program support from the private sector (local NGO) and the rest of the world agencies. In the 2015/16 school year, the federal government which contributed about 22 percent of the public-sector financing for education managed 21 percent of these funds directly. Sokoto State government which contributed about 58 percent of the total public sector financing managed all of these funds. The Local governments contributed 20 percent also managed all of these of the funds. Tables 4.8, 4.9 and Figure 4.9 present this difference in distribution.
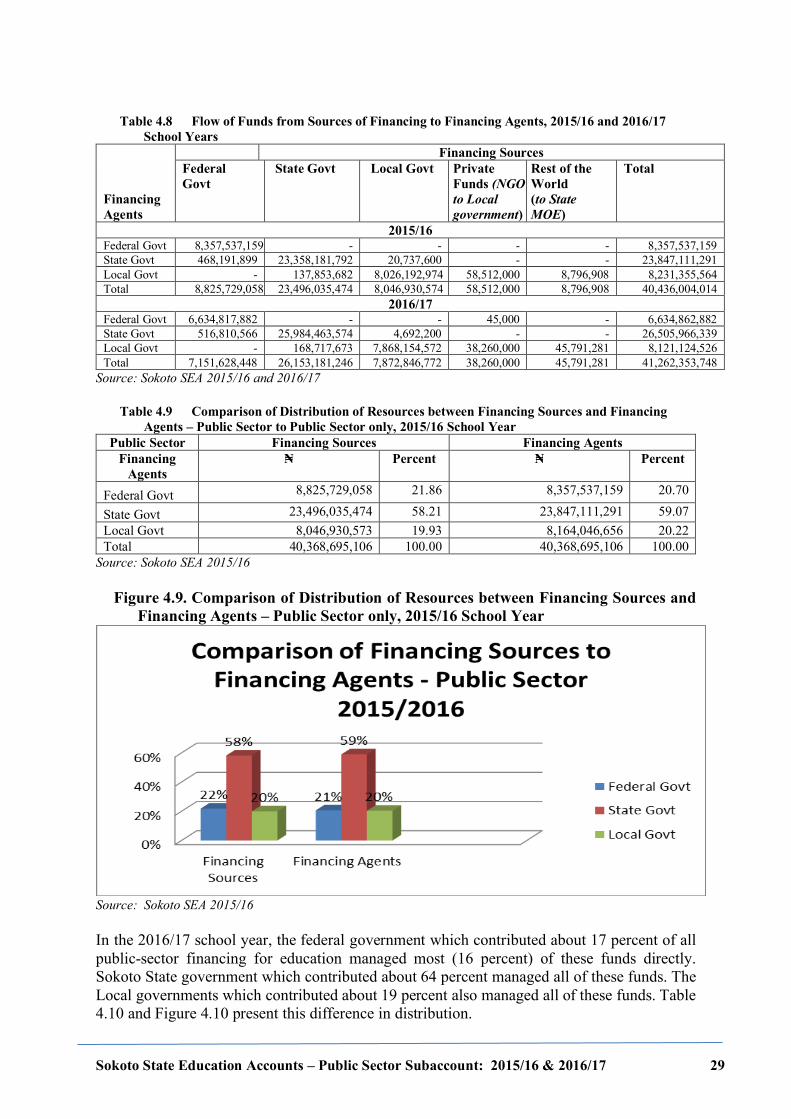
Sokoto State Education Accounts – Public Sector Subaccount: 2015/16 & 2016/17 29
Table 4.8 Flow of Funds from Sources of Financing to Financing Agents, 2015/16 and 2016/17
School Years
Financing Agents
Financing Sources Federal Govt
State Govt Local Govt Private Funds (NGO to Local government)
Rest of the World (to State MOE)
Total
2015/16 Federal Govt 8,357,537,159 - - - - 8,357,537,159 State Govt 468,191,899 23,358,181,792 20,737,600 - - 23,847,111,291 Local Govt - 137,853,682 8,026,192,974 58,512,000 8,796,908 8,231,355,564 Total 8,825,729,058 23,496,035,474 8,046,930,574 58,512,000 8,796,908 40,436,004,014
2016/17 Federal Govt 6,634,817,882 - - 45,000 - 6,634,862,882 State Govt 516,810,566 25,984,463,574 4,692,200 - - 26,505,966,339 Local Govt - 168,717,673 7,868,154,572 38,260,000 45,791,281 8,121,124,526 Total 7,151,628,448 26,153,181,246 7,872,846,772 38,260,000 45,791,281 41,262,353,748
Source: Sokoto SEA 2015/16 and 2016/17
Table 4.9 Comparison of Distribution of Resources between Financing Sources and Financing Agents – Public Sector to Public Sector only, 2015/16 School Year
Public Sector Financing Sources Financing Agents Financing
Agents N= Percent N= Percent
Federal Govt 8,825,729,058 21.86 8,357,537,159 20.70
State Govt 23,496,035,474 58.21 23,847,111,291 59.07 Local Govt 8,046,930,573 19.93 8,164,046,656 20.22 Total 40,368,695,106 100.00 40,368,695,106 100.00
Source: Sokoto SEA 2015/16
Figure 4.9. Comparison of Distribution of Resources between Financing Sources and Financing Agents – Public Sector only, 2015/16 School Year
Source: Sokoto SEA 2015/16 In the 2016/17 school year, the federal government which contributed about 17 percent of all public-sector financing for education managed most (16 percent) of these funds directly. Sokoto State government which contributed about 64 percent managed all of these funds. The Local governments which contributed about 19 percent also managed all of these funds. Table 4.10 and Figure 4.10 present this difference in distribution.
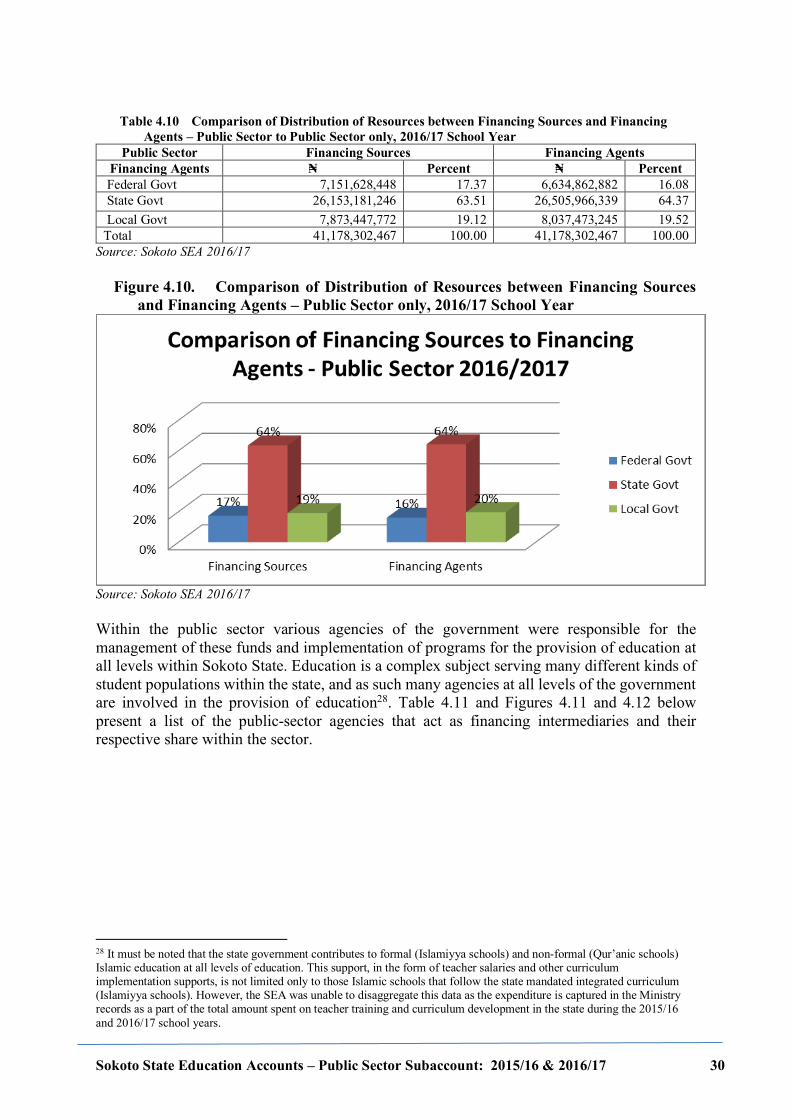
Sokoto State Education Accounts – Public Sector Subaccount: 2015/16 & 2016/17 30
Table 4.10 Comparison of Distribution of Resources between Financing Sources and Financing
Agents – Public Sector to Public Sector only, 2016/17 School Year Public Sector Financing Sources Financing Agents
Financing Agents N= Percent N= Percent Federal Govt 7,151,628,448 17.37 6,634,862,882 16.08 State Govt 26,153,181,246 63.51 26,505,966,339 64.37 Local Govt 7,873,447,772 19.12 8,037,473,245 19.52 Total 41,178,302,467 100.00 41,178,302,467 100.00
Source: Sokoto SEA 2016/17
Figure 4.10. Comparison of Distribution of Resources between Financing Sources and Financing Agents – Public Sector only, 2016/17 School Year
Source: Sokoto SEA 2016/17 Within the public sector various agencies of the government were responsible for the management of these funds and implementation of programs for the provision of education at all levels within Sokoto State. Education is a complex subject serving many different kinds of student populations within the state, and as such many agencies at all levels of the government are involved in the provision of education28. Table 4.11 and Figures 4.11 and 4.12 below present a list of the public-sector agencies that act as financing intermediaries and their respective share within the sector.
28 It must be noted that the state government contributes to formal (Islamiyya schools) and non-formal (Qur’anic schools) Islamic education at all levels of education. This support, in the form of teacher salaries and other curriculum implementation supports, is not limited only to those Islamic schools that follow the state mandated integrated curriculum (Islamiyya schools). However, the SEA was unable to disaggregate this data as the expenditure is captured in the Ministry records as a part of the total amount spent on teacher training and curriculum development in the state during the 2015/16 and 2016/17 school years.
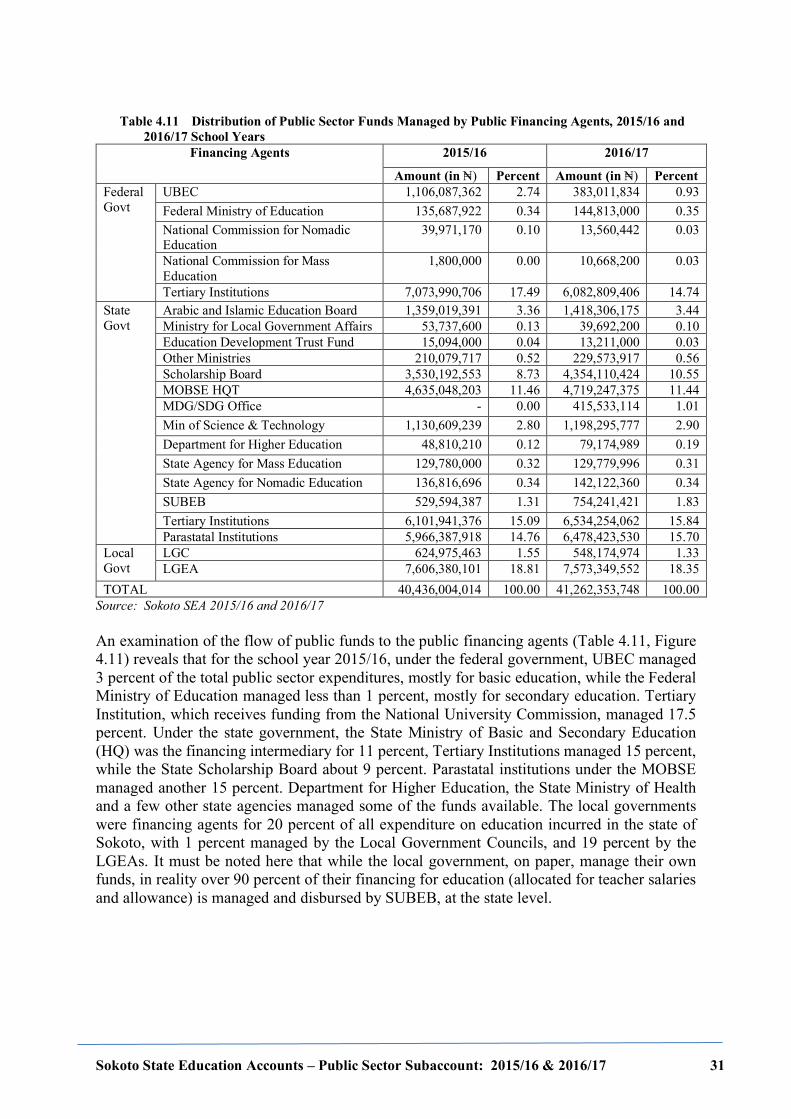
Sokoto State Education Accounts – Public Sector Subaccount: 2015/16 & 2016/17 31
Table 4.11 Distribution of Public Sector Funds Managed by Public Financing Agents, 2015/16 and
2016/17 School Years Financing Agents 2015/16 2016/17
Amount (in N=) Percent Amount (in N=) Percent Federal Govt
UBEC 1,106,087,362 2.74 383,011,834 0.93 Federal Ministry of Education 135,687,922 0.34 144,813,000 0.35 National Commission for Nomadic Education
39,971,170 0.10 13,560,442 0.03
National Commission for Mass Education
1,800,000 0.00 10,668,200 0.03
Tertiary Institutions 7,073,990,706 17.49 6,082,809,406 14.74 State Govt
Arabic and Islamic Education Board 1,359,019,391 3.36 1,418,306,175 3.44 Ministry for Local Government Affairs 53,737,600 0.13 39,692,200 0.10 Education Development Trust Fund 15,094,000 0.04 13,211,000 0.03 Other Ministries 210,079,717 0.52 229,573,917 0.56 Scholarship Board 3,530,192,553 8.73 4,354,110,424 10.55 MOBSE HQT 4,635,048,203 11.46 4,719,247,375 11.44 MDG/SDG Office - 0.00 415,533,114 1.01 Min of Science & Technology 1,130,609,239 2.80 1,198,295,777 2.90 Department for Higher Education 48,810,210 0.12 79,174,989 0.19 State Agency for Mass Education 129,780,000 0.32 129,779,996 0.31 State Agency for Nomadic Education 136,816,696 0.34 142,122,360 0.34 SUBEB 529,594,387 1.31 754,241,421 1.83 Tertiary Institutions 6,101,941,376 15.09 6,534,254,062 15.84 Parastatal Institutions 5,966,387,918 14.76 6,478,423,530 15.70
Local Govt
LGC 624,975,463 1.55 548,174,974 1.33 LGEA 7,606,380,101 18.81 7,573,349,552 18.35
TOTAL 40,436,004,014 100.00 41,262,353,748 100.00 Source: Sokoto SEA 2015/16 and 2016/17 An examination of the flow of public funds to the public financing agents (Table 4.11, Figure 4.11) reveals that for the school year 2015/16, under the federal government, UBEC managed 3 percent of the total public sector expenditures, mostly for basic education, while the Federal Ministry of Education managed less than 1 percent, mostly for secondary education. Tertiary Institution, which receives funding from the National University Commission, managed 17.5 percent. Under the state government, the State Ministry of Basic and Secondary Education (HQ) was the financing intermediary for 11 percent, Tertiary Institutions managed 15 percent, while the State Scholarship Board about 9 percent. Parastatal institutions under the MOBSE managed another 15 percent. Department for Higher Education, the State Ministry of Health and a few other state agencies managed some of the funds available. The local governments were financing agents for 20 percent of all expenditure on education incurred in the state of Sokoto, with 1 percent managed by the Local Government Councils, and 19 percent by the LGEAs. It must be noted here that while the local government, on paper, manage their own funds, in reality over 90 percent of their financing for education (allocated for teacher salaries and allowance) is managed and disbursed by SUBEB, at the state level.
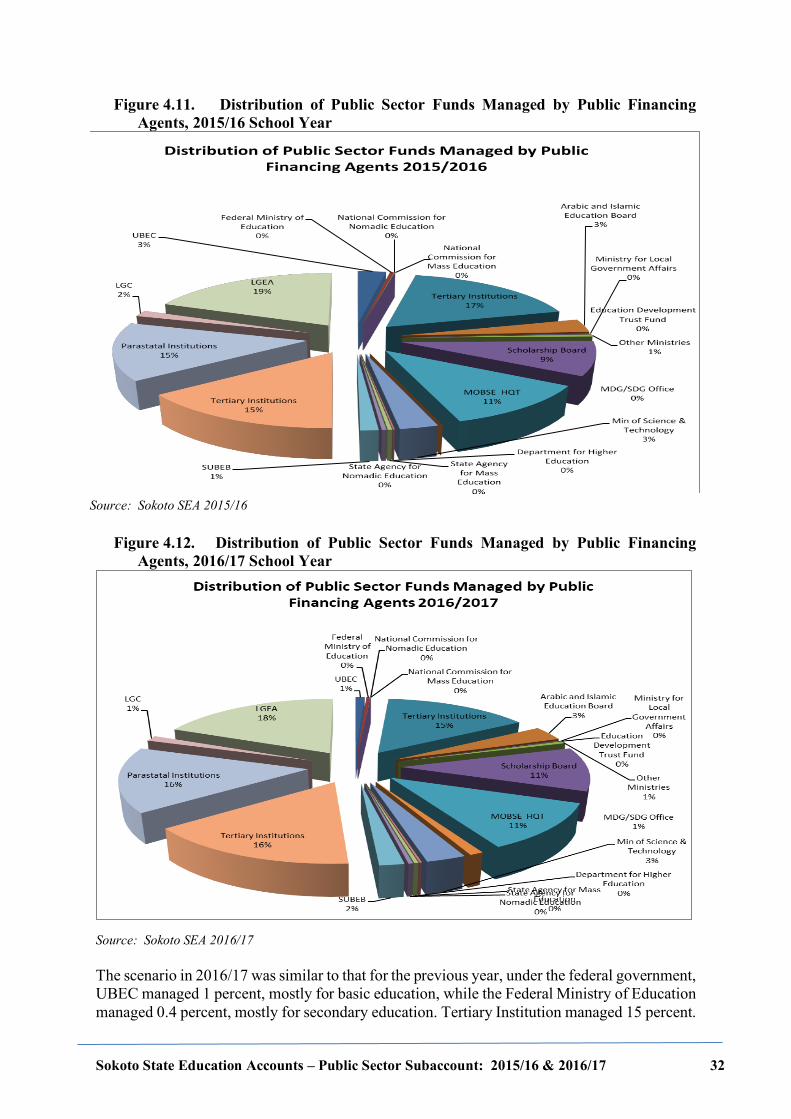
Sokoto State Education Accounts – Public Sector Subaccount: 2015/16 & 2016/17 32
Figure 4.11. Distribution of Public Sector Funds Managed by Public Financing Agents, 2015/16 School Year
Source: Sokoto SEA 2015/16
Figure 4.12. Distribution of Public Sector Funds Managed by Public Financing Agents, 2016/17 School Year
Source: Sokoto SEA 2016/17 The scenario in 2016/17 was similar to that for the previous year, under the federal government, UBEC managed 1 percent, mostly for basic education, while the Federal Ministry of Education managed 0.4 percent, mostly for secondary education. Tertiary Institution managed 15 percent.
Sokoto State Education Accounts – Public Sector Subaccount: 2015/16 & 2016/17 33
Under the state government, the State Ministry of Basic and Secondary Education (HQ) was the financing intermediary for 11 percent, Tertiary Institutions managed 16 percent, while the State Scholarship Board about 11 percent. Parastatal institutions under the MOBSE managed another 16 percent. Department for Higher Education, the State Ministry of Health and a few other state agencies managed some of the funds available. Within the local governments, the Local Government Councils managed about 1 percent while 18 percent was managed by the LGEAs. (Table 4.11, Figure 4.12). 4.4 Flow of Funds from Financing Agents to Education Providers The State Education Accounts track the flow of funds from sources to uses, via financing agents and providers. We have described the financing sources and their contribution to the education sector in Sokoto State, the flow of funds from the sources to financing agents and their respective distribution. The next section examines the flow of funds from financing agents to providers of education. The SEA examines the allocation of funds for the provision of education at all levels in schools and institutions of higher education managed by the public sector. Providers of education can be looked at in one of several ways – by ownership – public and privately-owned institutions; by level of education – preprimary to tertiary, including formal and non-formal schools and overall administration of the system; by location – urban, rural or statewide; and by type of school – secular or integrated Islamiyya schools. 4.4.1 Financing Agent to Education Providers in Public Schools As noted earlier, the focus of this SEA subaccount is the public sector. Therefore, only education providers in the public sector are discussed. As in some other states, the Sokoto State Ministry of Education is involved in the funding and management of formal education at all levels, that is primary, junior secondary, senior secondary and tertiary. Available expenditure data is, however, not always disaggregated by these levels of education. We thus have lumping up of expenditure data in some cases. . In both years, 2015/16 and 2016/17, 98 percent of the funding for education was used in the provision of formal education, with only a small proportion going towards nonformal schools. A detailed analysis is below 4.4.1.1 Financing Agent to Education Providers by Level of Education In 2015/16 expenditures for education in Sokoto State were distributed as follows: 9.8 billion for basic education (24 percent), 7.5 billion for secondary education (19 percent), 13.7 million for special education (0.03 percent), 17 billion for tertiary education (42 percent), and 1.6 billion for non-formal education (4 percent). Of the total amount of approximately 40 billion, 38.7 billion (96 percent) was spent on formal education, while 1.6 billion (4 percent) was for the provision of non-formal education (Table 4.12 and Figures 4.13).
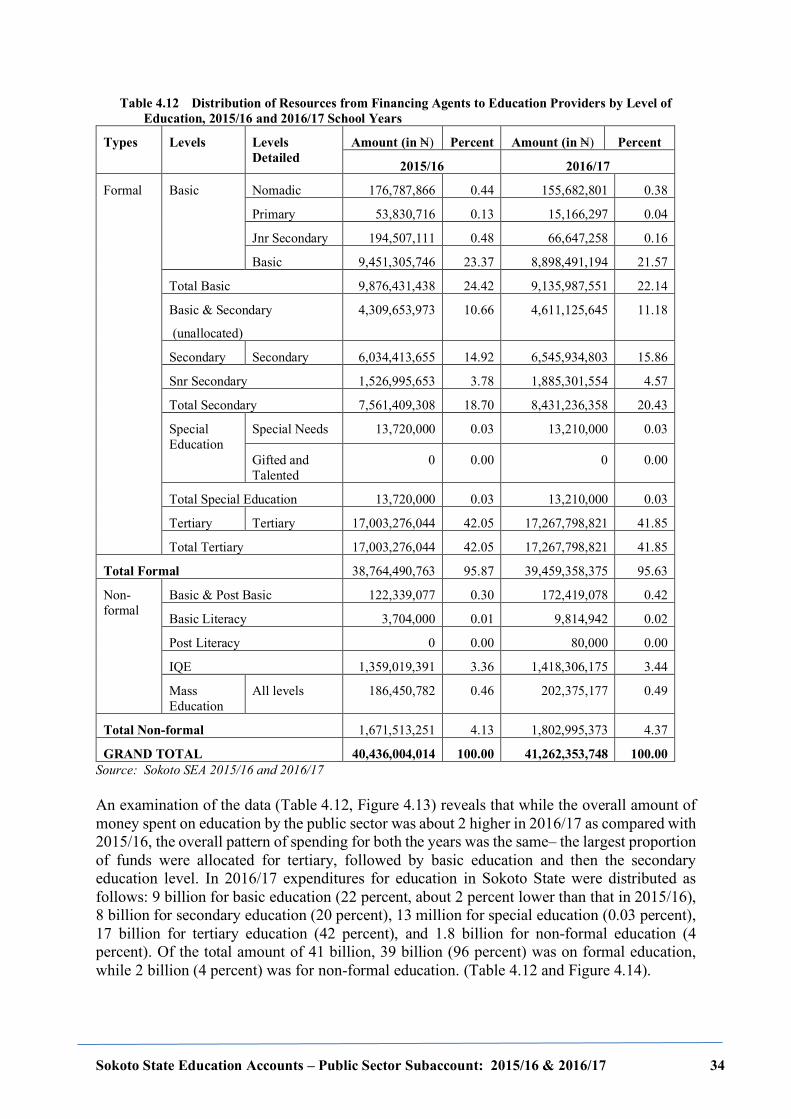
Sokoto State Education Accounts – Public Sector Subaccount: 2015/16 & 2016/17 34
Table 4.12 Distribution of Resources from Financing Agents to Education Providers by Level of Education, 2015/16 and 2016/17 School Years
Types Levels Levels Detailed
Amount (in N=) Percent Amount (in N=) Percent
2015/16 2016/17
Formal Basic Nomadic 176,787,866 0.44 155,682,801 0.38
Primary 53,830,716 0.13 15,166,297 0.04
Jnr Secondary 194,507,111 0.48 66,647,258 0.16
Basic 9,451,305,746 23.37 8,898,491,194 21.57
Total Basic 9,876,431,438 24.42 9,135,987,551 22.14
Basic & Secondary
(unallocated)
4,309,653,973 10.66 4,611,125,645 11.18
Secondary Secondary 6,034,413,655 14.92 6,545,934,803 15.86
Snr Secondary 1,526,995,653 3.78 1,885,301,554 4.57
Total Secondary 7,561,409,308 18.70 8,431,236,358 20.43
Special Education
Special Needs 13,720,000 0.03 13,210,000 0.03
Gifted and Talented
0 0.00 0 0.00
Total Special Education 13,720,000 0.03 13,210,000 0.03
Tertiary Tertiary 17,003,276,044 42.05 17,267,798,821 41.85
Total Tertiary 17,003,276,044 42.05 17,267,798,821 41.85
Total Formal 38,764,490,763 95.87 39,459,358,375 95.63
Non-formal
Basic & Post Basic 122,339,077 0.30 172,419,078 0.42
Basic Literacy 3,704,000 0.01 9,814,942 0.02
Post Literacy 0 0.00 80,000 0.00
IQE 1,359,019,391 3.36 1,418,306,175 3.44
Mass Education
All levels 186,450,782 0.46 202,375,177 0.49
Total Non-formal 1,671,513,251 4.13 1,802,995,373 4.37
GRAND TOTAL 40,436,004,014 100.00 41,262,353,748 100.00 Source: Sokoto SEA 2015/16 and 2016/17 An examination of the data (Table 4.12, Figure 4.13) reveals that while the overall amount of money spent on education by the public sector was about 2 higher in 2016/17 as compared with 2015/16, the overall pattern of spending for both the years was the same– the largest proportion of funds were allocated for tertiary, followed by basic education and then the secondary education level. In 2016/17 expenditures for education in Sokoto State were distributed as follows: 9 billion for basic education (22 percent, about 2 percent lower than that in 2015/16), 8 billion for secondary education (20 percent), 13 million for special education (0.03 percent), 17 billion for tertiary education (42 percent), and 1.8 billion for non-formal education (4 percent). Of the total amount of 41 billion, 39 billion (96 percent) was on formal education, while 2 billion (4 percent) was for non-formal education. (Table 4.12 and Figure 4.14).
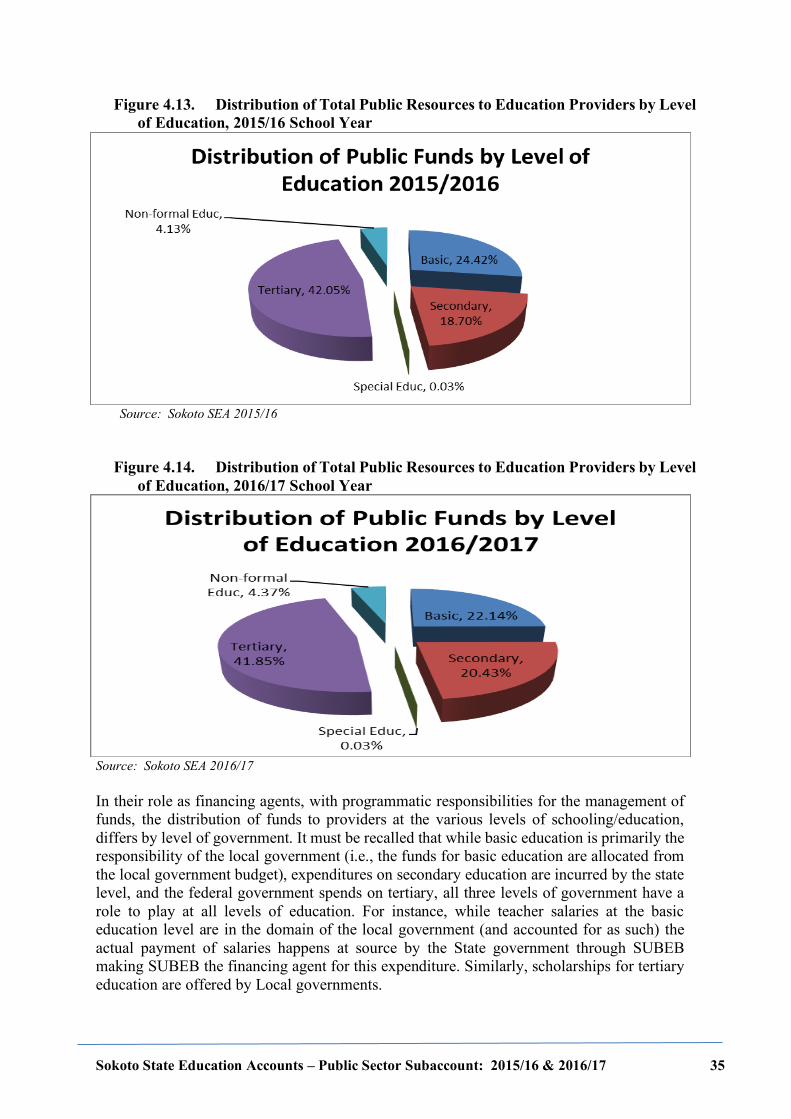
Sokoto State Education Accounts – Public Sector Subaccount: 2015/16 & 2016/17 35
Figure 4.13. Distribution of Total Public Resources to Education Providers by Level of Education, 2015/16 School Year
Source: Sokoto SEA 2015/16
Figure 4.14. Distribution of Total Public Resources to Education Providers by Level of Education, 2016/17 School Year
Source: Sokoto SEA 2016/17 In their role as financing agents, with programmatic responsibilities for the management of funds, the distribution of funds to providers at the various levels of schooling/education, differs by level of government. It must be recalled that while basic education is primarily the responsibility of the local government (i.e., the funds for basic education are allocated from the local government budget), expenditures on secondary education are incurred by the state level, and the federal government spends on tertiary, all three levels of government have a role to play at all levels of education. For instance, while teacher salaries at the basic education level are in the domain of the local government (and accounted for as such) the actual payment of salaries happens at source by the State government through SUBEB making SUBEB the financing agent for this expenditure. Similarly, scholarships for tertiary education are offered by Local governments.
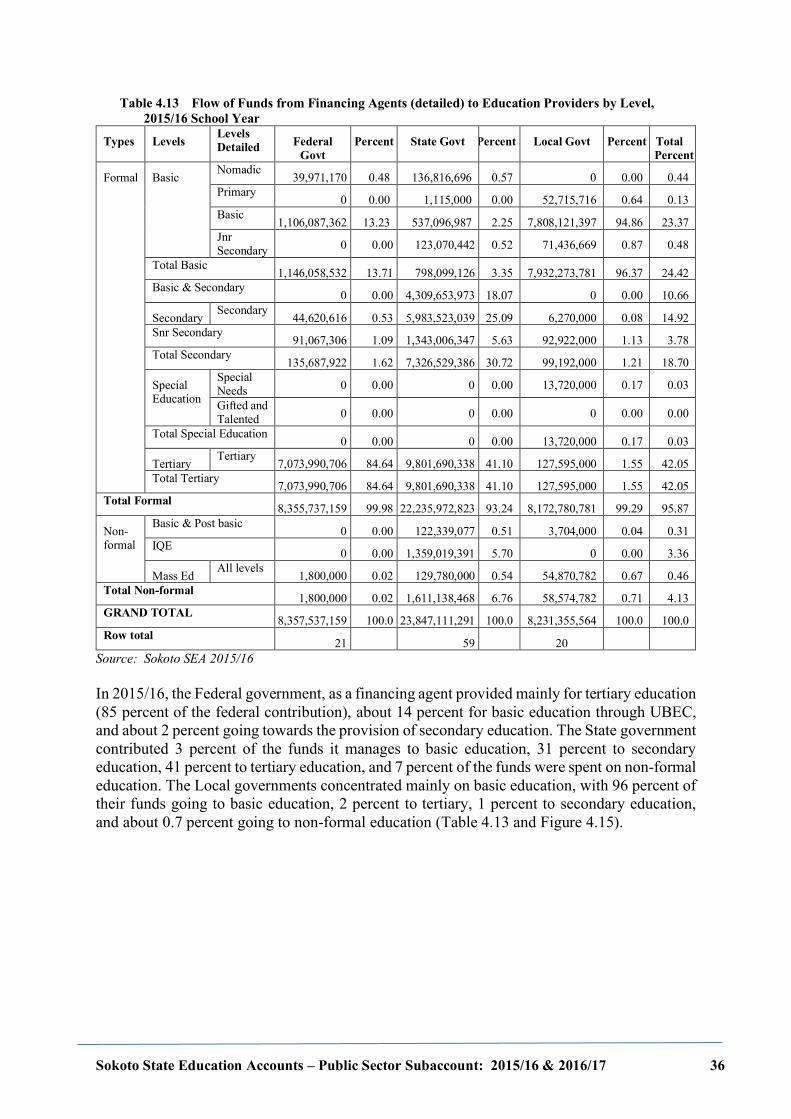
Sokoto State Education Accounts – Public Sector Subaccount: 2015/16 & 2016/17 36
Table 4.13 Flow of Funds from Financing Agents (detailed) to Education Providers by Level, 2015/16 School Year
Types Levels Levels Detailed Federal
Govt Percent State Govt Percent Local Govt Percent Total
Percent
Formal Basic Nomadic
39,971,170 0.48 136,816,696 0.57 0 0.00 0.44 Primary
0 0.00 1,115,000 0.00 52,715,716 0.64 0.13 Basic
1,106,087,362 13.23 537,096,987 2.25 7,808,121,397 94.86 23.37 Jnr Secondary 0 0.00 123,070,442 0.52 71,436,669 0.87 0.48
Total Basic 1,146,058,532 13.71 798,099,126 3.35 7,932,273,781 96.37 24.42
Basic & Secondary 0 0.00 4,309,653,973 18.07 0 0.00 10.66
Secondary Secondary
44,620,616 0.53 5,983,523,039 25.09 6,270,000 0.08 14.92 Snr Secondary
91,067,306 1.09 1,343,006,347 5.63 92,922,000 1.13 3.78 Total Secondary
135,687,922 1.62 7,326,529,386 30.72 99,192,000 1.21 18.70
Special Education
Special Needs 0 0.00 0 0.00 13,720,000 0.17 0.03
Gifted and Talented 0 0.00 0 0.00 0 0.00 0.00
Total Special Education 0 0.00 0 0.00 13,720,000 0.17 0.03
Tertiary Tertiary
7,073,990,706 84.64 9,801,690,338 41.10 127,595,000 1.55 42.05 Total Tertiary
7,073,990,706 84.64 9,801,690,338 41.10 127,595,000 1.55 42.05 Total Formal
8,355,737,159 99.98 22,235,972,823 93.24 8,172,780,781 99.29 95.87
Non-formal
Basic & Post basic 0 0.00 122,339,077 0.51 3,704,000 0.04 0.31
IQE 0 0.00 1,359,019,391 5.70 0 0.00 3.36
Mass Ed All levels
1,800,000 0.02 129,780,000 0.54 54,870,782 0.67 0.46 Total Non-formal
1,800,000 0.02 1,611,138,468 6.76 58,574,782 0.71 4.13 GRAND TOTAL
8,357,537,159 100.0 23,847,111,291 100.0 8,231,355,564 100.0 100.0 Row total
21 59 20 Source: Sokoto SEA 2015/16 In 2015/16, the Federal government, as a financing agent provided mainly for tertiary education (85 percent of the federal contribution), about 14 percent for basic education through UBEC, and about 2 percent going towards the provision of secondary education. The State government contributed 3 percent of the funds it manages to basic education, 31 percent to secondary education, 41 percent to tertiary education, and 7 percent of the funds were spent on non-formal education. The Local governments concentrated mainly on basic education, with 96 percent of their funds going to basic education, 2 percent to tertiary, 1 percent to secondary education, and about 0.7 percent going to non-formal education (Table 4.13 and Figure 4.15).
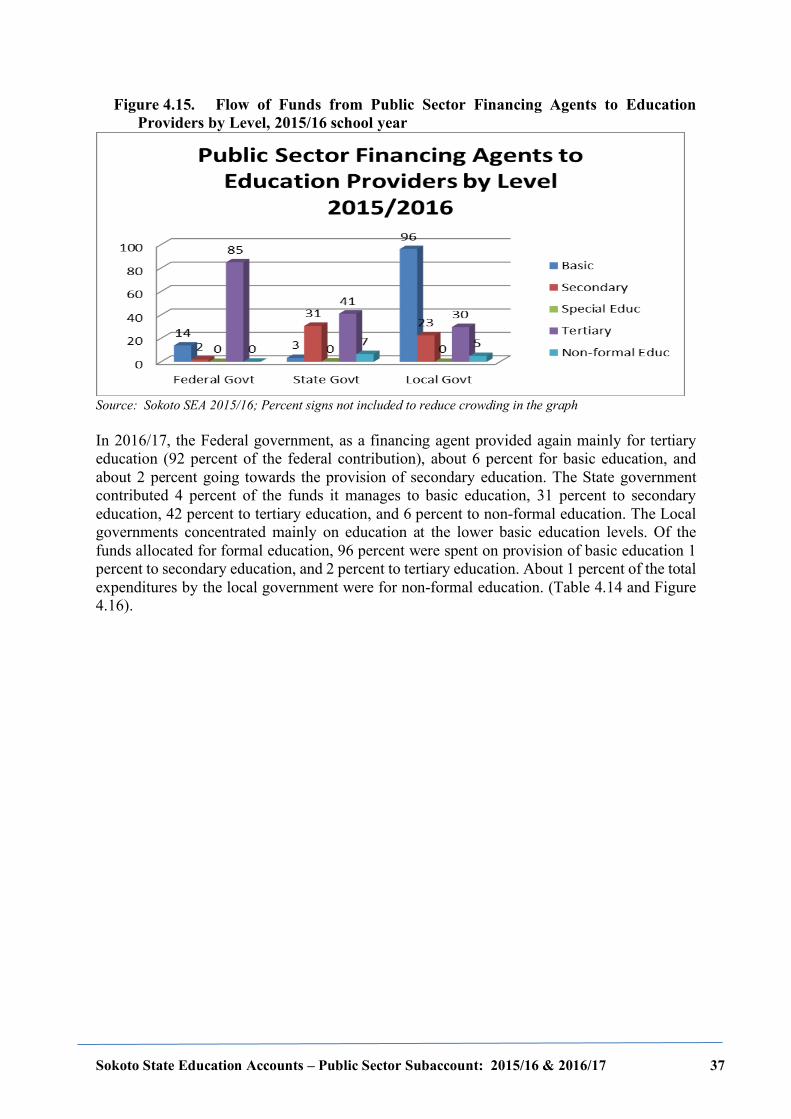
Sokoto State Education Accounts – Public Sector Subaccount: 2015/16 & 2016/17 37
Figure 4.15. Flow of Funds from Public Sector Financing Agents to Education Providers by Level, 2015/16 school year
Source: Sokoto SEA 2015/16; Percent signs not included to reduce crowding in the graph In 2016/17, the Federal government, as a financing agent provided again mainly for tertiary education (92 percent of the federal contribution), about 6 percent for basic education, and about 2 percent going towards the provision of secondary education. The State government contributed 4 percent of the funds it manages to basic education, 31 percent to secondary education, 42 percent to tertiary education, and 6 percent to non-formal education. The Local governments concentrated mainly on education at the lower basic education levels. Of the funds allocated for formal education, 96 percent were spent on provision of basic education 1 percent to secondary education, and 2 percent to tertiary education. About 1 percent of the total expenditures by the local government were for non-formal education. (Table 4.14 and Figure 4.16).
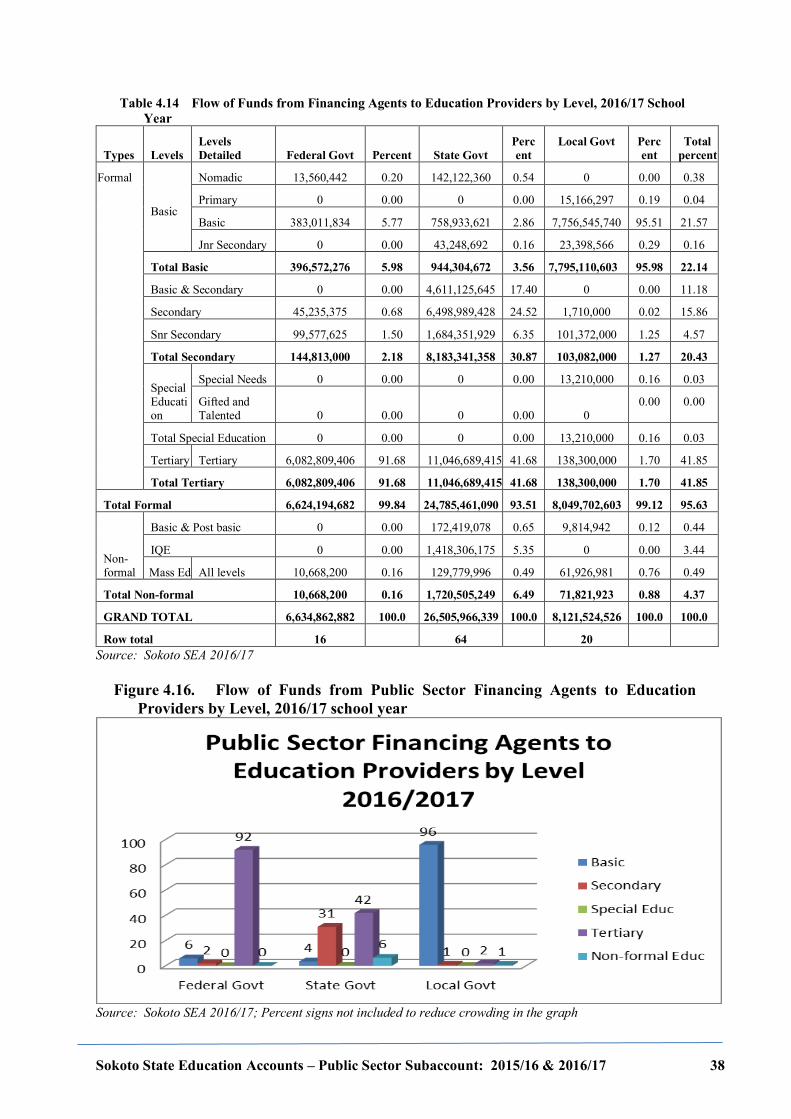
Sokoto State Education Accounts – Public Sector Subaccount: 2015/16 & 2016/17 38
Table 4.14 Flow of Funds from Financing Agents to Education Providers by Level, 2016/17 School Year
Types Levels Levels Detailed Federal Govt Percent State Govt
Percent
Local Govt Percent
Total percent
Formal
Basic
Nomadic 13,560,442 0.20 142,122,360 0.54 0 0.00 0.38
Primary 0 0.00 0 0.00 15,166,297 0.19 0.04
Basic 383,011,834 5.77 758,933,621 2.86 7,756,545,740 95.51 21.57
Jnr Secondary 0 0.00 43,248,692 0.16 23,398,566 0.29 0.16
Total Basic 396,572,276 5.98 944,304,672 3.56 7,795,110,603 95.98 22.14
Basic & Secondary 0 0.00 4,611,125,645 17.40 0 0.00 11.18
Secondary 45,235,375 0.68 6,498,989,428 24.52 1,710,000 0.02 15.86
Snr Secondary 99,577,625 1.50 1,684,351,929 6.35 101,372,000 1.25 4.57
Total Secondary 144,813,000 2.18 8,183,341,358 30.87 103,082,000 1.27 20.43
Special Education
Special Needs 0 0.00 0 0.00 13,210,000 0.16 0.03
Gifted and Talented 0 0.00 0 0.00 0
0.00 0.00
Total Special Education 0 0.00 0 0.00 13,210,000 0.16 0.03
Tertiary Tertiary 6,082,809,406 91.68 11,046,689,415 41.68 138,300,000 1.70 41.85
Total Tertiary 6,082,809,406 91.68 11,046,689,415 41.68 138,300,000 1.70 41.85
Total Formal 6,624,194,682 99.84 24,785,461,090 93.51 8,049,702,603 99.12 95.63
Non-formal
Basic & Post basic 0 0.00 172,419,078 0.65 9,814,942 0.12 0.44
IQE 0 0.00 1,418,306,175 5.35 0 0.00 3.44
Mass Ed. All levels 10,668,200 0.16 129,779,996 0.49 61,926,981 0.76 0.49
Total Non-formal 10,668,200 0.16 1,720,505,249 6.49 71,821,923 0.88 4.37
GRAND TOTAL 6,634,862,882 100.0 26,505,966,339 100.0 8,121,524,526 100.0 100.0
Row total 16 64 20 Source: Sokoto SEA 2016/17
Figure 4.16. Flow of Funds from Public Sector Financing Agents to Education Providers by Level, 2016/17 school year
Source: Sokoto SEA 2016/17; Percent signs not included to reduce crowding in the graph
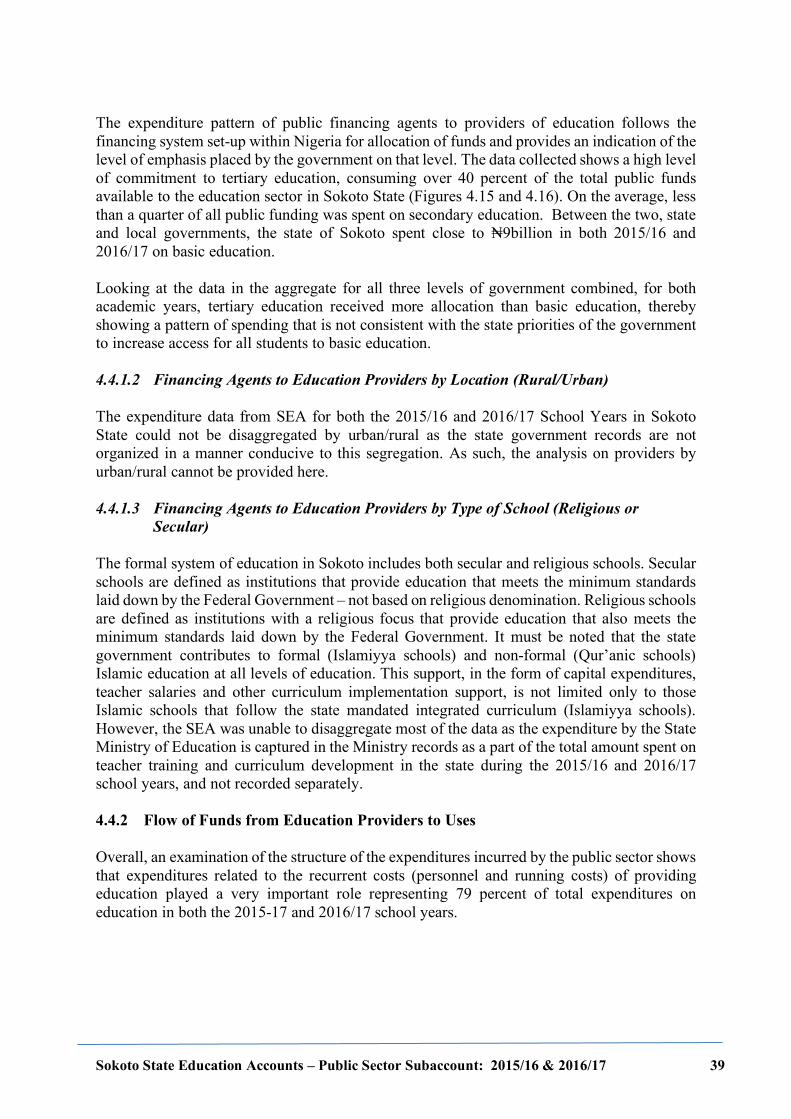
Sokoto State Education Accounts – Public Sector Subaccount: 2015/16 & 2016/17 39
The expenditure pattern of public financing agents to providers of education follows the financing system set-up within Nigeria for allocation of funds and provides an indication of the level of emphasis placed by the government on that level. The data collected shows a high level of commitment to tertiary education, consuming over 40 percent of the total public funds available to the education sector in Sokoto State (Figures 4.15 and 4.16). On the average, less than a quarter of all public funding was spent on secondary education. Between the two, state and local governments, the state of Sokoto spent close to ₦9billion in both 2015/16 and 2016/17 on basic education. Looking at the data in the aggregate for all three levels of government combined, for both academic years, tertiary education received more allocation than basic education, thereby showing a pattern of spending that is not consistent with the state priorities of the government to increase access for all students to basic education. 4.4.1.2 Financing Agents to Education Providers by Location (Rural/Urban) The expenditure data from SEA for both the 2015/16 and 2016/17 School Years in Sokoto State could not be disaggregated by urban/rural as the state government records are not organized in a manner conducive to this segregation. As such, the analysis on providers by urban/rural cannot be provided here. 4.4.1.3 Financing Agents to Education Providers by Type of School (Religious or
Secular) The formal system of education in Sokoto includes both secular and religious schools. Secular schools are defined as institutions that provide education that meets the minimum standards laid down by the Federal Government – not based on religious denomination. Religious schools are defined as institutions with a religious focus that provide education that also meets the minimum standards laid down by the Federal Government. It must be noted that the state government contributes to formal (Islamiyya schools) and non-formal (Qur’anic schools) Islamic education at all levels of education. This support, in the form of capital expenditures, teacher salaries and other curriculum implementation support, is not limited only to those Islamic schools that follow the state mandated integrated curriculum (Islamiyya schools). However, the SEA was unable to disaggregate most of the data as the expenditure by the State Ministry of Education is captured in the Ministry records as a part of the total amount spent on teacher training and curriculum development in the state during the 2015/16 and 2016/17 school years, and not recorded separately. 4.4.2 Flow of Funds from Education Providers to Uses Overall, an examination of the structure of the expenditures incurred by the public sector shows that expenditures related to the recurrent costs (personnel and running costs) of providing education played a very important role representing 79 percent of total expenditures on education in both the 2015-17 and 2016/17 school years.
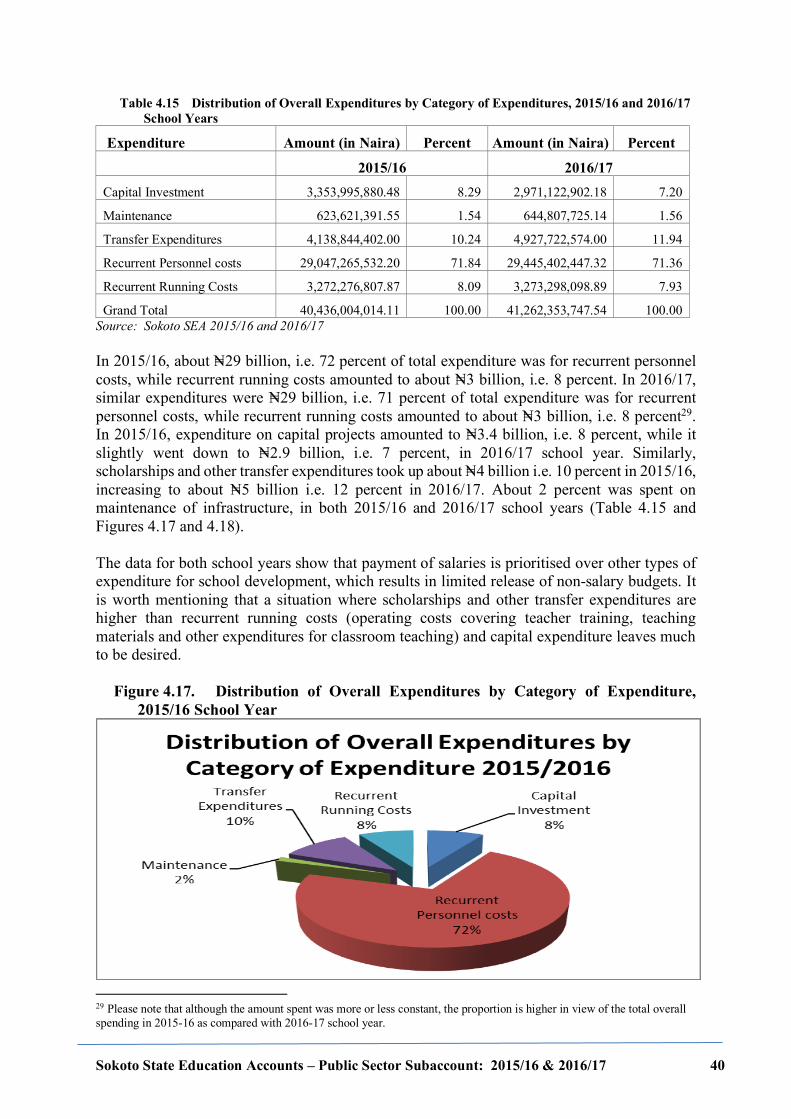
Sokoto State Education Accounts – Public Sector Subaccount: 2015/16 & 2016/17 40
Table 4.15 Distribution of Overall Expenditures by Category of Expenditures, 2015/16 and 2016/17 School Years
Expenditure Amount (in Naira) Percent Amount (in Naira) Percent
2015/16 2016/17 Capital Investment 3,353,995,880.48 8.29 2,971,122,902.18 7.20
Maintenance 623,621,391.55 1.54 644,807,725.14 1.56
Transfer Expenditures 4,138,844,402.00 10.24 4,927,722,574.00 11.94
Recurrent Personnel costs 29,047,265,532.20 71.84 29,445,402,447.32 71.36
Recurrent Running Costs 3,272,276,807.87 8.09 3,273,298,098.89 7.93
Grand Total 40,436,004,014.11 100.00 41,262,353,747.54 100.00 Source: Sokoto SEA 2015/16 and 2016/17 In 2015/16, about N=29 billion, i.e. 72 percent of total expenditure was for recurrent personnel costs, while recurrent running costs amounted to about N=3 billion, i.e. 8 percent. In 2016/17, similar expenditures were N=29 billion, i.e. 71 percent of total expenditure was for recurrent personnel costs, while recurrent running costs amounted to about N=3 billion, i.e. 8 percent29. In 2015/16, expenditure on capital projects amounted to N=3.4 billion, i.e. 8 percent, while it slightly went down to N=2.9 billion, i.e. 7 percent, in 2016/17 school year. Similarly, scholarships and other transfer expenditures took up about N=4 billion i.e. 10 percent in 2015/16, increasing to about N=5 billion i.e. 12 percent in 2016/17. About 2 percent was spent on maintenance of infrastructure, in both 2015/16 and 2016/17 school years (Table 4.15 and Figures 4.17 and 4.18). The data for both school years show that payment of salaries is prioritised over other types of expenditure for school development, which results in limited release of non-salary budgets. It is worth mentioning that a situation where scholarships and other transfer expenditures are higher than recurrent running costs (operating costs covering teacher training, teaching materials and other expenditures for classroom teaching) and capital expenditure leaves much to be desired.
Figure 4.17. Distribution of Overall Expenditures by Category of Expenditure, 2015/16 School Year
29 Please note that although the amount spent was more or less constant, the proportion is higher in view of the total overall spending in 2015-16 as compared with 2016-17 school year.
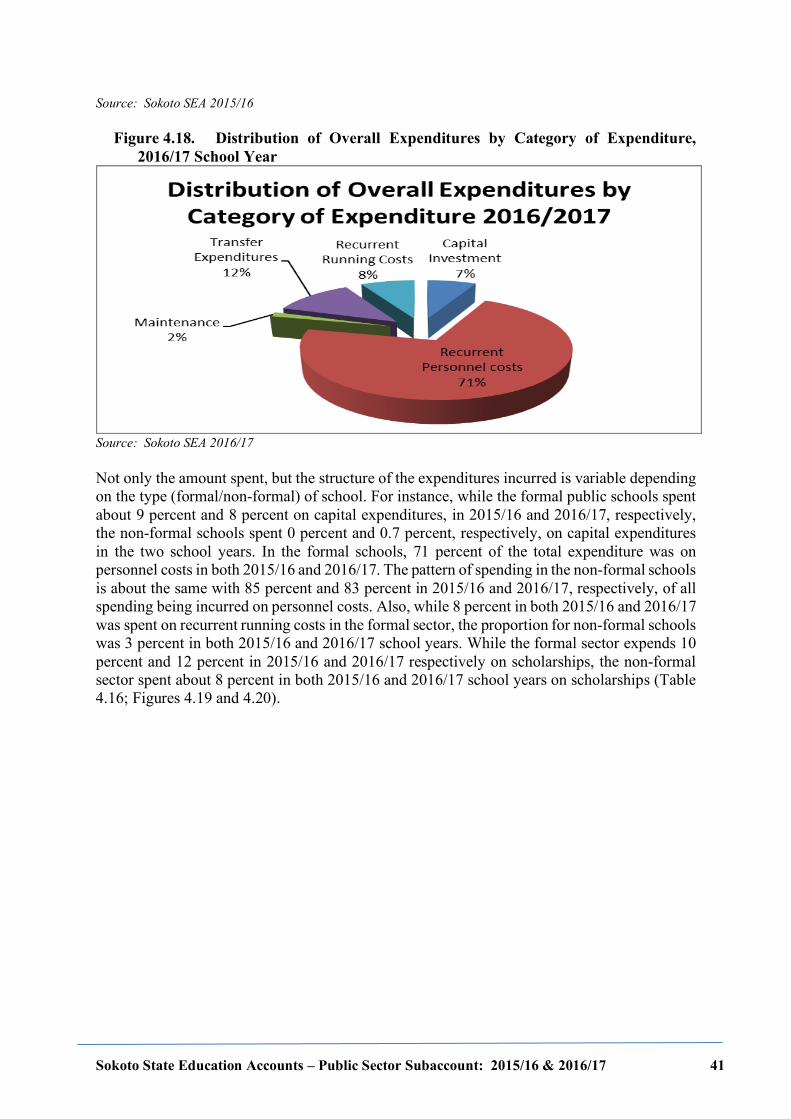
Sokoto State Education Accounts – Public Sector Subaccount: 2015/16 & 2016/17 41
Source: Sokoto SEA 2015/16
Figure 4.18. Distribution of Overall Expenditures by Category of Expenditure, 2016/17 School Year
Source: Sokoto SEA 2016/17 Not only the amount spent, but the structure of the expenditures incurred is variable depending on the type (formal/non-formal) of school. For instance, while the formal public schools spent about 9 percent and 8 percent on capital expenditures, in 2015/16 and 2016/17, respectively, the non-formal schools spent 0 percent and 0.7 percent, respectively, on capital expenditures in the two school years. In the formal schools, 71 percent of the total expenditure was on personnel costs in both 2015/16 and 2016/17. The pattern of spending in the non-formal schools is about the same with 85 percent and 83 percent in 2015/16 and 2016/17, respectively, of all spending being incurred on personnel costs. Also, while 8 percent in both 2015/16 and 2016/17 was spent on recurrent running costs in the formal sector, the proportion for non-formal schools was 3 percent in both 2015/16 and 2016/17 school years. While the formal sector expends 10 percent and 12 percent in 2015/16 and 2016/17 respectively on scholarships, the non-formal sector spent about 8 percent in both 2015/16 and 2016/17 school years on scholarships (Table 4.16; Figures 4.19 and 4.20).
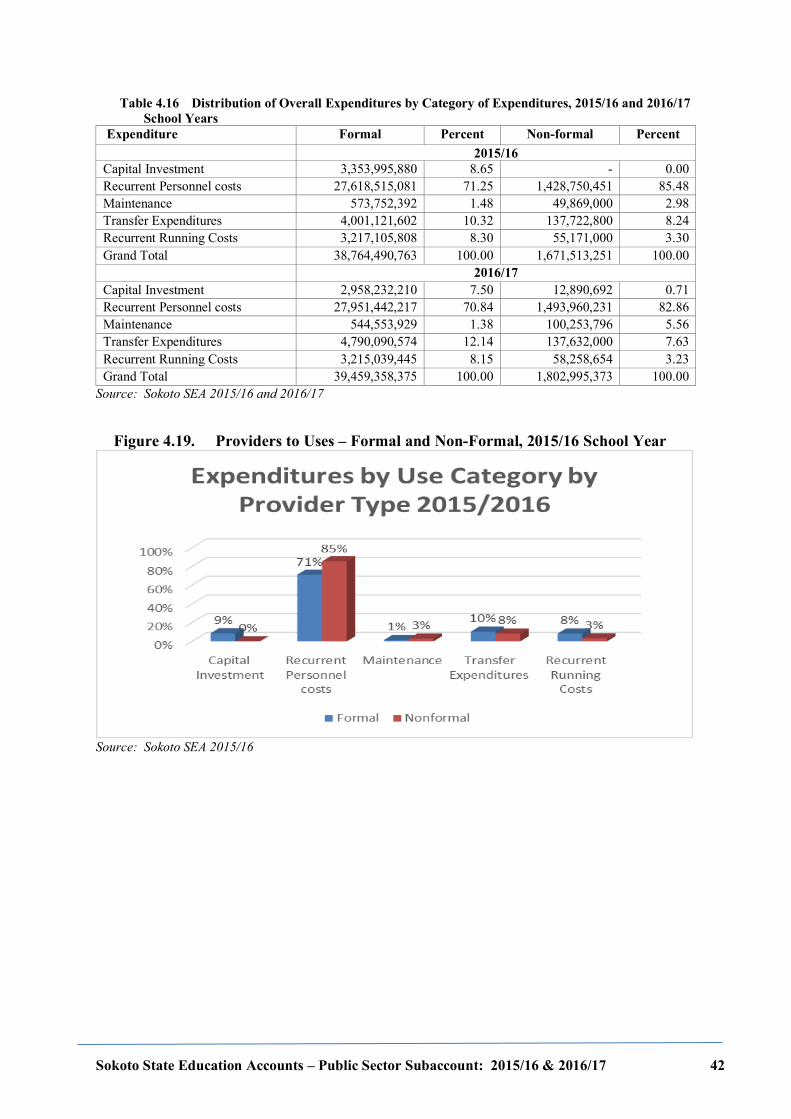
Sokoto State Education Accounts – Public Sector Subaccount: 2015/16 & 2016/17 42
Table 4.16 Distribution of Overall Expenditures by Category of Expenditures, 2015/16 and 2016/17 School Years
Expenditure Formal Percent Non-formal Percent 2015/16 Capital Investment 3,353,995,880 8.65 - 0.00 Recurrent Personnel costs 27,618,515,081 71.25 1,428,750,451 85.48 Maintenance 573,752,392 1.48 49,869,000 2.98 Transfer Expenditures 4,001,121,602 10.32 137,722,800 8.24 Recurrent Running Costs 3,217,105,808 8.30 55,171,000 3.30 Grand Total 38,764,490,763 100.00 1,671,513,251 100.00 2016/17 Capital Investment 2,958,232,210 7.50 12,890,692 0.71 Recurrent Personnel costs 27,951,442,217 70.84 1,493,960,231 82.86 Maintenance 544,553,929 1.38 100,253,796 5.56 Transfer Expenditures 4,790,090,574 12.14 137,632,000 7.63 Recurrent Running Costs 3,215,039,445 8.15 58,258,654 3.23 Grand Total 39,459,358,375 100.00 1,802,995,373 100.00
Source: Sokoto SEA 2015/16 and 2016/17
Figure 4.19. Providers to Uses – Formal and Non-Formal, 2015/16 School Year
Source: Sokoto SEA 2015/16
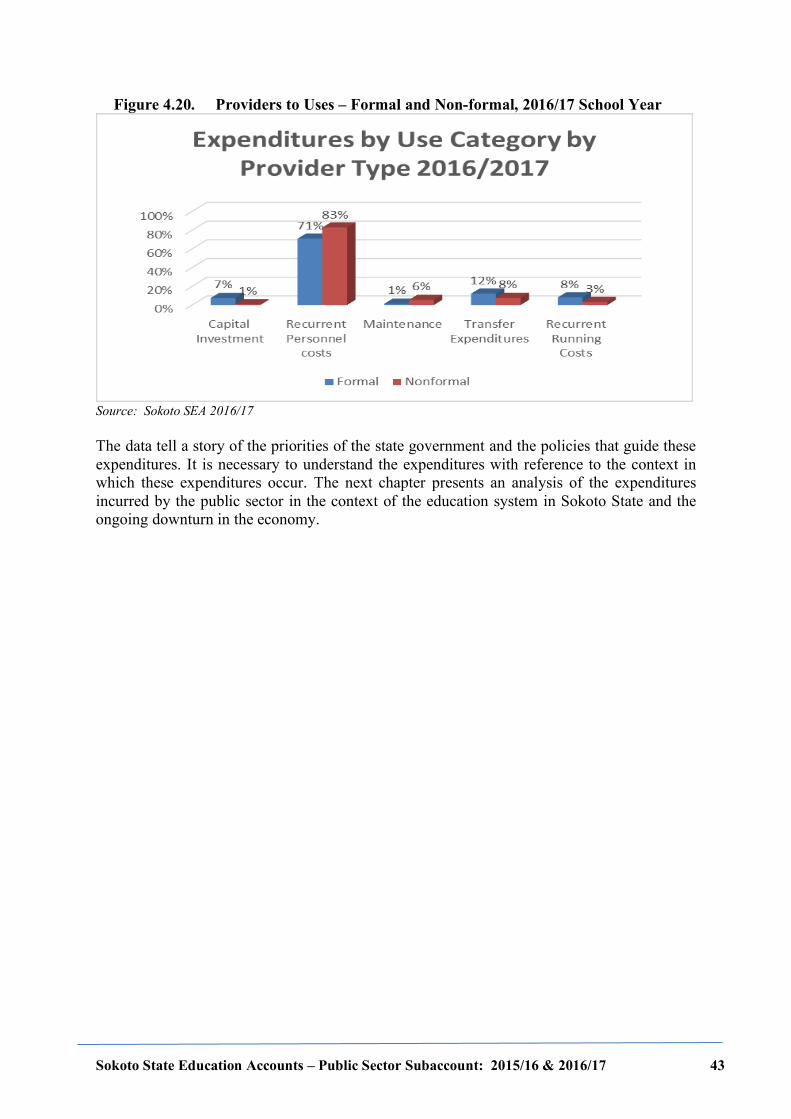
Sokoto State Education Accounts – Public Sector Subaccount: 2015/16 & 2016/17 43
Figure 4.20. Providers to Uses – Formal and Non-formal, 2016/17 School Year
Source: Sokoto SEA 2016/17
The data tell a story of the priorities of the state government and the policies that guide these expenditures. It is necessary to understand the expenditures with reference to the context in which these expenditures occur. The next chapter presents an analysis of the expenditures incurred by the public sector in the context of the education system in Sokoto State and the ongoing downturn in the economy.
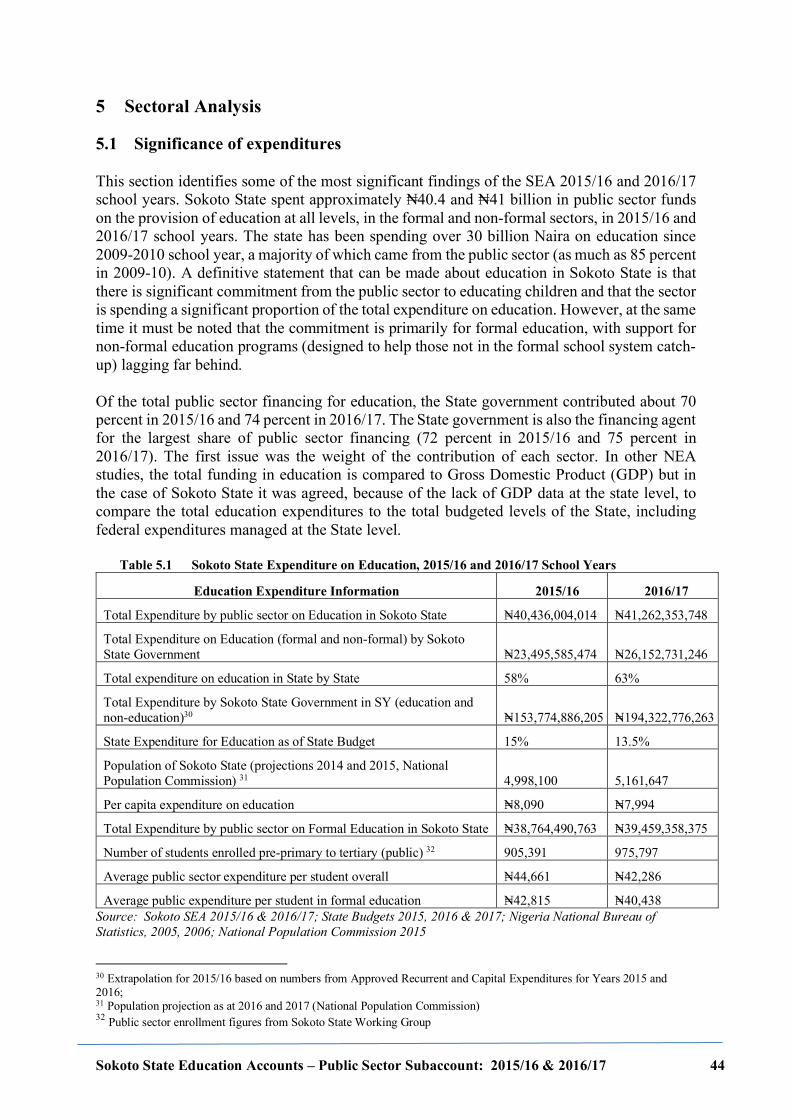
Sokoto State Education Accounts – Public Sector Subaccount: 2015/16 & 2016/17 44
5 Sectoral Analysis 5.1 Significance of expenditures This section identifies some of the most significant findings of the SEA 2015/16 and 2016/17 school years. Sokoto State spent approximately ₦40.4 and ₦41 billion in public sector funds on the provision of education at all levels, in the formal and non-formal sectors, in 2015/16 and 2016/17 school years. The state has been spending over 30 billion Naira on education since 2009-2010 school year, a majority of which came from the public sector (as much as 85 percent in 2009-10). A definitive statement that can be made about education in Sokoto State is that there is significant commitment from the public sector to educating children and that the sector is spending a significant proportion of the total expenditure on education. However, at the same time it must be noted that the commitment is primarily for formal education, with support for non-formal education programs (designed to help those not in the formal school system catch-up) lagging far behind. Of the total public sector financing for education, the State government contributed about 70 percent in 2015/16 and 74 percent in 2016/17. The State government is also the financing agent for the largest share of public sector financing (72 percent in 2015/16 and 75 percent in 2016/17). The first issue was the weight of the contribution of each sector. In other NEA studies, the total funding in education is compared to Gross Domestic Product (GDP) but in the case of Sokoto State it was agreed, because of the lack of GDP data at the state level, to compare the total education expenditures to the total budgeted levels of the State, including federal expenditures managed at the State level.
Table 5.1 Sokoto State Expenditure on Education, 2015/16 and 2016/17 School Years
Education Expenditure Information 2015/16 2016/17
Total Expenditure by public sector on Education in Sokoto State N=40,436,004,014 N=41,262,353,748
Total Expenditure on Education (formal and non-formal) by Sokoto State Government N=23,495,585,474 N=26,152,731,246
Total expenditure on education in State by State 58% 63%
Total Expenditure by Sokoto State Government in SY (education and non-education)30 N=153,774,886,205 N=194,322,776,263
State Expenditure for Education as of State Budget 15% 13.5%
Population of Sokoto State (projections 2014 and 2015, National Population Commission) 31 4,998,100 5,161,647
Per capita expenditure on education N=8,090 N=7,994
Total Expenditure by public sector on Formal Education in Sokoto State N=38,764,490,763 N=39,459,358,375
Number of students enrolled pre-primary to tertiary (public) 32 905,391 975,797
Average public sector expenditure per student overall N=44,661 N=42,286
Average public expenditure per student in formal education N=42,815 N=40,438 Source: Sokoto SEA 2015/16 & 2016/17; State Budgets 2015, 2016 & 2017; Nigeria National Bureau of Statistics, 2005, 2006; National Population Commission 2015
30 Extrapolation for 2015/16 based on numbers from Approved Recurrent and Capital Expenditures for Years 2015 and 2016; 31 Population projection as at 2016 and 2017 (National Population Commission) 32 Public sector enrollment figures from Sokoto State Working Group
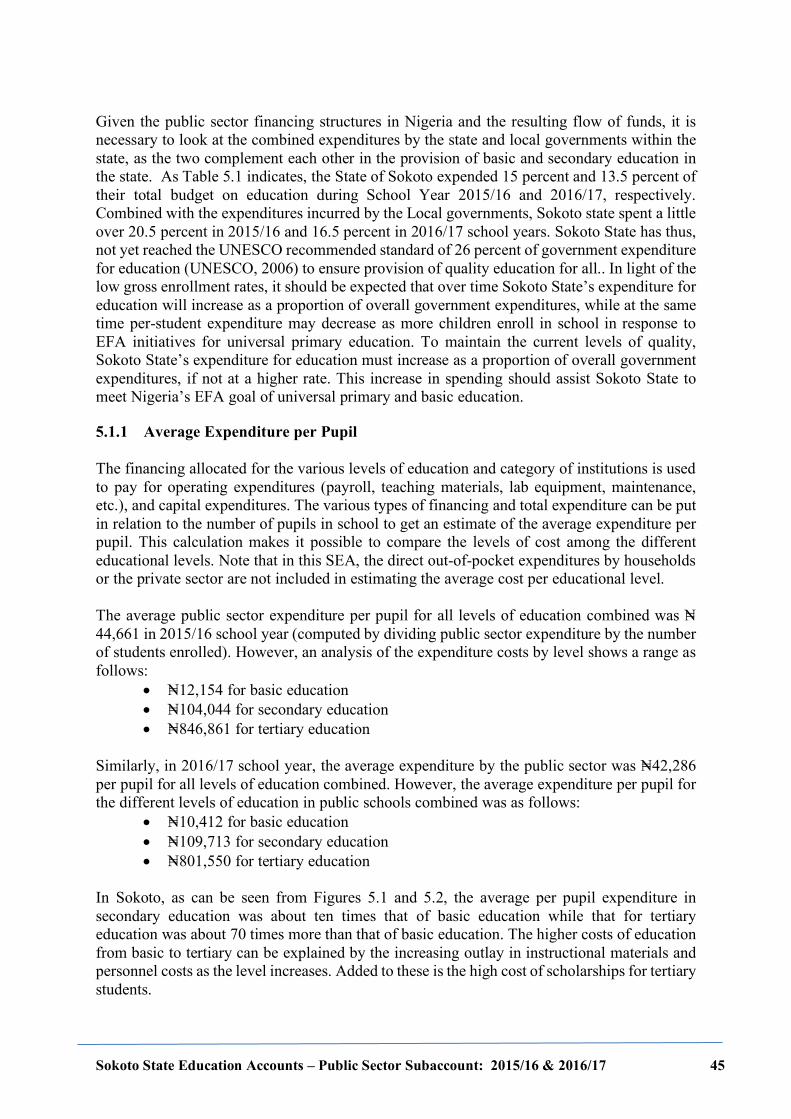
Sokoto State Education Accounts – Public Sector Subaccount: 2015/16 & 2016/17 45
Given the public sector financing structures in Nigeria and the resulting flow of funds, it is necessary to look at the combined expenditures by the state and local governments within the state, as the two complement each other in the provision of basic and secondary education in the state. As Table 5.1 indicates, the State of Sokoto expended 15 percent and 13.5 percent of their total budget on education during School Year 2015/16 and 2016/17, respectively. Combined with the expenditures incurred by the Local governments, Sokoto state spent a little over 20.5 percent in 2015/16 and 16.5 percent in 2016/17 school years. Sokoto State has thus, not yet reached the UNESCO recommended standard of 26 percent of government expenditure for education (UNESCO, 2006) to ensure provision of quality education for all.. In light of the low gross enrollment rates, it should be expected that over time Sokoto State’s expenditure for education will increase as a proportion of overall government expenditures, while at the same time per-student expenditure may decrease as more children enroll in school in response to EFA initiatives for universal primary education. To maintain the current levels of quality, Sokoto State’s expenditure for education must increase as a proportion of overall government expenditures, if not at a higher rate. This increase in spending should assist Sokoto State to meet Nigeria’s EFA goal of universal primary and basic education. 5.1.1 Average Expenditure per Pupil The financing allocated for the various levels of education and category of institutions is used to pay for operating expenditures (payroll, teaching materials, lab equipment, maintenance, etc.), and capital expenditures. The various types of financing and total expenditure can be put in relation to the number of pupils in school to get an estimate of the average expenditure per pupil. This calculation makes it possible to compare the levels of cost among the different educational levels. Note that in this SEA, the direct out-of-pocket expenditures by households or the private sector are not included in estimating the average cost per educational level. The average public sector expenditure per pupil for all levels of education combined was N=44,661 in 2015/16 school year (computed by dividing public sector expenditure by the number of students enrolled). However, an analysis of the expenditure costs by level shows a range as follows:
• N=12,154 for basic education • N=104,044 for secondary education • N=846,861 for tertiary education
Similarly, in 2016/17 school year, the average expenditure by the public sector was N=42,286 per pupil for all levels of education combined. However, the average expenditure per pupil for the different levels of education in public schools combined was as follows:
• N=10,412 for basic education • N=109,713 for secondary education • N=801,550 for tertiary education
In Sokoto, as can be seen from Figures 5.1 and 5.2, the average per pupil expenditure in secondary education was about ten times that of basic education while that for tertiary education was about 70 times more than that of basic education. The higher costs of education from basic to tertiary can be explained by the increasing outlay in instructional materials and personnel costs as the level increases. Added to these is the high cost of scholarships for tertiary students.
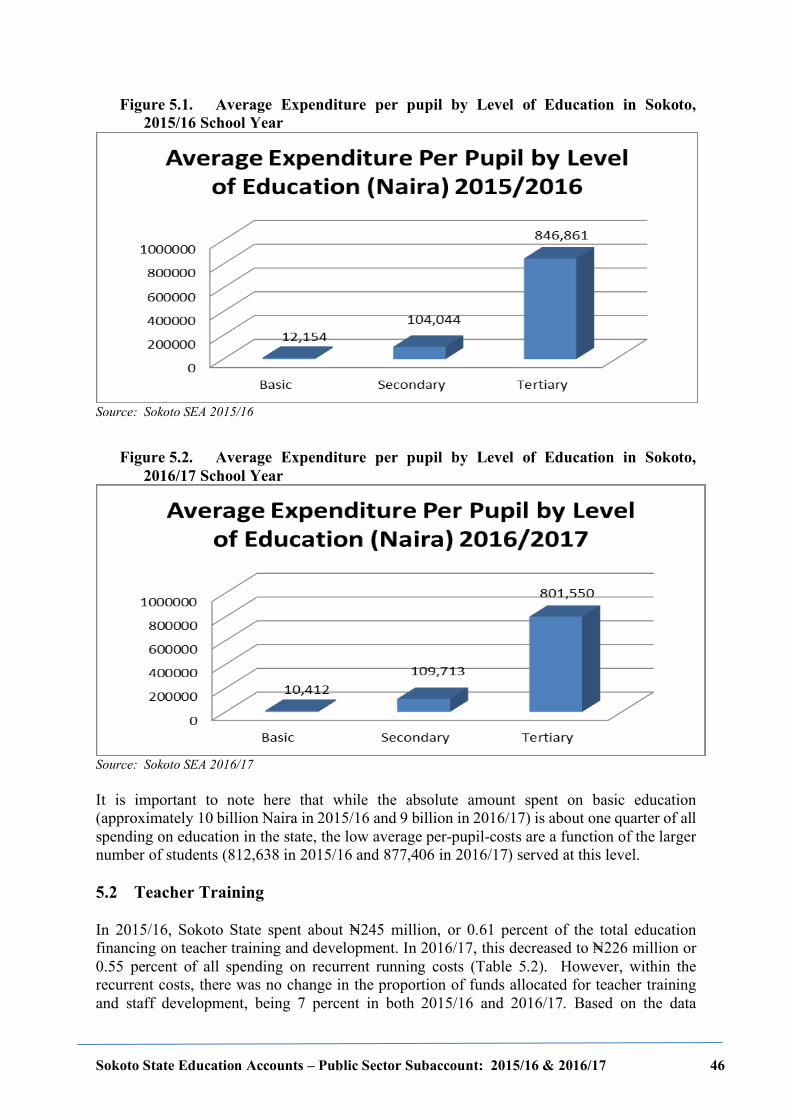
Sokoto State Education Accounts – Public Sector Subaccount: 2015/16 & 2016/17 46
Figure 5.1. Average Expenditure per pupil by Level of Education in Sokoto, 2015/16 School Year
Source: Sokoto SEA 2015/16
Figure 5.2. Average Expenditure per pupil by Level of Education in Sokoto, 2016/17 School Year
Source: Sokoto SEA 2016/17 It is important to note here that while the absolute amount spent on basic education (approximately 10 billion Naira in 2015/16 and 9 billion in 2016/17) is about one quarter of all spending on education in the state, the low average per-pupil-costs are a function of the larger number of students (812,638 in 2015/16 and 877,406 in 2016/17) served at this level. 5.2 Teacher Training In 2015/16, Sokoto State spent about N=245 million, or 0.61 percent of the total education financing on teacher training and development. In 2016/17, this decreased to N=226 million or 0.55 percent of all spending on recurrent running costs (Table 5.2). However, within the recurrent costs, there was no change in the proportion of funds allocated for teacher training and staff development, being 7 percent in both 2015/16 and 2016/17. Based on the data
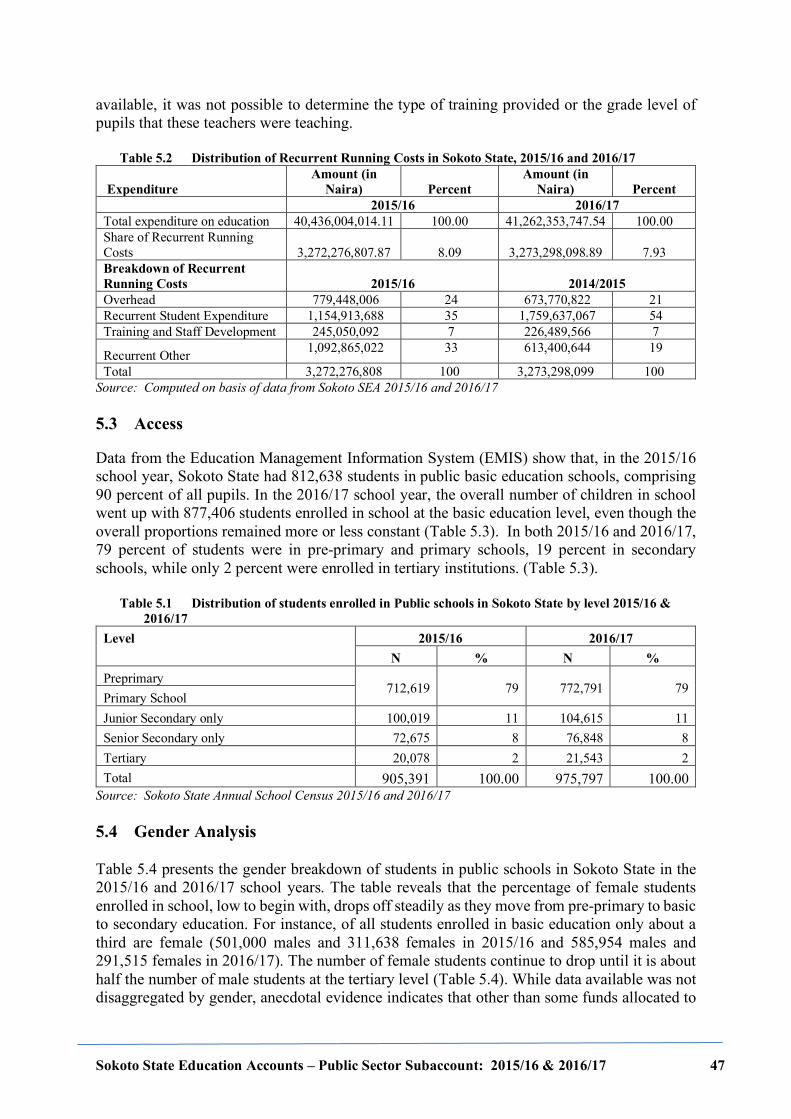
Sokoto State Education Accounts – Public Sector Subaccount: 2015/16 & 2016/17 47
available, it was not possible to determine the type of training provided or the grade level of pupils that these teachers were teaching.
Table 5.2 Distribution of Recurrent Running Costs in Sokoto State, 2015/16 and 2016/17
Expenditure Amount (in
Naira) Percent Amount (in
Naira) Percent 2015/16 2016/17 Total expenditure on education 40,436,004,014.11 100.00 41,262,353,747.54 100.00 Share of Recurrent Running Costs 3,272,276,807.87 8.09 3,273,298,098.89 7.93 Breakdown of Recurrent Running Costs 2015/16 2014/2015 Overhead 779,448,006 24 673,770,822 21 Recurrent Student Expenditure 1,154,913,688 35 1,759,637,067 54 Training and Staff Development 245,050,092 7 226,489,566 7
Recurrent Other 1,092,865,022 33 613,400,644 19
Total 3,272,276,808 100 3,273,298,099 100 Source: Computed on basis of data from Sokoto SEA 2015/16 and 2016/17 5.3 Access Data from the Education Management Information System (EMIS) show that, in the 2015/16 school year, Sokoto State had 812,638 students in public basic education schools, comprising 90 percent of all pupils. In the 2016/17 school year, the overall number of children in school went up with 877,406 students enrolled in school at the basic education level, even though the overall proportions remained more or less constant (Table 5.3). In both 2015/16 and 2016/17, 79 percent of students were in pre-primary and primary schools, 19 percent in secondary schools, while only 2 percent were enrolled in tertiary institutions. (Table 5.3).
Table 5.1 Distribution of students enrolled in Public schools in Sokoto State by level 2015/16 & 2016/17
Level 2015/16 2016/17 N % N %
Preprimary 712,619 79 772,791 79
Primary School Junior Secondary only 100,019 11 104,615 11 Senior Secondary only 72,675 8 76,848 8 Tertiary 20,078 2 21,543 2 Total 905,391 100.00 975,797 100.00
Source: Sokoto State Annual School Census 2015/16 and 2016/17 5.4 Gender Analysis Table 5.4 presents the gender breakdown of students in public schools in Sokoto State in the 2015/16 and 2016/17 school years. The table reveals that the percentage of female students enrolled in school, low to begin with, drops off steadily as they move from pre-primary to basic to secondary education. For instance, of all students enrolled in basic education only about a third are female (501,000 males and 311,638 females in 2015/16 and 585,954 males and 291,515 females in 2016/17). The number of female students continue to drop until it is about half the number of male students at the tertiary level (Table 5.4). While data available was not disaggregated by gender, anecdotal evidence indicates that other than some funds allocated to
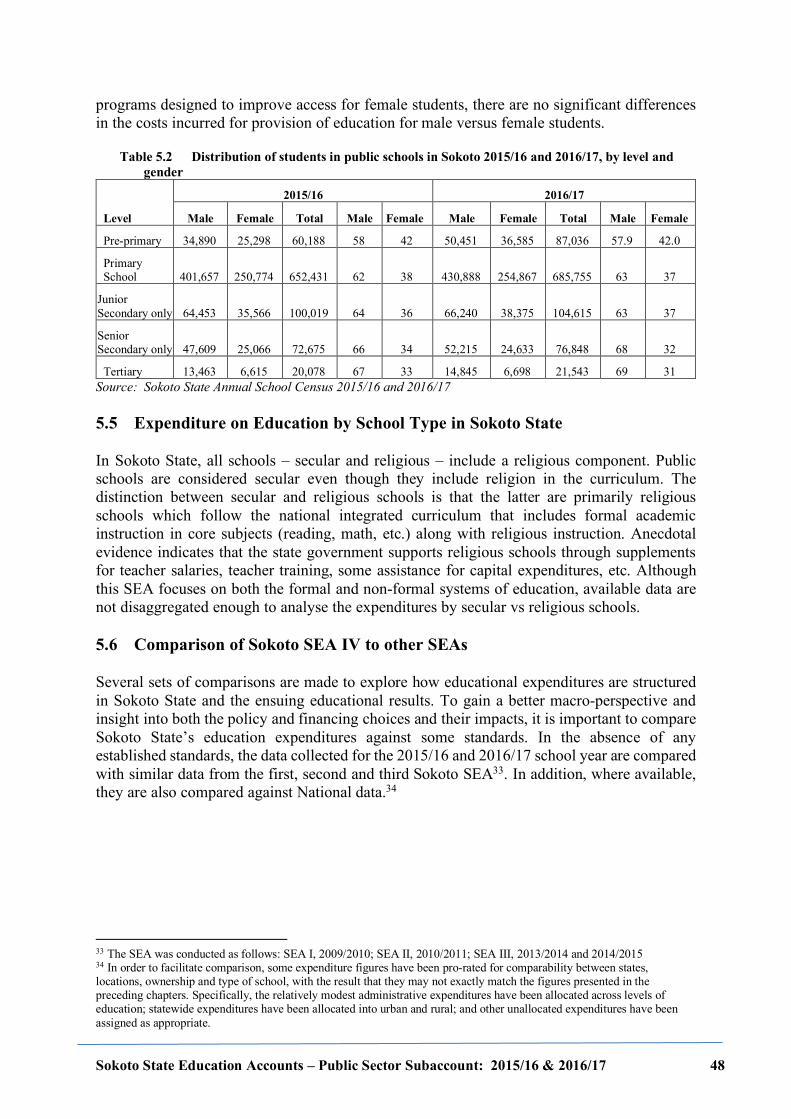
Sokoto State Education Accounts – Public Sector Subaccount: 2015/16 & 2016/17 48
programs designed to improve access for female students, there are no significant differences in the costs incurred for provision of education for male versus female students.
Table 5.2 Distribution of students in public schools in Sokoto 2015/16 and 2016/17, by level and gender
Level
2015/16 2016/17
Male Female Total Male Female Male Female Total Male Female
Pre-primary 34,890 25,298 60,188 58 42 50,451 36,585 87,036 57.9 42.0
Primary School 401,657 250,774 652,431 62 38 430,888 254,867 685,755 63 37
Junior Secondary only 64,453 35,566 100,019 64 36 66,240 38,375 104,615 63 37
Senior Secondary only 47,609 25,066 72,675 66 34 52,215 24,633 76,848 68 32
Tertiary 13,463 6,615 20,078 67 33 14,845 6,698 21,543 69 31 Source: Sokoto State Annual School Census 2015/16 and 2016/17 5.5 Expenditure on Education by School Type in Sokoto State In Sokoto State, all schools – secular and religious – include a religious component. Public schools are considered secular even though they include religion in the curriculum. The distinction between secular and religious schools is that the latter are primarily religious schools which follow the national integrated curriculum that includes formal academic instruction in core subjects (reading, math, etc.) along with religious instruction. Anecdotal evidence indicates that the state government supports religious schools through supplements for teacher salaries, teacher training, some assistance for capital expenditures, etc. Although this SEA focuses on both the formal and non-formal systems of education, available data are not disaggregated enough to analyse the expenditures by secular vs religious schools. 5.6 Comparison of Sokoto SEA IV to other SEAs Several sets of comparisons are made to explore how educational expenditures are structured in Sokoto State and the ensuing educational results. To gain a better macro-perspective and insight into both the policy and financing choices and their impacts, it is important to compare Sokoto State’s education expenditures against some standards. In the absence of any established standards, the data collected for the 2015/16 and 2016/17 school year are compared with similar data from the first, second and third Sokoto SEA33. In addition, where available, they are also compared against National data.34
33 The SEA was conducted as follows: SEA I, 2009/2010; SEA II, 2010/2011; SEA III, 2013/2014 and 2014/2015 34 In order to facilitate comparison, some expenditure figures have been pro-rated for comparability between states, locations, ownership and type of school, with the result that they may not exactly match the figures presented in the preceding chapters. Specifically, the relatively modest administrative expenditures have been allocated across levels of education; statewide expenditures have been allocated into urban and rural; and other unallocated expenditures have been assigned as appropriate.
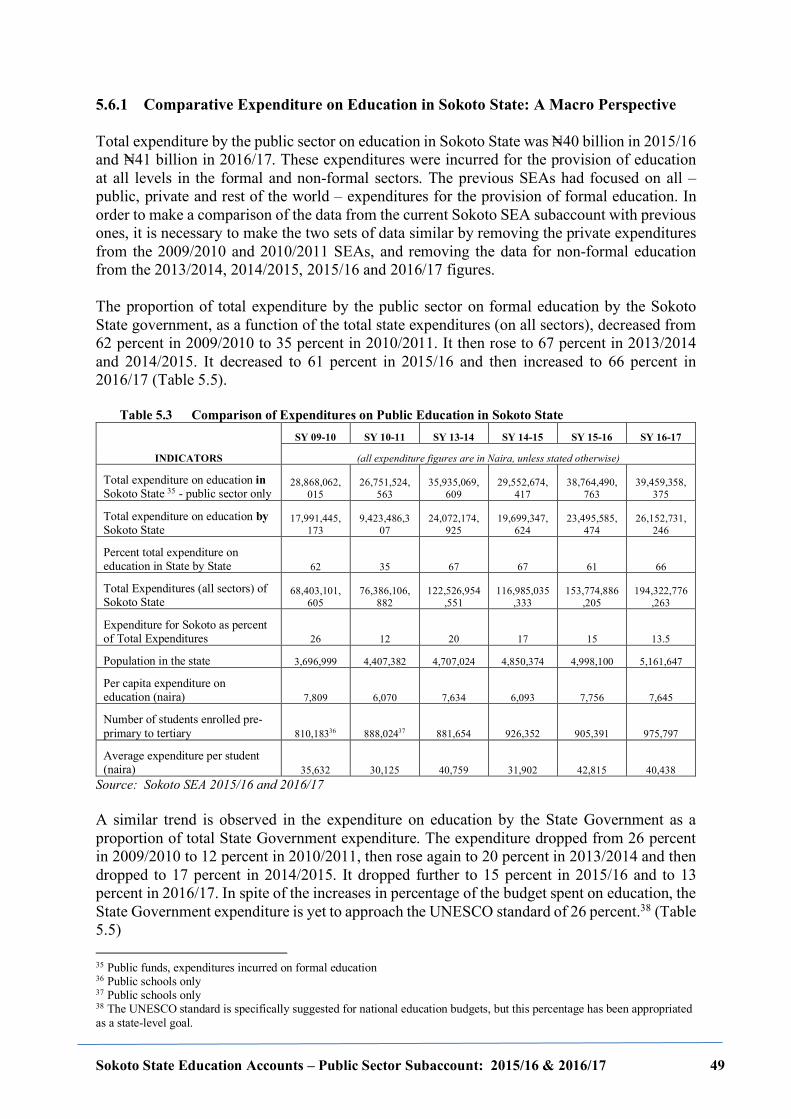
Sokoto State Education Accounts – Public Sector Subaccount: 2015/16 & 2016/17 49
5.6.1 Comparative Expenditure on Education in Sokoto State: A Macro Perspective Total expenditure by the public sector on education in Sokoto State was N=40 billion in 2015/16 and N=41 billion in 2016/17. These expenditures were incurred for the provision of education at all levels in the formal and non-formal sectors. The previous SEAs had focused on all – public, private and rest of the world – expenditures for the provision of formal education. In order to make a comparison of the data from the current Sokoto SEA subaccount with previous ones, it is necessary to make the two sets of data similar by removing the private expenditures from the 2009/2010 and 2010/2011 SEAs, and removing the data for non-formal education from the 2013/2014, 2014/2015, 2015/16 and 2016/17 figures. The proportion of total expenditure by the public sector on formal education by the Sokoto State government, as a function of the total state expenditures (on all sectors), decreased from 62 percent in 2009/2010 to 35 percent in 2010/2011. It then rose to 67 percent in 2013/2014 and 2014/2015. It decreased to 61 percent in 2015/16 and then increased to 66 percent in 2016/17 (Table 5.5).
Table 5.3 Comparison of Expenditures on Public Education in Sokoto State
INDICATORS
SY 09-10 SY 10-11 SY 13-14 SY 14-15 SY 15-16 SY 16-17
(all expenditure figures are in Naira, unless stated otherwise)
Total expenditure on education in Sokoto State 35 - public sector only
28,868,062,015
26,751,524,563
35,935,069,609
29,552,674,417
38,764,490,763
39,459,358,375
Total expenditure on education by Sokoto State
17,991,445,173
9,423,486,307
24,072,174,925
19,699,347,624
23,495,585,474
26,152,731,246
Percent total expenditure on education in State by State 62 35 67 67 61 66
Total Expenditures (all sectors) of Sokoto State
68,403,101,605
76,386,106,882
122,526,954,551
116,985,035,333
153,774,886,205
194,322,776,263
Expenditure for Sokoto as percent of Total Expenditures 26 12 20 17 15 13.5
Population in the state 3,696,999 4,407,382 4,707,024 4,850,374 4,998,100 5,161,647
Per capita expenditure on education (naira) 7,809 6,070 7,634 6,093 7,756 7,645
Number of students enrolled pre-primary to tertiary 810,18336 888,02437 881,654 926,352 905,391 975,797
Average expenditure per student (naira) 35,632 30,125 40,759 31,902 42,815 40,438
Source: Sokoto SEA 2015/16 and 2016/17 A similar trend is observed in the expenditure on education by the State Government as a proportion of total State Government expenditure. The expenditure dropped from 26 percent in 2009/2010 to 12 percent in 2010/2011, then rose again to 20 percent in 2013/2014 and then dropped to 17 percent in 2014/2015. It dropped further to 15 percent in 2015/16 and to 13 percent in 2016/17. In spite of the increases in percentage of the budget spent on education, the State Government expenditure is yet to approach the UNESCO standard of 26 percent.38 (Table 5.5) 35 Public funds, expenditures incurred on formal education 36 Public schools only 37 Public schools only 38 The UNESCO standard is specifically suggested for national education budgets, but this percentage has been appropriated as a state-level goal.
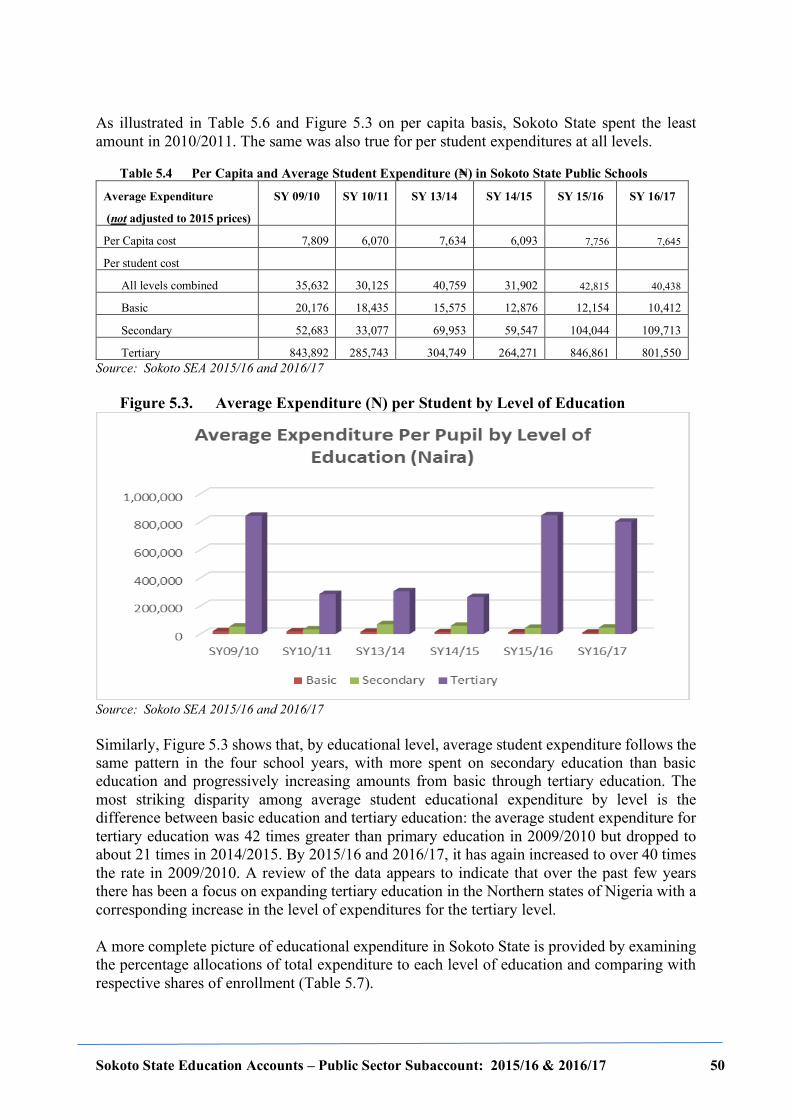
Sokoto State Education Accounts – Public Sector Subaccount: 2015/16 & 2016/17 50
As illustrated in Table 5.6 and Figure 5.3 on per capita basis, Sokoto State spent the least amount in 2010/2011. The same was also true for per student expenditures at all levels.
Table 5.4 Per Capita and Average Student Expenditure (N=) in Sokoto State Public Schools
Average Expenditure
(not adjusted to 2015 prices)
SY 09/10 SY 10/11 SY 13/14 SY 14/15 SY 15/16 SY 16/17
Per Capita cost 7,809 6,070 7,634 6,093 7,756 7,645
Per student cost
All levels combined 35,632 30,125 40,759 31,902 42,815 40,438
Basic 20,176 18,435 15,575 12,876 12,154 10,412
Secondary 52,683 33,077 69,953 59,547 104,044 109,713
Tertiary 843,892 285,743 304,749 264,271 846,861 801,550 Source: Sokoto SEA 2015/16 and 2016/17
Figure 5.3. Average Expenditure (N) per Student by Level of Education
Source: Sokoto SEA 2015/16 and 2016/17 Similarly, Figure 5.3 shows that, by educational level, average student expenditure follows the same pattern in the four school years, with more spent on secondary education than basic education and progressively increasing amounts from basic through tertiary education. The most striking disparity among average student educational expenditure by level is the difference between basic education and tertiary education: the average student expenditure for tertiary education was 42 times greater than primary education in 2009/2010 but dropped to about 21 times in 2014/2015. By 2015/16 and 2016/17, it has again increased to over 40 times the rate in 2009/2010. A review of the data appears to indicate that over the past few years there has been a focus on expanding tertiary education in the Northern states of Nigeria with a corresponding increase in the level of expenditures for the tertiary level. A more complete picture of educational expenditure in Sokoto State is provided by examining the percentage allocations of total expenditure to each level of education and comparing with respective shares of enrollment (Table 5.7).
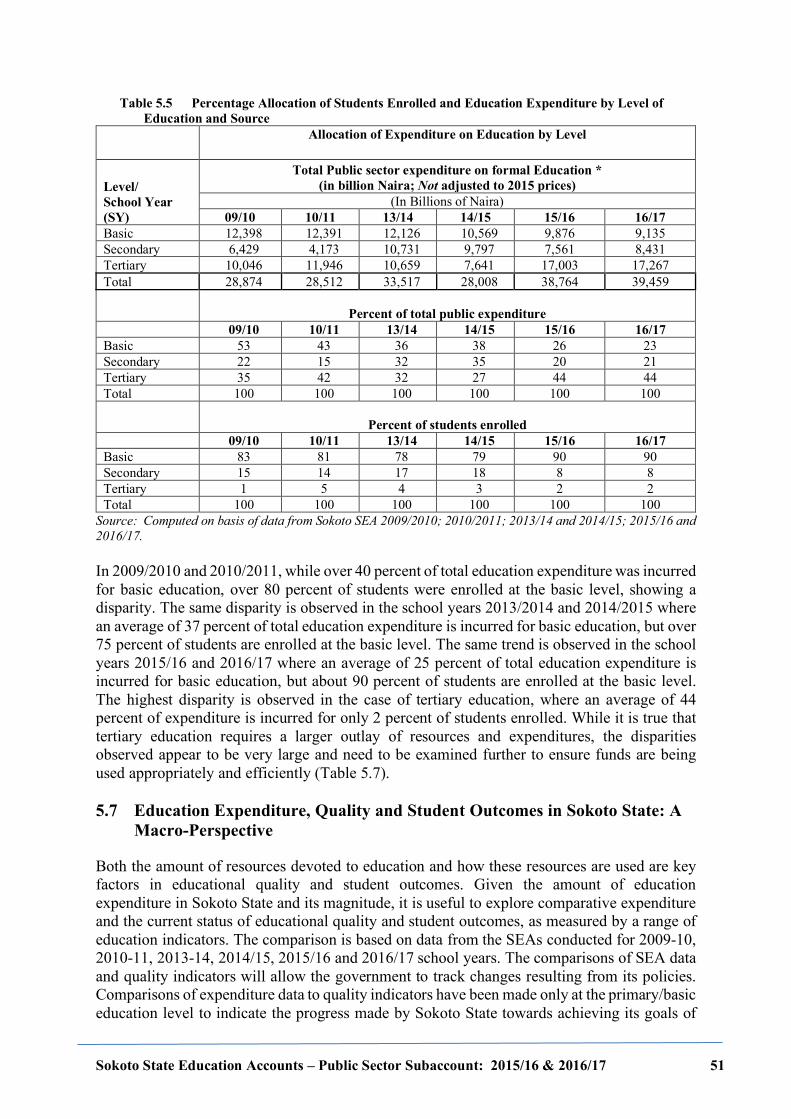
Sokoto State Education Accounts – Public Sector Subaccount: 2015/16 & 2016/17 51
Table 5.5 Percentage Allocation of Students Enrolled and Education Expenditure by Level of Education and Source
Allocation of Expenditure on Education by Level
Level/ School Year (SY)
Total Public sector expenditure on formal Education * (in billion Naira; Not adjusted to 2015 prices)
(In Billions of Naira) 09/10 10/11 13/14 14/15 15/16 16/17
Basic 12,398 12,391 12,126 10,569 9,876 9,135 Secondary 6,429 4,173 10,731 9,797 7,561 8,431 Tertiary 10,046 11,946 10,659 7,641 17,003 17,267 Total 28,874 28,512 33,517 28,008 38,764 39,459
Percent of total public expenditure 09/10 10/11 13/14 14/15 15/16 16/17 Basic 53 43 36 38 26 23 Secondary 22 15 32 35 20 21 Tertiary 35 42 32 27 44 44 Total 100 100 100 100 100 100
Percent of students enrolled 09/10 10/11 13/14 14/15 15/16 16/17 Basic 83 81 78 79 90 90 Secondary 15 14 17 18 8 8 Tertiary 1 5 4 3 2 2 Total 100 100 100 100 100 100
Source: Computed on basis of data from Sokoto SEA 2009/2010; 2010/2011; 2013/14 and 2014/15; 2015/16 and 2016/17. In 2009/2010 and 2010/2011, while over 40 percent of total education expenditure was incurred for basic education, over 80 percent of students were enrolled at the basic level, showing a disparity. The same disparity is observed in the school years 2013/2014 and 2014/2015 where an average of 37 percent of total education expenditure is incurred for basic education, but over 75 percent of students are enrolled at the basic level. The same trend is observed in the school years 2015/16 and 2016/17 where an average of 25 percent of total education expenditure is incurred for basic education, but about 90 percent of students are enrolled at the basic level. The highest disparity is observed in the case of tertiary education, where an average of 44 percent of expenditure is incurred for only 2 percent of students enrolled. While it is true that tertiary education requires a larger outlay of resources and expenditures, the disparities observed appear to be very large and need to be examined further to ensure funds are being used appropriately and efficiently (Table 5.7). 5.7 Education Expenditure, Quality and Student Outcomes in Sokoto State: A
Macro-Perspective Both the amount of resources devoted to education and how these resources are used are key factors in educational quality and student outcomes. Given the amount of education expenditure in Sokoto State and its magnitude, it is useful to explore comparative expenditure and the current status of educational quality and student outcomes, as measured by a range of education indicators. The comparison is based on data from the SEAs conducted for 2009-10, 2010-11, 2013-14, 2014/15, 2015/16 and 2016/17 school years. The comparisons of SEA data and quality indicators will allow the government to track changes resulting from its policies. Comparisons of expenditure data to quality indicators have been made only at the primary/basic education level to indicate the progress made by Sokoto State towards achieving its goals of
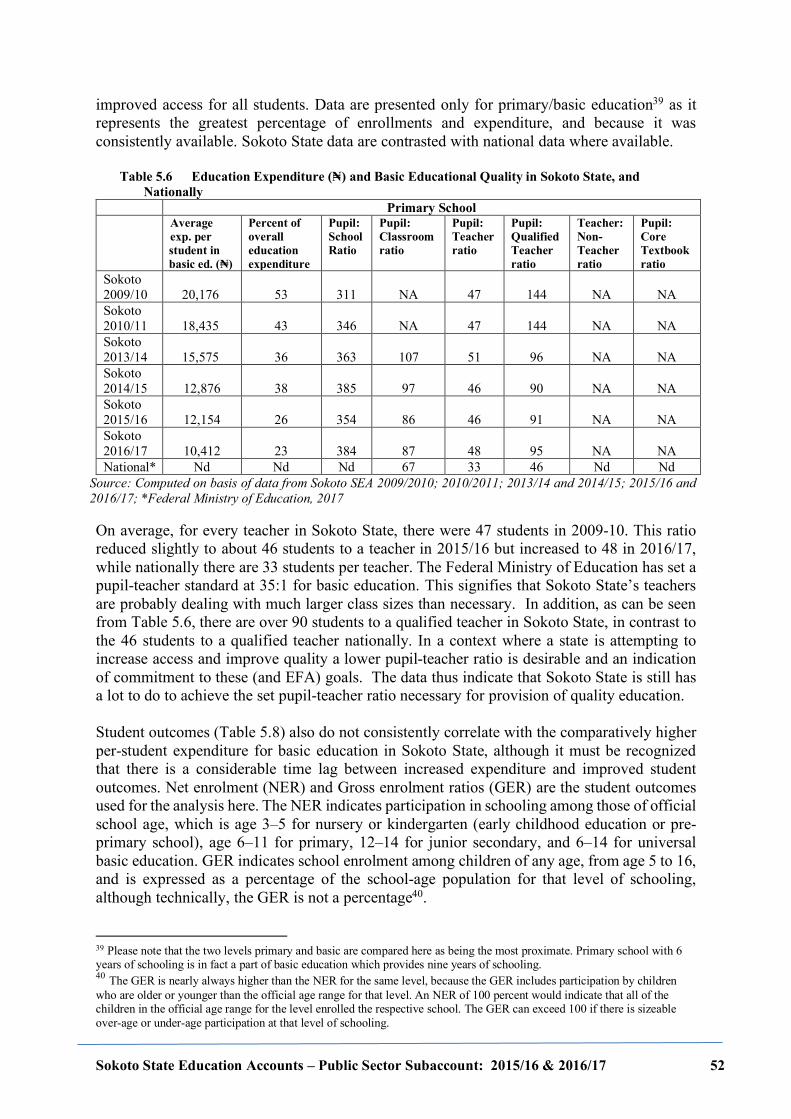
Sokoto State Education Accounts – Public Sector Subaccount: 2015/16 & 2016/17 52
improved access for all students. Data are presented only for primary/basic education39 as it represents the greatest percentage of enrollments and expenditure, and because it was consistently available. Sokoto State data are contrasted with national data where available.
Table 5.6 Education Expenditure (N=) and Basic Educational Quality in Sokoto State, and Nationally
Primary School Average
exp. per student in basic ed. (₦)
Percent of overall education expenditure
Pupil: School Ratio
Pupil: Classroom ratio
Pupil: Teacher ratio
Pupil: Qualified Teacher ratio
Teacher: Non-Teacher ratio
Pupil: Core Textbook ratio
Sokoto 2009/10 20,176 53 311 NA 47 144 NA NA Sokoto 2010/11 18,435 43 346 NA 47 144 NA NA Sokoto 2013/14 15,575 36 363 107 51 96 NA NA Sokoto 2014/15 12,876 38 385 97 46 90 NA NA Sokoto 2015/16 12,154 26 354 86 46 91 NA NA Sokoto 2016/17 10,412 23 384 87 48 95 NA NA National* Nd Nd Nd 67 33 46 Nd Nd
Source: Computed on basis of data from Sokoto SEA 2009/2010; 2010/2011; 2013/14 and 2014/15; 2015/16 and 2016/17; *Federal Ministry of Education, 2017 On average, for every teacher in Sokoto State, there were 47 students in 2009-10. This ratio reduced slightly to about 46 students to a teacher in 2015/16 but increased to 48 in 2016/17, while nationally there are 33 students per teacher. The Federal Ministry of Education has set a pupil-teacher standard at 35:1 for basic education. This signifies that Sokoto State’s teachers are probably dealing with much larger class sizes than necessary. In addition, as can be seen from Table 5.6, there are over 90 students to a qualified teacher in Sokoto State, in contrast to the 46 students to a qualified teacher nationally. In a context where a state is attempting to increase access and improve quality a lower pupil-teacher ratio is desirable and an indication of commitment to these (and EFA) goals. The data thus indicate that Sokoto State is still has a lot to do to achieve the set pupil-teacher ratio necessary for provision of quality education. Student outcomes (Table 5.8) also do not consistently correlate with the comparatively higher per-student expenditure for basic education in Sokoto State, although it must be recognized that there is a considerable time lag between increased expenditure and improved student outcomes. Net enrolment (NER) and Gross enrolment ratios (GER) are the student outcomes used for the analysis here. The NER indicates participation in schooling among those of official school age, which is age 3–5 for nursery or kindergarten (early childhood education or pre-primary school), age 6–11 for primary, 12–14 for junior secondary, and 6–14 for universal basic education. GER indicates school enrolment among children of any age, from age 5 to 16, and is expressed as a percentage of the school-age population for that level of schooling, although technically, the GER is not a percentage40. 39 Please note that the two levels primary and basic are compared here as being the most proximate. Primary school with 6 years of schooling is in fact a part of basic education which provides nine years of schooling. 40 The GER is nearly always higher than the NER for the same level, because the GER includes participation by children who are older or younger than the official age range for that level. An NER of 100 percent would indicate that all of the children in the official age range for the level enrolled the respective school. The GER can exceed 100 if there is sizeable over-age or under-age participation at that level of schooling.
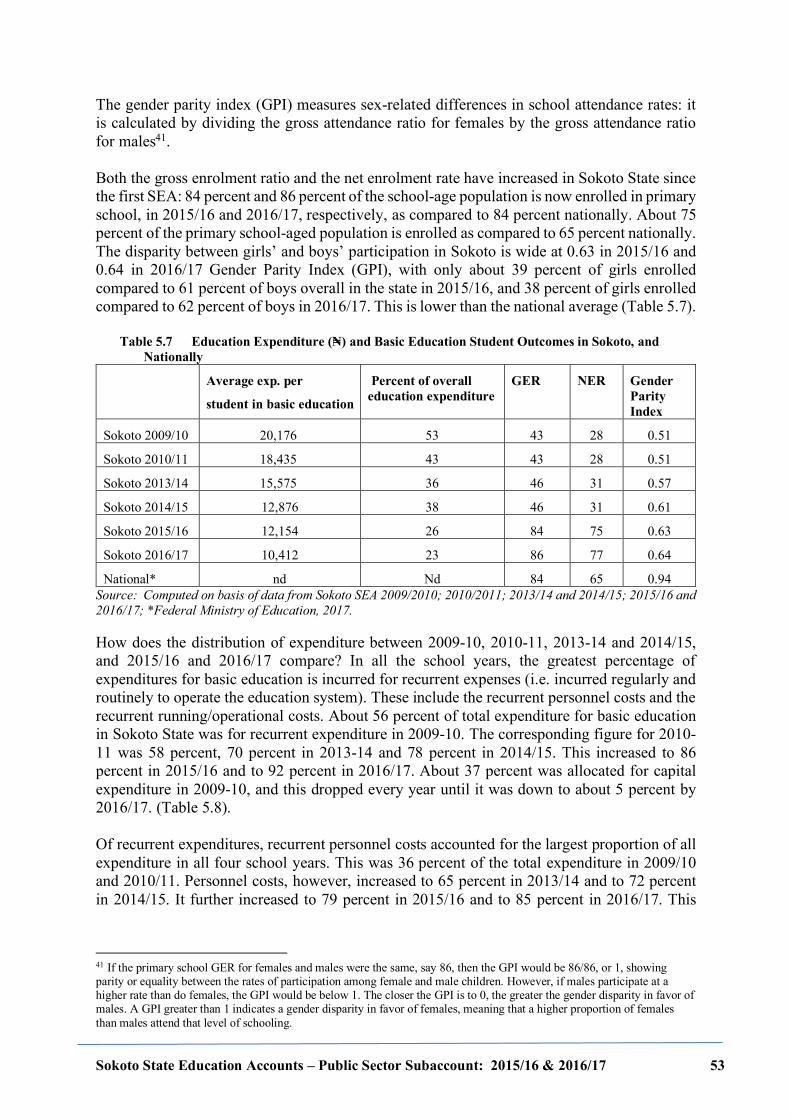
Sokoto State Education Accounts – Public Sector Subaccount: 2015/16 & 2016/17 53
The gender parity index (GPI) measures sex-related differences in school attendance rates: it is calculated by dividing the gross attendance ratio for females by the gross attendance ratio for males41. Both the gross enrolment ratio and the net enrolment rate have increased in Sokoto State since the first SEA: 84 percent and 86 percent of the school-age population is now enrolled in primary school, in 2015/16 and 2016/17, respectively, as compared to 84 percent nationally. About 75 percent of the primary school-aged population is enrolled as compared to 65 percent nationally. The disparity between girls’ and boys’ participation in Sokoto is wide at 0.63 in 2015/16 and 0.64 in 2016/17 Gender Parity Index (GPI), with only about 39 percent of girls enrolled compared to 61 percent of boys overall in the state in 2015/16, and 38 percent of girls enrolled compared to 62 percent of boys in 2016/17. This is lower than the national average (Table 5.7).
Table 5.7 Education Expenditure (N=) and Basic Education Student Outcomes in Sokoto, and Nationally
Average exp. per
student in basic education
Percent of overall education expenditure
GER NER Gender Parity Index
Sokoto 2009/10 20,176 53 43 28 0.51
Sokoto 2010/11 18,435 43 43 28 0.51
Sokoto 2013/14 15,575 36 46 31 0.57
Sokoto 2014/15 12,876 38 46 31 0.61
Sokoto 2015/16 12,154 26 84 75 0.63
Sokoto 2016/17 10,412 23 86 77 0.64
National* nd Nd 84 65 0.94 Source: Computed on basis of data from Sokoto SEA 2009/2010; 2010/2011; 2013/14 and 2014/15; 2015/16 and 2016/17; *Federal Ministry of Education, 2017. How does the distribution of expenditure between 2009-10, 2010-11, 2013-14 and 2014/15, and 2015/16 and 2016/17 compare? In all the school years, the greatest percentage of expenditures for basic education is incurred for recurrent expenses (i.e. incurred regularly and routinely to operate the education system). These include the recurrent personnel costs and the recurrent running/operational costs. About 56 percent of total expenditure for basic education in Sokoto State was for recurrent expenditure in 2009-10. The corresponding figure for 2010-11 was 58 percent, 70 percent in 2013-14 and 78 percent in 2014/15. This increased to 86 percent in 2015/16 and to 92 percent in 2016/17. About 37 percent was allocated for capital expenditure in 2009-10, and this dropped every year until it was down to about 5 percent by 2016/17. (Table 5.8). Of recurrent expenditures, recurrent personnel costs accounted for the largest proportion of all expenditure in all four school years. This was 36 percent of the total expenditure in 2009/10 and 2010/11. Personnel costs, however, increased to 65 percent in 2013/14 and to 72 percent in 2014/15. It further increased to 79 percent in 2015/16 and to 85 percent in 2016/17. This
41 If the primary school GER for females and males were the same, say 86, then the GPI would be 86/86, or 1, showing parity or equality between the rates of participation among female and male children. However, if males participate at a higher rate than do females, the GPI would be below 1. The closer the GPI is to 0, the greater the gender disparity in favor of males. A GPI greater than 1 indicates a gender disparity in favor of females, meaning that a higher proportion of females than males attend that level of schooling.
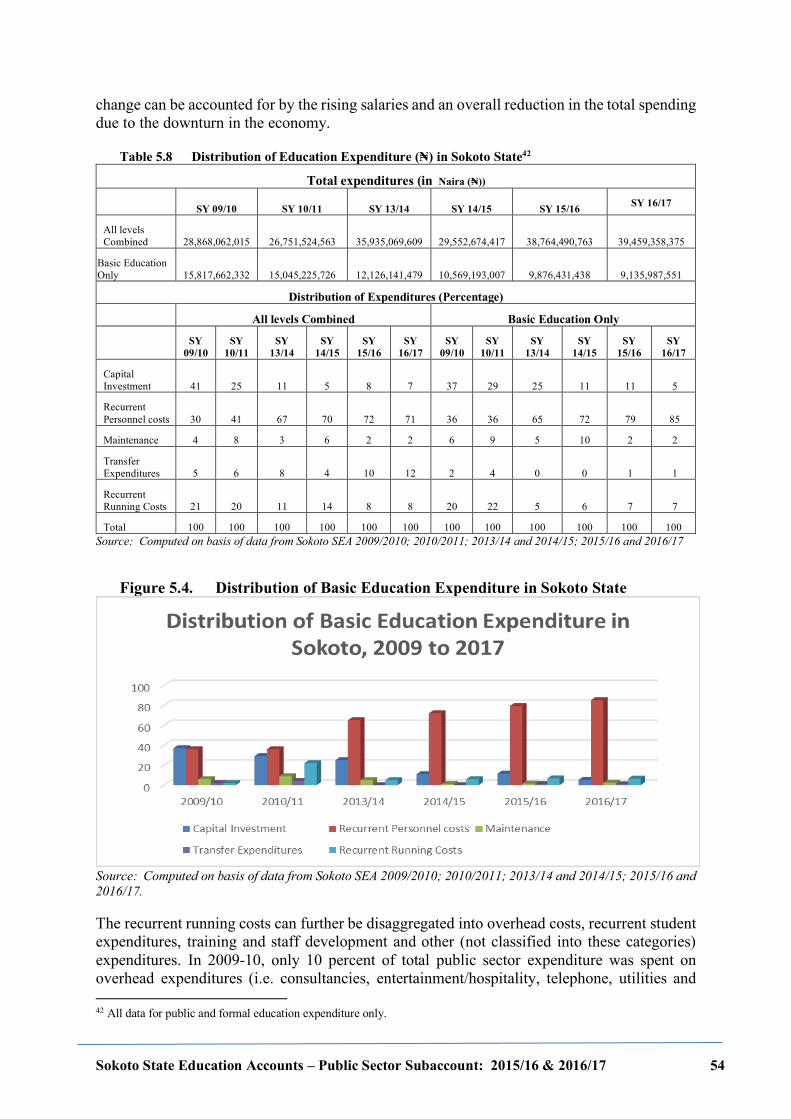
Sokoto State Education Accounts – Public Sector Subaccount: 2015/16 & 2016/17 54
change can be accounted for by the rising salaries and an overall reduction in the total spending due to the downturn in the economy.
Table 5.8 Distribution of Education Expenditure (N=) in Sokoto State42
Total expenditures (in Naira (₦))
SY 09/10 SY 10/11 SY 13/14 SY 14/15 SY 15/16 SY 16/17
All levels Combined 28,868,062,015 26,751,524,563 35,935,069,609 29,552,674,417 38,764,490,763 39,459,358,375
Basic Education Only 15,817,662,332 15,045,225,726 12,126,141,479 10,569,193,007 9,876,431,438 9,135,987,551
Distribution of Expenditures (Percentage)
All levels Combined Basic Education Only
SY
09/10 SY
10/11 SY
13/14 SY
14/15 SY
15/16 SY
16/17 SY
09/10 SY
10/11 SY
13/14 SY
14/15 SY
15/16 SY
16/17
Capital Investment 41 25 11 5 8 7 37 29 25 11 11 5
Recurrent Personnel costs 30 41 67 70 72 71 36 36 65 72 79 85
Maintenance 4 8 3 6 2 2 6 9 5 10 2 2
Transfer Expenditures 5 6 8 4 10 12 2 4 0 0 1 1
Recurrent Running Costs 21 20 11 14 8 8 20 22 5 6 7 7
Total 100 100 100 100 100 100 100 100 100 100 100 100 Source: Computed on basis of data from Sokoto SEA 2009/2010; 2010/2011; 2013/14 and 2014/15; 2015/16 and 2016/17
Figure 5.4. Distribution of Basic Education Expenditure in Sokoto State
Source: Computed on basis of data from Sokoto SEA 2009/2010; 2010/2011; 2013/14 and 2014/15; 2015/16 and 2016/17. The recurrent running costs can further be disaggregated into overhead costs, recurrent student expenditures, training and staff development and other (not classified into these categories) expenditures. In 2009-10, only 10 percent of total public sector expenditure was spent on overhead expenditures (i.e. consultancies, entertainment/hospitality, telephone, utilities and 42 All data for public and formal education expenditure only.
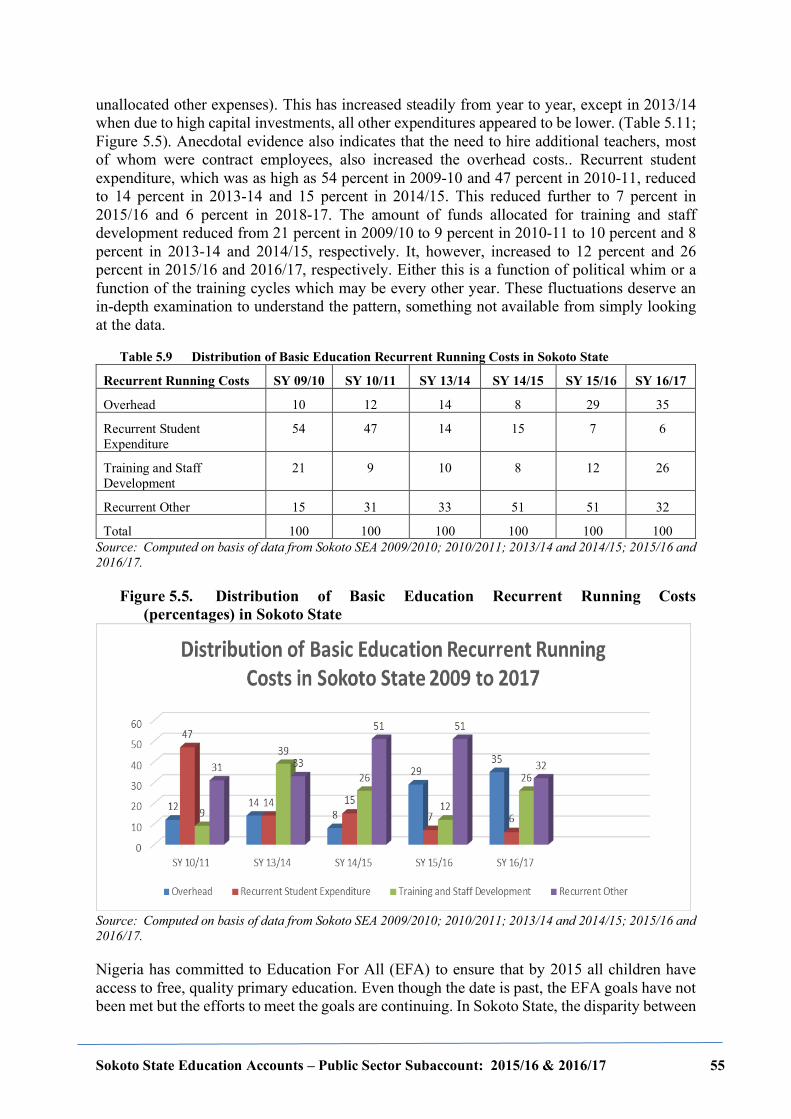
Sokoto State Education Accounts – Public Sector Subaccount: 2015/16 & 2016/17 55
unallocated other expenses). This has increased steadily from year to year, except in 2013/14 when due to high capital investments, all other expenditures appeared to be lower. (Table 5.11; Figure 5.5). Anecdotal evidence also indicates that the need to hire additional teachers, most of whom were contract employees, also increased the overhead costs.. Recurrent student expenditure, which was as high as 54 percent in 2009-10 and 47 percent in 2010-11, reduced to 14 percent in 2013-14 and 15 percent in 2014/15. This reduced further to 7 percent in 2015/16 and 6 percent in 2018-17. The amount of funds allocated for training and staff development reduced from 21 percent in 2009/10 to 9 percent in 2010-11 to 10 percent and 8 percent in 2013-14 and 2014/15, respectively. It, however, increased to 12 percent and 26 percent in 2015/16 and 2016/17, respectively. Either this is a function of political whim or a function of the training cycles which may be every other year. These fluctuations deserve an in-depth examination to understand the pattern, something not available from simply looking at the data.
Table 5.9 Distribution of Basic Education Recurrent Running Costs in Sokoto State
Recurrent Running Costs SY 09/10 SY 10/11 SY 13/14 SY 14/15 SY 15/16 SY 16/17
Overhead 10 12 14 8 29 35
Recurrent Student Expenditure
54 47 14 15 7 6
Training and Staff Development
21 9 10 8 12 26
Recurrent Other 15 31 33 51 51 32
Total 100 100 100 100 100 100 Source: Computed on basis of data from Sokoto SEA 2009/2010; 2010/2011; 2013/14 and 2014/15; 2015/16 and 2016/17.
Figure 5.5. Distribution of Basic Education Recurrent Running Costs (percentages) in Sokoto State
Source: Computed on basis of data from Sokoto SEA 2009/2010; 2010/2011; 2013/14 and 2014/15; 2015/16 and 2016/17. Nigeria has committed to Education For All (EFA) to ensure that by 2015 all children have access to free, quality primary education. Even though the date is past, the EFA goals have not been met but the efforts to meet the goals are continuing. In Sokoto State, the disparity between
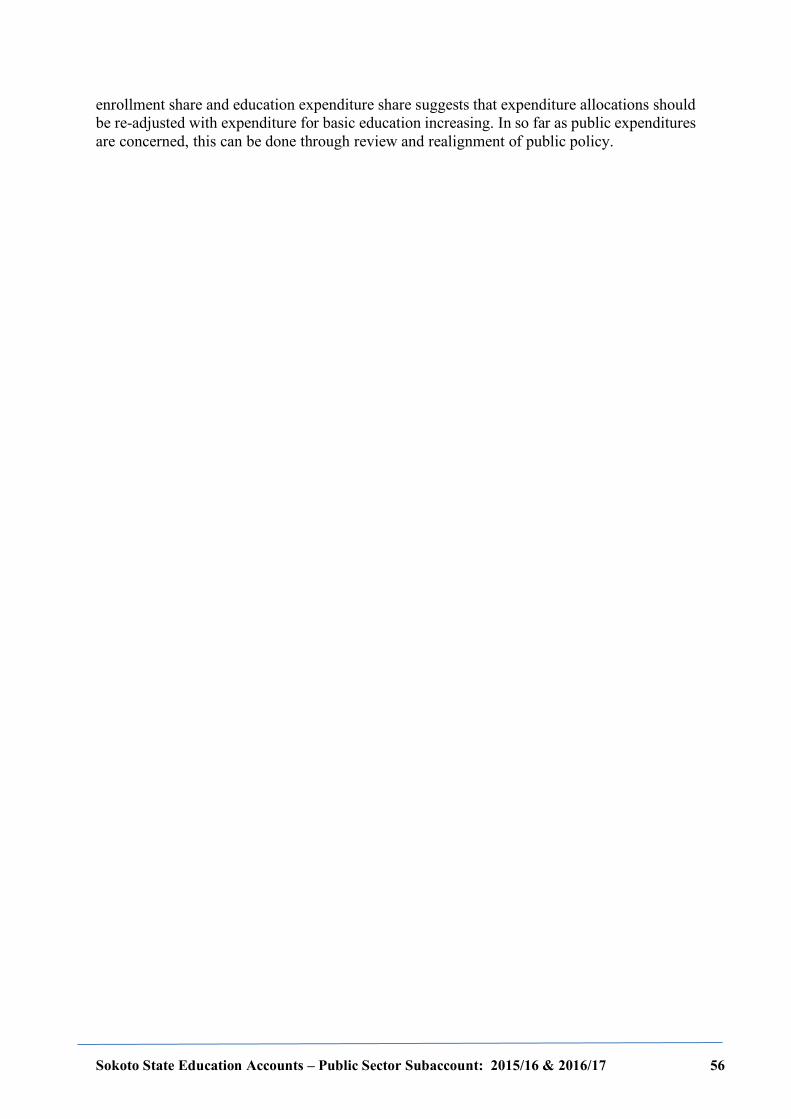
Sokoto State Education Accounts – Public Sector Subaccount: 2015/16 & 2016/17 56
enrollment share and education expenditure share suggests that expenditure allocations should be re-adjusted with expenditure for basic education increasing. In so far as public expenditures are concerned, this can be done through review and realignment of public policy.
Sokoto State Education Accounts – Public Sector Subaccount: 2015/16 & 2016/17 57
6 Conclusions and Recommendations of Sokoto SEA This chapter identifies some of the most significant findings of the SEA as well as the recommendations for improving the process and the outcomes of the SEA. 6.1 Conclusions - Significance of Findings The Sokoto State government expended 15 percent of its total budget on education during School Year 2015/16 and 13.5 percent in 2016/17, a reduction from the 26 percent in 2009/10 school year (the first year a SEA was conducted in Sokoto). Most of the financing of education in the public sector comes from the State government (58 percent in 2015/16 and 64 percent in 2016/17). The State government is also the financing agent for the largest share of public sector financing (59 percent in 2015/16 and 64 percent in 2016/17). Between them, the state and local governments are responsible for over 80 percent of the expenditures incurred by the public sector on education in the state and this accounts for approximately 24 percent of the total state budget. It can thus be stated that, Sokoto State is committed to providing education for its children and that the state is spending a significant proportion of its total expenditure on education, even though it still has a long way to go in the bid to reach the UNESCO standard of 26 percent of government expenditure for education. In 2015/16, about 24 percent of all funding was spent on basic education, 19 percent secondary education, 42 percent for tertiary education, 0.03 percent is for special education and 4 percent for non-formal education. In 2016/17, about 22 percent of all funding was spent on basic education, 20 percent secondary education, 42 percent for tertiary education, 0.03 percent is for special education and 4 percent for non-formal education. The data reveals that while the overall amount of money spent on education by the public sector was about 2 percent higher in 2016/17 as compared with 2015/16, the overall pattern of spending for both the years was the same– the largest proportion of funds were allocated for tertiary, followed by basic education and then the secondary education level. It is also noted that the proportion of expenditures is not in keeping with the distribution of students at these levels. These expenditure disparities may impede Sokoto State’s ability to meet access and educational quality goals. Primary education, the target of the EFA goal, may be underfinanced in view of the discrepancy between its share of enrollment and share of expenditures. Using the same logic, tertiary education may be overfunded. At the same time, it must also be kept in mind that the cost of provision of education at lower levels is significantly lower than at the higher levels. In 2009/2010 and 2010/2011, while over 40 percent of total education expenditure was incurred for basic education, over 80 percent of students were enrolled at the basic level, showing a disparity. The same disparity is observed in the school years 2013/2014 and 2014/2015 where an average of 37 percent of total education expenditure is incurred for basic education, but over 75 percent of students are enrolled at the basic level. The same trend is observed in the school years 2015/16 and 2016/17 where an average of 25 percent of total education expenditure is incurred for basic education, but about 90 percent of students are enrolled at the basic level. The highest disparity is observed in the case of tertiary education, where an average of 44 percent of expenditure is incurred for only 2 percent of students enrolled. While it is true that tertiary education requires a larger outlay of resources and expenditures, the disparities observed appear to be very large and need to be examined further to ensure funds are being used appropriately and efficiently. It should be emphasized basic education is important for equipping pupils with a range of skills and stimulating economic growth. It also has particular
Sokoto State Education Accounts – Public Sector Subaccount: 2015/16 & 2016/17 58
benefits for girls in encouraging later marriage, better maternal health, fewer and healthier children and increased economic opportunities. Inadequate funding at that level will be counterproductive. Nigeria has committed to Education For All (EFA) to ensure that by 2015 all children have access to free, quality primary education. This goal has not been met, however, the state is still committed to attaining the EFA goals. In Sokoto State, the disparity between enrollment share and education expenditure share suggests that expenditure allocations should be re-adjusted with expenditure for basic education increasing. Insofar as public expenditures are concerned, this can be done through public policy. The average public sector expenditure per student expenditure in public school was N=44,661 in 2015/16 and N=42,286 in 2016/17, with the costs at basic education level varying significantly by level. The average per pupil expenditure in secondary education was about four times that of basic education while that for tertiary education was about 70 times more than that of basic education. In 2009/10, only 10 percent of the recurrent running costs were for overhead expenses (i.e. consultancies, entertainment/hospitality, telephone, utilities and unallocated other expenses). This increased to 12 percent in 2010/11 and then to 14 percent in 2013/14. This, however, decreased to 8 percent in 2014/15. This overhead, however, increased to 29 percent in 2015/16 and 35 percent in 2016/17. Recurrent student expenditure, which was as high as 54 percent in 2009/10 and 47 percent in 2010/11, reduced to 14 percent in 2013/14 and 15 percent in 2014/15. This reduced further to 7 percent in 2015/16 and 6 percent in 2016/17. Anecdotal evidence indicates that this reflects a possible change in procurement policies and the non-purchase of books and instructional materials in the state after 2010/11. As has been discussed elsewhere in this document, the cyclical nature of expenditures on teacher training and the amount of variation in the amount spent warrants an exploration of the causes for this variation. The amount of funds allocated for training and staff development reduced from 21 percent in 2009/10 to 9 percent in 2010/11 to 10 percent and 8 percent in 2013/14 and 2014/15, respectively. It, however, increased to 12 percent and 26 percent in 2015/16 and 2016/17, respectively. On average, for every teacher in Sokoto State, there were 47 students in 2009/10. This ratio reduced slightly to about 46 students to a teacher in 2015/16 but increased to 48 in 2016/17, while nationally there are 33 students per teacher. This signifies that Sokoto State’s teachers are probably dealing with much larger class sizes than necessary. The Federal Ministry of Education has set a pupil-teacher standard at 35:1 for basic education. The data thus indicate that Sokoto State is still has a lot to do to achieve the set pupil-teacher ratio. Data also show that there are 90 students to a qualified teacher in Sokoto State, in contrast to the 46 students to a qualified teacher nationally. In a context where a state is attempting to increase access and improve quality, a lower pupil-teacher ratio is desirable and an indication of commitment to these (and EFA) goals. Access to formal schooling seems to have improved tremendously in the last couple of years. Both the gross enrolment ratio and the net enrolment rate have increased in Sokoto State since the first SEA: 84 percent and 86 percent of the school-age population is now enrolled in primary school, in 2015/16 and 2016/17, respectively, as compared to 84 percent nationally. About 75 percent of the primary school-aged population is enrolled as compared to 65 percent nationally.
Sokoto State Education Accounts – Public Sector Subaccount: 2015/16 & 2016/17 59
The disparity between girls’ and boys’ participation in Sokoto is wide at 0.63 in 2015/16 and 0.64 in 2016/17 Gender Parity Index (GPI), with only about 39 percent of girls enrolled compared to 61 percent of boys overall in the state in 2015/16, and 38 percent of girls enrolled compared to 62 percent of boys in 2016/17. This is lower than the national average. In spite of the increasing advocacy for the education of the girl child by the Government and some NGOs, the gap in enrolment in the state is still negatively skewed to girls. In spite of the awareness of government efforts to provide education for all by pumping extra resources on education during the study periods, the effort on girl-child education cannot be easily analyzed since the data is not disaggregated by gender. However, policy documents indicate government efforts in providing education for the girl-child, e.g. UNICEF-assisted girl-child education program (GEP)/Girls education replication program (coordinated by SUBEB). 6.2 Challenges and Recommendations Review of the SEA data indicates that data, at the aggregate level, is available to support evidence-based decision making. At this point it is evident that there is a need to examine the allocation of funds by level of education to ensure there is adequate financing at the primary and basic education level. Similarly, there is a need to increase the level of spending on recurrent expenditures such as text books, teacher and staff development, etc. If the data were available in a more granular form, it would help the policy makers make better policies and allocate funds to support the EFA and MDGs goals. Some concerns and recommendations for addressing them are noted below: 6.2.1 Recommendations for data collection The process of preparing the SEA subaccount was very inclusive involving personnel not only from the Sokoto State Ministry of Basic and Secondary Education and the State Universal Basic Education Board (SUBEB) but also significant stakeholders. The stakeholders included the President of the National Association of Proprietors of Private Schools (NAPPS), the Commissioner of the Ministry of Local Government Affairs as well as representatives from parastatal organizations. The involvement of all these people assured the SEA Working Group of access to data as well as a profound understanding of that data. Because of this involvement of stakeholders, the team was better able to collect data and include expenditures that had not been picked up in other studies. The Sokoto SWG observe that there is now a better understanding of the SEA process, which explains why there was a better performance under SEA IV. It was noted with satisfaction the participation of the State and LGC Computer staff as another strategy that ensured the success of the team. The SWG thus express confidence on the reliability and validity of the data collected. The principal problems and recommendations for future SEAs are as follows:
• There is a need to continuously inform the policy makers of the purpose of SEA and the data available so that the SEA process and data generated can become a part of the system and support evidence-based decision making.
• There is a greater need for using SEA process, even at lower levels of record keeping to ensure that data is available and easy to access when needed by the decision makers to support policy debates.
• Most of the data that was available was not in electronic form and had to be entered manually into the data base. Electronically generated data would be easier to enter into
Sokoto State Education Accounts – Public Sector Subaccount: 2015/16 & 2016/17 60
the data base and likely result in fewer errors in transferring the data. In the absence of electronic data, it is important to build time for cleaning the data and to have the manpower to double check each and every number. We thus recommend that the government move towards electronic systems for record keeping, so all data can be available in an electronic format.
• Data was not adequately disaggregated by level (junior and senior secondary, preprimary and primary in public schools) or in terms of location (rural/urban) and gender. We are sure that there are ways of obtaining this data, it just requires more time and manpower, than was available to the SEA team, to mine the information available to the Ministries. The SEA team recommends the government document its expenditures by level of education, gender, and location (urban/rural) as this would support evidence-based policy decision-making. .
• Data on public expenditures for religious formal schools at the primary and secondary level was unavailable, though there were expenditures made by the public sector on those schools. It is recommended that the Ministry add in some more detail to their records so that this data can be obtained.
• Another policy recommendation is that more training and sensitization is necessary for school and institution-level data keepers to assure more integrity in data collection and analysis.
• There is a concern that the keepers of data are not willing to provide data as they are not a part of the data collection activity. It is hoped that with greater exposure to this activity, there may be a change in attitudes resulting in a more efficient process.
• Financial data collection is one of the most difficult data to collect due to the sensitivities surrounding the use of data. Therefore, sensitizing all relevant stakeholders including the Heads of Administration and sectional heads is recommended at both the LGCs and the LGEAs levels
• An introductory letter from Federal Ministry of Education should be obtained in good time for use in collecting data at State-based federal organizations
• There is a need to continuously inform the policy makers of the purpose of SEA and the data available so that the SEA process and data generated can become a part of the system and support evidence-based decision making.
6.2.2 Recommendations for Institutionalization of SEA The response of the personnel working on the SEA was very positive. The SWG feels confident in their skills that they could conduct the SEA with minimal support. To repeat the SEA we recommend:
• Establishing a permanent SEA Working Group to work with the MOBSE and SUBEB on understanding the findings of SEA I, II, III and IV in preparation for future SEAs.
• Additional training for SUBEB and MOBSE staff on use and development of the data base to assist them in answering questions posed by the MOBSE or SUBEB and in revising and updating a new data base for the next SEA. This will also lead to institutionalization of the SEA in the state.
• Ministry of Basic and Secondary Education and SUBEB should make a more concerted effort to gather annual data on indicators of school quality, such as retention, promotion, drop-out rates for students as it enables them to learn of progress achieved through new policies and also will support the SEA as a way to project costs.
• Conduct SEA annually or every other year to allow for tracking of progress towards the current goals and priorities of the state government and provide an opportunity to collect data to inform policy decisions on issues of special interest.
Sokoto State Education Accounts – Public Sector Subaccount: 2015/16 & 2016/17 61
• There should be a desk officer in the State responsible for SEA matters (either in the MOBSE HQ or SUBEB).
6.2.3 Recommendations for Improvement of Quality of Education Based on a review of literature and the findings from the SEA, the following have been identified as challenges for improving access, equity and quality of education in Nigeria.
• Teacher shortage leading to high student-teacher ratios, and a negative effect on the quality of basic education in the state. Also includes:
• Shortage of qualified teachers in the classroom • Poor training and staff development • Schools in rural areas with teachers to teach the students
• Low levels of funding: Although the Sokoto state government is devoting appreciable resources to education, funding of basic education in particular is low. The practice of needing matching grant funds to be able to draw the UBEC allocation poses significant burden on the state government and delays programmatic activity while the state is trying draw down its allocation.
• Complete and reliable enrollment data: this is a major challenge given the poor quality of data available at both Federal and State levels. This challenge has both political and technical dimensions. For this reason, projections based on population figures (like net and gross enrolments) have remained in the realm of conjectures and cause a general apathy towards the use of data for decision-making.
For improvement of quality of education for the students in basic and secondary school, there is a need to address each of the concerns noted above. SEA can help with better record keeping to instill confidence in the data generated for policy making. Review of the SEA data indicates that data, at the aggregate level, is available to support evidence-based decision making. At this point it is evident that there is a need to examine the allocation of funds by level of education to ensure there is adequate financing at the primary school level. Similarly, there is a need to increase the level of spending on recurrent expenditures such as text books, teacher and staff development, etc. If the data were available in a more granular form, it would help the policy makers make better policies and allocate funds to support the EFA and MDGs goals.
Sokoto State Education Accounts – Public Sector Subaccount: 2015/16 & 2016/17 62
References Amanchukwu, Rose N (2011). The Challenges of Quality Education and Good Governance in Developing Economy African Journal of Education and Technology, Volume 1 Number 3 (2011), Pp. 103-110 Bennell Paul, Kabir Isa Dandago, Murtala Sabo Sagagi (2007) Kano State, Federal Republic Of Nigeria: Education Public Expenditure Review Federal Ministry of Education (2017) Nigeria Education Indicators, 2016. FME, August 2017. Federal Ministry of Education: 4-Year Strategic Plan for the Development of the Education Sector 2011 – 2015 Federal Republic of Nigeria, National Policy on Education – 6th Edition (2013), Nigerian Educational Research and Development Council, Lagos, Nigeria Federal Ministry of Education: 4-Year Strategic Plan for the Development of the Education Sector 2011 – 2015 Federal Ministry of Education: Nigeria EFA Review Report (2000 – 2014) Hinchliffe, Keith.2002. "Public Expenditures on Education in Nigeria: Issues, Estimates, and Some Implications." Working Paper. World Bank, Africa Region, Human Development Department. Washington, DC. Labo-Popoola, S.O., A.A. Bello and F.A. Atanda 2009 Universal basic education in Nigeria: Challenges and way forward. The Social Sciences, 4: 614-621. Ministry of Education, Sokoto Nigeria. April 2014. Sokoto State Annual School Census Report 2013/2014. Ministry of Education Sokoto, Nigeria Ministry of Education, Sokoto Nigeria. December 2015. Sokoto State Annual School Census Report 2014/2015. Ministry of Education Sokoto, Nigeria Ministry of Education, Sokoto, Nigeria. February 2012. Sokoto State Education Accounts 2008/2009. Creative Associates International Inc. Washington, DC, and Ministry of Education Sokoto, Nigeria. Ministry of Education, Sokoto Nigeria. June 2013. Sokoto State Education Accounts 2010/2011. Creative Associates International Inc. Washington, DC, and Sokoto State Ministry of Education, Sokoto, Nigeria National Population Commission (Nigeria) and RTI International (2011) Nigeria Demographic and Health Survey (DHS) EdData Profile 1990, 2003 and 2008: Education Data for Decision-Making, 2011. Washington, DC, USA: National Population Commission (Nigeria) and RTI International National Population Commission (NPC) [Nigeria] and ICF Macro. 2009. Nigeria Demographic and Health Survey 2008. Abuja, Nigeria: National Population Commission and ICF Macro Nigeria National Bureau of Statistics. Basic and Senior Secondary Education Statistics in Nigeria 2007. Federal Ministry of Education, Nigeria. Nigeria National Bureau of Statistics. Federal Republic of Nigeria: 2006 Population Census - National and State Provisional Totals. Accessed on accessed January 30, 2009 at Url: http//www.nigerianstat.gov.ng/Connections/Pop2006.pdf
Sokoto State Education Accounts – Public Sector Subaccount: 2015/16 & 2016/17 63
Nigeria, Federal Ministry of Education (2002). Cost and Financing of Education in Nigeria, Education Sector Analysis. In Federal Republic of Nigeria, National Policy on Education - 4th Edition (2004), Nigerian Educational Research and Development Council, Lagos, Nigeria. Nigeria National Bureau of Statistics. Federal Republic of Nigeria: 2006 Population Census - National and State Provisional Totals. Accessed on accessed January 30, 2009 at Url: http//www.nigerianstat.gov.ng/Connections/Pop2006.pdf Nigeria National Bureau of Statistics. Basic and Senior Secondary Education Statistics in Nigeria 2007. Federal Ministry of Education, Nigeria. Schmidt, Pascala. A short guide to Educational expenditure statistics. Eurostat - education, training and culture. European Commission. 2003. Accessed from the following URL: http://forum.europa.eu.int/Public/irc/dsis/edtcs/library?l=/public/unesco_collection/methodology Sambo Umaru, Masai Abubakar and Ibrahim Abdullahi (2016) A study of girls' enrolment and completion in senior secondary school in Sokoto State, Nigeria. International Scholars Journals Frontiers of Library, Information and Computer Sciences ISSN 5721-610X Vol. 2 (2), pp. 145-149, February, 2016. Available online at www.internationalscholarsjournals.org Sokoto State Government, Nigeria: Approved state budgets for 2013, 2014, and 2015. UBEC (Universal Basic Education Commission). 2004. Basic Information on Universal Basic Education. UBEC: Abuja. Universal Basic Education Commission 2012 National Personnel Audit Report. Abuja UNESCO. 2006. "Decentralization of Education in Nigeria". Country report presented at the UNESCO Seminar on EFA Implementation: Teacher and Resource Management in the Context of Decentralization Administrative Staff College of India, Hyderabad, India, 6-8 January 2005, Published by Division of Educational Policies and Strategies, United Nations Educational, Scientific and Cultural Organization. UNESCO 2011 Education for All - Global Monitoring Report: Reaching the marginalized. Available at: http://unesdoc.unesco.org/images/0018/001865/186525e.pdf UNESCO UIS report accessed at: http://www.uis.unesco.org/_LAYOUTS/UNESCO/oosci-data-tool/index-en.html#en/cover UNICEF. (2012) “Global Out-of-School Children, Nigeria Country Study” Report, March 2012 World Bank (2008). Nigeria: A review of the costs and financing of public education. Volume II: Main Report. Report 42418-NG. AFTH3, Human Development Unit, Africa Region, World Bank. World Health Organization. (2003). Guide to producing national health accounts with special applications for low-income and middle income countries. World Health Organization, Geneva, Switzerland.
Sokoto State Education Accounts – Public Sector Subaccount: 2015/16 & 2016/17 64
Annexes Annex 1: Education Context in Nigeria with a focus on Sokoto State (This section has been included here as a compendium of information drawn from various sources on the current state of education in Nigeria, and Sokoto in particular, as well as to raise some generic issues that plague the system, to enable the readers to have a broader context for understanding the SEA subaccount data and where the data may inform policy). The Federal Constitution of 1999 provides the legal framework for educational management in Nigeria and stipulates that the government should provide education free of charge for all citizens as soon as possible. Education has been placed on the concurrent legislative list, implying that Federal, State and Local governments have legislative jurisdiction and corresponding functional responsibilities with respect to education. By this arrangement, although a few functions are exclusively assigned to the Federal or State government, most of the functions and responsibilities are in fact shared by the three tiers of government. The National Council on Education, is responsible for approval of a national curriculum for primary and secondary education, determining policies on all aspects and levels of education, setting standards for quality assurance and guidelines for national examinations for primary and secondary schools. The federal government is responsible for policy making and the enforcement of standards at the primary and secondary levels as well as the provision of tertiary education. The state governments are responsible for the management of secondary education and regionally focused tertiary education; basic education as well as adult and non-formal education are the joint responsibility of both state and local governments. A key policy initiative, the Universal Basic Education (UBE) Policy guides the provision of basic education. While the UBE policy preserves the constitutional responsibilities of states and local government to finance and manage basic education, it expands the roles, responsibilities, and investment of the federal government in basic education. At both the federal and state levels, a large collection of parastatals are responsible for the implementation of education policies. The structure of the education system is presented in Figure 1.1 and 1.2.
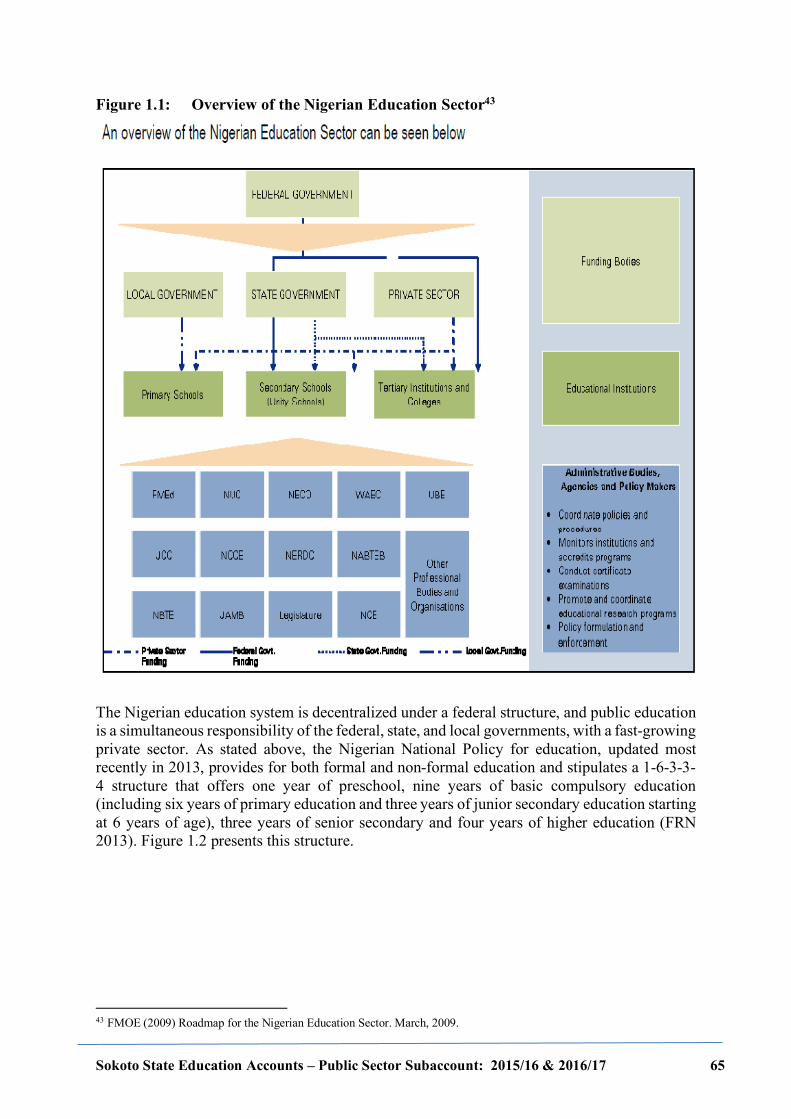
Sokoto State Education Accounts – Public Sector Subaccount: 2015/16 & 2016/17 65
Figure 1.1: Overview of the Nigerian Education Sector43
The Nigerian education system is decentralized under a federal structure, and public education is a simultaneous responsibility of the federal, state, and local governments, with a fast-growing private sector. As stated above, the Nigerian National Policy for education, updated most recently in 2013, provides for both formal and non-formal education and stipulates a 1-6-3-3-4 structure that offers one year of preschool, nine years of basic compulsory education (including six years of primary education and three years of junior secondary education starting at 6 years of age), three years of senior secondary and four years of higher education (FRN 2013). Figure 1.2 presents this structure.
43 FMOE (2009) Roadmap for the Nigerian Education Sector. March, 2009.
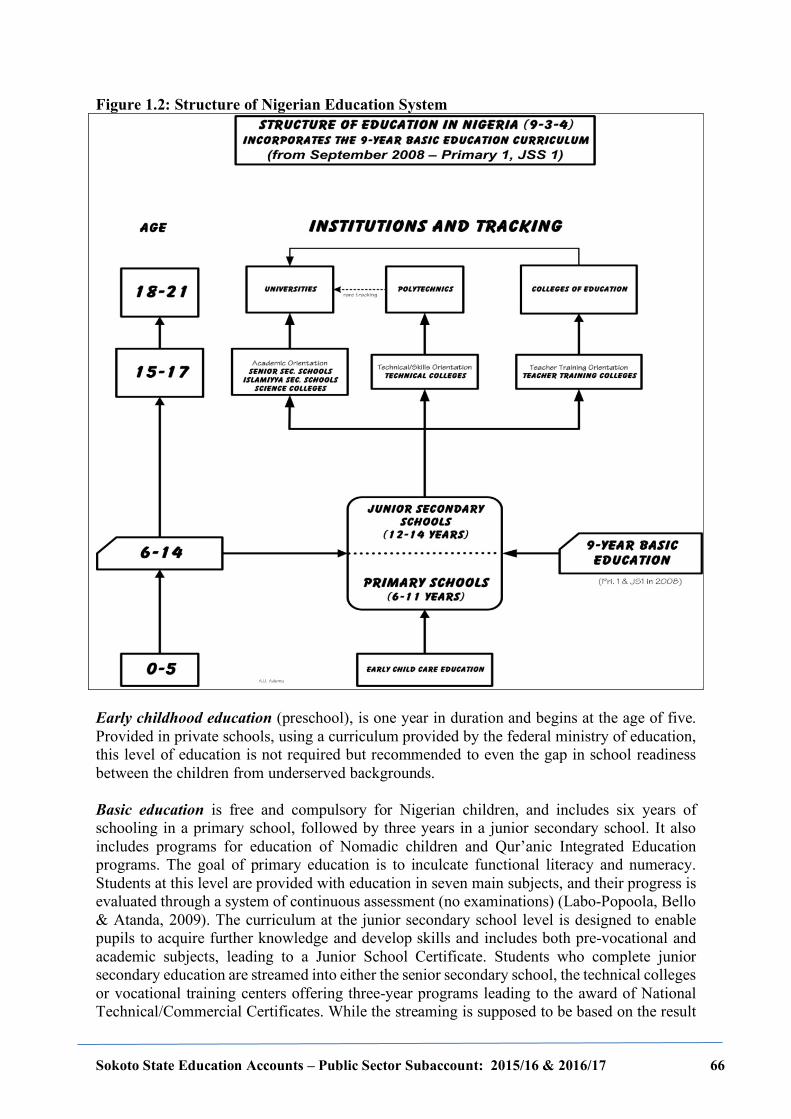
Sokoto State Education Accounts – Public Sector Subaccount: 2015/16 & 2016/17 66
Figure 1.2: Structure of Nigerian Education System
Early childhood education (preschool), is one year in duration and begins at the age of five. Provided in private schools, using a curriculum provided by the federal ministry of education, this level of education is not required but recommended to even the gap in school readiness between the children from underserved backgrounds. Basic education is free and compulsory for Nigerian children, and includes six years of schooling in a primary school, followed by three years in a junior secondary school. It also includes programs for education of Nomadic children and Qur’anic Integrated Education programs. The goal of primary education is to inculcate functional literacy and numeracy. Students at this level are provided with education in seven main subjects, and their progress is evaluated through a system of continuous assessment (no examinations) (Labo-Popoola, Bello & Atanda, 2009). The curriculum at the junior secondary school level is designed to enable pupils to acquire further knowledge and develop skills and includes both pre-vocational and academic subjects, leading to a Junior School Certificate. Students who complete junior secondary education are streamed into either the senior secondary school, the technical colleges or vocational training centers offering three-year programs leading to the award of National Technical/Commercial Certificates. While the streaming is supposed to be based on the result
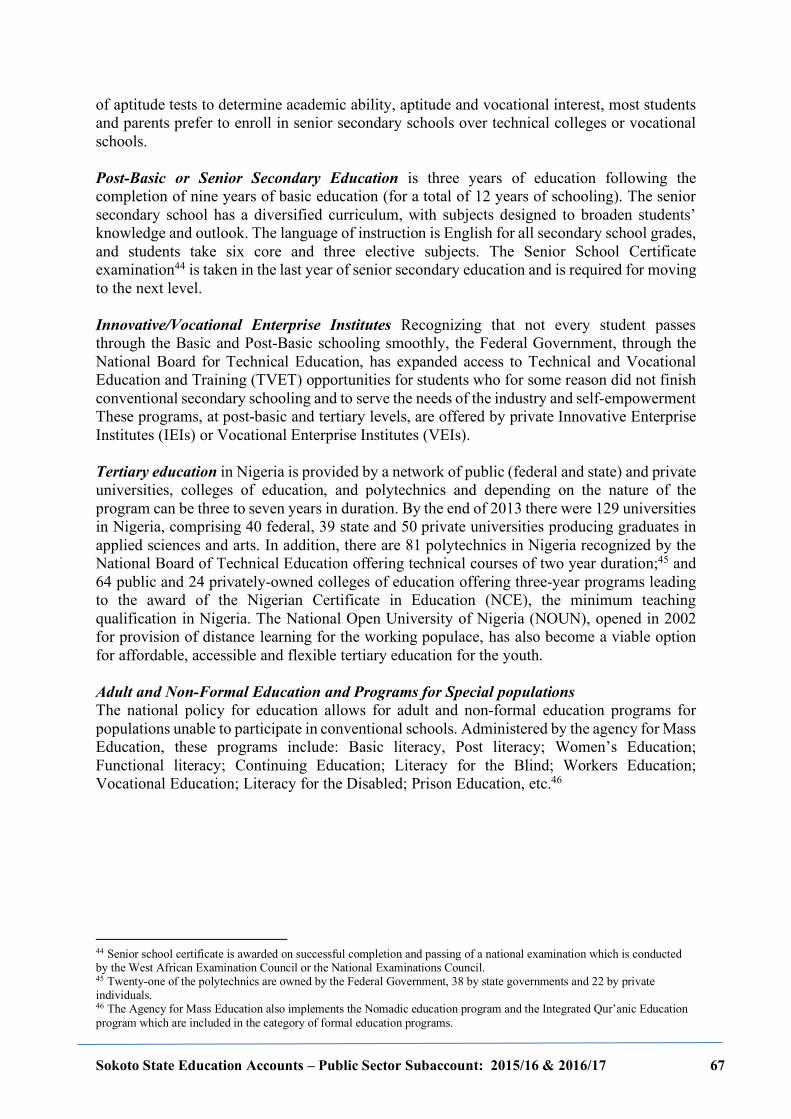
Sokoto State Education Accounts – Public Sector Subaccount: 2015/16 & 2016/17 67
of aptitude tests to determine academic ability, aptitude and vocational interest, most students and parents prefer to enroll in senior secondary schools over technical colleges or vocational schools. Post-Basic or Senior Secondary Education is three years of education following the completion of nine years of basic education (for a total of 12 years of schooling). The senior secondary school has a diversified curriculum, with subjects designed to broaden students’ knowledge and outlook. The language of instruction is English for all secondary school grades, and students take six core and three elective subjects. The Senior School Certificate examination44 is taken in the last year of senior secondary education and is required for moving to the next level. Innovative/Vocational Enterprise Institutes Recognizing that not every student passes through the Basic and Post-Basic schooling smoothly, the Federal Government, through the National Board for Technical Education, has expanded access to Technical and Vocational Education and Training (TVET) opportunities for students who for some reason did not finish conventional secondary schooling and to serve the needs of the industry and self-empowerment These programs, at post-basic and tertiary levels, are offered by private Innovative Enterprise Institutes (IEIs) or Vocational Enterprise Institutes (VEIs). Tertiary education in Nigeria is provided by a network of public (federal and state) and private universities, colleges of education, and polytechnics and depending on the nature of the program can be three to seven years in duration. By the end of 2013 there were 129 universities in Nigeria, comprising 40 federal, 39 state and 50 private universities producing graduates in applied sciences and arts. In addition, there are 81 polytechnics in Nigeria recognized by the National Board of Technical Education offering technical courses of two year duration;45 and 64 public and 24 privately-owned colleges of education offering three-year programs leading to the award of the Nigerian Certificate in Education (NCE), the minimum teaching qualification in Nigeria. The National Open University of Nigeria (NOUN), opened in 2002 for provision of distance learning for the working populace, has also become a viable option for affordable, accessible and flexible tertiary education for the youth. Adult and Non-Formal Education and Programs for Special populations The national policy for education allows for adult and non-formal education programs for populations unable to participate in conventional schools. Administered by the agency for Mass Education, these programs include: Basic literacy, Post literacy; Women’s Education; Functional literacy; Continuing Education; Literacy for the Blind; Workers Education; Vocational Education; Literacy for the Disabled; Prison Education, etc.46
44 Senior school certificate is awarded on successful completion and passing of a national examination which is conducted by the West African Examination Council or the National Examinations Council. 45 Twenty-one of the polytechnics are owned by the Federal Government, 38 by state governments and 22 by private individuals. 46 The Agency for Mass Education also implements the Nomadic education program and the Integrated Qur’anic Education program which are included in the category of formal education programs.
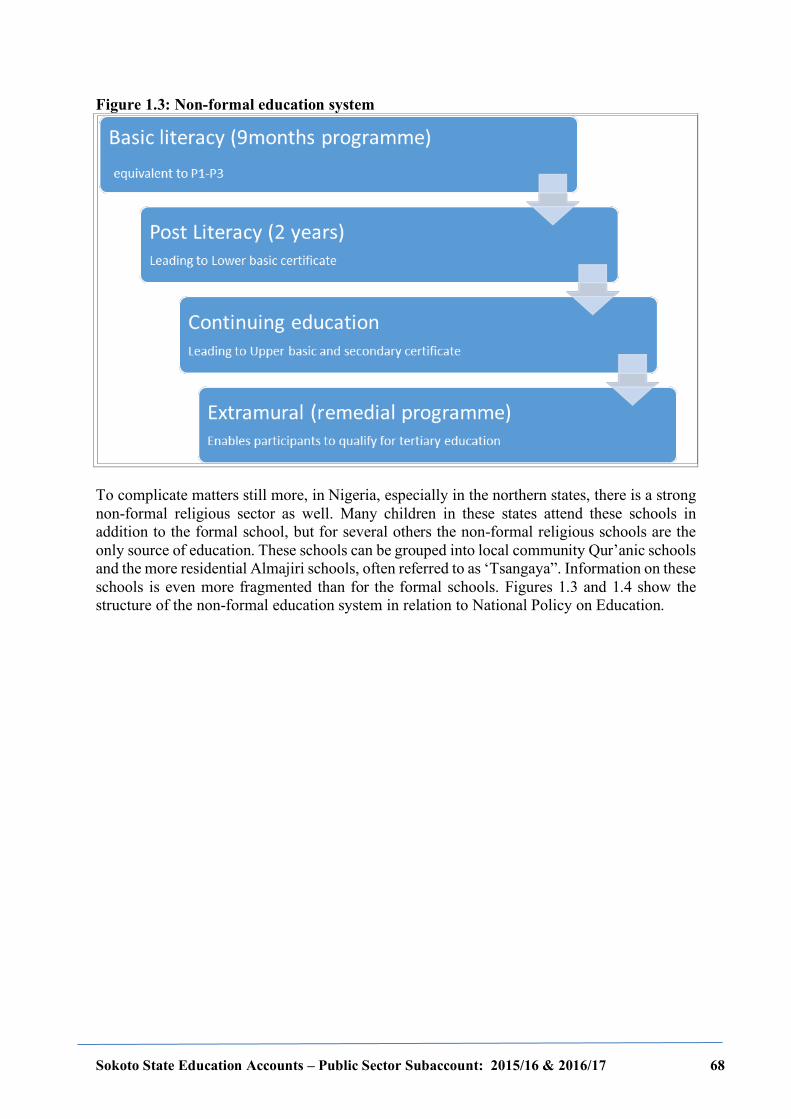
Sokoto State Education Accounts – Public Sector Subaccount: 2015/16 & 2016/17 68
Figure 1.3: Non-formal education system
To complicate matters still more, in Nigeria, especially in the northern states, there is a strong non-formal religious sector as well. Many children in these states attend these schools in addition to the formal school, but for several others the non-formal religious schools are the only source of education. These schools can be grouped into local community Qur’anic schools and the more residential Almajiri schools, often referred to as ‘Tsangaya”. Information on these schools is even more fragmented than for the formal schools. Figures 1.3 and 1.4 show the structure of the non-formal education system in relation to National Policy on Education.
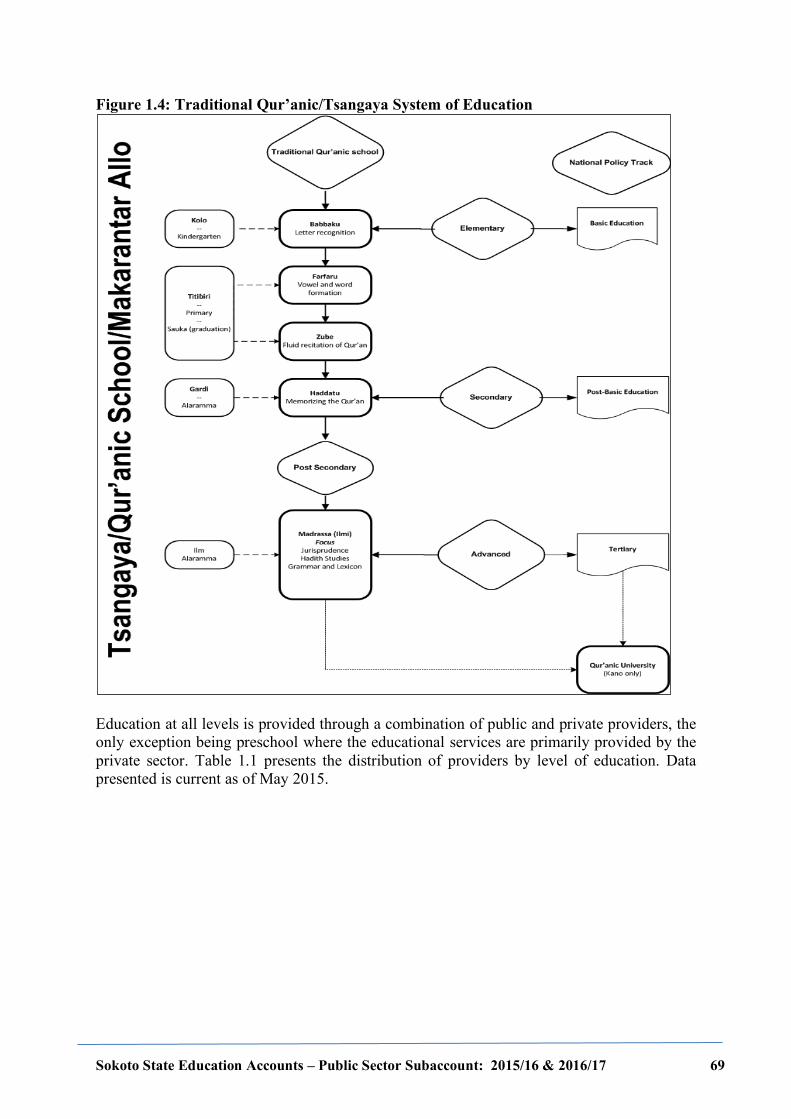
Sokoto State Education Accounts – Public Sector Subaccount: 2015/16 & 2016/17 69
Figure 1.4: Traditional Qur’anic/Tsangaya System of Education
Education at all levels is provided through a combination of public and private providers, the only exception being preschool where the educational services are primarily provided by the private sector. Table 1.1 presents the distribution of providers by level of education. Data presented is current as of May 2015.
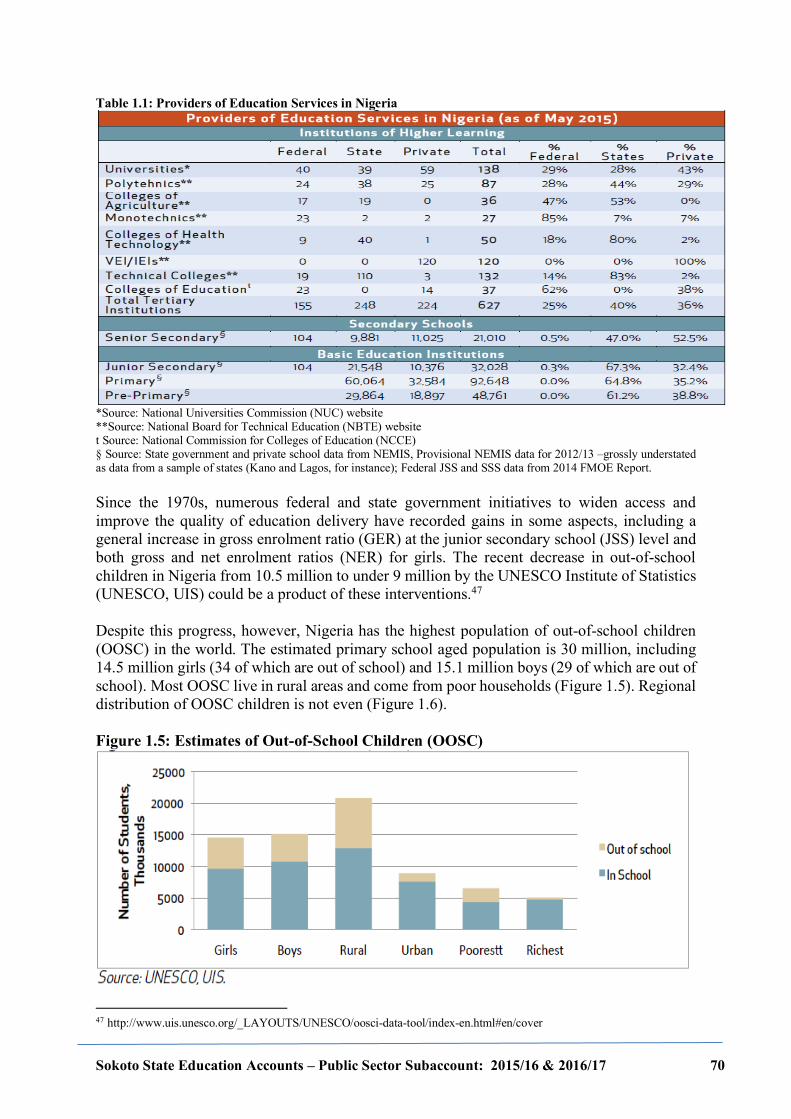
Sokoto State Education Accounts – Public Sector Subaccount: 2015/16 & 2016/17 70
Table 1.1: Providers of Education Services in Nigeria
*Source: National Universities Commission (NUC) website **Source: National Board for Technical Education (NBTE) website t Source: National Commission for Colleges of Education (NCCE) § Source: State government and private school data from NEMIS, Provisional NEMIS data for 2012/13 –grossly understated as data from a sample of states (Kano and Lagos, for instance); Federal JSS and SSS data from 2014 FMOE Report. Since the 1970s, numerous federal and state government initiatives to widen access and improve the quality of education delivery have recorded gains in some aspects, including a general increase in gross enrolment ratio (GER) at the junior secondary school (JSS) level and both gross and net enrolment ratios (NER) for girls. The recent decrease in out-of-school children in Nigeria from 10.5 million to under 9 million by the UNESCO Institute of Statistics (UNESCO, UIS) could be a product of these interventions.47 Despite this progress, however, Nigeria has the highest population of out-of-school children (OOSC) in the world. The estimated primary school aged population is 30 million, including 14.5 million girls (34 of which are out of school) and 15.1 million boys (29 of which are out of school). Most OOSC live in rural areas and come from poor households (Figure 1.5). Regional distribution of OOSC children is not even (Figure 1.6). Figure 1.5: Estimates of Out-of-School Children (OOSC)
47 http://www.uis.unesco.org/_LAYOUTS/UNESCO/oosci-data-tool/index-en.html#en/cover
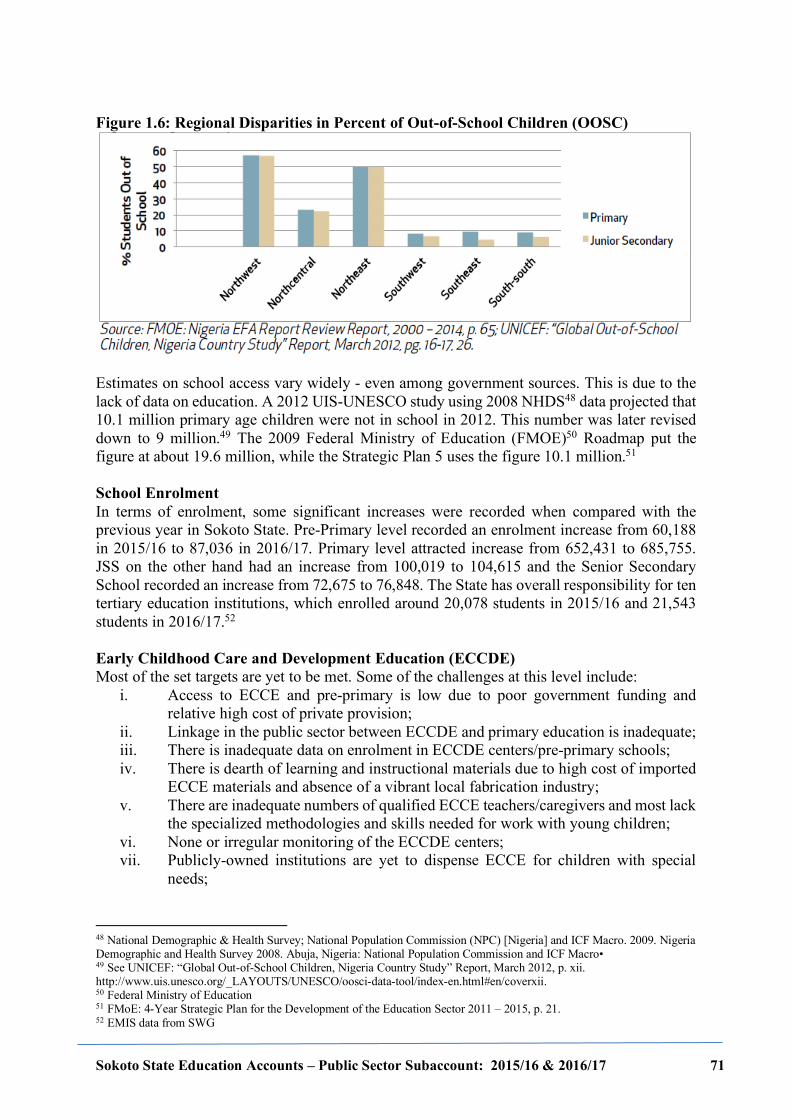
Sokoto State Education Accounts – Public Sector Subaccount: 2015/16 & 2016/17 71
Figure 1.6: Regional Disparities in Percent of Out-of-School Children (OOSC)
Estimates on school access vary widely - even among government sources. This is due to the lack of data on education. A 2012 UIS-UNESCO study using 2008 NHDS48 data projected that 10.1 million primary age children were not in school in 2012. This number was later revised down to 9 million.49 The 2009 Federal Ministry of Education (FMOE)50 Roadmap put the figure at about 19.6 million, while the Strategic Plan 5 uses the figure 10.1 million.51 School Enrolment In terms of enrolment, some significant increases were recorded when compared with the previous year in Sokoto State. Pre-Primary level recorded an enrolment increase from 60,188 in 2015/16 to 87,036 in 2016/17. Primary level attracted increase from 652,431 to 685,755. JSS on the other hand had an increase from 100,019 to 104,615 and the Senior Secondary School recorded an increase from 72,675 to 76,848. The State has overall responsibility for ten tertiary education institutions, which enrolled around 20,078 students in 2015/16 and 21,543 students in 2016/17.52 Early Childhood Care and Development Education (ECCDE) Most of the set targets are yet to be met. Some of the challenges at this level include:
i. Access to ECCE and pre-primary is low due to poor government funding and relative high cost of private provision;
ii. Linkage in the public sector between ECCDE and primary education is inadequate; iii. There is inadequate data on enrolment in ECCDE centers/pre-primary schools; iv. There is dearth of learning and instructional materials due to high cost of imported
ECCE materials and absence of a vibrant local fabrication industry; v. There are inadequate numbers of qualified ECCE teachers/caregivers and most lack
the specialized methodologies and skills needed for work with young children; vi. None or irregular monitoring of the ECCDE centers; vii. Publicly-owned institutions are yet to dispense ECCE for children with special
needs;
48 National Demographic & Health Survey; National Population Commission (NPC) [Nigeria] and ICF Macro. 2009. Nigeria Demographic and Health Survey 2008. Abuja, Nigeria: National Population Commission and ICF Macro• 49 See UNICEF: “Global Out-of-School Children, Nigeria Country Study” Report, March 2012, p. xii. http://www.uis.unesco.org/_LAYOUTS/UNESCO/oosci-data-tool/index-en.html#en/coverxii. 50 Federal Ministry of Education 51 FMoE: 4-Year Strategic Plan for the Development of the Education Sector 2011 – 2015, p. 21. 52 EMIS data from SWG
Sokoto State Education Accounts – Public Sector Subaccount: 2015/16 & 2016/17 72
viii. Lack of synergy among the line Ministries and Agencies involved in the implementation of the ECD Policy;
ix. Poverty – Most parents cannot afford to send their children to ECCDE centers; x. Low level of awareness of the policy on ECCDE among ECCDE policy/decision
makers and practitioners; xi. Inadequate sensitization/advocacy on ECCDE; xii. Most public schools are yet to comply with UBEC directive of establishing ECCDE
in their schools; and xiii. Poor commitment on the part of the State to access UBEC intervention fund.
Basic/primary education Access to basic education has improved over the years, although there is room for improvement. Access to formal schooling seems to have improved tremendously in the last couple of years in Sokoto State. Both the gross enrolment ratio and the net enrolment rate have increased in Sokoto State since the first SEA: 84 percent and 86 percent of the school-age population is now enrolled in primary school, in 2015/16 and 2016/17, respectively, as compared to 84 percent nationally. About 75 percent of the primary school-aged population is enrolled as compared to 65 percent nationally. Although progress has been made in basic education provision at primary and junior secondary levels, much more remains to be done, both in quantity and quality. The quality of education given at basic education level is still adjudged below standard as evidenced in the products of this level. Based on discussions with representatives of the SWG, the following were noted:
i. Participation in primary education is still low in comparison with primary school age population, with enrolment being particularly problematic, especially in the rural areas;
ii. The high quality of the national school curriculum is undermined by the generally low quality of teachers to implement it, translating into low levels of learning achievement.
iii. Infrastructure and furniture are inadequate and in dilapidated states; sanitary facilities and toilets are inadequate.
iv. There are social and cultural barriers that are hindrances to female participation. v. Non-accessing of FGN intervention funds by some SUBEBS. vi. Child labor. vii. Poverty. viii. Insecurity issues in some parts of the state.
Secondary education Both primary and secondary school teachers are on the same pay scales as all other civil servants. However, the average pay of secondary school teachers is over double that of primary school teachers mainly because secondary school teachers are university graduates and are, therefore, on higher pay scales and the average length of service of secondary school teachers is considerably longer than primary school teachers. In the past, state governments have provided little or no funding for instructional materials for secondary schools. Students themselves had, therefore, to purchase essential textbooks, but these were not affordable for the large majority. Some funding is now available through the UBEC Intervention Fund, but, as with primary education, the sums disbursed to date are too small to achieve any sizeable improvement in textbook availability, although, given the much
Sokoto State Education Accounts – Public Sector Subaccount: 2015/16 & 2016/17 73
small enrolments in JSS, expenditure per student on instructional materials is appreciable higher than for primary education. Secondary schools are, therefore, heavily reliant on fee income from students in order to meet basic overhead costs and students themselves have to buy their textbooks. Average expenditures per student are small and much lower among students at rural secondary schools. Adult Literacy Institutional frameworks for delivering literacy have been strengthened considerably. Partnerships have also increased in the provision of non-formal education. However, some of the challenges are:
i. Payment of facilitators. Despite spirited attempts to set mobilized funds for the payment of facilitators, this challenge has remained intractable. As long as this challenge is not met, it will remain difficult, indeed, impossible to operationalize literacy classes at the community level;
ii. Data collection, storage and usage in monitoring literacy delivery and participation is another area of great challenge.
Gender parity and equality The disparity between girls’ and boys’ participation in Sokoto is wide at 0.63 in 2015/16 and 0.64 in 2016/17 Gender Parity Index (GPI), with only about 39 percent of girls enrolled compared to 61 percent of boys overall in the state in 2015/16, and 38 percent of girls enrolled compared to 62 percent of boys in 2016/17. This is lower than the national average. While some improvement has been achieved over time, a number of challenges need to be addressed. These include:
i. Inadequate learning materials and infrastructure in schools to promote girl friendly school environment.
ii. Inadequate number of qualified teachers especially female teachers who serve as role models to girls in communities.
iii. Poverty of families who cannot afford to send their wards to school especially girls who serve as income generators for their respective families; this greatly affects enrolment and retention in schools.
iv. Recent trend in insecurity in some parts of Nigeria which threaten to derail the progress so far made in the education of girls.
Traditionally in Africa, the woman is regarded as a house keeper, child bearer, family health care taker, kitchen expert and the man’s relaxation tool after a hard day’s work. She is seen as being with low intellectual capability, physically weak and sometimes emotionally unstable. Her nature is associated with certain deficiencies and defectiveness. This perception affects the level of attention given to the girl-child in terms of her training and preparation for her future life. Oftentimes emphases are laid on the development of her male counterpart who is seen as a stronger being, endowed with better natural capabilities and potentialities which when taped have positive implication for accelerated socio-economic development. These erroneous views in some quarters still result in overt discrimination and determined resistance to the idea of giving girls an equal chance. Many remain uncomfortable with program that have a specific gender focus and passively fail to implement them.53
53 Sambo Umaru, Masai Abubakar and Ibrahim Abdullahi (2016) A study of girls' enrolment and completion in senior secondary school in Sokoto State, Nigeria. International Scholars Journals Frontiers of Library, Information and Computer Sciences ISSN 5721-610X Vol. 2 (2), pp. 145-149, February, 2016. Available online at www.internationalscholarsjournals.org
Sokoto State Education Accounts – Public Sector Subaccount: 2015/16 & 2016/17 74
The allocation of social, political and economic resources, benefits and opportunities is heavily weighted in favor of boys and men in virtually every ethnic or faith community across Nigeria. In the North East and North West attitudes towards girls’ education, women’s rights and HIV/AIDS remain conventional. HIV/AIDS is stigmatized, taboo and VCT centers are not popular, although churches and mosques in some communities have a policy on pre-marriage testing. The cultural separation of male and female spheres persists. To a large extent, women and girls are unaware of their rights and generally suffer from low self-esteem. Society increasingly accepts girls’ education but not to the same degree as boys (evidenced by education statistics) and girls’ educational progression beyond primary school is often viewed as waste of time and resources with no immediate benefit to the family. On the other hand, there are clear indications of positive change, as a result of growing sensitization and responsiveness by Federal and state governments, international and indigenous NGOs and some religious bodies, on the importance of girls’ education and women’s empowerment for the purpose of socio-economic development. Notwithstanding, increases in girls’ enrolment, completion and progression has been marginal; culturally sanctioned practices such as child marriage, gender-based violence and son preference in relation to access to education and other social benefits and opportunities are still common. Indeed, the ideas that prescribe pre-set gender roles still prevail and resistance to change remains strong, particularly in rural areas. 54 Sokoto State has a mainly rural, agricultural and Muslim population. Poverty remains high and basic education indicators show that enrolment, attendance and transition remain generally low. In 2009/10 girls’ enrolment in public primary schools was 44. Since 2010 the state (as many other northern-western states) has witnessed some unrest due to ethno-religious conflict and insurgency (Para-Mallam 2012). In a country where expenditure on education is far below the UNESCO 26 recommendation, specific basic requirements for girl-child education can at best receive minimal budgetary attention. Quality of education On average, for every teacher in Sokoto State, there were 47 students in 2009-10. This ratio reduced slightly to about 46 students to a teacher in 2015/16 but increased to 48 in 2016/17, while nationally there are 33 students per teacher. This signifies that Sokoto State’s teachers are probably dealing with much larger class sizes than necessary. The Federal Ministry of Education has set a pupil-teacher standard at 35:1 for basic education. The data thus indicate that Sokoto State is still has a lot to do to achieve the set pupil-teacher ratio. Data also show that there are 90 students to a qualified teacher in Sokoto State, in contrast to the 46 students to a qualified teacher nationally. In a context where a state is attempting to increase access and improve quality, a lower pupil-teacher ratio is desirable and an indication of commitment to these (and EFA) goals. A critical issue in Sokoto State is teacher shortage at all levels of education. There is no doubt that the inadequacy of qualified teachers has negative impacts on the general quality of basic education in the state. No education system can rise above the quality of its teachers as the standard of our teachers invariably affects the performance of the pupils and students. The entire system is characterized by:
54 PARA-MALLAM, OJ (2012) Transforming Education for Girls in Nigeria and Tanzania: Nigeria Endline Research Report National Institute for Policy & Strategic Studies. Aug 2012. Accessed at http://nipsskuru.gov.ng/journals/FULL%20TEGINT%20ACTION%20REPORT%20BY%20NIPSS%202012.pdf
Sokoto State Education Accounts – Public Sector Subaccount: 2015/16 & 2016/17 75
• Lack of adequate staffing in terms of quality and quantity. There is need for recruitment of only certified qualified teachers.
• Poor staff development schemes at all levels. For quality teaching to take place in the classroom, teachers must receive adequate training that would help them deliver the goods effectively
• Difficulty in attracting and retaining top talent in the teaching profession. There is need for encouragement of in-service training.
• Lack of establishment of schools in the rural areas. Where schools are available, teachers abhor going there on transfer because of lack of social amenities. Teachers think of the welfare of their children and go all out to resist being transferred to the rural areas. Model schools are needed in the rural areas, and effort should be made to provide staff quarters with electricity, potable water and communication network to attract teachers to such areas. There should be some sort of inducements granted by the government to staff posted to the rural areas. Rural areas should be made as attractive as the cities by providing essential social amenities so as to retain the population of both teachers and learners.
• The low number of graduates going into the teaching profession is of grave concern. The major causes are due to inadequate funding levels and poor salaries. The fact that teachers have become marginalized and the profession is the most impoverished of all sectors of the labor force in Nigeria. In almost every area of the system the conditions of the work environment, access to information, resources needed for supplies and equipment, salaries and benefits are extremely poor. Access to new technologies is virtually non-existent.
Adequate infrastructure will attract quality education when they are properly made use of. Where the government spends fortune putting up structures and ensures that the classrooms are well equipped for effective teaching and if the teachers were not trained on the use of those facilities and equipment they become a waste. But where these facilities are in place and the users are very conversant on how to operate them, for example computer/laptops, the teachers will enjoy teaching and proper learning will take place. Coupled with enough social amenities, the teachers will do their work without blinking their eye. Lack of social amenities thwarts the effort of the government to retain teachers in rural areas.55 It is very likely that teachers working in such places will not be supervised and many of them will absent themselves from school as they wish. It is likely that their knowledge and skills would be limited and may have little or nothing to offer the learner as many of them might not have gone on in-service training. As government officials rarely show their presence in such areas, there might not be official records about what goes on in the school. It boils down to the fact that the government should renovate schools to modern standards. Teacher competence is a major determinant of educational quality and thus learning outcomes in schools. The formal professional qualifications of teachers are the only readily available indicator of teacher competence. The prescribed teaching qualifications are the National Certificate of Education (NCE) in primary schools and a Bachelor of Education or Post-Graduate Diploma of Education in secondary schools. However, fewer than 40 percent of public primary school teachers have the NCE qualification in the northern states, which must
55 Amanchukwu, Rose N (2011). The Challenges Of Quality Education And Good Governance In Developing Economy African Journal Of Education And Technology, Volume 1 Number 3 (2011), Pp. 103-110
Sokoto State Education Accounts – Public Sector Subaccount: 2015/16 & 2016/17 76
have a substantial negative impact on learning outcomes.56 By contrast, the qualification profiles of public secondary school teachers are much better. All state governments are seeking to upgrade unqualified teachers, but progress is slow in most states mainly because most teachers have to study for the NCE qualification while they continue to work as teachers. Up until 2005, regular in-service training of teachers was minimal in most states. The UBEC Intervention Fund is attempting to increase significantly levels of INSET with the earmarking of 15 percent of funding for staff development activities. However, given the delays in disbursing UBEC funds, the numbers of teachers attending INSET activities remain relatively small. Management training is urgently needed particularly for head teachers and other school managers. Teachers should be encouraged to go for in-service training or seminars to update their knowledge and skills. With this, they can tackle day-to-day affairs of the school. They will be in good stead to give the learner quality education which, in turn, help the learner know what is good for the citizens of the state, and put them in place. Lack of knowledge and skill make teachers abandon the equipment provided by the government for the running of schools to enhance science and technology. Some of these equipment were left to rot away in some schools and they become a huge waste to the government, e.g. when a computer set was distributed to Federal Government Colleges, many of them were left in the same package as they were delivered without opening them for use; the reason being that the teachers were not conversant with the use of computers at that time. Professional support. Good quality and regular inspection and professional support and advice for teachers in schools are also critically important in raising teaching standards. Institutional arrangements for inspection differ to some extent from one state to another. SUBEB is responsible for the inspection of teachers in primary schools while the Teachers Service Board in collaboration with the SMOE inspect secondary schools. Serious resource constraints are a major issue in most states (particularly the lack of transport to rural schools) and there are also mounting concerns about the duplication of inspection and advisory services by the primary and secondary education boards, LGEAs and Zonal Offices, and central inspection departments in SMOEs. Teacher motivation. The general consensus is that teacher motivation and morale in government schools is low. A variety of factors influence teacher job satisfaction and overall levels of work commitment. Unlike in many countries, both primary and secondary school teachers receive the same pay and other conditions of service as other state government employees. However, state civil service pay scales are not uniform mainly because some state governments have greater ability to pay more than others. In most states, secondary teachers earn, on average, twice as much as primary school teachers. This is due to: (i) the much higher proportion of secondary teachers who are university graduates and who, therefore, start on GL 8 whereas NCE and Grade II begin their teaching careers on GL7 and GL 5 respectively; and (ii) generally better career progression opportunities for secondary school teachers. Consequently, many teachers are forced to find additional income earning opportunities, which can have a serious impact on their overall motivation and job performance. However, the opportunities for earning income from private tuition, which is common in many developing countries, appear to be quite limited in most states mainly because of widespread poverty,
56Source: SUBEB, SMOE, TSB/SEB/PPSMB,ASC, 2015
Sokoto State Education Accounts – Public Sector Subaccount: 2015/16 & 2016/17 77
especially in rural areas. Children whose parents can afford private tuition are probably attending private schools. 57 Teacher recruitment. State governments are responsible for the recruitment of civil servants (including teachers) for all positions above Grade Level 6. Even though, therefore, LGAs are formally responsible for primary education, they do not have the authority to recruit qualified teachers for their schools since the entry point for a newly qualified NCE teacher is GL7. LGEA Education Secretaries periodically inform SUBEB about the number of teachers that are required, especially in order to fill pressing vacancies, but these still have to be vetted and approved by the Office of the State Governor. Thus, the ability of the local governments who are constitutionally responsible for primary education to improve primary education provision in their jurisdictions is quite seriously constrained by these recruitment regulations and policies. Consequently, the degree to which primary education has been decentralized to local governments is, in practice, quite limited (Bennel 2007). Political factors also complicate and, in some instances, undermine the recruitment process. The requirement that teachers must be indigenes of the LGA and/or state reduces the pool of available candidates, which is a major problem in remoter and poorer LGAs that have fewer teachers seeking employment. LGA Chairmen and other local politicians also have a strong influence over the recruitment of primary school teachers since the appointment of teachers is a major source of political patronage. Female teachers. It is particularly difficult to deploy female teachers. As in all states, Sokoto State has a policy of not separating spouses, which means that female teachers ‘follow their husbands’, most of whom are resident in urban centers. Consequently, female teachers tend to be heavily concentrated in urban schools. Female teachers are important role models, especially in rural areas. Learning materials It is the policy that every primary school student should have exclusive access to the prescribed textbooks for the four core subjects. While funding for instructional materials has increased with the introduction of the UBEC Intervention Fund, there have been no dramatic improvements in the textbook situation in primary schools. Textbook availability has been considerably worse in public secondary schools, where virtually no state funding was made available for textbook provision. Teachers in both primary and secondary schools rely heavily on the few textbooks purchased by schools. Given the acute shortages of textbooks, they spend a lot of their time in class transcribing whole pages of the textbooks onto the blackboard. Many secondary school teachers use very old books and very often the same books are used repeatedly for many years. Financing Education The State Government was the main source of financing for education in the public sector in Sokoto State in both school years, accounting for more than half in 2015/16 (58 percent) and in 2016/17 (64 percent) of total public expenditure on education. The Local Governments contributed 20 percent in 2015/16 and 19 percent in 2016/17, while the contribution of the Federal Government was 22 percent in 2015/16 and reducing to 17 percent in 2016/17 of total expenditures for education. (SEA data) 57 Bennell Paul, Kabir Isa Dandago, Murtala Sabo Sagagi (2007) Kano State, Federal Republic Of Nigeria: Education Public Expenditure Review
Sokoto State Education Accounts – Public Sector Subaccount: 2015/16 & 2016/17 78
Of the total public sector financing available, Sokoto State government managed the majority of the funds (59 percent in 2015/16 and 64 percent in 2016/17). The Federal government was second in 2015/16, directly managing 21 percent of the total public sector funds but third with 16 percent in 2016/17. The Local governments were third in 2015/16, managing 20 percent but second managing 20 percent in 2016/17. (SEA data) Institutional framework. For a variety of reasons, institutional relationships in the education sector in Nigeria are becoming increasingly complicated. The growing complexity of the organizational structure and institutional relations in the education sector could have far reaching implications for the governance and funding of the education sector, which, in turn, could affect the attainment of key education goals. In particular, increasing centralization of decision making and funding in the education sector coupled with the creation of new agencies is creating tension and confusion. Constitutionally, primary education is the responsibility of local governments, but both federal and state governments are seeking greater overall control and funding of basic education in order to ensure the attainment of UBE goals and objectives. Under the provisions of the 2004 UBE Act, operational responsibility for all aspects of basic education provision has been given to the State Universal Basic Education Boards. Responsibility for secondary education remains mainly with SMOEs with Teaching Service Boards (also known as Post Primary School Management or Secondary Education Boards in some states) being given overall control of key human management functions (mainly selection, recruitment, promotion, and discipline). The UBEC Intervention Fund is a mechanism for states to access additional resources for basic education, but with this comes greater federal control over resources and the education sector itself at the state and local government levels. State Governor’s Office. In all states, there is a high degree of centralization of power, and thus control of resources, in the Office of the State Governor (OSG). With regard to education, all teacher recruitment and capital expenditures in schools have to be approved by the OSG. The loss of control by local government councils (LGC) over the primary school payroll represented a major loss of power of local governments vis-a-vis the state government. The Joint Account Committee is effectively controlled by the state governor and decisions made by this Committee determine resource flows to the LGCs. Once all deductions for primary school salaries, pensions, Emir Courts, LG staff salaries, ‘joint projects’ have been made, LGCs receive only a small fraction of their federal account allocations. LG Chairmen sit on the JAC, but they are political appointments by the Governor.58 LGCs are also not allowed to recruit staff above Grade level 6 without the permission of the state government. Since all newly qualified teachers are appointed on GL 7 (NCE) or GL (graduates), this means that LGCs no longer control the key resource that is required for the improvement and expansion of primary education. LGCs, on the other hand, can recruit below GL7 and this may explain why there are relatively very large numbers of ‘support staff’ in primary schools in some LGAs. Recruitment of local government is a major source of political patronage. Although local governments have overall responsibility for primary education, most do not feel any strong sense of responsibility for ensuring that primary schools receive adequate funding for essential operational inputs. With the removal of direct control over salary payments to 58 Bennell et al (2007)
Sokoto State Education Accounts – Public Sector Subaccount: 2015/16 & 2016/17 79
primary school staff, LGCs may have felt a loss of control and thus responsibility for primary education, but at the same time, state governments did not take on responsibility for primary education. So, primary education has been caught in an organizational no man’s land. From evidence available (including discussions with SWG members), it is clear that most local governments spend very little on supplying schools with essential materials. Infrequent supplies of chalk, registers and exercise books are the limit of most LGC support. SMOE-SUBEB relations59. As a ministerial agency, each SMOE is directly responsible for their SUBEB. However, the underlying rationale for the establishment of the SUBEB is to create a new kind of semiautonomous agency, which is more efficient and effective than the traditional ministry model, which has become discredited and tarnished after two decades of military rule. SUBEBs are closely linked to UBEC, especially through the implementation of the UBE Intervention Fund. Each SUBEB is financially reliant on the SMOE for staff salaries and operating resources. In states where SUBEB funding has been seriously squeezed, relations with the SMOE have often become strained. Relations also tend to be difficult where SMOEs have taken over responsibility from SUBEB of key activities such as the payment of primary school salaries and school inspection. The creation of a ‘unified’ nine-grade basic school system also poses a major challenge, which has far reaching implications for all aspects of the schooling system. Unifying primary and junior secondary schools necessitates the ‘disarticulation’ of junior from senior secondary education. The state government is planning the separation of JSS sections from secondary schools along with the establishment of additional junior secondary/upper basic schools. SUBEB should have taken full responsibility for all three JSS grades by the end of 2007. As elsewhere in SSA, the rationale and consequences of creating a unified basic education cycle does not appear to be thought through clearly. SMOEs are increasingly losing control over large areas of education provision. With disarticulation, SUBEBs are taking de facto control of both primary and junior secondary schools leaving SMOEs with only senior secondary education and overall policy and regulatory functions. Policy formulation capacity is generally weak and there is no human resource planning whatsoever. The funding for JSS/upper basic schools presumably still come from the SMOEs even though SUBEBs have direct responsibility for these large and growing numbers of schools. In the long run, the separation of funding and management may not be tenable and will have to be resolved. SUBEBs may well become Ministries of Basic Education with Ministries of Higher Education responsible for the rump of senior secondary schools and state-level education higher education institutions. Most of the recurrent budgets of the SUBEBs are spent on their own staff and support operations. In some states, these budgets have been cut quite appreciably during the last five years and SUBEB managers are increasingly concerned about the adverse impact this is having on the capacity of the organization to perform its core functions. SUBEB-LGA relations. Each local government funds almost all the recurrent costs of primary education and Local Government Education Authorities (LGEAs) are supposed to be responsible for the overall management of primary schools in each LGA. However, SUBEB 59 Bennell et al 2007
Sokoto State Education Accounts – Public Sector Subaccount: 2015/16 & 2016/17 80
also has key planning, supervisory and service delivery functions (inspection/monitoring, salary administration, construction, provision of instructional materials and staff development). This mix of regulatory and management functions needs to be separated into separate organizations. SUBEBs often lack control/agency over LGC and LGEAs, especially in key areas such as teacher recruitment, where powerful LGC Chairman can have a major influence in deciding who is appointed. The indigene recruitment policies/practices which give preference to candidates first from the LGA itself and then to state natives also provides scope for political interference. SMOE-Higher Education relations. Most education higher education institutions have always had a high degree of organizational autonomy and SMOEs have, therefore, little agency and control over what they do and thus higher education policy as whole. Funding for higher education by SMOEs is falling in most states with annual subventions, at best, barely covering salary costs. HEIs have had to generate their own funding to meet operational costs and have become more market driven, which makes them even more autonomous. Budget Implementation Budget discipline remains poor in the state, which is manifested in the limited correspondence between approved budgets and actual expenditures. Very large negative deviations on capital expenditures are the norm with actual spending consistently falling far short of approved estimates. Deviations on the recurrent budget are generally much less because the bulk of recurrent expenditures comprise emoluments for staff currently in post, which have to be met. Policy Focus The policy focus is to improve access to and the quality of schooling through increased school construction, better availability of core learning materials, and improved in-service teacher training. Policy interventions such as school feeding, conditional cash transfers, free school uniforms, and the promotion of non-formal schooling, which more directly attempt to increase the demand for education have not been widely implemented. Nor is the effective enforcement of compulsory education high on the policy agenda of the SMOE.
Sokoto State Education Accounts – Public Sector Subaccount: 2015/16 & 2016/17 81
Annex 2: Education Financing in Nigeria Federal Government Education Spending Education is a concurrent responsibility of both the federal and state governments under the constitution. There are four main sources of public funding for the public (non-federal) education sector: direct allocations from the federal government (through the Universal Basic Education Intervention Fund and the Tertiary Education Trust Fund), state governments, local governments, and private individuals and organizations, including nongovernmental organizations and international donors in some states. There is a huge lack of information on state and local expenditures for education, which makes accurate estimates of total spending difficult. The federal government (FG) makes nationwide policies and runs secondary (both junior and senior) and post-secondary institutions, including universities, polytechnics, and colleges.60 The FG funds these through annual budgetary allocations and several targeted interventions funds, including the Tertiary Education Trust Fund (TETFund), debt relief grant (DRG/MDGs), and constituency projects of federal legislators. These funds also benefit state government schools. In addition, the FG funds the construction of several Almajiri (Tsangaya) schools and participates in nomadic education and adult education campaigns. The FG’s main intervention instrument in basic education is through a special Universal Basic Education (UBE) Fund, which makes matching grants to state governments. FG education spending has both budgetary and extra budgetary elements. Budgetary allocations account for an average of 82 per annum of FG education spending, and are mainly to the Federal Ministry of Education (FMOE) and its agencies61. Extra-budgetary funds represent the remaining 18 and often accrue for education through certain dedicated funds outside FMOE’s control (such as the Debt Relief Fund (DRF)/MDG and legislators’ constituency projects).62 The two most prominent extra budgetary funds in education are the UBE Fund and the Tertiary Education Trust Fund (TETFund), with UBE being the larger. The FMOE controlled 95 of budgetary allocations, which translates to 78 of total education spending at the federal level. Targeted non-FMOE spending was 5 of budgetary expenditures (4 total education spending). UBEC receipts averaged $350 USD million between 2010 and 2014, but annual figures oscillated with FG earnings.63 TETfund is a dedicated fund for public (federal and state) tertiary institutions, financed by 2 prior tax on the profits of non-oil companies with over 100 personnel. Its share in total federal education funding is relatively small, averaging 0.3 in the period. The UBE Fund is the principal FG intervention instrument in basic education. Releases to the Fund amounted to more than $1.7 USD (2010 constant) billion total between 2010 and 2014 (Figure 1) UBEC expends a large proportion of its resources as matching grants to state governments (SGs) to support basic education. Actual disbursement to individual SGs depends on whether they have met (non-performance-related) conditions. States are not always able to 60 See the 1999 Constitution of the Federal Republic of Nigeria, as amended to date, Schedule 2, paras. 27- 28. 61 Source: All 2014, UBEC, TETFund, DRG/MDG information from FMOE Annual Report 2014; other data from Audited FGN Financial Statements (2010 - 2013), courtesy (OAGF); analysis by C. Nwoko (2015) 62 Constituency projects are expenditure appropriated to projects of interest to legislators in their respective constituencies 63 Note: UBEC allocations comprise 2 % of FG share of federation revenues accruing directly to the Fund. The allocations rose steadily in nominal terms up to 2013, only dipping in 2014 due to the poor performance of oil revenues in the second half of the year. The dwindling allocations are due to the twin effects of deflating the allocations to 2010 real (constant) values and applying the official CBN $/N exchange rate, which disfavored the Naira over the years.
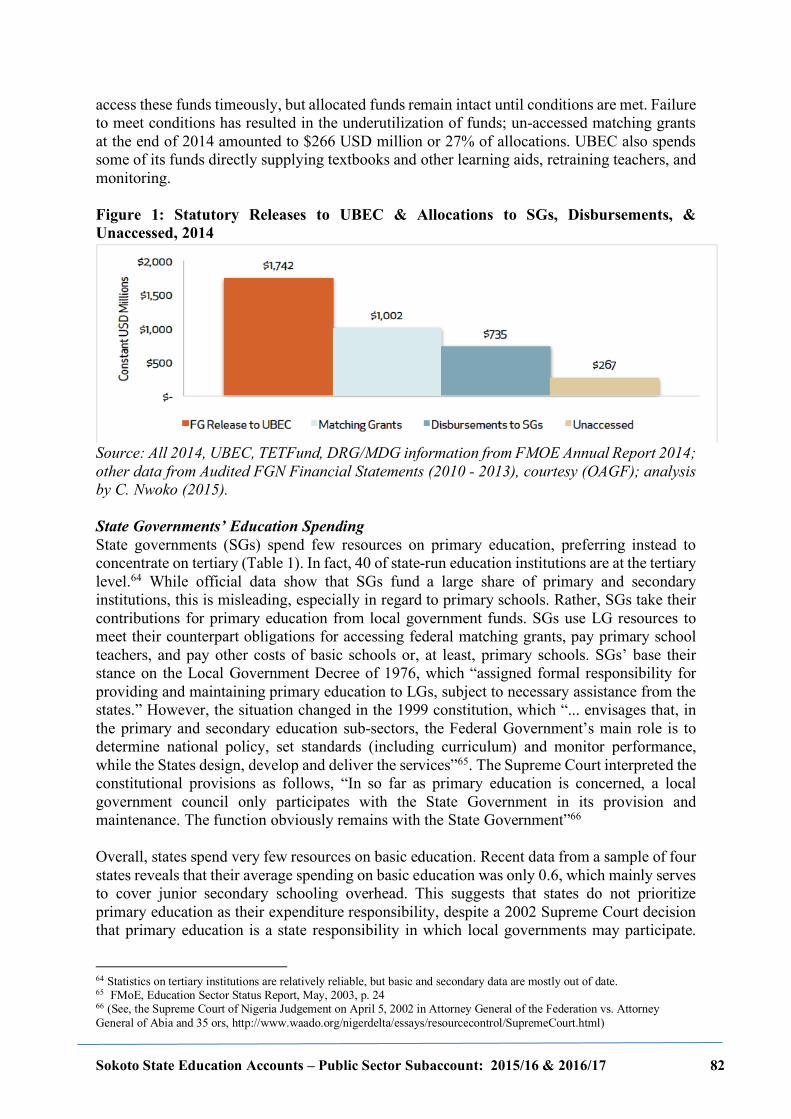
Sokoto State Education Accounts – Public Sector Subaccount: 2015/16 & 2016/17 82
access these funds timeously, but allocated funds remain intact until conditions are met. Failure to meet conditions has resulted in the underutilization of funds; un-accessed matching grants at the end of 2014 amounted to $266 USD million or 27% of allocations. UBEC also spends some of its funds directly supplying textbooks and other learning aids, retraining teachers, and monitoring. Figure 1: Statutory Releases to UBEC & Allocations to SGs, Disbursements, & Unaccessed, 2014
Source: All 2014, UBEC, TETFund, DRG/MDG information from FMOE Annual Report 2014; other data from Audited FGN Financial Statements (2010 - 2013), courtesy (OAGF); analysis by C. Nwoko (2015). State Governments’ Education Spending State governments (SGs) spend few resources on primary education, preferring instead to concentrate on tertiary (Table 1). In fact, 40 of state-run education institutions are at the tertiary level.64 While official data show that SGs fund a large share of primary and secondary institutions, this is misleading, especially in regard to primary schools. Rather, SGs take their contributions for primary education from local government funds. SGs use LG resources to meet their counterpart obligations for accessing federal matching grants, pay primary school teachers, and pay other costs of basic schools or, at least, primary schools. SGs’ base their stance on the Local Government Decree of 1976, which “assigned formal responsibility for providing and maintaining primary education to LGs, subject to necessary assistance from the states.” However, the situation changed in the 1999 constitution, which “... envisages that, in the primary and secondary education sub-sectors, the Federal Government’s main role is to determine national policy, set standards (including curriculum) and monitor performance, while the States design, develop and deliver the services”65. The Supreme Court interpreted the constitutional provisions as follows, “In so far as primary education is concerned, a local government council only participates with the State Government in its provision and maintenance. The function obviously remains with the State Government”66 Overall, states spend very few resources on basic education. Recent data from a sample of four states reveals that their average spending on basic education was only 0.6, which mainly serves to cover junior secondary schooling overhead. This suggests that states do not prioritize primary education as their expenditure responsibility, despite a 2002 Supreme Court decision that primary education is a state responsibility in which local governments may participate.
64 Statistics on tertiary institutions are relatively reliable, but basic and secondary data are mostly out of date. 65 FMoE, Education Sector Status Report, May, 2003, p. 24 66 (See, the Supreme Court of Nigeria Judgement on April 5, 2002 in Attorney General of the Federation vs. Attorney General of Abia and 35 ors, http://www.waado.org/nigerdelta/essays/resourcecontrol/SupremeCourt.html)
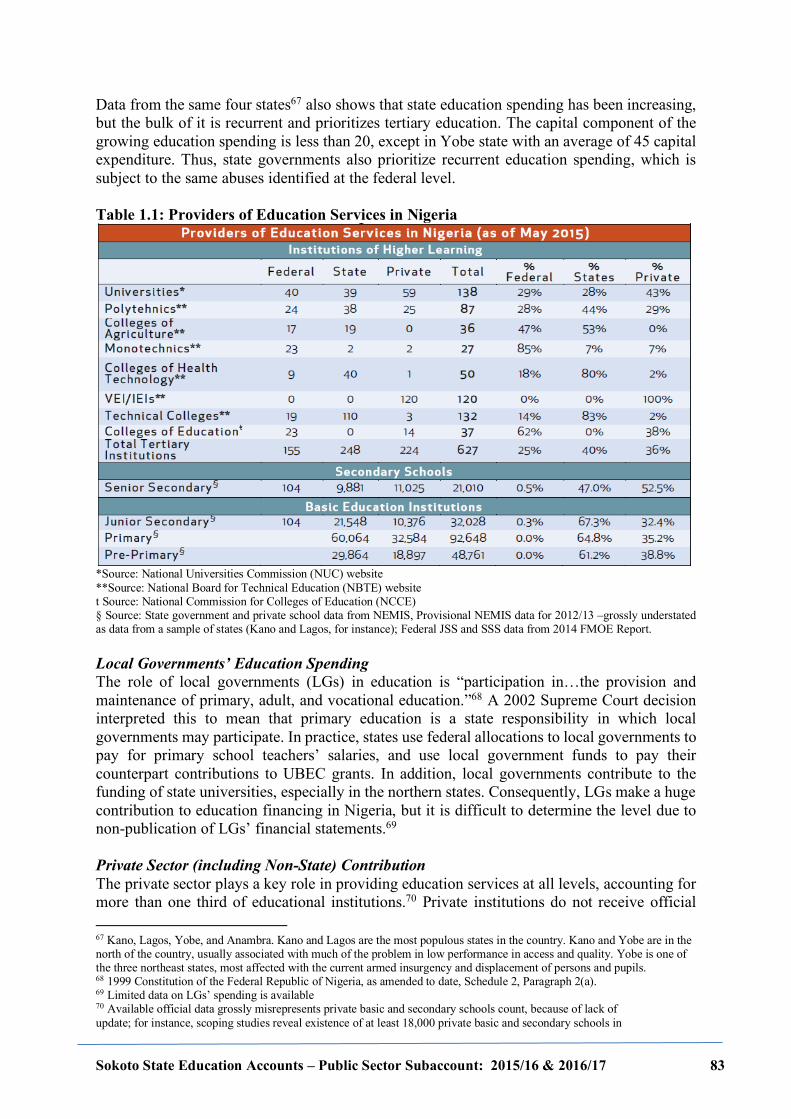
Sokoto State Education Accounts – Public Sector Subaccount: 2015/16 & 2016/17 83
Data from the same four states67 also shows that state education spending has been increasing, but the bulk of it is recurrent and prioritizes tertiary education. The capital component of the growing education spending is less than 20, except in Yobe state with an average of 45 capital expenditure. Thus, state governments also prioritize recurrent education spending, which is subject to the same abuses identified at the federal level. Table 1.1: Providers of Education Services in Nigeria
*Source: National Universities Commission (NUC) website **Source: National Board for Technical Education (NBTE) website t Source: National Commission for Colleges of Education (NCCE) § Source: State government and private school data from NEMIS, Provisional NEMIS data for 2012/13 –grossly understated as data from a sample of states (Kano and Lagos, for instance); Federal JSS and SSS data from 2014 FMOE Report. Local Governments’ Education Spending The role of local governments (LGs) in education is “participation in…the provision and maintenance of primary, adult, and vocational education.”68 A 2002 Supreme Court decision interpreted this to mean that primary education is a state responsibility in which local governments may participate. In practice, states use federal allocations to local governments to pay for primary school teachers’ salaries, and use local government funds to pay their counterpart contributions to UBEC grants. In addition, local governments contribute to the funding of state universities, especially in the northern states. Consequently, LGs make a huge contribution to education financing in Nigeria, but it is difficult to determine the level due to non-publication of LGs’ financial statements.69 Private Sector (including Non-State) Contribution The private sector plays a key role in providing education services at all levels, accounting for more than one third of educational institutions.70 Private institutions do not receive official 67 Kano, Lagos, Yobe, and Anambra. Kano and Lagos are the most populous states in the country. Kano and Yobe are in the north of the country, usually associated with much of the problem in low performance in access and quality. Yobe is one of the three northeast states, most affected with the current armed insurgency and displacement of persons and pupils. 68 1999 Constitution of the Federal Republic of Nigeria, as amended to date, Schedule 2, Paragraph 2(a). 69 Limited data on LGs’ spending is available 70 Available official data grossly misrepresents private basic and secondary schools count, because of lack of update; for instance, scoping studies reveal existence of at least 18,000 private basic and secondary schools in
Sokoto State Education Accounts – Public Sector Subaccount: 2015/16 & 2016/17 84
funding support; their main source of finance is the fees they charge. Therefore, households’ contributions to education financing are significant. Many of these schools have smaller classes (approximately ten to fifteen students per class), modern equipment and a better environment. Teachers in these institutions all possess at least a Bachelors in a specific course area an attend workshops or short term programs on a regular basis.71 Recognizing that the information base is very weak for debates on such fundamental issues as the adequacy of funding for education, sources of funding, efficiency and equity of the use of public funds, costs of system expansion and the appropriate mix of public and private (household) expenditures, a new tool was needed that would enable a detailed flow-of-funds analysis for the education sector based on the National Education Accounts (NEA) methodology, a sub-account or State Education Account (SEA) will study the flow of funds from sources-to-users within the education sector at the state level. The Ministry of Education of Sokoto State decided to become the fourth Nigerian State to test this new tool. Effect of the Nigerian Economy on Education Financing As reported by NBS (2016)72, the turmoil in global commodity markets, witnessed in the second half of 2014 brought their full weight to bear on the Nigerian economy in 2015. Oil prices fell 66.8 from $114/barrel recorded in June 2014, to $38.0 by December 2015. Prices fell even further in 2016, to $32.6 as at 3rd February, 2016. Beyond commodity markets, recent developments in the global economy created a trifecta of headwinds that the nation has to contend with. Years prior to 2015, the Nigerian economy was largely supported by the non-oil sector as supply disruptions hampered oil output. In 2015 however, various factors: political uncertainty prior to and six months after the elections, and intermittent supply shocks of refined petroleum products, and others weighted on both oil and non-oil output. The entire economy took a hit. The crude oil price shocks, the resulting declining government expenditure and its multiplier effects are likely to impact education funding as well.
Lagos state alone. A sizeable number of private schools also exist in the FCT. Enrollment figures would have provided a more accurate picture of the contribution of private school providers, but data is not available. 71 From http://nigeria.usembassy.gov/nigeria_education_profile.html, sourced on Sunday, May 31, 2015, 6.38 PM, Abuja time 72 National Bureau of Statistics (2016) The Nigerian Economy: Past, Present and Future
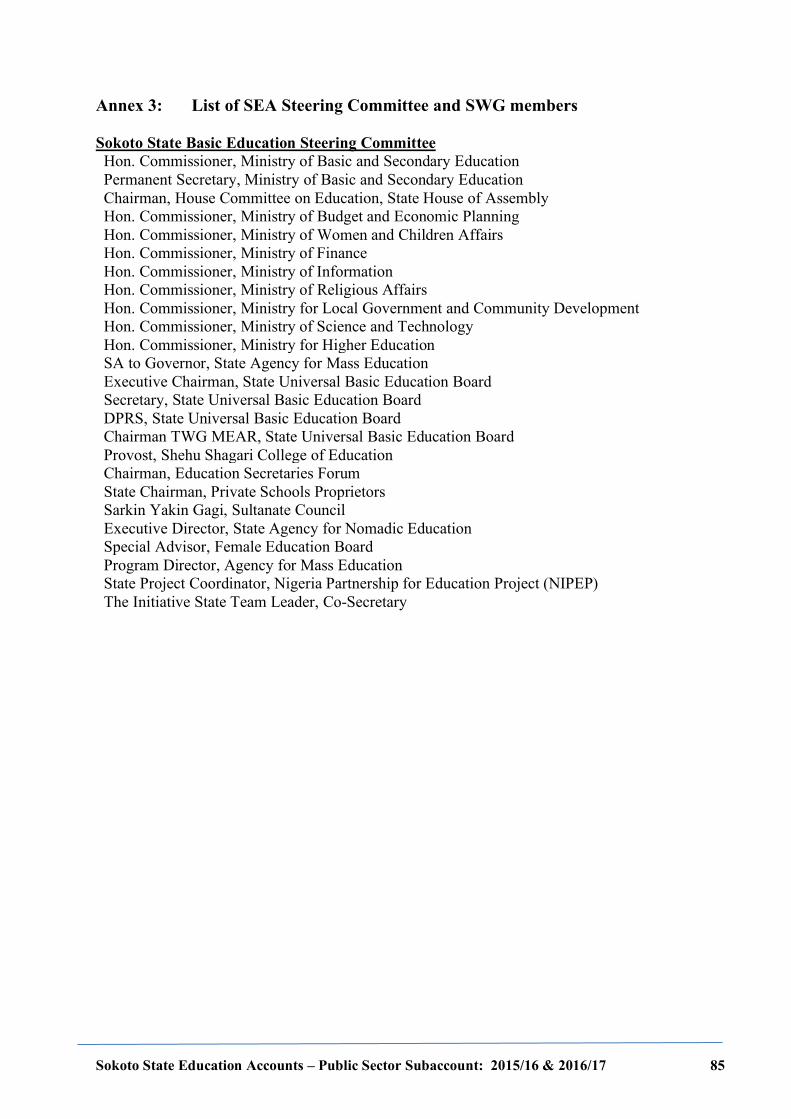
Sokoto State Education Accounts – Public Sector Subaccount: 2015/16 & 2016/17 85
Annex 3: List of SEA Steering Committee and SWG members Sokoto State Basic Education Steering Committee Hon. Commissioner, Ministry of Basic and Secondary Education Permanent Secretary, Ministry of Basic and Secondary Education Chairman, House Committee on Education, State House of Assembly Hon. Commissioner, Ministry of Budget and Economic Planning Hon. Commissioner, Ministry of Women and Children Affairs Hon. Commissioner, Ministry of Finance Hon. Commissioner, Ministry of Information Hon. Commissioner, Ministry of Religious Affairs Hon. Commissioner, Ministry for Local Government and Community Development Hon. Commissioner, Ministry of Science and Technology Hon. Commissioner, Ministry for Higher Education SA to Governor, State Agency for Mass Education Executive Chairman, State Universal Basic Education Board Secretary, State Universal Basic Education Board DPRS, State Universal Basic Education Board Chairman TWG MEAR, State Universal Basic Education Board Provost, Shehu Shagari College of Education Chairman, Education Secretaries Forum State Chairman, Private Schools Proprietors Sarkin Yakin Gagi, Sultanate Council Executive Director, State Agency for Nomadic Education Special Advisor, Female Education Board Program Director, Agency for Mass Education State Project Coordinator, Nigeria Partnership for Education Project (NIPEP) The Initiative State Team Leader, Co-Secretary
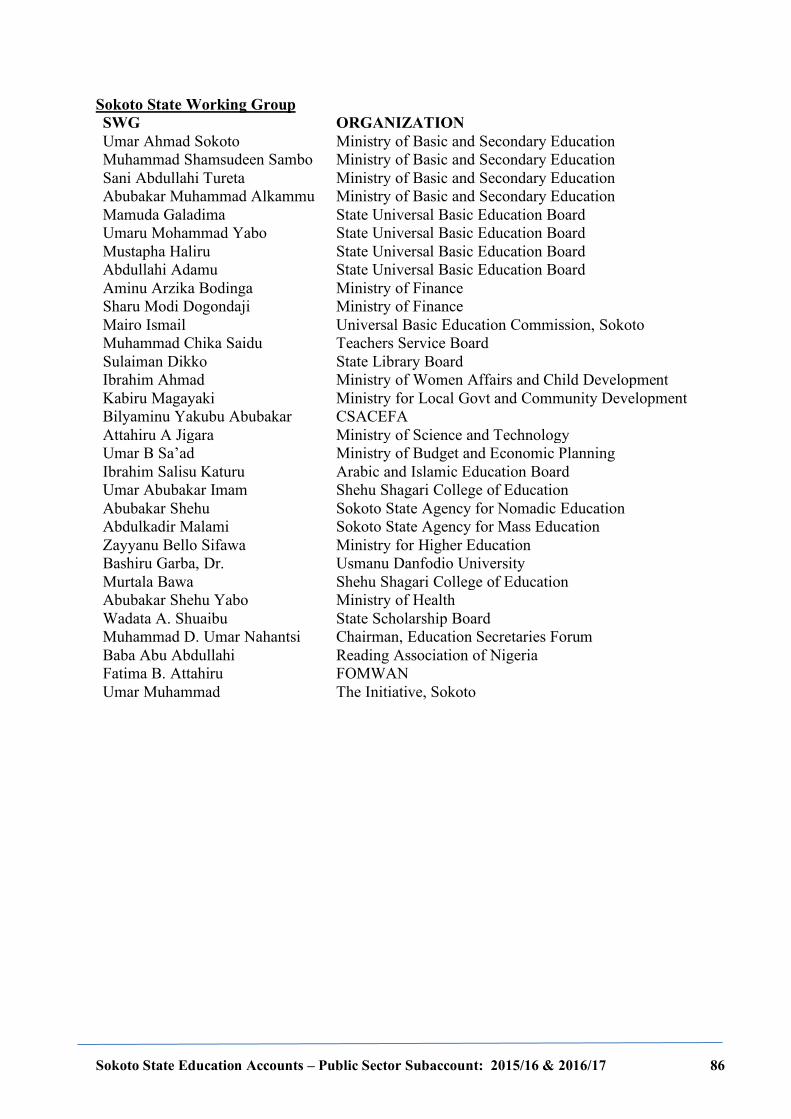
Sokoto State Education Accounts – Public Sector Subaccount: 2015/16 & 2016/17 86
Sokoto State Working Group SWG ORGANIZATION Umar Ahmad Sokoto Ministry of Basic and Secondary Education Muhammad Shamsudeen Sambo Ministry of Basic and Secondary Education Sani Abdullahi Tureta Ministry of Basic and Secondary Education Abubakar Muhammad Alkammu Ministry of Basic and Secondary Education Mamuda Galadima State Universal Basic Education Board Umaru Mohammad Yabo State Universal Basic Education Board Mustapha Haliru State Universal Basic Education Board Abdullahi Adamu State Universal Basic Education Board Aminu Arzika Bodinga Ministry of Finance Sharu Modi Dogondaji Ministry of Finance Mairo Ismail Universal Basic Education Commission, Sokoto Muhammad Chika Saidu Teachers Service Board Sulaiman Dikko State Library Board Ibrahim Ahmad Ministry of Women Affairs and Child Development Kabiru Magayaki Ministry for Local Govt and Community Development Bilyaminu Yakubu Abubakar CSACEFA Attahiru A Jigara Ministry of Science and Technology Umar B Sa’ad Ministry of Budget and Economic Planning Ibrahim Salisu Katuru Arabic and Islamic Education Board Umar Abubakar Imam Shehu Shagari College of Education Abubakar Shehu Sokoto State Agency for Nomadic Education Abdulkadir Malami Sokoto State Agency for Mass Education Zayyanu Bello Sifawa Ministry for Higher Education Bashiru Garba, Dr. Usmanu Danfodio University Murtala Bawa Shehu Shagari College of Education Abubakar Shehu Yabo Ministry of Health Wadata A. Shuaibu State Scholarship Board Muhammad D. Umar Nahantsi Chairman, Education Secretaries Forum Baba Abu Abdullahi Reading Association of Nigeria Fatima B. Attahiru FOMWAN Umar Muhammad The Initiative, Sokoto
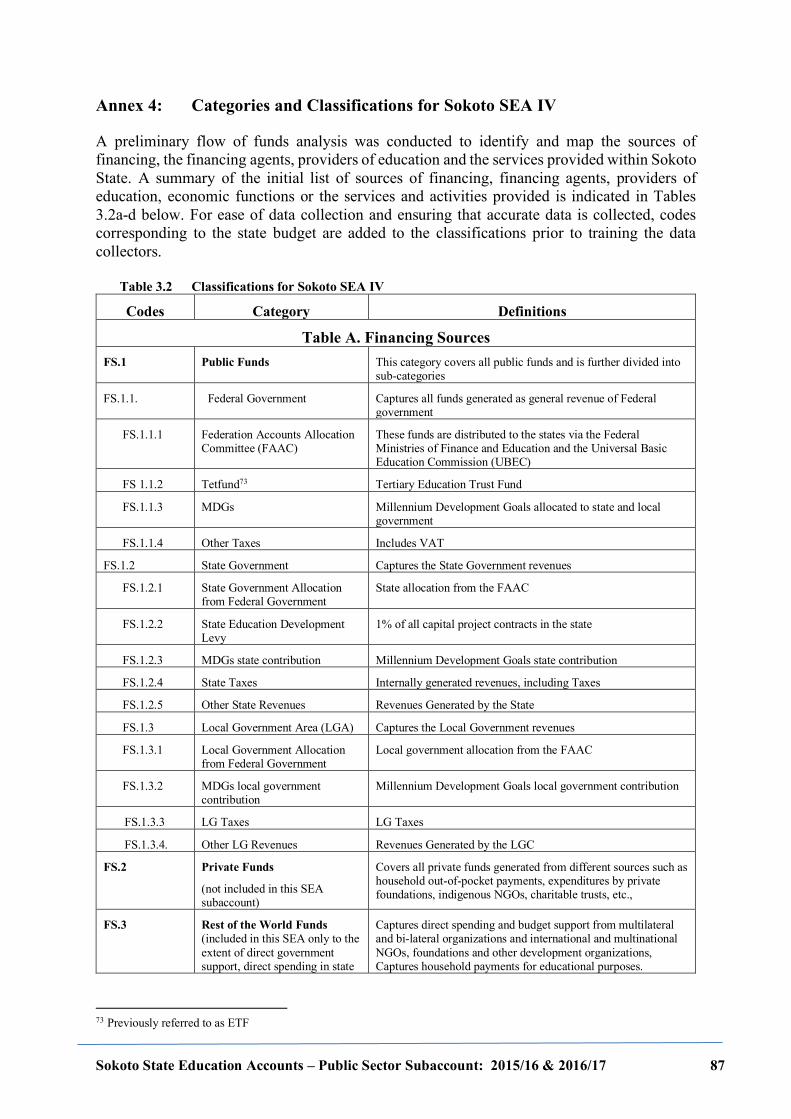
Sokoto State Education Accounts – Public Sector Subaccount: 2015/16 & 2016/17 87
Annex 4: Categories and Classifications for Sokoto SEA IV A preliminary flow of funds analysis was conducted to identify and map the sources of financing, the financing agents, providers of education and the services provided within Sokoto State. A summary of the initial list of sources of financing, financing agents, providers of education, economic functions or the services and activities provided is indicated in Tables 3.2a-d below. For ease of data collection and ensuring that accurate data is collected, codes corresponding to the state budget are added to the classifications prior to training the data collectors.
Table 3.2 Classifications for Sokoto SEA IV
Codes Category Definitions
Table A. Financing Sources FS.1 Public Funds This category covers all public funds and is further divided into
sub-categories
FS.1.1. Federal Government Captures all funds generated as general revenue of Federal government
FS.1.1.1 Federation Accounts Allocation Committee (FAAC)
These funds are distributed to the states via the Federal Ministries of Finance and Education and the Universal Basic Education Commission (UBEC)
FS 1.1.2 Tetfund73 Tertiary Education Trust Fund
FS.1.1.3 MDGs Millennium Development Goals allocated to state and local government
FS.1.1.4 Other Taxes Includes VAT
FS.1.2 State Government Captures the State Government revenues
FS.1.2.1 State Government Allocation from Federal Government
State allocation from the FAAC
FS.1.2.2 State Education Development Levy
1% of all capital project contracts in the state
FS.1.2.3 MDGs state contribution Millennium Development Goals state contribution
FS.1.2.4 State Taxes Internally generated revenues, including Taxes
FS.1.2.5 Other State Revenues Revenues Generated by the State
FS.1.3 Local Government Area (LGA) Captures the Local Government revenues
FS.1.3.1 Local Government Allocation from Federal Government
Local government allocation from the FAAC
FS.1.3.2 MDGs local government contribution
Millennium Development Goals local government contribution
FS.1.3.3 LG Taxes LG Taxes
FS.1.3.4. Other LG Revenues Revenues Generated by the LGC
FS.2 Private Funds
(not included in this SEA subaccount)
Covers all private funds generated from different sources such as household out-of-pocket payments, expenditures by private foundations, indigenous NGOs, charitable trusts, etc.,
FS.3 Rest of the World Funds (included in this SEA only to the extent of direct government support, direct spending in state
Captures direct spending and budget support from multilateral and bi-lateral organizations and international and multinational NGOs, foundations and other development organizations, Captures household payments for educational purposes.
73 Previously referred to as ETF
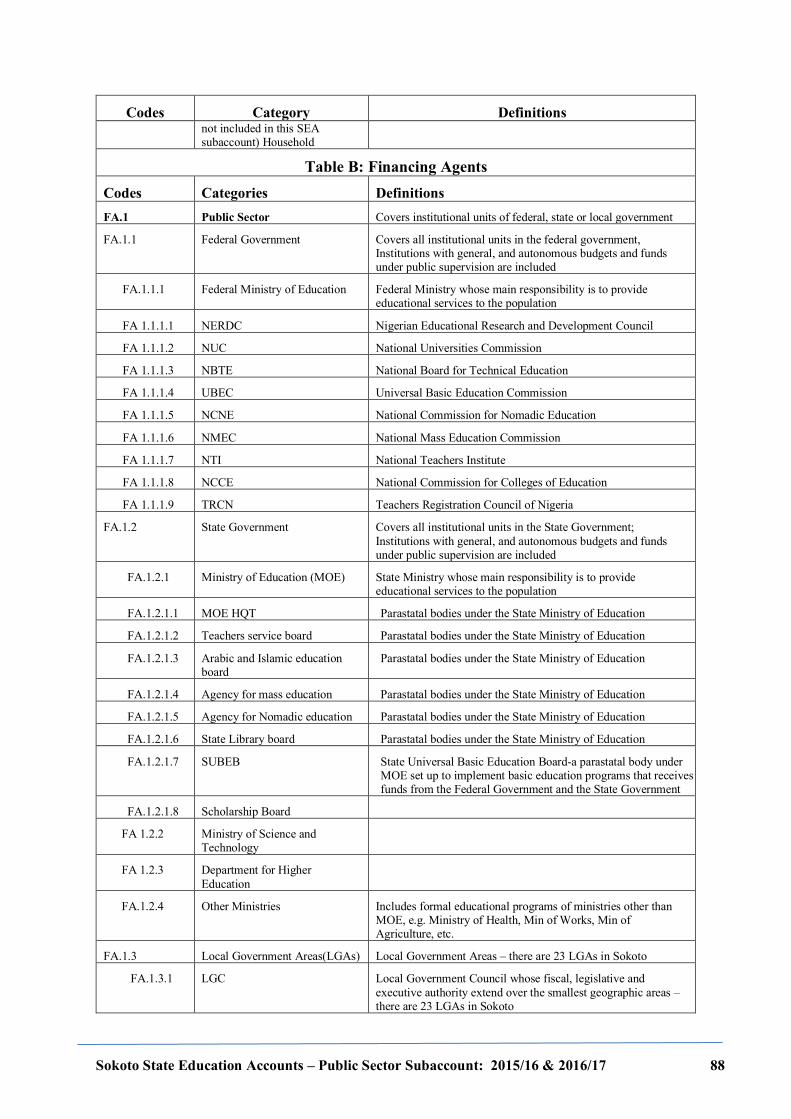
Sokoto State Education Accounts – Public Sector Subaccount: 2015/16 & 2016/17 88
Codes Category Definitions not included in this SEA subaccount) Household
Table B: Financing Agents Codes Categories Definitions FA.1 Public Sector Covers institutional units of federal, state or local government
FA.1.1 Federal Government Covers all institutional units in the federal government, Institutions with general, and autonomous budgets and funds under public supervision are included
FA.1.1.1 Federal Ministry of Education Federal Ministry whose main responsibility is to provide educational services to the population
FA 1.1.1.1 NERDC Nigerian Educational Research and Development Council
FA 1.1.1.2 NUC National Universities Commission
FA 1.1.1.3 NBTE National Board for Technical Education
FA 1.1.1.4 UBEC Universal Basic Education Commission
FA 1.1.1.5 NCNE National Commission for Nomadic Education
FA 1.1.1.6 NMEC National Mass Education Commission
FA 1.1.1.7 NTI National Teachers Institute
FA 1.1.1.8 NCCE National Commission for Colleges of Education
FA 1.1.1.9 TRCN Teachers Registration Council of Nigeria
FA.1.2 State Government Covers all institutional units in the State Government; Institutions with general, and autonomous budgets and funds under public supervision are included
FA.1.2.1 Ministry of Education (MOE) State Ministry whose main responsibility is to provide educational services to the population
FA.1.2.1.1 MOE HQT Parastatal bodies under the State Ministry of Education
FA.1.2.1.2 Teachers service board Parastatal bodies under the State Ministry of Education
FA.1.2.1.3 Arabic and Islamic education board
Parastatal bodies under the State Ministry of Education
FA.1.2.1.4 Agency for mass education Parastatal bodies under the State Ministry of Education
FA.1.2.1.5 Agency for Nomadic education Parastatal bodies under the State Ministry of Education
FA.1.2.1.6 State Library board Parastatal bodies under the State Ministry of Education
FA.1.2.1.7 SUBEB State Universal Basic Education Board-a parastatal body under MOE set up to implement basic education programs that receives funds from the Federal Government and the State Government
FA.1.2.1.8 Scholarship Board
FA 1.2.2 Ministry of Science and Technology
FA 1.2.3 Department for Higher Education
FA.1.2.4 Other Ministries Includes formal educational programs of ministries other than MOE, e.g. Ministry of Health, Min of Works, Min of Agriculture, etc.
FA.1.3 Local Government Areas(LGAs) Local Government Areas – there are 23 LGAs in Sokoto
FA.1.3.1 LGC Local Government Council whose fiscal, legislative and executive authority extend over the smallest geographic areas – there are 23 LGAs in Sokoto
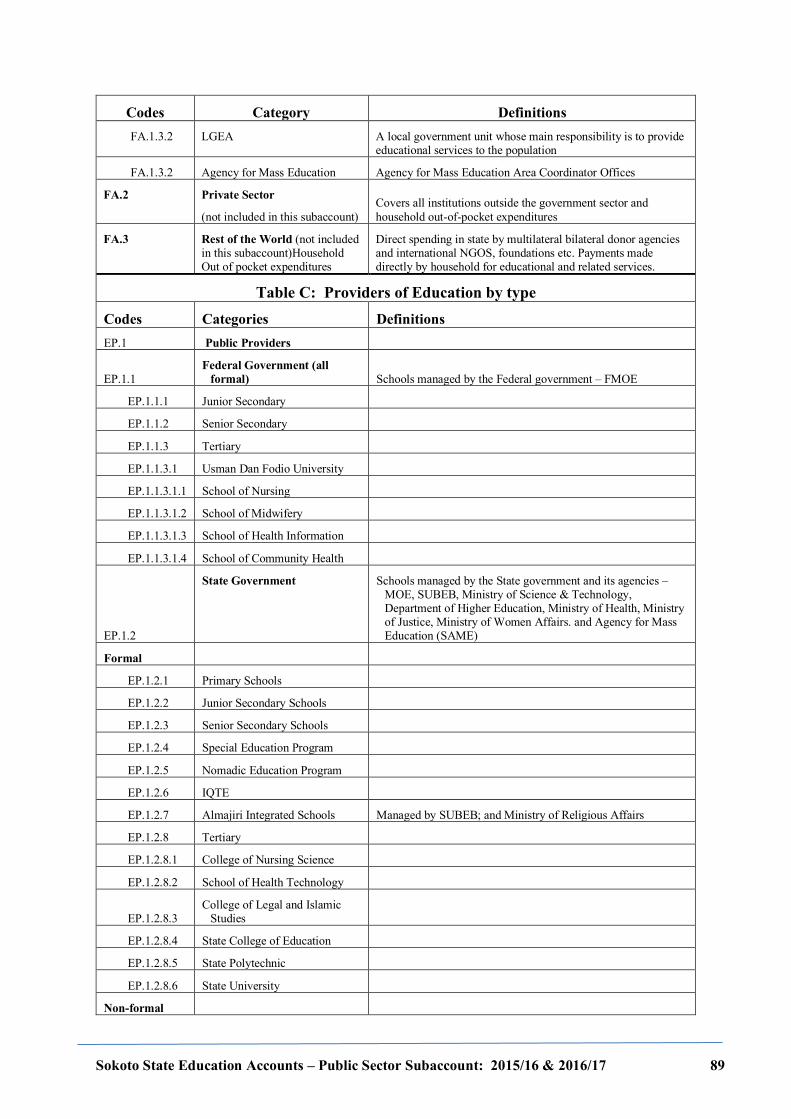
Sokoto State Education Accounts – Public Sector Subaccount: 2015/16 & 2016/17 89
Codes Category Definitions FA.1.3.2 LGEA A local government unit whose main responsibility is to provide
educational services to the population
FA.1.3.2 Agency for Mass Education Agency for Mass Education Area Coordinator Offices
FA.2 Private Sector
(not included in this subaccount) Covers all institutions outside the government sector and household out-of-pocket expenditures
FA.3 Rest of the World (not included in this subaccount)Household Out of pocket expenditures
Direct spending in state by multilateral bilateral donor agencies and international NGOS, foundations etc. Payments made directly by household for educational and related services.
Table C: Providers of Education by type Codes Categories Definitions EP.1 Public Providers
EP.1.1 Federal Government (all
formal) Schools managed by the Federal government – FMOE
EP.1.1.1 Junior Secondary
EP.1.1.2 Senior Secondary
EP.1.1.3 Tertiary
EP.1.1.3.1 Usman Dan Fodio University
EP.1.1.3.1.1 School of Nursing
EP.1.1.3.1.2 School of Midwifery
EP.1.1.3.1.3 School of Health Information
EP.1.1.3.1.4 School of Community Health
EP.1.2
State Government Schools managed by the State government and its agencies – MOE, SUBEB, Ministry of Science & Technology, Department of Higher Education, Ministry of Health, Ministry of Justice, Ministry of Women Affairs. and Agency for Mass Education (SAME)
Formal
EP.1.2.1 Primary Schools
EP.1.2.2 Junior Secondary Schools
EP.1.2.3 Senior Secondary Schools
EP.1.2.4 Special Education Program
EP.1.2.5 Nomadic Education Program
EP.1.2.6 IQTE
EP.1.2.7 Almajiri Integrated Schools Managed by SUBEB; and Ministry of Religious Affairs
EP.1.2.8 Tertiary
EP.1.2.8.1 College of Nursing Science
EP.1.2.8.2 School of Health Technology
EP.1.2.8.3 College of Legal and Islamic
Studies
EP.1.2.8.4 State College of Education
EP.1.2.8.5 State Polytechnic
EP.1.2.8.6 State University
Non-formal
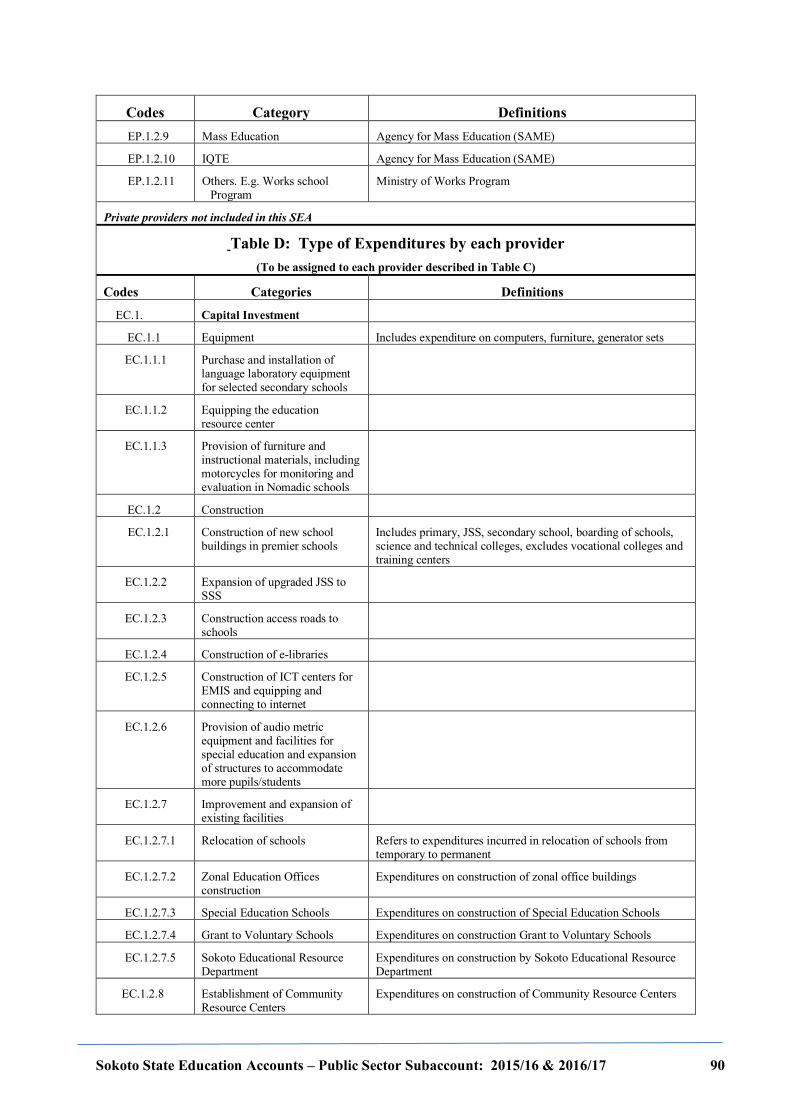
Sokoto State Education Accounts – Public Sector Subaccount: 2015/16 & 2016/17 90
Codes Category Definitions EP.1.2.9 Mass Education Agency for Mass Education (SAME)
EP.1.2.10 IQTE Agency for Mass Education (SAME)
EP.1.2.11 Others. E.g. Works school Program
Ministry of Works Program
Private providers not included in this SEA
Table D: Type of Expenditures by each provider (To be assigned to each provider described in Table C)
Codes Categories Definitions
EC.1. Capital Investment
EC.1.1 Equipment Includes expenditure on computers, furniture, generator sets
EC.1.1.1 Purchase and installation of language laboratory equipment for selected secondary schools
EC.1.1.2 Equipping the education resource center
EC.1.1.3 Provision of furniture and instructional materials, including motorcycles for monitoring and evaluation in Nomadic schools
EC.1.2 Construction
EC.1.2.1 Construction of new school buildings in premier schools
Includes primary, JSS, secondary school, boarding of schools, science and technical colleges, excludes vocational colleges and training centers
EC.1.2.2 Expansion of upgraded JSS to SSS
EC.1.2.3 Construction access roads to schools
EC.1.2.4 Construction of e-libraries
EC.1.2.5 Construction of ICT centers for EMIS and equipping and connecting to internet
EC.1.2.6 Provision of audio metric equipment and facilities for special education and expansion of structures to accommodate more pupils/students
EC.1.2.7 Improvement and expansion of existing facilities
EC.1.2.7.1 Relocation of schools Refers to expenditures incurred in relocation of schools from temporary to permanent
EC.1.2.7.2 Zonal Education Offices construction
Expenditures on construction of zonal office buildings
EC.1.2.7.3 Special Education Schools Expenditures on construction of Special Education Schools
EC.1.2.7.4 Grant to Voluntary Schools Expenditures on construction Grant to Voluntary Schools
EC.1.2.7.5 Sokoto Educational Resource Department
Expenditures on construction by Sokoto Educational Resource Department
EC.1.2.8 Establishment of Community Resource Centers
Expenditures on construction of Community Resource Centers
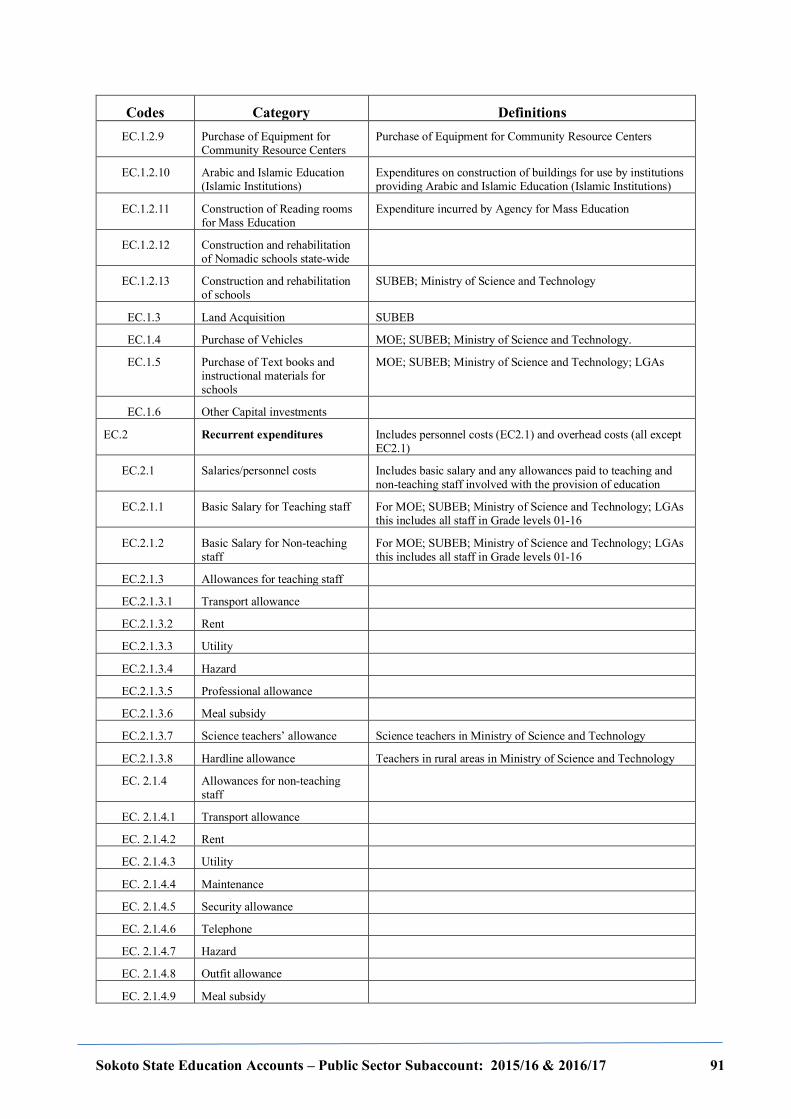
Sokoto State Education Accounts – Public Sector Subaccount: 2015/16 & 2016/17 91
Codes Category Definitions EC.1.2.9 Purchase of Equipment for
Community Resource Centers Purchase of Equipment for Community Resource Centers
EC.1.2.10 Arabic and Islamic Education (Islamic Institutions)
Expenditures on construction of buildings for use by institutions providing Arabic and Islamic Education (Islamic Institutions)
EC.1.2.11 Construction of Reading rooms for Mass Education
Expenditure incurred by Agency for Mass Education
EC.1.2.12 Construction and rehabilitation of Nomadic schools state-wide
EC.1.2.13 Construction and rehabilitation of schools
SUBEB; Ministry of Science and Technology
EC.1.3 Land Acquisition SUBEB
EC.1.4 Purchase of Vehicles MOE; SUBEB; Ministry of Science and Technology.
EC.1.5 Purchase of Text books and instructional materials for schools
MOE; SUBEB; Ministry of Science and Technology; LGAs
EC.1.6 Other Capital investments
EC.2 Recurrent expenditures Includes personnel costs (EC2.1) and overhead costs (all except EC2.1)
EC.2.1 Salaries/personnel costs Includes basic salary and any allowances paid to teaching and non-teaching staff involved with the provision of education
EC.2.1.1 Basic Salary for Teaching staff For MOE; SUBEB; Ministry of Science and Technology; LGAs this includes all staff in Grade levels 01-16
EC.2.1.2 Basic Salary for Non-teaching staff
For MOE; SUBEB; Ministry of Science and Technology; LGAs this includes all staff in Grade levels 01-16
EC.2.1.3 Allowances for teaching staff
EC.2.1.3.1 Transport allowance
EC.2.1.3.2 Rent
EC.2.1.3.3 Utility
EC.2.1.3.4 Hazard
EC.2.1.3.5 Professional allowance
EC.2.1.3.6 Meal subsidy
EC.2.1.3.7 Science teachers’ allowance Science teachers in Ministry of Science and Technology
EC.2.1.3.8 Hardline allowance Teachers in rural areas in Ministry of Science and Technology
EC. 2.1.4 Allowances for non-teaching staff
EC. 2.1.4.1 Transport allowance
EC. 2.1.4.2 Rent
EC. 2.1.4.3 Utility
EC. 2.1.4.4 Maintenance
EC. 2.1.4.5 Security allowance
EC. 2.1.4.6 Telephone
EC. 2.1.4.7 Hazard
EC. 2.1.4.8 Outfit allowance
EC. 2.1.4.9 Meal subsidy
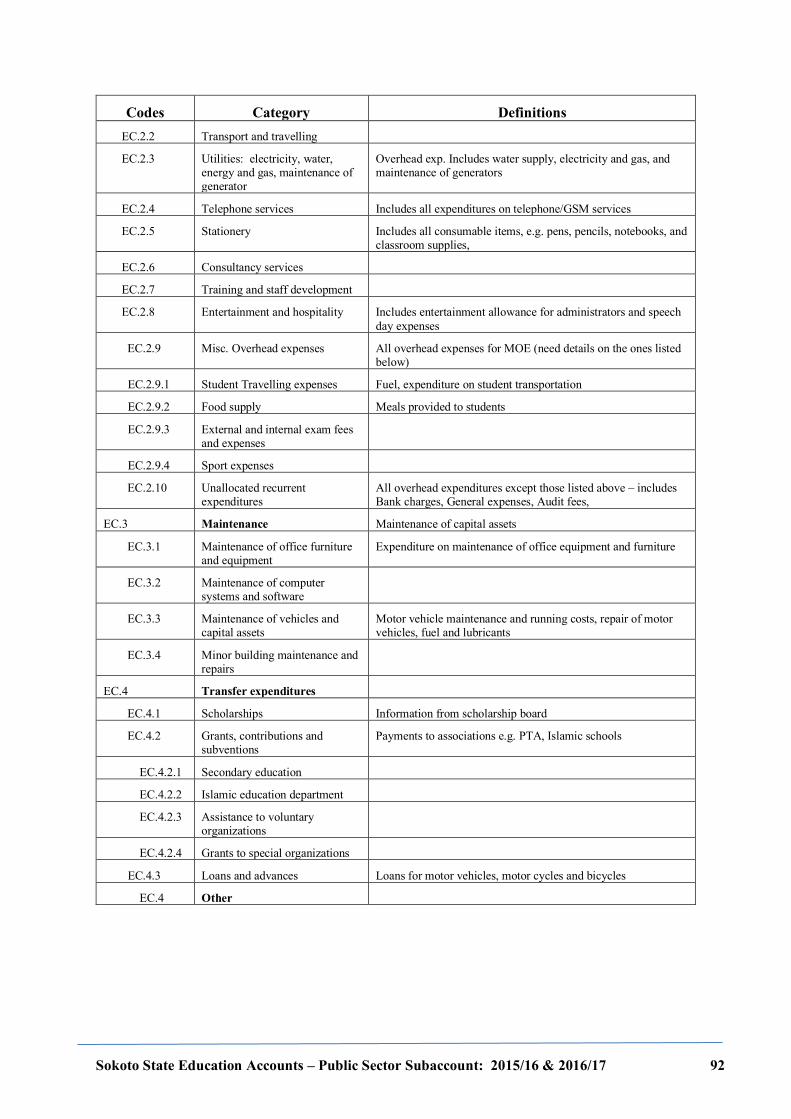
Sokoto State Education Accounts – Public Sector Subaccount: 2015/16 & 2016/17 92
Codes Category Definitions EC.2.2 Transport and travelling
EC.2.3 Utilities: electricity, water, energy and gas, maintenance of generator
Overhead exp. Includes water supply, electricity and gas, and maintenance of generators
EC.2.4 Telephone services Includes all expenditures on telephone/GSM services
EC.2.5 Stationery Includes all consumable items, e.g. pens, pencils, notebooks, and classroom supplies,
EC.2.6 Consultancy services
EC.2.7 Training and staff development
EC.2.8 Entertainment and hospitality Includes entertainment allowance for administrators and speech day expenses
EC.2.9 Misc. Overhead expenses All overhead expenses for MOE (need details on the ones listed below)
EC.2.9.1 Student Travelling expenses Fuel, expenditure on student transportation
EC.2.9.2 Food supply Meals provided to students
EC.2.9.3 External and internal exam fees and expenses
EC.2.9.4 Sport expenses
EC.2.10 Unallocated recurrent expenditures
All overhead expenditures except those listed above – includes Bank charges, General expenses, Audit fees,
EC.3 Maintenance Maintenance of capital assets
EC.3.1 Maintenance of office furniture and equipment
Expenditure on maintenance of office equipment and furniture
EC.3.2 Maintenance of computer systems and software
EC.3.3 Maintenance of vehicles and capital assets
Motor vehicle maintenance and running costs, repair of motor vehicles, fuel and lubricants
EC.3.4 Minor building maintenance and repairs
EC.4 Transfer expenditures
EC.4.1 Scholarships Information from scholarship board
EC.4.2 Grants, contributions and subventions
Payments to associations e.g. PTA, Islamic schools
EC.4.2.1 Secondary education
EC.4.2.2 Islamic education department
EC.4.2.3 Assistance to voluntary organizations
EC.4.2.4 Grants to special organizations
EC.4.3 Loans and advances Loans for motor vehicles, motor cycles and bicycles
EC.4 Other
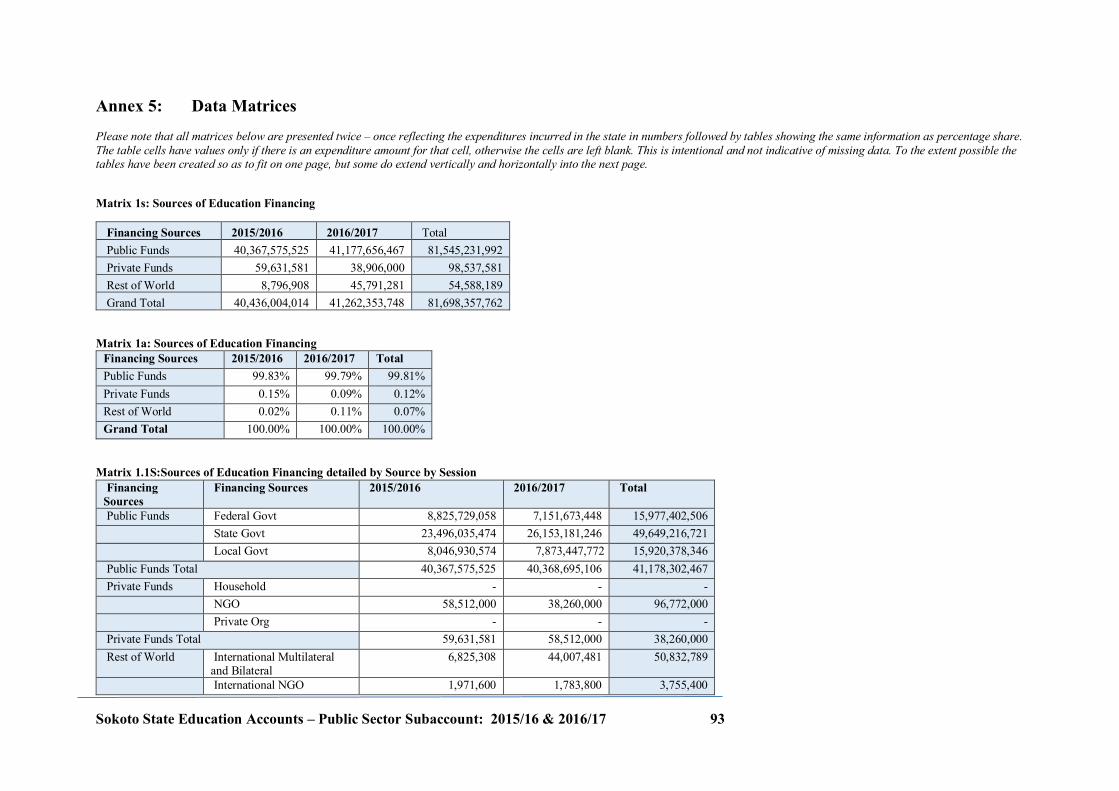
Sokoto State Education Accounts – Public Sector Subaccount: 2015/16 & 2016/17 93
Annex 5: Data Matrices Please note that all matrices below are presented twice – once reflecting the expenditures incurred in the state in numbers followed by tables showing the same information as percentage share. The table cells have values only if there is an expenditure amount for that cell, otherwise the cells are left blank. This is intentional and not indicative of missing data. To the extent possible the tables have been created so as to fit on one page, but some do extend vertically and horizontally into the next page.
Matrix 1s: Sources of Education Financing
Financing Sources 2015/2016 2016/2017 Total Public Funds 40,367,575,525 41,177,656,467 81,545,231,992 Private Funds 59,631,581 38,906,000 98,537,581 Rest of World 8,796,908 45,791,281 54,588,189 Grand Total 40,436,004,014 41,262,353,748 81,698,357,762
Matrix 1a: Sources of Education Financing Financing Sources 2015/2016 2016/2017 Total Public Funds 99.83% 99.79% 99.81% Private Funds 0.15% 0.09% 0.12% Rest of World 0.02% 0.11% 0.07% Grand Total 100.00% 100.00% 100.00%
Matrix 1.1S:Sources of Education Financing detailed by Source by Session Financing Sources
Financing Sources 2015/2016 2016/2017 Total
Public Funds Federal Govt 8,825,729,058 7,151,673,448 15,977,402,506 State Govt 23,496,035,474 26,153,181,246 49,649,216,721 Local Govt 8,046,930,574 7,873,447,772 15,920,378,346 Public Funds Total 40,367,575,525 40,368,695,106 41,178,302,467 Private Funds Household - - - NGO 58,512,000 38,260,000 96,772,000 Private Org - - - Private Funds Total 59,631,581 58,512,000 38,260,000 Rest of World International Multilateral
and Bilateral 6,825,308 44,007,481 50,832,789
International NGO 1,971,600 1,783,800 3,755,400
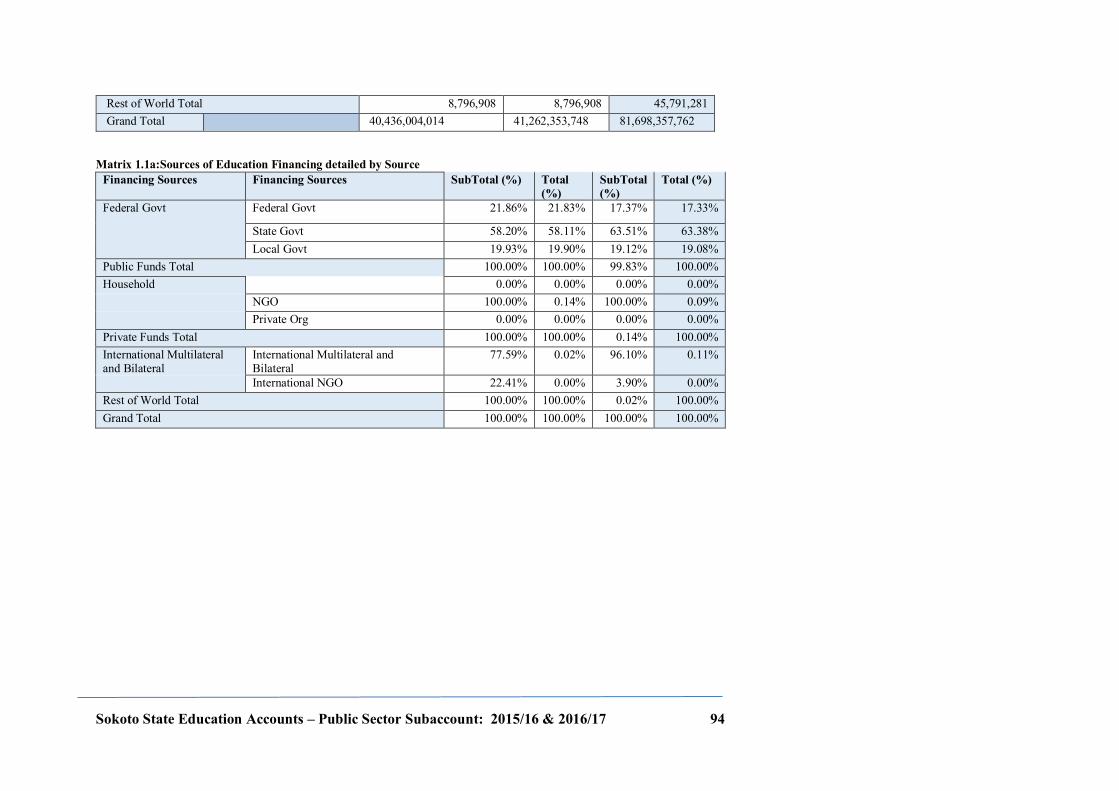
Sokoto State Education Accounts – Public Sector Subaccount: 2015/16 & 2016/17 94
Rest of World Total 8,796,908 8,796,908 45,791,281 Grand Total 40,436,004,014 41,262,353,748 81,698,357,762
Matrix 1.1a:Sources of Education Financing detailed by Source Financing Sources Financing Sources SubTotal (%) Total
(%) SubTotal (%)
Total (%)
Federal Govt Federal Govt 21.86% 21.83% 17.37% 17.33%
State Govt 58.20% 58.11% 63.51% 63.38% Local Govt 19.93% 19.90% 19.12% 19.08%
Public Funds Total 100.00% 100.00% 99.83% 100.00% Household 0.00% 0.00% 0.00% 0.00% NGO 100.00% 0.14% 100.00% 0.09% Private Org 0.00% 0.00% 0.00% 0.00% Private Funds Total 100.00% 100.00% 0.14% 100.00% International Multilateral and Bilateral
International Multilateral and Bilateral
77.59% 0.02% 96.10% 0.11%
International NGO 22.41% 0.00% 3.90% 0.00% Rest of World Total 100.00% 100.00% 0.02% 100.00% Grand Total 100.00% 100.00% 100.00% 100.00%
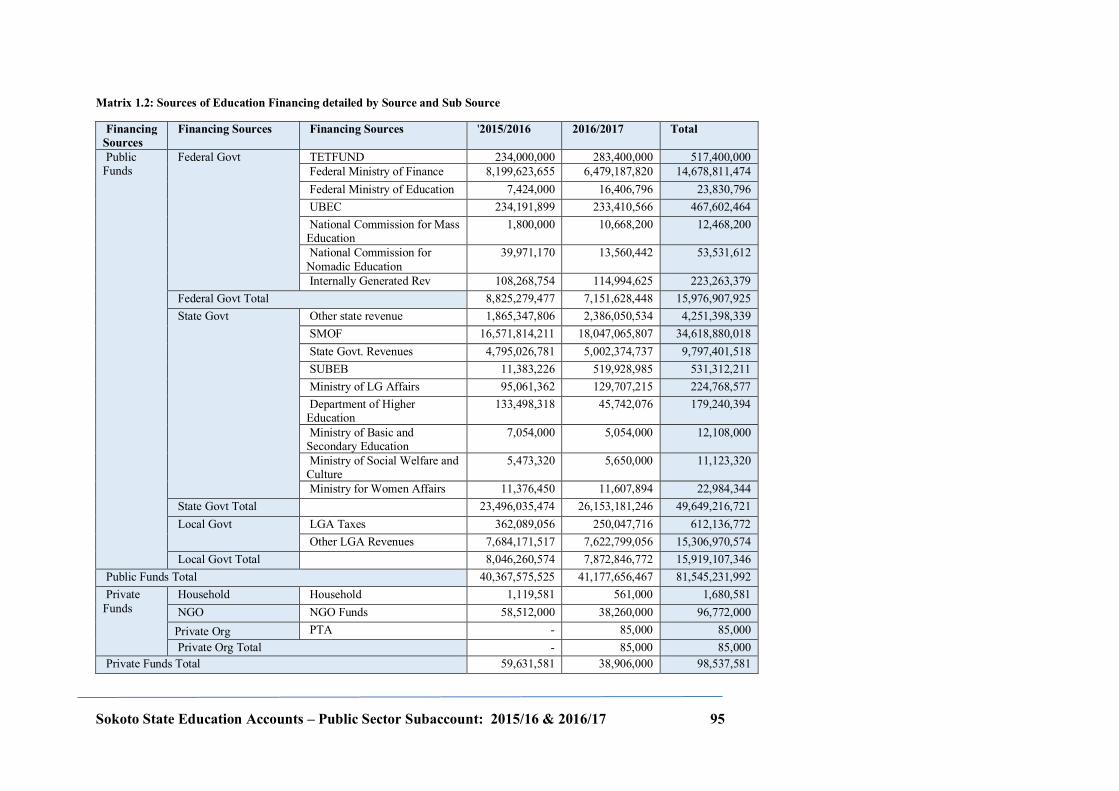
Sokoto State Education Accounts – Public Sector Subaccount: 2015/16 & 2016/17 95
Matrix 1.2: Sources of Education Financing detailed by Source and Sub Source
Financing Sources
Financing Sources Financing Sources '2015/2016 2016/2017 Total
Public Funds
Federal Govt TETFUND 234,000,000 283,400,000 517,400,000 Federal Ministry of Finance 8,199,623,655 6,479,187,820 14,678,811,474 Federal Ministry of Education 7,424,000 16,406,796 23,830,796 UBEC 234,191,899 233,410,566 467,602,464 National Commission for Mass Education
1,800,000 10,668,200 12,468,200
National Commission for Nomadic Education
39,971,170 13,560,442 53,531,612
Internally Generated Rev 108,268,754 114,994,625 223,263,379 Federal Govt Total 8,825,279,477 7,151,628,448 15,976,907,925 State Govt Other state revenue 1,865,347,806 2,386,050,534 4,251,398,339
SMOF 16,571,814,211 18,047,065,807 34,618,880,018 State Govt. Revenues 4,795,026,781 5,002,374,737 9,797,401,518 SUBEB 11,383,226 519,928,985 531,312,211 Ministry of LG Affairs 95,061,362 129,707,215 224,768,577 Department of Higher Education
133,498,318 45,742,076 179,240,394
Ministry of Basic and Secondary Education
7,054,000 5,054,000 12,108,000
Ministry of Social Welfare and Culture
5,473,320 5,650,000 11,123,320
Ministry for Women Affairs 11,376,450 11,607,894 22,984,344 State Govt Total 23,496,035,474 26,153,181,246 49,649,216,721 Local Govt LGA Taxes 362,089,056 250,047,716 612,136,772
Other LGA Revenues 7,684,171,517 7,622,799,056 15,306,970,574 Local Govt Total 8,046,260,574 7,872,846,772 15,919,107,346
Public Funds Total 40,367,575,525 41,177,656,467 81,545,231,992 Private Funds
Household Household 1,119,581 561,000 1,680,581 NGO NGO Funds 58,512,000 38,260,000 96,772,000 Private Org PTA - 85,000 85,000 Private Org Total - 85,000 85,000
Private Funds Total 59,631,581 38,906,000 98,537,581
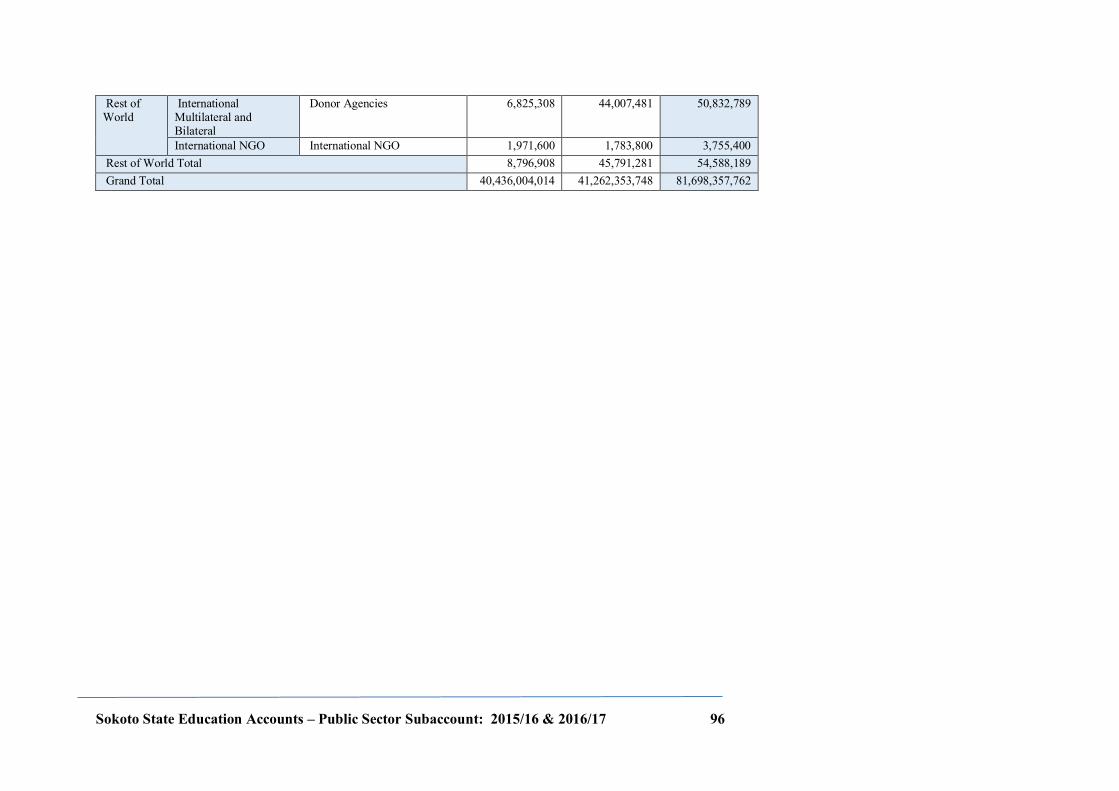
Sokoto State Education Accounts – Public Sector Subaccount: 2015/16 & 2016/17 96
Rest of World
International Multilateral and Bilateral
Donor Agencies 6,825,308 44,007,481 50,832,789
International NGO International NGO 1,971,600 1,783,800 3,755,400 Rest of World Total 8,796,908 45,791,281 54,588,189 Grand Total 40,436,004,014 41,262,353,748 81,698,357,762
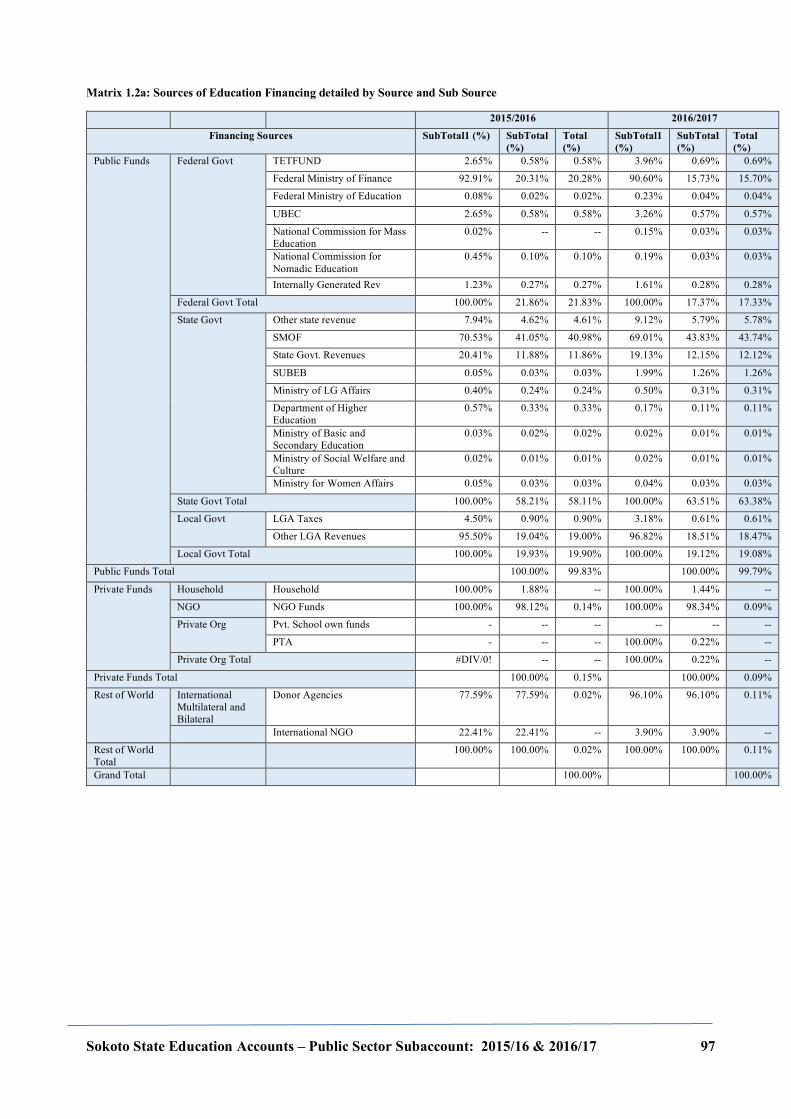
Sokoto State Education Accounts – Public Sector Subaccount: 2015/16 & 2016/17 97
Matrix 1.2a: Sources of Education Financing detailed by Source and Sub Source
2015/2016 2016/2017
Financing Sources SubTotal1 (%) SubTotal (%)
Total (%)
SubTotal1 (%)
SubTotal (%)
Total (%)
Public Funds Federal Govt TETFUND 2.65% 0.58% 0.58% 3.96% 0.69% 0.69%
Federal Ministry of Finance 92.91% 20.31% 20.28% 90.60% 15.73% 15.70%
Federal Ministry of Education 0.08% 0.02% 0.02% 0.23% 0.04% 0.04%
UBEC 2.65% 0.58% 0.58% 3.26% 0.57% 0.57%
National Commission for Mass Education
0.02% -- -- 0.15% 0.03% 0.03%
National Commission for Nomadic Education
0.45% 0.10% 0.10% 0.19% 0.03% 0.03%
Internally Generated Rev 1.23% 0.27% 0.27% 1.61% 0.28% 0.28%
Federal Govt Total 100.00% 21.86% 21.83% 100.00% 17.37% 17.33%
State Govt Other state revenue 7.94% 4.62% 4.61% 9.12% 5.79% 5.78%
SMOF 70.53% 41.05% 40.98% 69.01% 43.83% 43.74%
State Govt. Revenues 20.41% 11.88% 11.86% 19.13% 12.15% 12.12%
SUBEB 0.05% 0.03% 0.03% 1.99% 1.26% 1.26%
Ministry of LG Affairs 0.40% 0.24% 0.24% 0.50% 0.31% 0.31%
Department of Higher Education
0.57% 0.33% 0.33% 0.17% 0.11% 0.11%
Ministry of Basic and Secondary Education
0.03% 0.02% 0.02% 0.02% 0.01% 0.01%
Ministry of Social Welfare and Culture
0.02% 0.01% 0.01% 0.02% 0.01% 0.01%
Ministry for Women Affairs 0.05% 0.03% 0.03% 0.04% 0.03% 0.03%
State Govt Total 100.00% 58.21% 58.11% 100.00% 63.51% 63.38%
Local Govt LGA Taxes 4.50% 0.90% 0.90% 3.18% 0.61% 0.61%
Other LGA Revenues 95.50% 19.04% 19.00% 96.82% 18.51% 18.47%
Local Govt Total 100.00% 19.93% 19.90% 100.00% 19.12% 19.08%
Public Funds Total
100.00% 99.83%
100.00% 99.79%
Private Funds Household Household 100.00% 1.88% -- 100.00% 1.44% --
NGO NGO Funds 100.00% 98.12% 0.14% 100.00% 98.34% 0.09%
Private Org Pvt. School own funds - -- -- -- -- --
PTA - -- -- 100.00% 0.22% --
Private Org Total #DIV/0! -- -- 100.00% 0.22% --
Private Funds Total
100.00% 0.15%
100.00% 0.09%
Rest of World International Multilateral and Bilateral
Donor Agencies 77.59% 77.59% 0.02% 96.10% 96.10% 0.11%
International NGO 22.41% 22.41% -- 3.90% 3.90% --
Rest of World Total
100.00% 100.00% 0.02% 100.00% 100.00% 0.11%
Grand Total
100.00% 100.00%
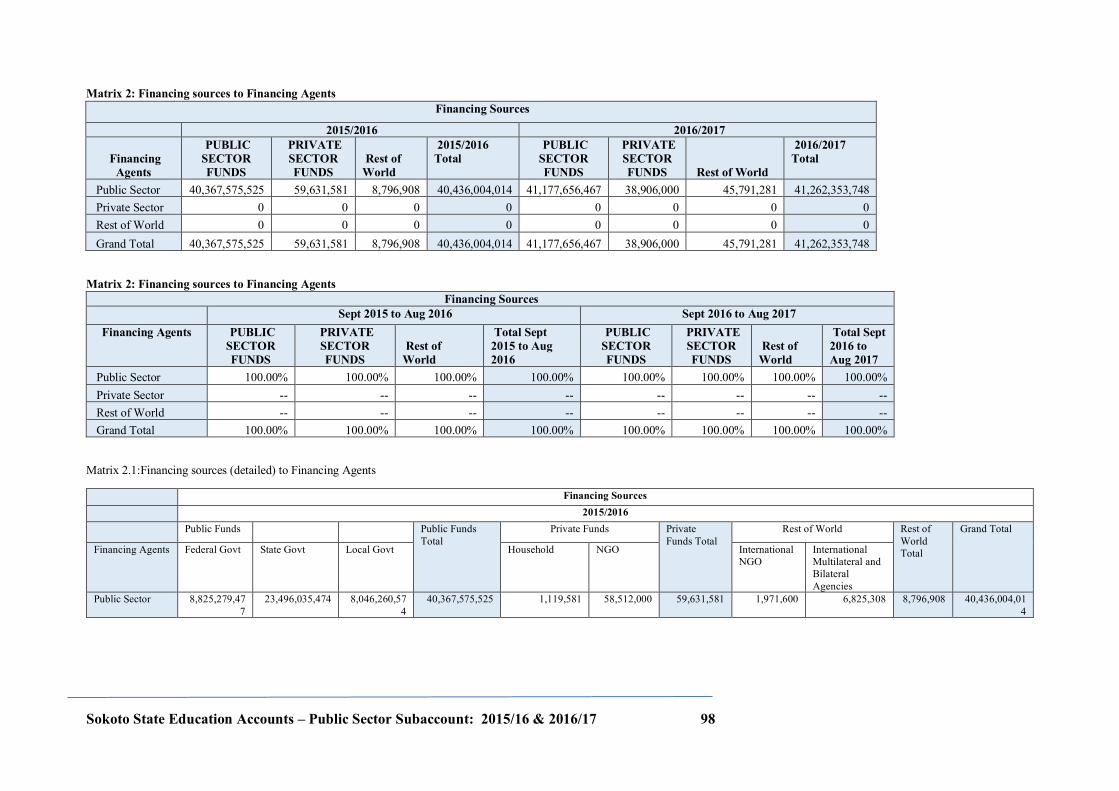
Sokoto State Education Accounts – Public Sector Subaccount: 2015/16 & 2016/17 98
Matrix 2: Financing sources to Financing Agents Financing Sources
2015/2016 2016/2017
Financing Agents
PUBLIC SECTOR FUNDS
PRIVATE SECTOR FUNDS
Rest of World
2015/2016 Total
PUBLIC SECTOR FUNDS
PRIVATE SECTOR FUNDS Rest of World
2016/2017 Total
Public Sector 40,367,575,525 59,631,581 8,796,908 40,436,004,014 41,177,656,467 38,906,000 45,791,281 41,262,353,748 Private Sector 0 0 0 0 0 0 0 0 Rest of World 0 0 0 0 0 0 0 0 Grand Total 40,367,575,525 59,631,581 8,796,908 40,436,004,014 41,177,656,467 38,906,000 45,791,281 41,262,353,748
Matrix 2: Financing sources to Financing Agents Financing Sources
Sept 2015 to Aug 2016 Sept 2016 to Aug 2017 Financing Agents PUBLIC
SECTOR FUNDS
PRIVATE SECTOR FUNDS
Rest of World
Total Sept 2015 to Aug 2016
PUBLIC SECTOR FUNDS
PRIVATE SECTOR FUNDS
Rest of World
Total Sept 2016 to Aug 2017
Public Sector 100.00% 100.00% 100.00% 100.00% 100.00% 100.00% 100.00% 100.00% Private Sector -- -- -- -- -- -- -- -- Rest of World -- -- -- -- -- -- -- -- Grand Total 100.00% 100.00% 100.00% 100.00% 100.00% 100.00% 100.00% 100.00%
Matrix 2.1:Financing sources (detailed) to Financing Agents
Financing Sources 2015/2016
Public Funds
Public Funds Total
Private Funds Private Funds Total
Rest of World Rest of World Total
Grand Total
Financing Agents Federal Govt State Govt Local Govt Household NGO International NGO
International Multilateral and Bilateral Agencies
Public Sector 8,825,279,477
23,496,035,474 8,046,260,574
40,367,575,525 1,119,581 58,512,000 59,631,581 1,971,600 6,825,308 8,796,908 40,436,004,014
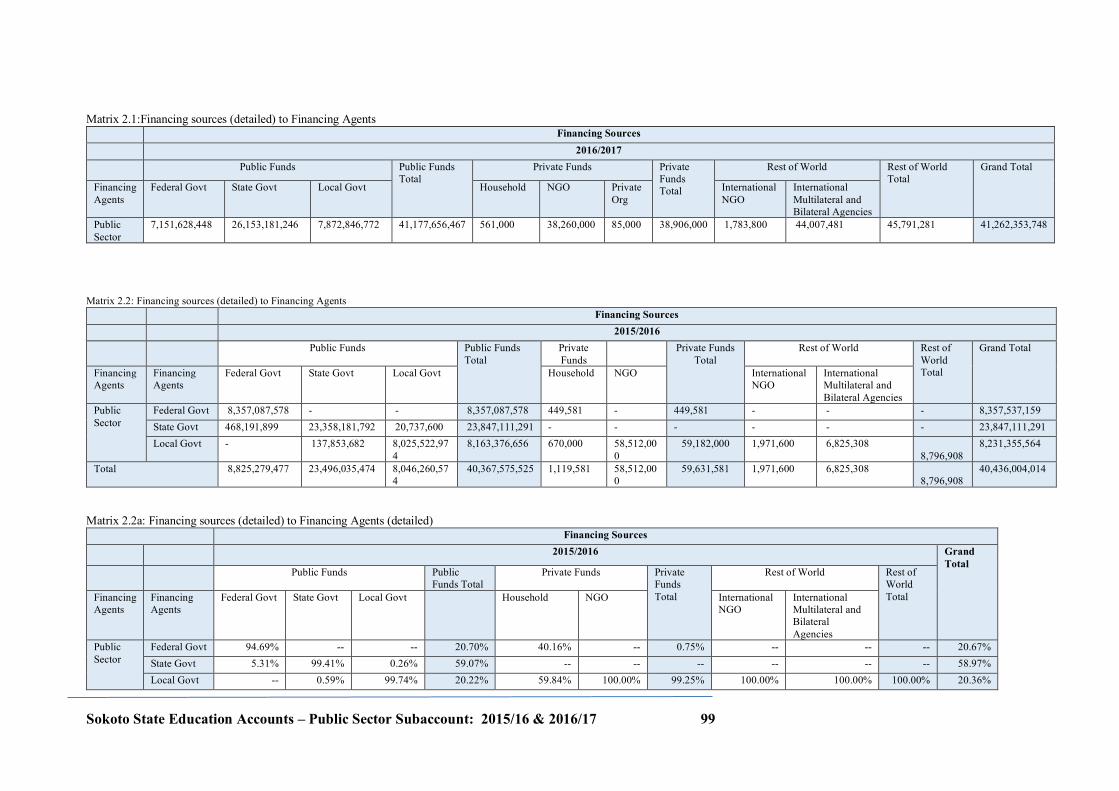
Sokoto State Education Accounts – Public Sector Subaccount: 2015/16 & 2016/17 99
Matrix 2.1:Financing sources (detailed) to Financing Agents Financing Sources 2016/2017 Public Funds Public Funds
Total Private Funds Private
Funds Total
Rest of World Rest of World Total
Grand Total
Financing Agents
Federal Govt State Govt Local Govt Household NGO Private Org
International NGO
International Multilateral and Bilateral Agencies
Public Sector
7,151,628,448 26,153,181,246 7,872,846,772 41,177,656,467 561,000 38,260,000 85,000 38,906,000 1,783,800 44,007,481 45,791,281 41,262,353,748
Matrix 2.2: Financing sources (detailed) to Financing Agents Financing Sources
2015/2016 Public Funds Public Funds
Total Private Funds
Private Funds Total
Rest of World Rest of World Total
Grand Total
Financing Agents
Financing Agents
Federal Govt State Govt Local Govt Household NGO International NGO
International Multilateral and Bilateral Agencies
Public Sector
Federal Govt 8,357,087,578 - - 8,357,087,578 449,581 - 449,581 - - - 8,357,537,159 State Govt 468,191,899 23,358,181,792 20,737,600 23,847,111,291 - - - - - - 23,847,111,291 Local Govt - 137,853,682 8,025,522,97
4 8,163,376,656 670,000 58,512,00
0 59,182,000 1,971,600 6,825,308
8,796,908 8,231,355,564
Total 8,825,279,477 23,496,035,474 8,046,260,574
40,367,575,525 1,119,581 58,512,000
59,631,581 1,971,600 6,825,308 8,796,908
40,436,004,014
Matrix 2.2a: Financing sources (detailed) to Financing Agents (detailed) Financing Sources
2015/2016 Grand Total
Public Funds Public Funds Total
Private Funds Private Funds Total
Rest of World Rest of World Total Financing
Agents Financing Agents
Federal Govt State Govt Local Govt
Household NGO International NGO
International Multilateral and Bilateral Agencies
Public Sector
Federal Govt 94.69% -- -- 20.70% 40.16% -- 0.75% -- -- -- 20.67% State Govt 5.31% 99.41% 0.26% 59.07% -- -- -- -- -- -- 58.97% Local Govt -- 0.59% 99.74% 20.22% 59.84% 100.00% 99.25% 100.00% 100.00% 100.00% 20.36%
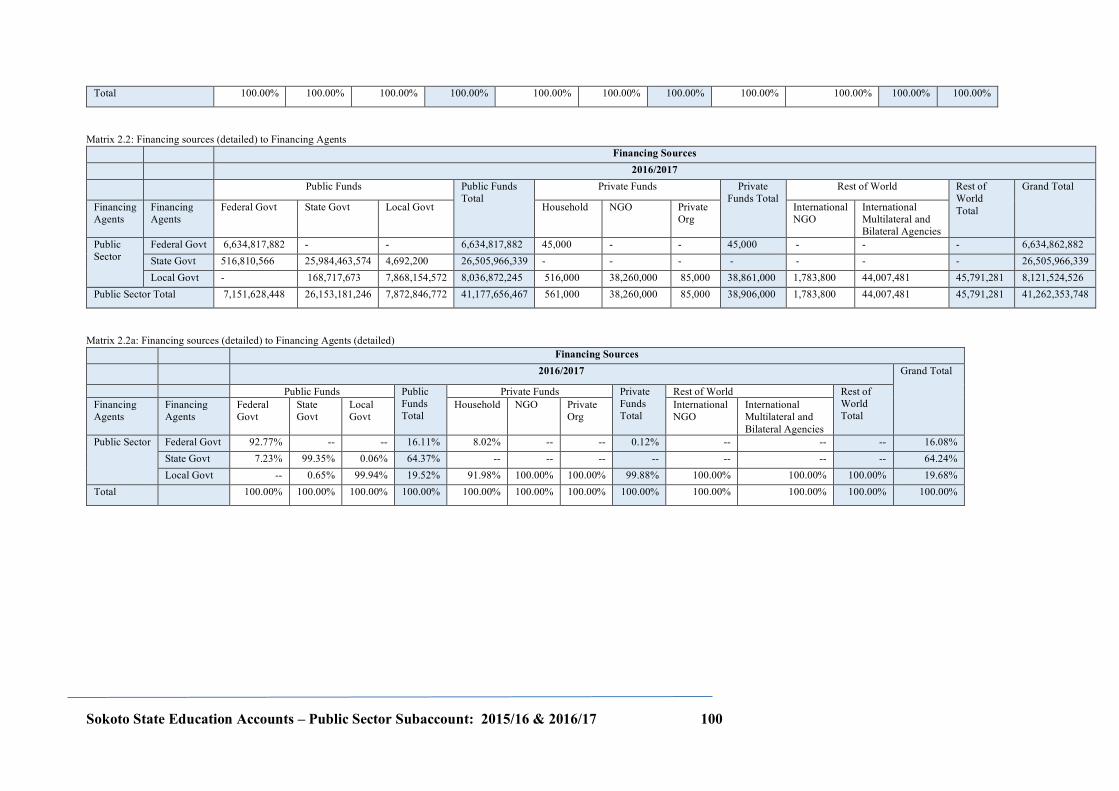
Sokoto State Education Accounts – Public Sector Subaccount: 2015/16 & 2016/17 100
Total 100.00% 100.00% 100.00% 100.00% 100.00% 100.00% 100.00% 100.00% 100.00% 100.00% 100.00%
Matrix 2.2: Financing sources (detailed) to Financing Agents Financing Sources
2016/2017 Public Funds Public Funds
Total Private Funds Private
Funds Total Rest of World Rest of
World Total
Grand Total
Financing Agents
Financing Agents
Federal Govt State Govt Local Govt Household NGO Private Org
International NGO
International Multilateral and Bilateral Agencies
Public Sector
Federal Govt 6,634,817,882 - - 6,634,817,882 45,000 - - 45,000 - - - 6,634,862,882 State Govt 516,810,566 25,984,463,574 4,692,200 26,505,966,339 - - - - - - - 26,505,966,339 Local Govt - 168,717,673 7,868,154,572 8,036,872,245 516,000 38,260,000 85,000 38,861,000 1,783,800 44,007,481 45,791,281 8,121,524,526
Public Sector Total 7,151,628,448 26,153,181,246 7,872,846,772 41,177,656,467 561,000 38,260,000 85,000 38,906,000 1,783,800 44,007,481 45,791,281 41,262,353,748
Matrix 2.2a: Financing sources (detailed) to Financing Agents (detailed) Financing Sources
2016/2017 Grand Total
Public Funds Public Funds Total
Private Funds Private Funds Total
Rest of World Rest of World Total
Financing Agents
Financing Agents
Federal Govt
State Govt
Local Govt
Household NGO Private Org
International NGO
International Multilateral and Bilateral Agencies
Public Sector Federal Govt 92.77% -- -- 16.11% 8.02% -- -- 0.12% -- -- -- 16.08% State Govt 7.23% 99.35% 0.06% 64.37% -- -- -- -- -- -- -- 64.24% Local Govt -- 0.65% 99.94% 19.52% 91.98% 100.00% 100.00% 99.88% 100.00% 100.00% 100.00% 19.68%
Total
100.00% 100.00% 100.00% 100.00% 100.00% 100.00% 100.00% 100.00% 100.00% 100.00% 100.00% 100.00%
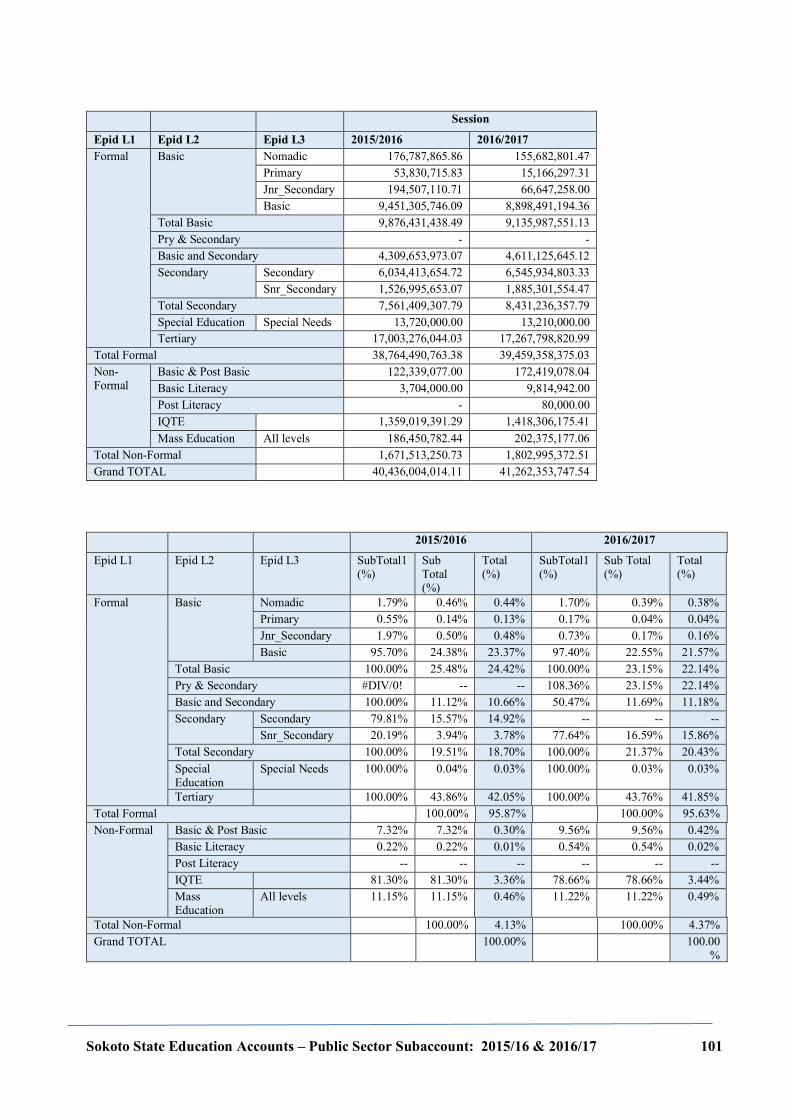
Sokoto State Education Accounts – Public Sector Subaccount: 2015/16 & 2016/17 101
Session
Epid L1 Epid L2 Epid L3 2015/2016 2016/2017 Formal Basic Nomadic 176,787,865.86 155,682,801.47
Primary 53,830,715.83 15,166,297.31 Jnr_Secondary 194,507,110.71 66,647,258.00 Basic 9,451,305,746.09 8,898,491,194.36
Total Basic 9,876,431,438.49 9,135,987,551.13 Pry & Secondary - - Basic and Secondary 4,309,653,973.07 4,611,125,645.12 Secondary Secondary 6,034,413,654.72 6,545,934,803.33
Snr_Secondary 1,526,995,653.07 1,885,301,554.47 Total Secondary 7,561,409,307.79 8,431,236,357.79 Special Education Special Needs 13,720,000.00 13,210,000.00 Tertiary 17,003,276,044.03 17,267,798,820.99
Total Formal 38,764,490,763.38 39,459,358,375.03 Non-Formal
Basic & Post Basic 122,339,077.00 172,419,078.04 Basic Literacy 3,704,000.00 9,814,942.00 Post Literacy - 80,000.00 IQTE
1,359,019,391.29 1,418,306,175.41
Mass Education All levels 186,450,782.44 202,375,177.06 Total Non-Formal
1,671,513,250.73 1,802,995,372.51
Grand TOTAL
40,436,004,014.11 41,262,353,747.54
2015/2016 2016/2017
Epid L1 Epid L2 Epid L3 SubTotal1 (%)
Sub Total (%)
Total (%)
SubTotal1 (%)
Sub Total (%)
Total (%)
Formal Basic Nomadic 1.79% 0.46% 0.44% 1.70% 0.39% 0.38% Primary 0.55% 0.14% 0.13% 0.17% 0.04% 0.04% Jnr_Secondary 1.97% 0.50% 0.48% 0.73% 0.17% 0.16% Basic 95.70% 24.38% 23.37% 97.40% 22.55% 21.57%
Total Basic 100.00% 25.48% 24.42% 100.00% 23.15% 22.14% Pry & Secondary #DIV/0! -- -- 108.36% 23.15% 22.14% Basic and Secondary 100.00% 11.12% 10.66% 50.47% 11.69% 11.18% Secondary Secondary 79.81% 15.57% 14.92% -- -- --
Snr_Secondary 20.19% 3.94% 3.78% 77.64% 16.59% 15.86% Total Secondary 100.00% 19.51% 18.70% 100.00% 21.37% 20.43% Special Education
Special Needs 100.00% 0.04% 0.03% 100.00% 0.03% 0.03%
Tertiary
100.00% 43.86% 42.05% 100.00% 43.76% 41.85% Total Formal
100.00% 95.87%
100.00% 95.63%
Non-Formal Basic & Post Basic 7.32% 7.32% 0.30% 9.56% 9.56% 0.42% Basic Literacy 0.22% 0.22% 0.01% 0.54% 0.54% 0.02% Post Literacy -- -- -- -- -- -- IQTE
81.30% 81.30% 3.36% 78.66% 78.66% 3.44%
Mass Education
All levels 11.15% 11.15% 0.46% 11.22% 11.22% 0.49%
Total Non-Formal
100.00% 4.13%
100.00% 4.37% Grand TOTAL
100.00%
100.00
%
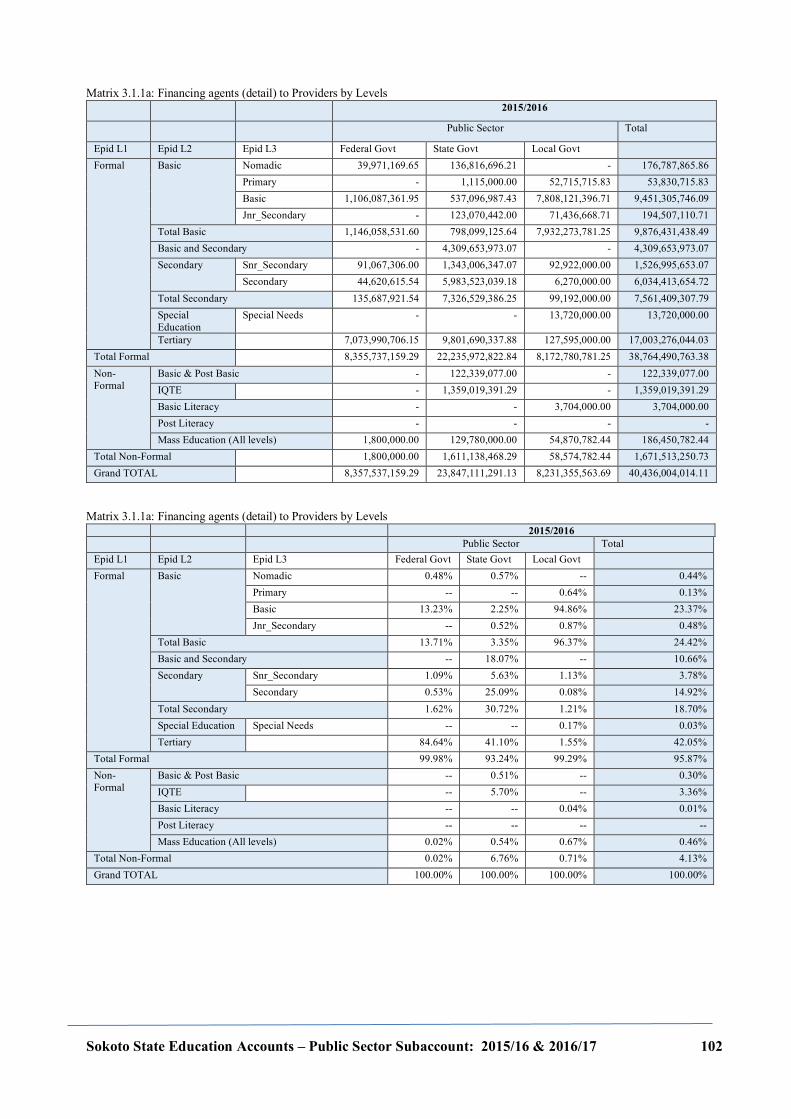
Sokoto State Education Accounts – Public Sector Subaccount: 2015/16 & 2016/17 102
Matrix 3.1.1a: Financing agents (detail) to Providers by Levels 2015/2016
Public Sector Total
Epid L1 Epid L2 Epid L3 Federal Govt State Govt Local Govt
Formal Basic Nomadic 39,971,169.65 136,816,696.21 - 176,787,865.86 Primary - 1,115,000.00 52,715,715.83 53,830,715.83 Basic 1,106,087,361.95 537,096,987.43 7,808,121,396.71 9,451,305,746.09 Jnr_Secondary - 123,070,442.00 71,436,668.71 194,507,110.71
Total Basic 1,146,058,531.60 798,099,125.64 7,932,273,781.25 9,876,431,438.49 Basic and Secondary - 4,309,653,973.07 - 4,309,653,973.07 Secondary Snr_Secondary 91,067,306.00 1,343,006,347.07 92,922,000.00 1,526,995,653.07
Secondary 44,620,615.54 5,983,523,039.18 6,270,000.00 6,034,413,654.72 Total Secondary 135,687,921.54 7,326,529,386.25 99,192,000.00 7,561,409,307.79 Special Education
Special Needs - - 13,720,000.00 13,720,000.00
Tertiary
7,073,990,706.15 9,801,690,337.88 127,595,000.00 17,003,276,044.03 Total Formal
8,355,737,159.29 22,235,972,822.84 8,172,780,781.25 38,764,490,763.38
Non-Formal
Basic & Post Basic - 122,339,077.00 - 122,339,077.00 IQTE
- 1,359,019,391.29 - 1,359,019,391.29
Basic Literacy - - 3,704,000.00 3,704,000.00 Post Literacy - - - - Mass Education (All levels) 1,800,000.00 129,780,000.00 54,870,782.44 186,450,782.44
Total Non-Formal
1,800,000.00 1,611,138,468.29 58,574,782.44 1,671,513,250.73 Grand TOTAL
8,357,537,159.29 23,847,111,291.13 8,231,355,563.69 40,436,004,014.11
Matrix 3.1.1a: Financing agents (detail) to Providers by Levels 2015/2016
Public Sector Total Epid L1 Epid L2 Epid L3 Federal Govt State Govt Local Govt
Formal Basic Nomadic 0.48% 0.57% -- 0.44% Primary -- -- 0.64% 0.13% Basic 13.23% 2.25% 94.86% 23.37% Jnr_Secondary -- 0.52% 0.87% 0.48%
Total Basic 13.71% 3.35% 96.37% 24.42% Basic and Secondary -- 18.07% -- 10.66% Secondary Snr_Secondary 1.09% 5.63% 1.13% 3.78%
Secondary 0.53% 25.09% 0.08% 14.92% Total Secondary 1.62% 30.72% 1.21% 18.70% Special Education Special Needs -- -- 0.17% 0.03% Tertiary
84.64% 41.10% 1.55% 42.05%
Total Formal 99.98% 93.24% 99.29% 95.87% Non-Formal
Basic & Post Basic -- 0.51% -- 0.30% IQTE
-- 5.70% -- 3.36%
Basic Literacy -- -- 0.04% 0.01% Post Literacy -- -- -- -- Mass Education (All levels) 0.02% 0.54% 0.67% 0.46%
Total Non-Formal 0.02% 6.76% 0.71% 4.13% Grand TOTAL 100.00% 100.00% 100.00% 100.00%
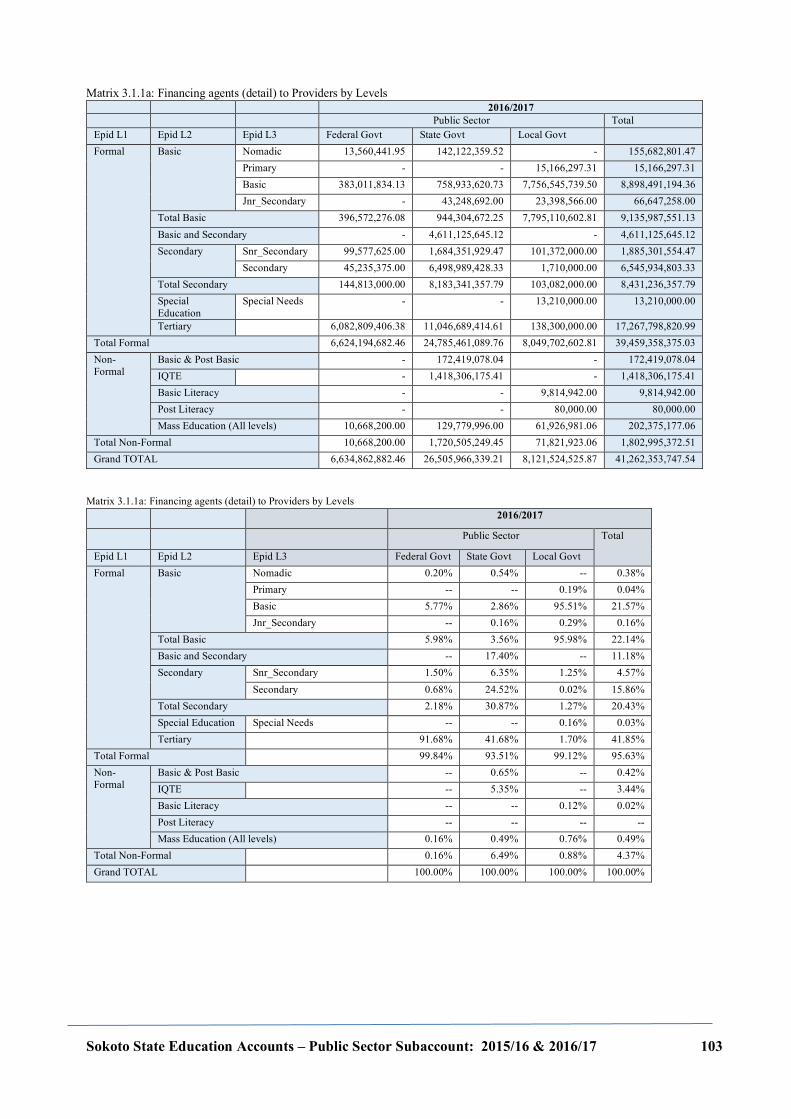
Sokoto State Education Accounts – Public Sector Subaccount: 2015/16 & 2016/17 103
Matrix 3.1.1a: Financing agents (detail) to Providers by Levels 2016/2017
Public Sector Total Epid L1 Epid L2 Epid L3 Federal Govt State Govt Local Govt
Formal Basic Nomadic 13,560,441.95 142,122,359.52 - 155,682,801.47 Primary - - 15,166,297.31 15,166,297.31 Basic 383,011,834.13 758,933,620.73 7,756,545,739.50 8,898,491,194.36 Jnr_Secondary - 43,248,692.00 23,398,566.00 66,647,258.00
Total Basic 396,572,276.08 944,304,672.25 7,795,110,602.81 9,135,987,551.13 Basic and Secondary - 4,611,125,645.12 - 4,611,125,645.12 Secondary Snr_Secondary 99,577,625.00 1,684,351,929.47 101,372,000.00 1,885,301,554.47
Secondary 45,235,375.00 6,498,989,428.33 1,710,000.00 6,545,934,803.33 Total Secondary 144,813,000.00 8,183,341,357.79 103,082,000.00 8,431,236,357.79 Special Education
Special Needs - - 13,210,000.00 13,210,000.00
Tertiary
6,082,809,406.38 11,046,689,414.61 138,300,000.00 17,267,798,820.99 Total Formal 6,624,194,682.46 24,785,461,089.76 8,049,702,602.81 39,459,358,375.03 Non-Formal
Basic & Post Basic - 172,419,078.04 - 172,419,078.04 IQTE
- 1,418,306,175.41 - 1,418,306,175.41
Basic Literacy - - 9,814,942.00 9,814,942.00 Post Literacy - - 80,000.00 80,000.00 Mass Education (All levels) 10,668,200.00 129,779,996.00 61,926,981.06 202,375,177.06
Total Non-Formal 10,668,200.00 1,720,505,249.45 71,821,923.06 1,802,995,372.51 Grand TOTAL 6,634,862,882.46 26,505,966,339.21 8,121,524,525.87 41,262,353,747.54
Matrix 3.1.1a: Financing agents (detail) to Providers by Levels 2016/2017
Public Sector Total
Epid L1 Epid L2 Epid L3 Federal Govt State Govt Local Govt Formal Basic Nomadic 0.20% 0.54% -- 0.38%
Primary -- -- 0.19% 0.04% Basic 5.77% 2.86% 95.51% 21.57% Jnr_Secondary -- 0.16% 0.29% 0.16%
Total Basic 5.98% 3.56% 95.98% 22.14% Basic and Secondary -- 17.40% -- 11.18% Secondary Snr_Secondary 1.50% 6.35% 1.25% 4.57%
Secondary 0.68% 24.52% 0.02% 15.86% Total Secondary 2.18% 30.87% 1.27% 20.43% Special Education Special Needs -- -- 0.16% 0.03% Tertiary
91.68% 41.68% 1.70% 41.85%
Total Formal
99.84% 93.51% 99.12% 95.63% Non-Formal
Basic & Post Basic -- 0.65% -- 0.42% IQTE
-- 5.35% -- 3.44%
Basic Literacy -- -- 0.12% 0.02% Post Literacy -- -- -- -- Mass Education (All levels) 0.16% 0.49% 0.76% 0.49%
Total Non-Formal
0.16% 6.49% 0.88% 4.37% Grand TOTAL
100.00% 100.00% 100.00% 100.00%
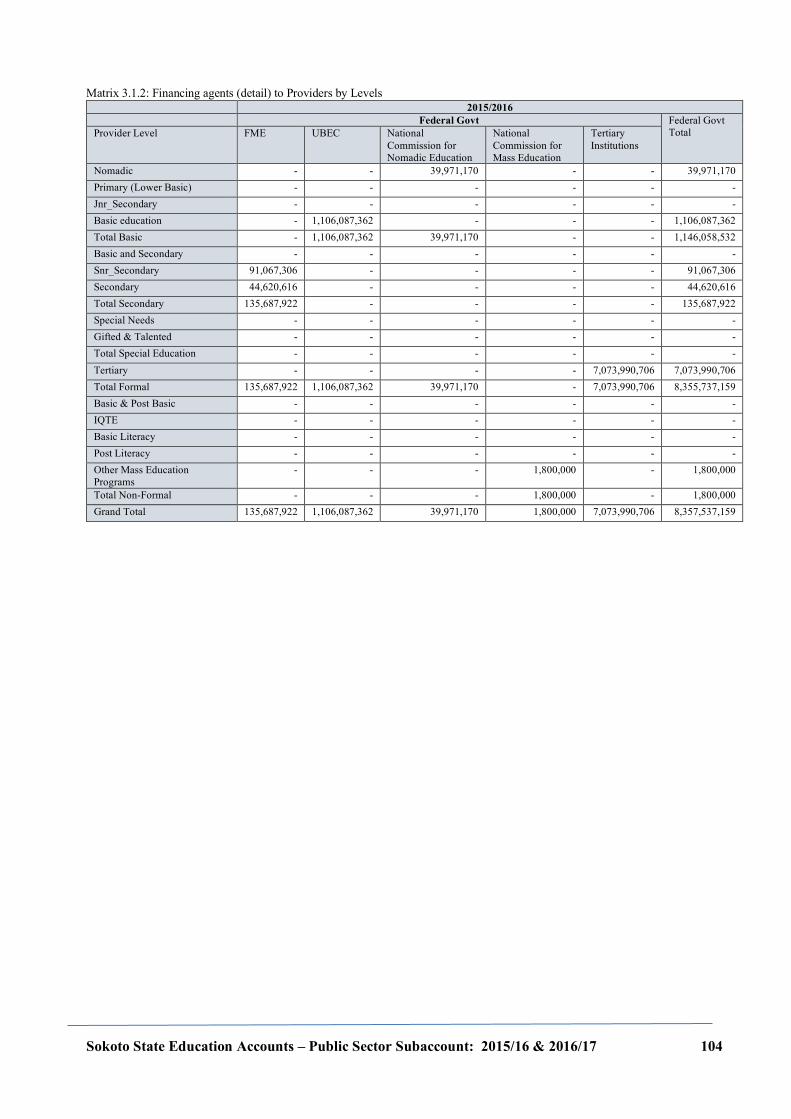
Sokoto State Education Accounts – Public Sector Subaccount: 2015/16 & 2016/17 104
Matrix 3.1.2: Financing agents (detail) to Providers by Levels 2015/2016
Federal Govt Federal Govt Total Provider Level FME UBEC National
Commission for Nomadic Education
National Commission for Mass Education
Tertiary Institutions
Nomadic - - 39,971,170 - - 39,971,170 Primary (Lower Basic) - - - - - - Jnr_Secondary - - - - - - Basic education - 1,106,087,362 - - - 1,106,087,362 Total Basic - 1,106,087,362 39,971,170 - - 1,146,058,532 Basic and Secondary - - - - - - Snr_Secondary 91,067,306 - - - - 91,067,306 Secondary 44,620,616 - - - - 44,620,616 Total Secondary 135,687,922 - - - - 135,687,922 Special Needs - - - - - - Gifted & Talented - - - - - - Total Special Education - - - - - - Tertiary - - - - 7,073,990,706 7,073,990,706 Total Formal 135,687,922 1,106,087,362 39,971,170 - 7,073,990,706 8,355,737,159 Basic & Post Basic - - - - - - IQTE - - - - - - Basic Literacy - - - - - - Post Literacy - - - - - - Other Mass Education Programs
- - - 1,800,000 - 1,800,000
Total Non-Formal - - - 1,800,000 - 1,800,000 Grand Total 135,687,922 1,106,087,362 39,971,170 1,800,000 7,073,990,706 8,357,537,159
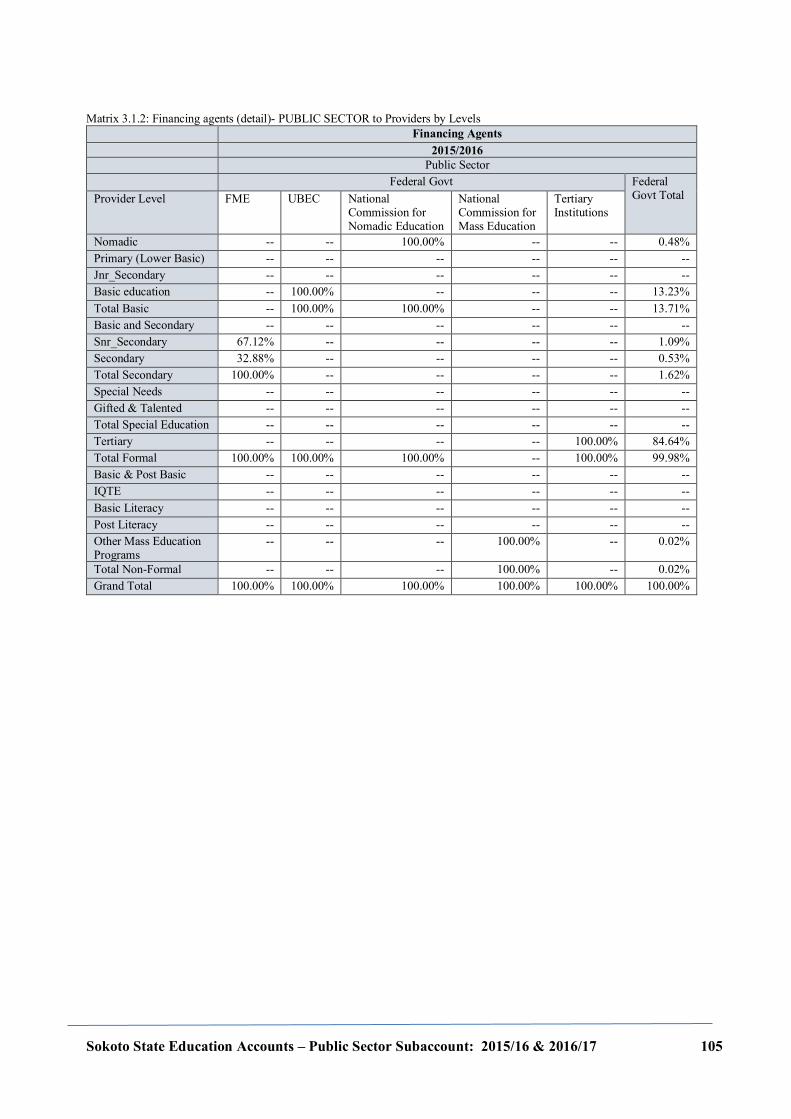
Sokoto State Education Accounts – Public Sector Subaccount: 2015/16 & 2016/17 105
Matrix 3.1.2: Financing agents (detail)- PUBLIC SECTOR to Providers by Levels Financing Agents
2015/2016 Public Sector
Federal Govt Federal Govt Total Provider Level FME UBEC National
Commission for Nomadic Education
National Commission for Mass Education
Tertiary Institutions
Nomadic -- -- 100.00% -- -- 0.48% Primary (Lower Basic) -- -- -- -- -- -- Jnr_Secondary -- -- -- -- -- -- Basic education -- 100.00% -- -- -- 13.23% Total Basic -- 100.00% 100.00% -- -- 13.71% Basic and Secondary -- -- -- -- -- -- Snr_Secondary 67.12% -- -- -- -- 1.09% Secondary 32.88% -- -- -- -- 0.53% Total Secondary 100.00% -- -- -- -- 1.62% Special Needs -- -- -- -- -- -- Gifted & Talented -- -- -- -- -- -- Total Special Education -- -- -- -- -- -- Tertiary -- -- -- -- 100.00% 84.64% Total Formal 100.00% 100.00% 100.00% -- 100.00% 99.98% Basic & Post Basic -- -- -- -- -- -- IQTE -- -- -- -- -- -- Basic Literacy -- -- -- -- -- -- Post Literacy -- -- -- -- -- -- Other Mass Education Programs
-- -- -- 100.00% -- 0.02%
Total Non-Formal -- -- -- 100.00% -- 0.02% Grand Total 100.00% 100.00% 100.00% 100.00% 100.00% 100.00%
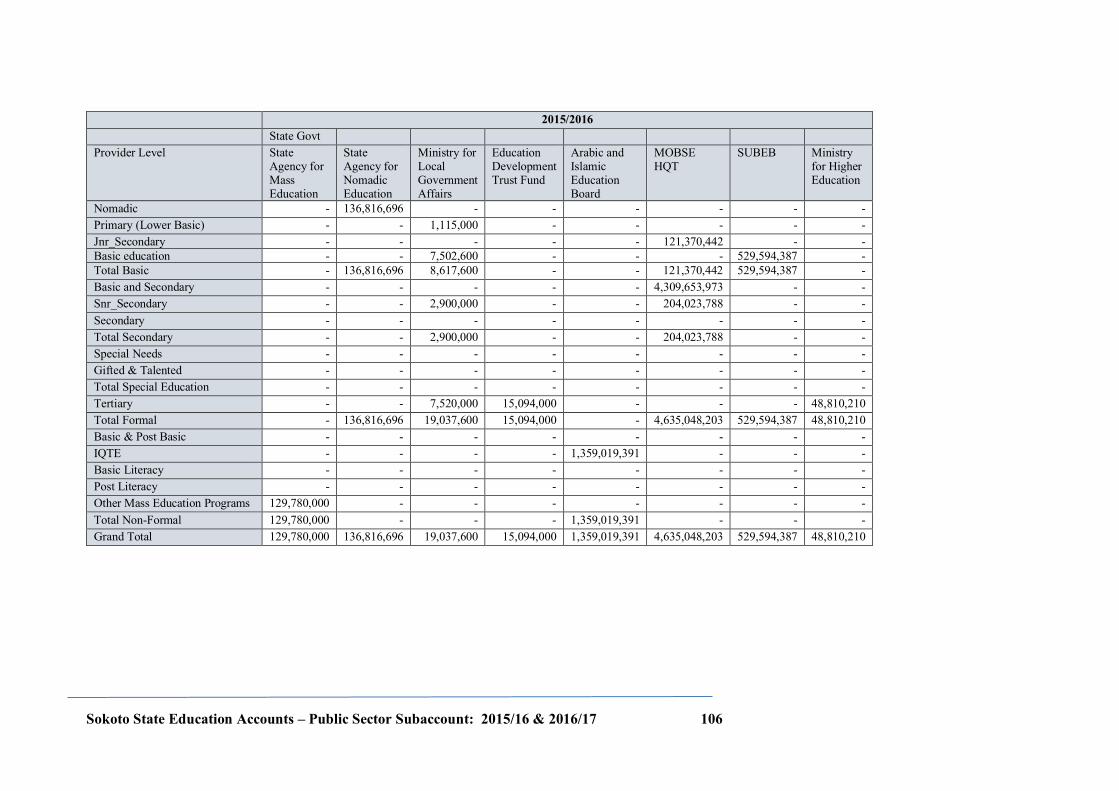
Sokoto State Education Accounts – Public Sector Subaccount: 2015/16 & 2016/17 106
2015/2016 State Govt
Provider Level State Agency for Mass Education
State Agency for Nomadic Education
Ministry for Local Government Affairs
Education Development Trust Fund
Arabic and Islamic Education Board
MOBSE HQT
SUBEB Ministry for Higher Education
Nomadic - 136,816,696 - - - - - - Primary (Lower Basic) - - 1,115,000 - - - - - Jnr_Secondary - - - - - 121,370,442 - - Basic education - - 7,502,600 - - - 529,594,387 - Total Basic - 136,816,696 8,617,600 - - 121,370,442 529,594,387 - Basic and Secondary - - - - - 4,309,653,973 - - Snr_Secondary - - 2,900,000 - - 204,023,788 - - Secondary - - - - - - - - Total Secondary - - 2,900,000 - - 204,023,788 - - Special Needs - - - - - - - - Gifted & Talented - - - - - - - - Total Special Education - - - - - - - - Tertiary - - 7,520,000 15,094,000 - - - 48,810,210 Total Formal - 136,816,696 19,037,600 15,094,000 - 4,635,048,203 529,594,387 48,810,210 Basic & Post Basic - - - - - - - - IQTE - - - - 1,359,019,391 - - - Basic Literacy - - - - - - - - Post Literacy - - - - - - - - Other Mass Education Programs 129,780,000 - - - - - - - Total Non-Formal 129,780,000 - - - 1,359,019,391 - - - Grand Total 129,780,000 136,816,696 19,037,600 15,094,000 1,359,019,391 4,635,048,203 529,594,387 48,810,210
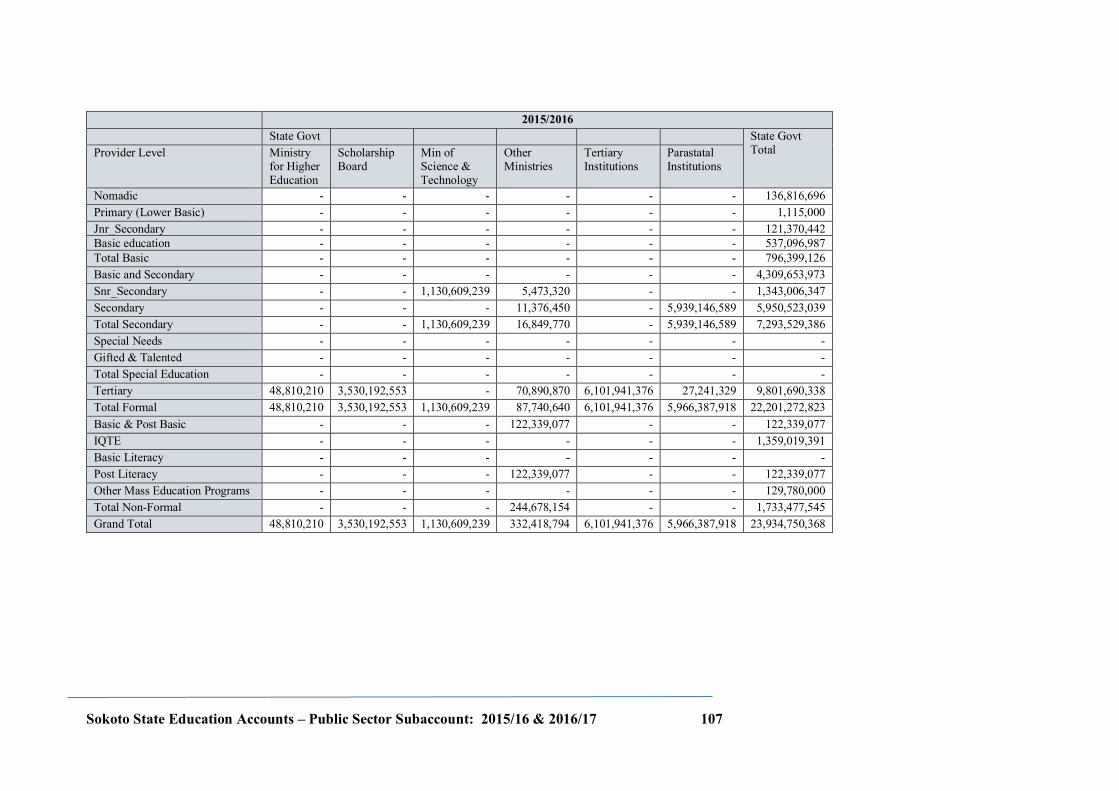
Sokoto State Education Accounts – Public Sector Subaccount: 2015/16 & 2016/17 107
2015/2016 State Govt
State Govt Total Provider Level Ministry
for Higher Education
Scholarship Board
Min of Science & Technology
Other Ministries
Tertiary Institutions
Parastatal Institutions
Nomadic - - - - - - 136,816,696 Primary (Lower Basic) - - - - - - 1,115,000 Jnr_Secondary - - - - - - 121,370,442 Basic education - - - - - - 537,096,987 Total Basic - - - - - - 796,399,126 Basic and Secondary - - - - - - 4,309,653,973 Snr_Secondary - - 1,130,609,239 5,473,320 - - 1,343,006,347 Secondary - - - 11,376,450 - 5,939,146,589 5,950,523,039 Total Secondary - - 1,130,609,239 16,849,770 - 5,939,146,589 7,293,529,386 Special Needs - - - - - - - Gifted & Talented - - - - - - - Total Special Education - - - - - - - Tertiary 48,810,210 3,530,192,553 - 70,890,870 6,101,941,376 27,241,329 9,801,690,338 Total Formal 48,810,210 3,530,192,553 1,130,609,239 87,740,640 6,101,941,376 5,966,387,918 22,201,272,823 Basic & Post Basic - - - 122,339,077 - - 122,339,077 IQTE - - - - - - 1,359,019,391 Basic Literacy - - - - - - - Post Literacy - - - 122,339,077 - - 122,339,077 Other Mass Education Programs - - - - - - 129,780,000 Total Non-Formal - - - 244,678,154 - - 1,733,477,545 Grand Total 48,810,210 3,530,192,553 1,130,609,239 332,418,794 6,101,941,376 5,966,387,918 23,934,750,368
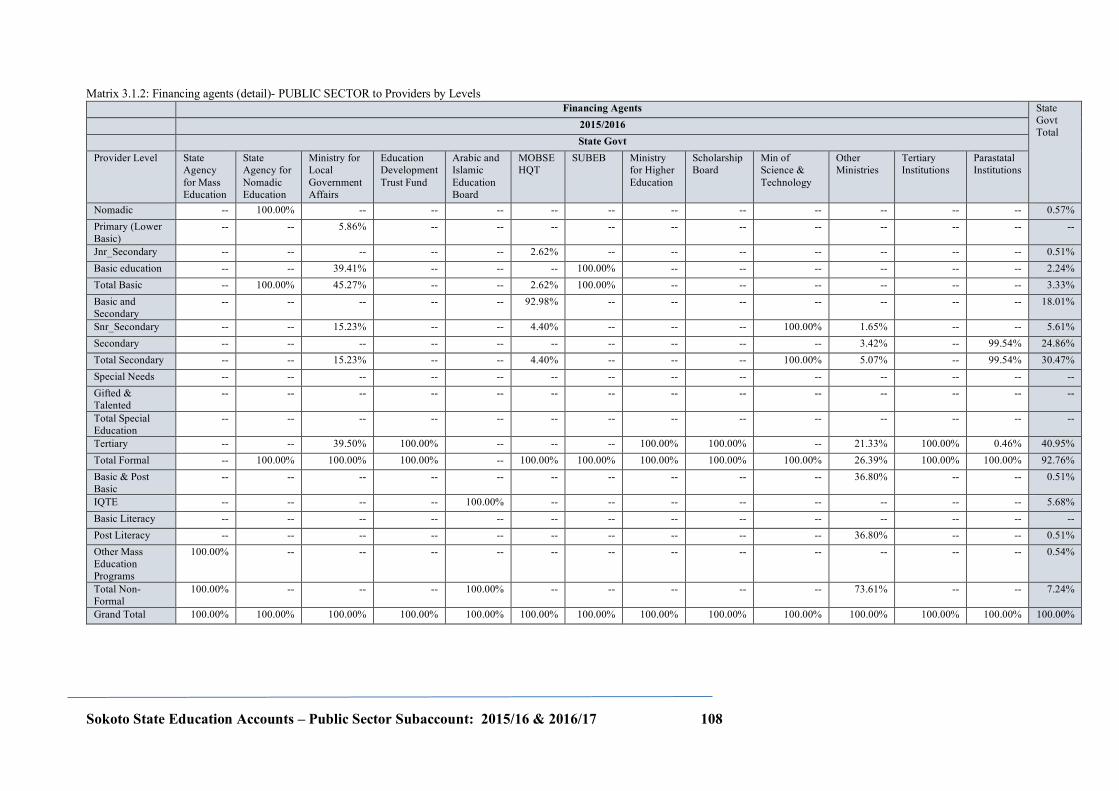
Sokoto State Education Accounts – Public Sector Subaccount: 2015/16 & 2016/17 108
Matrix 3.1.2: Financing agents (detail)- PUBLIC SECTOR to Providers by Levels Financing Agents State
Govt Total
2015/2016 State Govt
Provider Level State Agency for Mass Education
State Agency for Nomadic Education
Ministry for Local Government Affairs
Education Development Trust Fund
Arabic and Islamic Education Board
MOBSE HQT
SUBEB Ministry for Higher Education
Scholarship Board
Min of Science & Technology
Other Ministries
Tertiary Institutions
Parastatal Institutions
Nomadic -- 100.00% -- -- -- -- -- -- -- -- -- -- -- 0.57% Primary (Lower Basic)
-- -- 5.86% -- -- -- -- -- -- -- -- -- -- --
Jnr_Secondary -- -- -- -- -- 2.62% -- -- -- -- -- -- -- 0.51% Basic education -- -- 39.41% -- -- -- 100.00% -- -- -- -- -- -- 2.24% Total Basic -- 100.00% 45.27% -- -- 2.62% 100.00% -- -- -- -- -- -- 3.33% Basic and Secondary
-- -- -- -- -- 92.98% -- -- -- -- -- -- -- 18.01%
Snr_Secondary -- -- 15.23% -- -- 4.40% -- -- -- 100.00% 1.65% -- -- 5.61% Secondary -- -- -- -- -- -- -- -- -- -- 3.42% -- 99.54% 24.86% Total Secondary -- -- 15.23% -- -- 4.40% -- -- -- 100.00% 5.07% -- 99.54% 30.47% Special Needs -- -- -- -- -- -- -- -- -- -- -- -- -- -- Gifted & Talented
-- -- -- -- -- -- -- -- -- -- -- -- -- --
Total Special Education
-- -- -- -- -- -- -- -- -- -- -- -- -- --
Tertiary -- -- 39.50% 100.00% -- -- -- 100.00% 100.00% -- 21.33% 100.00% 0.46% 40.95% Total Formal -- 100.00% 100.00% 100.00% -- 100.00% 100.00% 100.00% 100.00% 100.00% 26.39% 100.00% 100.00% 92.76% Basic & Post Basic
-- -- -- -- -- -- -- -- -- -- 36.80% -- -- 0.51%
IQTE -- -- -- -- 100.00% -- -- -- -- -- -- -- -- 5.68% Basic Literacy -- -- -- -- -- -- -- -- -- -- -- -- -- -- Post Literacy -- -- -- -- -- -- -- -- -- -- 36.80% -- -- 0.51% Other Mass Education Programs
100.00% -- -- -- -- -- -- -- -- -- -- -- -- 0.54%
Total Non-Formal
100.00% -- -- -- 100.00% -- -- -- -- -- 73.61% -- -- 7.24%
Grand Total 100.00% 100.00% 100.00% 100.00% 100.00% 100.00% 100.00% 100.00% 100.00% 100.00% 100.00% 100.00% 100.00% 100.00%
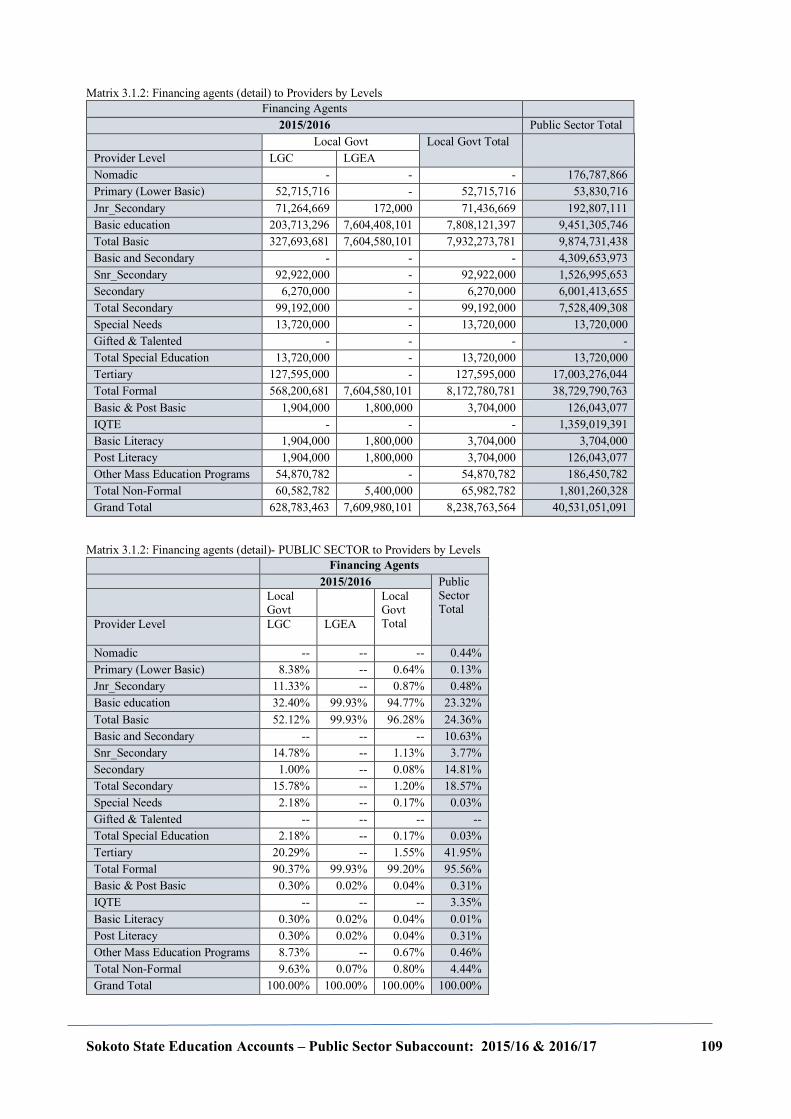
Sokoto State Education Accounts – Public Sector Subaccount: 2015/16 & 2016/17 109
Matrix 3.1.2: Financing agents (detail) to Providers by Levels Financing Agents
2015/2016 Public Sector Total Local Govt Local Govt Total
Provider Level LGC LGEA Nomadic - - - 176,787,866 Primary (Lower Basic) 52,715,716 - 52,715,716 53,830,716 Jnr_Secondary 71,264,669 172,000 71,436,669 192,807,111 Basic education 203,713,296 7,604,408,101 7,808,121,397 9,451,305,746 Total Basic 327,693,681 7,604,580,101 7,932,273,781 9,874,731,438 Basic and Secondary - - - 4,309,653,973 Snr_Secondary 92,922,000 - 92,922,000 1,526,995,653 Secondary 6,270,000 - 6,270,000 6,001,413,655 Total Secondary 99,192,000 - 99,192,000 7,528,409,308 Special Needs 13,720,000 - 13,720,000 13,720,000 Gifted & Talented - - - - Total Special Education 13,720,000 - 13,720,000 13,720,000 Tertiary 127,595,000 - 127,595,000 17,003,276,044 Total Formal 568,200,681 7,604,580,101 8,172,780,781 38,729,790,763 Basic & Post Basic 1,904,000 1,800,000 3,704,000 126,043,077 IQTE - - - 1,359,019,391 Basic Literacy 1,904,000 1,800,000 3,704,000 3,704,000 Post Literacy 1,904,000 1,800,000 3,704,000 126,043,077 Other Mass Education Programs 54,870,782 - 54,870,782 186,450,782 Total Non-Formal 60,582,782 5,400,000 65,982,782 1,801,260,328 Grand Total 628,783,463 7,609,980,101 8,238,763,564 40,531,051,091
Matrix 3.1.2: Financing agents (detail)- PUBLIC SECTOR to Providers by Levels Financing Agents
2015/2016 Public Sector Total
Local Govt
Local Govt Total Provider Level LGC LGEA
Nomadic -- -- -- 0.44% Primary (Lower Basic) 8.38% -- 0.64% 0.13% Jnr_Secondary 11.33% -- 0.87% 0.48% Basic education 32.40% 99.93% 94.77% 23.32% Total Basic 52.12% 99.93% 96.28% 24.36% Basic and Secondary -- -- -- 10.63% Snr_Secondary 14.78% -- 1.13% 3.77% Secondary 1.00% -- 0.08% 14.81% Total Secondary 15.78% -- 1.20% 18.57% Special Needs 2.18% -- 0.17% 0.03% Gifted & Talented -- -- -- -- Total Special Education 2.18% -- 0.17% 0.03% Tertiary 20.29% -- 1.55% 41.95% Total Formal 90.37% 99.93% 99.20% 95.56% Basic & Post Basic 0.30% 0.02% 0.04% 0.31% IQTE -- -- -- 3.35% Basic Literacy 0.30% 0.02% 0.04% 0.01% Post Literacy 0.30% 0.02% 0.04% 0.31% Other Mass Education Programs 8.73% -- 0.67% 0.46% Total Non-Formal 9.63% 0.07% 0.80% 4.44% Grand Total 100.00% 100.00% 100.00% 100.00%
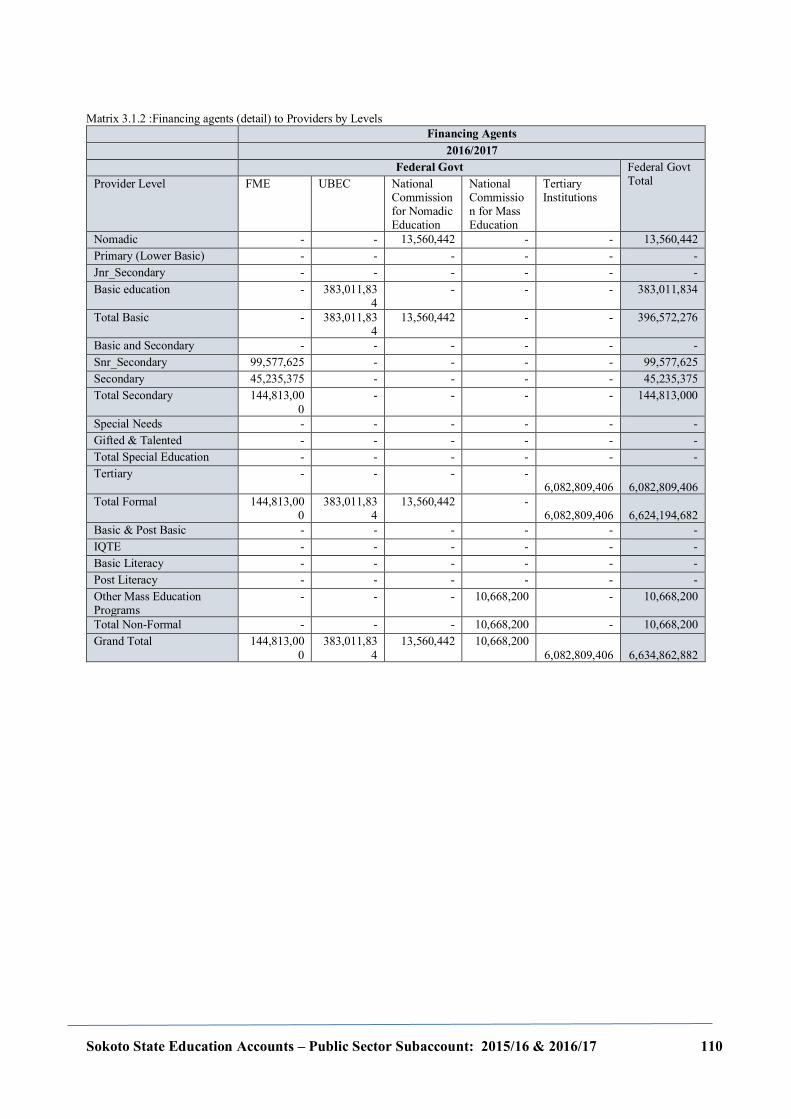
Sokoto State Education Accounts – Public Sector Subaccount: 2015/16 & 2016/17 110
Matrix 3.1.2 :Financing agents (detail) to Providers by Levels Financing Agents
2016/2017 Federal Govt Federal Govt
Total Provider Level FME UBEC National Commission for Nomadic Education
National Commission for Mass Education
Tertiary Institutions
Nomadic - - 13,560,442 - - 13,560,442 Primary (Lower Basic) - - - - - - Jnr_Secondary - - - - - - Basic education - 383,011,83
4 - - - 383,011,834
Total Basic - 383,011,834
13,560,442 - - 396,572,276
Basic and Secondary - - - - - - Snr_Secondary 99,577,625 - - - - 99,577,625 Secondary 45,235,375 - - - - 45,235,375 Total Secondary 144,813,00
0 - - - - 144,813,000
Special Needs - - - - - - Gifted & Talented - - - - - - Total Special Education - - - - - - Tertiary - - - -
6,082,809,406
6,082,809,406 Total Formal 144,813,00
0 383,011,83
4 13,560,442 -
6,082,809,406
6,624,194,682 Basic & Post Basic - - - - - - IQTE - - - - - - Basic Literacy - - - - - - Post Literacy - - - - - - Other Mass Education Programs
- - - 10,668,200 - 10,668,200
Total Non-Formal - - - 10,668,200 - 10,668,200 Grand Total 144,813,00
0 383,011,83
4 13,560,442 10,668,200
6,082,809,406
6,634,862,882
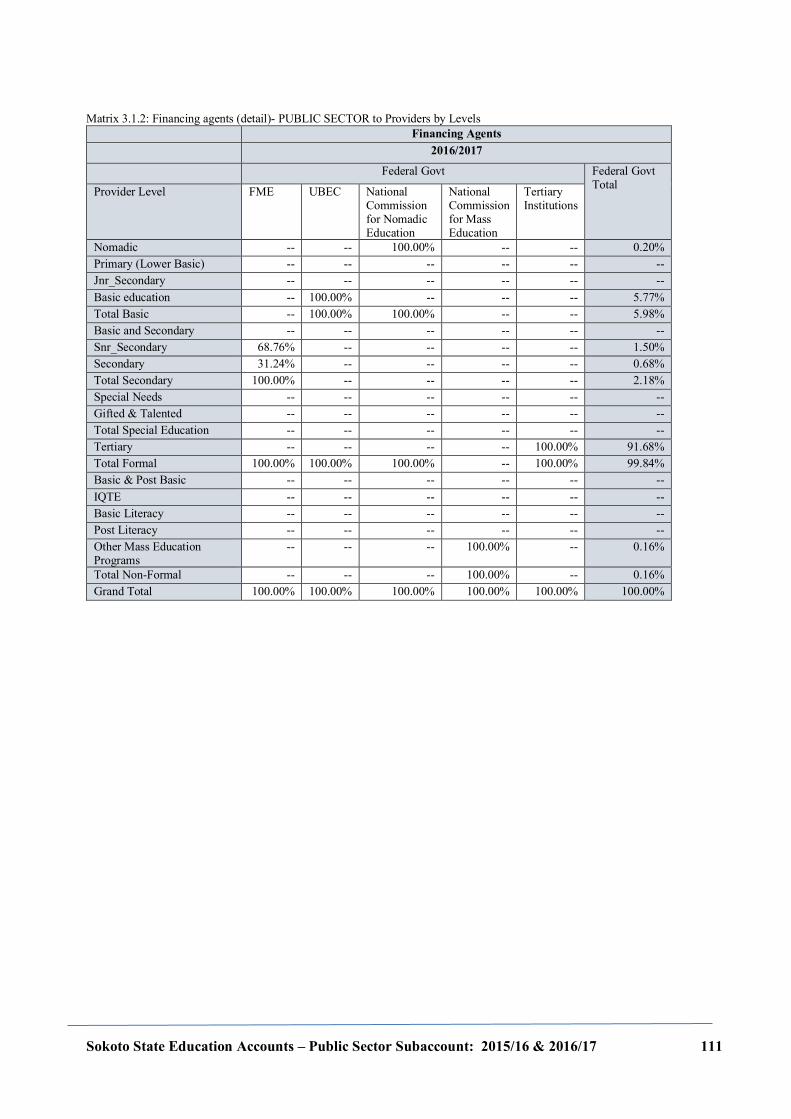
Sokoto State Education Accounts – Public Sector Subaccount: 2015/16 & 2016/17 111
Matrix 3.1.2: Financing agents (detail)- PUBLIC SECTOR to Providers by Levels Financing Agents
2016/2017
Federal Govt Federal Govt Total Provider Level FME UBEC National
Commission for Nomadic Education
National Commission for Mass Education
Tertiary Institutions
Nomadic -- -- 100.00% -- -- 0.20% Primary (Lower Basic) -- -- -- -- -- -- Jnr_Secondary -- -- -- -- -- -- Basic education -- 100.00% -- -- -- 5.77% Total Basic -- 100.00% 100.00% -- -- 5.98% Basic and Secondary -- -- -- -- -- -- Snr_Secondary 68.76% -- -- -- -- 1.50% Secondary 31.24% -- -- -- -- 0.68% Total Secondary 100.00% -- -- -- -- 2.18% Special Needs -- -- -- -- -- -- Gifted & Talented -- -- -- -- -- -- Total Special Education -- -- -- -- -- -- Tertiary -- -- -- -- 100.00% 91.68% Total Formal 100.00% 100.00% 100.00% -- 100.00% 99.84% Basic & Post Basic -- -- -- -- -- -- IQTE -- -- -- -- -- -- Basic Literacy -- -- -- -- -- -- Post Literacy -- -- -- -- -- -- Other Mass Education Programs
-- -- -- 100.00% -- 0.16%
Total Non-Formal -- -- -- 100.00% -- 0.16% Grand Total 100.00% 100.00% 100.00% 100.00% 100.00% 100.00%
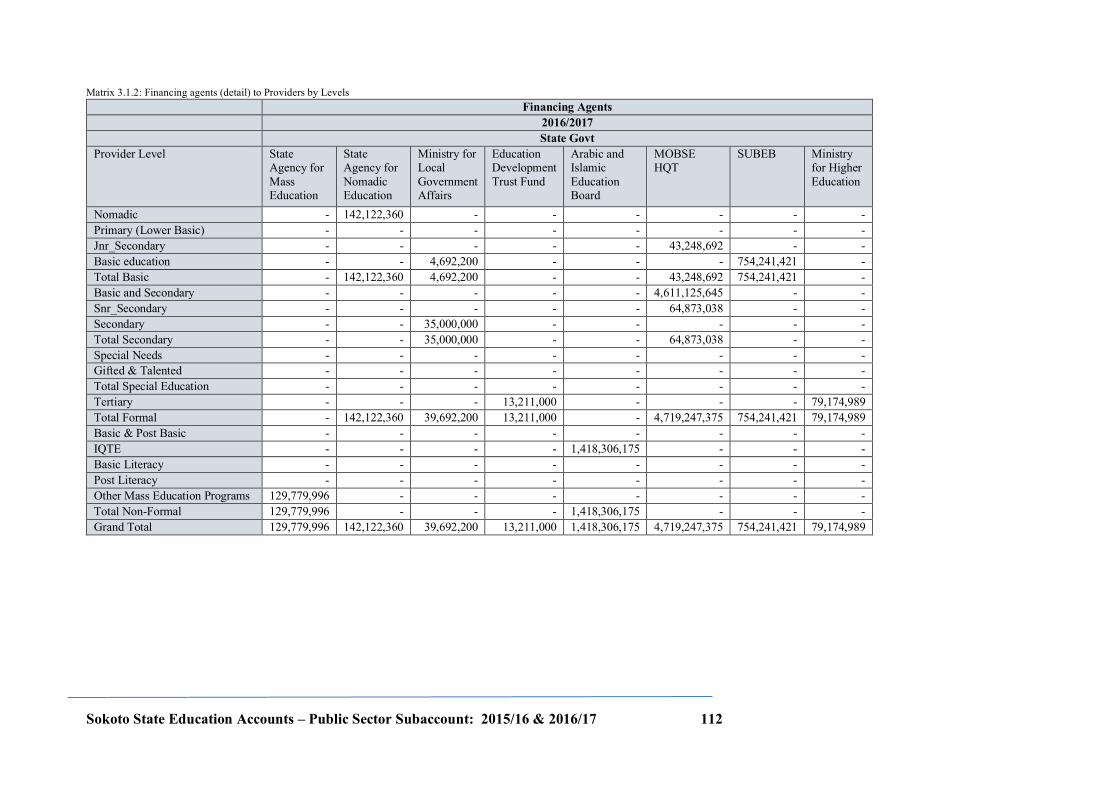
Sokoto State Education Accounts – Public Sector Subaccount: 2015/16 & 2016/17 112
Matrix 3.1.2: Financing agents (detail) to Providers by Levels Financing Agents
2016/2017 State Govt
Provider Level State Agency for Mass Education
State Agency for Nomadic Education
Ministry for Local Government Affairs
Education Development Trust Fund
Arabic and Islamic Education Board
MOBSE HQT
SUBEB Ministry for Higher Education
Nomadic - 142,122,360 - - - - - - Primary (Lower Basic) - - - - - - - - Jnr_Secondary - - - - - 43,248,692 - - Basic education - - 4,692,200 - - - 754,241,421 - Total Basic - 142,122,360 4,692,200 - - 43,248,692 754,241,421 - Basic and Secondary - - - - - 4,611,125,645 - - Snr_Secondary - - - - - 64,873,038 - - Secondary - - 35,000,000 - - - - - Total Secondary - - 35,000,000 - - 64,873,038 - - Special Needs - - - - - - - - Gifted & Talented - - - - - - - - Total Special Education - - - - - - - - Tertiary - - - 13,211,000 - - - 79,174,989 Total Formal - 142,122,360 39,692,200 13,211,000 - 4,719,247,375 754,241,421 79,174,989 Basic & Post Basic - - - - - - - - IQTE - - - - 1,418,306,175 - - - Basic Literacy - - - - - - - - Post Literacy - - - - - - - - Other Mass Education Programs 129,779,996 - - - - - - - Total Non-Formal 129,779,996 - - - 1,418,306,175 - - - Grand Total 129,779,996 142,122,360 39,692,200 13,211,000 1,418,306,175 4,719,247,375 754,241,421 79,174,989
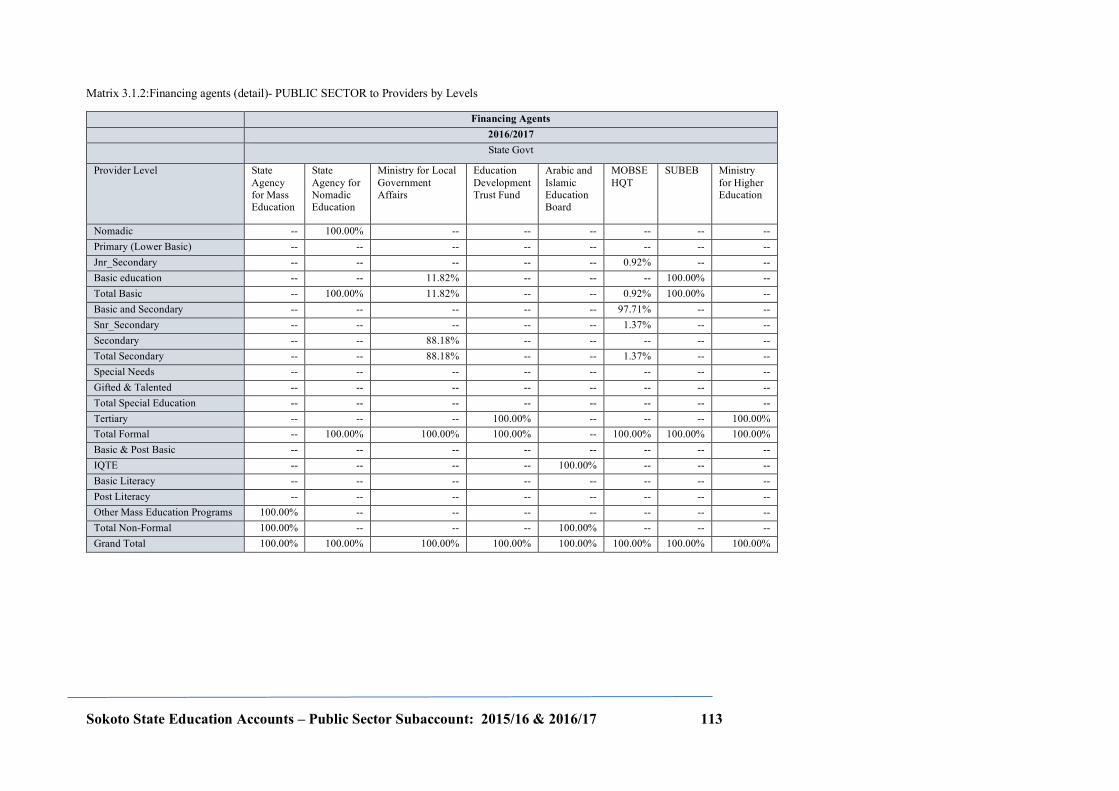
Sokoto State Education Accounts – Public Sector Subaccount: 2015/16 & 2016/17 113
Matrix 3.1.2:Financing agents (detail)- PUBLIC SECTOR to Providers by Levels
Financing Agents 2016/2017 State Govt
Provider Level State Agency for Mass Education
State Agency for Nomadic Education
Ministry for Local Government Affairs
Education Development Trust Fund
Arabic and Islamic Education Board
MOBSE HQT
SUBEB Ministry for Higher Education
Nomadic -- 100.00% -- -- -- -- -- -- Primary (Lower Basic) -- -- -- -- -- -- -- -- Jnr_Secondary -- -- -- -- -- 0.92% -- -- Basic education -- -- 11.82% -- -- -- 100.00% -- Total Basic -- 100.00% 11.82% -- -- 0.92% 100.00% -- Basic and Secondary -- -- -- -- -- 97.71% -- -- Snr_Secondary -- -- -- -- -- 1.37% -- -- Secondary -- -- 88.18% -- -- -- -- -- Total Secondary -- -- 88.18% -- -- 1.37% -- -- Special Needs -- -- -- -- -- -- -- -- Gifted & Talented -- -- -- -- -- -- -- -- Total Special Education -- -- -- -- -- -- -- -- Tertiary -- -- -- 100.00% -- -- -- 100.00% Total Formal -- 100.00% 100.00% 100.00% -- 100.00% 100.00% 100.00% Basic & Post Basic -- -- -- -- -- -- -- -- IQTE -- -- -- -- 100.00% -- -- -- Basic Literacy -- -- -- -- -- -- -- -- Post Literacy -- -- -- -- -- -- -- -- Other Mass Education Programs 100.00% -- -- -- -- -- -- -- Total Non-Formal 100.00% -- -- -- 100.00% -- -- -- Grand Total 100.00% 100.00% 100.00% 100.00% 100.00% 100.00% 100.00% 100.00%
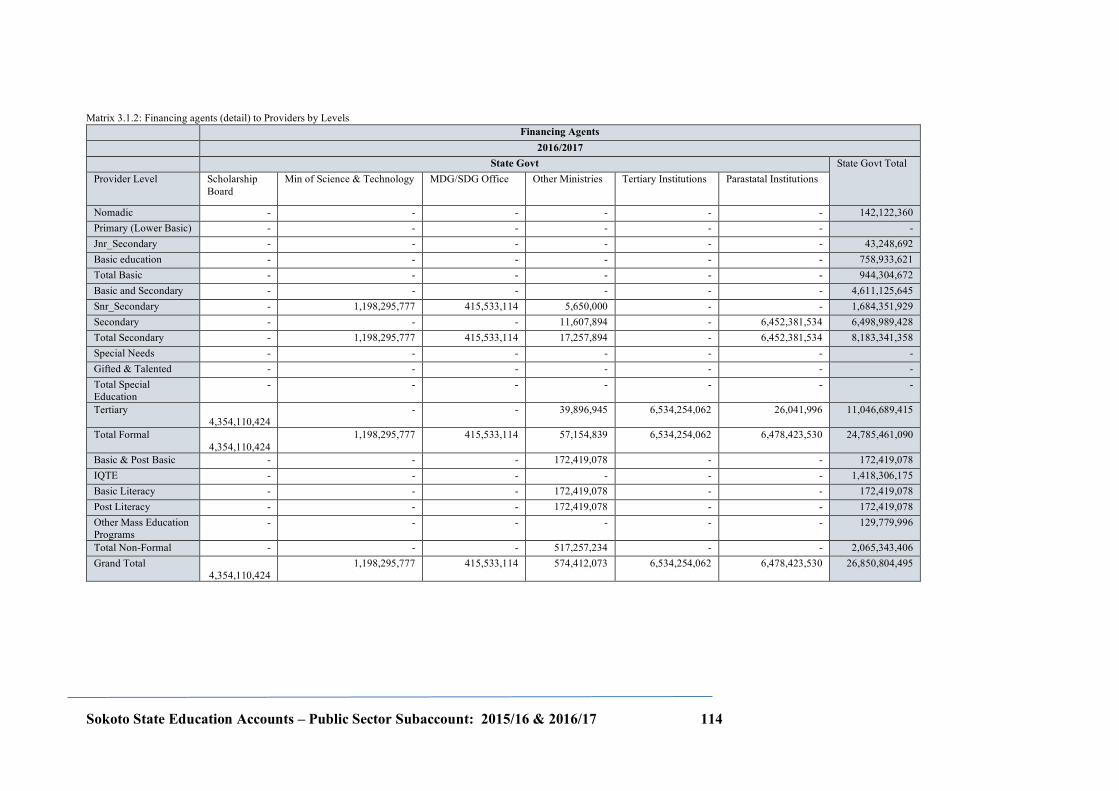
Sokoto State Education Accounts – Public Sector Subaccount: 2015/16 & 2016/17 114
Matrix 3.1.2: Financing agents (detail) to Providers by Levels Financing Agents
2016/2017 State Govt State Govt Total
Provider Level Scholarship Board
Min of Science & Technology MDG/SDG Office Other Ministries Tertiary Institutions Parastatal Institutions
Nomadic - - - - - - 142,122,360 Primary (Lower Basic) - - - - - - - Jnr_Secondary - - - - - - 43,248,692 Basic education - - - - - - 758,933,621 Total Basic - - - - - - 944,304,672 Basic and Secondary - - - - - - 4,611,125,645 Snr_Secondary - 1,198,295,777 415,533,114 5,650,000 - - 1,684,351,929 Secondary - - - 11,607,894 - 6,452,381,534 6,498,989,428 Total Secondary - 1,198,295,777 415,533,114 17,257,894 - 6,452,381,534 8,183,341,358 Special Needs - - - - - - - Gifted & Talented - - - - - - - Total Special Education
- - - - - - -
Tertiary 4,354,110,424
- - 39,896,945 6,534,254,062 26,041,996 11,046,689,415
Total Formal 4,354,110,424
1,198,295,777 415,533,114 57,154,839 6,534,254,062 6,478,423,530 24,785,461,090
Basic & Post Basic - - - 172,419,078 - - 172,419,078 IQTE - - - - - - 1,418,306,175 Basic Literacy - - - 172,419,078 - - 172,419,078 Post Literacy - - - 172,419,078 - - 172,419,078 Other Mass Education Programs
- - - - - - 129,779,996
Total Non-Formal - - - 517,257,234 - - 2,065,343,406 Grand Total
4,354,110,424 1,198,295,777 415,533,114 574,412,073 6,534,254,062 6,478,423,530 26,850,804,495
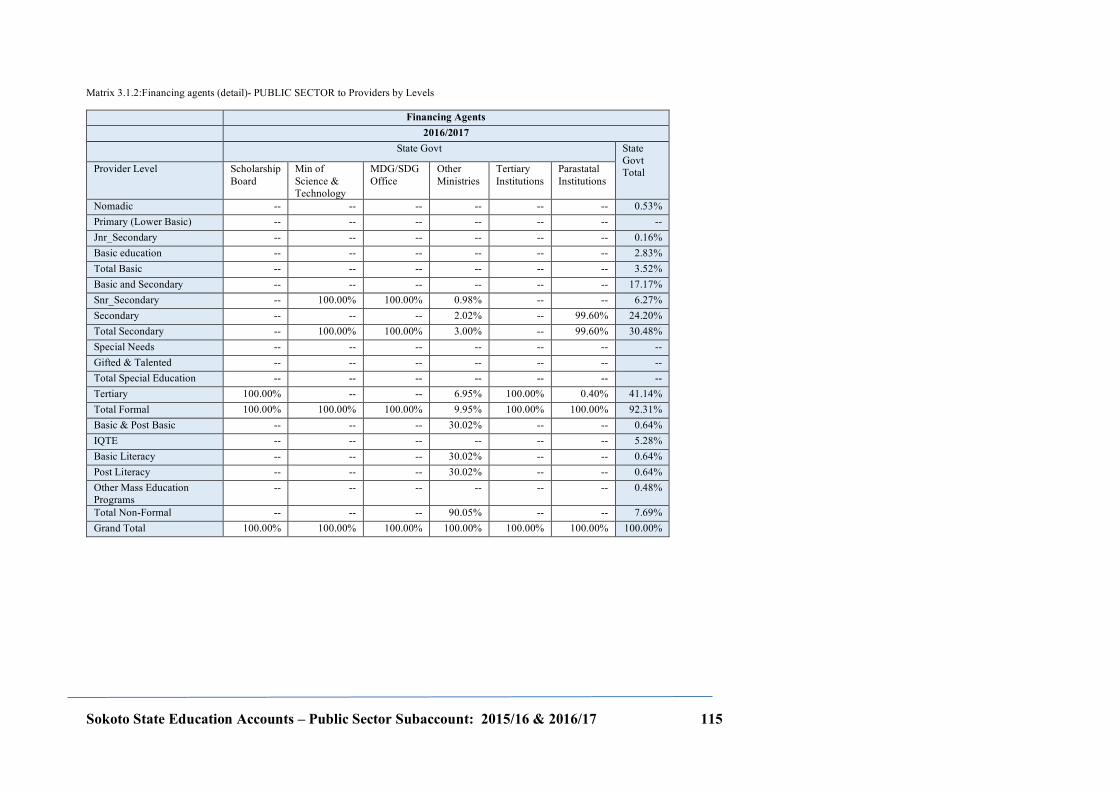
Sokoto State Education Accounts – Public Sector Subaccount: 2015/16 & 2016/17 115
Matrix 3.1.2:Financing agents (detail)- PUBLIC SECTOR to Providers by Levels
Financing Agents 2016/2017
State Govt State Govt Total Provider Level Scholarship
Board Min of Science & Technology
MDG/SDG Office
Other Ministries
Tertiary Institutions
Parastatal Institutions
Nomadic -- -- -- -- -- -- 0.53% Primary (Lower Basic) -- -- -- -- -- -- -- Jnr_Secondary -- -- -- -- -- -- 0.16% Basic education -- -- -- -- -- -- 2.83% Total Basic -- -- -- -- -- -- 3.52% Basic and Secondary -- -- -- -- -- -- 17.17% Snr_Secondary -- 100.00% 100.00% 0.98% -- -- 6.27% Secondary -- -- -- 2.02% -- 99.60% 24.20% Total Secondary -- 100.00% 100.00% 3.00% -- 99.60% 30.48% Special Needs -- -- -- -- -- -- -- Gifted & Talented -- -- -- -- -- -- -- Total Special Education -- -- -- -- -- -- -- Tertiary 100.00% -- -- 6.95% 100.00% 0.40% 41.14% Total Formal 100.00% 100.00% 100.00% 9.95% 100.00% 100.00% 92.31% Basic & Post Basic -- -- -- 30.02% -- -- 0.64% IQTE -- -- -- -- -- -- 5.28% Basic Literacy -- -- -- 30.02% -- -- 0.64% Post Literacy -- -- -- 30.02% -- -- 0.64% Other Mass Education Programs
-- -- -- -- -- -- 0.48%
Total Non-Formal -- -- -- 90.05% -- -- 7.69% Grand Total 100.00% 100.00% 100.00% 100.00% 100.00% 100.00% 100.00%
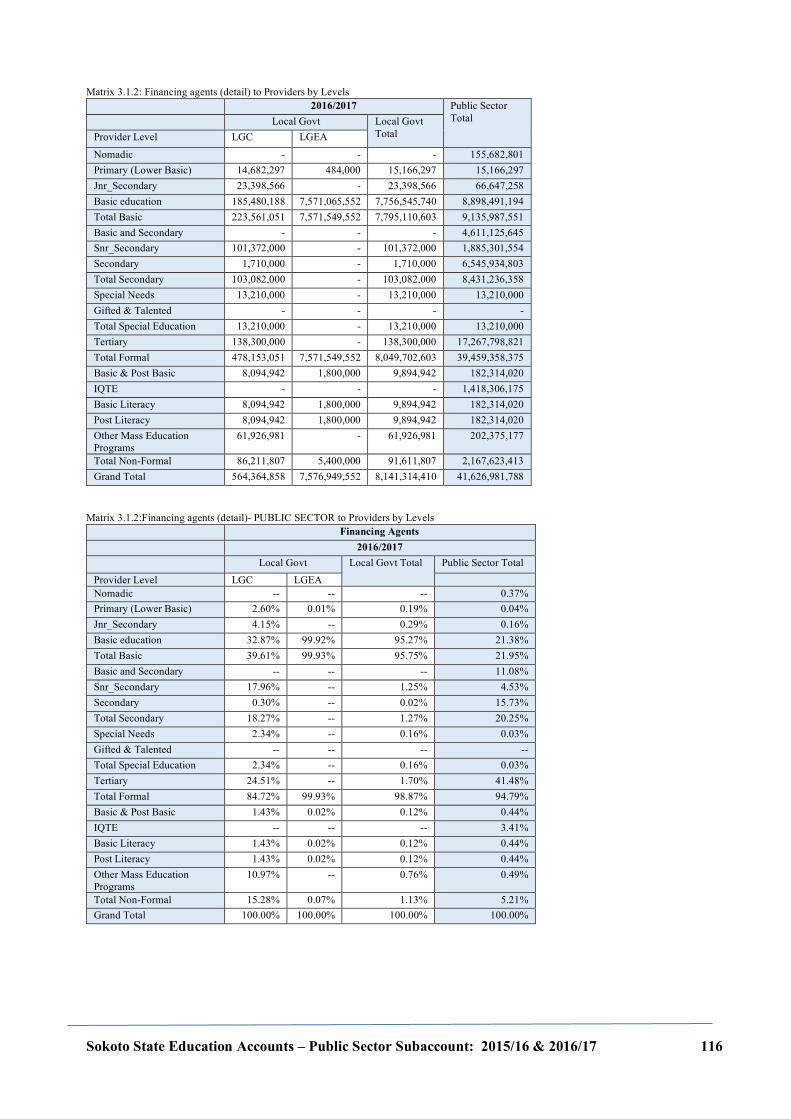
Sokoto State Education Accounts – Public Sector Subaccount: 2015/16 & 2016/17 116
Matrix 3.1.2: Financing agents (detail) to Providers by Levels 2016/2017 Public Sector
Total Local Govt Local Govt
Total Provider Level LGC LGEA
Nomadic - - - 155,682,801 Primary (Lower Basic) 14,682,297 484,000 15,166,297 15,166,297 Jnr_Secondary 23,398,566 - 23,398,566 66,647,258 Basic education 185,480,188 7,571,065,552 7,756,545,740 8,898,491,194 Total Basic 223,561,051 7,571,549,552 7,795,110,603 9,135,987,551 Basic and Secondary - - - 4,611,125,645 Snr_Secondary 101,372,000 - 101,372,000 1,885,301,554 Secondary 1,710,000 - 1,710,000 6,545,934,803 Total Secondary 103,082,000 - 103,082,000 8,431,236,358 Special Needs 13,210,000 - 13,210,000 13,210,000 Gifted & Talented - - - - Total Special Education 13,210,000 - 13,210,000 13,210,000 Tertiary 138,300,000 - 138,300,000 17,267,798,821 Total Formal 478,153,051 7,571,549,552 8,049,702,603 39,459,358,375 Basic & Post Basic 8,094,942 1,800,000 9,894,942 182,314,020 IQTE - - - 1,418,306,175 Basic Literacy 8,094,942 1,800,000 9,894,942 182,314,020 Post Literacy 8,094,942 1,800,000 9,894,942 182,314,020 Other Mass Education Programs
61,926,981 - 61,926,981 202,375,177
Total Non-Formal 86,211,807 5,400,000 91,611,807 2,167,623,413 Grand Total 564,364,858 7,576,949,552 8,141,314,410 41,626,981,788
Matrix 3.1.2:Financing agents (detail)- PUBLIC SECTOR to Providers by Levels Financing Agents
2016/2017 Local Govt Local Govt Total Public Sector Total
Provider Level LGC LGEA
Nomadic -- -- -- 0.37% Primary (Lower Basic) 2.60% 0.01% 0.19% 0.04% Jnr_Secondary 4.15% -- 0.29% 0.16% Basic education 32.87% 99.92% 95.27% 21.38% Total Basic 39.61% 99.93% 95.75% 21.95% Basic and Secondary -- -- -- 11.08% Snr_Secondary 17.96% -- 1.25% 4.53% Secondary 0.30% -- 0.02% 15.73% Total Secondary 18.27% -- 1.27% 20.25% Special Needs 2.34% -- 0.16% 0.03% Gifted & Talented -- -- -- -- Total Special Education 2.34% -- 0.16% 0.03% Tertiary 24.51% -- 1.70% 41.48% Total Formal 84.72% 99.93% 98.87% 94.79% Basic & Post Basic 1.43% 0.02% 0.12% 0.44% IQTE -- -- -- 3.41% Basic Literacy 1.43% 0.02% 0.12% 0.44% Post Literacy 1.43% 0.02% 0.12% 0.44% Other Mass Education Programs
10.97% -- 0.76% 0.49%
Total Non-Formal 15.28% 0.07% 1.13% 5.21% Grand Total 100.00% 100.00% 100.00% 100.00%
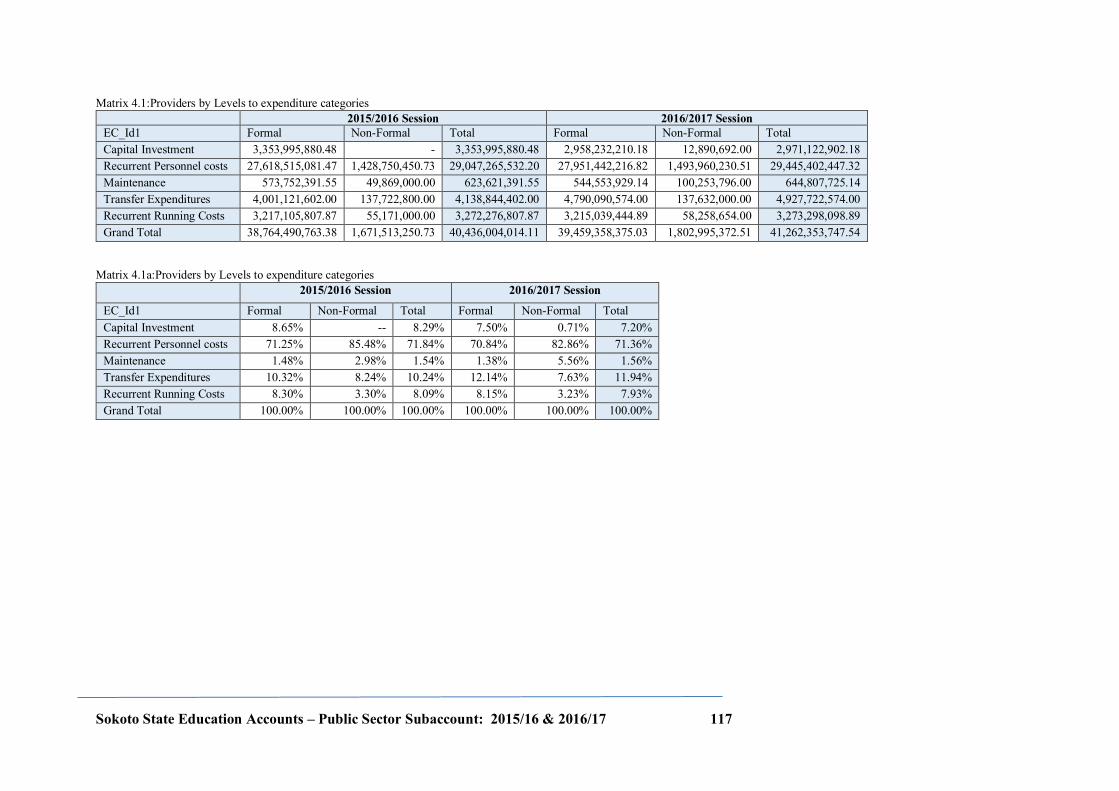
Sokoto State Education Accounts – Public Sector Subaccount: 2015/16 & 2016/17 117
Matrix 4.1:Providers by Levels to expenditure categories 2015/2016 Session 2016/2017 Session
EC_Id1 Formal Non-Formal Total Formal Non-Formal Total Capital Investment 3,353,995,880.48 - 3,353,995,880.48 2,958,232,210.18 12,890,692.00 2,971,122,902.18 Recurrent Personnel costs 27,618,515,081.47 1,428,750,450.73 29,047,265,532.20 27,951,442,216.82 1,493,960,230.51 29,445,402,447.32 Maintenance 573,752,391.55 49,869,000.00 623,621,391.55 544,553,929.14 100,253,796.00 644,807,725.14 Transfer Expenditures 4,001,121,602.00 137,722,800.00 4,138,844,402.00 4,790,090,574.00 137,632,000.00 4,927,722,574.00 Recurrent Running Costs 3,217,105,807.87 55,171,000.00 3,272,276,807.87 3,215,039,444.89 58,258,654.00 3,273,298,098.89 Grand Total 38,764,490,763.38 1,671,513,250.73 40,436,004,014.11 39,459,358,375.03 1,802,995,372.51 41,262,353,747.54
Matrix 4.1a:Providers by Levels to expenditure categories 2015/2016 Session 2016/2017 Session
EC_Id1 Formal Non-Formal Total Formal Non-Formal Total Capital Investment 8.65% -- 8.29% 7.50% 0.71% 7.20% Recurrent Personnel costs 71.25% 85.48% 71.84% 70.84% 82.86% 71.36% Maintenance 1.48% 2.98% 1.54% 1.38% 5.56% 1.56% Transfer Expenditures 10.32% 8.24% 10.24% 12.14% 7.63% 11.94% Recurrent Running Costs 8.30% 3.30% 8.09% 8.15% 3.23% 7.93% Grand Total 100.00% 100.00% 100.00% 100.00% 100.00% 100.00%
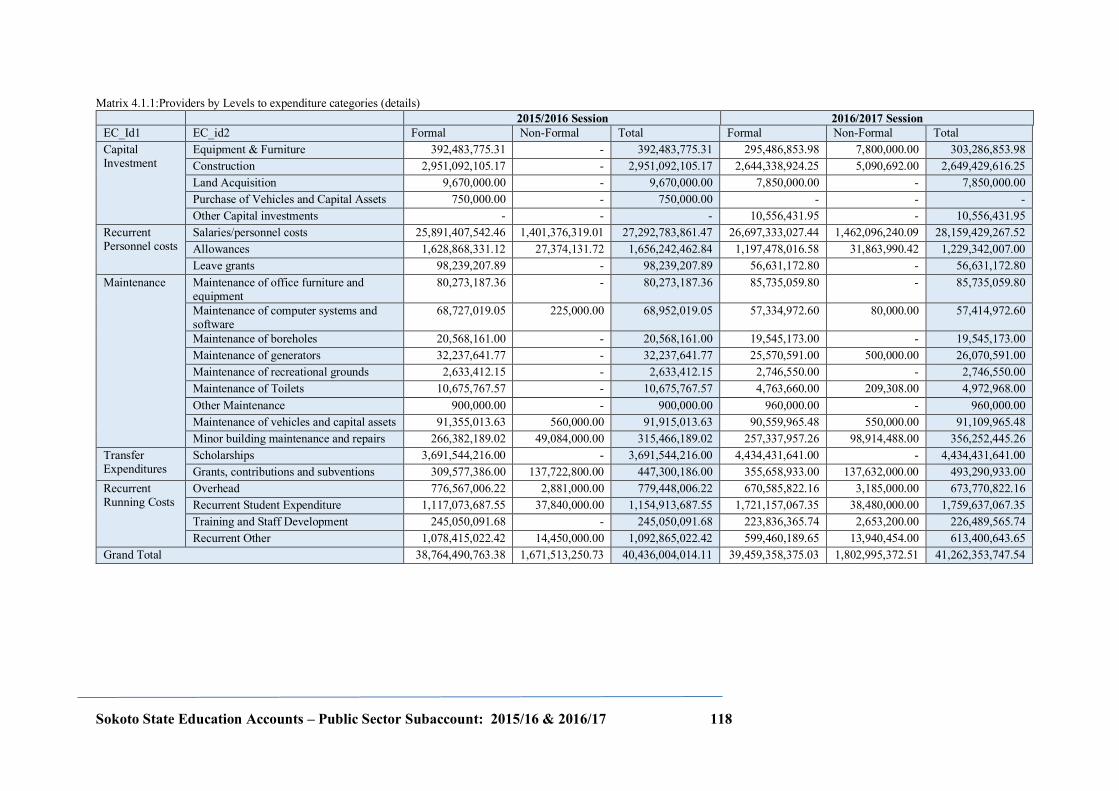
Sokoto State Education Accounts – Public Sector Subaccount: 2015/16 & 2016/17 118
Matrix 4.1.1:Providers by Levels to expenditure categories (details) 2015/2016 Session 2016/2017 Session
EC_Id1 EC_id2 Formal Non-Formal Total Formal Non-Formal Total Capital Investment
Equipment & Furniture 392,483,775.31 - 392,483,775.31 295,486,853.98 7,800,000.00 303,286,853.98 Construction 2,951,092,105.17 - 2,951,092,105.17 2,644,338,924.25 5,090,692.00 2,649,429,616.25 Land Acquisition 9,670,000.00 - 9,670,000.00 7,850,000.00 - 7,850,000.00 Purchase of Vehicles and Capital Assets 750,000.00 - 750,000.00 - - - Other Capital investments - - - 10,556,431.95 - 10,556,431.95
Recurrent Personnel costs
Salaries/personnel costs 25,891,407,542.46 1,401,376,319.01 27,292,783,861.47 26,697,333,027.44 1,462,096,240.09 28,159,429,267.52 Allowances 1,628,868,331.12 27,374,131.72 1,656,242,462.84 1,197,478,016.58 31,863,990.42 1,229,342,007.00 Leave grants 98,239,207.89 - 98,239,207.89 56,631,172.80 - 56,631,172.80
Maintenance Maintenance of office furniture and equipment
80,273,187.36 - 80,273,187.36 85,735,059.80 - 85,735,059.80
Maintenance of computer systems and software
68,727,019.05 225,000.00 68,952,019.05 57,334,972.60 80,000.00 57,414,972.60
Maintenance of boreholes 20,568,161.00 - 20,568,161.00 19,545,173.00 - 19,545,173.00 Maintenance of generators 32,237,641.77 - 32,237,641.77 25,570,591.00 500,000.00 26,070,591.00 Maintenance of recreational grounds 2,633,412.15 - 2,633,412.15 2,746,550.00 - 2,746,550.00 Maintenance of Toilets 10,675,767.57 - 10,675,767.57 4,763,660.00 209,308.00 4,972,968.00 Other Maintenance 900,000.00 - 900,000.00 960,000.00 - 960,000.00 Maintenance of vehicles and capital assets 91,355,013.63 560,000.00 91,915,013.63 90,559,965.48 550,000.00 91,109,965.48 Minor building maintenance and repairs 266,382,189.02 49,084,000.00 315,466,189.02 257,337,957.26 98,914,488.00 356,252,445.26
Transfer Expenditures
Scholarships 3,691,544,216.00 - 3,691,544,216.00 4,434,431,641.00 - 4,434,431,641.00 Grants, contributions and subventions 309,577,386.00 137,722,800.00 447,300,186.00 355,658,933.00 137,632,000.00 493,290,933.00
Recurrent Running Costs
Overhead 776,567,006.22 2,881,000.00 779,448,006.22 670,585,822.16 3,185,000.00 673,770,822.16 Recurrent Student Expenditure 1,117,073,687.55 37,840,000.00 1,154,913,687.55 1,721,157,067.35 38,480,000.00 1,759,637,067.35 Training and Staff Development 245,050,091.68 - 245,050,091.68 223,836,365.74 2,653,200.00 226,489,565.74 Recurrent Other 1,078,415,022.42 14,450,000.00 1,092,865,022.42 599,460,189.65 13,940,454.00 613,400,643.65
Grand Total 38,764,490,763.38 1,671,513,250.73 40,436,004,014.11 39,459,358,375.03 1,802,995,372.51 41,262,353,747.54
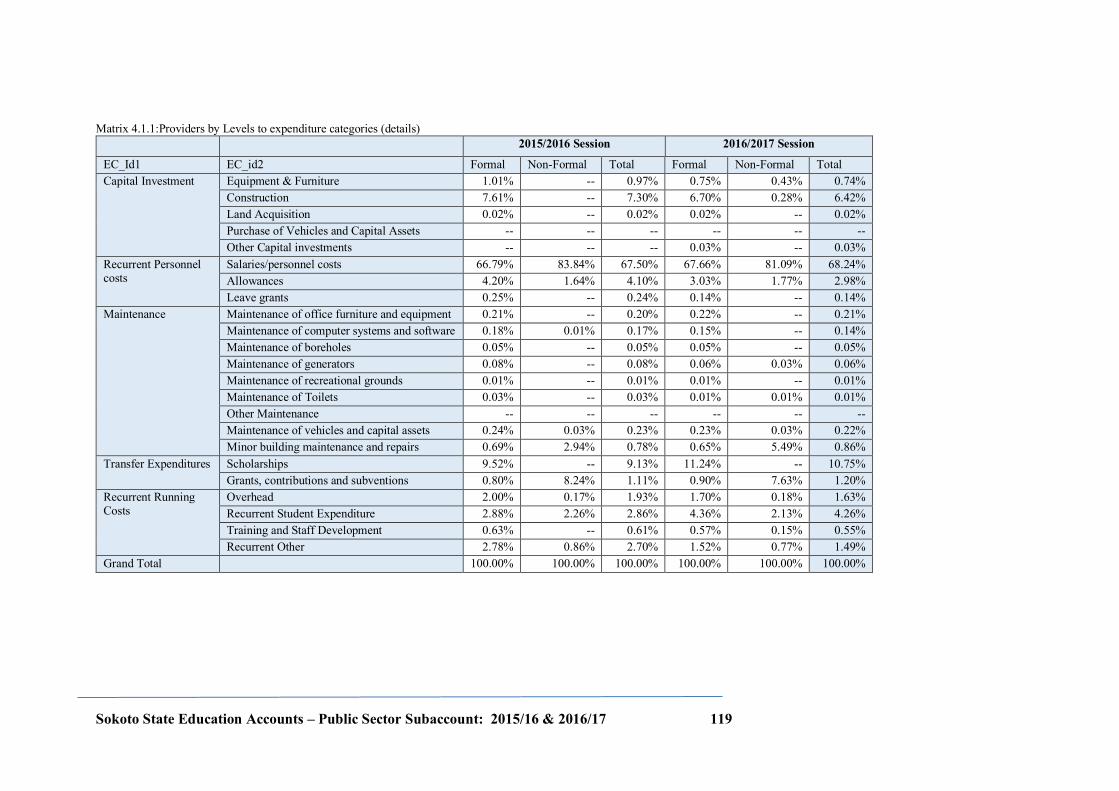
Sokoto State Education Accounts – Public Sector Subaccount: 2015/16 & 2016/17 119
Matrix 4.1.1:Providers by Levels to expenditure categories (details) 2015/2016 Session 2016/2017 Session
EC_Id1 EC_id2 Formal Non-Formal Total Formal Non-Formal Total Capital Investment Equipment & Furniture 1.01% -- 0.97% 0.75% 0.43% 0.74%
Construction 7.61% -- 7.30% 6.70% 0.28% 6.42% Land Acquisition 0.02% -- 0.02% 0.02% -- 0.02% Purchase of Vehicles and Capital Assets -- -- -- -- -- -- Other Capital investments -- -- -- 0.03% -- 0.03%
Recurrent Personnel costs
Salaries/personnel costs 66.79% 83.84% 67.50% 67.66% 81.09% 68.24% Allowances 4.20% 1.64% 4.10% 3.03% 1.77% 2.98% Leave grants 0.25% -- 0.24% 0.14% -- 0.14%
Maintenance Maintenance of office furniture and equipment 0.21% -- 0.20% 0.22% -- 0.21% Maintenance of computer systems and software 0.18% 0.01% 0.17% 0.15% -- 0.14% Maintenance of boreholes 0.05% -- 0.05% 0.05% -- 0.05% Maintenance of generators 0.08% -- 0.08% 0.06% 0.03% 0.06% Maintenance of recreational grounds 0.01% -- 0.01% 0.01% -- 0.01% Maintenance of Toilets 0.03% -- 0.03% 0.01% 0.01% 0.01% Other Maintenance -- -- -- -- -- -- Maintenance of vehicles and capital assets 0.24% 0.03% 0.23% 0.23% 0.03% 0.22% Minor building maintenance and repairs 0.69% 2.94% 0.78% 0.65% 5.49% 0.86%
Transfer Expenditures Scholarships 9.52% -- 9.13% 11.24% -- 10.75% Grants, contributions and subventions 0.80% 8.24% 1.11% 0.90% 7.63% 1.20%
Recurrent Running Costs
Overhead 2.00% 0.17% 1.93% 1.70% 0.18% 1.63% Recurrent Student Expenditure 2.88% 2.26% 2.86% 4.36% 2.13% 4.26% Training and Staff Development 0.63% -- 0.61% 0.57% 0.15% 0.55% Recurrent Other 2.78% 0.86% 2.70% 1.52% 0.77% 1.49%
Grand Total
100.00% 100.00% 100.00% 100.00% 100.00% 100.00%
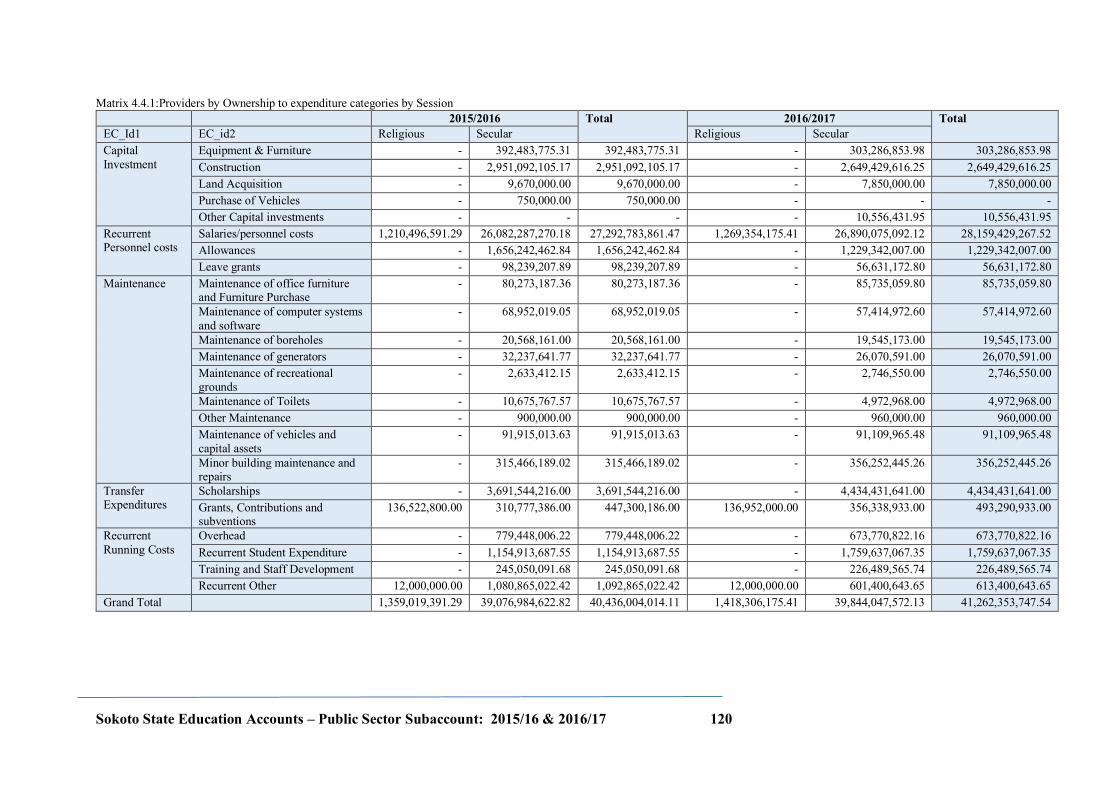
Sokoto State Education Accounts – Public Sector Subaccount: 2015/16 & 2016/17 120
Matrix 4.4.1:Providers by Ownership to expenditure categories by Session 2015/2016 Total 2016/2017 Total
EC_Id1 EC_id2 Religious Secular Religious Secular Capital Investment
Equipment & Furniture - 392,483,775.31 392,483,775.31 - 303,286,853.98 303,286,853.98 Construction - 2,951,092,105.17 2,951,092,105.17 - 2,649,429,616.25 2,649,429,616.25 Land Acquisition - 9,670,000.00 9,670,000.00 - 7,850,000.00 7,850,000.00 Purchase of Vehicles - 750,000.00 750,000.00 - - - Other Capital investments - - - - 10,556,431.95 10,556,431.95
Recurrent Personnel costs
Salaries/personnel costs 1,210,496,591.29 26,082,287,270.18 27,292,783,861.47 1,269,354,175.41 26,890,075,092.12 28,159,429,267.52 Allowances - 1,656,242,462.84 1,656,242,462.84 - 1,229,342,007.00 1,229,342,007.00 Leave grants - 98,239,207.89 98,239,207.89 - 56,631,172.80 56,631,172.80
Maintenance Maintenance of office furniture and Furniture Purchase
- 80,273,187.36 80,273,187.36 - 85,735,059.80 85,735,059.80
Maintenance of computer systems and software
- 68,952,019.05 68,952,019.05 - 57,414,972.60 57,414,972.60
Maintenance of boreholes - 20,568,161.00 20,568,161.00 - 19,545,173.00 19,545,173.00 Maintenance of generators - 32,237,641.77 32,237,641.77 - 26,070,591.00 26,070,591.00 Maintenance of recreational grounds
- 2,633,412.15 2,633,412.15 - 2,746,550.00 2,746,550.00
Maintenance of Toilets - 10,675,767.57 10,675,767.57 - 4,972,968.00 4,972,968.00 Other Maintenance - 900,000.00 900,000.00 - 960,000.00 960,000.00 Maintenance of vehicles and capital assets
- 91,915,013.63 91,915,013.63 - 91,109,965.48 91,109,965.48
Minor building maintenance and repairs
- 315,466,189.02 315,466,189.02 - 356,252,445.26 356,252,445.26
Transfer Expenditures
Scholarships - 3,691,544,216.00 3,691,544,216.00 - 4,434,431,641.00 4,434,431,641.00 Grants, Contributions and subventions
136,522,800.00 310,777,386.00 447,300,186.00 136,952,000.00 356,338,933.00 493,290,933.00
Recurrent Running Costs
Overhead - 779,448,006.22 779,448,006.22 - 673,770,822.16 673,770,822.16 Recurrent Student Expenditure - 1,154,913,687.55 1,154,913,687.55 - 1,759,637,067.35 1,759,637,067.35 Training and Staff Development - 245,050,091.68 245,050,091.68 - 226,489,565.74 226,489,565.74 Recurrent Other 12,000,000.00 1,080,865,022.42 1,092,865,022.42 12,000,000.00 601,400,643.65 613,400,643.65
Grand Total
1,359,019,391.29 39,076,984,622.82 40,436,004,014.11 1,418,306,175.41 39,844,047,572.13 41,262,353,747.54
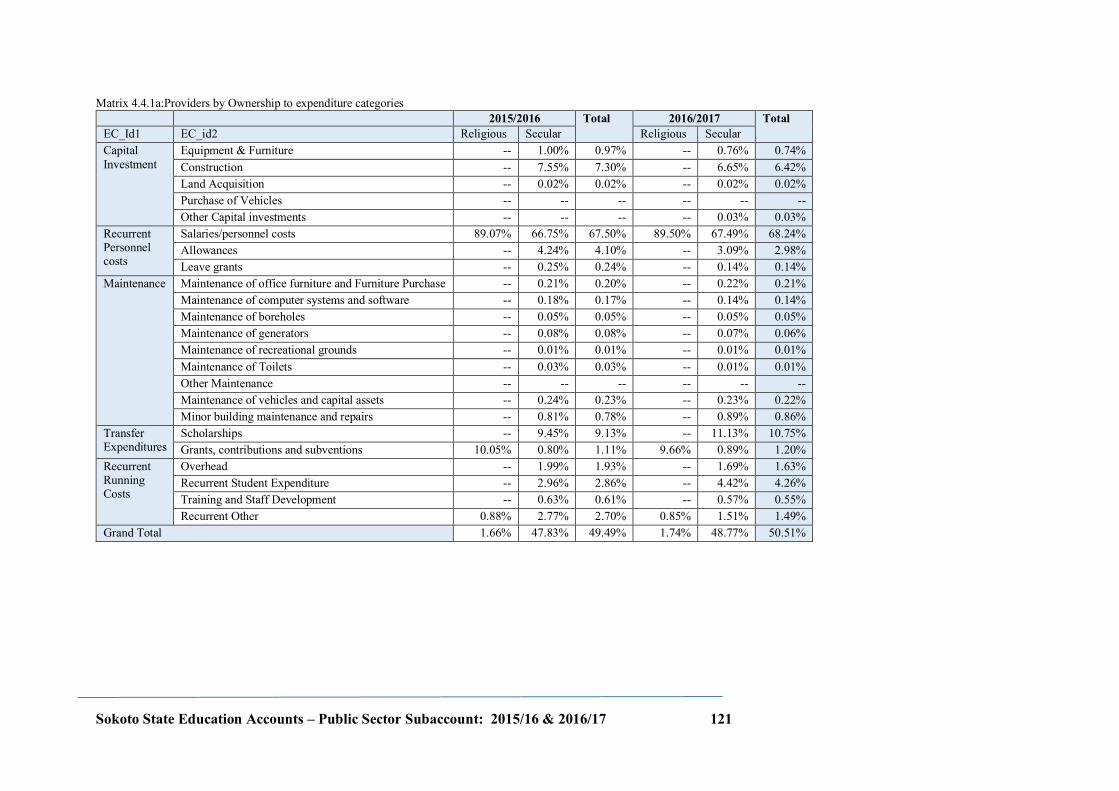
Sokoto State Education Accounts – Public Sector Subaccount: 2015/16 & 2016/17 121
Matrix 4.4.1a:Providers by Ownership to expenditure categories 2015/2016 Total 2016/2017 Total
EC_Id1 EC_id2 Religious Secular Religious Secular Capital Investment
Equipment & Furniture -- 1.00% 0.97% -- 0.76% 0.74% Construction -- 7.55% 7.30% -- 6.65% 6.42% Land Acquisition -- 0.02% 0.02% -- 0.02% 0.02% Purchase of Vehicles -- -- -- -- -- -- Other Capital investments -- -- -- -- 0.03% 0.03%
Recurrent Personnel costs
Salaries/personnel costs 89.07% 66.75% 67.50% 89.50% 67.49% 68.24% Allowances -- 4.24% 4.10% -- 3.09% 2.98% Leave grants -- 0.25% 0.24% -- 0.14% 0.14%
Maintenance Maintenance of office furniture and Furniture Purchase -- 0.21% 0.20% -- 0.22% 0.21% Maintenance of computer systems and software -- 0.18% 0.17% -- 0.14% 0.14% Maintenance of boreholes -- 0.05% 0.05% -- 0.05% 0.05% Maintenance of generators -- 0.08% 0.08% -- 0.07% 0.06% Maintenance of recreational grounds -- 0.01% 0.01% -- 0.01% 0.01% Maintenance of Toilets -- 0.03% 0.03% -- 0.01% 0.01% Other Maintenance -- -- -- -- -- -- Maintenance of vehicles and capital assets -- 0.24% 0.23% -- 0.23% 0.22% Minor building maintenance and repairs -- 0.81% 0.78% -- 0.89% 0.86%
Transfer Expenditures
Scholarships -- 9.45% 9.13% -- 11.13% 10.75% Grants, contributions and subventions 10.05% 0.80% 1.11% 9.66% 0.89% 1.20%
Recurrent Running Costs
Overhead -- 1.99% 1.93% -- 1.69% 1.63% Recurrent Student Expenditure -- 2.96% 2.86% -- 4.42% 4.26% Training and Staff Development -- 0.63% 0.61% -- 0.57% 0.55% Recurrent Other 0.88% 2.77% 2.70% 0.85% 1.51% 1.49%
Grand Total 1.66% 47.83% 49.49% 1.74% 48.77% 50.51%
Related Documents