Variability of Electroluminescent Displays
By
C. Michael Shedd & Nathan Ostrout
Graphic Communication Department
College of Liberal Arts
California Polytechnic State University
2011

APPROVAL PAGE
TITLE: Variability of electroluminescent Displays
AUTHOR: C. Michael Shedd & Nathan Ostrout
DATE SUBMITTED: June 2011
Professor Xiaoying Rong, Senior Project Advisor __________________________________

Variability of Electroluminescent Displays—3
Acknowledgements
The completion of this senior project was made possible through the generous donations of
time, energy and financial resources. A special thank you to the California Polytechnic State University
Graphic Communication faculty who prepared us over the past three years to apply the knowledge and
skills we have learned through our education towards the testing and writing of these five chapters.
To Professor Xiaoying Rong who spent countless hours guiding us through this project, helping
us grow as students and insuring we smiled every step of the way. To Professor Nancy Cullins who
encouraged us in the early phases of this project and lent us her extensive understanding of the graphic
communication industry, particularly screen printing. We would like to extend a special thank you to
the Graphic Communication Department at Cal Poly and to Gwent Group for donating equipment and
supplies for all of the testing. Last, but not least, thank you to my senior project partner and friend for
making this process an enjoyable experience.
Variability of Electroluminescent Displays—4
Table of Contents
Chapter I — Introduction ........................................................................................................................................ 5
Chapter II — Literature Review ............................................................................................................................. 7
Chapter III — Research Methods and Procedures...........................................................................................12
Chapter IV — Results .............................................................................................................................................17
Chapter V — Conclusions .....................................................................................................................................36
Appendices ................................................................................................................................................................40
Appendix A — Benchmark Test Table .................................................................................................40
Appendix B — Benchmark Test “Cal Poly” Wordmark ....................................................................41
Appendix C— Comprehensive Test “CP” Workmark ......................................................................42

Variability of Electroluminescent Displays—5
Chapter 1—Introduction
Consumer product companies are demanding new and innovative print solutions to increase
sales and compete with the vast amount of advertisements pleading for the attention of consumers.
Electroluminescent (EL) printing is one solution to this growing demand for more effective marketing
collateral. Electroluminescent displays create a kinetic visual element by lighting up. These displays
are useful in such instances where brightness, high contrast and a wide angle of view are required.
Electroluminescent printing combines the features of both traditional graphic printing and EL inks for
the production of commercial prints, products, and packaging that illuminate (Hart, 2010).
EL displays, by a large part, are produced by screen printing several layers of functional inks.
While screen printing has traditionally been used for graphic imaging processes, awareness of the
process’ functional printing uses has introduced it to the EL printing segment. Screen printing, currently
the optimal print choice for EL displays, have many variables, which arise from the nature of this process,
both which promote and inhibit the performance of functional ink layers. The effects that these variables
have on printing EL displays will need to be analyzed to make constructive improvements for all
applications.
This study asks: how does the screen printing variables affect efficiency of electroluminescent
displays? Based on previous studies and research, traditional screen printing methods are adequate
for obtaining desired results for different functional layers in electroluminescent displays . Squeegee
pressure, printing speed, emulsion thickness, and screen mesh count are all variables that are involved
in screen printing and need to be quantified in order to determine optimal operational conditions.
Furthermore, printed functional ink film variables need to be examined for their effect on the display.
These variables include surface uniformity, thickness, and printing processes (e.g. wet over wet method
or wet ink on dry method). In order to understand optimal printing characteristics for efficient current

Variability of Electroluminescent Displays—6
conduction and illumination of a display, this study attempted to control human errors during operation
that might lead to additional printing related variables. As a result, an automated screen printer was used.
The enhancements of the screen printing processes were key for printing fine detail work and in the end
aided to the success of printing electroluminescent displays.
The purpose of this study was to optimize the screen printing process pertaining to the printing
of electroluminescent displays. Printed electronics is a fairly new concept in the graphic communication
industry and to date has only been employed by a limited number of professionals. Therefore, this
research study was conducted to identify optimal processes for screen printing electroluminescent
displays. The research was intended to help understand how printed electronics could be printed with
conventional screen printing.
Variability of Electroluminescent Displays—7
Chapter 2 —Literature Review
There are two main categories of emitted light, consisting of incandescence and luminescence.
Incandescent light is produced by an electric current, which passes through a filament, the transmission
of which generates heat and in turn emits light. Luminescence is thereafter defined as any radiant energy
that is not generated by a change in temperature and encompasses electroluminescent, and is the focus of
this study (Hart, 2010).
Electroluminescent displays require a minimal amount of energy compared to other forms of
light. These displays which are composed of a series of functional layers, undergo several steps in order
to generate light. Electrons are tunneled from an electronic state at the phosphor interface until they
are ultimately accelerated to high levels by fields in the phosphor. These highly energized electrons then
activate the luminescent region of the phosphor. Once this region returns to a ground state it emits the
basic unit of light, a photon (Hart, 2010).
A record of the electroluminescent phenomenon dates back to the early 1900s. Henry J. Round
conducted the first recorded study of electroluminescent in 1907. Round, an American scientist who
at the time was analyzing radio waves, observed a discharge of various hues of light while transmitting
a current through silicon carbide (SiC). However, research on the technology remained relatively
quiet until in 1923, a Russian experimenter by the name of Oleg Lossev made a similar observation to
that of Round while also conducting fieldwork on radio waves. Lossev would later make a significant
contribution to the field of electroluminescent by publishing detailed documentation on his findings
in 1940. Concurrently as Lossev was performing his research, French engineer Georges Destriau
discovered that zinc sulphide (ZnS) was capable of emitting light under conduction. In 1959, the
Westinghouse Company produced the first zinc sulphide electroluminescent panel in America as part
of their research and development and would eventually lay the foundation for commercial production

Variability of Electroluminescent Displays—8
of electroluminescent displays. Today, electroluminescent displays have found a market in commercial
prints, products, and packaging and are primarily produced by methods of screen printing (Peaker,
1970).
For many years, only those who were exceptionally skilled at screen printing could print superior
results for electroluminescent displays. However, R. J. Horwood (1974), screen printing researcher
focused in ink film thickness, explains, “in recent years, a more scientific approach to the age-old craft of
screen printing has resulted in the evolution of complex precision-built printing machines for use in the
electronics micro-circuit industry” (p.129). As print technology keeps growing, the call for specialized
print processes does as well. As a result, due to screen printing’s capabilities, the process appears to be the
most optimal form of production for printed electronics (Horwood, 1974).
Screen printing is a process by which ink is pushed through a polyester screen stencil and onto
a substrate (Hensen, 2007). The image (C in Figure 1) is printed onto a transparency, which is used
to image a polyester screen, mounted into a frame (D in Figure 1) and coated with a photosensitive
emulsion layer. The transparency is secured on the screen and then exposed with ultraviolet light to
cure the emulsion. The uncured portion of is then removed by water, leaving openings in the screen for
printing. Screen printing ink (A in Figure 1) is then placed onto the screen and a squeegee (B in Figure
1) is used to force the ink through the stencil. There are certain types of squeegees that can be used,
each having a unique affect on how the ink is transferred through the stencil. The image can be printed
onto numerous types of substrates (E in Figure 1) including paper, fabrics plastics, and metals (Hensen,
2007).
Figure 1: the screen printing process

Variability of Electroluminescent Displays—9
Traditional screen printing techniques do not require extremely tight process controls over
each variable of the printing process. However, the printing of functional inks need careful monitoring
to ensure accurate print results. Printed electronics depend on specific characteristic values to function,
which influence resistivity (Horwood, 1974). Therefore, it is important to maintain control during the
printing process to ensure electroluminescent displays function effectively.
It is also important to understand the qualities of screen printing inks and how they are
comparable to that of electroluminescent inks. The important aspect of screen printing inks is the is
their viscosity, and how ink’s resistance to flow plays a part in the screen printing process. Horwood
explained that screen printing inks, “exhibit a kind of quality that when at rest are extremely viscous but
flow quite readily under moderate shearing stress, a force that is applied parallel or tangential to the face
of the material, which are termed pseudo-plastic” (Horwood, 1974). The purpose of such qualities is
to ensure that the inks do not flow after they are printed so that the image does not acquire any dot gain
(Horwood, 1974). Screen printing inks have a high viscosity making them very rigid and able to hold
their form.
The pillar theory presented by Horwood (1974) gives a detailed formula of certain elements of
the screen printing process to calculate accurate ink film thicknesses. The key elements revolve around
the screen where mesh count (T), thread diameter (d), and emulsion thickness (e) all play a part in
the calculation of the ink film thickness (Horwood, 1974,). First, the mesh thickness is determined
by doubling the thread diameter (2d). Screen thickness can then be determined by adding the mesh
thickness and the emulsion thickness (2d+e) (Horwood, 1974). Horwood (1974) also made note of
another variable where he stated, “the warp lines have larger amplitudes (a) than the weft lines resulting
in an overall mesh thickness (a+d). Warp and weft describes the characteristics of a weave in fabric,
usually weft is the threads running left to right and warp running up and down (Mahon, 2007). Thus, the

Variability of Electroluminescent Displays—10
variation of mesh thickness is due to the warp and weft characteristics of the mesh weave. The pillars of
ink are printed through the mesh weave resulting in pillars of ink being deposited onto the substrate. It
is also known that, “there are T2 such pillars in a unit square of area,” therefore the total ink volume per
unit area can be calculated by the formula: v = [(1/T) - d]2 (ad+e) T2 (Horwood, 1974).
After the ink has been deposited there can be some lateral flow by gravitational stress (Horwood,
1974). However, Horwood (1974) discusses how, “pillars are usually close enough that the pillars merge
by surface tension once they are printed resulting in a continuous print thickness (t).” Surface tension is
the intermolecular force that attracts like molecules at the surface of a liquid (Escobedo and Mansoori,
1996). Therefore, the similar pillars of ink would merge by the attraction force the ink molecules have.
Horwood also stated that the possible losses in the pillar merging process such as; surface uniformity,
line sharpness, and presence of pinholes are minute enough to be ignored in the calculation process
and therefore t = v = [(1/T) - d]2 (ad+e) T2 (Horwood, 1974). The examination of this formula
is important because of the relationship between functionality of electric materials and the ink film
thicknesses. Research has shown that the conductivity of ink layers depends heavily upon the ink film
thickness and it is therefore important to understand the variables related to ink film thickness. Horwood
(1974) concludes that this formula can accurately predict ink film thicknesses within ten percent as long
as the printing conditions are held constant.
There are a few other variables of the printing process that could affect ink film thickness.
Horwood (1974) found that the traverse speed of the squeegee directly affects the ink film thickness.
Studies showed that the faster that the squeegee traverses, the thicker the ink film thickness will be
(Horwood, 1974). In addition to the squeegee speed, the durometer (hardness) of the squeegee also
plays a role in ink film thickness. Softer squeegees lay down more ink (Horwood, 1974). In addition,
screen tension exerts force upward against the squeegee affecting the “snap off,” which is the distance

Variability of Electroluminescent Displays—11
between the substrate and the screen (Horwood, 1974). Greater distance between substrate and screen
reduces the likelihood of the screen causing ink pick up and thus inadvertently leading to uneven ink film
thickness. Screen tension loss occurs over time through the use of the screen. Horwood found that as
long as the screen is no less than 50 percent of its original tension, it will produce adequate quality prints
(1974).
This project was performed to understand how screen printing variables affect
electroluminescent displays. The knowledge of screen printing inks and electroluminescent displays
gathered and presented in this chapter were used to design the experimental testing.

Variability of Electroluminescent Displays—12
Chapter 3—Research Methods and Procedures
The scientific method is used when experimentation is needed to answer questions correlating
with cause and effect relationships of the experiment. This is done by first identifying and defining the
problem that is needed to be resolved. The observer then forms a hypothesis to what the cause of the
problem is, in order to prepare for the next step. Experiments are then conducted to collect, organize, and
analyze data to further understand the experiment. The observer then forms a conclusion based on the
analyzed data. Testing is repeated to ensure the accuracy of the experiment. The scientific method was
used in this experiment to reach conclusions (Science Buddies, 2011).
Benchmark Test
Benchmark analysis was conducted in the labs at the Graphic Communication Department at
California Polytechnic State University. The purpose of the benchmark test was to predetermine the
influence of printing speed on surface uniformity and the conductivity of conductive inks in order to
narrow down the variables for the comprehensive test by using one printing speed (220 millimeters per
minute or 440 millimeters per minute).
To determine the variability of electroluminescent displays, a series of twelve benchmark tests
were conducted (see Appendix A). A monotone “Cal Poly” wordmark, a text only logo, was selected and
prepared in Adobe Illustrator Creative Suite 5 (see Appendix B). Two types of inks were tested: silver
and dielectric. The layers were output, on an Epson Stylus Pro 7880. Each layer was printed on a separate
sheet of polyester transparency for screen exposure.
Polyester screens with a different mesh count were selected: 156 threads per inch (tpi) and 305
threads per inch (tpi). A sheet of Ulano capillary emulsion film with 30 microns of thickness was then
applied to each. After the emulsions were applied, the screens were kept at room temperature and in a
light-less storage cabinet while they dried.

Variability of Electroluminescent Displays—13
Screen exposure and preparation was performed in house at the Cal Poly Graphic
Communication Department. The positive Cal Poly graphic transparency film was exposed at 40 LTU
(light units) with a NuArc 3140 exposure unit. After exposure, the silver and dielectric screens were
washed and dried.
Once all preparations of the screens were made, a close examination was performed to check
for pinholes and other defects that might cause issues to the finished product. Each screen was then
mounted into the ATMA Electric Screen Printer for printing. The press was then prepared for printing by
clamping in the squeegee and flood bar and placing ink onto the screen.
A silver ink provided by Gwent Group was printed though a 156 tpi mesh and a 305 tpi mesh
at speeds of 220 millimeters per minute and 440 millimeters per minute to create four silver benchmark
samples. All four samples were then sent through a M&R Economax II conveyor drier for 60 seconds at
925 degrees Fahrenheit.
Gwent Group dielectric ink was printed following the same procedures as the silver ink.
Dielectric ink was printed with two passes to buildup the ink film thickness in order to obtain greater
insulation properties. Two experiments were done to understand how printing processes affect ink film
qualities: wet over wet method and wet over dry method.
The wet over wet layer was printed with two consecutive passes of dielectric ink, one on top the
other without drying in between passes. Printing was performed with a 156 tpi mesh and a 305 tpi mesh
at speeds of 220 millimeters per minute and 440 millimeters per minute to create four silver benchmark
samples. All four samples were then sent through the conveyor drier for 60 seconds at 925 degrees
Fahrenheit.
The dielectric ink was also printed with the wet over dry method. The first pass was printed and
dried through a conveyor for 60 seconds at 925 degrees Fahrenheit, and then a second pass was laid on

Variability of Electroluminescent Displays—14
top of the previously dried ink film. Four samples were printed wet over dry similar to the wet over wet
printing process. After printing, the samples were analyzed to verify which variables of printing could
produce efficient lighting.
A Keyence LK-682 laser displacement sensor was used to measure thickness and height variation
(roughness) for each sample. Resistivity of each sample was also analyzed. Resistivity is defined as “the
fundamental parameter of the material that describes how easily the material can transmit an electrical
current. High values of resistivity imply that the material is very resistant to the flow of electricity.
Low values of resistivity imply that the material transmits electrical current very easily” (Exploration
Geophysics, 2002). In order to test the electrical resistance of each sample a Fluke 115 ohmmeter was
used. Each sample was tested using the mentioned devices and the results were recorded in a chart for
comparison of the variables.
Once all the samples were tested and measured, the results were then used to infer an optimum
combination of print variables that would allow for efficient current conduction and illumination of EL
displays.

Variability of Electroluminescent Displays—15
Comprehensive Test
The comprehensive test was conducted in the labs at the Graphic Communication Department
at California Polytechnic State University. The purpose of the comprehensive testing was to optimize the
screen printing process pertaining to the printing of electroluminescent displays. Displays were analyzed
in order to determine how printing variables affect luminance.
An EL display is constructed by consecutively printing phosphor, dielectric and silver ink layers
on top of a conductive transparent ITO film (see Figure 2 and Figure 3). An electroluminescent display
illuminates when an alternating current between positive and negative is transferred to the phosphor
layer, which is sandwiched between the two conductive materials: ITO and silver. The dielectric layer
acts as an electrical insulator between the two opposing charges.
A “CP” wordmark was selected and prepared in Adobe Illustrator 5 in order to construct a
functional EL device (see Appendix C). The design was printed for 16 different samples (see Appendix
A) with a constant squeegee speed of 220 millimeters per minute. Each of the three layers: phosphor,
dielectric, and silver were printed in sequence on an ITO spattered transparency. Mesh count was kept
constant for each layer of an EL display in order to reduce the number of variables per test. The phosphor
layer was printed as a 100%, 75%, 50% and 25% halftone dot using Gwent Group green phosphor ink.
Figure 2: Display build sequence (DuPont, 2000) Figure 3: Display build sequence cross section view (DuPont, 2000)

Variability of Electroluminescent Displays—16
After printing, the samples were analyzed to verify which print variables could produce the brightest
lighting. Additionally, four registration marks were added half an inch from all adjacent sides for accuracy
in aligning ink layers.
Ink film thickness was measured using a laser displacement sensor. Data was recorded for later
print variable comparison for current conduction and illumination.

Variability of Electroluminescent Displays—17
Chapter 4—Results
Benchmark Test
Silver and dielectric inks were printed on 12 micron polyester transparencies to analyze
electroluminescent print variables.
Ink Film Thickness
Ink film thickness for the silver and dielectric layers were estimated with a Keyence LK-682 laser
displacement sensor. The sensor measured relative ink film height in order to infer ink film thickness for
the silver and dielectric layers. Ten ink film thickness measurements were conducted on each test sample
(156 tpi mesh printed at 440 mm/min, 305 tpi mesh printed at 440 mm/min, 156 tpi mesh printed at
220 mm/min and 305 tpi mesh printed at 220 mm/min) at random locations. Readings for each sample
were then averaged. Findings demonstrate that the combination between speed and tpi mesh have an
impact on ink lay down.
Silver Ink
Silver Ink Film Thickness (µm)156 tpi 305 tpi
220 mm/min 17.9 µm 9.5 µm440 mm/min 22 µm 12.6 µm
Table 1: Silver ink film thickness across speed and mesh count variables
Silver ink film thickness was important to this study because an EL display luminance value relies
on a sufficient amount of silver conductor for a current to flow throughout the display. In summarizing
Table 1, a greater print speed in conjunction with a lower tpi mesh produced a greater silver ink film
thickness. Printing with a 156 tpi mesh at 440 millimeters per minute produced a greater ink film
thickness than at 220 millimeters per minute. Comparatively, printing with a 305 tpi mesh at 440
millimeters per minute produced a greater ink film thickness than at 220 millimeters per minute.

Variability of Electroluminescent Displays—18
0
5
10
15
20
25
156 tpi 305 tpi
Microns (µm)
Mesh Count
Silver Ink Film Thickness
220 mm/min
440 mm/min
Figure 4: Silver ink film thickness across speed and mesh count variables
Figure 4 illustrates that a lower tpi mesh produced a greater silver ink film thickness. In keeping
the print speed constant, at 440 millimeters per minute, a 156 tpi mesh produced a greater ink film
thickness than a 305 tpi mesh. Comparatively, while keeping the print speed constant at 220 millimeters
per minute, a 156 tpi mesh produced a greater ink film thickness than a 305 tpi mesh.
Considering all ink film thickness variables tested, printing with a tpi mesh of 156 at 440
millimeters per minute produced the greatest ink film thickness.
Standard Deviation of Silver Ink Film Thickness156 tpi 305 tpi
220 mm/min 0.0029 0.019440 mm/min 0.0325 0.0226
Table 2: Silver ink film thickness standard deviation across speed and mesh count variables
The standard deviations of silver ink film thickness were used to understand the surface
uniformity of the ink film. Surface uniformity was important to this study because an uneven surface
or pinholing can hinder the efficiency of a current flowing throughout a display. In summarizing Table

Variability of Electroluminescent Displays—19
2, a slower print speed in conjunction with a lower tpi mesh produced a smoother ink film surface
compared to other printing variable combinations. Printing with 156 tpi mesh at 220 millimeters per
minute produced a slightly smaller variance in ink film thickness than 440 millimeters per minute.
Comparatively, printing with a 305 tpi mesh at 220 millimeters per minute produced a slightly smaller
variance in thickness than 440 millimeters per minute.
Upon analysis of Figure 5, one can identify that a higher tpi mesh produced a smoother silver ink
film surface. In keeping the print speed constant, at 440 millimeters per minute, a 305 tpi mesh produced
a slightly smaller variance in ink film thickness than a 156 tpi mesh. Contrarily, while keeping the print
speed constant at 220 millimeters per minute, a 156 tpi mesh produced a smaller variance in ink film
thickness than a 305 tpi mesh.
Considering all surface uniformity variables tested, printing at 220 millimeters per minute
produced a smoother silver ink film surface than 440 millimeters per minute when the tpi mesh was kept
constant for comparison.
0
0.005
0.01
0.015
0.02
0.025
0.03
0.035
156 tpi 305 tpi
Standard devia+on (σ)
Mesh Count
Standard Devia+on of Silver Ink Film
Thickness
220 mm/min
440 mm/min
Figure 5: Silver ink film thickness standard deviation across speed and mesh count variables
Variability of Electroluminescent Displays—20
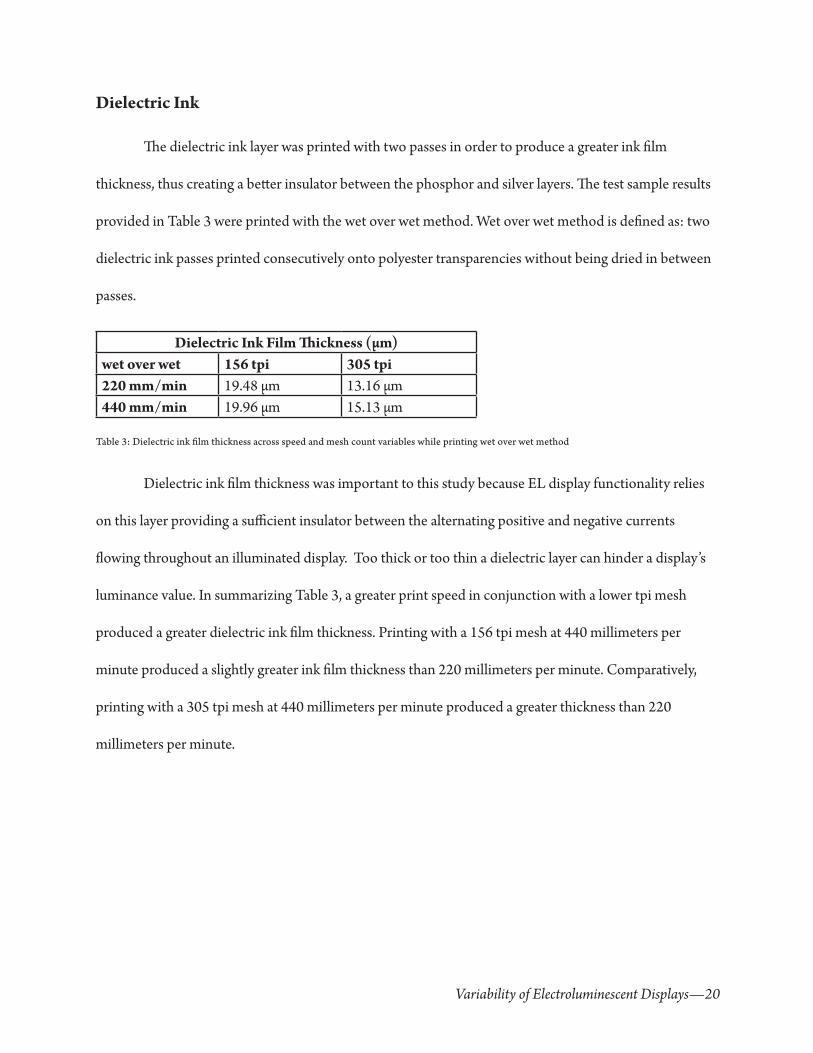
Dielectric Ink
The dielectric ink layer was printed with two passes in order to produce a greater ink film
thickness, thus creating a better insulator between the phosphor and silver layers. The test sample results
provided in Table 3 were printed with the wet over wet method. Wet over wet method is defined as: two
dielectric ink passes printed consecutively onto polyester transparencies without being dried in between
passes.
Dielectric Ink Film Thickness (µm)wet over wet 156 tpi 305 tpi220 mm/min 19.48 µm 13.16 µm440 mm/min 19.96 µm 15.13 µm
Table 3: Dielectric ink film thickness across speed and mesh count variables while printing wet over wet method
Dielectric ink film thickness was important to this study because EL display functionality relies
on this layer providing a sufficient insulator between the alternating positive and negative currents
flowing throughout an illuminated display. Too thick or too thin a dielectric layer can hinder a display’s
luminance value. In summarizing Table 3, a greater print speed in conjunction with a lower tpi mesh
produced a greater dielectric ink film thickness. Printing with a 156 tpi mesh at 440 millimeters per
minute produced a slightly greater ink film thickness than 220 millimeters per minute. Comparatively,
printing with a 305 tpi mesh at 440 millimeters per minute produced a greater thickness than 220
millimeters per minute.

Variability of Electroluminescent Displays—21
0
5
10
15
20
25
156 tpi 305 tpi
Microns (µm)
Mesh Count
Dielectric Ink Film Thickness (wet over wet)
220 mm/min
440 mm/min
Figure 6: Dielectric ink film thickness across speed and mesh count variables while printing wet over wet method
Figure 6 illustrates that a lower tpi mesh produced a greater dielectric ink film lay down. In
keeping the print speed constant, at 440 millimeters per minute, a 156 tpi mesh produced a greater
ink film thickness than a 305 tpi mesh. Comparatively, while keeping the print speed constant, at 220
millimeters per minute, a 156 tpi mesh produced a greater ink film thickness than a 305 mesh count.
The test sample results provided in Table 4 were printed with the wet over dry method with the
same variables as the wet over wet method. Wet over dry method is defined as: one dielectric ink pass
being printed and allowed to dry prior to a second pass of the dielectric ink.
Dielectric Ink Film Thickness (µm)wet over dry 156 tpi 305 tpi220 mm/min 23.84 µm 13.7 µm440 mm/min 24.71 µm 17.2 µm
Table 4: Dielectric ink film thickness across speed and mesh count variables while printing wet over dry method
In summarizing Table 4, a greater print speed in conjunction with a lower tpi mesh produced a
greater dielectric ink film thickness. Printing with a 156 tpi mesh at 440 millimeters per minute produced

Variability of Electroluminescent Displays—22
a slightly greater ink film thickness than 220 millimeters per minute. Comparatively, printing with a 305
tpi mesh at 440 millimeters per minute produced a greater thickness than 220 millimeters per minute.
0
5
10
15
20
25
30
156 tpi 305 tpi
Microns (µm)
Mesh Count
Dielectric Ink Film Thickness (wet over dry)
220 mm/min
440 mm/min
Figure 7: Dielectric ink film thickness across speed and mesh count variables while printing wet over dry method
One can infer from Figure 7 that a lower tpi mesh produced a greater dielectric ink film lay down.
In keeping the print speed constant, at 440 millimeters per minute, a 156 tpi mesh produced a greater
ink film thickness than a 305 tpi mesh. Comparatively, while keeping the print speed constant, at 220
millimeters per minute, a 156 tpi mesh produced a greater ink film thickness than a 305 tpi mesh.
Standard Deviation of Dielectric Ink Film Thicknesswet over wet 156 tpi 305 tpi220 mm/min 0.00361 0.00209440 mm/min 0.0033 0.00236
Table 5: Dielectric ink film thickness standard deviation across speed and mesh count variables
In summarizing Table 5, a slower print speed in conjunction with a higher tpi mesh produced
a smoother dielectric ink film surface. Printing with a 305 tpi mesh at 220 millimeters per minute
produced a slightly smaller variance in ink film thickness than 440 millimeters per minute. Contrarily,
printing with a 156 tpi mesh at 220 millimeters per minute produced a slightly greater variance in

Variability of Electroluminescent Displays—23
thickness than 440 millimeters per minute.
0
0.0005
0.001
0.0015
0.002
0.0025
0.003
0.0035
0.004
156 tpi 305 tpi
Sta
ndard
devia
+on (σ)
Mesh Count
Standard Devia+on of Dielectric Ink
Film Thickness (wet over wet)
220 mm/min
440 mm/min
Figure 8: Dielectric ink film thickness standard deviation across speed and mesh count variables
Upon analysis of Figure 8, one can identify that a lower tpi mesh produced a smoother dielectric
ink film surface. In keeping the print speed constant, at 440 millimeters per minute, a 305 tpi mesh
produced a slightly smaller variance in ink film thickness than a 156 tpi mesh. Comparatively, while
keeping the print speed constant at 220 millimeters per minute, a 305 tpi mesh produced a slightly
smaller variance in ink film thickness than a 156 tpi mesh.
Uneven ink film surface can cause pin holing in the surface of the dielectric layer, therefore
increasing the likelihood of current shorting, and thus a defective display. One can infer from Table 5 that
printing at 220 millimeters per minute produced a smoother dielectric ink film surface when mesh count
was kept constant. However, Figure 8 shows a tpi mesh of 156 had a smoother ink film surface when
printing at 440 millimeters per minute. This discrepancy is possibly due to inaccurate test readings, but
further analysis is needed to determine the root cause.

Variability of Electroluminescent Displays—24
Standard Deviation of Dielectric Ink Film Thicknesswet on dry 156 tpi 305 tpi220 mm/min 0.0029 0.0025440 mm/min 0.0031 0.0027
Table 6: Dielectric ink film thickness standard deviation across speed and mesh count variables
In summarizing Table 6, a slower print speed in conjunction with a higher tpi mesh produced
a smoother dielectric ink film surface. Printing with a 156 tpi mesh at 220 millimeters per minute
produced a slightly smaller variance in dielectric ink film thickness than 440 millimeters per minute.
Comparatively, printing with a 305 tpi mesh at 220 millimeters per minute produced a slightly smaller
variance in thickness than 440 millimeters per minute.
0
0.0005
0.001
0.0015
0.002
0.0025
0.003
0.0035
156 tpi 305 tpi
Sta
ndard
devia
+on (σ)
Mesh Count
Standard Devia+on of Dielectric Ink
Film Thickness (wet over dry)
220 mm/min
440 mm/min
Figure 9: Dielectric ink film thickness standard deviation across speed and mesh count variables
Figure 9 illustrates that a lower tpi mesh produced a smoother thicker dielectric ink film surface.
In keeping the print speed constant, at 440 millimeters per minute, a 305 tpi mesh produced a slightly
smaller variance in ink film thickness than a 156 tpi mesh. Comparatively, while keeping the print speed
constant at 220 millimeters per minute, a 305 tpi mesh produced a slightly smaller variance in ink film

Variability of Electroluminescent Displays—25
thickness than a 156 tpi mesh.
One can infer from Table 6 that printing at 220 millimeters per minute produced a smoother
dielectric ink film surface when mesh count was kept constant. After comparison of Table 2, 5 and 6 one
can identify that printing at 220 millimeters per minute produced a smoother ink film surface for both
silver and dielectric ink layers.
After analyzing all the data collected for both dielectric printing methods, one can conclude
that printing with the wet over dry method produced a thicker ink film thickness and in general led to
slightly more ink surface uniformity than the wet over wet method. Both printing methods produced
greater ink film thickness for a tpi mesh of 305 versus a tpi mesh of 156. Furthermore, for both printing
methods, printing at 440 millimeters per minute produced a greater ink film thickness than printing at
220 millimeters per minute.
Ink Resistivity
Ink resistivity for the silver layer was estimated with a Fluke 115 Ohmmeter. Ten resistivity
measurements were conducted for each test sample (156 tpi mesh printed at 440 mm/min, 305 tpi mesh
printed at 440 mm/min, 156 tpi mesh printed at 220 mm/min and 305 tpi mesh printed at 220 mm/
min) at randomized location over one inch distances with silver printed over polyester transparencies.
Readings for each sample were then averaged. One can observe that the relationship between mesh
count and speed led to a difference in ink film resistivity.
Silver Ink Film Resistivity (Ω)156 tpi 305 tpi
220 mm/min 13.2 Ω 6.5 Ω440 mm/min 3.7 Ω 3.07 Ω
Table 7: Silver ink film resistivity across speed and mesh count variables
In summarizing Table 7, a higher tpi mesh produced a lower ohm reading. Printing with a 156 tpi
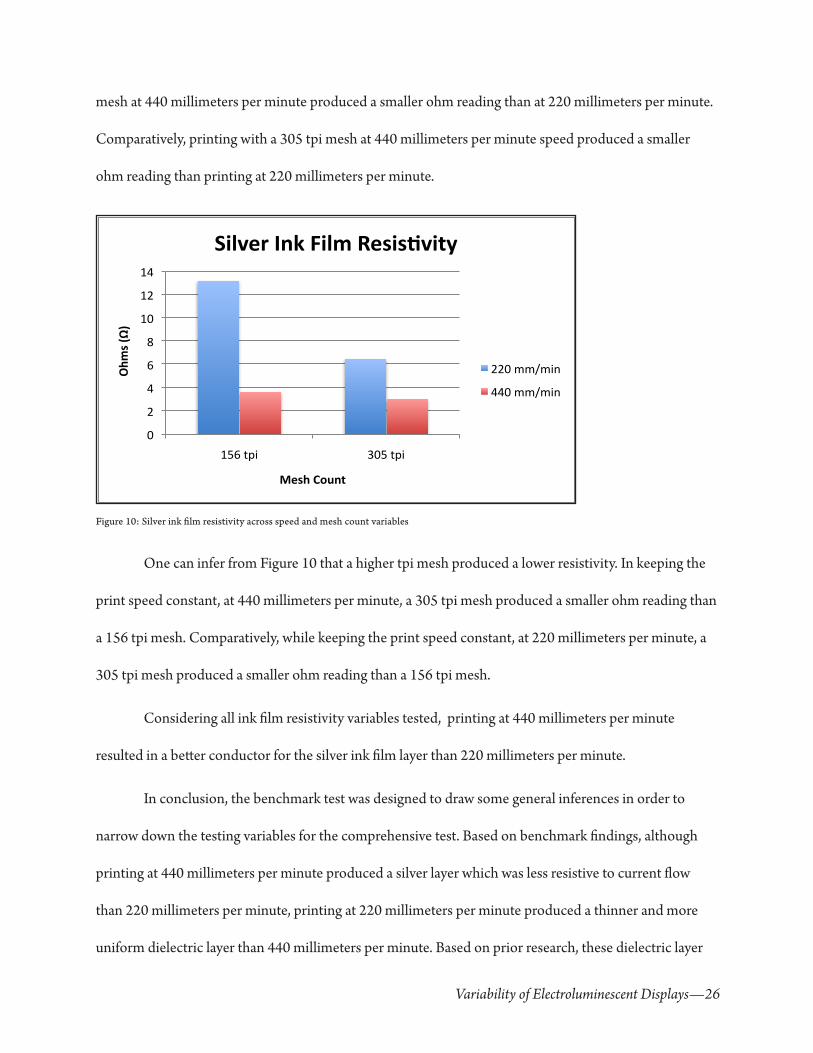
Variability of Electroluminescent Displays—26
mesh at 440 millimeters per minute produced a smaller ohm reading than at 220 millimeters per minute.
Comparatively, printing with a 305 tpi mesh at 440 millimeters per minute speed produced a smaller
ohm reading than printing at 220 millimeters per minute.
0
2
4
6
8
10
12
14
156 tpi 305 tpi
Ohms (Ω)
Mesh Count
Silver Ink Film Resis9vity
220 mm/min
440 mm/min
Figure 10: Silver ink film resistivity across speed and mesh count variables
One can infer from Figure 10 that a higher tpi mesh produced a lower resistivity. In keeping the
print speed constant, at 440 millimeters per minute, a 305 tpi mesh produced a smaller ohm reading than
a 156 tpi mesh. Comparatively, while keeping the print speed constant, at 220 millimeters per minute, a
305 tpi mesh produced a smaller ohm reading than a 156 tpi mesh.
Considering all ink film resistivity variables tested, printing at 440 millimeters per minute
resulted in a better conductor for the silver ink film layer than 220 millimeters per minute.
In conclusion, the benchmark test was designed to draw some general inferences in order to
narrow down the testing variables for the comprehensive test. Based on benchmark findings, although
printing at 440 millimeters per minute produced a silver layer which was less resistive to current flow
than 220 millimeters per minute, printing at 220 millimeters per minute produced a thinner and more
uniform dielectric layer than 440 millimeters per minute. Based on prior research, these dielectric layer

Variability of Electroluminescent Displays—27
qualities were believed to have a greater impact on EL display luminance value than the silver layer
qualities. As a result, printing at 220 millimeters per minute was chosen as a constant print speed for the
comprehensive test.

Variability of Electroluminescent Displays—28
Comprehensive Test
Phosphor, dielectric and silver inks, respectively, were printed on 17 micron ITO spattered
polyester transparencies to analyze electroluminescent print variables.
Ink Film Thickness
Ink film thickness for the silver and dielectric layers were estimated with a laser displacement
sensor. Ten measurements were conducted on each test sample (the silver ink layer was printed at a
constant speed of 220 mm/min for 156 tpi mesh and 305 tpi mesh, the dielectric ink layer was printed at
a constant speed of 220mm/min for 156 tpi mesh as wet over wet and wet over dry, and 305 tpi mesh as
wet over wet and wet over dry) at random locations. Readings for each sample were then averaged.
Silver Ink
Silver Ink Film Thickness (µm)156 tpi 19.2 µm305 tpi 11.2 µm
Table 8: Silver ink film thickness across mesh count
The silver ink film thickness measurements from the comprehensive test were consistent with the
findings from the benchmark test. In summarizing Table 8 and Figure 11, printing with a constant speed
at 220 millimeters per minute with a 156 tpi mesh produced a greater ink film thickness than a 305 tpi
mesh.

Variability of Electroluminescent Displays—29
0
5
10
15
20
25
156tpi 305tpi
Microns(µm)
MeshCount
SilverInkFilmThickness
Figure 11: Silver ink film thickness across mesh count
Dielectric Ink
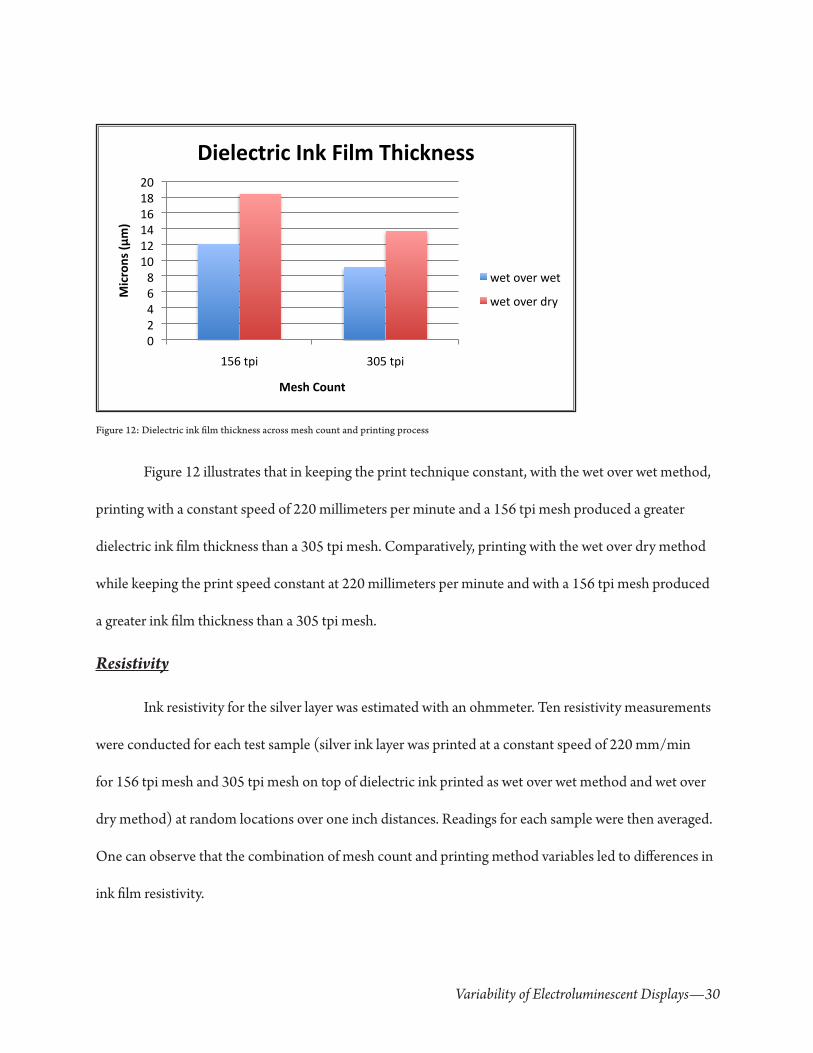
Dielectric Ink Film Thickness (µm)156 tpi 305 tpi
wet on wet 12.2 µm 9.2 µmwet on dry 18.5 µm 13.8 µm
Table 9: Dielectric ink film thickness across mesh count and printing process
In summarizing Table 9, two layers of dielectric ink, printed by the wet over dry method at a
constant speed of 220 millimeters per minute with a 156 tpi mesh produced a greater ink film thickness
than the one printed with the wet over wet method. Comparatively, printing with a constant speed at 220
millimeters per minute with a 305 tpi mesh with the wet over dry method produced a greater ink film
thickness than the one printed with the wet over wet method.
Variability of Electroluminescent Displays—30
0
2
4
6
8
10
12
14
16
18
20
156 tpi 305 tpi
Microns (µm)
Mesh Count
Dielectric Ink Film Thickness
wet over wet
wet over dry
Figure 12: Dielectric ink film thickness across mesh count and printing process
Figure 12 illustrates that in keeping the print technique constant, with the wet over wet method,
printing with a constant speed of 220 millimeters per minute and a 156 tpi mesh produced a greater
dielectric ink film thickness than a 305 tpi mesh. Comparatively, printing with the wet over dry method
while keeping the print speed constant at 220 millimeters per minute and with a 156 tpi mesh produced
a greater ink film thickness than a 305 tpi mesh.
Resistivity
Ink resistivity for the silver layer was estimated with an ohmmeter. Ten resistivity measurements
were conducted for each test sample (silver ink layer was printed at a constant speed of 220 mm/min
for 156 tpi mesh and 305 tpi mesh on top of dielectric ink printed as wet over wet method and wet over
dry method) at random locations over one inch distances. Readings for each sample were then averaged.
One can observe that the combination of mesh count and printing method variables led to differences in
ink film resistivity.

Variability of Electroluminescent Displays—31
Silver Ink Film Resistivity (Ink Film Thickness (Ω)Wet Over Wet Silver Over ITO Over Dielectric Wet Over Dry Silver Over ITO Over Dielectric156 tpi 10.09 Ω 0.84 Ω 156 tpi 6.21 Ω 0.95 Ω305 tpi 15.05 Ω 1.61 Ω 305 tpi 78 Ω 3.07 Ω
Table 10: Silver ink film resistivity across mesh count and printing process
Silver Ink Over ITO
Upon analysis of Table 10, one can identify that the silver layer printed over the ITO
transparency with a 156 tpi mesh had a higher ohm reading with the wet over wet method versus the wet
over dry method. Contrarily, silver printed over the ITO transparency with a 305 tpi mesh had a higher
ohm reading with the wet over dry method versus the wet over wet method.
One can infer from Table 10 that in keeping the print technique constant, the wet over dry
method, printing with a constant speed of 156 tpi mesh produced a lower ohm reading than a 305 tpi
mesh. Comparatively, printing with the wet over wet method, a 156 tpi mesh produced a lower ohm
reading than a 305 tpi mesh.
Silver Ink Over Dielectric Ink
Both Figure 13 and Figure 14 illustrate that printing with a 156 tpi mesh produced a lower ohm
reading with the wet over wet method versus the wet over dry method. Comparatively, printing with
a 305 tpi mesh produced a lower ohm reading with the wet over wet method versus the wet over dry
method.
Upon analysis of Figure 13 and Figure 14, one can identify that in keeping the print technique
constant, with the wet over dry method, printing with a constant speed of 156 tpi mesh produced a lower
ohm reading than a 305 tpi mesh. Comparatively, printing with the wet over wet method, a 156 tpi mesh
produced a lower ohm reading than a 305 tpi mesh.

Variability of Electroluminescent Displays—32
0
10
20
30
40
50
60
70
80
Silver Dielectric
Ohms (µm)
Dielectric Ink Film Resis5vity (wet
over wet dielectric)
156 tpi
305 tpi
Figure 13: Silver ink film resistivity across mesh count for wet over wet method
0
10
20
30
40
50
60
70
80
Silver Dielectric
Ohms (µm)
Dielectric Ink Film Resi5vity (wet over
dry dielectric)
156 tpi
305 tpi
Figure 14: Silver ink film resistivity across mesh count for wet over dry method

Variability of Electroluminescent Displays—33
Luminance
Luminance of Halftonewet over wet 156 tpi 305 tpi wet over dry 156 tpi 305 tpi100% 120.86 125.62 100% 111.46 111.4475% Defective Defective 75% 100.26 92.4650% 78.34 94.38 50% 69.18 71.4225% 60.24 71.62 25% 54.32 56
Table 11: Luminance for each halftone across mesh count and printing process
Upon analysis of Table 11, one can identify that printing a 100% solid phosphor dot and a
dielectric layer printed with the wet over wet method, produced a brighter luminance value for 305 tpi
mesh versus a 156 tpi mesh. Comparatively, printing a 100% solid phosphor dot and a dielectric layer
printed with the wet over dry method, produced a brighter luminance value for 305 tpi mesh versus a
156 tpi mesh.
Table 11 demonstrates that printing a 100% solid phosphor dot and a dielectric layer with a
156 tpi mesh produced a brighter luminance value for the wet over wet method versus the wet over dry
method. Comparatively, printing with a 305 tpi mesh produced a brighter luminance value for the wet
over wet method versus the wet over dry method.
Upon analysis of Table 11, one can identify that printing a 75% halftone phosphor dot and a
dielectric layer printed with the wet over dry method, produced a brighter luminance value for a 156
tpi mesh versus a 305 tpi mesh. The results for a 75% halftone phosphor dot was contrary to all other
halftone phosphor luminance’s, where a 156 tpi mesh had a brighter value than 305 tpi mesh. Due to
printing error, the 75% halftone phosphor dot printed with the wet over wet method was defective.

Variability of Electroluminescent Displays—34
0
20
40
60
80
100
120
140
100% 75% 50% 25%
Luminance Intensity
Hal0one
Lightness Value (wet over wet dielectric)
156 tpi
305 tpi
Figure 15: Luminance for each halftone across mesh count for wet over wet dielectric
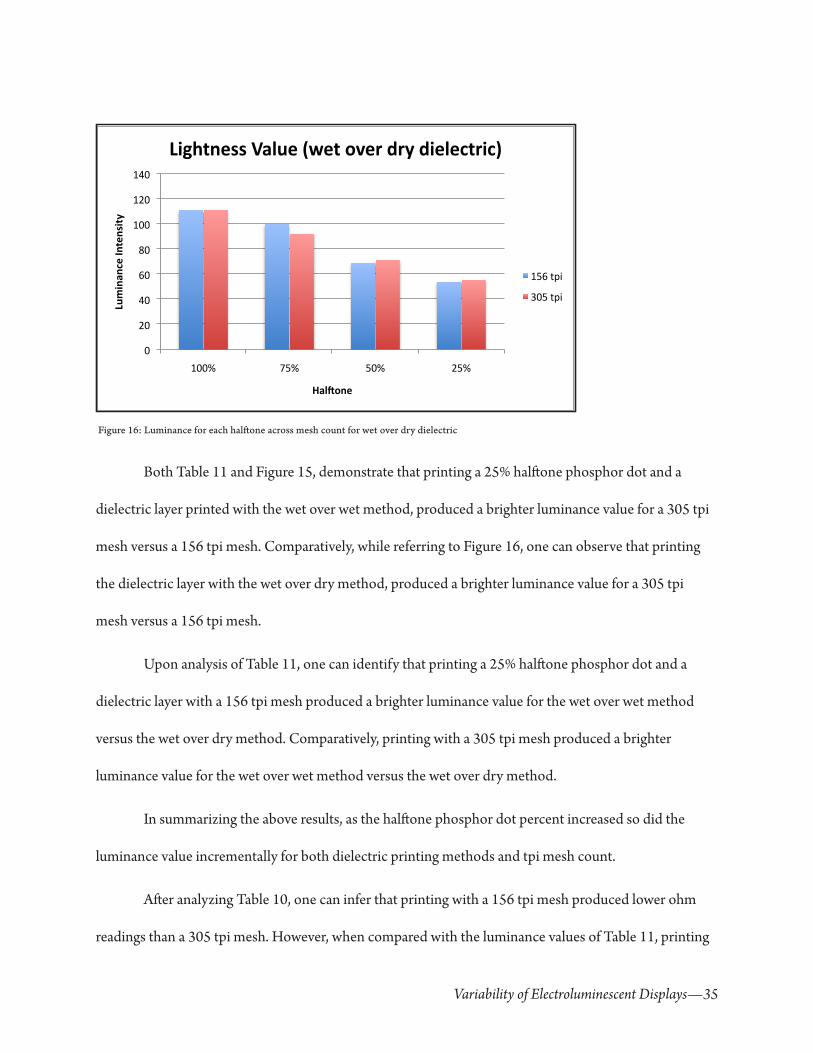
Upon analysis of Table 11 and Figure 15, one can identify that printing a 50% halftone phosphor
dot and a dielectric layer printed with the wet over wet method, produced a brighter luminance value for
a 305 tpi mesh versus a 156 tpi mesh. Comparatively, while referring to Figure 16, one can observe that
printing the dielectric layer with the wet over dry method, produced a brighter luminance value for a 305
tpi mesh versus a 156 tpi mesh.
One can infer from Table 11 that printing a 50% halftone phosphor dot and a dielectric layer
with 156 tpi mesh produced a brighter luminance value for the wet over wet method versus the wet over
dry method. Comparatively, printing with a 305 tpi mesh produced a brighter luminance value for the
wet over wet method versus the wet over dry method.
Variability of Electroluminescent Displays—35
0
20
40
60
80
100
120
140
100% 75% 50% 25%
Luminance Intensity
Hal0one
Lightness Value (wet over dry dielectric)
156 tpi
305 tpi
Figure 16: Luminance for each halftone across mesh count for wet over dry dielectric
Both Table 11 and Figure 15, demonstrate that printing a 25% halftone phosphor dot and a
dielectric layer printed with the wet over wet method, produced a brighter luminance value for a 305 tpi
mesh versus a 156 tpi mesh. Comparatively, while referring to Figure 16, one can observe that printing
the dielectric layer with the wet over dry method, produced a brighter luminance value for a 305 tpi
mesh versus a 156 tpi mesh.
Upon analysis of Table 11, one can identify that printing a 25% halftone phosphor dot and a
dielectric layer with a 156 tpi mesh produced a brighter luminance value for the wet over wet method
versus the wet over dry method. Comparatively, printing with a 305 tpi mesh produced a brighter
luminance value for the wet over wet method versus the wet over dry method.
In summarizing the above results, as the halftone phosphor dot percent increased so did the
luminance value incrementally for both dielectric printing methods and tpi mesh count.
After analyzing Table 10, one can infer that printing with a 156 tpi mesh produced lower ohm
readings than a 305 tpi mesh. However, when compared with the luminance values of Table 11, printing

Variability of Electroluminescent Displays—36
with a 156 tpi mesh produced, in a majority of the samples, a lower luminance value than a 305 tpi mesh.
This is contrary to the assumption that a lower ohm reading should produce a brighter display. One
possible explanation for this discrepancy is that for these test samples, the dielectric layer’s characteristics
may have had a greater impact on luminance value than the silver layer’s characteristics.
After analysis of the comprehensive test data, one can conclude that further tests are needed to
determine the contribution that each variable makes on the luminance of electroluminescent displays.

Variability of Electroluminescent Displays—37
Chapter 5—Conclusions
Analysis of the comprehensive and benchmark tests revealed that screen printing variables do
in fact affect the luminance value of electroluminescent displays. Printing speed, threads per inch mesh,
printing processes such as the wet over wet method and the wet over dry method, and the halftone
screening of phosphor should be considered when producing EL displays. These printing variables, as
the data presented in chapter 4 supports, influence the conductivity of EL displays and their resulting
luminance value.
Testing revealed that a threads per inch mesh of 305 printed with the wet over wet method and
at a 100% phosphor dot produced the brightest value of luminance across all findings. This finding is
supported by data demonstrating that printing with a tpi mesh of 305 with the wet over wet method
produced a lower ohm reading than with a tpi mesh of 156. However, a tpi mesh of 156 was found to
have a lower resistivity reading for the silver over ITO than a tpi mesh of 305. These two contrasting
results allude to the assumption that testing procedures constrained luminance values of the EL displays
by limiting the variability in relation to speed and threads per inch between layers. Rather, more efficient
EL displays might result from combining a dielectric layer printed with a tpi mesh of 305 with the wet
over wet method and a silver ink layer printed with a 156 tpi mesh.
The intent of this research project was to provide suggestions for, a still not widely documented
area of electronic printing. Data collected does provide a new understanding for the affects of print
variables on EL displays. However, further testing is still required for more conclusive findings. Proposed
future research should include a more extensive degree of variability between ink layers by combining
different mesh counts and print speeds. By examining the influence of display layer variability in more
depth, functional printers can further improve the printing process of EL displays.

Variability of Electroluminescent Displays—38
Works Cited
Escobedo, J., Mansoori, A. G. (1996). Surface Tension Prediction for Pure Fluids. AIChE
Journal, 42, 5, 2.
Exploration Geophysics (2002). DC Resistivity Notes
http://galitzin.mines.edu/INTROGP/MISC/resnotes.pdf
Dr. Rong, X. (2010) Characterize Screen Printing Parameters for Electroluminescent
Inks. California Polytechnic State University. 1-10.
DuPont. (2000). Processing Guide For DuPont Luxprint® Electroluminescent Inks.
DuPont Microcircuit Materials. 1-12.
Hart, J. A., Lenway, S. A., Murtha, T. (1999). A History of Electroluminescent Displays,
1-14.
Hensen, S. (2007). A Guide to Screen Printing As a Supremely Accessible Art Form.
1-6.
Horwood, R. J. (1974). Towards a Better Understanding of Screen Print Thickness
Control. Electrocomponent Science and Technology, 1, 129-136.
Mahon, J. (2007). Weft, Warp & Weave: Understanding the mystery of fabric structure.
SQE Professional, 38-39.
Peaker, A. R. (1970). Electroluminescent and its Applications. Electronics & Power,
329.
Science Buddies (2011). Steps of the Scientific Method.
http://www.sciencebuddies.org/sciencefairprojects/project_scientific_method.shtml
Variability of Electroluminescent Displays—39
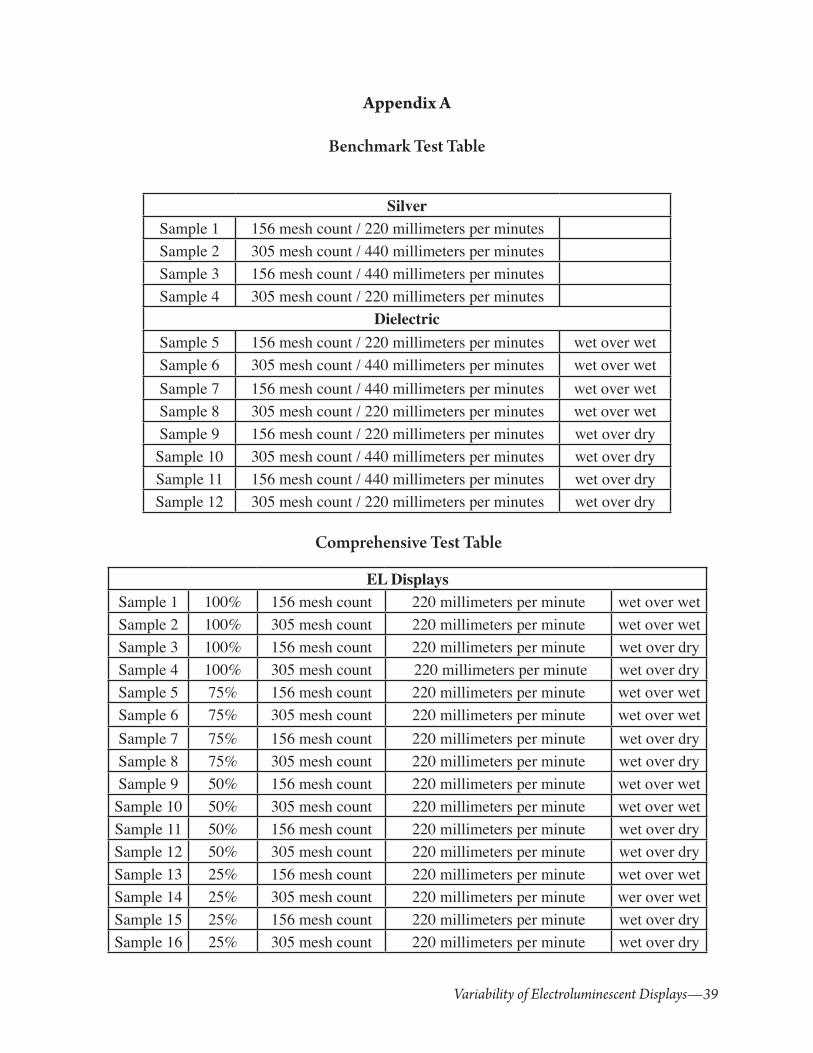
Appendix A
Benchmark Test Table
SilverSample 1 156 mesh count / 220 millimeters per minutesSample 2 305 mesh count / 440 millimeters per minutesSample 3 156 mesh count / 440 millimeters per minutesSample 4 305 mesh count / 220 millimeters per minutes
DielectricSample 5 156 mesh count / 220 millimeters per minutes wet over wetSample 6 305 mesh count / 440 millimeters per minutes wet over wetSample 7 156 mesh count / 440 millimeters per minutes wet over wetSample 8 305 mesh count / 220 millimeters per minutes wet over wetSample 9 156 mesh count / 220 millimeters per minutes wet over drySample 10 305 mesh count / 440 millimeters per minutes wet over drySample 11 156 mesh count / 440 millimeters per minutes wet over drySample 12 305 mesh count / 220 millimeters per minutes wet over dry
Comprehensive Test Table
EL DisplaysSample 1 100% 156 mesh count 220 millimeters per minute wet over wetSample 2 100% 305 mesh count 220 millimeters per minute wet over wetSample 3 100% 156 mesh count 220 millimeters per minute wet over drySample 4 100% 305 mesh count 220 millimeters per minute wet over drySample 5 75% 156 mesh count 220 millimeters per minute wet over wetSample 6 75% 305 mesh count 220 millimeters per minute wet over wetSample 7 75% 156 mesh count 220 millimeters per minute wet over drySample 8 75% 305 mesh count 220 millimeters per minute wet over drySample 9 50% 156 mesh count 220 millimeters per minute wet over wetSample 10 50% 305 mesh count 220 millimeters per minute wet over wetSample 11 50% 156 mesh count 220 millimeters per minute wet over drySample 12 50% 305 mesh count 220 millimeters per minute wet over drySample 13 25% 156 mesh count 220 millimeters per minute wet over wetSample 14 25% 305 mesh count 220 millimeters per minute wer over wetSample 15 25% 156 mesh count 220 millimeters per minute wet over drySample 16 25% 305 mesh count 220 millimeters per minute wet over dry

Variability of Electroluminescent Displays—40
Appendix B
Benchmark Test “Cal Poly” Wordmark

Variability of Electroluminescent Displays—41
Appendix C
Comprehensive Test “CP” Wordmark


![Atomic Layer Deposition on Self-Assembled … › pdfs › 44930 › InTech-Atomic...electroluminescent (TFEL) flat panel displays. [1]- [7] Several types of materials including metals](https://static.cupdf.com/doc/110x72/5f2709250d3bcf062f3b3457/atomic-layer-deposition-on-self-assembled-a-pdfs-a-44930-a-intech-atomic.jpg)