Unilever Trading Statement Q1 2018
Graeme Pitkethly / Richard Williams
19th April 2018
SAFE HARBOUR STATEMENT
This announcement may contain forward-looking statements, including ‘forward-looking statements’ within the meaning of theUnited States Private Securities Litigation Reform Act of 1995. Words such as ‘will’, ‘aim’, ‘expects’, ‘anticipates’, ‘intends’, ‘looks’,‘believes’, ‘vision’, or the negative of these terms and other similar expressions of future performance or results, and theirnegatives, are intended to identify such forward-looking statements. These forward-looking statements are based upon currentexpectations and assumptions regarding anticipated developments and other factors affecting the Unilever Group (the ‘Group’). Theyare not historical facts, nor are they guarantees of future performance.
Because these forward-looking statements involve risks and uncertainties, there are important factors that could cause actualresults to differ materially from those expressed or implied by these forward-looking statements. Among other risks anduncertainties, the material or principal factors which could cause actual results to differ materially are: Unilever’s global brands notmeeting consumer preferences; Unilever’s ability to innovate and remain competitive; Unilever’s investment choices in its portfoliomanagement; inability to find sustainable solutions to support long-term growth; the effect of climate change on Unilever’sbusiness; customer relationships; the recruitment and retention of talented employees; disruptions in our supply chain; the cost ofraw materials and commodities; the production of safe and high quality products; secure and reliable IT infrastructure; successfulexecution of acquisitions, divestitures and business transformation projects; economic and political risks and natural disasters;financial risks; failure to meet high and ethical standards; and managing regulatory, tax and legal matters. These forward-lookingstatements speak only as of the date of this announcement. Except as required by any applicable law or regulation, the Groupexpressly disclaims any obligation or undertaking to release publicly any updates or revisions to any forward-looking statementscontained herein to reflect any change in the Group’s expectations with regard thereto or any change in events, conditions orcircumstances on which any such statement is based. Further details of potential risks and uncertainties affecting the Group aredescribed in the Group’s filings with the London Stock Exchange, Euronext Amsterdam and the US Securities and ExchangeCommission, including in the Annual Report on Form 20-F 2017 and the Unilever Annual Report and Accounts 2017.
2

India improving
China improving
Brazil uncertain
Indonesia weaker
South Africa weaker
Improved consumer demand, uncertainties remain
Market Growth Country Dynamics Global GDP
Source: Nielsen, adjusted for e-commerce
Market value
+3%
+1%
Market volume
2.4%
2.9%
3.2%
2016 2017 2018
Source: Oxford Economics
33
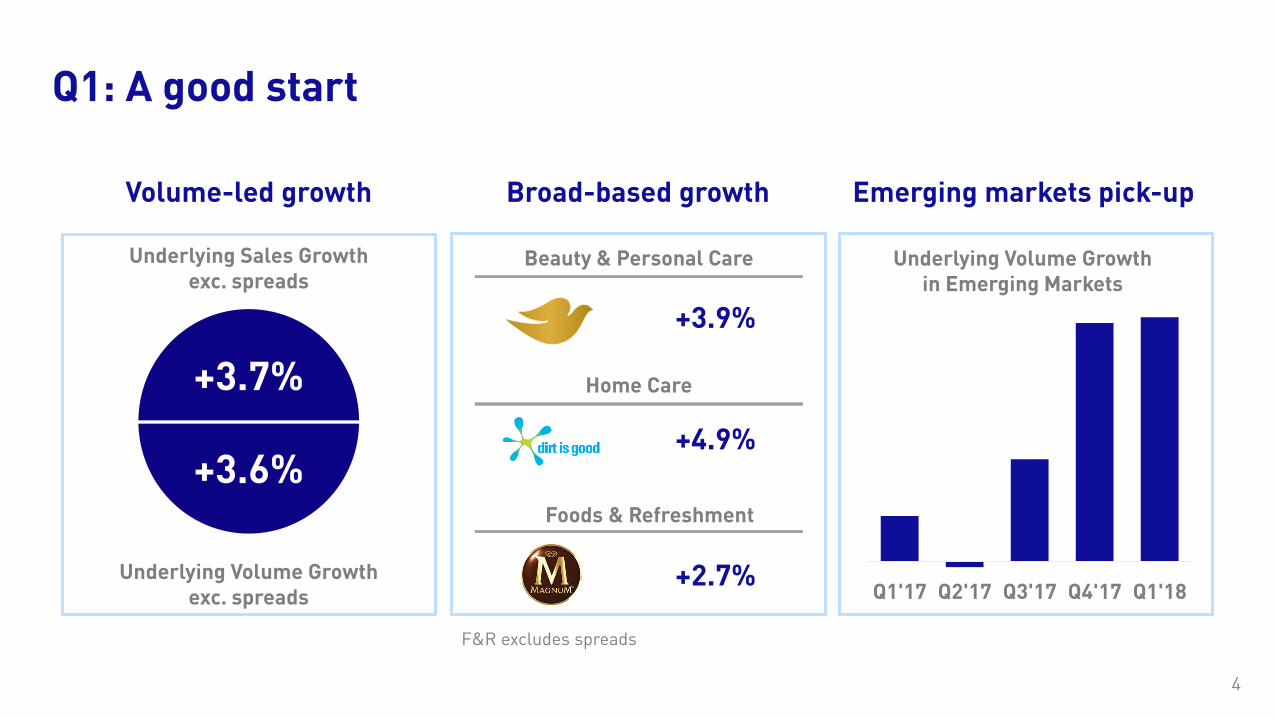
Q1: A good start
Broad-based growth Emerging markets pick-upVolume-led growth
Underlying Sales Growth exc. spreads
Underlying Volume Growth exc. spreads
+3.7%
+3.6%
Beauty & Personal Care
+3.9%
Foods & Refreshment
Home Care
+2.7%
+4.9%
Q1'17 Q2'17 Q3'17 Q4'17 Q1'18
Underlying Volume Growth in Emerging Markets
44
F&R excludes spreads

Lower commodity inflation
India: lower input taxes passed on
to consumers
Negative pricing in Latin America
Promotional pressure in North
America and Europe
Price contributing less to quarterly growth
Q1 '17 Q2 '17 Q3 '17 Q4 '17 Q1 '18
UPG 3.0%
0.1%
3.0% 2.4%
0.7%
Muted pricing, as expected
USG 2.6%3.0% 4.0%2.9% 3.4%
Saving programmes driving margin
>€1bn supply chain savings
p.a.
>2/3rd’s reinvested in
growth
5
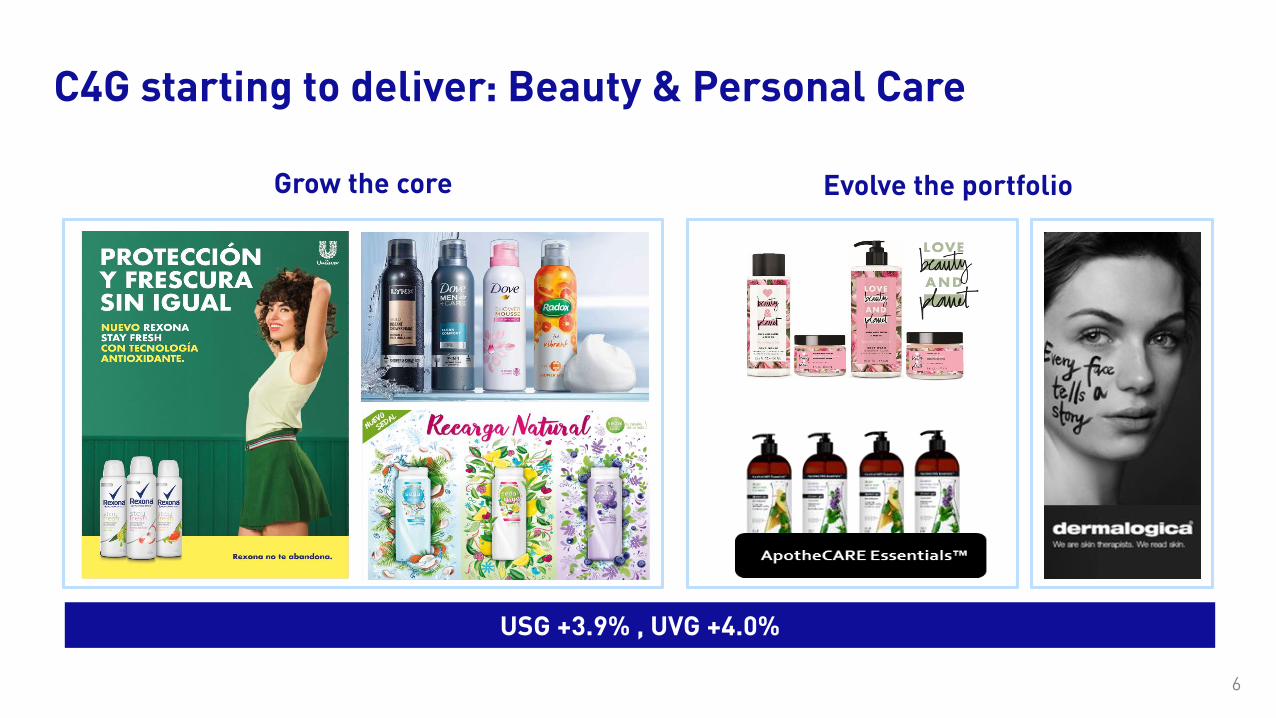
C4G starting to deliver: Beauty & Personal Care
Evolve the portfolioGrow the core
USG +3.9% , UVG +4.0%
6

C4G starting to deliver: Home Care
Evolve the portfolioGrow the core
USG +4.9% , UVG +4.8%
7
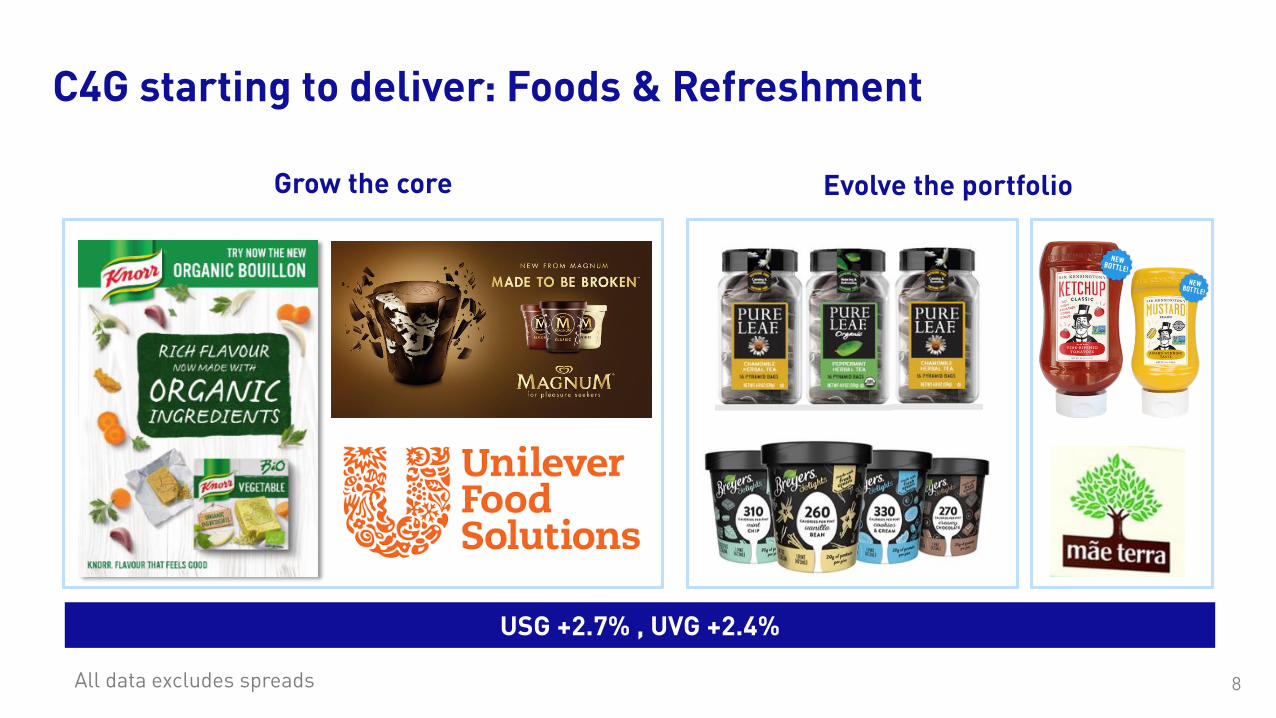
C4G starting to deliver: Foods & Refreshment
Evolve the portfolioGrow the core
USG +2.7% , UVG +2.4%
All data excludes spreads 8

Richard Williams
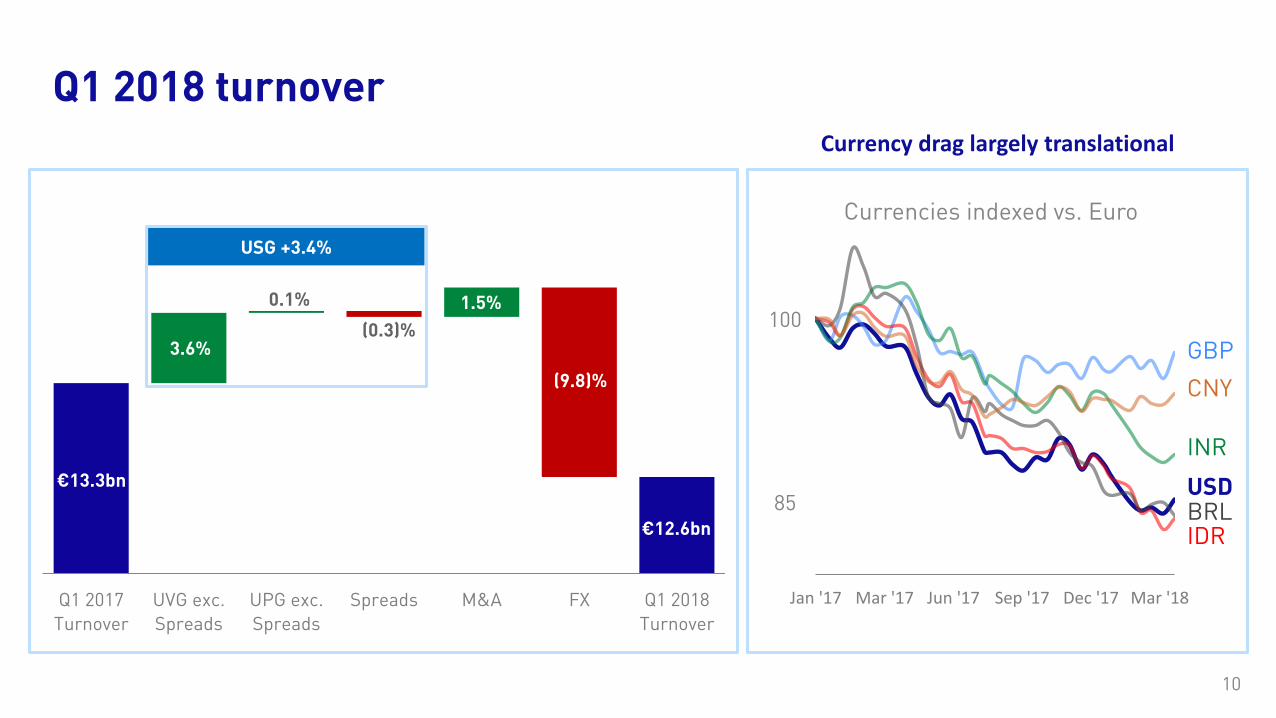
Q1 2017
Turnover
UVG exc.
Spreads
UPG exc.
Spreads
Spreads M&A FX Q1 2018
Turnover
€13.3bn
USG +3.4%
€12.6bn
3.6%
0.1% 1.5%
(9.8)%
(0.3)%
Q1 2018 turnover
Jan '17 Mar '17 Jun '17 Sep '17 Dec '17 Mar '18
GBP
CNY
INR
USD BRL IDR
100
85
Currencies indexed vs. Euro
Currency drag largely translational
10

Emerging Markets: +5.1% Underlying Sales Growth
Asia / AMET / RUB Latin America
Q2’17
6.9%USG
UPG
UVG
1.0%
Q3’17 Q4’17 Q1’18
4.3% 6.0% 6.5% 5.9%
Q1’17 Q2’17
3.5%USG
UPG
UVG
1.0%
Q3’17 Q4’17 Q1’18
6.3% 6.6% 4.6% 2.2%
Q1’17
11

Developed Markets: +1.1% Underlying Sales Growth
(0.9)%USG
UPG
UVG
1.0%
1.4% (2.9)% 2.3% 2.9%
Q1’17 Q2’17
(2.0)%USG
UPG
UVG
1.0%
Q3’17 Q4’17 Q1’18
0.3% (1.6)% (0.3)% 0.0%
Q1’17 Q2’17 Q3’17 Q4’17 Q1’18
North America Europe
12
Graeme Pitkethly
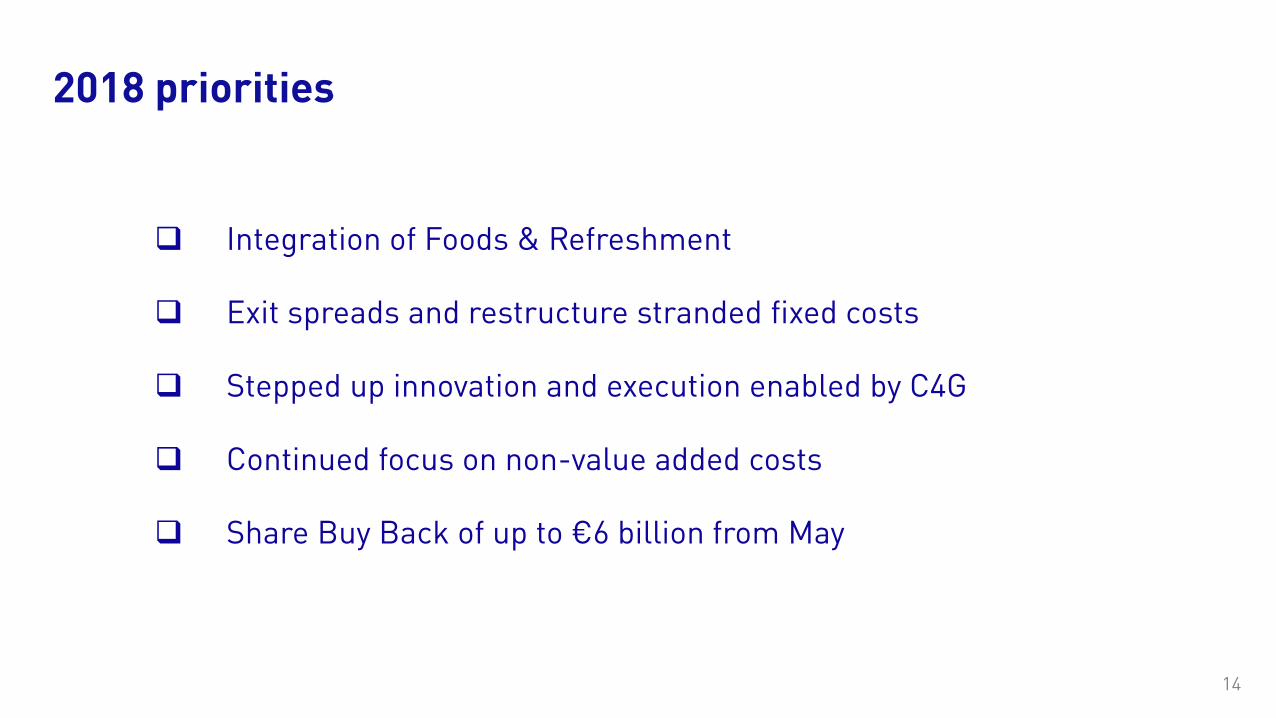
2018 priorities
Integration of Foods & Refreshment
Exit spreads and restructure stranded fixed costs
Stepped up innovation and execution enabled by C4G
Continued focus on non-value added costs
Share Buy Back of up to €6 billion from May
14

Underlying sales growth in the 3-5% range
Underlying Operating Margin: continued progress to 20%
Strong cash flow
2018 outlook unchanged
15
Unilever Trading Statement Q1 2018
Graeme Pitkethly / Richard Williams
19th April 2018