1 Lemon Tree Hotels Limited Corporate Presentation June 2018 1

Welcome message from author
This document is posted to help you gain knowledge. Please leave a comment to let me know what you think about it! Share it to your friends and learn new things together.
Transcript

1
Lemon Tree Hotels Limited
Corporate Presentation
June 2018
1

Disclaimer
2
Certain statements in this communication may be ‘forward
looking statements’ within the meaning of applicable laws
and regulations. These forward-looking statements involve a
number of risks, uncertainties and other factors that could
cause actual results to differ materially from those
suggested by the forward-looking statements. Important
developments that could affect the Company’s operations
include changes in the industry structure, significant
changes in political and economic environment in India and
overseas, tax laws, import duties, litigation and labour
relations.
Lemon Tree Hotels Limited (LTH) will not be in any way
responsible for any action taken based on such statements
and undertakes no obligation to publicly update these
forward-looking statements to reflect subsequent events or
circumstances.

Table of Contents
I Attractiveness of Indian Hotel Industry 4
II Differentiated Business Model of Lemon Tree 12
III Company Overview and Growth Plans 22
IV Strong Operating and Financial Performance 27
V Corporate Governance and Sustainability 34
3
Attractiveness of Indian Hotel Industry
Lemon Tree Premier, Delhi Airport Lemon Tree Premier, Jaipur Lemon Tree Premier, City Center, Gurgaon
44
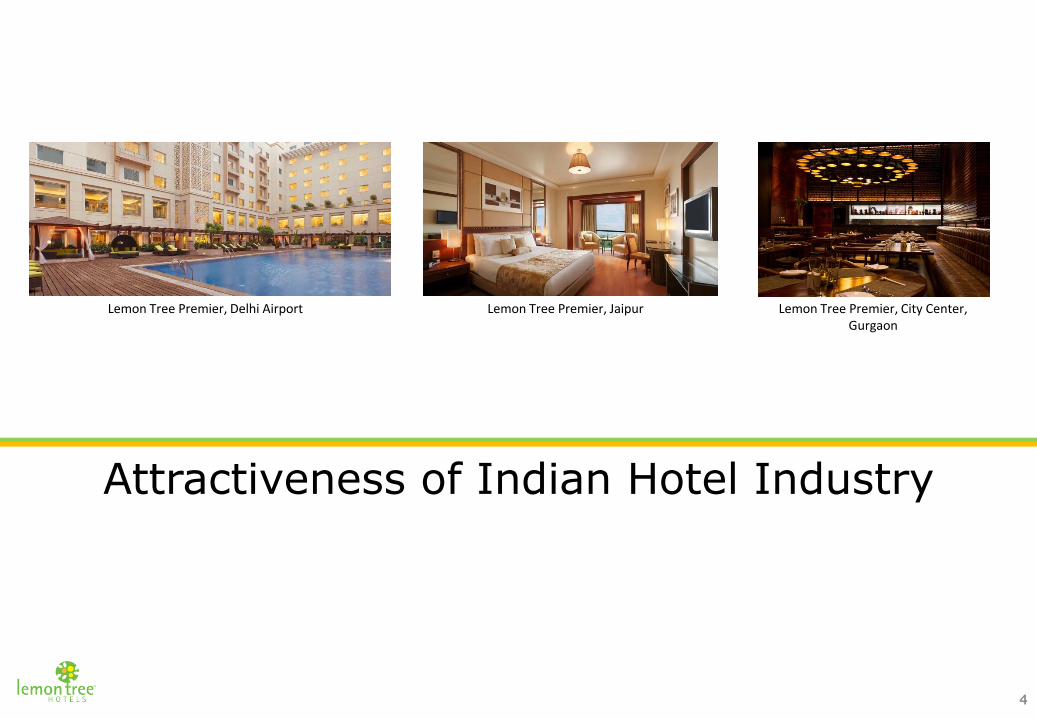
India: A comparatively under-penetrated hotel market
Supply of Rooms 16.2 Million 5.0 Million 3.78 Million 0.2 Million
Population 7349 Million 321 Million 1379 Million 1211 Million
Penetration (Rooms/1000 People)
2.2 15.7 2.7 0.2
Source : 1) STR census inventory as on December 20162) United Nations – population and vital statistics report 2017 5

Supply of rooms in India’s hotel industry was primarily at the top-end
When Lemon Tree commenced business in 2002, India’s Hotel industry was an inverted pyramid
Luxury-Upper Upscale
Upscale
UpperMidscale
Midscale &Economy
15,052
4,661
4,458
1,895
Luxury and Upper Upscale refers to top tier hotels generally referred to as five star, deluxe and luxury
Upscale hotels more moderately positioned and priced, than top tier hotels and generally classified as four or even five star hotels
Upper Midscale hotels are more moderately positioned and priced than upscale hotels and may be full service or even select service hotels; these are generally classified as four star and sometimes three star hotels
Midscale hotels are typically three star hotels with distinctly moderate room sizes, quality and pricingEconomy Hotels are typically two star hotels providing functional accommodations and limited services
Mid
-pric
ed
H
ote
l S
ecto
r
Source : Horwath Report Note: * as of March 31 of that year
No. of rooms
2002* 2017*
47,331
24,825
24,840
28,363
No. of rooms
6
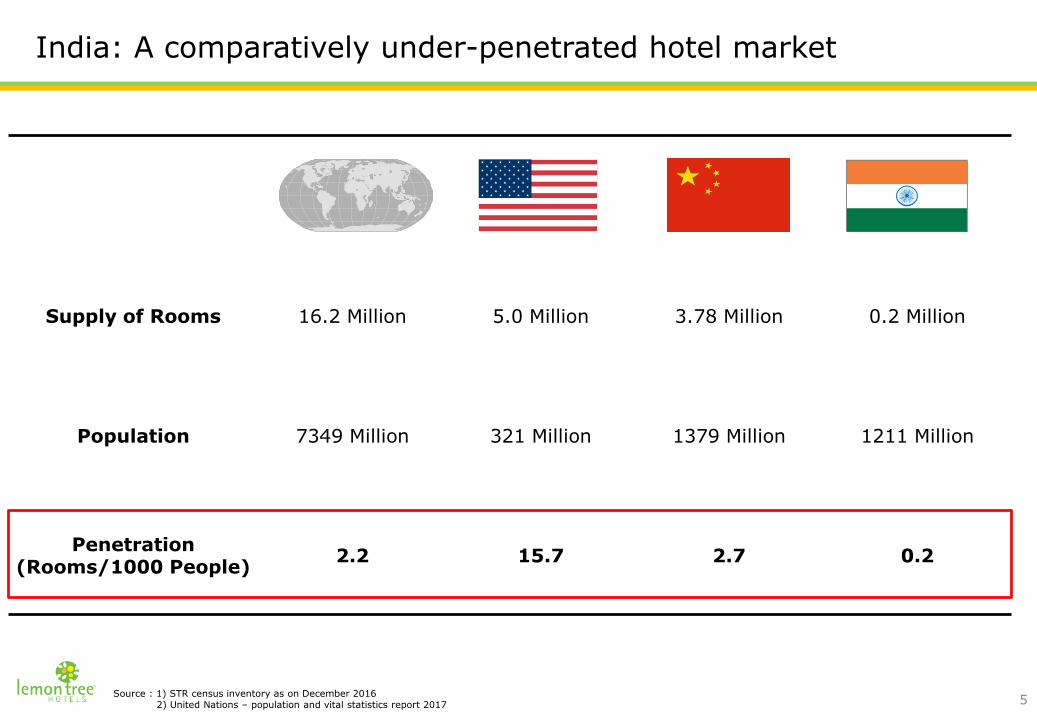
Significant drivers for hotel industry growth in India
Source: Union budget and economic survey 2013
7.1%
7.7%
7.8%7.9%
8.1%
8.2%
7.0%
7.5%
8.0%
8.5%
2017 2018F 2019F 2020F 2021F 2022F
Increased income levels expected to create additional discretionary spending capacity for the individuals
300
600
0
200
400
600
800
2004 2012
Middle Class Population (mn)
Middle class population in India is likely to overtake that of US and China by 2027
29
37
48
0
10
20
30
40
50
60
India China Japan
Average Age by 2020
64% of India’s population is expected to be in the working age population by the fiscal year 2021
Growth in domestic travel in India in forms like business travel, leisure travel, MICE visitation, wedding and social travel
etc.
Improved road and air connectivity
Increasing Indian GDP
Rise in young population
Growing middle class population
Higher spending
Source : Central Statistics Office, Govt. of India, IMF Source : World Economic Forum
Source : Horwath Report
7
8
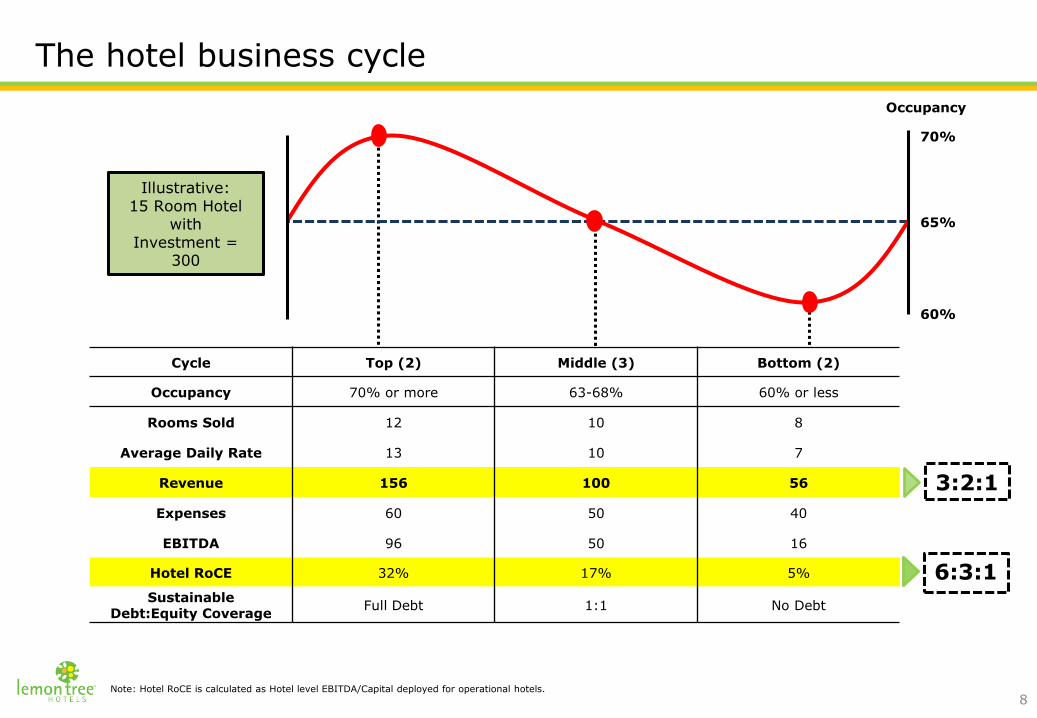
Cycle Top (2) Middle (3) Bottom (2)
Occupancy 70% or more 63-68% 60% or less
Rooms Sold 12 10 8
Average Daily Rate 13 10 7
Revenue 156 100 56
Expenses 60 50 40
EBITDA 96 50 16
Hotel RoCE 32% 17% 5%
Sustainable Debt:Equity Coverage
Full Debt 1:1 No Debt
Illustrative: 15 Room Hotel
with Investment =
300
Note: Hotel RoCE is calculated as Hotel level EBITDA/Capital deployed for operational hotels.
6:3:1
70%
65%
60%
Occupancy
The hotel business cycle
3:2:1

69%68%
59% 59%
60%
58%57%
58%
59%
63%
65%
68%
71%
73%
76%
55%
65%
75%
85%
0
50
100
150
200
FY07 FY08 FY09 FY10 FY11 FY12 FY13 FY14 FY15 FY16 FY17 FY18 FY19 FY20 FY21
Occupancy (%) Rooms demand per day ('000) Rooms supply per day ('000)
Indian hotel industry is at an inflection point
Slowing supply and rising demand is expected to increase occupancy
No. of rooms in ‘000s Occupancy
Source : Horwath Report
Demand 10.8%Supply 14.9%
Demand 15.1%Supply 15.1%
Demand 13.7%Supply 8.4%
Demand 12.5%Supply 8.0%
9

69%
68%
59% 59%
60%
58%
57%
58%
59%
63%
65%
7,543
5,745
55%
59%
63%
67%
71%
5,000
6,000
7,000
8,000
9,000
FY07 FY08 FY09 FY10 FY11 FY12 FY13 FY14 FY15 FY16 FY17
Occupancy (RHS) ADR (INR) Occupancy %ADR (INR)
Increasing occupancy leading to increase in room rates
Average Daily Rate (ADR) is increasing with increase in occupancy rates
Source : Horwath Report10

19%
16%
12%
19%
16%
13%
15%
12%11%
12%
8% 8%
0%
5%
10%
15%
20%
25%
Midscale & Economy Hotels Upper Midscale Hotels Total Hotels Midscale & Economy Hotels Upper Midscale Hotels Total Hotels
Demand Growth Supply Growth
4%
Mid-priced hotel sector expected to have higher demand supply gap resulting in higher growth in occupancy
FY12-17 FY17-21
Mid-priced hotel sector expected to continue having higher demand-supply gap leading to…
4%1%
7% 8%
5%
Demand Supply Gap
…faster growth in expected occupancy
58%
65%
76%
54%
64%
82%
61%
65%
80%
50%
55%
60%
65%
70%
75%
80%
85%
FY12 FY13 FY14 FY15 FY16 FY17 FY18 FY19 FY20 FY21
Industry Upper Midscale Midscale & Economy
Occupancy levels in FY17 for upper midscale and midscale & economy
segments in line with broader industry
Occupancy levels for upper midscale and midscale & economy segments to increase faster than industry due to higher growth
11Source : Horwath Report

Differentiated business model of
Lemon Tree (LTH)
Lemon Tree Hotel, Aurangabad Lemon Tree Hotel, Gachibowli, Hyderabad
Lemon Tree Hotel, Vadodara
1212
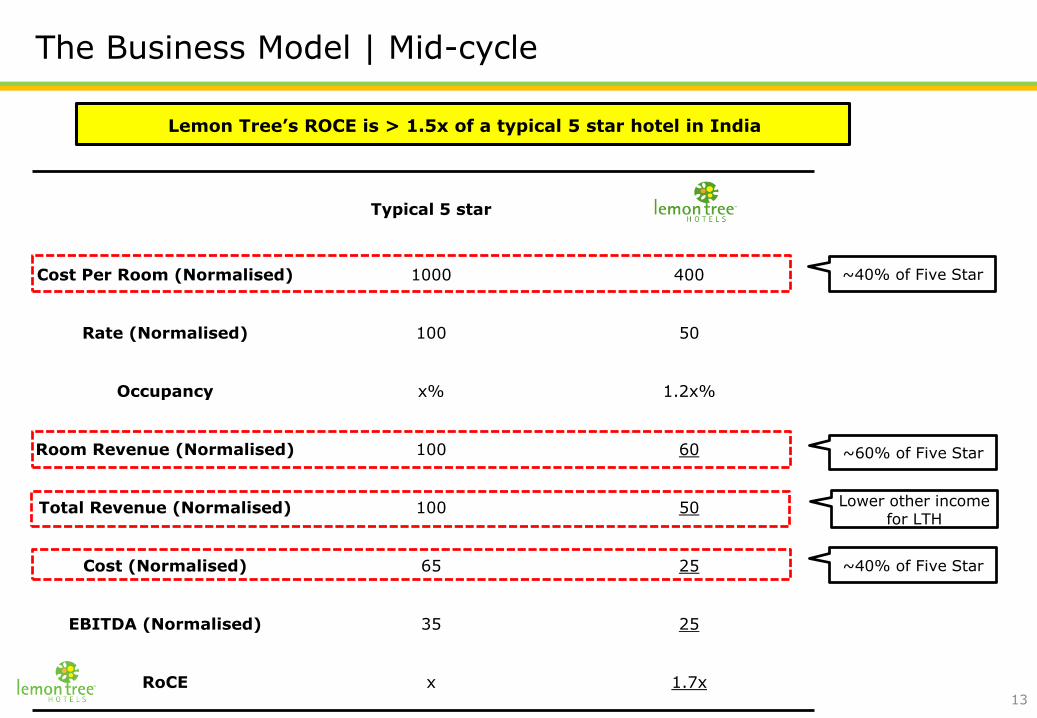
Typical 5 star
Cost Per Room (Normalised) 1000 400
Rate (Normalised) 100 50
Occupancy x% 1.2x%
Room Revenue (Normalised) 100 60
Total Revenue (Normalised) 100 50
Cost (Normalised) 65 25
EBITDA (Normalised) 35 25
RoCE x 1.7x
Lemon Tree’s ROCE is > 1.5x of a typical 5 star hotel in India
The Business Model | Mid-cycle
13
~40% of Five Star
~40% of Five Star
~60% of Five Star
Lower other income for LTH
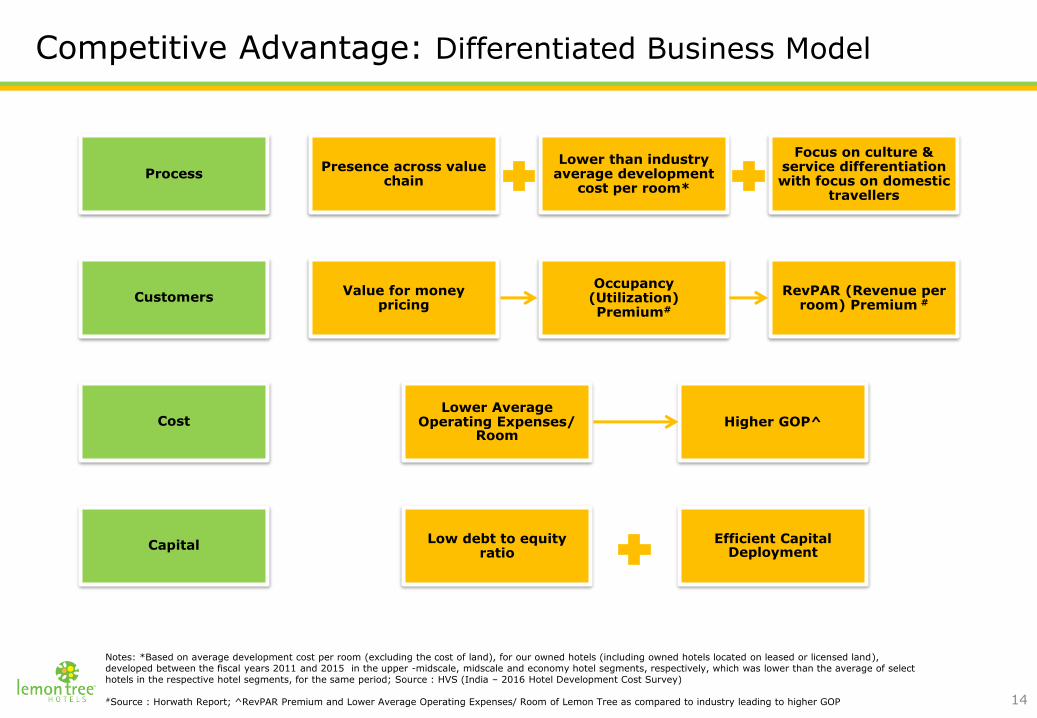
Competitive Advantage: Differentiated Business Model
ProcessPresence across value
chain
Lower than industry average development
cost per room*
Focus on culture & service differentiation with focus on domestic
travellers
CapitalEfficient Capital
DeploymentLow debt to equity
ratio
CustomersValue for money
pricing
Occupancy (Utilization) Premium#
RevPAR (Revenue per room) Premium #
CostLower Average
Operating Expenses/ Room
Higher GOP^
Notes: *Based on average development cost per room (excluding the cost of land), for our owned hotels (including owned hotels located on leased or licensed land), developed between the fiscal years 2011 and 2015 in the upper -midscale, midscale and economy hotel segments, respectively, which was lower than the average of select hotels in the respective hotel segments, for the same period; Source : HVS (India – 2016 Hotel Development Cost Survey)
#Source : Horwath Report; ^RevPAR Premium and Lower Average Operating Expenses/ Room of Lemon Tree as compared to industry leading to higher GOP 14
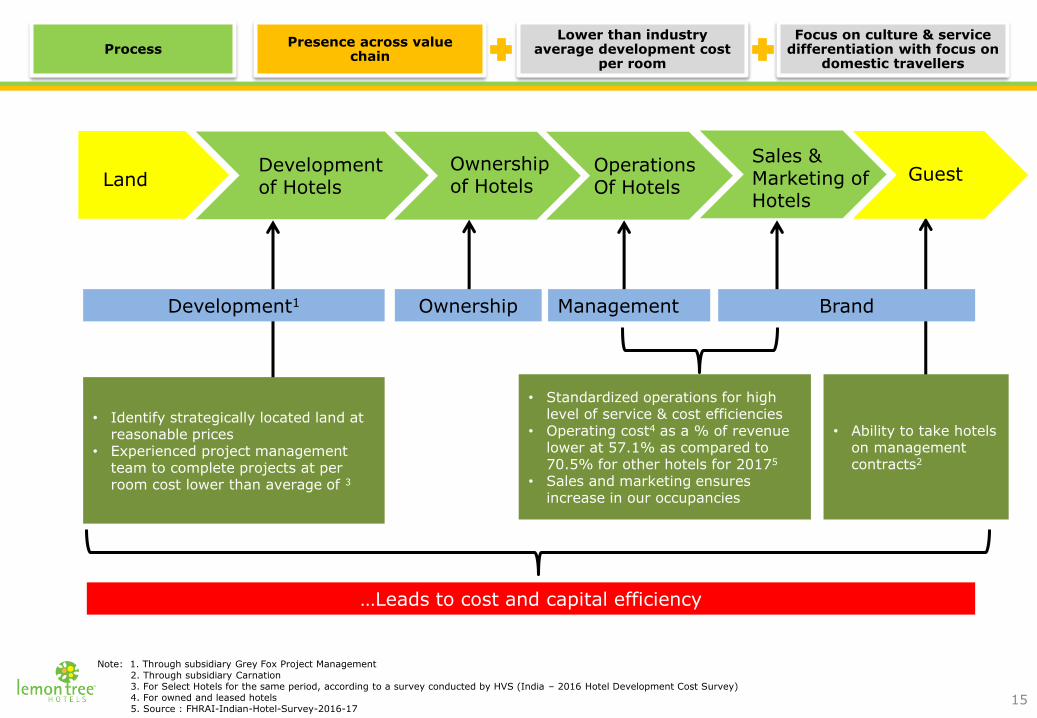
Note: 1. Through subsidiary Grey Fox Project Management2. Through subsidiary Carnation3. For Select Hotels for the same period, according to a survey conducted by HVS (India – 2016 Hotel Development Cost Survey)4. For owned and leased hotels5. Source : FHRAI-Indian-Hotel-Survey-2016-17
ProcessPresence across value
chain
Lower than industry average development cost
per room
Focus on culture & service differentiation with focus on
domestic travellers
• Standardized operations for high level of service & cost efficiencies
• Operating cost4 as a % of revenue lower at 57.1% as compared to 70.5% for other hotels for 20175
• Sales and marketing ensures increase in our occupancies
• Identify strategically located land at reasonable prices
• Experienced project management team to complete projects at per room cost lower than average of 3
LandDevelopment of Hotels
Ownership of Hotels
Operations Of Hotels
Sales & Marketing of Hotels
Guest
Development1 Ownership BrandManagement
…Leads to cost and capital efficiency
• Ability to take hotels on management contracts2
15
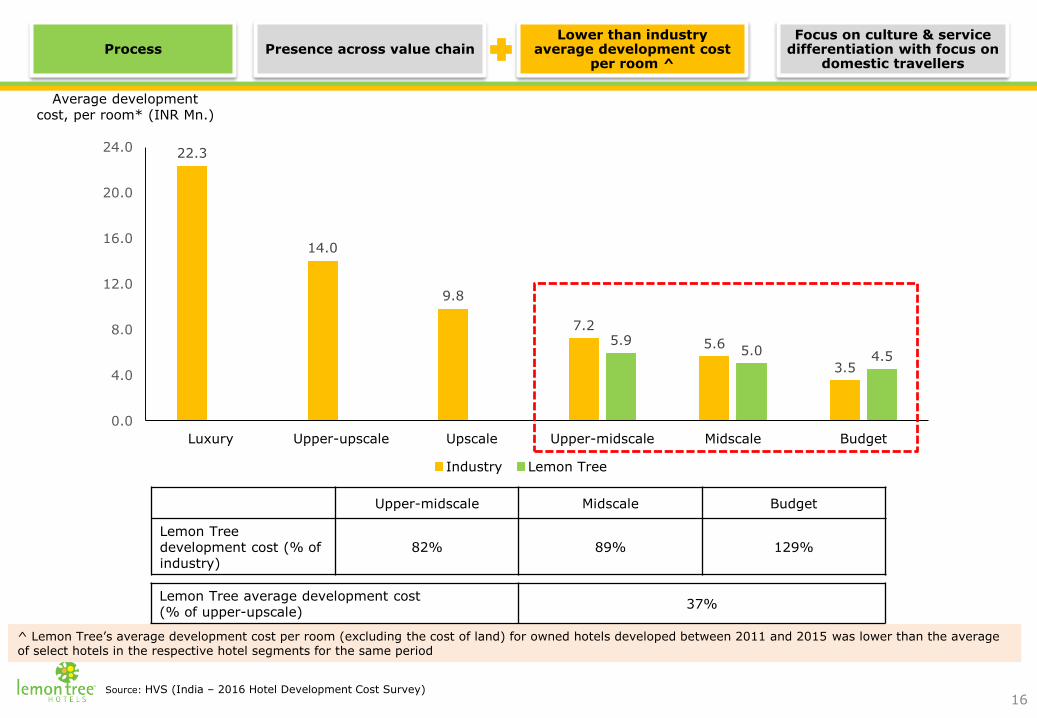
Upper-midscale Midscale Budget
Lemon Treedevelopment cost (% of industry)
82% 89% 129%
22.3
14.0
9.8
7.2
5.6
3.5
5.95.0 4.5
0.0
4.0
8.0
12.0
16.0
20.0
24.0
Luxury Upper-upscale Upscale Upper-midscale Midscale Budget
Industry Lemon Tree
Average development cost, per room* (INR Mn.)
^ Lemon Tree’s average development cost per room (excluding the cost of land) for owned hotels developed between 2011 and 2015 was lower than the average of select hotels in the respective hotel segments for the same period
Process Presence across value chainLower than industry
average development cost per room ^
Focus on culture & service differentiation with focus on
domestic travellers
Lemon Tree average development cost (% of upper-upscale)
37%
16Source: HVS (India – 2016 Hotel Development Cost Survey)

26 out of 41 hotels (which were
operational for at least a year
and were eligible for receiving
this recognition) were awarded
the TripAdvisor Certificate of
Excellence for 2018
Superior service leads to higher Customer Satisfaction as demonstrated by TripAdvisor recognition
Focus on Domestic Customers
- Ranked 4th in India and only Hotel chain in top 10 Best Companies to Work for by the Great Place to
Work Institute, India in 2017
- Ranked 12th in Asia’s Best Large Workplaces in 2018 by Great Place to Work Institute. Only Indian
company in top 15
- The highly engaged work force provides superior service to customers
ProcessPresence across value
chain
Lower than industry average development cost
per room
Focus on culture & service differentiation with focus
on domestic travellers
17
Domestic, 82%
Foreign, 18%
FY18
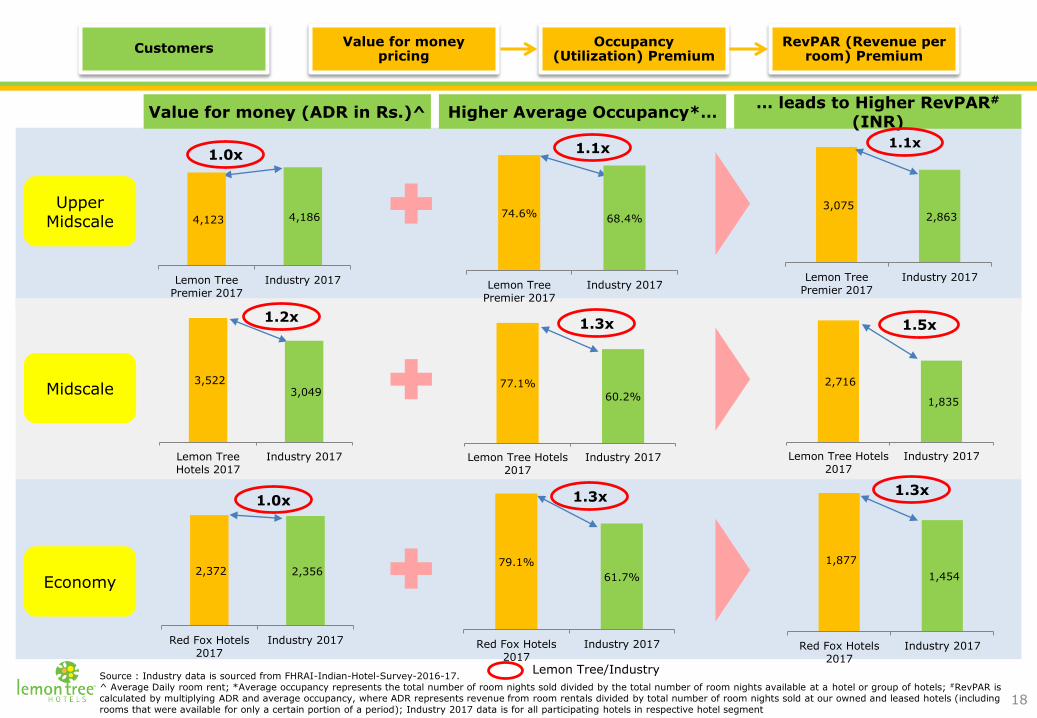
Higher Average Occupancy*…
Upper Midscale
Midscale
Economy
… leads to Higher RevPAR#
(INR)
Source : Industry data is sourced from FHRAI-Indian-Hotel-Survey-2016-17.^ Average Daily room rent; *Average occupancy represents the total number of room nights sold divided by the total number of room nights available at a hotel or group of hotels; #RevPAR is calculated by multiplying ADR and average occupancy, where ADR represents revenue from room rentals divided by total number of room nights sold at our owned and leased hotels (including rooms that were available for only a certain portion of a period); Industry 2017 data is for all participating hotels in respective hotel segment
Lemon Tree/Industry
CustomersValue for money
pricingOccupancy
(Utilization) PremiumRevPAR (Revenue per
room) Premium
Value for money (ADR in Rs.)^
1.0x
18
1.0x
79.1%
61.7%
Red Fox Hotels2017
Industry 2017
1.2x
1.1x
1.3x
3,075 2,863
Lemon TreePremier 2017
Industry 2017
1.1x
2,716
1,835
Lemon Tree Hotels2017
Industry 2017
1.5x
1,877
1,454
Red Fox Hotels2017
Industry 2017
1.3x
1.3x
77.1%
60.2%
Lemon Tree Hotels2017
Industry 2017
74.6% 68.4%
Lemon TreePremier 2017
Industry 2017
3,522 3,049
Lemon TreeHotels 2017
Industry 2017
4,123 4,186
Lemon TreePremier 2017
Industry 2017
2,372 2,356
Red Fox Hotels2017
Industry 2017
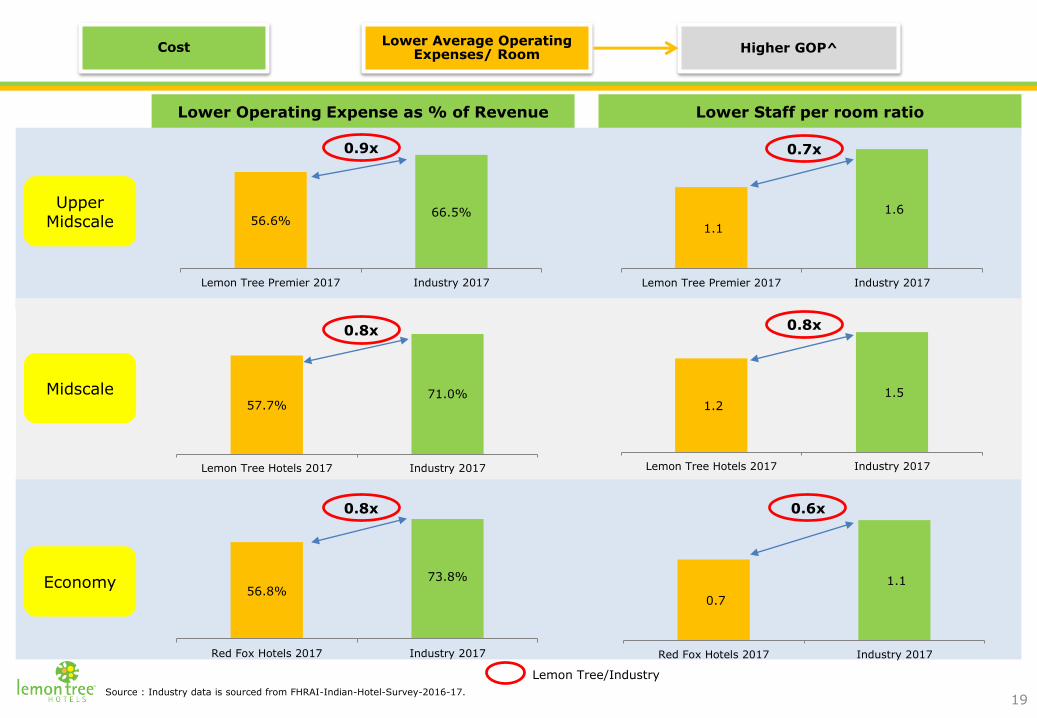
Lower Operating Expense as % of Revenue Lower Staff per room ratio
Lemon Tree/Industry
CostLower Average Operating
Expenses/ RoomHigher GOP^
19
Upper Midscale
Midscale
Economy
0.7x0.9x
0.8x
0.7
1.1
Red Fox Hotels 2017 Industry 2017
0.6x
0.8x
0.8x
56.6%66.5%
Lemon Tree Premier 2017 Industry 2017
57.7%71.0%
Lemon Tree Hotels 2017 Industry 2017
56.8%73.8%
Red Fox Hotels 2017 Industry 2017
1.2 1.5
Lemon Tree Hotels 2017 Industry 2017
1.1
1.6
Lemon Tree Premier 2017 Industry 2017
Source : Industry data is sourced from FHRAI-Indian-Hotel-Survey-2016-17.
Source : Industry data is sourced from FHRAI-Indian-Hotel-Survey-2016-17.
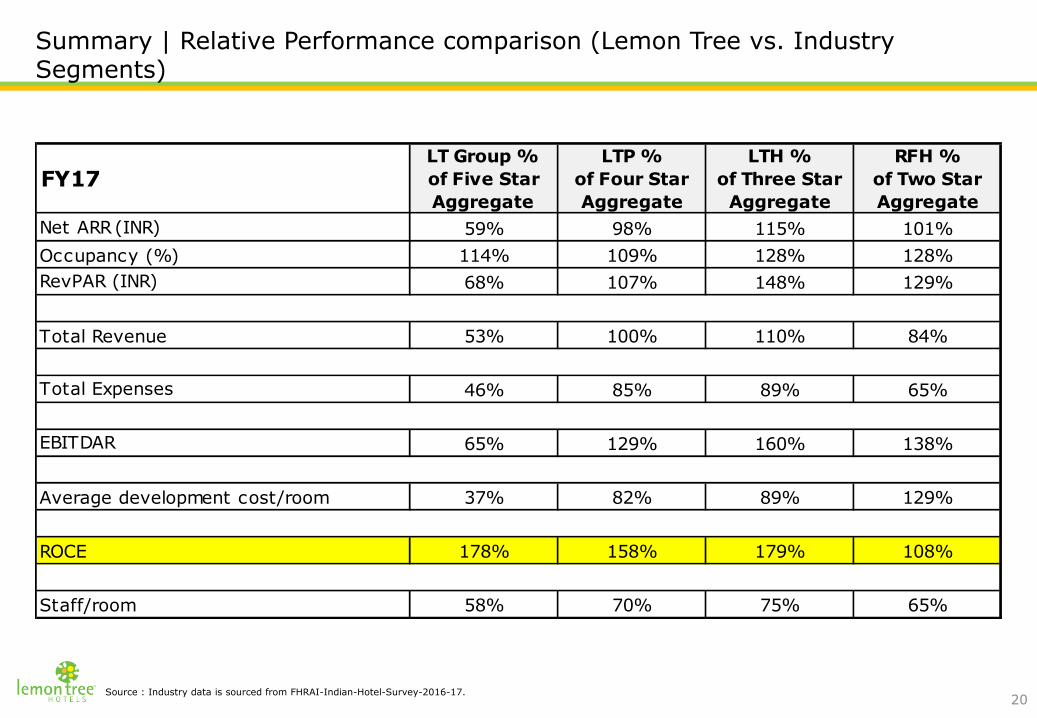
Summary | Relative Performance comparison (Lemon Tree vs. Industry Segments)
20
FY17LT Group %
of Five Star
Aggregate
LTP %
of Four Star
Aggregate
LTH %
of Three Star
Aggregate
RFH %
of Two Star
Aggregate
Net ARR (INR) 59% 98% 115% 101%
Occupancy (%) 114% 109% 128% 128%
RevPAR (INR) 68% 107% 148% 129%
Total Revenue 53% 100% 110% 84%
Total Expenses 46% 85% 89% 65%
EBITDAR 65% 129% 160% 138%
Average development cost/room 37% 82% 89% 129%
ROCE 178% 158% 179% 108%
Staff/room 58% 70% 75% 65%

Fleur Begonia Nightingale
APG
42.47%25.89%42.02%
57.53%74.11%57.98%
15.1
%
• Transferred minority stake in subsidiaries operating certain operational hotels to APG since 2012
• Capital raised from APG was used to purchase land and develop additional hotels
• Lemon Tree continues to have operational control over hotels, while reducing costs -capital and operational
• Lemon Tree earns management fee from these hotels
Maintained an efficient capital structure with a balanced-asset model
Development of hotels/ Scale up of portfolio
Stabilisation
Monetisation platform
• Track record of multiple simultaneous hotel developments – both organically and inorganically
• Present across the hotel value chain including both development and management of hotels
• Standardized pre-opening and seamless day-to-day operations, at high levels of service and cost efficiencies
• A dynamic pricing policy• Diversified team working to increase hotel occupancies
and achieve operational and financial targets
• Sale of operational assets by divesting equity interest in certain operating hotels
• Capital recycled back into new development• Retains management and control
CapitalEfficient Capital
DeploymentLow debt to equity
ratio
21
Company Overview and Growth Plans
Lemon Tree Hotel, Coimbatore Lemon Tree Premier, City Center, Gurgaon Lemon Tree Vembanad Lake, Alleppey, Kerela
2222
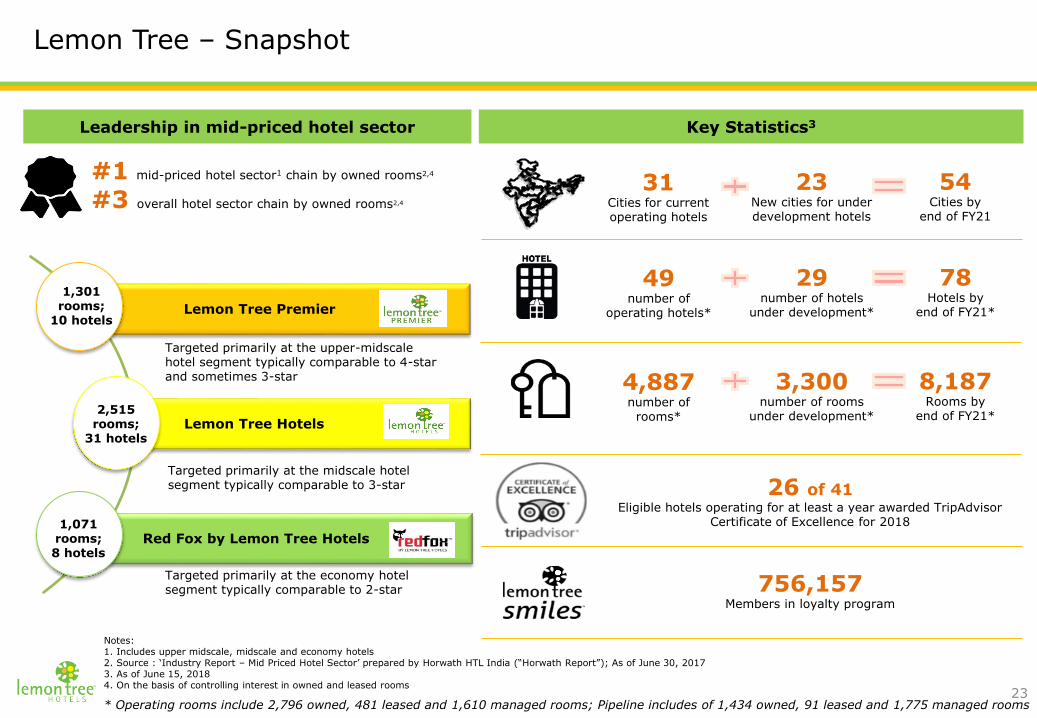
Lemon Tree Premier
Lemon Tree Hotels
Red Fox by Lemon Tree Hotels
Targeted primarily at the upper-midscale hotel segment typically comparable to 4-star and sometimes 3-star
Targeted primarily at the midscale hotel segment typically comparable to 3-star
Targeted primarily at the economy hotel segment typically comparable to 2-star
1,301 rooms;
10 hotels
2,515rooms;
31 hotels
1,071rooms;8 hotels
Lemon Tree – Snapshot
Leadership in mid-priced hotel sector
#1 mid-priced hotel sector1 chain by owned rooms2,4
#3 overall hotel sector chain by owned rooms2,4
49number of
operating hotels*
26 of 41 Eligible hotels operating for at least a year awarded TripAdvisor
Certificate of Excellence for 2018
756,157Members in loyalty program
Key Statistics3
23
29number of hotels
under development*
Notes:1. Includes upper midscale, midscale and economy hotels2. Source : ‘Industry Report – Mid Priced Hotel Sector’ prepared by Horwath HTL India (“Horwath Report”); As of June 30, 20173. As of June 15, 20184. On the basis of controlling interest in owned and leased rooms
4,887number of
rooms*
3,300number of rooms
under development*
* Operating rooms include 2,796 owned, 481 leased and 1,610 managed rooms; Pipeline includes of 1,434 owned, 91 leased and 1,775 managed rooms
31Cities for currentoperating hotels
23New cities for underdevelopment hotels
78Hotels by
end of FY21*
8,187Rooms by
end of FY21*
54Cities by
end of FY21

-208
3,171
314
2,931
- -
1,072
- - -
832
4,488
4,225 4,209 4,188
3,403
2,968 2,904 2,872
2,443
2,056 1,919 1,878
-
1,000
2,000
3,000
4,000
5,000
Accor Sarovar Lemon Tree ITC Hotels Taj-Ginger IHG Wyndham Royal Orchid Carlson ConceptHospitality
Clarks Inn Berggruen
Owned Rooms Total Rooms
India’s largest hotel chain in Mid-priced Hotel Sector 1
Notes: 1. On the basis of controlling interest in owned and leased rooms, as of June 30, 2017, Ranking is based on inventory, unless otherwise indicated2. Source : Horwath Report3. Accor has minority investment in hotels with inventory aggregating 4,168 rooms; Accor’s proportionate share of room’s ownership is 1,642 rooms. Since it is only a minority stake ranking is Accor is not ranked in category of Owned Rooms4 Top 12 classification is based on inventory as at March 31, 2017, the data for earlier years and as at June 30, 2017 is provided only for comparison purposes
6 1 5
2
3
4
Owned Rooms Ranking
No. of rooms
Lemon Tree is the largest hotel chain in mid-priced hotel sector in India1 and #3 in terms of total rooms 1,2
24

| Neelkanth
*
*
| Mussoorie
Vijayawada
Strategically positioned in key geographies
Delhi NCR: FY17 – 14%FY21E – 16%
City: Lemon Tree share of total mid priced hotel rooms sectorShare identified for top 10 markets as per Horwath HTL
Kolkata: FY17 – NAFY21E – 8%
Mumbai: FY17 – NAFY21E – 17%
Bengaluru: FY17 – 9%FY21E – 8%
Hyderabad: FY17 – 24%FY21E – 21%
Chennai: FY17 – 5%FY21E – 4%
Pune: FY17 – 5%FY21E – 9%
Goa: FY17 – 4%FY21E – 4%
Jaipur: FY17 – 11%FY21E – 10%
Ahmedabad: FY17 – 11%FY21E – 9%
Hotels at locations with high barrier-to-entry such as close to major business centers, airports etc.
Hotel operations in each of the top 10 markets in India (based on hotel inventory)
Focus in key micro markets to address demand and
optimize pricing
Geographical spread across India and presence in key
markets to cater effectively to corporate clients and
business travelers
Note: For FY21E, share based on management estimates of total rooms in FY21 and Horwath projection of total supply in these markets
Source : Horwath Report 25

49
1,920
2,708 3,001
3,249 3,698
4,870
6,222
6,838
8,187
-
1,000
2,000
3,000
4,000
5,000
6,000
7,000
8,000
9,000
2005 2013 2014 2015 2016 2017 2018 2019 2020 2021
Total number of rooms
Milestones
Subscription to equity shares of Lemon Tree by Patanjali Govind Keswani
Opened the first “Lemon Tree Hotel” in Gurugram, Haryana, India
Investment by Maplewood (fund affiliated to Warburg Pincus)
Opened the first “Red Fox” hotel in Jaipur, Rajasthan
Opened the first “Lemon Tree Premier” hotel in Leisure Valley, Gurugram, Haryana, India
Further Investment by APG – in Nightingale and Begonia (subsidiaries of Lemon Tree)
2002 2004 2006 2009 2010 2012
• Investment by APG in Company and Fleur
• Commenced business of management of hotels, through Lemon Tree’s Subsidiary, Carnation
2015
All India Supply CAGR: 11.8% All India Supply CAGR: 7.9%
LTH to All India: 3.7x LTH to All India: 2.4x26
Strong Operating and Financial Performance
Lemon Tree Premier, CorbettLemon Tree Amarante Beach, Goa Lemon Tree Premier, Hyderabad
27

Strong operating performance
Rooms are being added…
…coupled with increasing ADR…
…and occupancy levels increasing…
…leading to a RevPAR growth
28
1,6372,254 2,444 2,505 2,538 2,796
283283 283 283 317
481171 274 461 843
1593
FY13 FY14 FY15 FY16 FY17 FY18
Owned Leased Hotels Managed Hotels
1,920
2,708 3,0013,249
3,698
4,87020%
68% 68% 68%
78%
73%75%75%
77%79%
77%
74%
77%
Lemon Tree Premier Lemon Tree Hotels Red Fox Hotels
FY15 FY16 FY17 FY18
Note: Drop in occupancy levels is on account of new owned/leased supply addition by Lemon Tree in FY18
3,6
35
3,1
75
2,1
79
3,8
34
3,3
21
2,2
78
4,1
23
3,5
22
2,3
72
4,7
73
3,8
48
2,8
60
Lemon Tree Premier Lemon Tree Hotels Red Fox Hotels
FY15 FY16 FY17 FY18
9%10% 7%
2,4
82
2,1
55
1,4
77
3,0
01
2,4
33
1,7
11
3,0
75
2,7
16
1,8
77
3,6
86
2,8
57
2,2
08
Lemon Tree Premier Lemon Tree Hotels Red Fox Hotels
FY15 FY16 FY17 FY18
14%13% 10%

(83) (115)
225
459
672
FY14 FY15 FY16 FY17 FY18
Strong Growth and improving margins
Revenue has increased at 22% over the last 5 years…
Gearing low
…coupled with increasing EBITDA margins
Increasing cash profit* growth
29
2,217
2,904
3,6804,121
4,843
FY14 FY15 FY16 FY17 FY18
22%
246 519 1,033 1,247 1,440
11.0%
17.8%
27.9%29.7% 29.3%
FY14 FY15 FY16 FY17 FY18
0.510.46
0.50
0.65
0.81
FY14 FY15 FY16 FY17 FY18
Cash Profit (PAT + Depreciation) (Rs. million) Debt/Equity
EBITDA & EBITDA marginsRevenue from operations (Rs. million)
Note: FY14, FY15 and FY16 figures are from Lemon Tree Prospectus. FY17 and FY18 figures are from audited balance sheet.

30
Performance of owned/leased hotels by ageing – FY18 vs. FY17
ParametersFinancial
year
Adult Hotels (Stable - older than 3 years)
Toddler Hotels (Stabilizing -between 1-3
years old)
Infant Hotels (New - less than 1
year old)
Under-development
hotels
HotelsFY17 21 3 -
7FY18 21 3 4
Operating Rooms (year-end)
FY17 2,727 1061 -1,525
FY18 2,727 1281 422
Occupancy Rate (%)
FY17 77.5% 51.6% - Deep demand markets (high occupancies)FY18 77.6% 61.5% 66.0%
Average Daily Rate (Rs.)
FY17 3,411 5,302 - 1.5x of Adult Hotels in that year4
FY18 3,900 5,274 3,422
Hotel level EBITDAR2/room(Rs. million)
FY17 0.62 0.32 -High4
FY18 0.67 0.49 0.15
Hotel level EBITDAR2
Margin (%)
FY17 43% 32% -High4
FY18 44% 36% 15%
Hotel level ROCE*,3 (%)
FY17 11% 6% - 2.0x of Adult Hotels in that year4
FY18 12% 6% (1%)
Notes:1) 22 rooms were added in Lemon Tree Wildlife resort, Bandhavgarh which were operational from November-20172) Hotel level EBITDAR measures hotel-level results before lease rentals, debt service, depreciation and corporate expenses of the owned/leased hotels, and is a key measure ofcompany’s profitability3) Hotel level RoCE is calculated as : (Hotel level EBITDAR - lease rentals)/Capital deployed for operational owned & leased hotels.4) Post stabilization.
* Hotel level ROCE for hotels older than 5 years is 13% for FY18.

31
Key levers to drive better results
Current Stable
Inventory=
2,727
Triple Whammy
For Owned/Leased Assets:
Stabilized inventory
Higher pricing
More high value inventory
Equivalent to 2,300 (1.5x) rooms in
revenue potential and 3,050 (2.0x) rooms in EBITDAR
potential
Number of Rooms
Stabilizing=
550
Price Hike
Inventory Under
Development=
1,525*
13% ARR growth in FY18 vis-à-vis FY17
Opened in last 3 years
* Of these 1,525 rooms, currently 577 rooms are from Lemon Tree Premier, Mumbai International Airport. LTH is in the process of applying to convert some commercial spaces in thishotel’ to rooms. This will increase the hotel’s inventory by 94 rooms to 671, in which case total owned and leased inventory under development will increase to 1,619.
Cost Leadership
LTH CAGR of operating cost increase per room has been 4% between FY13 and FY18.

32
32%
53%
44%
27%
13%12%
9% 8%7% 7%
9%11% 12%
6% 6%
-1%
69%
68%
59%59%
60%
58%
57%
58%
59%
63%
65%
68%
45%
50%
55%
60%
65%
70%
75%
-10%
0%
10%
20%
30%
40%
50%
60%
70%
FY06 FY07 FY08 FY09 FY10 FY11 FY12 FY13 FY14 FY15 FY16 FY17 FY18
Adult Hotels (Stable - Older than 3 years) Toddler Hotels (Stablizing - between 1-3 years old)
Infant Hotels (New - less than 1 year old) All India Hotel Occupancy (%)
RoCE (%) Occupancy (%)
Lemon Tree Hotels RoCE : Hotel Buckets by ageing as on 31st March, 2018
Source : Industry occupancy is taken from Horwath HTL report.
Notes: 1. Hotel level RoCE is calculated as : (Hotel level EBITDAR - lease rentals)/Capital deployed for operational owned & leased hotels2. Hotel RoCE is based on first full year of operation

RoCE (%)
Opened in
Occupancy (%)
Source : Industry occupancy is taken from Horwath HTL report.
Lemon Tree Hotels RoCE : Hotel Buckets by opening
32%
53%
44%
27%
18%
21%
17%
11%10%
13%12%
14%14%
9%
11%14%
13%
9%11%
12%14%
15%
6%7% 6% 8%
11%12%
14%
2%5%
2%
7% 7%
11%
1%
69%
68%
59%59%
60%
58%57%
58%59%
63%
65%
68%
45%
50%
55%
60%
65%
70%
75%
0%
10%
20%
30%
40%
50%
60%
FY06
First Five
hotelsFY05 -FY08
FY07 FY08 FY09 FY10
Second Five
hotelsFY09
FY11 FY12
Third Seven
hotelsFY10 &FY11
FY13
Fourth Five
hotelsopened
during FY12
- FY15
FY14 FY15 FY16 FY17 FY18
Last Six
hotels
openedduring FY17
- FY18
First Five hotels opened in FY05 - FY08 Second Five hotels opened in FY09
Third Seven hotels opened in FY10 & FY11 Fourth Five hotels opened during FY12 - FY15
Last Six hotels opened during FY17 - FY18 All India Hotel Occupancy (%)
33
Notes: 1. Hotel level RoCE is calculated as : (Hotel level EBITDAR - lease rentals)/Capital deployed for operational owned & leased hotels2. Hotel RoCE is based on first full year of operation

Corporate Governance and Sustainability
Lemon Tree Hotel, Dehradun Lemon Tree Premier, Ahmedabad Lemon Tree Premier, Bengaluru
34

Board of Directors
35
Patanjali Govind Keswani (Chairman and Managing Director)
• Bachelor’s degree in electrical engineering from the Indian Institute of Technology, New Delhi• Postgraduate diploma degree in management from the Indian Institute of Management, Calcutta• Worked in: Tata Administrative Service/Taj Group of Hotels: 17 years; Last role as the Chief Operating Officer of Taj Business Hotels• Worked in: AT Kearney, New Delhi: 2 years; Director
Rattan Keswani (Deputy Managing Director) - Not related to the Chairman and Managing Director
• Bachelor’s degree in commerce from the DAV College, Panjab University • Diploma degree in hotel management from the Oberoi School of Hotel Management• Worked in: The Oberoi Group; Last role as the President of Trident Hotels• Over 30 years of experience in the hospitality industry and has been with Lemon Tree Hotels for over the last 6 years
Aditya Madhav Keswani (Non-Executive Director)
• Bachelor’s degree in arts from the New York University
Ravi Kant Jaipuria (Non-executive Director)
• Promoter and Director of Varun Beverages Limited and RJ Corp• A leading entrepreneur and business leader in India• Over 30 years of experience in the food and beverage industry
Niten Malhan (Non-executive Director)
• Bachelor’s degree in computer science and engineering from the Indian Institute of Technology, New Delhi • Postgraduate diploma degree in management from the Indian Institute of Management, Ahmedabad• Worked in: Warburg Pincus India Private Limited; Last role as the Managing Director and Co-head of Warburg Pincus, India• Worked in: McKinsey & Company, India; Engagement Manager • Over 15 years of experience across the fields of private equity, management consulting and entrepreneurship
Willem Albertus Hazeleger (Non-executive Director)
• Executive master’s degree in business administration from the Institut Européen d'Administration des Affaires (INSEAD) • Executive master’s degree in business administration from the Tsinghua University• Serves as the Chief Executive Officer (CEO) of APG Investments Asia Limited, the Hong Kong subsidiary of the APG Asset Management N.V

Board of Directors (contd.)
36
Gopal Sitaram Jiwarajka (Independent Director)
• Bachelor’s degree in commerce from the University of Bombay• Serves as the Managing Director and whole-time Director of Salora International Limited • Serves as a Director of PHD Chamber of Commerce and Industry• Worked in: Panasonic AVC Networks India Company Limited; Last role as a Director • Over 30 years of experience across the fields of manufacturing, marketing and consumer goods
Freyan Jamshed Desai (Independent Director)
• Bachelor’s degree in law from the University of Delhi • Master’s degree in law from King’s College, London• Serves as the General Counsel of the Novartis group of companies in India• Worked in: Amarchand & Mangaldas & Suresh A. Shroff & Co; Last role as a Partner• Over 30 years of experience across various legal fields
Paramartha Saikia (Independent Director)
• Bachelor’s degree in economics from the University of Delhi • Master’s degree in arts (economics) from the University of Delhi • Worked in: J. Walter Thomson Sdn. Bhd., Malaysia; Last role as the Chief Executive Officer (CEO) • Worked in: Iris Worldwide Integrated Marketing Private Limited; Last role as the Chief Executive Officer (CEO) • Worked in: Publicis India; Last role as the Chief Executive Officer (CEO) • Over 30 years of experience across the fields of marketing and brand development
Pradeep Mathur (Independent Director)
• Bachelor’s degree in commerce from the University of Poona • Postgraduate diploma degree in management from the Indian Institute of Management, Ahmedabad• Worked in: Tupperware, Asia Pacific; Last role as the Vice-President Finance and Chief Financial Officer • Worked in: Tupperware, India; Last role as the as the Managing Director• Over 30 years of experience across the fields of accounting, finance and leading a multinational company
Arvind Singhania (Independent Director)
• Promoter and Director of Ester Industries Limited• Serves as the Chairman and Chief Executive Officer of Ester Industries Limited • Over 30 years of experience across the fields of production, supply chain and people management
Ashish Kumar Guha (Independent Director)
• Bachelor’s degree in economics from the Jadavpur University in Kolkata• Serves as a Director and Advisor to the Chairman of Ambit Private Limited• Worked in: Lazard India Limited; Last role as the Chief Executive Officer (CEO) • Worked in: Heidelberg Cement; Last role as the Chief Executive Officer (CEO)• Over 30 years of experience across the fields of investment banking, advisory and industrial goods

Key Management Team
37
Patanjali Govind Keswani (Promoter, Chairman and Managing Director)
• Bachelor’s degree in electrical engineering from the Indian Institute of Technology, New Delhi• Postgraduate diploma degree in management from the Indian Institute of Management, Calcutta• Worked in: Tata Administrative Service/Taj Group of Hotels: 17 years; Last role as the Chief Operating Officer of Taj Business Hotels• Worked in: AT Kearney, New Delhi: 2 years; Director
Rattan Keswani (Deputy Managing Director) - Not related to the Chairman and Managing Director
• Bachelor’s degree in commerce from the DAV College, Panjab University • Postgraduate diploma degree in hotel management from the Oberoi School of Hotel Management• Worked in: Oberoi Group; Last role as the President of Trident Hotels• Over 30 years of experience in the hospitality industry• Been with Lemon Tree Hotels for over the last 6 years
Davander Tomar (Executive Vice-President, Corporate Affairs)
• Bachelor’s degree in commerce and law from the University of Delhi• Master’s degree in arts from the University of Delhi• Worked in: Taj Group of Hotels: 18 years; Last role as the Security Manager for Taj Palace Hotel, New Delhi • Over 30 years of experience in the hospitality industry • Been with Lemon Tree Hotels for over the last 15 years
Vikramjit Singh (President)
• Bachelor’s degree in commerce from the University of Delhi • Postgraduate diploma degree in hotel management and administration from the Taj Group of Hotels• Over 21 years of experience in the hospitality industry • Been with Lemon Tree Hotels for over 13 years
Jagdish Kumar Chawla (Executive Vice President - Projects and Engineering Services)
• Diploma degree in electrical engineering from Pusa Polytechnic, Pusa, New Delhi• Worked in: Taj Group of Hotels: 20 years• Worked in: National Thermal Power Corporation, Bharti Electric Steel Company Limited and Mother Dairy• Over 40 years of experience across the fields of engineering, constructions and operations• Been with Lemon Tree Hotels for over the last 15 years
Kapil Sharma (Chief Financial Officer)
• Bachelor’s degree in commerce from the University of Delhi • Qualified chartered accountant• Worked in: Leroy Somer & Controls India Private Limited; Last role as the Head of finance and accounts • Over 22 years of experience across the fields of accounting, financing and investing• Been with Lemon Tree Hotels for over the last 13 years

Key Management Team (contd.)
38
Sumant Jaidka (Senior Vice President - Operations)
• Graduate degree in hotel Management from the Salzburg School of Austria• Worked in: Taj Group of Hotels, Hilton, Maurya Sheraton, Crowne Plaza and Hyatt Regency across key managerial posts• Over 30 years of experience in the hospitality industry • Been with Lemon Tree Hotels for over the last 11 years
Prashant Mehrotra (Chief Revenue Officer)
• Graduate degree in hotel management from the Institute of Hotel Management, Gwalior• Worked in: The Oberoi Group & Radisson Hotels across key managerial posts• Over 17 years of experience in the hospitality industry • Been with Lemon Tree Hotels for over the last 12 years

Promoter &
Promoter Group:
31.07%
APG: 15.10%
Warburg Pincus:
12.51%
Other Institutions
(QIBs): 21.94%
Others (includes -
HNI’s/Retail/NII/
Employees):
19.38%
Shareholding structure
39Note: Shareholding as on 15 June, 2018
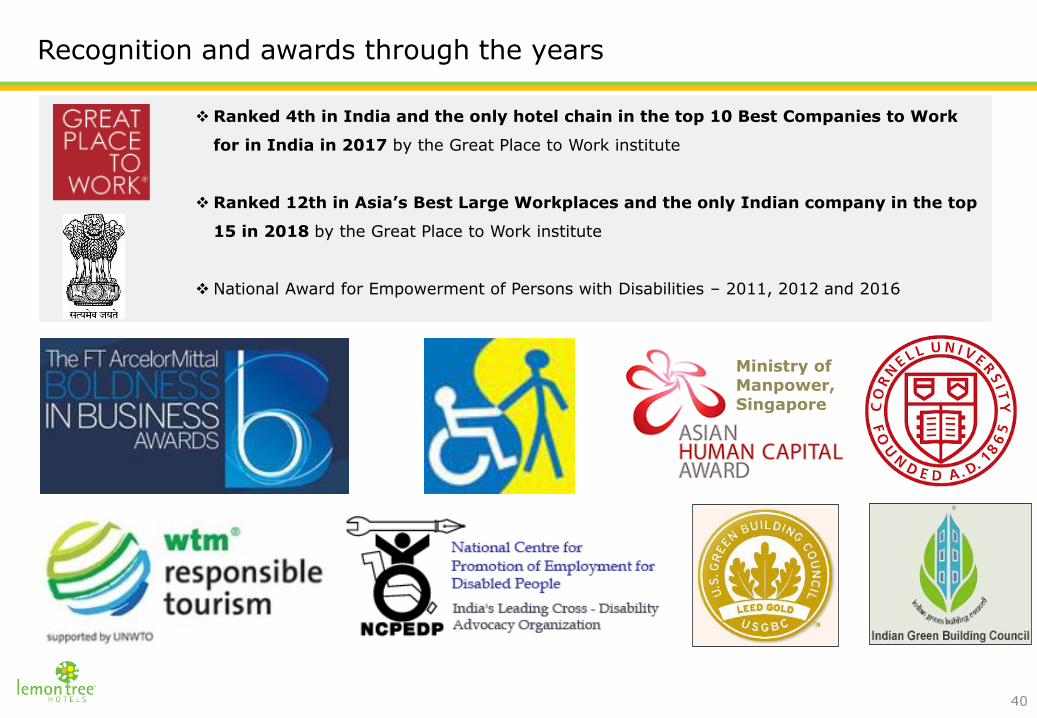
Recognition and awards through the years
Ranked 4th in India and the only hotel chain in the top 10 Best Companies to Work
for in India in 2017 by the Great Place to Work institute
Ranked 12th in Asia’s Best Large Workplaces and the only Indian company in the top
15 in 2018 by the Great Place to Work institute
National Award for Empowerment of Persons with Disabilities – 2011, 2012 and 2016
40
Ministry of Manpower, Singapore
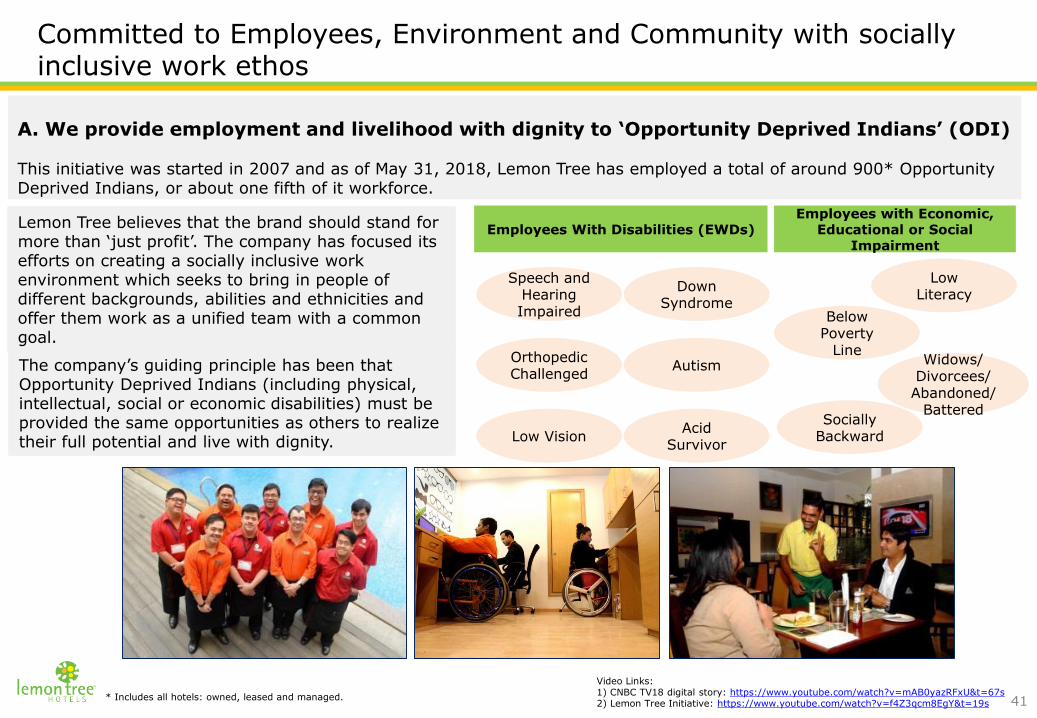
Lemon Tree believes that the brand should stand for more than ‘just profit’. The company has focused its efforts on creating a socially inclusive work environment which seeks to bring in people of different backgrounds, abilities and ethnicities and offer them work as a unified team with a common goal.
Committed to Employees, Environment and Community with socially inclusive work ethos
A. We provide employment and livelihood with dignity to ‘Opportunity Deprived Indians’ (ODI)
This initiative was started in 2007 and as of May 31, 2018, Lemon Tree has employed a total of around 900* Opportunity Deprived Indians, or about one fifth of it workforce.
Employees With Disabilities (EWDs)Employees with Economic,
Educational or Social Impairment
Below Poverty
Line
Low Literacy
Socially Backward
Widows/ Divorcees/ Abandoned/
Battered
Speech and Hearing Impaired
Orthopedic Challenged
Down Syndrome
Acid Survivor
Low Vision
AutismThe company’s guiding principle has been that Opportunity Deprived Indians (including physical, intellectual, social or economic disabilities) must be provided the same opportunities as others to realize their full potential and live with dignity.
41
Video Links:1) CNBC TV18 digital story: https://www.youtube.com/watch?v=mAB0yazRFxU&t=67s2) Lemon Tree Initiative: https://www.youtube.com/watch?v=f4Z3qcm8EgY&t=19s
* Includes all hotels: owned, leased and managed.
Committed to Employees, Environment and Community with socially inclusive work ethos (contd.)
B. Tribal ArtLemon Tree Hotel is among the largest buyers, nationally, of tribal art from Bastar, Madhya Pradesh. This comprises primarily of bronze age bell metal sculptures and enables the company to financially support tribal craftsmen from this region by showcasing their art extensively across all of its hotels.
C. Giving Back To SocietyLemon Tree Hotel supports and partners with the following NGOs and societies:Goonj: provides clothes and utensils to the impoverished.Suniye: runs a school for Speech and Hearing Impaired children from economically weaker sections of society. provides extensive life skills support to these children.Akshaya Patra: focus is to eliminate hunger in the city. It regularly provides a free meal to approximately 2000 destitute people in Delhi, across the city.Muskaan: provides comprehensive education, vocational training and work opportunities to young people who are intellectually challenged.Ramanujan Society: donates gifts to students for successfully clearing the IIT entrance exam.
D. Art Objects Through People For AnimalsLemon Tree supports People For Animals (PFA) by buying art sourced by PFA, which in turn is showcased across the company’s hotels. The money paid to PFA goes to support the welfare and care of animals across India.
E. K9 Policy/Pooch PolicyLemon Tree Hotel adopts a stray dog at each of its hotels across India. We name the dog, inoculate it and feed it well. Based on the personality of the dog, he/she is assigned a ‘fun’ role in the hotel and this brings joy to employees and guests alike.
42
Appendix
Lemon Tree Premier, CorbettLemon Tree Amarante Beach, Goa Lemon Tree Premier, Hyderabad
43

Lemon Tree Hotel, Coimbatore Lemon Tree Premier, City Center, Gurgaon Lemon Tree Vembanad Lake, Alleppey, Kerela
4444
Latest Performance – Q4 & FY18
45
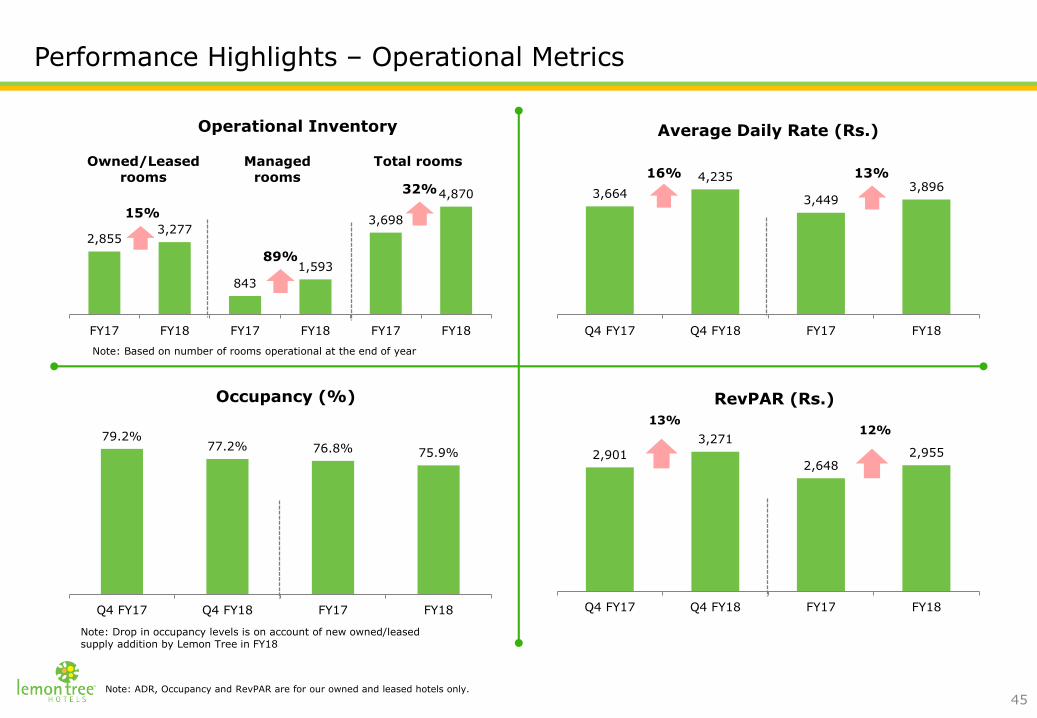
3,664
4,235
3,4493,896
Q4 FY17 Q4 FY18 FY17 FY18
Average Daily Rate (Rs.)
2,901
3,271
2,6482,955
Q4 FY17 Q4 FY18 FY17 FY18
RevPAR (Rs.)
12%13%
79.2%77.2% 76.8% 75.9%
Q4 FY17 Q4 FY18 FY17 FY18
Occupancy (%)
Performance Highlights – Operational Metrics
2,8553,277
843
1,593
3,698
4,870
FY17 FY18 FY17 FY18 FY17 FY18
Operational Inventory
Owned/Leased rooms
Managed rooms
Total rooms
15%
32%
13%16%
Note: ADR, Occupancy and RevPAR are for our owned and leased hotels only.
89%
Note: Drop in occupancy levels is on account of new owned/leased supply addition by Lemon Tree in FY18
Note: Based on number of rooms operational at the end of year

46
293
454
1,247
1,440
Q4 FY17 Q4 FY18 FY17 FY18
EBITDA (Rs. million)
1,1181,392
4,203
4,921
Q4 FY17 Q4 FY18 FY17 FY18
Total Income (Rs. million)
Performance Highlights – Financial Metrics (Consolidated)
102
245
460
672
Q4 FY17 Q4 FY18 FY17 FY18
Cash profit (PAT + Depreciation, Rs. million)
16%
46%
55%
140%
-22
117
-51
145
Q4 FY17 Q4 FY18 FY17 FY18
PAT (Rs. million)
24%
17%
47
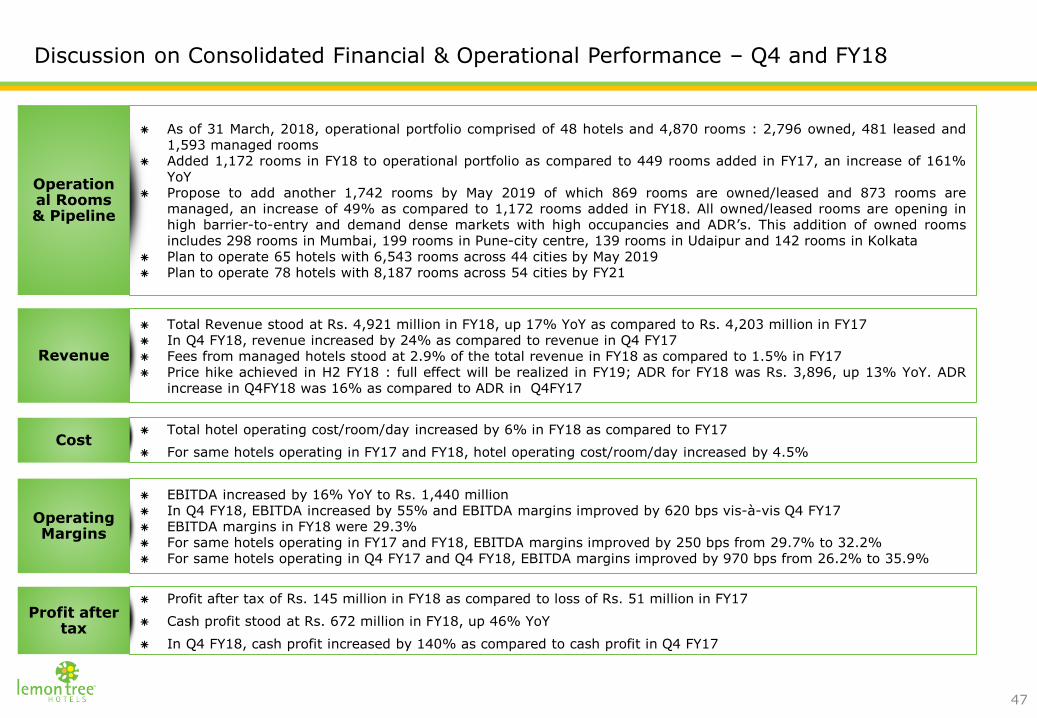
EBITDA increased by 16% YoY to Rs. 1,440 million In Q4 FY18, EBITDA increased by 55% and EBITDA margins improved by 620 bps vis-à-vis Q4 FY17 EBITDA margins in FY18 were 29.3% For same hotels operating in FY17 and FY18, EBITDA margins improved by 250 bps from 29.7% to 32.2% For same hotels operating in Q4 FY17 and Q4 FY18, EBITDA margins improved by 970 bps from 26.2% to 35.9%
As of 31 March, 2018, operational portfolio comprised of 48 hotels and 4,870 rooms : 2,796 owned, 481 leased and1,593 managed rooms
Added 1,172 rooms in FY18 to operational portfolio as compared to 449 rooms added in FY17, an increase of 161%YoY
Propose to add another 1,742 rooms by May 2019 of which 869 rooms are owned/leased and 873 rooms aremanaged, an increase of 49% as compared to 1,172 rooms added in FY18. All owned/leased rooms are opening inhigh barrier-to-entry and demand dense markets with high occupancies and ADR’s. This addition of owned roomsincludes 298 rooms in Mumbai, 199 rooms in Pune-city centre, 139 rooms in Udaipur and 142 rooms in Kolkata
Plan to operate 65 hotels with 6,543 rooms across 44 cities by May 2019 Plan to operate 78 hotels with 8,187 rooms across 54 cities by FY21
Total hotel operating cost/room/day increased by 6% in FY18 as compared to FY17
For same hotels operating in FY17 and FY18, hotel operating cost/room/day increased by 4.5%
Total Revenue stood at Rs. 4,921 million in FY18, up 17% YoY as compared to Rs. 4,203 million in FY17 In Q4 FY18, revenue increased by 24% as compared to revenue in Q4 FY17 Fees from managed hotels stood at 2.9% of the total revenue in FY18 as compared to 1.5% in FY17 Price hike achieved in H2 FY18 : full effect will be realized in FY19; ADR for FY18 was Rs. 3,896, up 13% YoY. ADR
increase in Q4FY18 was 16% as compared to ADR in Q4FY17
Profit after tax of Rs. 145 million in FY18 as compared to loss of Rs. 51 million in FY17
Cash profit stood at Rs. 672 million in FY18, up 46% YoY
In Q4 FY18, cash profit increased by 140% as compared to cash profit in Q4 FY17
Revenue
Operational Rooms & Pipeline
Operating Margins
Cost
Discussion on Consolidated Financial & Operational Performance – Q4 and FY18
Profit after tax

48
Profit & Loss Statement (Consolidated)
Rs. million Q4 FY17 Q4 FY18Change
(%)FY17 FY18
Change (%)
Revenue from operations 1,113 1,320 19% 4,121 4,843 18%
Other income 5 72 1,219% 82 78 (5%)
Total income 1,118 1,392 24% 4,203 4,921 17%
Cost of F&B consumed 89 115 29% 353 436 23%
Employee benefit expenses 271 296 9% 969 1,096 13%
Other expenses 465 527 13% 1,634 1,949 19%
Total expenses 825 938 14% 2,956 3,481 18%
EBITDA 293 454 55% 1,247 1,440 16%
EBITDA margin (%) 26.2% 32.6% 640 bps 29.7% 29.3% (40) bps
Finance costs 186 201 8%776
784 1%
Depreciation & amortization
124 128 3% 510 526 3%
PBT (2) 131 - (3) 183 -
Tax expense 20 14 (30%) 48 38 (21%)
PAT (22) 117 - (51) 145 -
Cash Profit 102 245 140% 459 672 46%
49
Balance Sheet Snapshot (Consolidated)
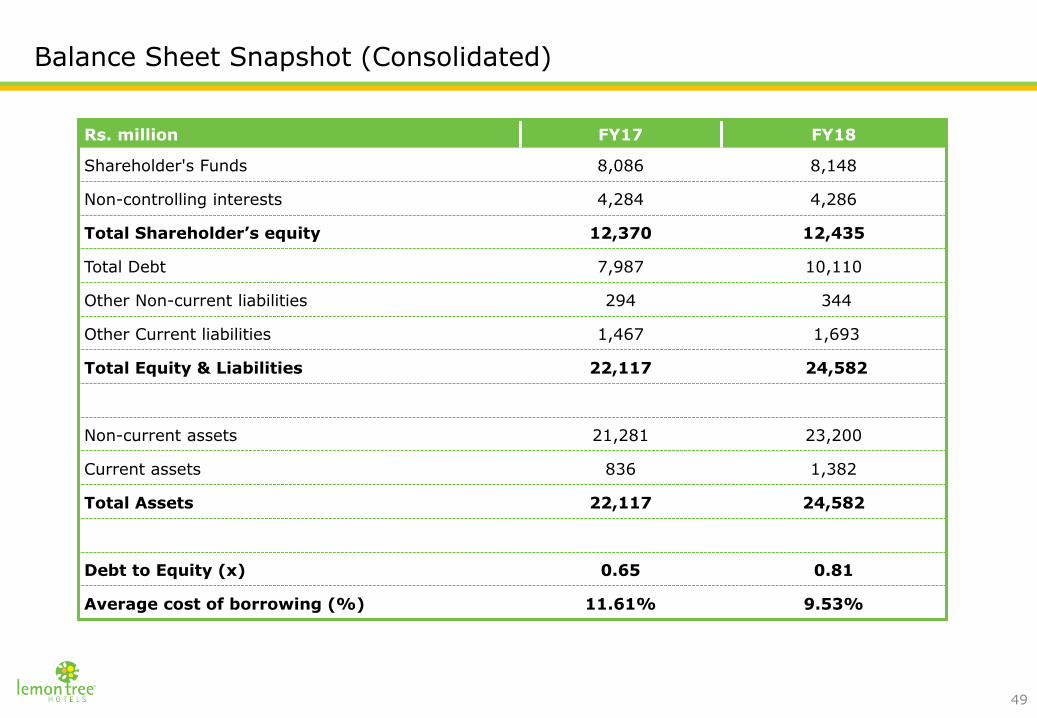
Rs. million FY17 FY18
Shareholder's Funds 8,086 8,148
Non-controlling interests 4,284 4,286
Total Shareholder’s equity 12,370 12,435
Total Debt 7,987 10,110
Other Non-current liabilities 294 344
Other Current liabilities 1,467 1,693
Total Equity & Liabilities 22,117 24,582
Non-current assets 21,281 23,200
Current assets 836 1,382
Total Assets 22,117 24,582
Debt to Equity (x) 0.65 0.81
Average cost of borrowing (%) 11.61% 9.53%

50
Operational Performance by Brands – FY18 vs. FY17
Parameters Occupancy Rate (%)Average Daily Rate
(Rs.)
Hotel level EBITDAR2/room (Rs.
million)
Hotel level EBITDAR2
Margin
By Brand FY17 FY18Change
(%)FY17 FY18
Change (%)
FY17 FY18Change
(%)FY17 FY18
Change (%)
Lemon Tree Premier 74.6% 77.2% 3.5% 4,123 4,773 16% 0.75 0.88 17% 43% 46% 7%
Lemon Tree Hotels 77.1% 74.2% (3.8%)1 3,522 3,848 9% 0.60 0.51 (15%)1 42% 36% (14%)1
Red Fox Hotels 79.1% 77.2% (2.4%)1 2,372 2,860 21% 0.40 0.43 8% 43% 45% 5%
Note:2) Hotel level EBITDAR measures hotel-level results before lease rentals, debt service, depreciation and corporate expenses of the owned/leased hotels, and is a keymeasure of company’s profitability.
1) Drop in occupancy levels, hotel level EBITDAR/room and hotel level EBITDAR margin is on account of new owned/leased supply addition by Lemon Tree in FY18.

Portfolio as on 31st March, 2018
45
Operational Portfolio
Owned Leased Managed Total
31.03.2018 Hotels Rooms Hotels Rooms Hotels Rooms Hotels Rooms
Lemon Tree Premier 4 796 2 161 4 344 10 1,301
Lemon Tree Hotels 13 1,241 4 320 13 937 30 2,498
Red Fox Hotels 5 759 - - 3 312 8 1,071
Total 22 2,796 6 481 20 1,593 48 4,870
Pipeline Owned Leased Managed Total
31.03.2018 Hotels Rooms Hotels Rooms Hotels Rooms Hotels Rooms
Lemon Tree Premier 5 1,355# - - 2 171 7 1,526
Lemon Tree Hotels 1 79 - - 16 1,169 17 1,248
Red Fox Hotels - - 1 91 - - 1 91
Total 6 1,434 1 91 18 1,340 25 2,865
Between April 1, 2018 and May 15, 2018, 2 hotels and 86 rooms have been operationalized from the pipeline,taking the total for operational rooms to 4,956
Between April 1, 2018 and May 15, 2018, 5 hotels and 417 rooms have been added to the pipeline, taking the totalof pipeline to 3,196 rooms
869 owned/leased rooms and 787 additional managed rooms will be operational by May 2019 Balance rooms will be operationalized by FY21
# Of these 1,525 rooms, currently 577 rooms are from Lemon Tree Premier, Mumbai International Airport. LTH is in the process of applying to convert some commercial spaces in thishotel to rooms. This will increase the hotel’s inventory by 94 rooms to 671, in which case total owned and leased inventory under development will increase to 1,619.

52
Expansion Plans – Hotels under Development
Total estimated project cost is Rs. 17,250 million
Total capital deployed/capital expenditure already incurred (i.e. CWIP + Security Deposit forleased assets under-development + Land Capitalised + Capital advances – Capital creditors) ason 31st March, 2018 is Rs. 8,680 million
Balance investment of Rs. 8,570 million will be deployed over the next 3 years in a phasedmanner, the majority of which will be through internal accruals
Under-development hotels Type RoomsExpected
Opening dateOwnership
(%)
Red Fox Hotel, DehradunLeased
(40 years)91 Jul-18 57.98%
Lemon Tree Premier, City Centre, Pune
Owned 199 Dec-18 57.98%
Lemon Tree Premier, Andheri (East), Mumbai
Owned 298 Jan-19 100.00%
Lemon Tree Premier, Udaipur Owned 139 Apr-19 57.98%
Lemon Tree Premier, Kolkata Owned 142 Apr-19 57.98%
Lemon Tree Vembanad Lake Resort, Alleppey, Kerela1
Owned 10 Oct-20 100.00%
Lemon Tree Mountain Resort, Shimla Owned 69 Dec-20 100.00%
Lemon Tree Premier, Intl. Airport, Mumbai
Owned 5772 Mar-21 57.98%
Total 1,525
Note:1) Expansion in existing hotel2) LTH is in the process of applying to convert some commercial spaces in this hotel to rooms. This will increase the hotel’s inventory by 94 rooms to 671, in which case
total owned and leased inventory under development will increase to 1,619

53
Expansion Plans – Pipeline of Management Contracts (as of 15 June, 2018)
Management Contracts Pipeline Rooms Expected Opening date Tenure
Lemon Tree Hotel, Lucknow 51 Sep-18 11
Red Fox Hotel, Morjim, Goa 111 Oct-18 10
Lemon Tree Hotel, Shirdi 59 Jan-19 12
Lemon Tree Hotel, Rishikesh 102 Jan-19 12
Lemon Tree Hotel, Amritsar 65 Jan-19 10
Red Fox Hotel, Neelkanth 80 Feb-19 12
Lemon Tree Premier, Rishikesh 66 Feb-19 12
Lemon Tree Hotel, Gulmarg 35 Mar-19 10
Lemon Tree Premier, Dwarka 108 Mar-19 15
Lemon Tree Hotel, Bokaro 70 Mar-19 10
Managed rooms to be operational in FY19 747
Lemon Tree Resort, Mussoorie 40 Apr-19 12
Lemon Tree Hotel, Jhansi 60 July-19 12
Lemon Tree Hotel, Gwalior 104 July-19 12
Lemon Tree Hotel, Aligarh 68 July-19 12
Lemon Tree Premier, Coorg 63 Oct-19 15
Managed rooms to be operational in FY20 335
Lemon Tree Suites, Manesar 260 Apr-20 15
Lemon Tree Hotel, Sonamarg 40 Apr-20 10
Lemon Tree Hotel, Kathmandu 75 Apr-20 12
Lemon Tree Hotel, Thimpu 38 Oct-20 10
Lemon Tree Hotel, Ludhiana 60 Dec-20 10
Lemon Tree Hotel, Trivandrum 100 Jan-21 10
Lemon Tree Premier, Vijaywada 120 Mar-21 15
Managed rooms to be operational in FY21 693
Total managed rooms in pipeline 1,775
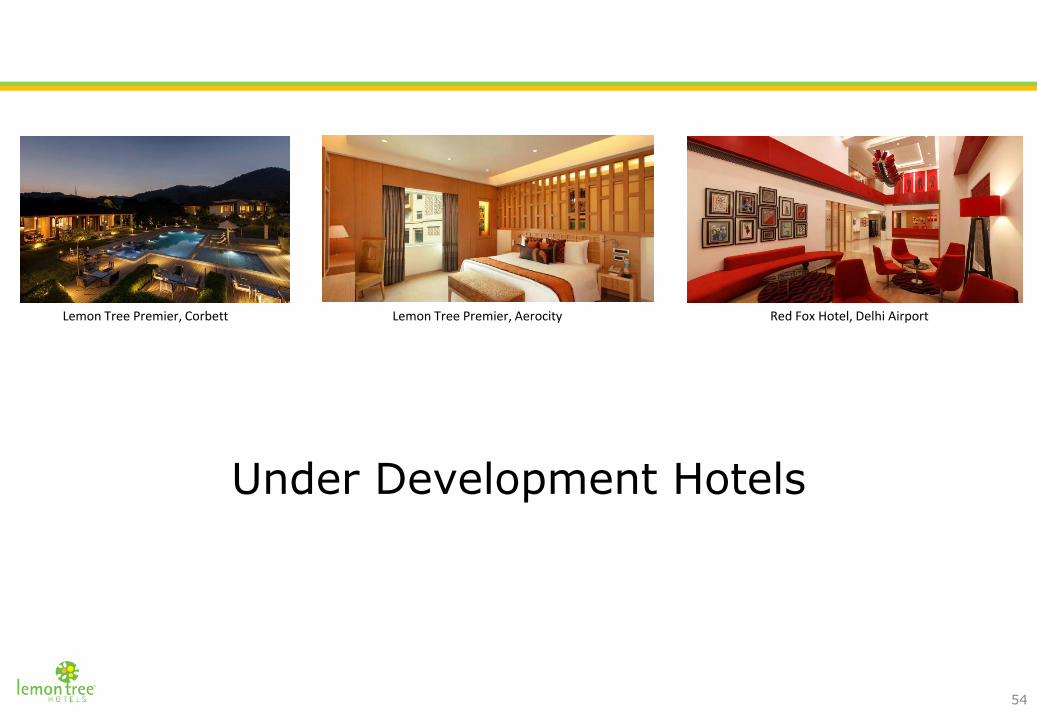
Under Development Hotels
Lemon Tree Premier, Corbett Lemon Tree Premier, Aerocity Red Fox Hotel, Delhi Airport
54

Lemon Tree Premier – Pune | Image Representation
Note: Hotel is expected to have 199 rooms and expected month of opening is December-2018.55

Note: Photograph as on June 15th, 2018Hotel is expected to have 199 rooms and expected month of opening is December-2018.
Lemon Tree Premier – Pune
56
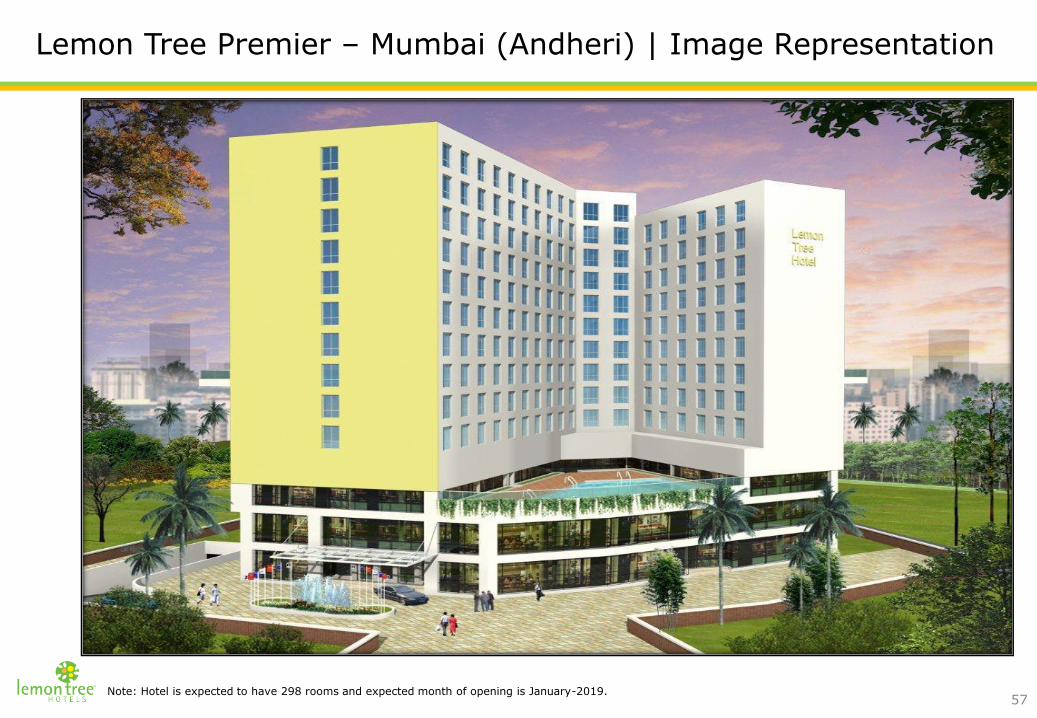
Note: Hotel is expected to have 298 rooms and expected month of opening is January-2019.
Lemon Tree Premier – Mumbai (Andheri) | Image Representation
57
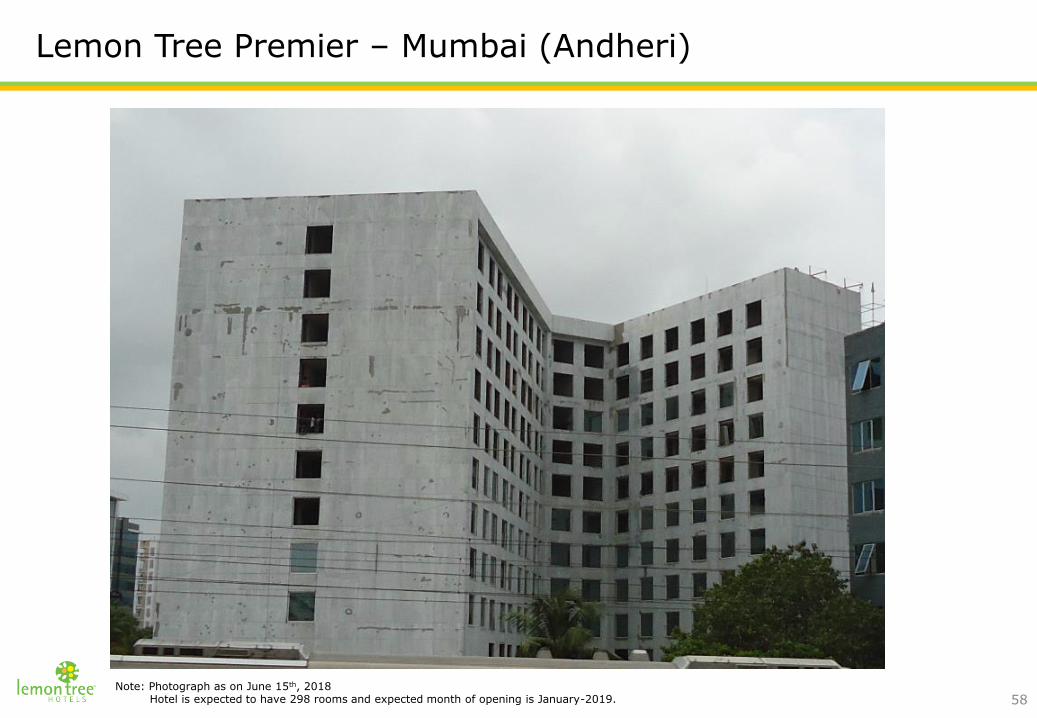
Note: Photograph as on June 15th, 2018Hotel is expected to have 298 rooms and expected month of opening is January-2019.
Lemon Tree Premier – Mumbai (Andheri)
58
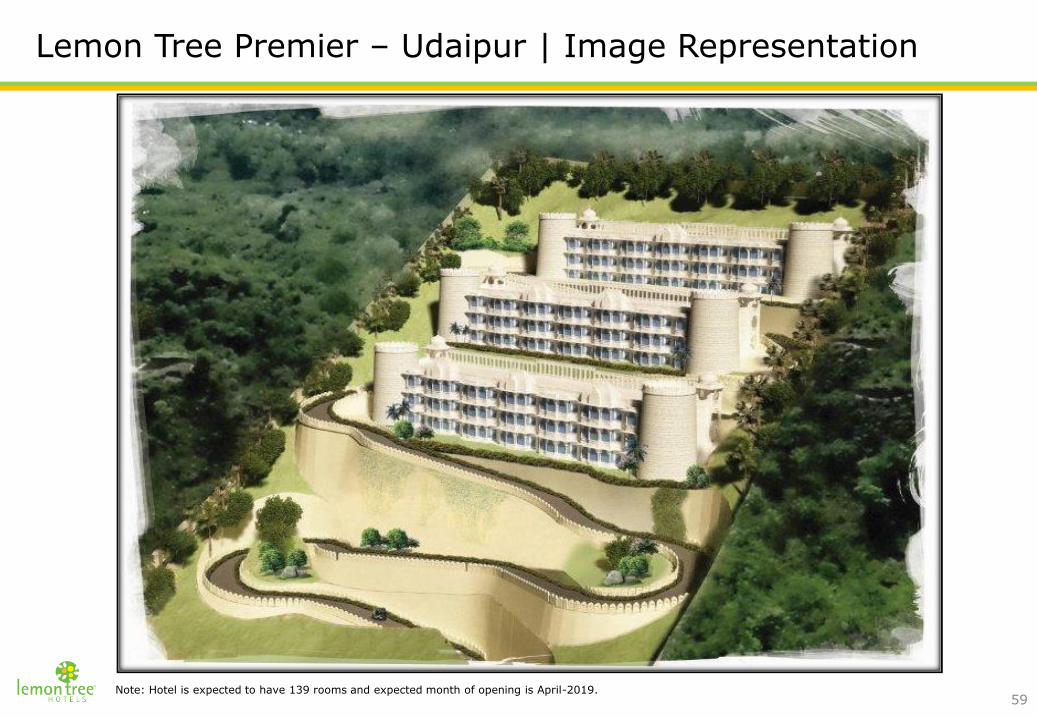
Note: Hotel is expected to have 139 rooms and expected month of opening is April-2019.
Lemon Tree Premier – Udaipur | Image Representation
59
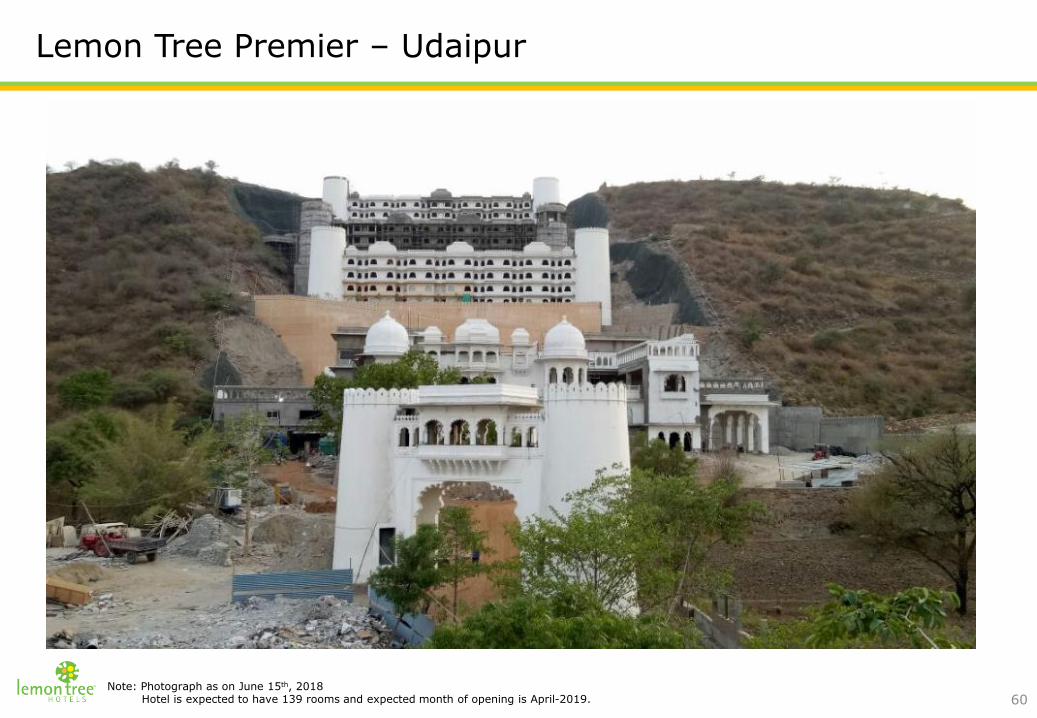
Note: Photograph as on June 15th, 2018Hotel is expected to have 139 rooms and expected month of opening is April-2019.
Lemon Tree Premier – Udaipur
60
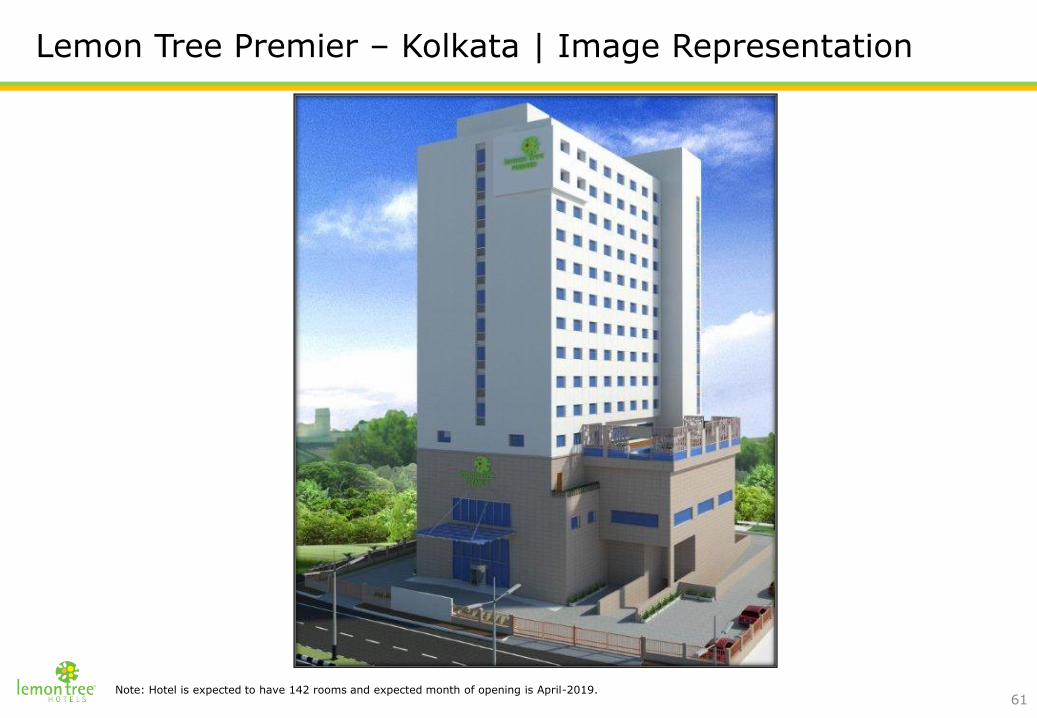
Note: Hotel is expected to have 142 rooms and expected month of opening is April-2019.
Lemon Tree Premier – Kolkata | Image Representation
61
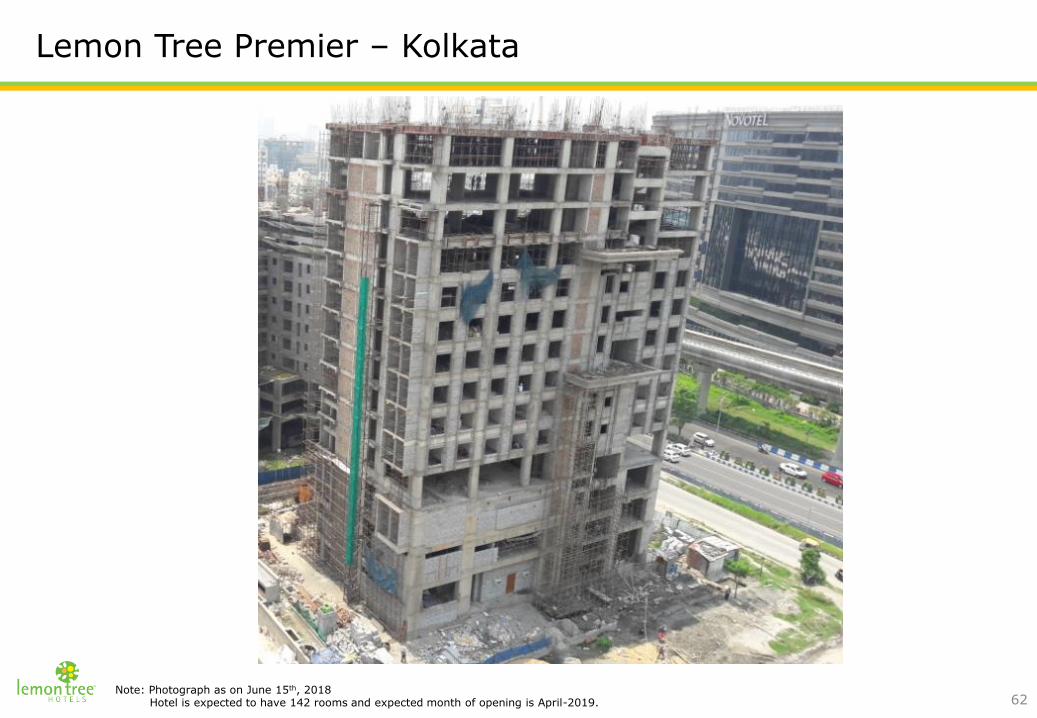
Note: Photograph as on June 15th, 2018Hotel is expected to have 142 rooms and expected month of opening is April-2019.
Lemon Tree Premier – Kolkata
62

Note: Hotel is expected to have 69 rooms and expected month of opening is December-2020.
Lemon Tree Mountain Resort – Shimla | Image Representation
63
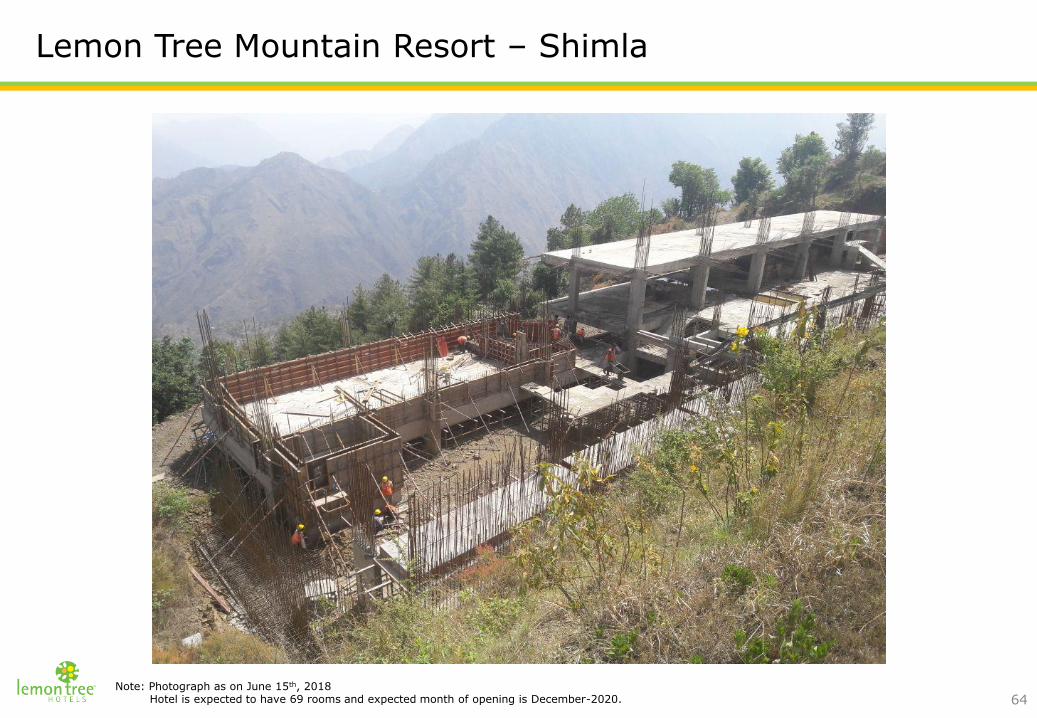
Lemon Tree Mountain Resort – Shimla
Note: Photograph as on June 15th, 2018Hotel is expected to have 69 rooms and expected month of opening is December-2020. 64

Note: Currently, hotel is expected to have 577 rooms. LTH is in the process of applying to convert some commercial spaces in this hotel to rooms. This will increase the hotel’s inventory by 94 rooms to 671. Expected month of opening is March-2021.
Lemon Tree Premier – Mumbai Airport | Image Representation
65

Lemon Tree Premier – Mumbai Airport
Note: Photograph as on June 15th, 2018Currently, hotel is expected to have 577 rooms. LTH is in the process of applying to convert some commercial spaces in this hotel to rooms. This will increase the hotel’s inventory by 94 rooms to 671. Expected month of opening is March-2021. 66

Thank You
67
Related Documents