UNAIDS RepoRt oN theglobAl AIDS epIDemIc | 2012
Copyright © 2012Joint United Nations Programme on HIV/AIDS (UNAIDS)All rights reserved
The designations employed and the presentation of the material in this publication do not imply the expression of any opinion whatsoever on the part of UNAIDS concerning the legal status of any country, territory, city or area or of its authorities, or concerning the delimitation of its frontiers or boundaries. UNAIDS does not warrant that the information published in this publication is complete and correct and shall not be liable for any damages incurred as a result of its use.
WHO Library Cataloguing-in-Publication Data
Global report: UNAIDS report on the global AIDS epidemic 2012
“UNAIDS / JC2417E”
1.HIV infections – therapy. 2.HIV infections – diagnosis. 3.HIV infections – epidemiology. 4.Acquired immunodeficiency syndrome – prevention and control. 5.International cooperation. I.UNAIDS.
ISBN 978-92-9173-996-7 (Printed version) (NLM classification: WC 503.6) ISBN 978-92-9173-592-1 (Digital version)
globAl RepoRt
UNAIDS RepoRt oN theglobAl AIDS epIDemIc | 2012

FoReWoRD 4
INtRoDUctIoN 6
StAte oF the epIDemIc 8
tARget 1 Sexual transmission 16
tARget 2 People who inject drugs 34
tARget 3 HIV infection among children and keeping their mothers alive 42
tARget 4 Treatment 50
tARget 5 Tuberculosis and HIV 58
tARget 6 Resources and spending 62
tARget 7 Gender and the HIV response 70
tARget 8 Stigma, discrimination and the law 78
tARget 9 Eliminating restrictions on entry, stay and residence 86
tARget 10 Integration 90
ReFeReNceS 96
ANNexeS A1
contents
4
UNAIDS
Foreword
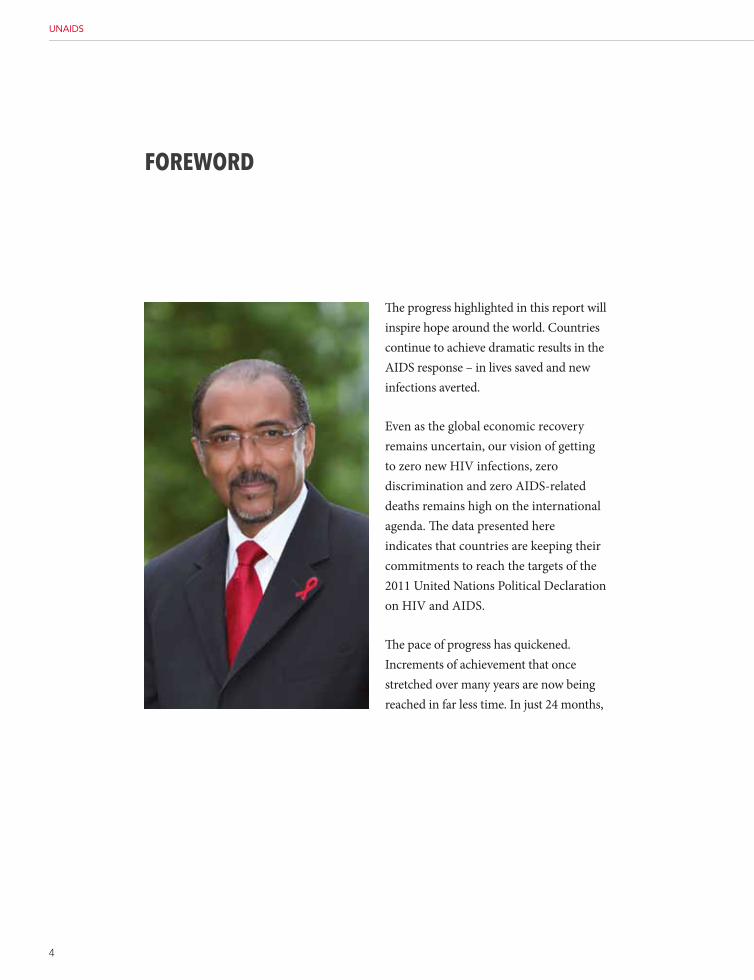
The progress highlighted in this report will inspire hope around the world. Countries continue to achieve dramatic results in the AIDS response – in lives saved and new infections averted.
Even as the global economic recovery remains uncertain, our vision of getting to zero new HIV infections, zero discrimination and zero AIDS-related deaths remains high on the international agenda. The data presented here indicates that countries are keeping their commitments to reach the targets of the 2011 United Nations Political Declaration on HIV and AIDS.
The pace of progress has quickened. Increments of achievement that once stretched over many years are now being reached in far less time. In just 24 months,
5
2012 GLOBAL REPORT
60% more people have accessed lifesaving HIV treatment, with a corresponding drop in mortality. New infection rates have fallen by 50% or more in 25 countries – 13 of them in in sub-Saharan Africa. Half of all the reductions in HIV infections in the past two years have been among children; this has emboldened our conviction that achieving an AIDS-free generation is not only possible, but imminent.
Yet, it is much too early to congratulate ourselves. AIDS is not over. The data in this report – provided by a record 186 UN Member States, indicate that in many countries, people living with and affected by HIV still face stigma, discrimination and injustice. Women and girls are still at higher risk because of gender inequity and sexual violence. There is still a 30% gap between
resources that are available and what is needed annually by 2015.
There are around 1000 days until the deadline for achieving the 2015 AIDS targets. Every one of the next 1000 days will be a test of our commitment to bring an end to this epidemic. We count on all partners globally, regionally and in countries to unite in advancing the AIDS response and delivering breakthrough results for people. Our targets are in sight.
Michel SidibéUNAIDS Executive Director
Under Secretary-General of the United Nations
6
UNAIDS
IntrodUctIonThe global community has embarked on an historic quest to lay the foundation for the eventual end of the AIDS epidemic.
This effort is more than merely visionary. It is entirely feasible. Unprecedented gains have been achieved in reducing the number of both adults and children newly infected with HIV, in lowering the numbers of people dying from AIDS-related causes and in implementing enabling policy frameworks that accelerate progress. A new era of hope has emerged in countries and communities across the world that had previously been devastated by AIDS.
However, a world in which AIDS has been eliminated can only be achieved through renewed and sustained commitment and solidarity and only if the available evidence and limited resources are used as efficiently and effectively as possible.
Recognizing the genuine opportunity to plan for the end of AIDS, countries pledged in the 2011 United Nations Political Declaration on HIV and AIDS: Intensifying Our Efforts to Eliminate HIV and AIDS (1) to take specific steps to achieve ambitious goals by 2015. Drawing from the 2011 Political Declaration, UNAIDS has articulated 10 specific targets for 2015 to guide collective action.
1. Reduce sexual transmission by 50%.2. Reduce HIV transmission among people who inject drugs by 50%.3. Eliminate new infections among children and substantially reduce the number of
mothers dying from AIDS-related causes.4. Provide antiretroviral therapy to 15 million people.5. Reduce the number of people living with HIV who die from tuberculosis by 50%.6. Close the global AIDS resource gap and reach annual global investment of US$
22 billion to US$ 24 billion in low- and middle-income countries.7. Eliminate gender inequalities and gender-based abuse and violence and increase
the capacity of women and girls to protect themselves from HIV.8. Eliminate stigma and discrimination against people living with and affected by
HIV by promoting laws and policies that ensure the full realization of all human rights and fundamental freedoms.
9. Eliminate restrictions for people living with HIV on entry, stay and residence.10. Eliminate parallel systems for HIV-related services to strengthen the integration
of the AIDS response in global health and development efforts.
7
2012 GLOBAL REPORT
In embracing the targets in the 2011 Political Declaration, countries committed to monitor and report on progress and challenges encountered in their national AIDS responses. To facilitate biennial reporting on national progress, UNAIDS collaborated with partners to develop a set of core indicators against which countries would report (2).
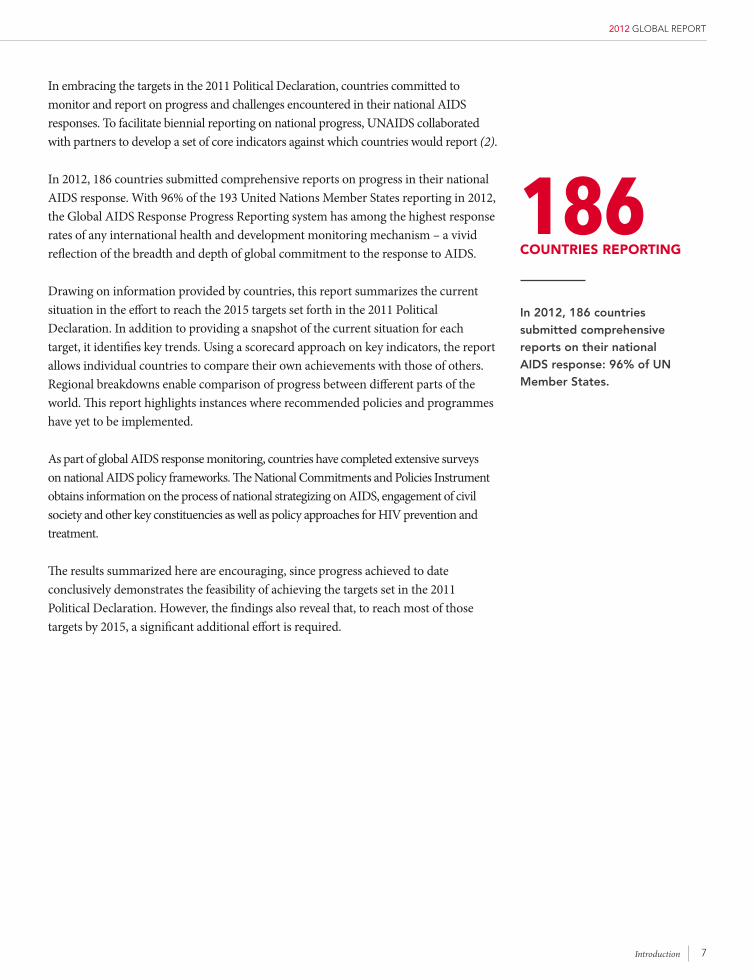
In 2012, 186 countries submitted comprehensive reports on progress in their national AIDS response. With 96% of the 193 United Nations Member States reporting in 2012, the Global AIDS Response Progress Reporting system has among the highest response rates of any international health and development monitoring mechanism – a vivid reflection of the breadth and depth of global commitment to the response to AIDS.
Drawing on information provided by countries, this report summarizes the current situation in the effort to reach the 2015 targets set forth in the 2011 Political Declaration. In addition to providing a snapshot of the current situation for each target, it identifies key trends. Using a scorecard approach on key indicators, the report allows individual countries to compare their own achievements with those of others. Regional breakdowns enable comparison of progress between different parts of the world. This report highlights instances where recommended policies and programmes have yet to be implemented.
As part of global AIDS response monitoring, countries have completed extensive surveys on national AIDS policy frameworks. The National Commitments and Policies Instrument obtains information on the process of national strategizing on AIDS, engagement of civil society and other key constituencies as well as policy approaches for HIV prevention and treatment.
The results summarized here are encouraging, since progress achieved to date conclusively demonstrates the feasibility of achieving the targets set in the 2011 Political Declaration. However, the findings also reveal that, to reach most of those targets by 2015, a significant additional effort is required.
186coUNtRIeS RepoRtINg
In 2012, 186 countries submitted comprehensive reports on their national AIDS response: 96% of UN Member States.
Introduction
8
UNAIDS
stAte oF tHe ePIdeMIcAlthough AIDS remains one of the world’s most serious health challenges, global solidarity in the AIDS response during the past decade continues to generate extraordinary health gains. Historic success in bringing HIV programmes to scale – combined with the emergence of powerful new tools to prevent people from becoming infected and from dying from AIDS-related causes – has enabled the foundation to be laid for the eventual end of AIDS.
Although much of the news on AIDS is encouraging, challenges remain. The number of people newly infected globally is continuing to decline, but national epidemics continue to expand in many parts of the world. Further, declines in the numbers of children dying from AIDS-related causes and acquiring HIV infection, although substantial, need to be accelerated to achieve global AIDS targets.
The globAl epIDeMIc AT A glANce
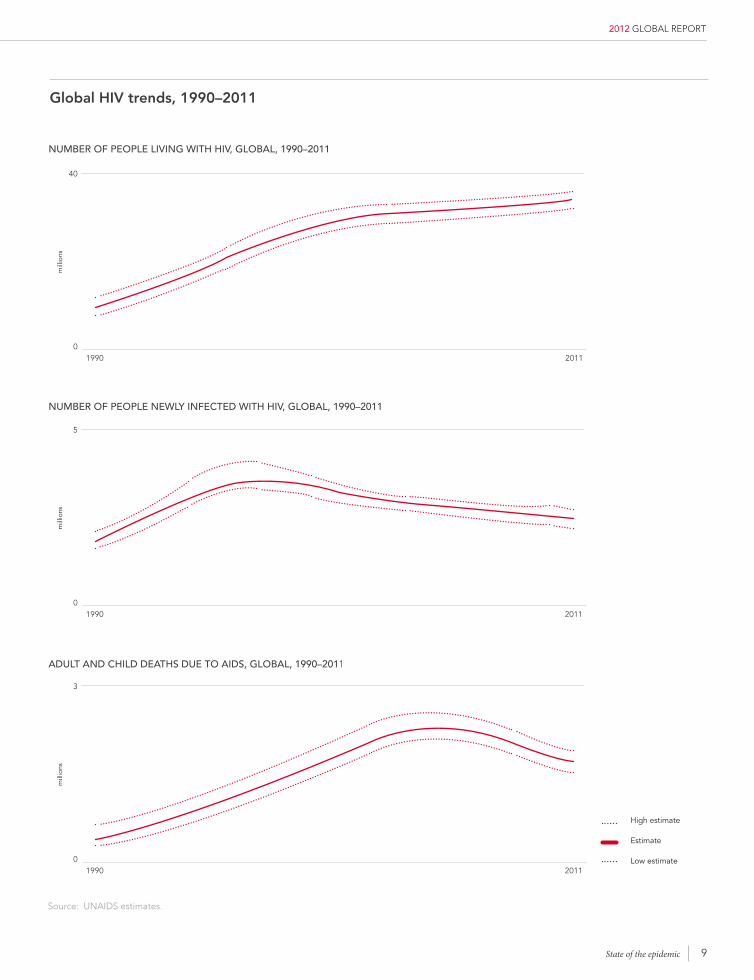
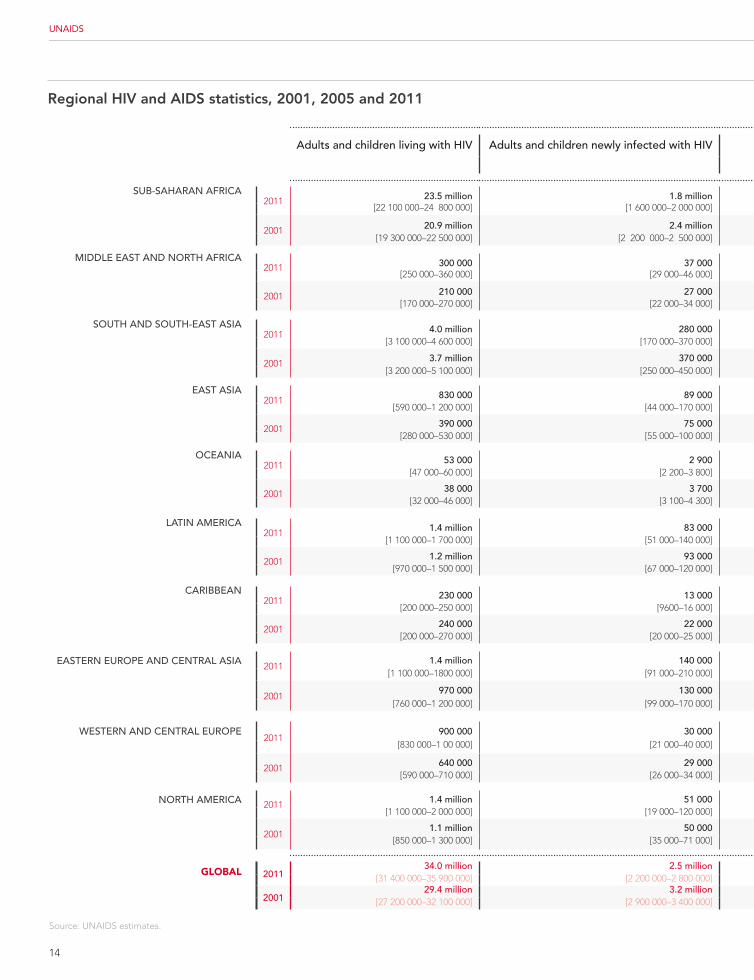
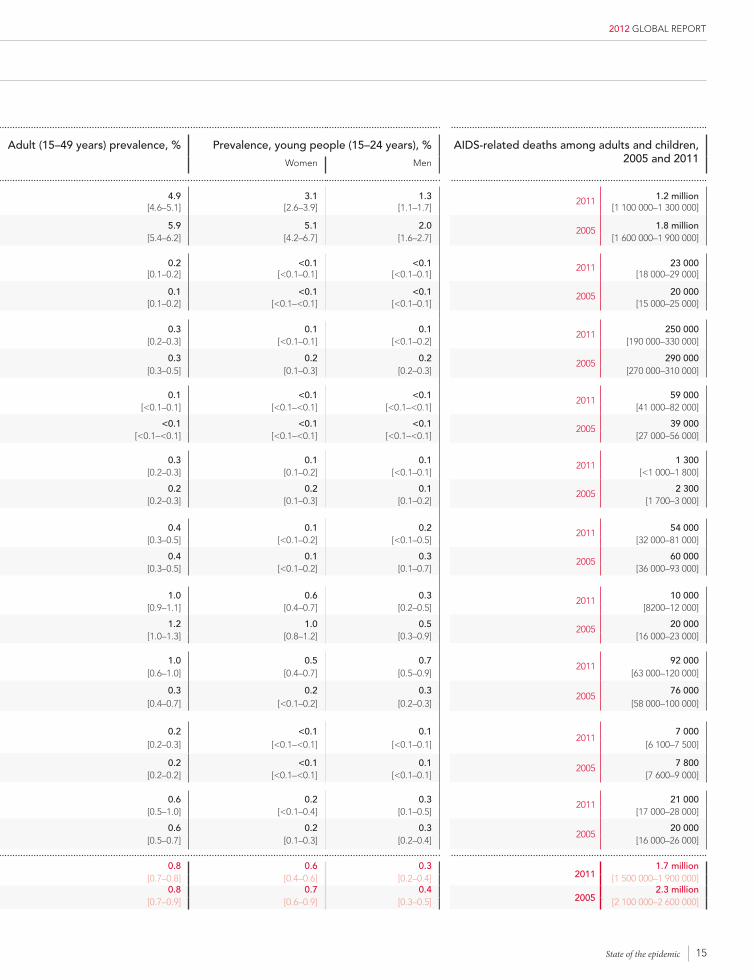
Globally, 34.0 million [31.4 million–35.9 million] people were living with HIV at the end of 2011. An estimated 0.8% of adults aged 15-49 years worldwide are living with HIV, although the burden of the epidemic continues to vary considerably between countries and regions.
Sub-Saharan Africa remains most severely affected, with nearly 1 in every 20 adults (4.9%) living with HIV and accounting for 69% of the people living with HIV worldwide. Although the regional prevalence of HIV infection is nearly 25 times higher in sub-Saharan Africa than in Asia, almost 5 million people are living with HIV in South, South-East and East Asia combined. After sub-Saharan Africa, the regions most heavily affected are the Caribbean and Eastern Europe and Central Asia, where 1.0% of adults were living with HIV in 2011.
New INfecTIoNS DeclININg
Worldwide, the number of people newly infected continues to fall: the number of people (adults and children) acquiring HIV infection in 2011 (2.5 million [2.2 million–2.8 million]) was 20% lower than in 2001. Here, too, variation is apparent. The sharpest declines in the numbers of people acquiring HIV infection since 2001 have occurred in the Caribbean (42%) and sub-Saharan Africa (25%).
9
2012 GLOBAL REPORT
State of the epidemic
global hIV trends, 1990–2011
High estimate
Estimate
Low estimate
NUmbeR oF people lIvINg WIth hIv, globAl, 1990–2011
NUmbeR oF people NeWly INFecteD WIth hIv, globAl, 1990–2011
ADUlt AND chIlD DeAthS DUe to AIDS, globAl, 1990–2011
mill
ions
m
illio
ns
mill
ions
0
0
0
1990
1990
1990
2011
2011
2011
40
5
3
Source: UNAIDS estimates.
10
UNAIDS
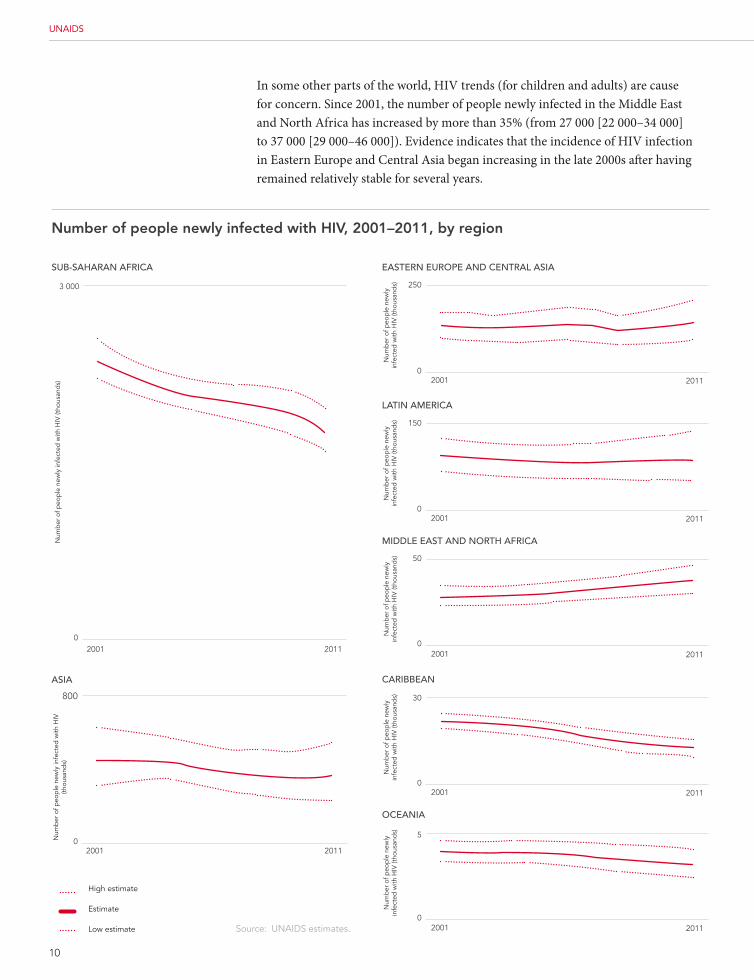
In some other parts of the world, HIV trends (for children and adults) are cause for concern. Since 2001, the number of people newly infected in the Middle East and North Africa has increased by more than 35% (from 27 000 [22 000–34 000] to 37 000 [29 000–46 000]). Evidence indicates that the incidence of HIV infection in Eastern Europe and Central Asia began increasing in the late 2000s after having remained relatively stable for several years.
Number of people newly infected with hIV, 2001–2011, by region
High estimate
Estimate
Low estimate
ASIA
Num
ber
of p
eop
le n
ewly
infe
cted
with
HIV
(th
ousa
nds)
02001 2011
800
02001 2011
30
Num
ber
of p
eop
le n
ewly
in
fect
ed w
ith H
IV (t
hous
and
s)
cARIbbeAN
02001 2011
250
Num
ber
of p
eop
le n
ewly
in
fect
ed w
ith H
IV (t
hous
and
s)
eASteRN eURope AND ceNtRAl ASIA
02001 2011
150
Num
ber
of p
eop
le n
ewly
in
fect
ed w
ith H
IV (t
hous
and
s)
lAtIN AmeRIcA
02001 2011
50
Num
ber
of p
eop
le n
ewly
in
fect
ed w
ith H
IV (t
hous
and
s)
mIDDle eASt AND NoRth AFRIcA
02001 2011
5
Num
ber
of p
eop
le n
ewly
in
fect
ed w
ith H
IV (t
hous
and
s)
oceANIA
Num
ber
of p
eop
le n
ewly
infe
cted
with
HIV
(tho
usan
ds)
SUb-SAhARAN AFRIcA
0
3 000
2001 2011
Source: UNAIDS estimates.
11
2012 GLOBAL REPORT
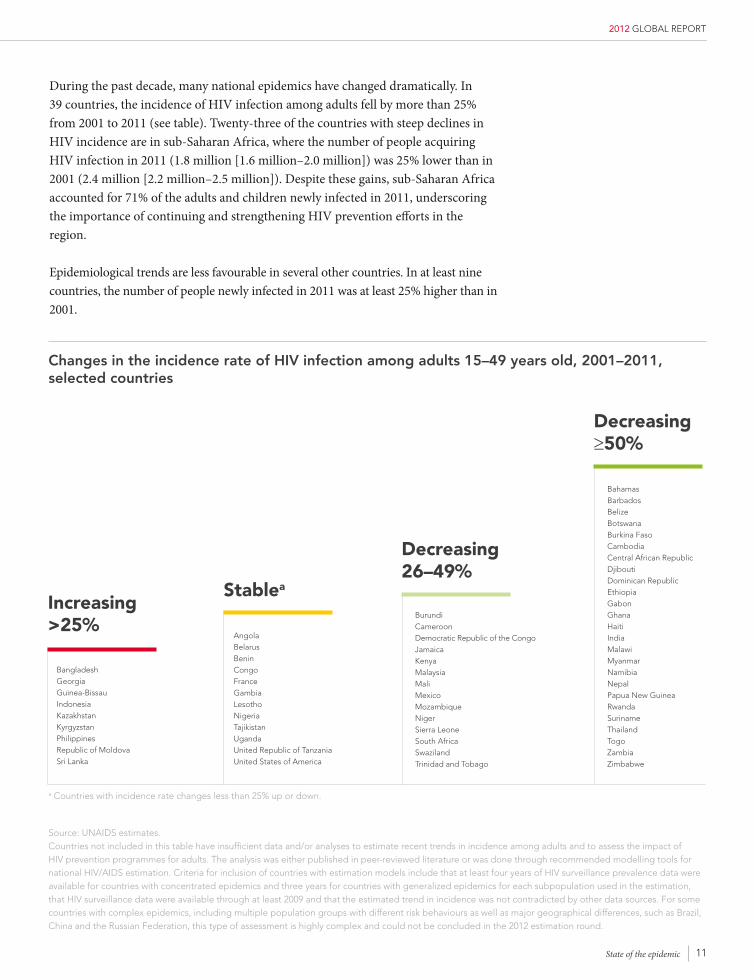
During the past decade, many national epidemics have changed dramatically. In 39 countries, the incidence of HIV infection among adults fell by more than 25% from 2001 to 2011 (see table). Twenty-three of the countries with steep declines in HIV incidence are in sub-Saharan Africa, where the number of people acquiring HIV infection in 2011 (1.8 million [1.6 million–2.0 million]) was 25% lower than in 2001 (2.4 million [2.2 million–2.5 million]). Despite these gains, sub-Saharan Africa accounted for 71% of the adults and children newly infected in 2011, underscoring the importance of continuing and strengthening HIV prevention efforts in the region.
Epidemiological trends are less favourable in several other countries. In at least nine countries, the number of people newly infected in 2011 was at least 25% higher than in 2001.
changes in the incidence rate of hIV infection among adults 15–49 years old, 2001–2011, selected countries
a Countries with incidence rate changes less than 25% up or down.
Source: UNAIDS estimates.Countries not included in this table have insufficient data and/or analyses to estimate recent trends in incidence among adults and to assess the impact of HIV prevention programmes for adults. The analysis was either published in peer-reviewed literature or was done through recommended modelling tools for national HIV/AIDS estimation. Criteria for inclusion of countries with estimation models include that at least four years of HIV surveillance prevalence data were available for countries with concentrated epidemics and three years for countries with generalized epidemics for each subpopulation used in the estimation, that HIV surveillance data were available through at least 2009 and that the estimated trend in incidence was not contradicted by other data sources. For some countries with complex epidemics, including multiple population groups with different risk behaviours as well as major geographical differences, such as Brazil, China and the Russian Federation, this type of assessment is highly complex and could not be concluded in the 2012 estimation round.
State of the epidemic
Increasing >25%
BangladeshGeorgiaGuinea-BissauIndonesiaKazakhstanKyrgyzstanPhilippinesRepublic of MoldovaSri Lanka
Decreasing 26–49%
Decreasing ≥50%
BurundiCameroonDemocratic Republic of the CongoJamaicaKenyaMalaysiaMaliMexicoMozambiqueNigerSierra LeoneSouth AfricaSwazilandTrinidad and Tobago
BahamasBarbadosBelizeBotswanaBurkina FasoCambodiaCentral African RepublicDjiboutiDominican RepublicEthiopiaGabonGhanaHaitiIndiaMalawiMyanmarNamibiaNepalPapua New GuineaRwandaSurinameThailandTogoZambiaZimbabwe
Stablea
AngolaBelarusBeninCongoFranceGambiaLesothoNigeriaTajikistanUgandaUnited Republic of TanzaniaUnited States of America
12
UNAIDS
ReDUcTIoNS IN DeAThS fRoM AIDS-RelATeD cAUSeS
The number of people dying from AIDS-related causes began to decline in the mid-2000s because of scaled-up antiretroviral therapy and the steady decline in HIV incidence since the peak in 1997. In 2011, this decline continued, with evidence that the drop in the number of people dying from AIDS-related causes is accelerating in several countries.
In 2011, 1.7 million [1.5 million–1.9 million] people died from AIDS-related causes worldwide. This represents a 24% decline in AIDS-related mortality compared with 2005 (when 2.3 million [2.1 million–2.6 million] deaths occurred).
The number of people dying from AIDS-related causes in sub-Saharan Africa declined by 32% from 2005 to 2011, although the region still accounted for 70% of all the people dying from AIDS in 2011. The Caribbean (48%) and Oceania (41%) experienced significant declines in AIDS-related deaths between 2005 and 2011. More modest declines occurred during the same period in Latin America (10%), Asia (4%) and Western and Central Europe and North America (1%). Two other regions, however, experienced significant increases in mortality from AIDS – Eastern Europe and Central Asia (21%) and the Middle East and North Africa (17%).
A review of country experiences vividly illustrates the changes in AIDS-related mortality patterns in the past several years (see table). In 14 countries, the annual number of people dying from AIDS-related causes declined by at least 50% from 2005 to 2011. In an additional 74 countries, more modest but still notable declines of 10–49% were recorded over the same six-year period.
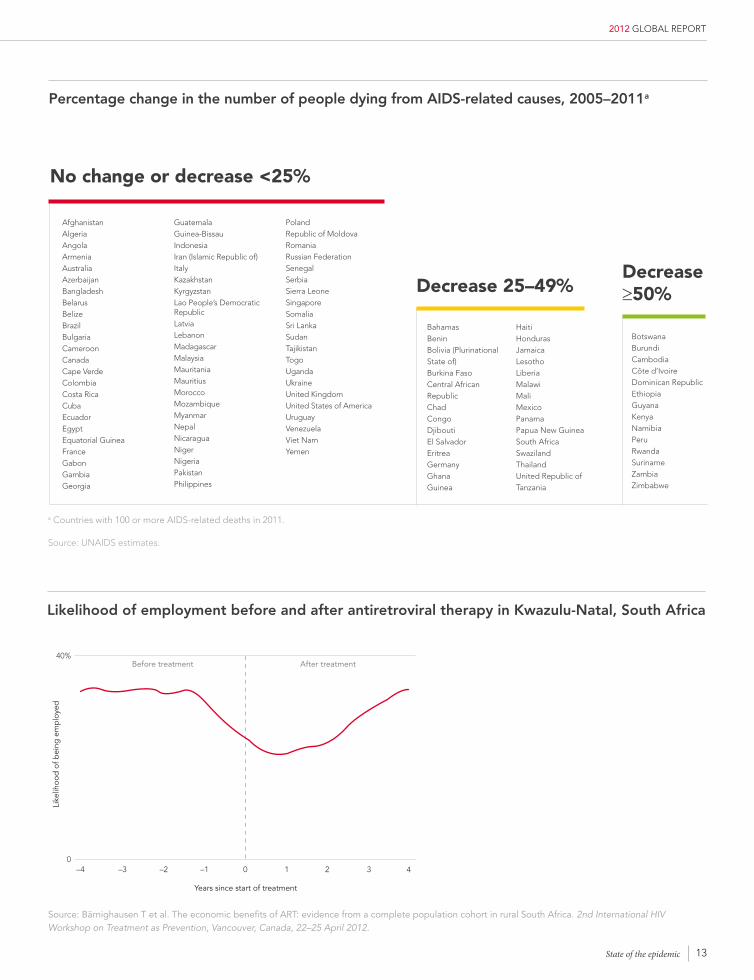
The scaling up of antiretroviral therapy in low- and middle-income countries has transformed national AIDS responses and generated broad-based health gains. Since 1995, antiretroviral therapy has saved 14 million life-years in low- and middle-income countries, including 9 million in sub-Saharan Africa. As programmatic scale-up has continued, health gains have accelerated, with the number of life-years saved by antiretroviral therapy in sub-Saharan Africa quadrupling in the last four years. Experience in the hyper-endemic KwaZulu-Natal Province in South Africa illustrates the macroeconomic and household livelihood benefits of expanded treatment access, with employment prospects sharply increasing among individuals receiving antiretroviral therapy.
1.7 mIllIoN DIeD
In 2011, 1.7 million people worldwide died from
AIDS-related causes, down 24% from the peak in 2005.
13
2012 GLOBAL REPORT
percentage change in the number of people dying from AIDS-related causes, 2005–2011a
Decrease ≥50%
BotswanaBurundiCambodiaCôte d’IvoireDominican RepublicEthiopiaGuyanaKenyaNamibiaPeruRwandaSurinameZambiaZimbabwe
AfghanistanAlgeriaAngolaArmeniaAustraliaAzerbaijanBangladeshBelarusBelizeBrazilBulgariaCameroonCanadaCape VerdeColombiaCosta RicaCubaEcuadorEgyptEquatorial GuineaFranceGabonGambiaGeorgia
GuatemalaGuinea-BissauIndonesiaIran (Islamic Republic of)ItalyKazakhstanKyrgyzstanLao People’s Democratic RepublicLatviaLebanonMadagascarMalaysiaMauritaniaMauritiusMoroccoMozambiqueMyanmarNepalNicaraguaNigerNigeriaPakistanPhilippines
PolandRepublic of MoldovaRomaniaRussian FederationSenegalSerbiaSierra LeoneSingaporeSomaliaSri LankaSudanTajikistanTogoUgandaUkraineUnited KingdomUnited States of AmericaUruguayVenezuelaViet NamYemen
No change or decrease <25%
Decrease 25–49%
BahamasBeninBolivia (Plurinational State of)Burkina FasoCentral AfricanRepublicChadCongoDjiboutiEl SalvadorEritreaGermanyGhanaGuinea
HaitiHondurasJamaicaLesothoLiberiaMalawiMaliMexicoPanamaPapua New GuineaSouth AfricaSwazilandThailandUnited Republic ofTanzania
Source: UNAIDS estimates.
a Countries with 100 or more AIDS-related deaths in 2011.
40%
0–4 –2–3 –1 0 1 2 3 4
Years since start of treatment
Before treatment After treatment
Like
lihoo
d o
f bei
ng e
mp
loye
d
Source: Bärnighausen T et al. The economic benefits of ART: evidence from a complete population cohort in rural South Africa. 2nd International HIV Workshop on Treatment as Prevention, Vancouver, Canada, 22–25 April 2012.
likelihood of employment before and after antiretroviral therapy in Kwazulu-Natal, South Africa
State of the epidemic
14
UNAIDS
Adults and children living with hIv Adults and children newly infected with hIv Adult (15–49 years) prevalence, % prevalence, young people (15–24 years), % AIDS-related deaths among adults and children, 2005 and 2011Women Men
SUb-SAhARAN AFRIcA2011 23.5 million 1.8 million 4.9 3.1 1.3 2011 1.2 million
[22 100 000–24 800 000] [1 600 000–2 000 000] [4.6–5.1] [2.6–3.9] [1.1–1.7] [1 100 000–1 300 000]
2001 20.9 million 2.4 million 5.9 5.1 2.0 2005 1.8 million[19 300 000–22 500 000] [2 200 000–2 500 000] [5.4–6.2] [4.2–6.7] [1.6–2.7] [1 600 000–1 900 000]
mIDDle eASt AND NoRth AFRIcA2011 300 000 37 000 0.2 <0.1 <0.1 2011 23 000
[250 000–360 000] [29 000–46 000] [0.1–0.2] [<0.1–0.1] [<0.1–0.1] [18 000–29 000]
2001 210 000 27 000 0.1 <0.1 <0.1 2005 20 000[170 000–270 000] [22 000–34 000] [0.1–0.2] [<0.1–<0.1] [<0.1–0.1] [15 000–25 000]
SoUth AND SoUth-eASt ASIA2011 4.0 million 280 000 0.3 0.1 0.1 2011 250 000
[3 100 000–4 600 000] [170 000–370 000] [0.2–0.3] [<0.1–0.1] [<0.1–0.2] [190 000–330 000]
2001 3.7 million 370 000 0.3 0.2 0.2 2005 290 000[3 200 000–5 100 000] [250 000–450 000] [0.3–0.5] [0.1–0.3] [0.2–0.3] [270 000–310 000]
eASt ASIA2011 830 000 89 000 0.1 <0.1 <0.1 2011 59 000
[590 000–1 200 000] [44 000–170 000] [<0.1–0.1] [<0.1–<0.1] [<0.1–<0.1] [41 000–82 000]
2001 390 000 75 000 <0.1 <0.1 <0.1 2005 39 000[280 000–530 000] [55 000–100 000] [<0.1–<0.1] [<0.1–<0.1] [<0.1–<0.1] [27 000–56 000]
oceANIA2011 53 000 2 900 0.3 0.1 0.1 2011 1 300
[47 000–60 000] [2 200–3 800] [0.2–0.3] [0.1–0.2] [<0.1–0.1] [<1 000–1 800]
2001 38 000 3 700 0.2 0.2 0.1 2005 2 300[32 000–46 000] [3 100–4 300] [0.2–0.3] [0.1–0.3] [0.1–0.2] [1 700–3 000]
lAtIN AmeRIcA2011 1.4 million 83 000 0.4 0.1 0.2 2011 54 000
[1 100 000–1 700 000] [51 000–140 000] [0.3–0.5] [<0.1–0.2] [<0.1–0.5] [32 000–81 000]
2001 1.2 million 93 000 0.4 0.1 0.3 2005 60 000[970 000–1 500 000] [67 000–120 000] [0.3–0.5] [<0.1–0.2] [0.1–0.7] [36 000–93 000]
cARIbbeAN2011 230 000 13 000 1.0 0.6 0.3 2011 10 000
[200 000–250 000] [9600–16 000] [0.9–1.1] [0.4–0.7] [0.2–0.5] [8200–12 000]
2001 240 000 22 000 1.2 1.0 0.5 2005 20 000[200 000–270 000] [20 000–25 000] [1.0–1.3] [0.8–1.2] [0.3–0.9] [16 000–23 000]
eASteRN eURope AND ceNtRAl ASIA 20111.4 million 140 000 1.0 0.5 0.7
201192 000
[1 100 000–1800 000] [91 000–210 000] [0.6–1.0] [0.4–0.7] [0.5–0.9] [63 000–120 000]
2001970 000 130 000 0.3 0.2 0.3
200576 000
[760 000–1 200 000] [99 000–170 000] [0.4–0.7] [<0.1–0.2] [0.2–0.3] [58 000–100 000]
WeSteRN AND ceNtRAl eURope2011
900 000 30 000 0.2 <0.1 0.12011
7 000[830 000–1 00 000] [21 000–40 000] [0.2–0.3] [<0.1–<0.1] [<0.1–0.1] [6 100–7 500]
2001 640 000 29 000 0.2 <0.1 0.1 2005 7 800[590 000–710 000] [26 000–34 000] [0.2–0.2] [<0.1–<0.1] [<0.1–0.1] [7 600–9 000]
NoRth AmeRIcA 2011 1.4 million 51 000 0.6 0.2 0.3 2011 21 000[1 100 000–2 000 000] [19 000–120 000] [0.5–1.0] [<0.1–0.4] [0.1–0.5] [17 000–28 000]
20011.1 million 50 000 0.6 0.2 0.3
200520 000
[850 000–1 300 000] [35 000–71 000] [0.5–0.7] [0.1–0.3] [0.2–0.4] [16 000–26 000]
globAl 201134.0 million 2.5 million 0.8 0.6 0.3
20111.7 million
[31 400 000–35 900 000] [2 200 000–2 800 000] [0.7–0.8] [0.4–0.6] [0.2–0.4] [1 500 000–1 900 000]
200129.4 million 3.2 million 0.8 0.7 0.4
20052.3 million
[27 200 000–32 100 000] [2 900 000–3 400 000] [0.7–0.9] [0.6–0.9] [0.3–0.5] [2 100 000–2 600 000]
Source: UNAIDS estimates.
Regional hIV and AIDS statistics, 2001, 2005 and 2011
15
2012 GLOBAL REPORT
Adults and children living with hIv Adults and children newly infected with hIv Adult (15–49 years) prevalence, % prevalence, young people (15–24 years), % AIDS-related deaths among adults and children, 2005 and 2011Women Men
SUb-SAhARAN AFRIcA2011 23.5 million 1.8 million 4.9 3.1 1.3 2011 1.2 million
[22 100 000–24 800 000] [1 600 000–2 000 000] [4.6–5.1] [2.6–3.9] [1.1–1.7] [1 100 000–1 300 000]
2001 20.9 million 2.4 million 5.9 5.1 2.0 2005 1.8 million[19 300 000–22 500 000] [2 200 000–2 500 000] [5.4–6.2] [4.2–6.7] [1.6–2.7] [1 600 000–1 900 000]
mIDDle eASt AND NoRth AFRIcA2011 300 000 37 000 0.2 <0.1 <0.1 2011 23 000
[250 000–360 000] [29 000–46 000] [0.1–0.2] [<0.1–0.1] [<0.1–0.1] [18 000–29 000]
2001 210 000 27 000 0.1 <0.1 <0.1 2005 20 000[170 000–270 000] [22 000–34 000] [0.1–0.2] [<0.1–<0.1] [<0.1–0.1] [15 000–25 000]
SoUth AND SoUth-eASt ASIA2011 4.0 million 280 000 0.3 0.1 0.1 2011 250 000
[3 100 000–4 600 000] [170 000–370 000] [0.2–0.3] [<0.1–0.1] [<0.1–0.2] [190 000–330 000]
2001 3.7 million 370 000 0.3 0.2 0.2 2005 290 000[3 200 000–5 100 000] [250 000–450 000] [0.3–0.5] [0.1–0.3] [0.2–0.3] [270 000–310 000]
eASt ASIA2011 830 000 89 000 0.1 <0.1 <0.1 2011 59 000
[590 000–1 200 000] [44 000–170 000] [<0.1–0.1] [<0.1–<0.1] [<0.1–<0.1] [41 000–82 000]
2001 390 000 75 000 <0.1 <0.1 <0.1 2005 39 000[280 000–530 000] [55 000–100 000] [<0.1–<0.1] [<0.1–<0.1] [<0.1–<0.1] [27 000–56 000]
oceANIA2011 53 000 2 900 0.3 0.1 0.1 2011 1 300
[47 000–60 000] [2 200–3 800] [0.2–0.3] [0.1–0.2] [<0.1–0.1] [<1 000–1 800]
2001 38 000 3 700 0.2 0.2 0.1 2005 2 300[32 000–46 000] [3 100–4 300] [0.2–0.3] [0.1–0.3] [0.1–0.2] [1 700–3 000]
lAtIN AmeRIcA2011 1.4 million 83 000 0.4 0.1 0.2 2011 54 000
[1 100 000–1 700 000] [51 000–140 000] [0.3–0.5] [<0.1–0.2] [<0.1–0.5] [32 000–81 000]
2001 1.2 million 93 000 0.4 0.1 0.3 2005 60 000[970 000–1 500 000] [67 000–120 000] [0.3–0.5] [<0.1–0.2] [0.1–0.7] [36 000–93 000]
cARIbbeAN2011 230 000 13 000 1.0 0.6 0.3 2011 10 000
[200 000–250 000] [9600–16 000] [0.9–1.1] [0.4–0.7] [0.2–0.5] [8200–12 000]
2001 240 000 22 000 1.2 1.0 0.5 2005 20 000[200 000–270 000] [20 000–25 000] [1.0–1.3] [0.8–1.2] [0.3–0.9] [16 000–23 000]
eASteRN eURope AND ceNtRAl ASIA 20111.4 million 140 000 1.0 0.5 0.7
201192 000
[1 100 000–1800 000] [91 000–210 000] [0.6–1.0] [0.4–0.7] [0.5–0.9] [63 000–120 000]
2001970 000 130 000 0.3 0.2 0.3
200576 000
[760 000–1 200 000] [99 000–170 000] [0.4–0.7] [<0.1–0.2] [0.2–0.3] [58 000–100 000]
WeSteRN AND ceNtRAl eURope2011
900 000 30 000 0.2 <0.1 0.12011
7 000[830 000–1 00 000] [21 000–40 000] [0.2–0.3] [<0.1–<0.1] [<0.1–0.1] [6 100–7 500]
2001 640 000 29 000 0.2 <0.1 0.1 2005 7 800[590 000–710 000] [26 000–34 000] [0.2–0.2] [<0.1–<0.1] [<0.1–0.1] [7 600–9 000]
NoRth AmeRIcA 2011 1.4 million 51 000 0.6 0.2 0.3 2011 21 000[1 100 000–2 000 000] [19 000–120 000] [0.5–1.0] [<0.1–0.4] [0.1–0.5] [17 000–28 000]
20011.1 million 50 000 0.6 0.2 0.3
200520 000
[850 000–1 300 000] [35 000–71 000] [0.5–0.7] [0.1–0.3] [0.2–0.4] [16 000–26 000]
globAl 201134.0 million 2.5 million 0.8 0.6 0.3
20111.7 million
[31 400 000–35 900 000] [2 200 000–2 800 000] [0.7–0.8] [0.4–0.6] [0.2–0.4] [1 500 000–1 900 000]
200129.4 million 3.2 million 0.8 0.7 0.4
20052.3 million
[27 200 000–32 100 000] [2 900 000–3 400 000] [0.7–0.9] [0.6–0.9] [0.3–0.5] [2 100 000–2 600 000]
Regional hIV and AIDS statistics, 2001, 2005 and 2011
State of the epidemic
16
UNAIDS
Getting to zero new HIV infections will require substantial reductions each year in sexual HIV transmission, which accounts for the overwhelming majority of the people who are newly infected. Although there is reason for optimism, including favourable trends in sexual behaviour in many countries and the additive impact of new biomedical prevention strategies, the current pace of progress is insufficient to reach the global goal of halving sexual transmission by 2015, underscoring the urgent need for intensified action.
Getting to zero new infections will require effective combination prevention: using behavioural, biomedical and structural strategies in combination, both intensively in specific populations in concentrated epidemics and across the whole population in generalized epidemics (1,2).1 Critical programmatic elements of combination prevention of the sexual transmission of HIV include behaviour change, condom provision, male circumcision, focused programmes for sex workers and men who have sex with men and access to antiretroviral therapy.
behAVIoUR chANge IS helpINg To pReVeNT SexUAl TRANSMISSIoN IN geNeRAlIzeD epIDeMIcS
Behaviour change programmes seek to promote safer individual behaviour as well as changes in social norms that generate healthier patterns of sexual behaviour. Behaviour change is complex; it involves knowledge, motivations and choices, which are influenced by sociocultural norms, as well as risk assessment in relation to immediate benefits and future consequences. It involves both rational decision-making and impulsive and automatic behaviour (3). HIV behaviour change programmes have largely been measured against the outcomes of reduction in the number of young people initiating sexual intercourse early and the number of sexual partners and increase in the correct and consistent use of condoms among people who are sexually active.
1 sexUAl trAnsMIssIon
1 This section reports on available information regarding sexual behaviour in the general population, coverage of male circumcision and HIV among sex workers and men who have sex with men. Unless otherwise indicated, data are from the 2012 country progress reports (www.unaids.org/cpr). Data on key populations at higher risk from country progress reports typically derive from surveys in capital cities and are not representative of the entire country. In particular, surveys in capital cities are likely to overestimate national HIV prevalence and service coverage.
17
2012 GLOBAL REPORT
Fig. 1.1
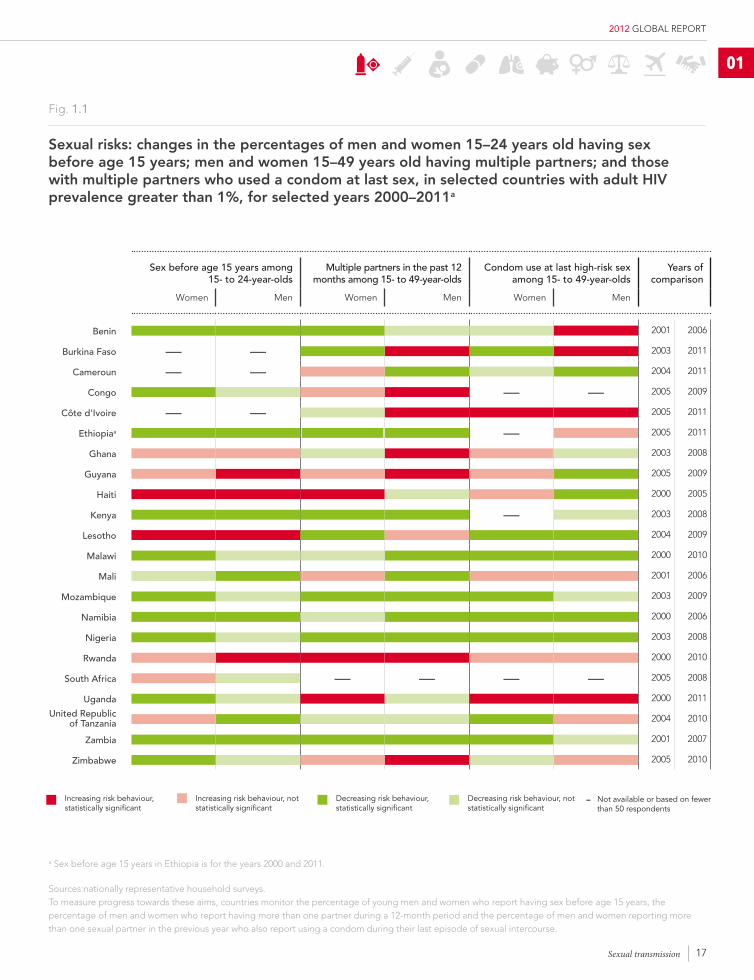
Sexual risks: changes in the percentages of men and women 15–24 years old having sex before age 15 years; men and women 15–49 years old having multiple partners; and those with multiple partners who used a condom at last sex, in selected countries with adult hIV prevalence greater than 1%, for selected years 2000–2011a
a Sex before age 15 years in Ethiopia is for the years 2000 and 2011.
Sources:nationally representative household surveys.To measure progress towards these aims, countries monitor the percentage of young men and women who report having sex before age 15 years, the percentage of men and women who report having more than one partner during a 12-month period and the percentage of men and women reporting more than one sexual partner in the previous year who also report using a condom during their last episode of sexual intercourse.
Increasing risk behaviour, statistically significant
Increasing risk behaviour, not statistically significant
Decreasing risk behaviour, statistically significant
Decreasing risk behaviour, not statistically significant
Not available or based on fewer than 50 respondents
01
Sexual transmission
Sex before age 15 years among 15- to 24-year-olds
multiple partners in the past 12 months among 15- to 49-year-olds
condom use at last high-risk sex among 15- to 49-year-olds
years of comparison
Women Men Women Men Women Men
benin 2001 2006
burkina Faso — — 2003 2011
cameroun — — 2004 2011
congo — — 2005 2009
côte d'Ivoire — — 2005 2011
ethiopiaa — 2005 2011
ghana 2003 2008
guyana 2005 2009
haiti 2000 2005
Kenya — 2003 2008
lesotho 2004 2009
malawi 2000 2010
mali 2001 2006
mozambique 2003 2009
Namibia 2000 2006
Nigeria 2003 2008
Rwanda 2000 2010
South Africa — — — — 2005 2008
Uganda 2000 2011
United Republic of tanzania 2004 2010
Zambia 2001 2007
Zimbabwe 2005 2010
18
UNAIDS
2 Angola, Botswana, Burkina Faso, Burundi, Cameroon, Central African Republic, Chad, Congo, Democratic Republic of the Congo, Gabon, Ghana, Guinea-Bissau, Haiti, Kenya, Lesotho, Nigeria and Togo.
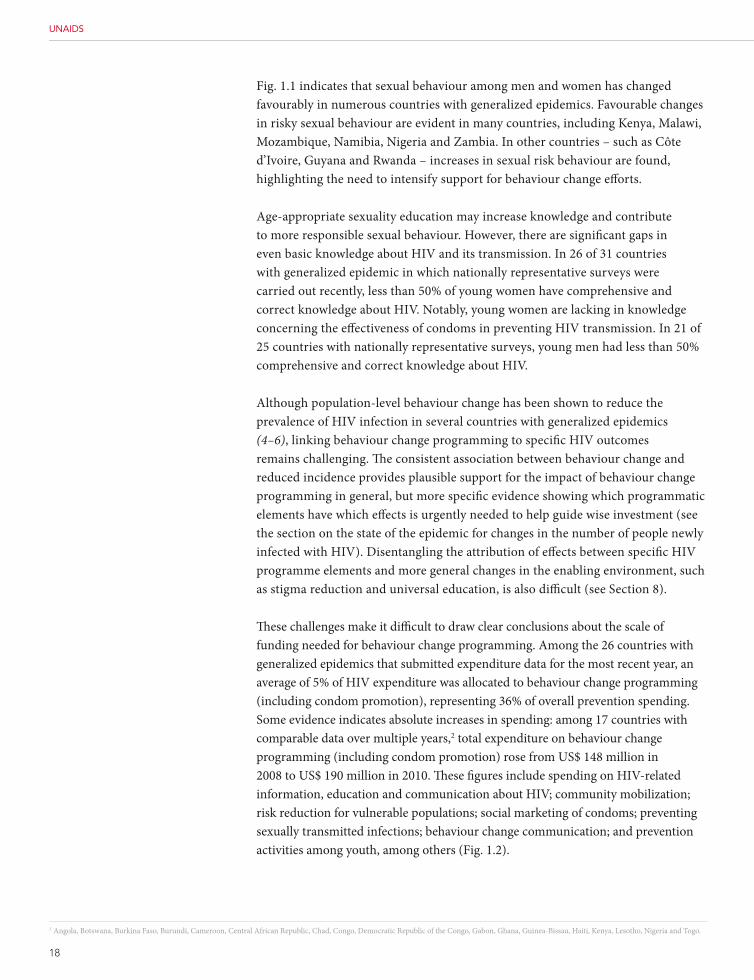
Fig. 1.1 indicates that sexual behaviour among men and women has changed favourably in numerous countries with generalized epidemics. Favourable changes in risky sexual behaviour are evident in many countries, including Kenya, Malawi, Mozambique, Namibia, Nigeria and Zambia. In other countries – such as Côte d’Ivoire, Guyana and Rwanda – increases in sexual risk behaviour are found, highlighting the need to intensify support for behaviour change efforts.
Age-appropriate sexuality education may increase knowledge and contribute to more responsible sexual behaviour. However, there are significant gaps in even basic knowledge about HIV and its transmission. In 26 of 31 countries with generalized epidemic in which nationally representative surveys were carried out recently, less than 50% of young women have comprehensive and correct knowledge about HIV. Notably, young women are lacking in knowledge concerning the effectiveness of condoms in preventing HIV transmission. In 21 of 25 countries with nationally representative surveys, young men had less than 50% comprehensive and correct knowledge about HIV.
Although population-level behaviour change has been shown to reduce the prevalence of HIV infection in several countries with generalized epidemics (4–6), linking behaviour change programming to specific HIV outcomes remains challenging. The consistent association between behaviour change and reduced incidence provides plausible support for the impact of behaviour change programming in general, but more specific evidence showing which programmatic elements have which effects is urgently needed to help guide wise investment (see the section on the state of the epidemic for changes in the number of people newly infected with HIV). Disentangling the attribution of effects between specific HIV programme elements and more general changes in the enabling environment, such as stigma reduction and universal education, is also difficult (see Section 8).
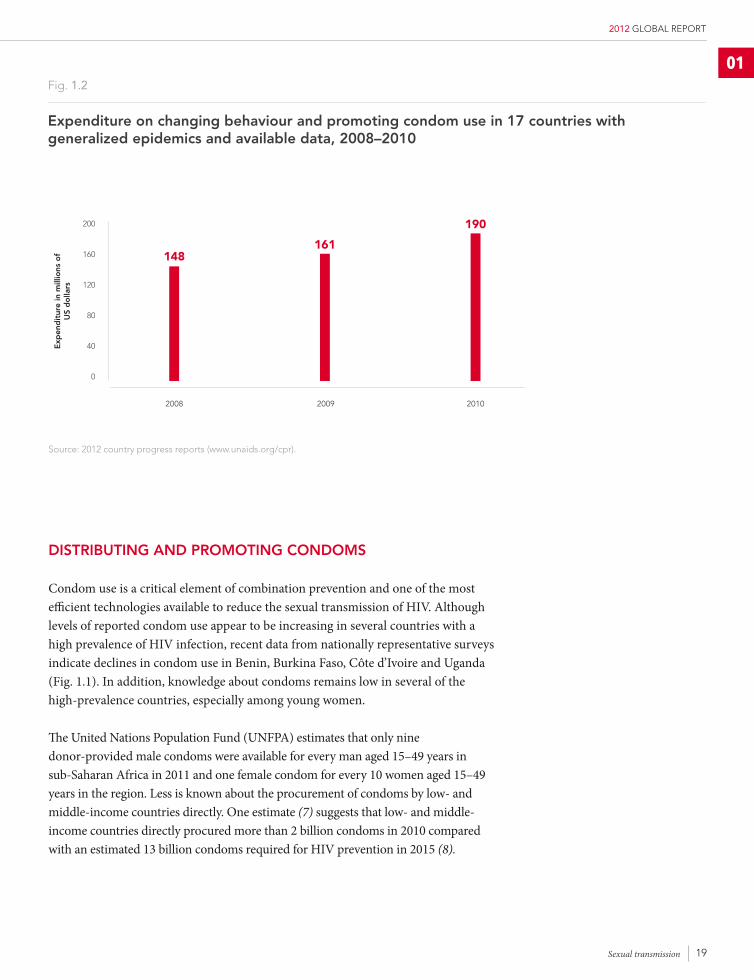
These challenges make it difficult to draw clear conclusions about the scale of funding needed for behaviour change programming. Among the 26 countries with generalized epidemics that submitted expenditure data for the most recent year, an average of 5% of HIV expenditure was allocated to behaviour change programming (including condom promotion), representing 36% of overall prevention spending. Some evidence indicates absolute increases in spending: among 17 countries with comparable data over multiple years,2 total expenditure on behaviour change programming (including condom promotion) rose from US$ 148 million in 2008 to US$ 190 million in 2010. These figures include spending on HIV-related information, education and communication about HIV; community mobilization; risk reduction for vulnerable populations; social marketing of condoms; preventing sexually transmitted infections; behaviour change communication; and prevention activities among youth, among others (Fig. 1.2).
19
2012 GLOBAL REPORT
Fig. 1.2
expenditure on changing behaviour and promoting condom use in 17 countries with generalized epidemics and available data, 2008–2010
200
160
120
80
40
0
exp
end
itur
e in
mill
ions
of
US
do
llars
2008
148
2009
161
2010
190
Source: 2012 country progress reports (www.unaids.org/cpr).
DISTRIbUTINg AND pRoMoTINg coNDoMS
Condom use is a critical element of combination prevention and one of the most efficient technologies available to reduce the sexual transmission of HIV. Although levels of reported condom use appear to be increasing in several countries with a high prevalence of HIV infection, recent data from nationally representative surveys indicate declines in condom use in Benin, Burkina Faso, Côte d’Ivoire and Uganda (Fig. 1.1). In addition, knowledge about condoms remains low in several of the high-prevalence countries, especially among young women.
The United Nations Population Fund (UNFPA) estimates that only nine donor-provided male condoms were available for every man aged 15–49 years in sub-Saharan Africa in 2011 and one female condom for every 10 women aged 15–49 years in the region. Less is known about the procurement of condoms by low- and middle-income countries directly. One estimate (7) suggests that low- and middle-income countries directly procured more than 2 billion condoms in 2010 compared with an estimated 13 billion condoms required for HIV prevention in 2015 (8).
01
Sexual transmission
20
UNAIDS
Increasing condom use requires both adequate supply and adequate demand. A recent study in Kenya estimated that, although condom use was low in the study population, so was the unmet need for condoms, highlighting the importance of building demand for condoms in the context of HIV prevention (9). The demand for condoms to protect against HIV infection may also be affected by other prevention programmes, such as perceptions that risks are lower because of interventions such as male circumcision or post-exposure prophylaxis or that partners receiving antiretroviral therapy will be less infectious, and similarly, the consequences of HIV infection may be seen as less devastating in the era of effective therapy thus decreasing the need for protection. These potential risk compensation effects are being closely scrutinized, but the dynamics are complex to track.
lIMITeD pRogReSS IN bRINgINg VolUNTARy MeDIcAl MAle cIRcUMcISIoN To ScAle
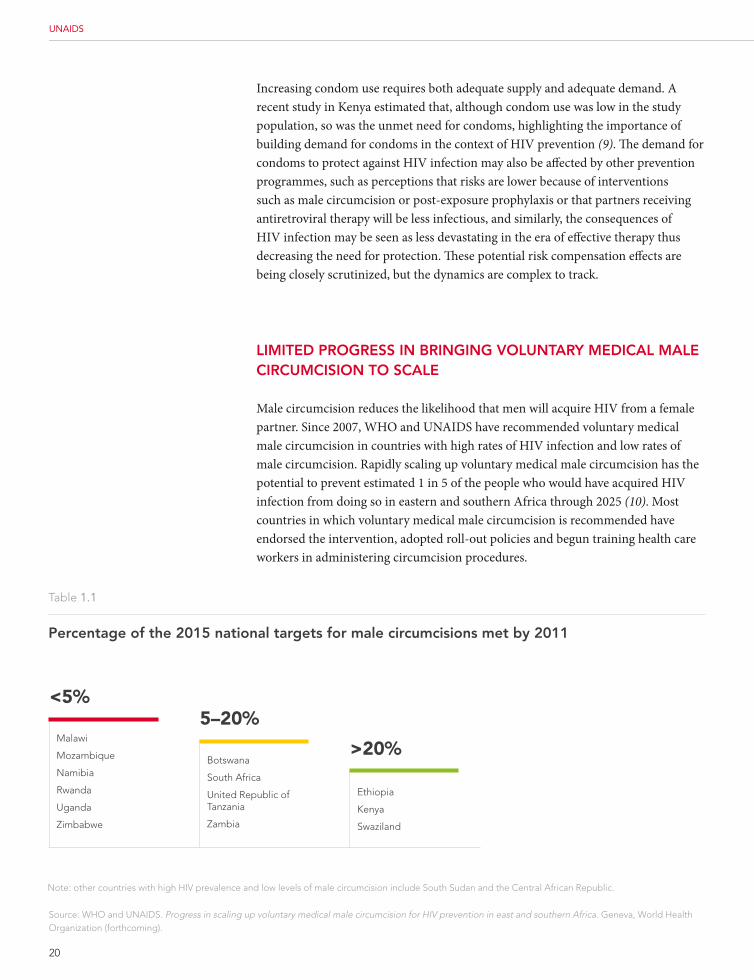
Male circumcision reduces the likelihood that men will acquire HIV from a female partner. Since 2007, WHO and UNAIDS have recommended voluntary medical male circumcision in countries with high rates of HIV infection and low rates of male circumcision. Rapidly scaling up voluntary medical male circumcision has the potential to prevent estimated 1 in 5 of the people who would have acquired HIV infection from doing so in eastern and southern Africa through 2025 (10). Most countries in which voluntary medical male circumcision is recommended have endorsed the intervention, adopted roll-out policies and begun training health care workers in administering circumcision procedures.
>20%
Ethiopia
Kenya
Swaziland
Table 1.1
percentage of the 2015 national targets for male circumcisions met by 2011
<5%
Malawi
Mozambique
Namibia
Rwanda
Uganda
Zimbabwe
5–20%
Botswana
South Africa
United Republic of Tanzania
Zambia
Note: other countries with high HIV prevalence and low levels of male circumcision include South Sudan and the Central African Republic.
Source: WHO and UNAIDS. Progress in scaling up voluntary medical male circumcision for HIV prevention in east and southern Africa. Geneva, World Health Organization (forthcoming).
21
2012 GLOBAL REPORT
01Countries that have given priority to male circumcision have established national targets for the number of voluntary medical male circumcisions to be performed by 2015. Rolling out medical male circumcision in Kenya is focused on Nyanza Province, where 54% of the targeted 230 000 male circumcisions have been performed as of December 2011. Ethiopia and Swaziland achieved more than 20% of their national target for voluntary medical male circumcision. In other priority countries, progress has been much slower (Table 1.1). In six countries (Malawi, Mozambique, Namibia, Rwanda, Uganda and Zimbabwe), less than 5% of the target number of men had been circumcised by the end of 2011 (11). Only two of the priority countries (Ethiopia and Swaziland) have integrated male circumcision into infant care programmes.
The unit cost of voluntary medical male circumcision is relatively low, and unlike most other prevention or treatment efforts, requires only one-time rather than lifelong expenditure. Nevertheless, countries have allocated relatively few resources towards scaling up this intervention, with less than 2% of total HIV expenditure allocated to voluntary medical male circumcision in 6 of the 14 priority countries with data available (Botswana, Kenya, Lesotho, Namibia, Rwanda and Swaziland). Some countries, such as Botswana, Kenya, Namibia and Swaziland, have increased expenditure for rolling out circumcision more recently. Given the lifelong risk reduction that male circumcision confers, it is clear that, the earlier programmes invest in ensuring high levels of coverage, the better.
pReVeNTINg hIV INfecTIoN IN Sex woRK
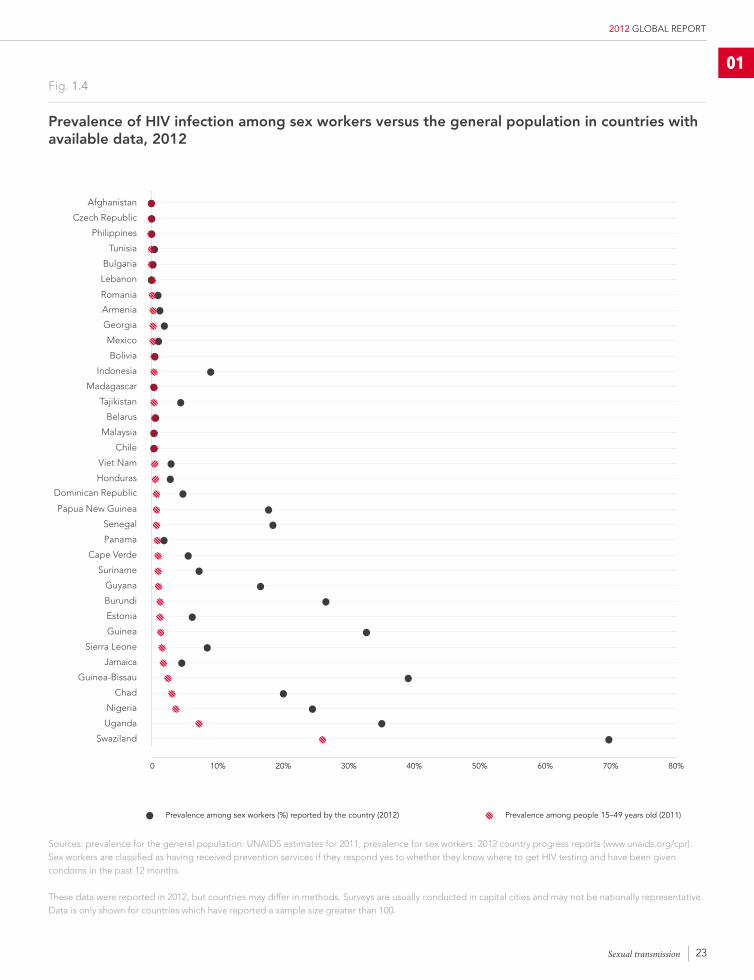
The number of countries reporting data on epidemiological trends and service coverage pertaining to sex workers significantly increased from 2006 to 2012, reflecting greater official recognition of the HIV-related needs of this population. Among generalized epidemic countries, country-reported HIV prevalence is consistently higher among sex workers in the capital city than among the general population with a median of 23% (Fig. 1.4). Median country-reported HIV prevalence among sex workers in the capital cities has remained stable between 2006 and 2011. Similarly, a recent review of available data from 50 countries, which estimated the global HIV prevalence among female sex workers at 12%, found that female sex workers were 13.5 times more likely to be living with HIV than are other women (12).
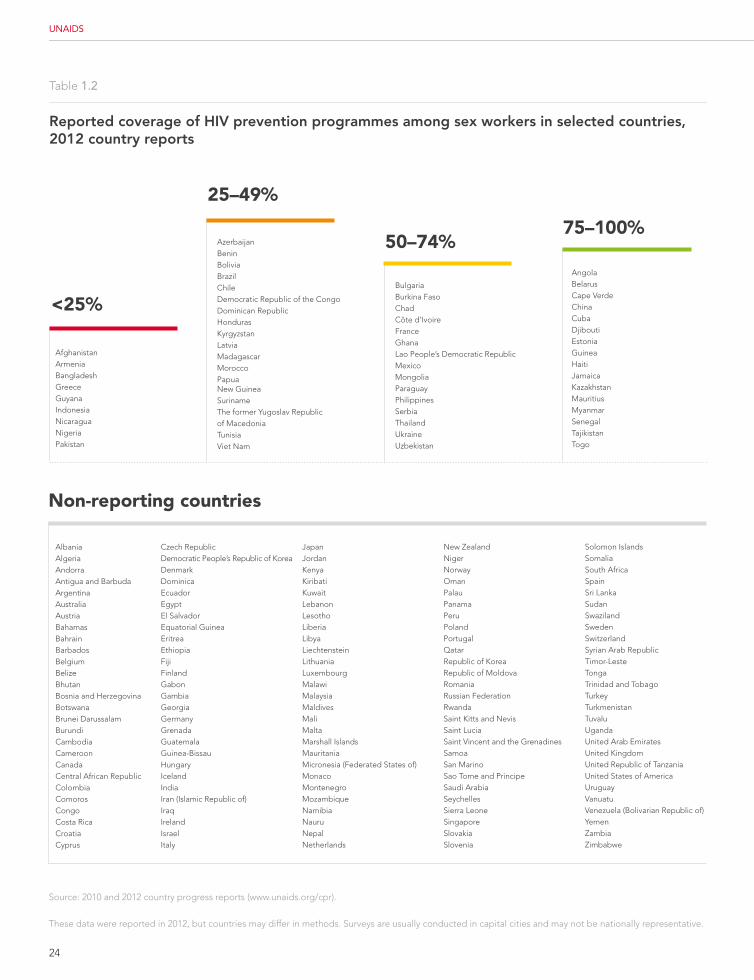
Nearly three quarters of reporting countries (73%) indicated they have implemented risk-reduction programmes for sex workers. Among 58 countries reporting data from surveys in capital cities, the median coverage of HIV prevention services for sex workers is 56% (Table 1.2), only marginally higher than in 2010, with 11 countries reportedly reaching at least 80% of sex workers. Although country-reported data remain limited and consistent comparisons across countries are difficult, countries that lack legal protections for sex workers appear to have lower median prevention coverage. According to data provided by 85 countries, 85% of sex workers in capital cities report having used a condom the last time they had sex.
Sexual transmission
13.5 ×female sex workers are 13.5 times more likely to be living with hIV than are other women.
22
UNAIDS
Programmes targeting sex workers are common but are far less consistently available for the clients of sex workers. Programmes that effectively target and engage the clients of sex workers are a critical omission, as this is a large population in many countries, and reducing the demand for unprotected paid sex is an important complement to programmes that target sex workers themselves.
The vast majority of countries (86%) address sex work in their multisectoral AIDS strategies. Although most country reports on sex workers pertain to females, a growing number of countries (10% in 2012) also provided information on male sex workers.
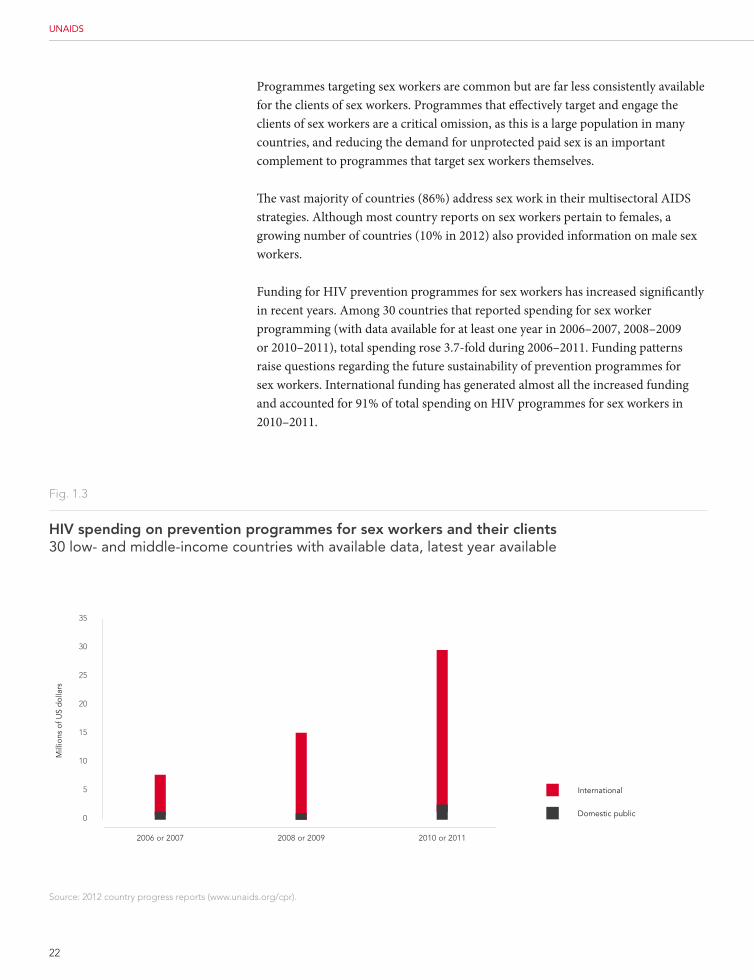
Funding for HIV prevention programmes for sex workers has increased significantly in recent years. Among 30 countries that reported spending for sex worker programming (with data available for at least one year in 2006–2007, 2008–2009 or 2010–2011), total spending rose 3.7-fold during 2006–2011. Funding patterns raise questions regarding the future sustainability of prevention programmes for sex workers. International funding has generated almost all the increased funding and accounted for 91% of total spending on HIV programmes for sex workers in 2010–2011.
Fig. 1.3
hIV spending on prevention programmes for sex workers and their clients 30 low- and middle-income countries with available data, latest year available
35
20
25
30
15
5
10
0
International
Domestic public
2008 or 2009
Mill
ions
of U
S d
olla
rs
2006 or 2007 2010 or 2011
Source: 2012 country progress reports (www.unaids.org/cpr).
Jamaica
23
2012 GLOBAL REPORT
01
Sexual transmission
Fig. 1.4
prevalence of hIV infection among sex workers versus the general population in countries with available data, 2012
Prevalence among sex workers (%) reported by the country (2012)
Afghanistan
Bolivia
Papua New Guinea
Czech Republic
Indonesia
Senegal
Philippines
Madagascar
Tunisia
Tajikistan
Cape Verde
Bulgaria
Suriname
Lebanon
Guyana
Romania
Chile
Burundi
Georgia
Honduras
Guinea
Armenia
Viet Nam
Estonia
Mexico
Dominican Republic
Sierra Leone
Jamaica
Guinea-Bissau
Chad
Nigeria
Uganda
Swaziland
0 10% 20% 30% 40% 50% 60% 70% 80%
Prevalence among people 15–49 years old (2011)
Sources: prevalence for the general population: UNAIDS estimates for 2011; prevalence for sex workers: 2012 country progress reports (www.unaids.org/cpr).Sex workers are classified as having received prevention services if they respond yes to whether they know where to get HIV testing and have been given condoms in the past 12 months.
These data were reported in 2012, but countries may differ in methods. Surveys are usually conducted in capital cities and may not be nationally representative.Data is only shown for countries which have reported a sample size greater than 100.
Belarus
Malaysia
Panama
24
UNAIDS
Source: 2010 and 2012 country progress reports (www.unaids.org/cpr).
These data were reported in 2012, but countries may differ in methods. Surveys are usually conducted in capital cities and may not be nationally representative.
Table 1.2
Reported coverage of hIV prevention programmes among sex workers in selected countries, 2012 country reports
75–100%
AngolaBelarusCape VerdeChina Cuba Djibouti Estonia Guinea Haiti Jamaica KazakhstanMauritius Myanmar Senegal Tajikistan Togo
Non-reporting countries
50–74%
Bulgaria Burkina Faso ChadCôte d’IvoireFrance Ghana Lao People’s Democratic Republic Mexico Mongolia Paraguay Philippines SerbiaThailand Ukraine Uzbekistan
<25%
AfghanistanArmenia Bangladesh Greece Guyana Indonesia Nicaragua Nigeria Pakistan
25–49%
AzerbaijanBenin Bolivia Brazil Chile Democratic Republic of the Congo Dominican Republic Honduras Kyrgyzstan Latvia Madagascar Morocco Papua New Guinea Suriname The former Yugoslav Republicof MacedoniaTunisia Viet Nam
Albania Algeria AndorraAntigua and BarbudaArgentina Australia Austria Bahamas Bahrain Barbados Belgium Belize Bhutan Bosnia and Herzegovina Botswana Brunei Darussalam BurundiCambodia Cameroon Canada Central African Republic Colombia Comoros Congo Costa Rica Croatia Cyprus
Czech Republic Democratic People’s Republic of Korea Denmark DominicaEcuador Egypt El Salvador Equatorial Guinea Eritrea Ethiopia Fiji Finland Gabon Gambia Georgia Germany GrenadaGuatemala Guinea-Bissau Hungary Iceland India Iran (Islamic Republic of)Iraq Ireland Israel Italy
Japan Jordan Kenya KiribatiKuwait Lebanon Lesotho Liberia Libya LiechtensteinLithuania Luxembourg Malawi Malaysia Maldives Mali Malta Marshall IslandsMauritania Micronesia (Federated States of)MonacoMontenegroMozambique Namibia NauruNepal Netherlands
New Zealand Niger Norway Oman PalauPanama Peru Poland Portugal Qatar Republic of KoreaRepublic of Moldova Romania Russian Federation Rwanda Saint Kitts and NevisSaint LuciaSaint Vincent and the GrenadinesSamoaSan MarinoSao Tome and PrincipeSaudi Arabia SeychellesSierra Leone Singapore Slovakia Slovenia
Solomon IslandsSomalia South Africa Spain Sri Lanka Sudan Swaziland Sweden Switzerland Syrian Arab Republic Timor-LesteTongaTrinidad and Tobago Turkey Turkmenistan TuvaluUganda United Arab Emirates United Kingdom United Republic of TanzaniaUnited States of AmericaUruguay VanuatuVenezuela (Bolivarian Republic of)YemenZambiaZimbabwe
25
2012 GLOBAL REPORT
Sexual transmission
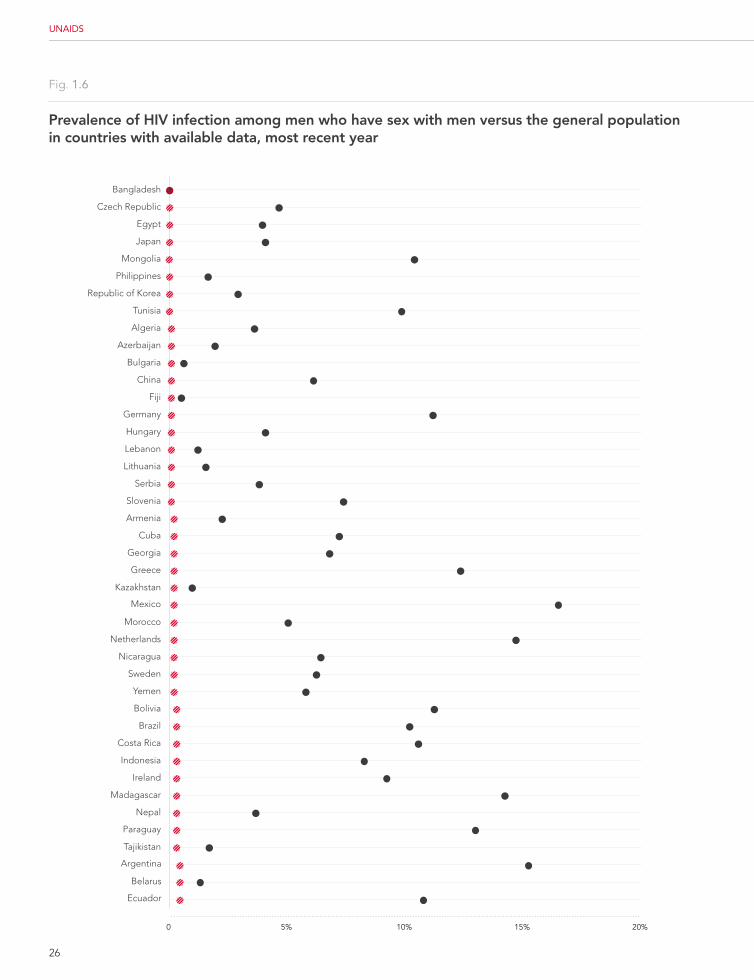
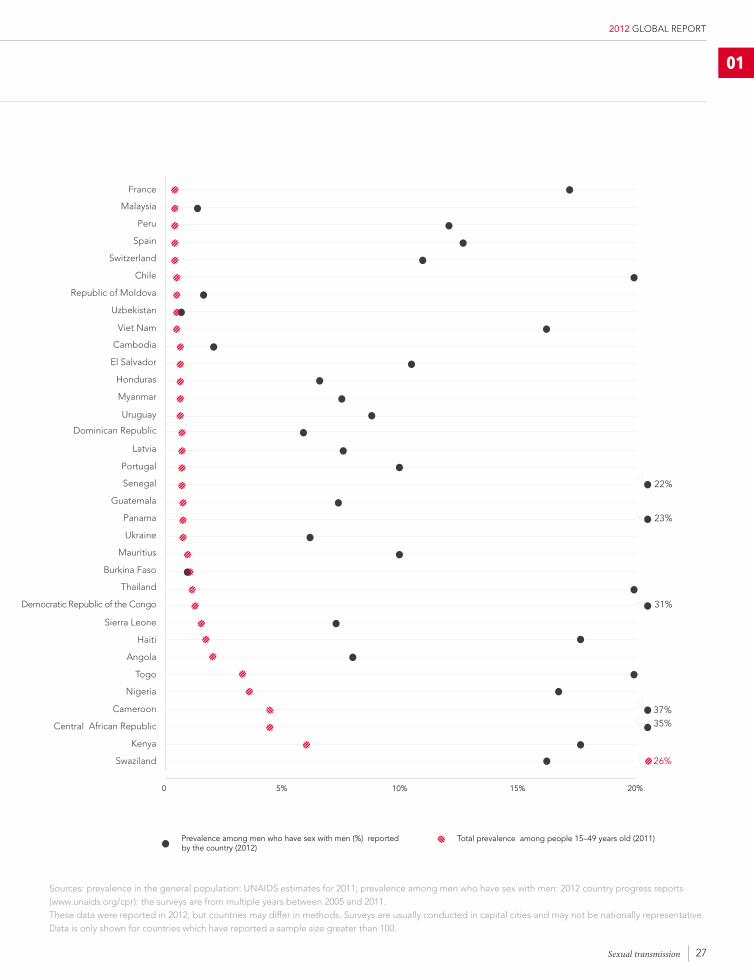
ReSpoNDINg To The globAl hIV epIDeMIc AMoNg MeN who hAVe Sex wITh MeN
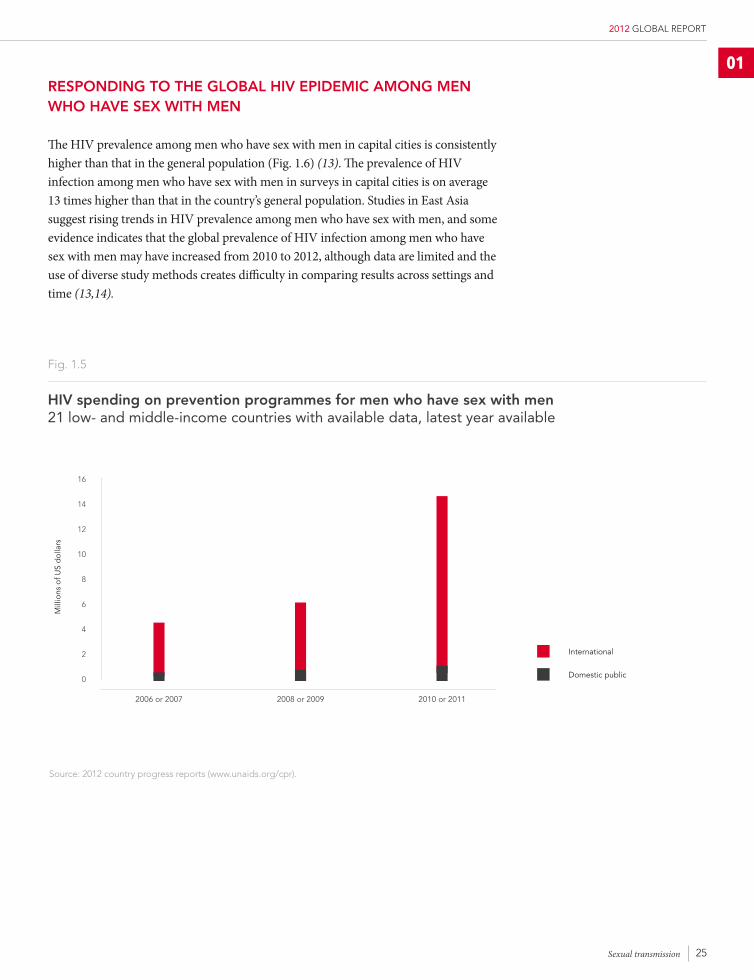
The HIV prevalence among men who have sex with men in capital cities is consistently higher than that in the general population (Fig. 1.6) (13). The prevalence of HIV infection among men who have sex with men in surveys in capital cities is on average 13 times higher than that in the country’s general population. Studies in East Asia suggest rising trends in HIV prevalence among men who have sex with men, and some evidence indicates that the global prevalence of HIV infection among men who have sex with men may have increased from 2010 to 2012, although data are limited and the use of diverse study methods creates difficulty in comparing results across settings and time (13,14).
Fig. 1.5
hIV spending on prevention programmes for men who have sex with men 21 low- and middle-income countries with available data, latest year available
16
8
10
12
14
6
2
4
0
International
Domestic public
2008 or 2009
Mill
ions
of U
S d
olla
rs
2006 or 2007 2010 or 2011
Source: 2012 country progress reports (www.unaids.org/cpr).
01
26
UNAIDS
Fig. 1.6
prevalence of hIV infection among men who have sex with men versus the general population in countries with available data, most recent year
Bangladesh
Bulgaria
Czech Republic
China
Egypt
Fiji
Japan
Germany
Mongolia
Hungary
Philippines
Lebanon
Republic of Korea
Lithuania
Tunisia
Serbia
Algeria
Slovenia
Azerbaijan
Armenia
Cuba
Georgia
Greece
Kazakhstan
Mexico
Morocco
Netherlands
Nicaragua
Sweden
Yemen
Bolivia
Brazil
Costa Rica
Indonesia
Ireland
Madagascar
Nepal
Paraguay
Tajikistan
0 5% 10% 15% 20%
Argentina
Belarus
Ecuador
27
2012 GLOBAL REPORT
Fig. 1.6
prevalence of hIV infection among men who have sex with men versus the general population in countries with available data, most recent year
01
Sexual transmission
31%
37%35%
26%
Cameroon
Nigeria
Switzerland
Chile
Republic of Moldova
France
Viet Nam
Myanmar
Portugal
Ukraine
Malaysia
Cambodia
Uruguay
Senegal
Mauritius
Spain
Peru
El Salvador
Honduras
Latvia
Dominican Republic
Panama
Guatemala
Democratic Republic of the Congo
Sierra Leone
Central African Republic
Swaziland
0 5% 10% 15% 20%
Kenya
22%
23%
Thailand
Sources: prevalence in the general population: UNAIDS estimates for 2011; prevalence among men who have sex with men: 2012 country progress reports (www.unaids.org/cpr): the surveys are from multiple years between 2005 and 2011.These data were reported in 2012, but countries may differ in methods. Surveys are usually conducted in capital cities and may not be nationally representative.Data is only shown for countries which have reported a sample size greater than 100.
Prevalence among men who have sex with men (%) reported by the country (2012)
Total prevalence among people 15–49 years old (2011)
Angola
Haiti
Togo
Burkina Faso
Uzbekistan
28
UNAIDS
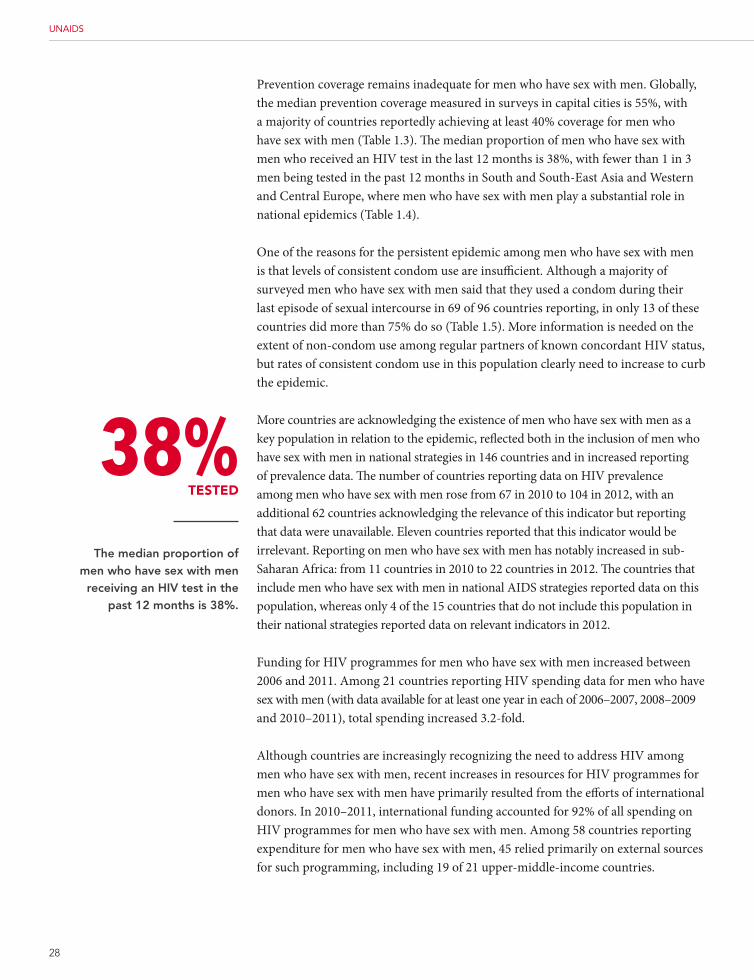
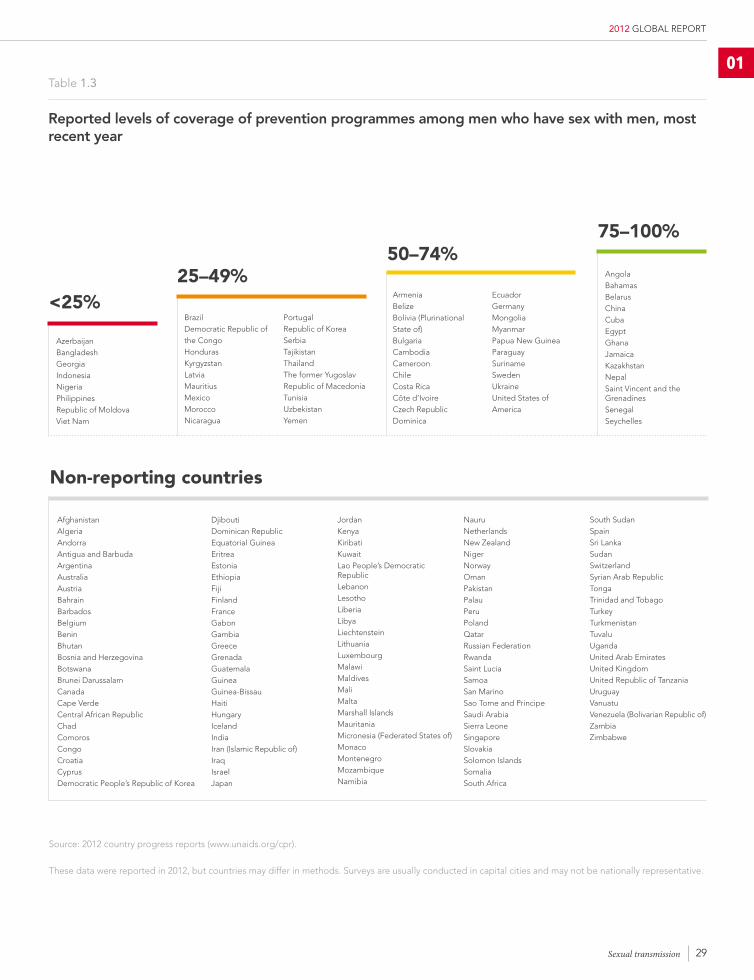
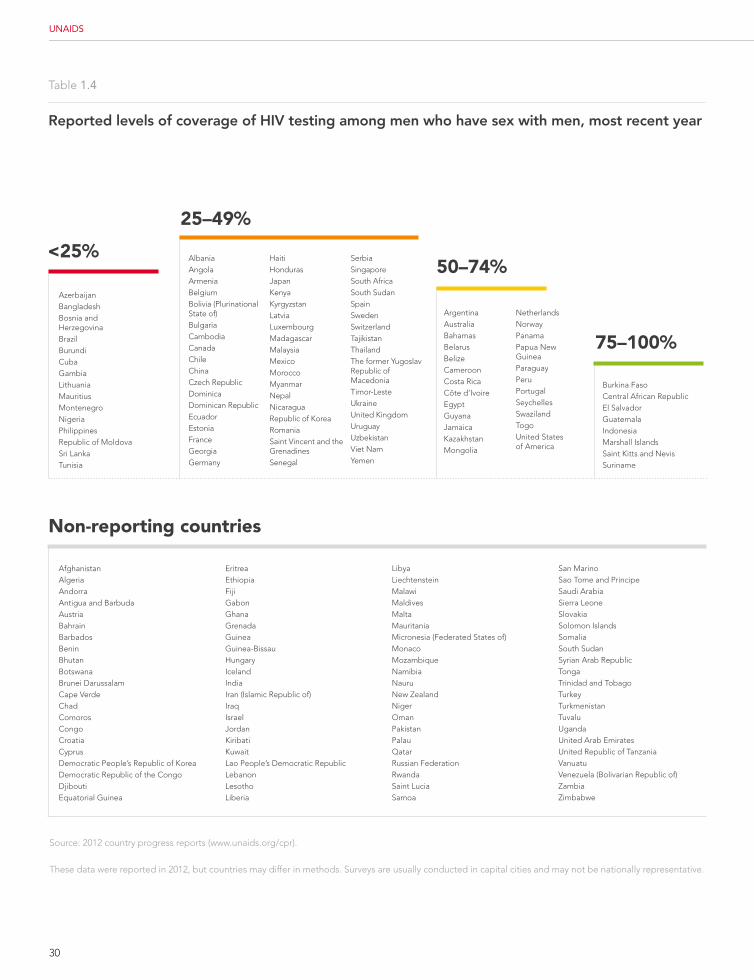
Prevention coverage remains inadequate for men who have sex with men. Globally, the median prevention coverage measured in surveys in capital cities is 55%, with a majority of countries reportedly achieving at least 40% coverage for men who have sex with men (Table 1.3). The median proportion of men who have sex with men who received an HIV test in the last 12 months is 38%, with fewer than 1 in 3 men being tested in the past 12 months in South and South-East Asia and Western and Central Europe, where men who have sex with men play a substantial role in national epidemics (Table 1.4).
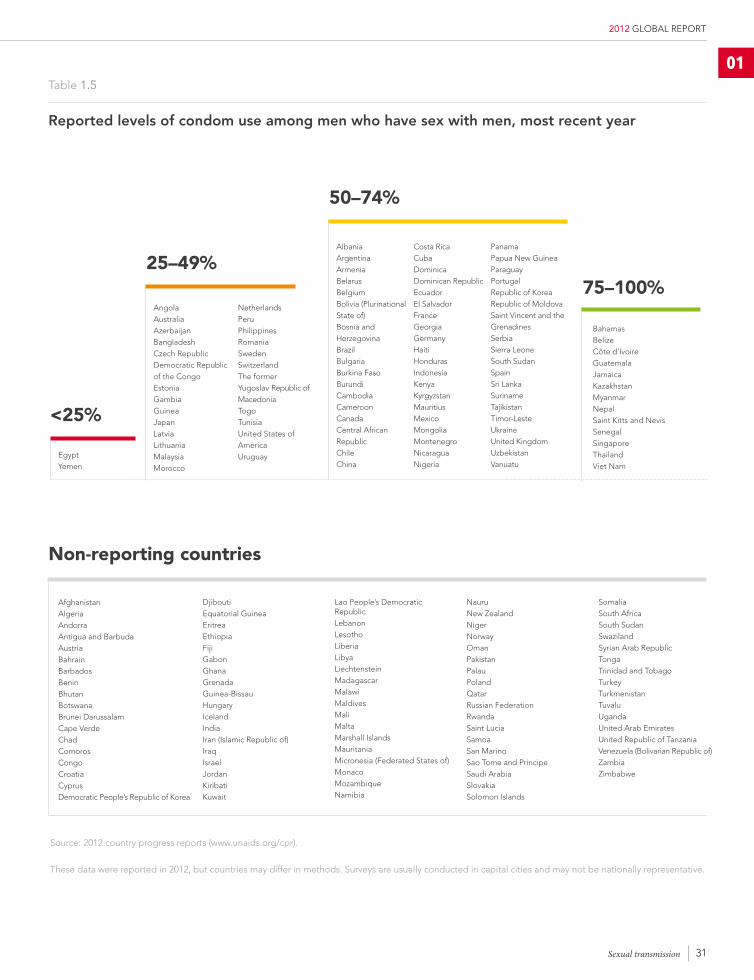
One of the reasons for the persistent epidemic among men who have sex with men is that levels of consistent condom use are insufficient. Although a majority of surveyed men who have sex with men said that they used a condom during their last episode of sexual intercourse in 69 of 96 countries reporting, in only 13 of these countries did more than 75% do so (Table 1.5). More information is needed on the extent of non-condom use among regular partners of known concordant HIV status, but rates of consistent condom use in this population clearly need to increase to curb the epidemic.
More countries are acknowledging the existence of men who have sex with men as a key population in relation to the epidemic, reflected both in the inclusion of men who have sex with men in national strategies in 146 countries and in increased reporting of prevalence data. The number of countries reporting data on HIV prevalence among men who have sex with men rose from 67 in 2010 to 104 in 2012, with an additional 62 countries acknowledging the relevance of this indicator but reporting that data were unavailable. Eleven countries reported that this indicator would be irrelevant. Reporting on men who have sex with men has notably increased in sub-Saharan Africa: from 11 countries in 2010 to 22 countries in 2012. The countries that include men who have sex with men in national AIDS strategies reported data on this population, whereas only 4 of the 15 countries that do not include this population in their national strategies reported data on relevant indicators in 2012.
Funding for HIV programmes for men who have sex with men increased between 2006 and 2011. Among 21 countries reporting HIV spending data for men who have sex with men (with data available for at least one year in each of 2006–2007, 2008–2009 and 2010–2011), total spending increased 3.2-fold.
Although countries are increasingly recognizing the need to address HIV among men who have sex with men, recent increases in resources for HIV programmes for men who have sex with men have primarily resulted from the efforts of international donors. In 2010–2011, international funding accounted for 92% of all spending on HIV programmes for men who have sex with men. Among 58 countries reporting expenditure for men who have sex with men, 45 relied primarily on external sources for such programming, including 19 of 21 upper-middle-income countries.
38%teSteD
The median proportion of men who have sex with men receiving an hIV test in the
past 12 months is 38%.
29
2012 GLOBAL REPORT
Sexual transmission
Table 1.3
Reported levels of coverage of prevention programmes among men who have sex with men, most recent year
<25%
AzerbaijanBangladesh Georgia Indonesia Nigeria Philippines Republic of MoldovaViet Nam
25–49%
Brazil Democratic Republic of the Congo Honduras Kyrgyzstan Latvia Mauritius Mexico Morocco Nicaragua
Portugal Republic of Korea SerbiaTajikistan Thailand The former Yugoslav Republic of MacedoniaTunisia UzbekistanYemen
Armenia Belize Bolivia (Plurinational State of) Bulgaria Cambodia Cameroon Chile Costa Rica Côte d’IvoireCzech Republic Dominica
Ecuador Germany Mongolia Myanmar Papua New Guinea Paraguay Suriname Sweden Ukraine United States of America
50–74%75–100%
AngolaBahamas BelarusChina Cuba Egypt Ghana Jamaica KazakhstanNepal Saint Vincent and the GrenadinesSenegal Seychelles
Source: 2012 country progress reports (www.unaids.org/cpr).
These data were reported in 2012, but countries may differ in methods. Surveys are usually conducted in capital cities and may not be nationally representative.
Non-reporting countries
AfghanistanAlgeriaAndorraAntigua and BarbudaArgentinaAustraliaAustriaBahrainBarbadosBelgiumBeninBhutanBosnia and HerzegovinaBotswanaBrunei DarussalamCanadaCape VerdeCentral African RepublicChadComorosCongo CroatiaCyprusDemocratic People’s Republic of Korea
01
DjiboutiDominican RepublicEquatorial GuineaEritreaEstoniaEthiopiaFijiFinlandFranceGabonGambiaGreeceGrenadaGuatemalaGuineaGuinea-BissauHaitiHungaryIcelandIndiaIran (Islamic Republic of)IraqIsraelJapan
JordanKenyaKiribatiKuwaitLao People’s Democratic RepublicLebanonLesothoLiberiaLibyaLiechtensteinLithuaniaLuxembourgMalawiMaldivesMaliMaltaMarshall IslandsMauritaniaMicronesia (Federated States of)MonacoMontenegroMozambiqueNamibia
NauruNetherlandsNew ZealandNigerNorwayOmanPakistanPalauPeruPolandQatarRussian FederationRwandaSaint LuciaSamoaSan MarinoSao Tome and PrincipeSaudi ArabiaSierra LeoneSingaporeSlovakiaSolomon IslandsSomaliaSouth Africa
South SudanSpainSri LankaSudanSwitzerlandSyrian Arab RepublicTongaTrinidad and TobagoTurkeyTurkmenistanTuvaluUgandaUnited Arab EmiratesUnited KingdomUnited Republic of TanzaniaUruguayVanuatuVenezuela (Bolivarian Republic of)ZambiaZimbabwe
30
UNAIDS
AfghanistanAlgeriaAndorraAntigua and BarbudaAustriaBahrainBarbadosBeninBhutanBotswanaBrunei DarussalamCape VerdeChadComorosCongoCroatiaCyprusDemocratic People’s Republic of KoreaDemocratic Republic of the CongoDjiboutiEquatorial Guinea
EritreaEthiopiaFijiGabonGhanaGrenadaGuineaGuinea-BissauHungaryIcelandIndiaIran (Islamic Republic of)IraqIsraelJordanKiribatiKuwaitLao People’s Democratic RepublicLebanonLesothoLiberia
LibyaLiechtensteinMalawiMaldivesMaltaMauritaniaMicronesia (Federated States of)MonacoMozambiqueNamibiaNauruNew ZealandNigerOmanPakistanPalauQatarRussian FederationRwandaSaint LuciaSamoa
San MarinoSao Tome and PrincipeSaudi ArabiaSierra LeoneSlovakiaSolomon IslandsSomaliaSouth SudanSyrian Arab RepublicTongaTrinidad and TobagoTurkeyTurkmenistanTuvaluUgandaUnited Arab EmiratesUnited Republic of TanzaniaVanuatuVenezuela (Bolivarian Republic of)ZambiaZimbabwe
Table 1.4
Reported levels of coverage of hIV testing among men who have sex with men, most recent year
<25%
AzerbaijanBangladesh Bosnia and Herzegovina Brazil BurundiCuba Gambia Lithuania Mauritius MontenegroNigeria Philippines Republic of MoldovaSri Lanka Tunisia
25–49%
Albania AngolaArmenia Belgium Bolivia (Plurinational State of) Bulgaria Cambodia Canada Chile China Czech Republic DominicaDominican Republic Ecuador Estonia France Georgia Germany
Haiti Honduras Japan Kenya Kyrgyzstan Latvia Luxembourg Madagascar Malaysia Mexico Morocco Myanmar Nepal Nicaragua Republic of Korea Romania Saint Vincent and the GrenadinesSenegal
SerbiaSingapore South Africa South Sudan Spain Sweden Switzerland Tajikistan Thailand The former Yugoslav Republic of MacedoniaTimor-LesteUkraine United KingdomUruguay UzbekistanViet NamYemen
50–74%
Argentina Australia Bahamas BelarusBelize Cameroon Costa Rica Côte d’IvoireEgypt Guyana Jamaica KazakhstanMongolia
Netherlands Norway Panama Papua New Guinea Paraguay Peru Portugal SeychellesSwaziland Togo United States of America
75–100%
Burkina Faso Central African Republic El Salvador Guatemala Indonesia Marshall IslandsSaint Kitts and NevisSuriname
Source: 2012 country progress reports (www.unaids.org/cpr).
These data were reported in 2012, but countries may differ in methods. Surveys are usually conducted in capital cities and may not be nationally representative.
Non-reporting countries
31
2012 GLOBAL REPORT
75–100%
Sexual transmission
01Table 1.5
Reported levels of condom use among men who have sex with men, most recent year
<25%
Egypt Yemen
25–49%
AngolaAustralia AzerbaijanBangladesh Czech Republic Democratic Republic of the Congo Estonia Gambia Guinea Japan Latvia Lithuania Malaysia Morocco
Netherlands Peru Philippines Romania Sweden Switzerland The formerYugoslav Republic of MacedoniaTogo Tunisia United States of AmericaUruguay
50–74%
Albania Argentina Armenia BelarusBelgium Bolivia (PlurinationalState of)Bosnia andHerzegovina Brazil Bulgaria Burkina Faso BurundiCambodia Cameroon Canada Central AfricanRepublic Chile China
Costa Rica Cuba DominicaDominican Republic Ecuador El Salvador France Georgia Germany Haiti Honduras Indonesia Kenya Kyrgyzstan Mauritius Mexico Mongolia MontenegroNicaragua Nigeria
Panama Papua New Guinea Paraguay Portugal Republic of Korea Republic of MoldovaSaint Vincent and theGrenadinesSerbiaSierra Leone South Sudan Spain Sri Lanka Suriname Tajikistan Timor-LesteUkraine United KingdomUzbekistanVanuatu
75–100%
Bahamas Belize Côte d’IvoireGuatemala Jamaica KazakhstanMyanmar Nepal Saint Kitts and NevisSenegal Singapore Thailand Viet Nam
Source: 2012 country progress reports (www.unaids.org/cpr).
These data were reported in 2012, but countries may differ in methods. Surveys are usually conducted in capital cities and may not be nationally representative.
Non-reporting countries
AfghanistanAlgeriaAndorraAntigua and BarbudaAustriaBahrainBarbadosBeninBhutanBotswanaBrunei DarussalamCape VerdeChadComorosCongoCroatiaCyprusDemocratic People’s Republic of Korea
01
DjiboutiEquatorial GuineaEritreaEthiopiaFijiGabonGhanaGrenadaGuinea-BissauHungaryIcelandIndiaIran (Islamic Republic of)IraqIsraelJordanKiribatiKuwait
Lao People’s Democratic RepublicLebanonLesothoLiberiaLibyaLiechtensteinMadagascarMalawiMaldivesMaliMaltaMarshall IslandsMauritaniaMicronesia (Federated States of)MonacoMozambiqueNamibia
NauruNew ZealandNigerNorwayOmanPakistanPalauPolandQatarRussian FederationRwandaSaint LuciaSamoaSan MarinoSao Tome and PrincipeSaudi ArabiaSlovakiaSolomon Islands
SomaliaSouth AfricaSouth SudanSwazilandSyrian Arab RepublicTongaTrinidad and TobagoTurkeyTurkmenistanTuvaluUgandaUnited Arab EmiratesUnited Republic of TanzaniaVenezuela (Bolivarian Republic of)ZambiaZimbabwe
32
UNAIDS
Full and effective combination of available prevention strategies has conclusively demonstrated the capacity to rapidly reduce the number of people newly infected with HIV. To make the best use of these combination prevention options, countries need to closely focus on the driving forces and key populations at higher risk of their national epidemics. Behaviour change, biomedical interventions and structural approaches to reduce the underlying vulnerability to HIV infection should be implemented in concert for maximum impact.
Newly emerging evidence from Kenya and Malawi indicates that even quite small cash transfers can markedly affect the dynamics of sexual transmission of HIV. In Kenya, young people who received a cash transfer were less likely to have ever had sex and, when sexually active, less likely to have had more than two sexual partners in the past 12 months (15). In Malawi, a cash transfer intervention led to significant declines in early marriage, teenage pregnancy and self-reported sexual activity (16).
The promise of antiretroviral therapy in preventing HIV transmission, with well-established evidence in relation to mother-to-child transmission, has come into sharp focus during the past two years. In 2011, researchers reported that antiretroviral therapy reduces the odds of sexual transmission within serodiscordant heterosexual partners (17), and in 2012 WHO issued guidelines on serodiscordant couples to recommend that the partner living with HIV be offered antiretroviral therapy regardless of his or her CD4 count (18). In addition to the reduced transmission of HIV resulting from fully effective viral suppression among people living with HIV, trials have also indicated that antiretroviral medicines can reduce the likelihood that an uninfected person will acquire HIV. The potential public health impact of this strategy in reducing HIV incidence greatly depends on the extent to which potential HIV-uninfected users of antiretroviral medicines for prophylactic purposes are able to adhere to daily dosing regimens.
In priority countries in sub-Saharan Africa, additional steps are needed to accelerate the scaling up of voluntary medical male circumcision. Although some countries have reported strong demand for voluntary medical male circumcision where such services have been offered, generating robust demand for the service remains a challenge in other priority countries. Investing in community engagement and mobilization represents an urgent priority to accelerate scale-up. Intensive efforts are underway to evaluate potentially promising non-surgical devices for male circumcision. By avoiding the need for scalpels or sutures in circumcision, it is hoped that scale-up can be expedited through substituting trained nurses for surgeons, thus alleviating health worker shortages and reducing men’s resistance
MoVINg foRwARD TowARDS 2015: ReDUcINg SexUAl TRANSMISSIoN by 50%
33
2012 GLOBAL REPORT
01to undergoing the procedure. In 2012, field trials were underway in Rwanda and Zimbabwe for PrePex (a device that enables non-surgical and safe adult male circumcision) and in Kenya and Zambia for the Shang Ring (a circumcision tool that helps health care providers with limited training to perform circumcision). A new device for infants (AccuCirc) is also being evaluated in Botswana. Whether surgical or non-surgical, voluntary medical male circumcision is a procedure that has important cultural resonance, underscoring the need for a meaningful cultural discussion on the significance and benefits of circumcision.
Although encouraging progress has been made in stabilizing HIV prevalence and promoting condom use among workers in sex work, substantially greater gains will be needed to halve the sexual transmission of HIV among sex workers by 2015. Accurate estimates of the size and distribution of sex worker populations will assist countries in adhering to the “know your epidemic, know your response” approach to prevention planning. Programmatic experience has also shown that review and, where necessary, reform, of legal and policy frameworks to reduce stigma and discrimination towards sex workers can promote the increased use of prevention services.
Services to reduce the sexual transmission of HIV among transgender populations are also critical. The severe marginalization experienced by many transgender people, limited options for employment, persistent stigma and discrimination and, in many cases, targeted violence, are all factors that increase the vulnerability to HIV infection for this population (see Section 7 for additional information on transgender populations).
Reaching a higher proportion of men who have sex with men with effective programmatic efforts is critical if the world is to halve sexual transmission by 2015. This is one of many areas where the lack of domestic funding allocated towards sound programming not only jeopardizes the sustainability of these programmes but also suggests that a lack of national ownership is hampering the success of these efforts. HIV monitoring among men who have sex with men should be strengthened, and punitive legal frameworks should be revised to bring AIDS responses in accordance with human rights norms. In addition to efforts focused on HIV-related behaviour, access to antiretroviral therapy for men who have sex with men who are living with HIV and the potential use of pre-exposure prophylaxis should be combined together in a coordinated and accelerated effort to reduce the sexual transmission of HIV. Research to develop rectal microbicides should also continue as a potentially important measure for this population.
Sexual transmission
34
UNAIDS
The global goal of reducing the number of people who use drugs who acquire HIV infection by 50% by 2015 recognizes both the epidemic’s extraordinary toll on this population and the fact that drug-related transmission is driving the expansion of the epidemic in many countries. Several countries that have implemented evidence-informed programmes for people who use drugs have dramatically reduced the number of these people who acquire HIV infection, with some countries approaching the elimination of drug-related transmission. However, globally we are far from halving the number of people who use drugs who are newly infected with HIV by 2015.
people who INJecT DRUgS ARe exTRAoRDINARIly bURDeNeD
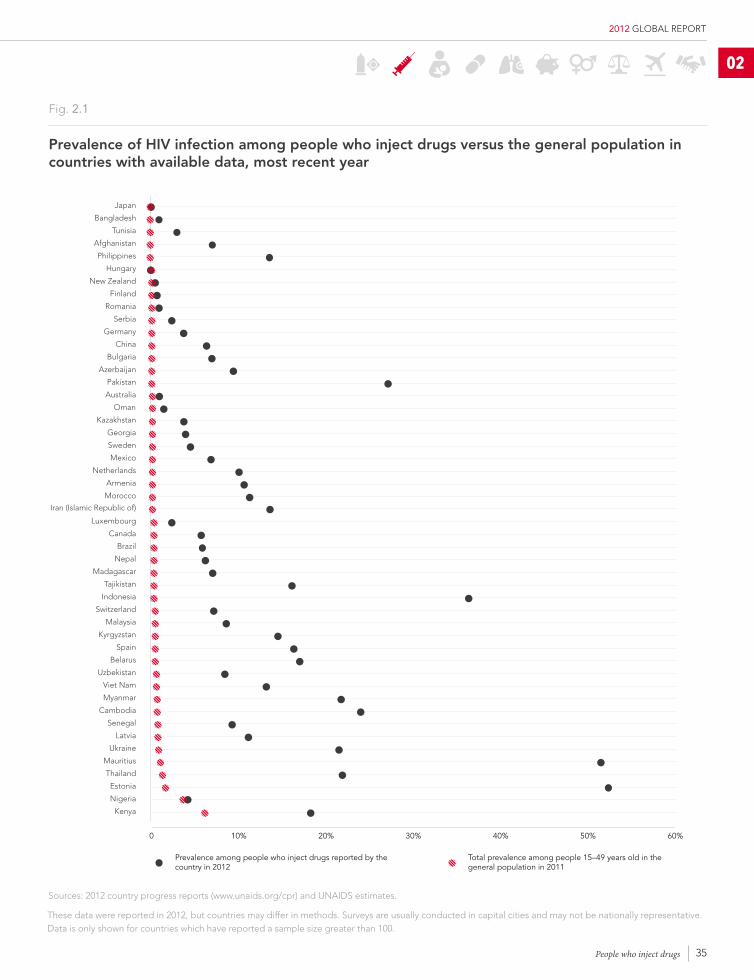
People who inject drugs are among the population groups most severely affected by HIV infection. In virtually all countries reporting data in 2012, the prevalence of HIV infection is higher among people who inject drugs than among the general population (Fig. 2.1). In 49 countries with available data, the prevalence of HIV infection is at least 22 times higher among people who inject drugs than for the population as a whole, with prevalence at least 50-fold higher in 11 countries. A 2007 study (1) estimated that about 16 million people inject drugs globally, including many younger than 25 years and 3 million of whom are living with HIV.
In addition to imposing extraordinary burdens on people who use drugs, drug-related transmission also undermines global efforts to lay the foundation for the eventual end of AIDS. In Eastern Europe and Central Asia, one of two regions where the number of people newly infected is rising, national epidemics are typically driven by drug use–related transmission and by further transmission to the sexual partners of people who use drugs.
Low- and middle-income countries, however, have had limited progress in slowing the spread of HIV among people who inject drugs. Nevertheless, transmission can be reduced substantially. Such countries as Australia and the United Kingdom that have implemented evidence-informed HIV prevention strategies have sharply reduced the number of people who inject drugs who acquire HIV infection, with some approaching the elimination of drug-related transmission.
2 PeoPle wHo Inject drUgs
22×people who inject drugs
have 22 times the rate of hIV infection as the general
population in 49 countries with available data.
35
2012 GLOBAL REPORT
02
Fig. 2.1
prevalence of hIV infection among people who inject drugs versus the general population in countries with available data, most recent year
Prevalence among people who inject drugs reported by the country in 2012
Total prevalence among people 15–49 years old in the general population in 2011
These data were reported in 2012, but countries may differ in methods. Surveys are usually conducted in capital cities and may not be nationally representative. Data is only shown for countries which have reported a sample size greater than 100.
Sources: 2012 country progress reports (www.unaids.org/cpr) and UNAIDS estimates.
Japan
Mexico
Germany
Indonesia
Hungary
Luxembourg
Pakistan
Belarus
Tunisia
Morocco
Ukraine
Finland
Nepal
Kazakhstan
Myanmar
Netherlands
Switzerland
Canada
Australia
Uzbekistan
Thailand
Afghanistan
Iran (Islamic Republic of)
Bulgaria
Kyrgyzstan
Romania
Madagascar
Georgia
Cambodia
Nigeria
Bangladesh
Armenia
China
Malaysia
Latvia
New Zealand
Brazil
Oman
Viet Nam
Estonia
Philippines
Azerbaijan
Spain
Mauritius
Serbia
Tajikistan
Sweden
Senegal
Kenya
0 10% 20% 30% 40% 50% 60%
People who inject drugs
36
UNAIDS
eVIDeNce-INfoRMeD pRogRAMMeS ARe beINg INADeqUATely ScAleD Up
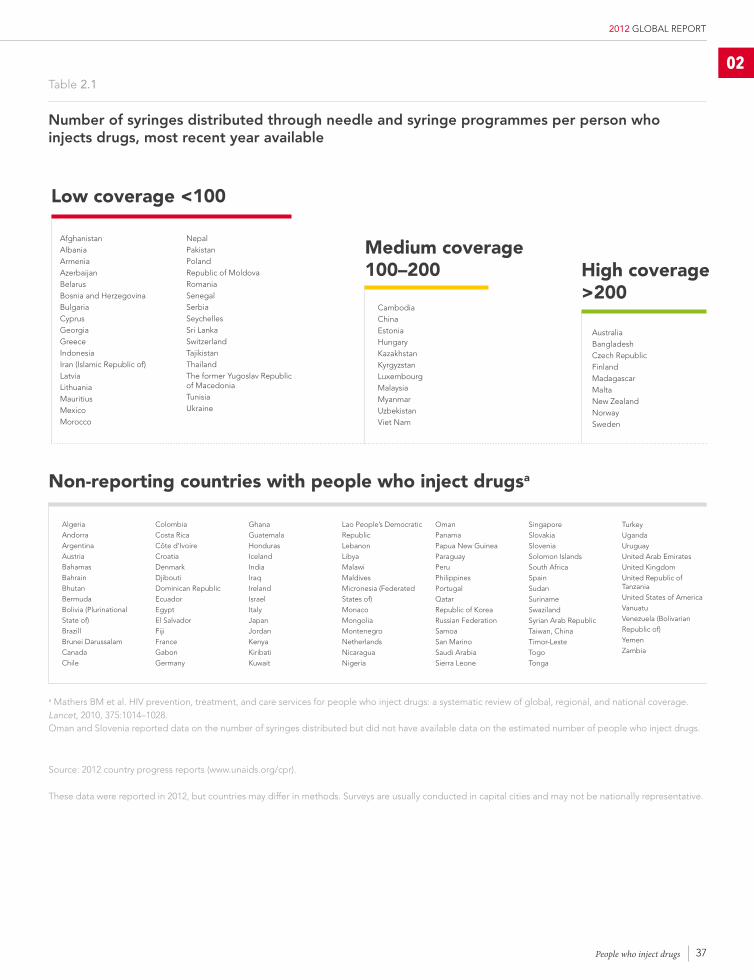
According to country reports, nearly 80% of people who inject drugs reached in surveys in 49 capital cities have access to safe injecting equipment, with similar access reported for men and women. However, evidence from recently published studies (2,3) suggests that accessibility to needle and syringe programmes is low in most countries in which drug use among women is highly stigmatized and that access to any HIV services among women drug users remains very low compared with men drug users. In addition, country reports indicate that the scale of such programmes is inadequate, with most countries indicating that programmes annually provide fewer than 100 needles per person who injects drugs (Table 2.1).1 A separate 2010 study (4) estimated that, globally, two needle-syringes (range 1–4) were distributed monthly per person who injects drugs per month, and another study (5) estimates that people who inject drugs only use sterile injecting equipment for 5% of injections globally.
Emerging evidence indicates that women who inject drugs may experience risks that are greater than for men who inject drugs (6). In particular, women who inject drugs are more vulnerable to violence from intimate partners, police and sex-trade clients (7). Combined with homelessness (8) and comorbid mental disorders (9), these vulnerabilities may act synergistically to increase the risk of exposure to HIV. Clear evidence indicates that women who inject drugs and are living with HIV who become pregnant have a substantially lower likelihood of accessing services to prevent children from acquiring HIV infection than do other women living with HIV.
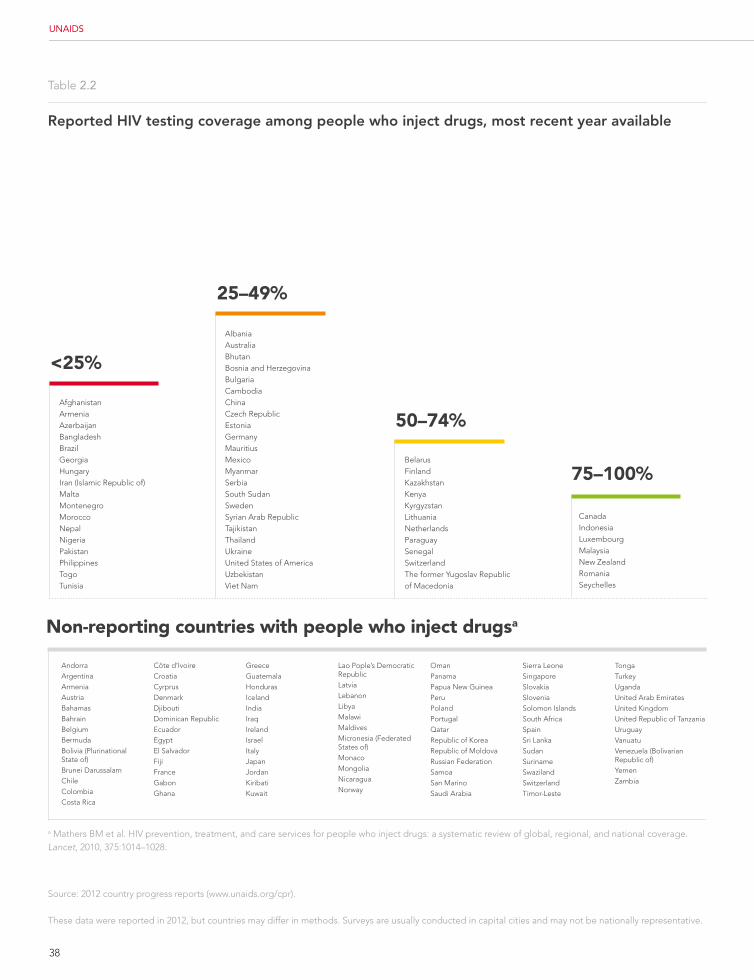
Countries also lag in scaling up other essential prevention measures for people who inject drugs (Tables 2.2 and 2.3). Reported condom use, for example, is lower among people who inject drugs reached in surveys in capital cities than for sex workers or men who have sex with men. Among 56 countries reporting data, the median condom use for people who inject drugs is 40% (30–48%), with only 3 countries reporting condom use above 75%.
HIV testing services are also failing to reach many people who inject drugs. Among 57 countries reporting, a median of 39% (22–60%) of people who inject drugs reached in surveys in capital cities reported having received an HIV test in the previous 12 months, with 8 countries reporting testing rates of at least 75%.
1 Tracking the average number of needles distributed per person who injects drugs is difficult, since it requires reliably estimating the size of national populations using drugs.
37
2012 GLOBAL REPORT
Table 2.1
Number of syringes distributed through needle and syringe programmes per person who injects drugs, most recent year available
Oman and Slovenia reported data on the number of syringes distributed but did not have available data on the estimated number of people who inject drugs.
Source: 2012 country progress reports (www.unaids.org/cpr).
These data were reported in 2012, but countries may differ in methods. Surveys are usually conducted in capital cities and may not be nationally representative.
low coverage <100
AfghanistanAlbaniaArmeniaAzerbaijanBelarusBosnia and HerzegovinaBulgariaCyprusGeorgiaGreeceIndonesiaIran (Islamic Republic of)LatviaLithuaniaMauritiusMexicoMorocco
NepalPakistanPolandRepublic of MoldovaRomaniaSenegalSerbiaSeychellesSri LankaSwitzerlandTajikistanThailandThe former Yugoslav Republic of MacedoniaTunisiaUkraine
high coverage >200
CambodiaChinaEstoniaHungaryKazakhstanKyrgyzstanLuxembourgMalaysiaMyanmarUzbekistanViet Nam
AlgeriaAndorraArgentinaAustriaBahamasBahrainBhutanBermudaBolivia (Plurinational State of)BrazillBrunei DarussalamCanadaChile
ColombiaCosta RicaCôte d’IvoireCroatiaDenmarkDjiboutiDominican RepublicEcuadorEgyptEl SalvadorFijiFranceGabonGermany
GhanaGuatemalaHondurasIcelandIndiaIraqIrelandIsraelItalyJapanJordanKenyaKiribatiKuwait
Lao People’s Democratic RepublicLebanonLibyaMalawiMaldivesMicronesia (Federated States of)MonacoMongoliaMontenegroNetherlandsNicaraguaNigeria
OmanPanamaPapua New GuineaParaguayPeruPhilippinesPortugalQatarRepublic of KoreaRussian FederationSamoaSan MarinoSaudi ArabiaSierra Leone
SingaporeSlovakiaSloveniaSolomon IslandsSouth AfricaSpainSudanSurinameSwazilandSyrian Arab RepublicTaiwan, ChinaTimor-LesteTogoTonga
TurkeyUgandaUruguayUnited Arab EmiratesUnited KingdomUnited Republic of TanzaniaUnited States of AmericaVanuatuVenezuela (Bolivarian Republic of)YemenZambia
medium coverage 100–200
Non-reporting countries with people who inject drugsa
AustraliaBangladeshCzech RepublicFinlandMadagascarMaltaNew ZealandNorwaySweden
a Mathers BM et al. HIV prevention, treatment, and care services for people who inject drugs: a systematic review of global, regional, and national coverage. Lancet, 2010, 375:1014–1028.
People who inject drugs
02
38
UNAIDS
Table 2.2
Reported hIV testing coverage among people who inject drugs, most recent year available
75–100%
Canada Indonesia Luxembourg Malaysia New Zealand Romania Seychelles
50–74%
BelarusFinland KazakhstanKenya Kyrgyzstan Lithuania Netherlands Paraguay Senegal Switzerland The former Yugoslav Republic of Macedonia
25–49%
Albania Australia Bhutan Bosnia and Herzegovina Bulgaria Cambodia China Czech Republic Estonia Germany Mauritius Mexico Myanmar SerbiaSouth Sudan Sweden Syrian Arab Republic Tajikistan Thailand Ukraine United States of AmericaUzbekistanViet Nam
<25%
AfghanistanArmenia AzerbaijanBangladesh Brazil Georgia Hungary Iran (Islamic Republic of)Malta MontenegroMorocco Nepal Nigeria Pakistan Philippines Togo Tunisia
a Mathers BM et al. HIV prevention, treatment, and care services for people who inject drugs: a systematic review of global, regional, and national coverage. Lancet, 2010, 375:1014–1028.
AndorraArgentinaArmeniaAustriaBahamasBahrainBelgiumBermudaBolivia (Plurinational State of)Brunei DarussalamChileColombiaCosta Rica
Côte d’IvoireCroatiaCyrprusDenmarkDjiboutiDominican RepublicEcuadorEgyptEl SalvadorFijiFranceGabonGhana
GreeceGuatemalaHondurasIcelandIndiaIraqIrelandIsraelItalyJapanJordanKiribatiKuwait
Lao Pople’s Democratic RepublicLatviaLebanonLibyaMalawiMaldivesMicronesia (Federated States of)MonacoMongoliaNicaraguaNorway
OmanPanamaPapua New GuineaPeruPolandPortugalQatarRepublic of KoreaRepublic of MoldovaRussian FederationSamoaSan MarinoSaudi Arabia
Sierra LeoneSingaporeSlovakiaSloveniaSolomon IslandsSouth AfricaSpainSri LankaSudanSurinameSwazilandSwitzerlandTimor-Leste
TongaTurkeyUgandaUnited Arab EmiratesUnited KingdomUnited Republic of TanzaniaUruguayVanuatuVenezuela (Bolivarian Republic of)YemenZambia
Non-reporting countries with people who inject drugsa
Source: 2012 country progress reports (www.unaids.org/cpr).
These data were reported in 2012, but countries may differ in methods. Surveys are usually conducted in capital cities and may not be nationally representative.
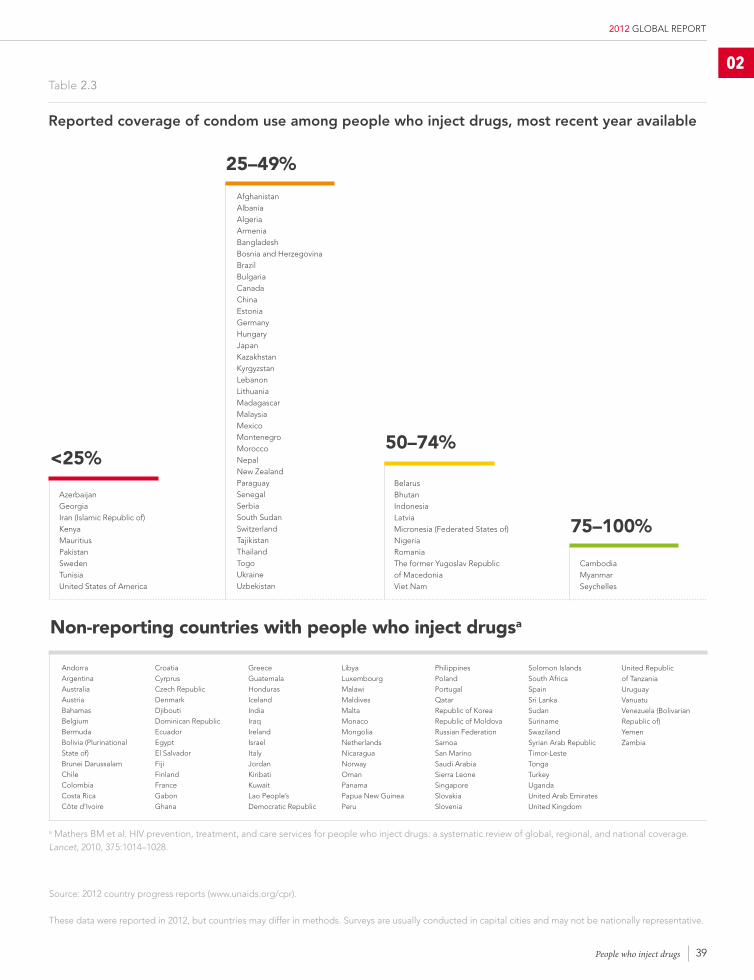
39
2012 GLOBAL REPORT
75–100%
50–74%
25–49%
<25%
Table 2.3
Reported coverage of condom use among people who inject drugs, most recent year available
Cambodia Myanmar Seychelles
BelarusBhutan Indonesia Latvia Micronesia (Federated States of)Nigeria Romania The former Yugoslav Republic of MacedoniaViet Nam
AfghanistanAlbania Algeria Armenia Bangladesh Bosnia and Herzegovina Brazil Bulgaria Canada China Estonia Germany Hungary Japan KazakhstanKyrgyzstan Lebanon Lithuania Madagascar Malaysia Mexico MontenegroMorocco Nepal New Zealand Paraguay Senegal SerbiaSouth Sudan Switzerland Tajikistan Thailand Togo Ukraine Uzbekistan
Azerbaijan Georgia Iran (Islamic Republic of) Kenya Mauritius Pakistan Sweden Tunisia United States of America
a Mathers BM et al. HIV prevention, treatment, and care services for people who inject drugs: a systematic review of global, regional, and national coverage. Lancet, 2010, 375:1014–1028.
AndorraArgentinaAustraliaAustriaBahamasBelgiumBermudaBolivia (PlurinationalState of)Brunei DarussalamChileColombiaCosta RicaCôte d’Ivoire
CroatiaCyrprusCzech RepublicDenmarkDjiboutiDominican RepublicEcuadorEgyptEl SalvadorFijiFinlandFranceGabonGhana
GreeceGuatemalaHondurasIcelandIndiaIraqIrelandIsraelItalyJordanKiribatiKuwaitLao People’s Democratic Republic
LibyaLuxembourgMalawiMaldivesMaltaMonacoMongoliaNetherlandsNicaraguaNorwayOmanPanamaPapua New GuineaPeru
PhilippinesPolandPortugalQatarRepublic of KoreaRepublic of MoldovaRussian FederationSamoaSan MarinoSaudi ArabiaSierra LeoneSingaporeSlovakiaSlovenia
Solomon IslandsSouth AfricaSpainSri LankaSudanSurinameSwazilandSyrian Arab RepublicTimor-LesteTongaTurkeyUgandaUnited Arab EmiratesUnited Kingdom
United Republic of TanzaniaUruguayVanuatuVenezuela (BolivarianRepublic of)YemenZambia
Non-reporting countries with people who inject drugsa
Source: 2012 country progress reports (www.unaids.org/cpr).
These data were reported in 2012, but countries may differ in methods. Surveys are usually conducted in capital cities and may not be nationally representative.
02
People who inject drugs
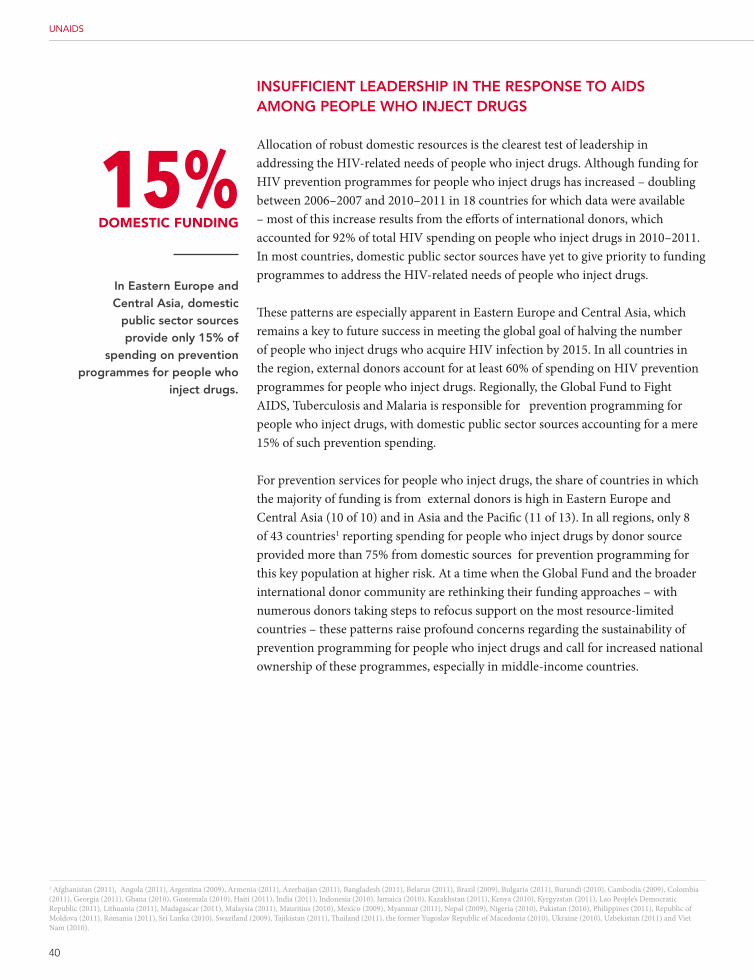
40
UNAIDS
INSUffIcIeNT leADeRShIp IN The ReSpoNSe To AIDS AMoNg people who INJecT DRUgS
Allocation of robust domestic resources is the clearest test of leadership in addressing the HIV-related needs of people who inject drugs. Although funding for HIV prevention programmes for people who inject drugs has increased – doubling between 2006–2007 and 2010–2011 in 18 countries for which data were available – most of this increase results from the efforts of international donors, which accounted for 92% of total HIV spending on people who inject drugs in 2010–2011. In most countries, domestic public sector sources have yet to give priority to funding programmes to address the HIV-related needs of people who inject drugs.
These patterns are especially apparent in Eastern Europe and Central Asia, which remains a key to future success in meeting the global goal of halving the number of people who inject drugs who acquire HIV infection by 2015. In all countries in the region, external donors account for at least 60% of spending on HIV prevention programmes for people who inject drugs. Regionally, the Global Fund to Fight AIDS, Tuberculosis and Malaria is responsible for prevention programming for people who inject drugs, with domestic public sector sources accounting for a mere 15% of such prevention spending.
For prevention services for people who inject drugs, the share of countries in which the majority of funding is from external donors is high in Eastern Europe and Central Asia (10 of 10) and in Asia and the Pacific (11 of 13). In all regions, only 8 of 43 countries1 reporting spending for people who inject drugs by donor source provided more than 75% from domestic sources for prevention programming for this key population at higher risk. At a time when the Global Fund and the broader international donor community are rethinking their funding approaches – with numerous donors taking steps to refocus support on the most resource-limited countries – these patterns raise profound concerns regarding the sustainability of prevention programming for people who inject drugs and call for increased national ownership of these programmes, especially in middle-income countries.
1 Afghanistan (2011), Angola (2011), Argentina (2009), Armenia (2011), Azerbaijan (2011), Bangladesh (2011), Belarus (2011), Brazil (2009), Bulgaria (2011), Burundi (2010), Cambodia (2009), Colombia (2011), Georgia (2011), Ghana (2010), Guatemala (2010), Haiti (2011), India (2011), Indonesia (2010), Jamaica (2010), Kazakhstan (2011), Kenya (2010), Kyrgyzstan (2011), Lao People’s Democratic Republic (2011), Lithuania (2011), Madagascar (2011), Malaysia (2011), Mauritius (2010), Mexico (2009), Myanmar (2011), Nepal (2009), Nigeria (2010), Pakistan (2010), Philippines (2011), Republic of Moldova (2011), Romania (2011), Sri Lanka (2010), Swaziland (2009), Tajikistan (2011), Thailand (2011), the former Yugoslav Republic of Macedonia (2010), Ukraine (2010), Uzbekistan (2011) and Viet Nam (2010).
15%DomeStIc FUNDINg
In eastern europe and central Asia, domestic
public sector sources provide only 15% of
spending on prevention programmes for people who
inject drugs.
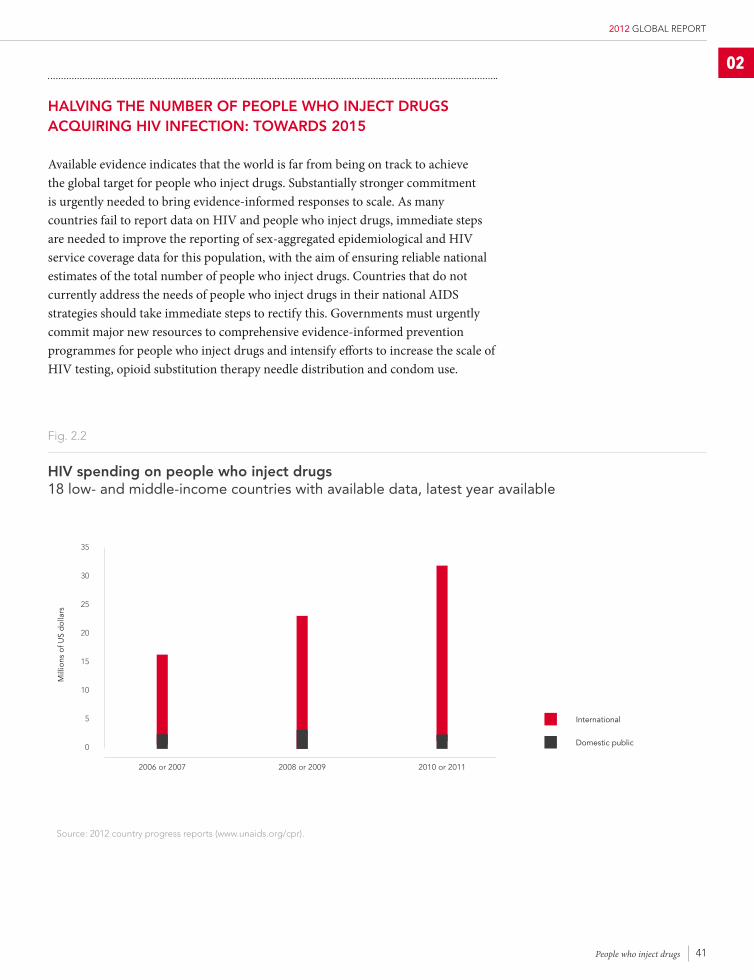
41
2012 GLOBAL REPORT
hAlVINg The NUMbeR of people who INJecT DRUgS AcqUIRINg hIV INfecTIoN: TowARDS 2015
Available evidence indicates that the world is far from being on track to achieve the global target for people who inject drugs. Substantially stronger commitment is urgently needed to bring evidence-informed responses to scale. As many countries fail to report data on HIV and people who inject drugs, immediate steps are needed to improve the reporting of sex-aggregated epidemiological and HIV service coverage data for this population, with the aim of ensuring reliable national estimates of the total number of people who inject drugs. Countries that do not currently address the needs of people who inject drugs in their national AIDS strategies should take immediate steps to rectify this. Governments must urgently commit major new resources to comprehensive evidence-informed prevention programmes for people who inject drugs and intensify efforts to increase the scale of HIV testing, opioid substitution therapy needle distribution and condom use.
02
Fig. 2.2
hIV spending on people who inject drugs 18 low- and middle-income countries with available data, latest year available
35
20
25
30
15
5
10
0
International
Domestic public
2008 or 2009
Mill
ions
of U
S d
olla
rs
2006 or 2007 2010 or 2011
People who inject drugs
Source: 2012 country progress reports (www.unaids.org/cpr).
42
UNAIDS
The world has embarked on an historic effort to end new HIV infections among children and reduce the number of women living with HIV who die from pregnancy-related causes. Stakeholders have joined together to develop the Global Plan towards the elimination of new HIV infections among children by 2015 and keeping their mothers alive (1). In 2011, the world made additional progress in advancing towards the 2015 goal, generating significant confidence in the feasibility of eliminating new infections among children by 2015.
The NUMbeR of chIlDReN Newly INfecTeD wITh hIV coNTINUeS To DeclINe
In 2011, 330 000 [280 000–390 000] children acquired HIV infection. This represents a 43% decline since 2003 (when 560 000 [510 000–650 000] children became newly infected) and a 24% drop since 2009 (when 430 000 [370 000–490 000] children acquired HIV infection).
More than 90% of the children who acquired HIV infection in 2011 live in sub-Saharan Africa. There, the number of children newly infected fell by 24% from 2009 to 2011. The number of children acquiring HIV infection also declined significantly in the Caribbean (32%) and Oceania (36%), with a more modest decline in Asia (12%). Declines have also been modest in Latin America (24%), Eastern Europe and Central Asia (13%). However, these three regions had already significantly reduced the numbers of children newly acquiring HIV infection. The Middle East and North Africa is the only region that has yet to see a reduction in the number of children newly infected.
In countries with generalized epidemics that account for the overwhelming majority of the children newly infected, major gains have occurred during the past decade. In six countries (Burundi, Kenya, Namibia, South Africa, Togo and Zambia), the number of children newly infected declined by 40–59% from 2009 to 2011. In 16 additional countries, declines of 20–39% occurred during the same period.
3 HIV InFectIon AMong cHIldren And KeePIng tHeIr MotHers AlIVe
409 000In the three years 2009 to
2011, antiretroviral prophylaxis prevented 409 000 children from
acquiring hIV infection in low- and middle-income
countries.
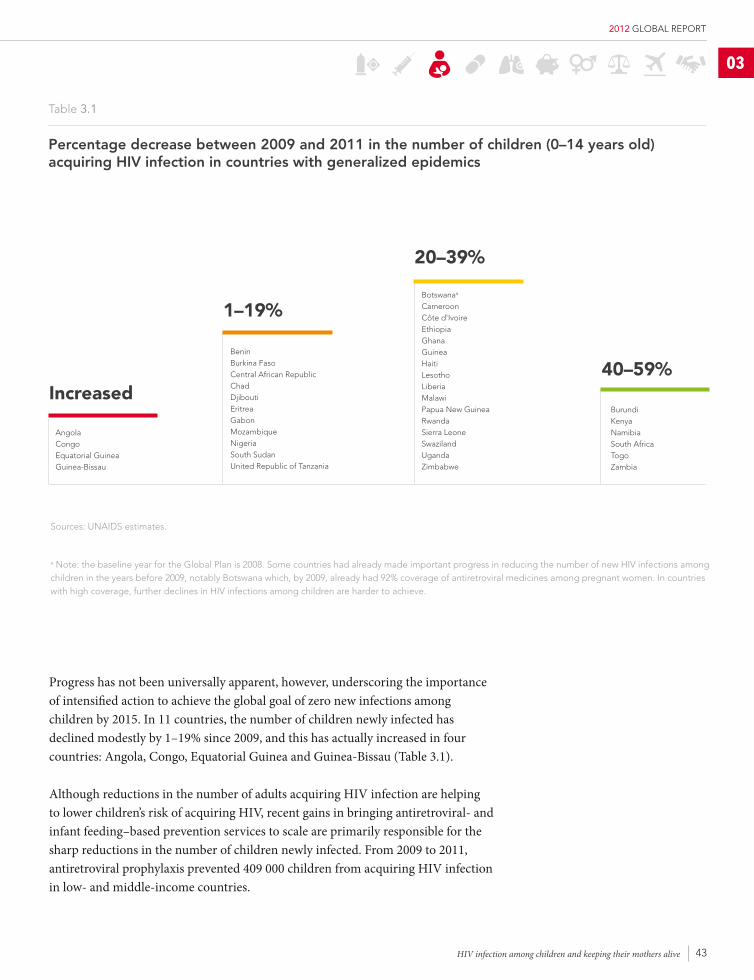
43
2012 GLOBAL REPORT
03
Table 3.1
percentage decrease between 2009 and 2011 in the number of children (0–14 years old) acquiring hIV infection in countries with generalized epidemics
Sources: UNAIDS estimates.
Increased
AngolaCongoEquatorial GuineaGuinea-Bissau
1–19%
BeninBurkina FasoCentral African RepublicChadDjiboutiEritreaGabonMozambiqueNigeriaSouth SudanUnited Republic of Tanzania
20–39%
Botswanaa
CameroonCôte d'IvoireEthiopiaGhanaGuineaHaitiLesothoLiberiaMalawiPapua New GuineaRwandaSierra LeoneSwazilandUgandaZimbabwe
40–59%
BurundiKenyaNamibiaSouth AfricaTogoZambia
Progress has not been universally apparent, however, underscoring the importance of intensified action to achieve the global goal of zero new infections among children by 2015. In 11 countries, the number of children newly infected has declined modestly by 1–19% since 2009, and this has actually increased in four countries: Angola, Congo, Equatorial Guinea and Guinea-Bissau (Table 3.1).
Although reductions in the number of adults acquiring HIV infection are helping to lower children’s risk of acquiring HIV, recent gains in bringing antiretroviral- and infant feeding–based prevention services to scale are primarily responsible for the sharp reductions in the number of children newly infected. From 2009 to 2011, antiretroviral prophylaxis prevented 409 000 children from acquiring HIV infection in low- and middle-income countries.
HIV infection among children and keeping their mothers alive
a Note: the baseline year for the Global Plan is 2008. Some countries had already made important progress in reducing the number of new HIV infections among children in the years before 2009, notably Botswana which, by 2009, already had 92% coverage of antiretroviral medicines among pregnant women. In countries with high coverage, further declines in HIV infections among children are harder to achieve.
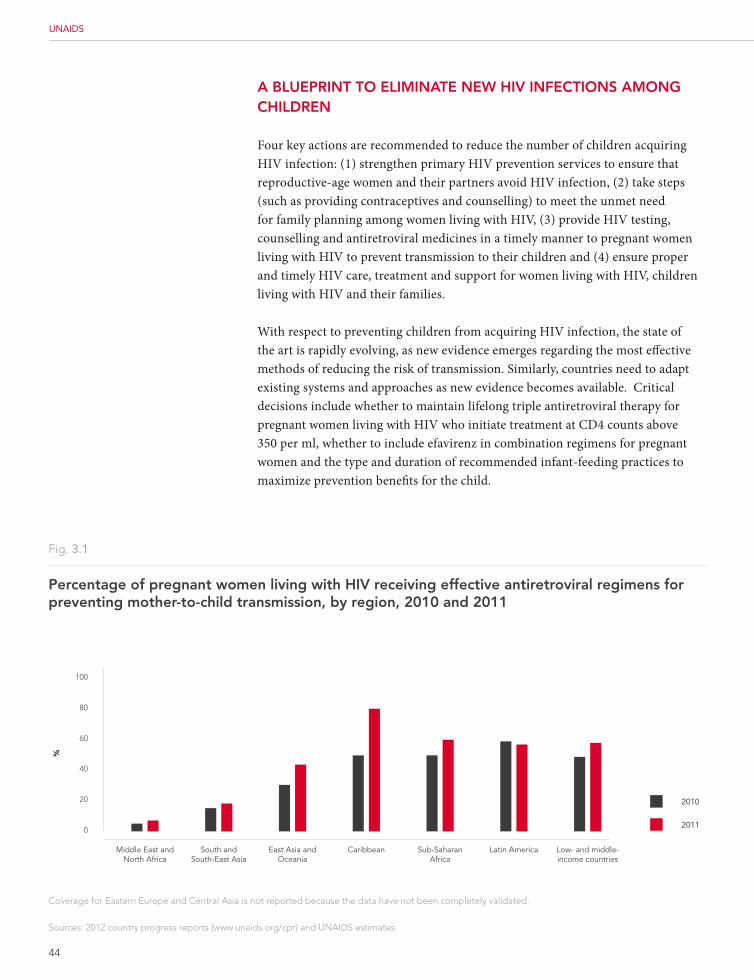
44
UNAIDS
Fig. 3.1
percentage of pregnant women living with hIV receiving effective antiretroviral regimens for preventing mother-to-child transmission, by region, 2010 and 2011
Coverage for Eastern Europe and Central Asia is not reported because the data have not been completely validated.
Sources: 2012 country progress reports (www.unaids.org/cpr) and UNAIDS estimates.
100
80
60
40
20
0
2010
2011
Middle East and North Africa
South and South-East Asia
East Asia and Oceania
Caribbean Sub-Saharan Africa
Latin America Low- and middle-income countries
%
A blUepRINT To elIMINATe New hIV INfecTIoNS AMoNg chIlDReN
Four key actions are recommended to reduce the number of children acquiring HIV infection: (1) strengthen primary HIV prevention services to ensure that reproductive-age women and their partners avoid HIV infection, (2) take steps (such as providing contraceptives and counselling) to meet the unmet need for family planning among women living with HIV, (3) provide HIV testing, counselling and antiretroviral medicines in a timely manner to pregnant women living with HIV to prevent transmission to their children and (4) ensure proper and timely HIV care, treatment and support for women living with HIV, children living with HIV and their families.
With respect to preventing children from acquiring HIV infection, the state of the art is rapidly evolving, as new evidence emerges regarding the most effective methods of reducing the risk of transmission. Similarly, countries need to adapt existing systems and approaches as new evidence becomes available. Critical decisions include whether to maintain lifelong triple antiretroviral therapy for pregnant women living with HIV who initiate treatment at CD4 counts above 350 per ml, whether to include efavirenz in combination regimens for pregnant women and the type and duration of recommended infant-feeding practices to maximize prevention benefits for the child.
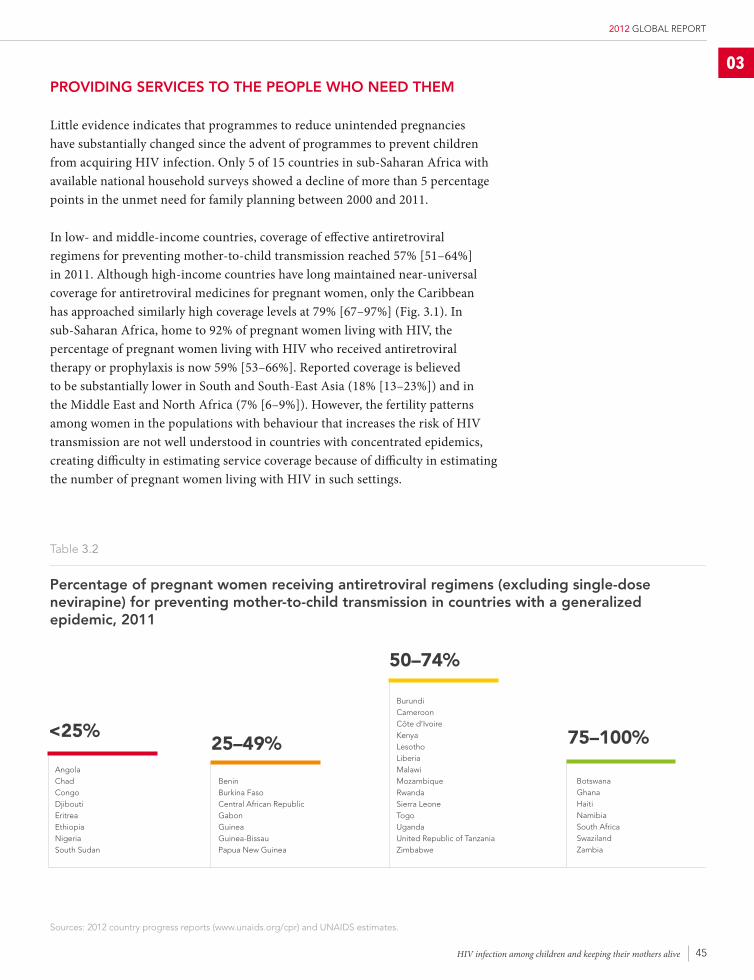
45
2012 GLOBAL REPORT
Table 3.2
percentage of pregnant women receiving antiretroviral regimens (excluding single-dose nevirapine) for preventing mother-to-child transmission in countries with a generalized epidemic, 2011
Sources: 2012 country progress reports (www.unaids.org/cpr) and UNAIDS estimates.
<25%
AngolaChadCongoDjiboutiEritreaEthiopiaNigeriaSouth Sudan
25–49%
BeninBurkina FasoCentral African RepublicGabonGuineaGuinea-BissauPapua New Guinea
50–74%
BurundiCameroonCôte d’IvoireKenyaLesothoLiberiaMalawiMozambiqueRwandaSierra LeoneTogoUgandaUnited Republic of TanzaniaZimbabwe
75–100%
BotswanaGhanaHaitiNamibiaSouth AfricaSwazilandZambia
03pRoVIDINg SeRVIceS To The people who NeeD TheM
Little evidence indicates that programmes to reduce unintended pregnancies have substantially changed since the advent of programmes to prevent children from acquiring HIV infection. Only 5 of 15 countries in sub-Saharan Africa with available national household surveys showed a decline of more than 5 percentage points in the unmet need for family planning between 2000 and 2011.
In low- and middle-income countries, coverage of effective antiretroviral regimens for preventing mother-to-child transmission reached 57% [51–64%] in 2011. Although high-income countries have long maintained near-universal coverage for antiretroviral medicines for pregnant women, only the Caribbean has approached similarly high coverage levels at 79% [67–97%] (Fig. 3.1). In sub-Saharan Africa, home to 92% of pregnant women living with HIV, the percentage of pregnant women living with HIV who received antiretroviral therapy or prophylaxis is now 59% [53–66%]. Reported coverage is believed to be substantially lower in South and South-East Asia (18% [13–23%]) and in the Middle East and North Africa (7% [6–9%]). However, the fertility patterns among women in the populations with behaviour that increases the risk of HIV transmission are not well understood in countries with concentrated epidemics, creating difficulty in estimating service coverage because of difficulty in estimating the number of pregnant women living with HIV in such settings.
HIV infection among children and keeping their mothers alive
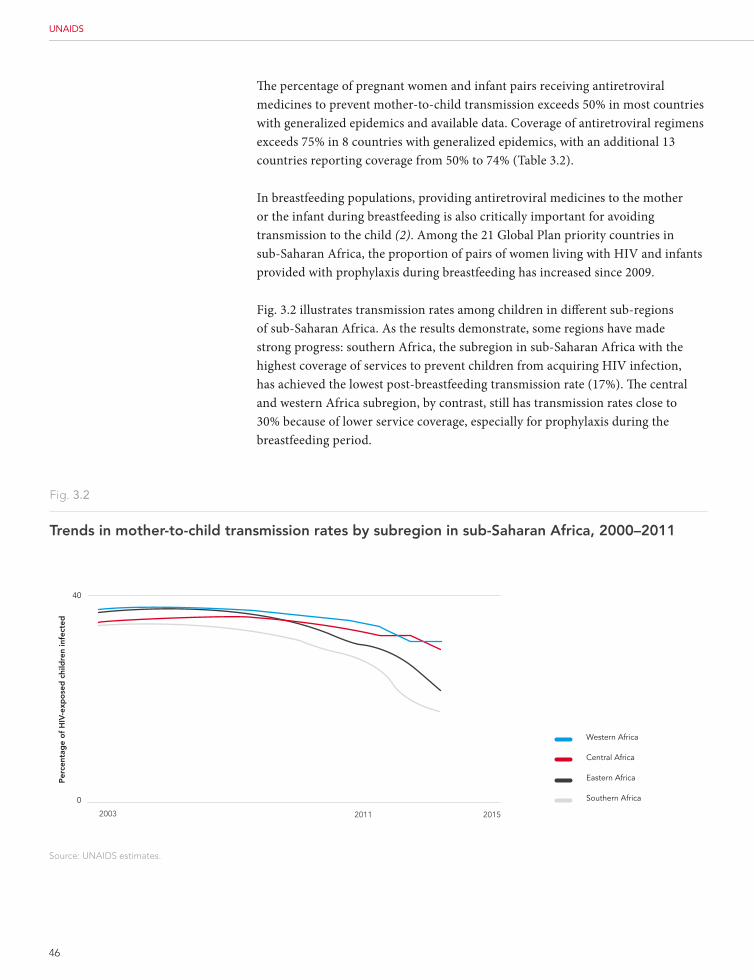
46
UNAIDS
The percentage of pregnant women and infant pairs receiving antiretroviral medicines to prevent mother-to-child transmission exceeds 50% in most countries with generalized epidemics and available data. Coverage of antiretroviral regimens exceeds 75% in 8 countries with generalized epidemics, with an additional 13 countries reporting coverage from 50% to 74% (Table 3.2).
In breastfeeding populations, providing antiretroviral medicines to the mother or the infant during breastfeeding is also critically important for avoiding transmission to the child (2). Among the 21 Global Plan priority countries in sub-Saharan Africa, the proportion of pairs of women living with HIV and infants provided with prophylaxis during breastfeeding has increased since 2009.
Fig. 3.2 illustrates transmission rates among children in different sub-regions of sub-Saharan Africa. As the results demonstrate, some regions have made strong progress: southern Africa, the subregion in sub-Saharan Africa with the highest coverage of services to prevent children from acquiring HIV infection, has achieved the lowest post-breastfeeding transmission rate (17%). The central and western Africa subregion, by contrast, still has transmission rates close to 30% because of lower service coverage, especially for prophylaxis during the breastfeeding period.
Fig. 3.2
Trends in mother-to-child transmission rates by subregion in sub-Saharan Africa, 2000–2011
Source: UNAIDS estimates.
Western Africa
Central Africa
Eastern Africa
Southern Africa
per
cent
age
of
hIV
-exp
ose
d c
hild
ren
infe
cted
0
2003 2011 2015
40
47
2012 GLOBAL REPORT
03For the children who do become infected with HIV, international guidelines recommend that all children younger than two years start immediately on antiretroviral therapy, whereas older children follow different guidelines based on their CD4 levels (3). In 2011, only 28% [25–31%] of children 0–14 years old who were eligible were receiving the life-saving medicines. Depending on the age of the child when infected, this could mean death within less than one year (4).
Ensuring treatment access for mothers living with HIV benefits not only mothers themselves but also their children, since studies indicate that children whose mothers die also have an increased risk of death regardless of the child’s HIV status. The percentage of treatment-eligible pregnant women living with HIV who are receiving antiretroviral therapy for their own health in 2011 was 30% [27–32%] – lower than the estimated coverage for all adults eligible for antiretroviral therapy (according to WHO guidelines) of 54% [51–59%]. Qualitative research is needed to determine why, despite higher levels of access to health care, pregnant women are not starting, or being reported to start, antiretroviral therapy. Recent estimates suggest that pregnancy-related deaths among women living with HIV have declined from 46 000 in 2005 to an estimated 37 000 in 2010. More effort is needed to ensure that pregnant women tested for HIV during antenatal care are also tested for eligibility for antiretroviral therapy.
Since pregnant women living with HIV have a much higher risk of developing TB, TB screening, prevention and infection control are integral components of the package of care for eliminating mother-to-child transmission. The risk of developing active TB is more than 10 times higher among pregnant women living with HIV than among HIV-negative pregnant women. In addition, TB is associated with a range of extremely poor obstetric and perinatal outcomes, including more than double the risk of HIV transmission to the unborn child, a 2.2- to 3.2-fold increased risk of maternal mortality and a 3.4-fold increased risk of infant mortality (5). Since antiretroviral therapy reduces the risk of TB by 65% irrespective of CD4 count, combining early antiretroviral therapy with regular TB screening at each health visit helps ensure that eligible mothers are provided isoniazid preventive treatment or early treatment for active TB, giving both mother and child a much better chance of survival.
Pregnant women living with HIV in humanitarian crisis settings are at particular risk. To reach the objective of no child born with HIV infection and keeping their mothers alive, humanitarian actors should scale up prevention services and ensure that forcibly displaced women have access to HIV prevention services, treatment, care and support.
HIV infection among children and keeping their mothers alive
30%tReAtmeNt coVeRAge
only 30% of eligible pregnant women were receiving antiretroviral therapy for their own health in 2011, compared with 54% for all eligible adults.
48
UNAIDS
NATIoNAl polIcIeS NeeD STReNgTheNINg
Among the 22 priority countries included in the Global Plan,1 21 have developed national targets for preventing children from becoming newly infected with HIV and have aligned their national strategies with the elements of the Global Plan. However, available evidence reveals persistent shortcomings in policy frameworks and clinical practices in many of these countries. In 2011, for example, 32 countries (including 12 countries with a high burden of HIV infection) reported they were still providing some pregnant women with suboptimal single-dose nevirapine regimens for preventing children from acquiring HIV infection.
Although breastfeeding is the norm throughout most of sub-Saharan Africa and many other parts of the world, only 10 of 43 countries in this region reported the number of breastfeeding women or infants who were receiving antiretroviral prophylaxis during breastfeeding. These disappointing results may be partly explained by weak reporting mechanisms, but they are also likely to reflect challenges that countries are experiencing in linking breastfeeding women with needed services and support at both the facility and community levels.
National and global leadership in the quest to eliminate new infections among children also needs to improve. Thirteen of the 22 Global Plan priority countries reported on trends in spending on services to prevent children from becoming newly infected with HIV between 2008 and 2010. The resources dedicated to programmes to prevent children from acquiring HIV infection has increased in some countries (Botswana, Burundi, Cameroon, Ghana and Kenya), but declines in funding (Angola, Chad and Namibia) or inconsistent spending patterns (the Democratic Republic of the Congo, India, Lesotho and Nigeria) are reported elsewhere, according to reported AIDS spending data.
elIMINATINg New hIV INfecTIoNS AMoNg chIlDReN AND KeepINg TheIR MoTheRS AlIVe: TowARDS 2015
Achieving 57% coverage of services to prevent children from acquiring HIV infection represents a major accomplishment. However, reaching the global goal of eliminating new HIV infections among children by 2015 will require not only accelerated efforts to bring services to prevent children from acquiring HIV infection to scale but also steps to ensure that all programmatic elements of the Global Plan are fully implemented. In particular, reaching global goals will be impossible without preventing reproductive-age women from acquiring HIV infection and enabling women living with HIV to make decisions about their reproductive life. The most effective prophylactic regimens must be used, and prevention efforts must extend beyond the antenatal period to
1 The Global Plan priority countries include: Angola, Botswana, Burundi, Cameroun, Chad, Côte d’Ivoire, Democratic Republic of the Congo, Ethiopia, Ghana, India, Kenya, Lesotho, Malawi, Mozambique, Namibia, Nigeria, South Africa, Swaziland, Uganda, United Republic of Tanzania, Zambia and Zimbabwe.
49
2012 GLOBAL REPORT
03encompass the duration of breastfeeding as well (6). Early diagnosis and treatment will be critical for improving the survival of children exposed to HIV and for ensuring high-quality programmes. Partners will need to collaborate to retrain nurses and ensure that all clinical settings have access to essential medicines.
Intensified efforts are needed to deliver timely, high-quality treatment and care to women living with HIV. An estimated 70% [68–73%] of pregnant women with CD4 counts below 350 per ml are not receiving antiretroviral therapy – a pattern that undermines women’s health as well as global efforts to prevent transmission to their children.
Growing evidence indicates the wisdom of continuing to provide mothers living with HIV with the same combination regimens they take as prophylaxis during pregnancy for the remainder of their lives (Option B+). This approach has the potential to reduce transmission rates for future births, lower the odds of transmission to sexual partners, improve maternal survival and promote simplified treatment regimens (7). It is essential that this be implemented with the informed consent of the women concerned and in a rights-based manner.
Integrating comprehensive prevention and antiretroviral services with maternal, neonatal and child health services will improve the efficiency and effectiveness of all interventions. By packaging services, women are more likely to obtain the services they require and service efficiency will be enhanced (8). Service integration is especially important in countries with generalized HIV epidemics, since HIV care is a substantial burden for already weak health care systems.
Additional efforts are also needed to minimize social and structural impediments to scaling up. Community programmes that mentor mothers, support disclosure, promote the involvement of men and boys and reduce stigma and discrimination are all critical to promote access to essential services and retain families in care. In addition, even in countries that have reached high levels of service coverage, concerted efforts are needed to reach the most marginalized and vulnerable populations, such as women who use drugs, women who sell sex, women in prison, illegal migrants and ethnic minorities. The marginalized groups, who are often missed by mainstream maternal and child health services, experience rates of HIV transmission from mother to child that are nearly 2.5 times higher than that of the general population (9).
Involving affected communities, innovation and commitment will be required to alleviate the stigma that would deter women living with HIV and vulnerable women from attending antenatal care. Recognizing the unique opportunity to eliminate new HIV infections among children by 2015, national and international partners also need to ensure that competing health priorities do not crowd out essential support for HIV prevention services.
HIV infection among children and keeping their mothers alive
2.5×children of mothers in marginalized populations experience hIV transmission nearly 2.5 times higher than in the general population.
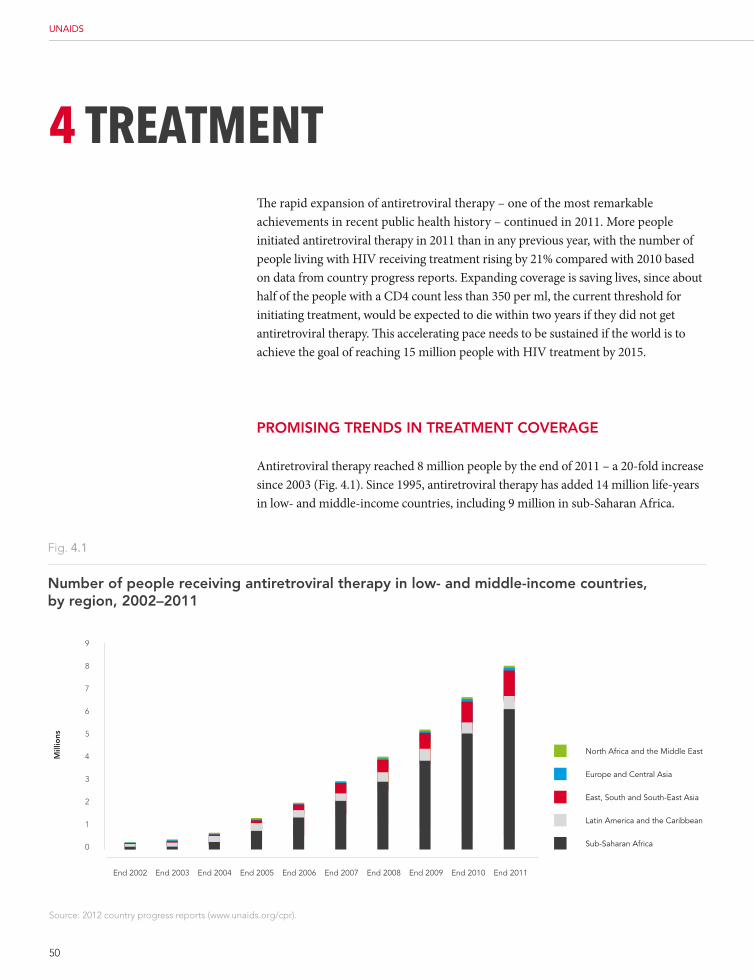
50
UNAIDS
4 treAtMentThe rapid expansion of antiretroviral therapy – one of the most remarkable achievements in recent public health history – continued in 2011. More people initiated antiretroviral therapy in 2011 than in any previous year, with the number of people living with HIV receiving treatment rising by 21% compared with 2010 based on data from country progress reports. Expanding coverage is saving lives, since about half of the people with a CD4 count less than 350 per ml, the current threshold for initiating treatment, would be expected to die within two years if they did not get antiretroviral therapy. This accelerating pace needs to be sustained if the world is to achieve the goal of reaching 15 million people with HIV treatment by 2015.
pRoMISINg TReNDS IN TReATMeNT coVeRAge
Antiretroviral therapy reached 8 million people by the end of 2011 – a 20-fold increase since 2003 (Fig. 4.1). Since 1995, antiretroviral therapy has added 14 million life-years in low- and middle-income countries, including 9 million in sub-Saharan Africa.
Fig. 4.1
Number of people receiving antiretroviral therapy in low- and middle-income countries, by region, 2002–2011
Source: 2012 country progress reports (www.unaids.org/cpr).
9
8
7
6
5
4
3
2
1
0
End 2002 End 2003 End 2004 End 2005 End 2006 End 2007 End 2008 End 2009 End 2010 End 2011
Mill
ions
North Africa and the Middle East
Europe and Central Asia
East, South and South-East Asia
Latin America and the Caribbean
Sub-Saharan Africa
51
2012 GLOBAL REPORT
In 2011, for the first time, a majority (54%) of people eligible for antiretroviral therapy in low- and middle-income countries were receiving it. Latin America (68%), the Caribbean (67%), and Oceania (69%) had the highest coverage. Coverage in sub-Saharan Africa is modestly higher than the global average, with 56% of eligible individuals receiving therapy. Coverage remains low in Eastern Europe and Central Asia (25%) and in the Middle East and North Africa (15%).
The number of countries achieving at least 80% treatment coverage increased from 7 in 2009 to 10 in 2011, and the number of countries with coverage less than 20% fell from 28 in 2009 to 10 in 2011. This represents real progress, although the fact that fewer than 1 in 5 people who are eligible for treatment receive it in 10 countries demands urgent attention.
Antiretroviral therapy coverage remains higher for women (68%) than for men (47%) in low- and middle-income countries. The treatment access gap for children also persists, with global coverage much lower for children (28%) than for adults (58%). Forty-two countries provide antiretroviral therapy to fewer than 1 in 5 treatment-eligible children, versus 10 with adult treatment coverage less than 20%. However, more countries have achieved 80% antiretroviral coverage for children (18) than have reached this goal for adults (14).
Access and continuity of HIV treatment remains an important issue for populations affected by humanitarian crises. In 2011, 93% of refugees in Asia, Africa, Latin America and the Middle East and North Africa had access to antiretroviral therapy at a level similar to that of the surrounding population.
IMpRoVINg pRogRAMMe oUTcoMeS
Compelling evidence indicates that programme implementers are benefiting from lessons learned over the past decade to enhance the success of treatment initiatives. Task-shifting and declining drug costs allow treatment to be delivered to more individuals with the same finite resources. In Mozambique, enhanced programme monitoring helped to reduce the costs of antiretroviral therapy per person by 45% from 2009 to 2011 (1). According to a 2012 study by the Clinton Health Access Initiative of more than 160 clinics in five countries in sub-Saharan Africa (2), the cost per person of delivering HIV treatment has steadily declined over time.
North Africa and the Middle East
Europe and Central Asia
East, South and South-East Asia
Latin America and the Caribbean
Sub-Saharan Africa
04
Treatment
28%coVeRAge FoR chIlDReN
hIV treatment coverage is 68% for women and 47% for men in low-and middle-income countries, compared with 28% for children worldwide.
52
UNAIDS
fURTheR ReDUcINg TReATMeNT coSTS
In addition to reducing per-person treatment costs by enhancing programme management, efforts are also needed to further reduce the cost of antiretroviral medicines. Countries, with the support of international partners, should take steps to build local pharmaceutical capacity and take full advantage of the flexibilities permitted under the Trade-Related Aspects of Intellectual Property Rights (TRIPS) agreement. As recommended by the WHO Consultative Expert Working Group, urgent attention should focus on developing innovative funding mechanisms to spur additional health research and development for HIV and other health problems confronting low- and middle-income countries, with particular attention to developing affordable new tools to address priority health issues.
eNgAgINg coMMUNITIeS IN The pUSh To expAND TReATMeNT AcceSS
Treatment 2.0, a programmatic approach to catalyse the next phase of HIV treatment, calls for the full involvement of people living with HIV and affected communities in planning, implementing and evaluating high-quality, rights-based HIV care and treatment programmes. Community leadership has the potential to generate robust, sustainable demand for treatment services and to improve treatment adherence and other treatment-related outcomes. Although a recent review of available experience indicated that 70% of the people in clinic-based treatment programmes in sub-Saharan Africa were still receiving antiretroviral therapy two years after initiating treatment, two-year retention rates rose to 98% in a programme in Mozambique that used community support strategies to complement clinical services. UNAIDS is working to build the evidence base for community involvement to strengthen programmes for HIV care and treatment.
Efforts are underway to improve results at each stage of the treatment continuum. Surveys conducted between 2004 and 2011 in 14 countries in sub-Saharan Africa show that the percentage of adults who received an HIV test in the previous 12 months has significantly increased as antiretroviral therapy programmes have been scaled up and as countries have invested in a broader array of testing strategies, such as provider-initiated testing and counselling, rapid testing technologies and home-based testing campaigns (Fig. 4.2). Innovative approaches, including multi-disease prevention campaigns in Kenya and Uganda, have demonstrated the feasibility and potential of community-based testing approaches. In 14 countries studied in sub-Saharan Africa, testing rates tend to be higher among women than among men, perhaps in part because of the increased availability of testing in antenatal settings. Although the trend towards increased population-based testing rates is encouraging, the available evidence does not conclusively demonstrate that testing programmes are reaching the age and population cohorts at highest risk.
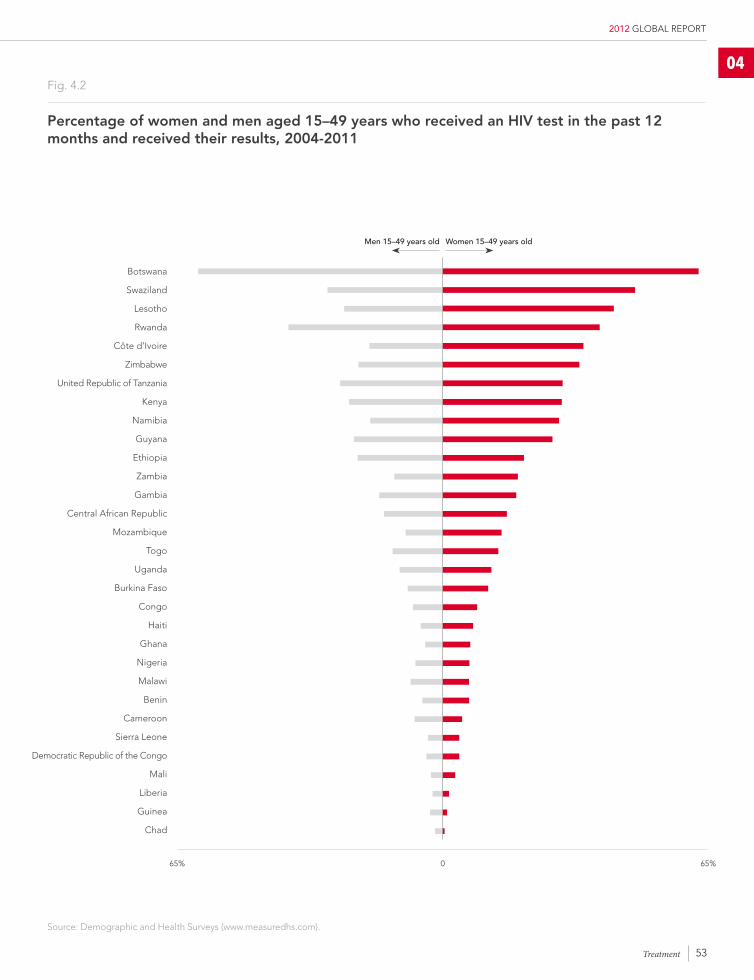
53
2012 GLOBAL REPORT
Fig. 4.2
percentage of women and men aged 15–49 years who received an hIV test in the past 12 months and received their results, 2004-2011
Source: Demographic and Health Surveys (www.measuredhs.com).
04
Treatment
Botswana
Swaziland
Lesotho
Rwanda
Côte d’Ivoire
Zimbabwe
United Republic of Tanzania
Kenya
Namibia
Guyana
Ethiopia
Zambia
Gambia
Central African Republic
Mozambique
Togo
Uganda
Burkina Faso
Congo
Haiti
Ghana
Nigeria
Malawi
Benin
Cameroon
Sierra Leone
Democratic Republic of the Congo
Mali
Liberia
Guinea
Chad
0 65%65%
Women 15–49 years oldmen 15–49 years old
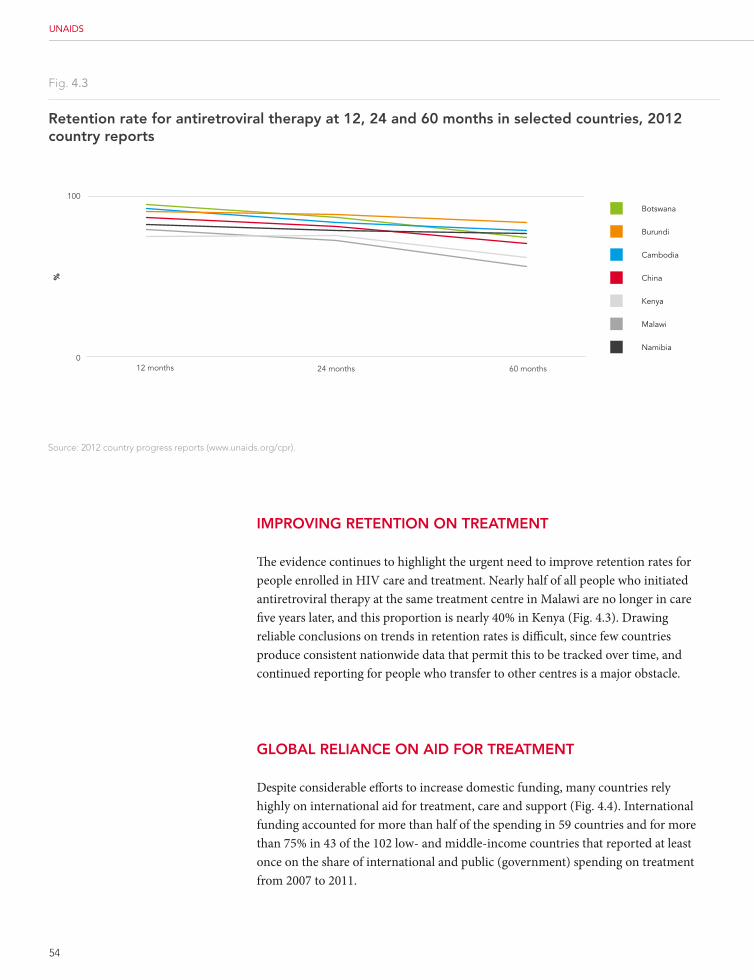
54
UNAIDS
Botswana
Burundi
Cambodia
China
Kenya
Malawi
Namibia
Fig. 4.3
Retention rate for antiretroviral therapy at 12, 24 and 60 months in selected countries, 2012 country reports
12 months 24 months 60 months
Source: 2012 country progress reports (www.unaids.org/cpr).
%
100
0
IMpRoVINg ReTeNTIoN oN TReATMeNT
The evidence continues to highlight the urgent need to improve retention rates for people enrolled in HIV care and treatment. Nearly half of all people who initiated antiretroviral therapy at the same treatment centre in Malawi are no longer in care five years later, and this proportion is nearly 40% in Kenya (Fig. 4.3). Drawing reliable conclusions on trends in retention rates is difficult, since few countries produce consistent nationwide data that permit this to be tracked over time, and continued reporting for people who transfer to other centres is a major obstacle.
globAl RelIANce oN AID foR TReATMeNT
Despite considerable efforts to increase domestic funding, many countries rely highly on international aid for treatment, care and support (Fig. 4.4). International funding accounted for more than half of the spending in 59 countries and for more than 75% in 43 of the 102 low- and middle-income countries that reported at least once on the share of international and public (government) spending on treatment from 2007 to 2011.
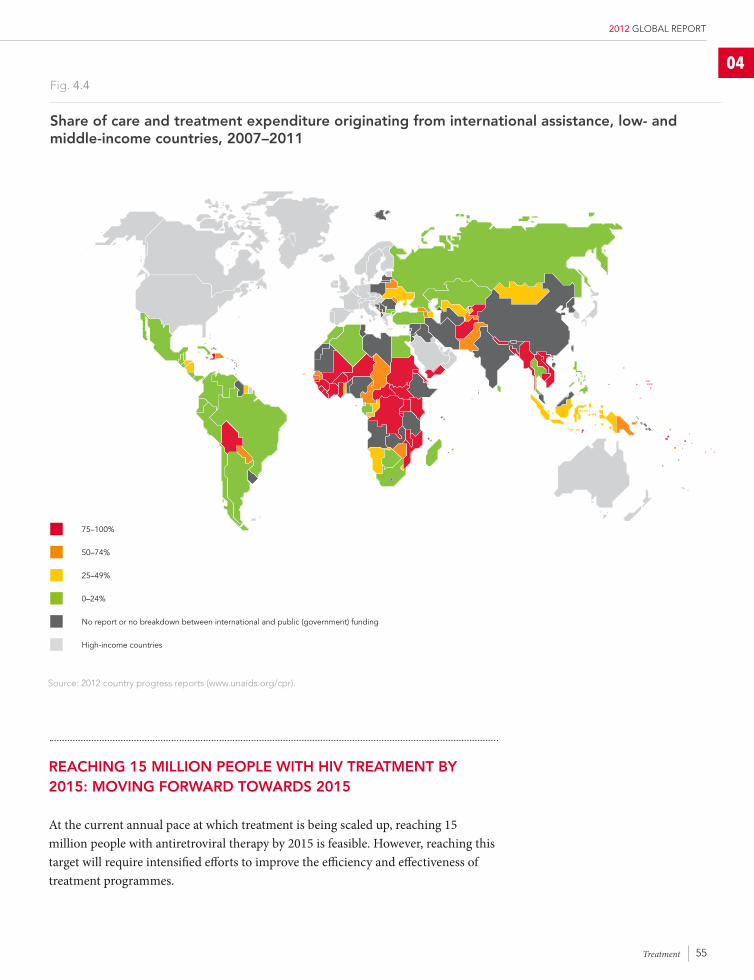
55
2012 GLOBAL REPORT
04
Source: 2012 country progress reports (www.unaids.org/cpr).
Fig. 4.4
Share of care and treatment expenditure originating from international assistance, low- and middle-income countries, 2007–2011
75–100%
50–74%
25–49%
0–24%
No report or no breakdown between international and public (government) funding
High-income countries
ReAchINg 15 MIllIoN people wITh hIV TReATMeNT by 2015: MoVINg foRwARD TowARDS 2015
At the current annual pace at which treatment is being scaled up, reaching 15 million people with antiretroviral therapy by 2015 is feasible. However, reaching this target will require intensified efforts to improve the efficiency and effectiveness of treatment programmes.
Treatment
56
UNAIDS
Maximizing the therapeutic and preventive benefits of treatment requires substantially greater success in closing gaps in the treatment continuum. People living with HIV need to be diagnosed early in the course of infection through testing services that are simple and easy to access, those who test positive must be linked to care that they can easily access and swiftly evaluated, antiretroviral therapy must be initiated in a timely manner, people must be retained in treatment programmes and individuals must receive support in adhering to prescribed regimens. Drug supply systems must become more reliable, programmes must better leverage opportunities to link treatment to other programmes (such as couples counselling and testing, initiatives for voluntary medical male circumcision and opioid substitution therapy) and communities need to be better engaged in supporting treatment initiatives.
Further reducing the cost of antiretroviral therapy will be essential, especially for the second- and third-line regimens that will increasingly be needed in future years. Strategies to manage intellectual property that are oriented towards public health goals, such as the full use, as required, of flexibilities permitted under international regulations such as the Agreement on Trade-Related Aspects of Intellectual Property Rights administered by the World Trade Organization, will play a critical role. International actors should avoid provisions in free-trade agreements that potentially undermine access to affordable, life-saving medicines and health technologies.
Intensified efforts are needed to improve treatment coverage among children, especially those who are youngest and most vulnerable, and to reach more men earlier with HIV testing and treatment services in high-prevalence settings. Health systems need to be more responsive to the needs of vulnerable populations. Health reporting systems need to be strengthened to monitor treatment retention by age and sex. Finally, greater efforts are needed to speed the next phase of HIV treatment by accelerating implementation research and heeding the lessons learned in different parts of the world (Table 4.1).
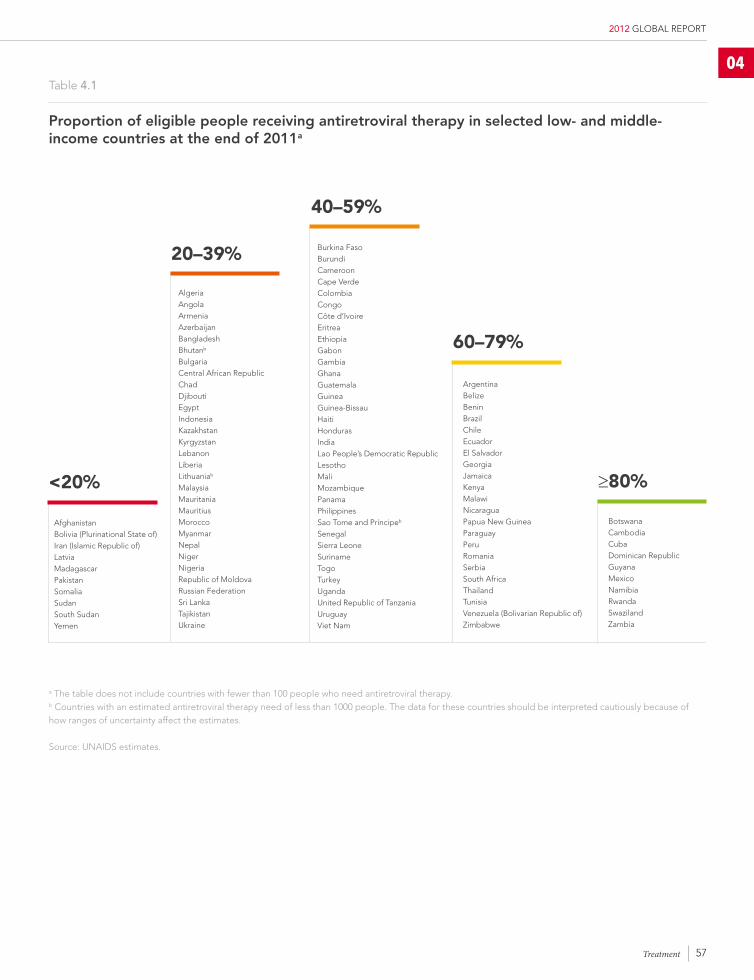
57
2012 GLOBAL REPORT
Table 4.1
proportion of eligible people receiving antiretroviral therapy in selected low- and middle-income countries at the end of 2011a
a The table does not include countries with fewer than 100 people who need antiretroviral therapy. b Countries with an estimated antiretroviral therapy need of less than 1000 people. The data for these countries should be interpreted cautiously because of how ranges of uncertainty affect the estimates.
Source: UNAIDS estimates.
<20%
AfghanistanBolivia (Plurinational State of)Iran (Islamic Republic of)LatviaMadagascarPakistanSomaliaSudanSouth SudanYemen
20–39%
AlgeriaAngolaArmeniaAzerbaijanBangladeshBhutanb
BulgariaCentral African RepublicChadDjiboutiEgyptIndonesiaKazakhstanKyrgyzstanLebanonLiberiaLithuaniab
MalaysiaMauritaniaMauritiusMoroccoMyanmarNepalNigerNigeriaRepublic of MoldovaRussian FederationSri LankaTajikistanUkraine
60–79%
ArgentinaBelizeBeninBrazilChileEcuadorEl SalvadorGeorgiaJamaicaKenyaMalawiNicaraguaPapua New GuineaParaguayPeruRomaniaSerbiaSouth AfricaThailandTunisiaVenezuela (Bolivarian Republic of)Zimbabwe
≥80%
BotswanaCambodiaCubaDominican RepublicGuyanaMexicoNamibiaRwandaSwazilandZambia
Burkina FasoBurundiCameroonCape VerdeColombiaCongoCôte d’IvoireEritreaEthiopiaGabonGambiaGhanaGuatemalaGuineaGuinea-BissauHaitiHondurasIndiaLao People’s Democratic RepublicLesothoMaliMozambiquePanamaPhilippinesSao Tome and Príncipeb
SenegalSierra LeoneSurinameTogoTurkeyUgandaUnited Republic of TanzaniaUruguayViet Nam
40–59%
04
Treatment
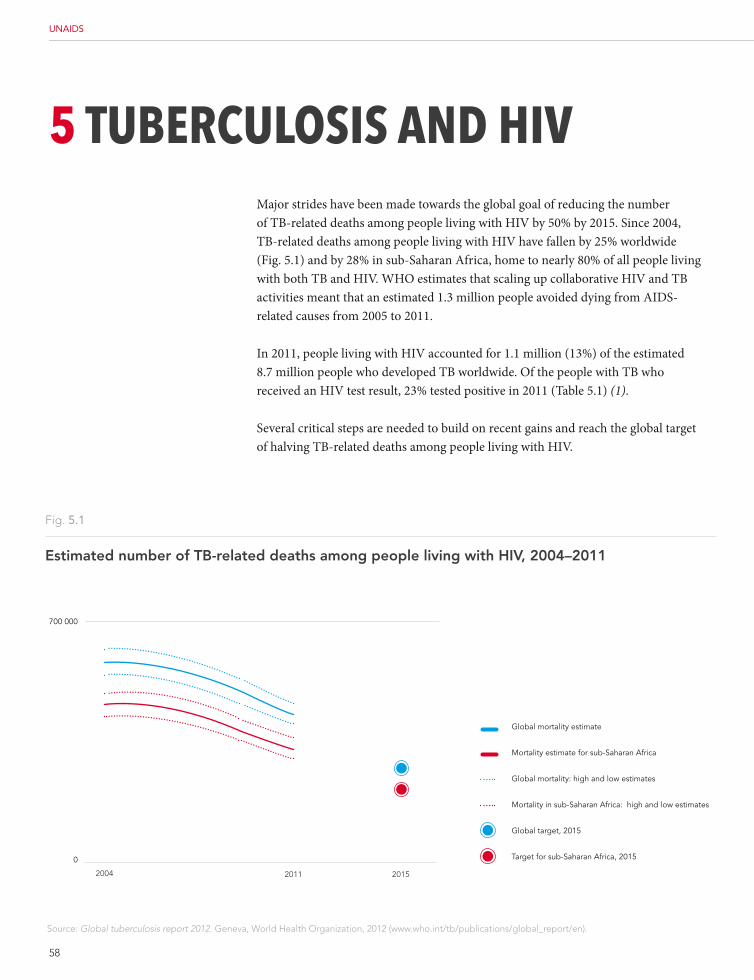
58
UNAIDS
5 Tuberculosis and HiVMajor strides have been made towards the global goal of reducing the number of TB-related deaths among people living with HIV by 50% by 2015. Since 2004, TB-related deaths among people living with HIV have fallen by 25% worldwide (Fig. 5.1) and by 28% in sub-Saharan Africa, home to nearly 80% of all people living with both TB and HIV. WHO estimates that scaling up collaborative HIV and TB activities meant that an estimated 1.3 million people avoided dying from AIDS-related causes from 2005 to 2011.
In 2011, people living with HIV accounted for 1.1 million (13%) of the estimated 8.7 million people who developed TB worldwide. Of the people with TB who received an HIV test result, 23% tested positive in 2011 (Table 5.1) (1).
Several critical steps are needed to build on recent gains and reach the global target of halving TB-related deaths among people living with HIV.
Fig. 5.1
Estimated number of TB-related deaths among people living with HIV, 2004–2011
Source: Global tuberculosis report 2012. Geneva, World Health Organization, 2012 (www.who.int/tb/publications/global_report/en).
0
2004 2011 2015
700 000
Global mortality estimate
Mortality estimate for sub-Saharan Africa
Global mortality: high and low estimates
Mortality in sub-Saharan Africa: high and low estimates
Global target, 2015
Target for sub-Saharan Africa, 2015
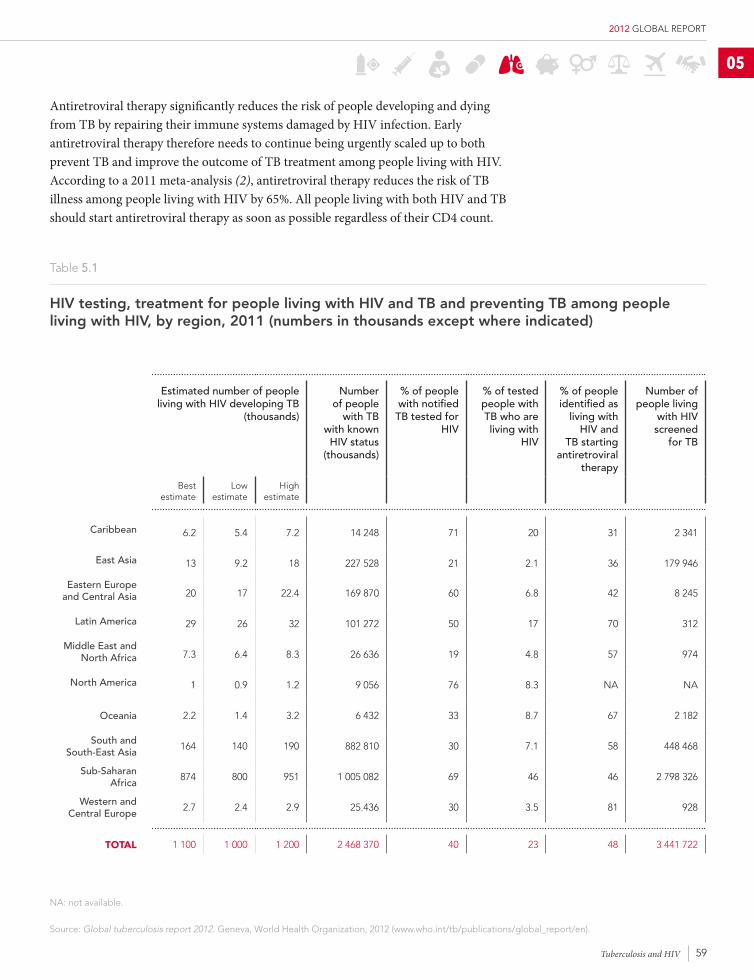
59
2012 GLOBAL REPORT
05
Estimated number of people living with HIV developing TB
(thousands)
Number of people
with TB with known
HIV status (thousands)
% of people with notified TB tested for
HIV
% of tested people with TB who are living with
HIV
% of people identified as
living with HIV and
TB starting antiretroviral
therapy
Number of people living
with HIV screened
for TB
Best estimate
Low estimate
High estimate
Caribbean 6.2 5.4 7.2 14 248 71 20 31 2 341
East Asia 13 9.2 18 227 528 21 2.1 36 179 946
Eastern Europe and Central Asia 20 17 22.4 169 870 60 6.8 42 8 245
Latin America 29 26 32 101 272 50 17 70 312
Middle East and North Africa 7.3 6.4 8.3 26 636 19 4.8 57 974
North America 1 0.9 1.2 9 056 76 8.3 NA NA
Oceania 2.2 1.4 3.2 6 432 33 8.7 67 2 182
South and South-East Asia
164 140 190 882 810 30 7.1 58 448 468
Sub-Saharan Africa
874 800 951 1 005 082 69 46 46 2 798 326
Western and Central Europe
2.7 2.4 2.9 25.436 30 3.5 81 928
ToTal 1 100 1 000 1 200 2 468 370 40 23 48 3 441 722
Table 5.1
HIV testing, treatment for people living with HIV and TB and preventing TB among people living with HIV, by region, 2011 (numbers in thousands except where indicated)
NA: not available.
Source: Global tuberculosis report 2012. Geneva, World Health Organization, 2012 (www.who.int/tb/publications/global_report/en).
Tuberculosis and HIV
Antiretroviral therapy significantly reduces the risk of people developing and dying from TB by repairing their immune systems damaged by HIV infection. Early antiretroviral therapy therefore needs to continue being urgently scaled up to both prevent TB and improve the outcome of TB treatment among people living with HIV. According to a 2011 meta-analysis (2), antiretroviral therapy reduces the risk of TB illness among people living with HIV by 65%. All people living with both HIV and TB should start antiretroviral therapy as soon as possible regardless of their CD4 count.
60
UNAIDS
Globally in 2011, fewer than half (48%) of the people with TB disease and with a documented HIV-positive test result obtained antiretroviral therapy (Table 5.1). In sub-Saharan Africa, only 46% of the people living with both HIV and TB disease initiated HIV treatment. Of the 41 countries with a high burden of HIV infection and TB (accounting for 97% of the estimated global number of people living with HIV and TB (3)), the percentage of people with TB with a documented HIV-positive test result receiving antiretroviral therapy exceeds 75% in only 6: Angola, Brazil, Cambodia, Myanmar, Rwanda and Sudan (Table 5.2) (1).
Since prompt HIV diagnosis is required for effective treatment, and sometimes survival, the fact that more people with TB are being tested for HIV is promising. From 2010 to 2011, the proportion of people with TB receiving HIV testing rose from 33% to 40%, with 2.46 million people with TB being tested for HIV in 2011.
Testing rates in 2011 were higher (at 45%) in the 41 countries with a high burden of HIV infection and TB, which accounted for nearly 90% of all the people with TB receiving HIV testing and reached 69% in the African Region of WHO. Half of the 41 countries provided HIV testing among at least 75% of all people with TB in 2011, although testing lags in many countries. Although Myanmar reports high coverage of antiretroviral therapy among people living with HIV, its coverage is challenged by low HIV testing rates among people with TB (Table 5.2) (1).
Among people living with HIV, 3.2 million were reported to have been screened for TB in 2011, and 460 000 people living with HIV without active TB received isoniazid preventive therapy. TB screening among people living with HIV rose almost two-fold in South Africa, and the number of people living with HIV receiving preventive TB therapy increased nearly three-fold, from 146 000 in 2010 to 373 000 in 2011 (1).
Although recent gains are heartening, additional initiatives are needed to strengthen the response to the linked epidemics of HIV and TB. Testing everyone with TB for HIV provides the essential entry point to care. Similarly, scaling up the three I’s for HIV and TB (intensified TB case-finding; isoniazid preventive therapy and infection control for TB (3)) and initiating antiretroviral therapy early are crucial for HIV programmes in preventing and reducing the burden of TB among people living with HIV. Everyone enrolled in HIV care should be screened for TB, and those without active TB should receive isoniazid preventive therapy. People living with HIV who have active TB should also receive antiretroviral therapy regardless of their CD4 count. All HIV care facilities should ensure that adequate TB infection control measures are in place to limit the transmission of TB and ensure a safer environment for service users and health care staff. Further efforts are also needed to strengthen case reporting and the tracking of progress of the collaborative HIV and TB activities by HIV stakeholders through harmonized indicators (4,5) and globally recommended patient monitoring systems (6).
48%TREATED FOR HIV
Fewer than half of all people living with tuberculosis and HIV received antiretroviral
therapy in 2011.
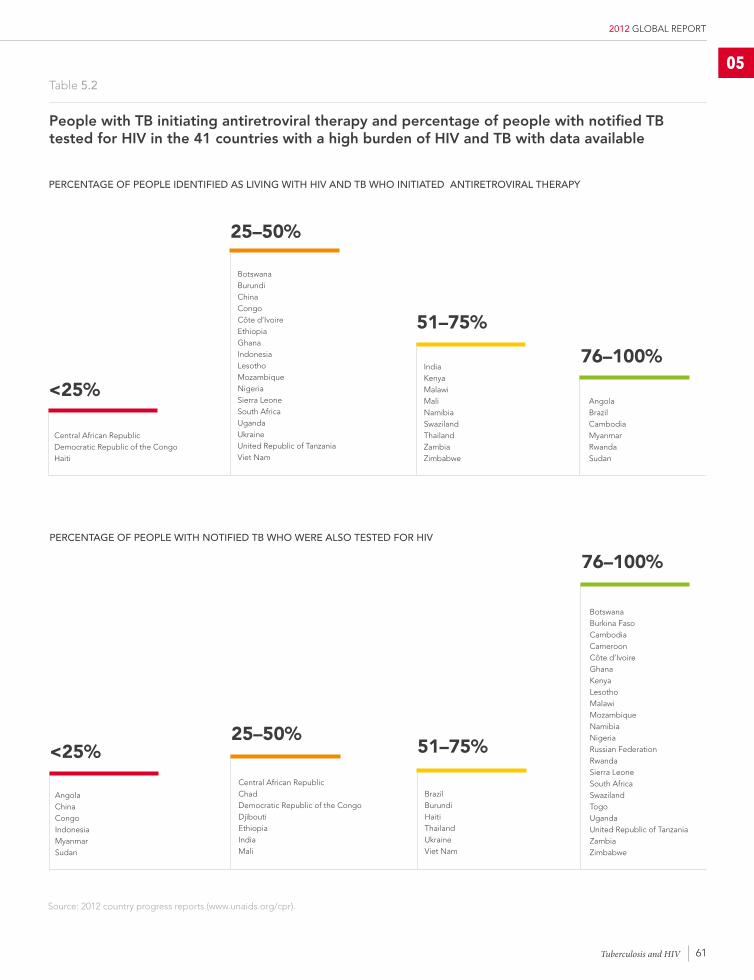
61
2012 GLOBAL REPORT
PErCENTAgE Of PEOPLE WITH NOTIfIEd TB WHO WErE ALSO TESTEd fOr HIV
<25%
Angola China Congo Indonesia MyanmarSudan
25–50%
Central African Republic Chad Democratic Republic of the Congo Djibouti Ethiopia India Mali
51–75%
Brazil Burundi Haiti Thailand Ukraine Viet Nam
76–100%
Botswana Burkina Faso CambodiaCameroon Côte d’Ivoire Ghana Kenya Lesotho Malawi Mozambique NamibiaNigeria Russian Federation Rwanda Sierra Leone South Africa Swaziland Togo Uganda United Republic of Tanzania Zambia Zimbabwe
Table 5.2
People with TB initiating antiretroviral therapy and percentage of people with notified TB tested for HIV in the 41 countries with a high burden of HIV and TB with data available
PErCENTAgE Of PEOPLE IdENTIfIEd AS LIVINg WITH HIV ANd TB WHO INITIATEd ANTIrETrOVIrAL THErAPy
<25%
Central African Republic Democratic Republic of the CongoHaiti
25–50%
Botswana Burundi China CongoCôte d’Ivoire Ethiopia Ghana IndonesiaLesothoMozambique Nigeria Sierra Leone South AfricaUganda Ukraine United Republic of Tanzania Viet Nam
51–75%
India KenyaMalawiMali Namibia Swaziland Thailand ZambiaZimbabwe
76–100%
Angola BrazilCambodia MyanmarRwandaSudan
Source: 2012 country progress reports (www.unaids.org/cpr).
05
Tuberculosis and HIV
62
UNAIDS
6 resoUrces And sPendIngEncouraging signs emerged in 2011 in the quest to close the global AIDS resource gap, as HIV spending increased by 11% compared with 2010. Especially noteworthy was a 15% rise in HIV expenditure by low- and middle-income countries, with domestic spending accounting for a majority of all HIV expenditure for the first time. However, total global HIV investment in 2011 was US$ 16.8 billion, compared to the global goal of US$ 22 billion to US$ 24 billion in annual HIV spending in 2015.
TRAcKINg SpeNDINg oN hIV
In 2012, 127 countries (including 112 low- and middle-income countries) reported on HIV spending (Table 6.1). East Asia, Central and South America and Eastern Europe and Central Asia had the highest reporting rates, with more than 80% of countries providing data on spending.
The comprehensiveness of national funding reports varies. Of the 127 countries, 11 countries only reported their total HIV spending, failing to differentiate spending by category. Eighty-one low- and middle-income countries reported spending on antiretroviral therapy in 2012 (similar to reporting in 2010), while 79 reported expenditure data on services to eliminate new infections among children (an increase of 6%).
ReSoURceS AVAIlAble foR hIV pRogRAMMeS IN low- AND MIDDle-INcoMe coUNTRIeS
Low- and middle-income countries are driving the global increase in HIV spending. Although international funding has stagnated with the onset of the global economic downturn, domestic spending has been continually increasing. Domestic public and private HIV spending in low- and middle-income countries rose from US$ 3.9 billion in 2005 to almost US$ 8.6 billion in 2011 (Fig. 6.1). This increase in domestic outlays has not only provided essential new funding for HIV programmes but also clearly indicates the growth in country ownership of national AIDS responses.
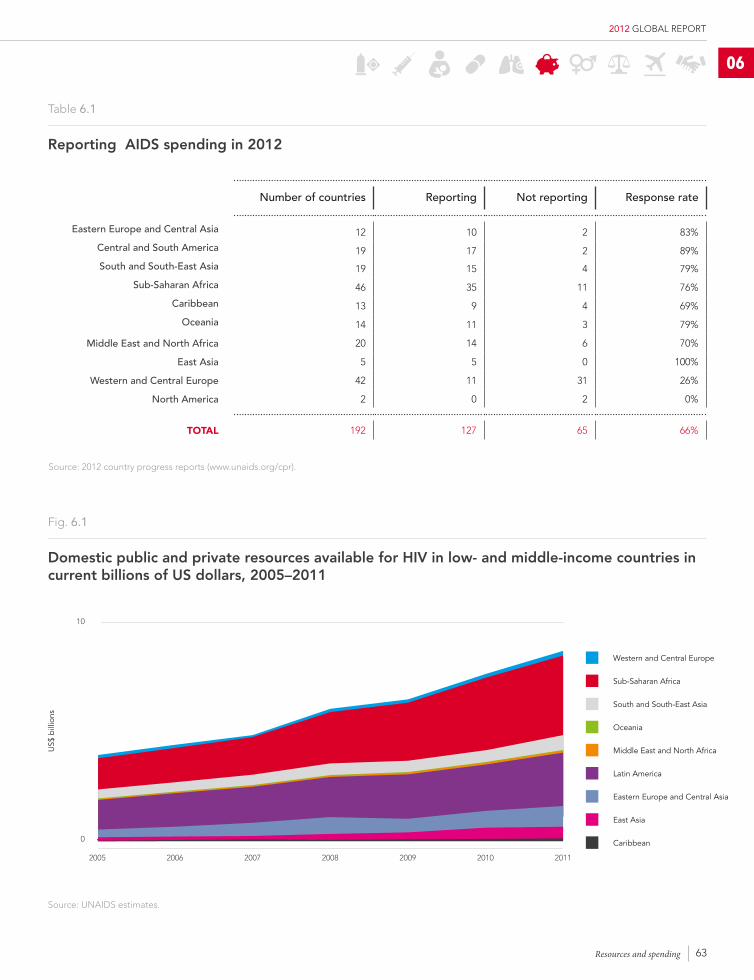
63
2012 GLOBAL REPORT
Number of countries Reporting Not reporting Response rate
eastern europe and central Asia 12 10 2 83%
central and South America 19 17 2 89%
South and South-east Asia 19 15 4 79%
Sub-Saharan Africa 46 35 11 76%
caribbean 13 9 4 69%
oceania 14 11 3 79%
middle east and North Africa 20 14 6 70%
east Asia 5 5 0 100%
Western and central europe 42 11 31 26%
North America 2 0 2 0%
totAl 192 127 65 66%
Table 6.1
Reporting AIDS spending in 2012
Source: 2012 country progress reports (www.unaids.org/cpr).
06
2005 2006 2007 2008 2009 2010 2011
US$
bill
ions
Fig. 6.1
Domestic public and private resources available for hIV in low- and middle-income countries in current billions of US dollars, 2005–2011
0
Western and Central Europe
Sub-Saharan Africa
South and South-East Asia
Oceania
Middle East and North Africa
Latin America
Eastern Europe and Central Asia
East Asia
Caribbean
10
Source: UNAIDS estimates.
Resources and spending
64
UNAIDS
who pAyS foR The AIDS ReSpoNSe?
Although domestic spending is growing in importance, donor contributions continue to play a critical role in funding the AIDS response, especially in low- and middle-income countries (Fig. 6.2).
Increasingly, many middle-income countries have assumed a greater role in funding their own national responses. South Africa, for example, increased domestic HIV spending five-fold from 2006 to 2009, while domestic HIV spending by Botswana more than doubled from 2006 to 2011. However, many upper-middle-income countries are still not fully assuming the responsibility of funding their AIDS response, with half of upper-middle-income countries allowing external donors to fund 50% or more of their HIV programmes for key populations at higher risk.
Zambia’s domestic health budget for 2012 is 45% larger than in 2011, although total health expenditure remains short of the 15% share of the national budget for health agreed to in the Abuja Declaration (1).
Some low-income countries have also taken important steps to increase domestic HIV investment: Kenya doubled its domestic HIV spending from 2008 to 2010, Togo doubled its domestic spending from 2007 to 2010 and Rwanda doubled its domestic HIV spending from 2006 to 2009.
Although domestic investment for HIV programmes has increased, many countries still rely heavily on international assistance. Overall, international sources provided 36% of the US$ 9.4 billion spent on HIV in the 107 low- and middle-income countries that reported on this in 2006-2011. Among these countries, 82 received more than 25% of their total spending from international sources, including 61 countries that received more than half their HIV funding from abroad and 38 countries that relied on international sources for 75% or more. Among 33 Sub-Saharan African countries with available data on international funding in the period 2009 to 2011, 26 received more than half of their HIV funding from international resources, including 19 countries that relied on external sources for 75% or more (Table 6.2).
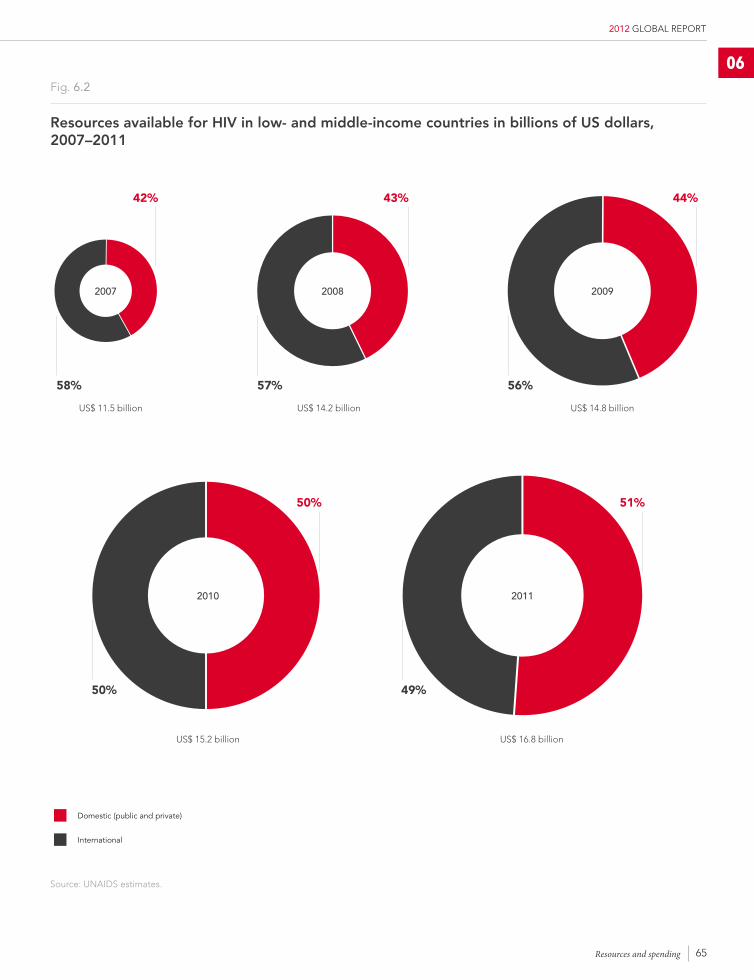
65
2012 GLOBAL REPORT
Fig. 6.2
Resources available for hIV in low- and middle-income countries in billions of US dollars, 2007–2011
US$ 11.5 billion
42%
58%
2007
43%
US$ 14.2 billion
57%
2008
44%
US$ 14.8 billion
56%
2009
50%
US$ 15.2 billion
50%
2010
51%
US$ 16.8 billion
49%
2011
International
Source: UNAIDS estimates.
Domestic (public and private)
Resources and spending
06
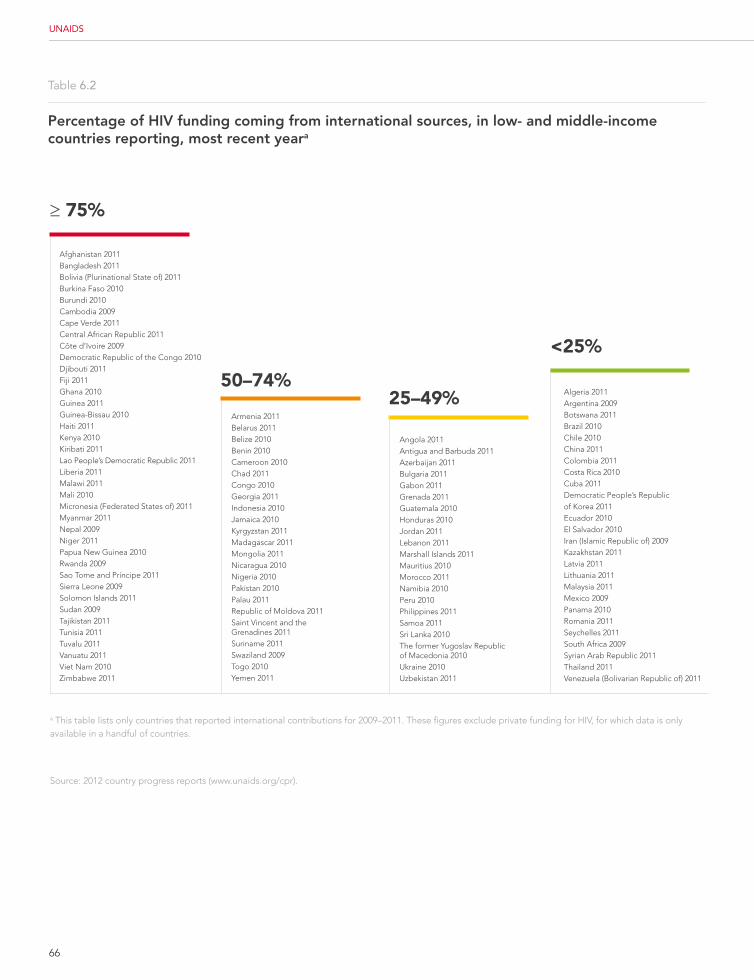
66
UNAIDS
Table 6.2
percentage of hIV funding coming from international sources, in low- and middle-income countries reporting, most recent yeara
≥ 75%
Afghanistan 2011Bangladesh 2011Bolivia (Plurinational State of) 2011Burkina Faso 2010Burundi 2010Cambodia 2009Cape Verde 2011Central African Republic 2011Côte d’Ivoire 2009Democratic Republic of the Congo 2010Djibouti 2011Fiji 2011Ghana 2010Guinea 2011Guinea-Bissau 2010Haiti 2011Kenya 2010Kiribati 2011Lao People’s Democratic Republic 2011Liberia 2011Malawi 2011Mali 2010Micronesia (Federated States of) 2011Myanmar 2011Nepal 2009Niger 2011Papua New Guinea 2010Rwanda 2009Sao Tome and Príncipe 2011Sierra Leone 2009Solomon Islands 2011Sudan 2009Tajikistan 2011Tunisia 2011Tuvalu 2011Vanuatu 2011Viet Nam 2010Zimbabwe 2011
<25%
Algeria 2011Argentina 2009Botswana 2011Brazil 2010Chile 2010China 2011Colombia 2011Costa Rica 2010Cuba 2011Democratic People’s Republic of Korea 2011Ecuador 2010El Salvador 2010Iran (Islamic Republic of) 2009Kazakhstan 2011Latvia 2011Lithuania 2011Malaysia 2011Mexico 2009Panama 2010Romania 2011Seychelles 2011South Africa 2009Syrian Arab Republic 2011Thailand 2011Venezuela (Bolivarian Republic of) 2011
50–74%25–49%
Armenia 2011Belarus 2011Belize 2010Benin 2010Cameroon 2010Chad 2011Congo 2010Georgia 2011Indonesia 2010Jamaica 2010Kyrgyzstan 2011Madagascar 2011Mongolia 2011Nicaragua 2010Nigeria 2010Pakistan 2010Palau 2011Republic of Moldova 2011Saint Vincent and the Grenadines 2011Suriname 2011Swaziland 2009Togo 2010Yemen 2011
Angola 2011Antigua and Barbuda 2011Azerbaijan 2011Bulgaria 2011Gabon 2011Grenada 2011Guatemala 2010Honduras 2010Jordan 2011Lebanon 2011Marshall Islands 2011Mauritius 2010Morocco 2011Namibia 2010Peru 2010Philippines 2011Samoa 2011Sri Lanka 2010The former Yugoslav Republic of Macedonia 2010Ukraine 2010Uzbekistan 2011
a This table lists only countries that reported international contributions for 2009–2011. These figures exclude private funding for HIV, for which data is only available in a handful of countries.
Source: 2012 country progress reports (www.unaids.org/cpr).
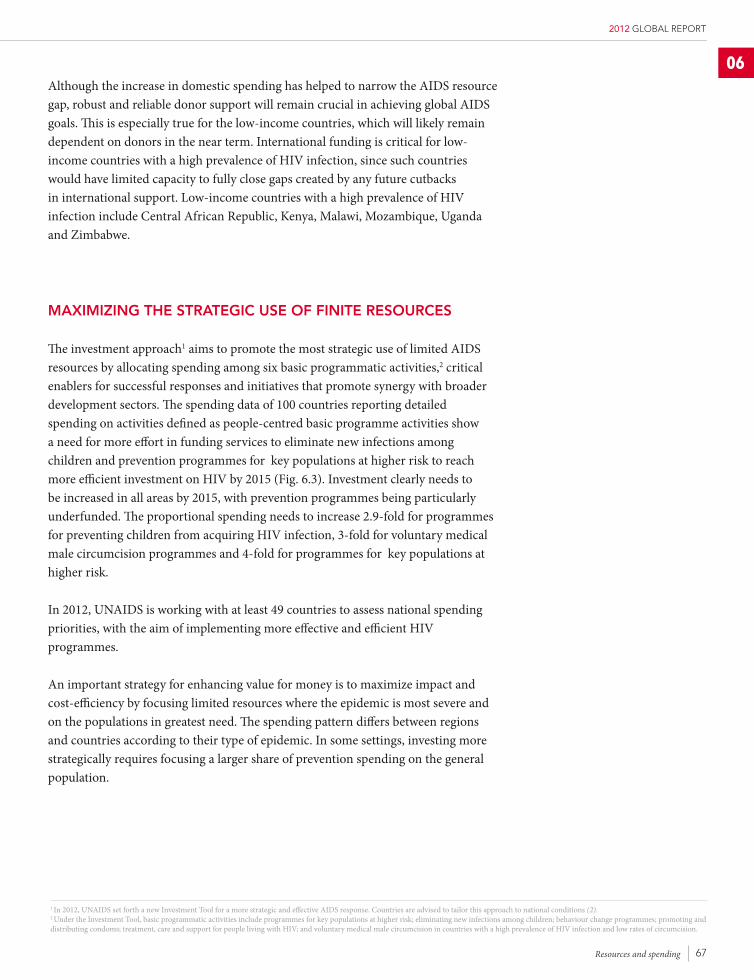
67
2012 GLOBAL REPORT
Although the increase in domestic spending has helped to narrow the AIDS resource gap, robust and reliable donor support will remain crucial in achieving global AIDS goals. This is especially true for the low-income countries, which will likely remain dependent on donors in the near term. International funding is critical for low-income countries with a high prevalence of HIV infection, since such countries would have limited capacity to fully close gaps created by any future cutbacks in international support. Low-income countries with a high prevalence of HIV infection include Central African Republic, Kenya, Malawi, Mozambique, Uganda and Zimbabwe.
MAxIMIzINg The STRATegIc USe of fINITe ReSoURceS
The investment approach1 aims to promote the most strategic use of limited AIDS resources by allocating spending among six basic programmatic activities,2 critical enablers for successful responses and initiatives that promote synergy with broader development sectors. The spending data of 100 countries reporting detailed spending on activities defined as people-centred basic programme activities show a need for more effort in funding services to eliminate new infections among children and prevention programmes for key populations at higher risk to reach more efficient investment on HIV by 2015 (Fig. 6.3). Investment clearly needs to be increased in all areas by 2015, with prevention programmes being particularly underfunded. The proportional spending needs to increase 2.9-fold for programmes for preventing children from acquiring HIV infection, 3-fold for voluntary medical male circumcision programmes and 4-fold for programmes for key populations at higher risk.
In 2012, UNAIDS is working with at least 49 countries to assess national spending priorities, with the aim of implementing more effective and efficient HIV programmes.
An important strategy for enhancing value for money is to maximize impact and cost-efficiency by focusing limited resources where the epidemic is most severe and on the populations in greatest need. The spending pattern differs between regions and countries according to their type of epidemic. In some settings, investing more strategically requires focusing a larger share of prevention spending on the general population.
1 In 2012, UNAIDS set forth a new Investment Tool for a more strategic and effective AIDS response. Countries are advised to tailor this approach to national conditions (2). 2 Under the Investment Tool, basic programmatic activities include programmes for key populations at higher risk; eliminating new infections among children; behaviour change programmes; promoting and distributing condoms; treatment, care and support for people living with HIV; and voluntary medical male circumcision in countries with a high prevalence of HIV infection and low rates of circumcision.
Resources and spending
06
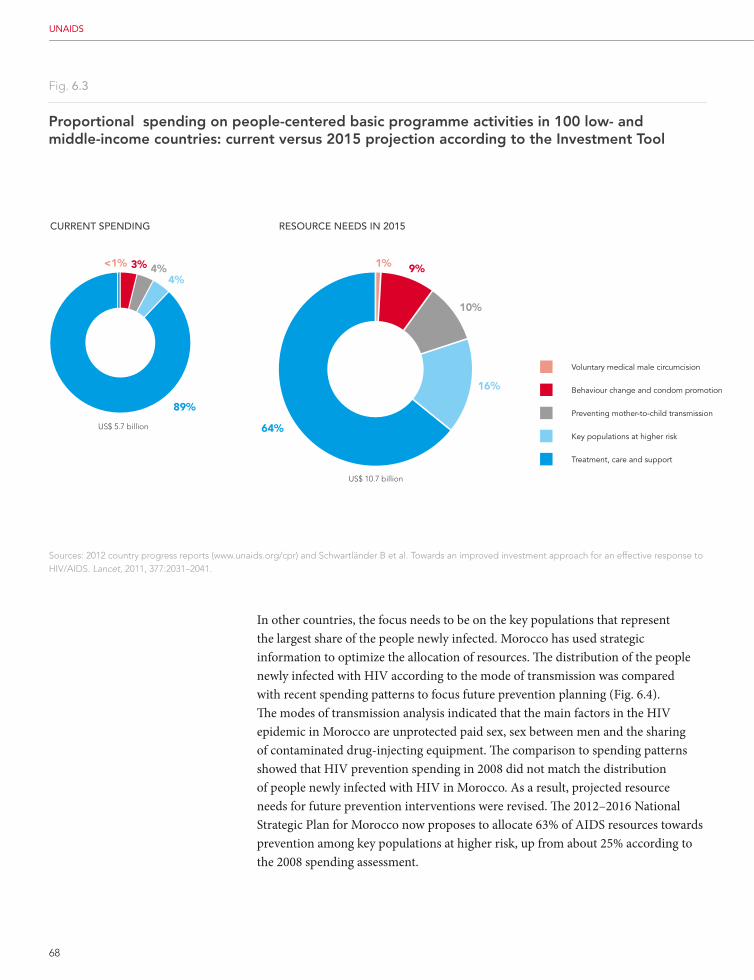
68
UNAIDS
Fig. 6.3
proportional spending on people-centered basic programme activities in 100 low- and middle-income countries: current versus 2015 projection according to the Investment Tool
Sources: 2012 country progress reports (www.unaids.org/cpr) and Schwartländer B et al. Towards an improved investment approach for an effective response to HIV/AIDS. Lancet, 2011, 377:2031–2041.
Voluntary medical male circumcision
Behaviour change and condom promotion
Preventing mother-to-child transmission
Key populations at higher risk
Treatment, care and support
US$ 5.7 billion
US$ 10.7 billion
cURReNt SpeNDINg ReSoURce NeeDS IN 2015
1% 9%<1%
10%
4%3%4%
16%
64%
89%
In other countries, the focus needs to be on the key populations that represent the largest share of the people newly infected. Morocco has used strategic information to optimize the allocation of resources. The distribution of the people newly infected with HIV according to the mode of transmission was compared with recent spending patterns to focus future prevention planning (Fig. 6.4). The modes of transmission analysis indicated that the main factors in the HIV epidemic in Morocco are unprotected paid sex, sex between men and the sharing of contaminated drug-injecting equipment. The comparison to spending patterns showed that HIV prevention spending in 2008 did not match the distribution of people newly infected with HIV in Morocco. As a result, projected resource needs for future prevention interventions were revised. The 2012–2016 National Strategic Plan for Morocco now proposes to allocate 63% of AIDS resources towards prevention among key populations at higher risk, up from about 25% according to the 2008 spending assessment.
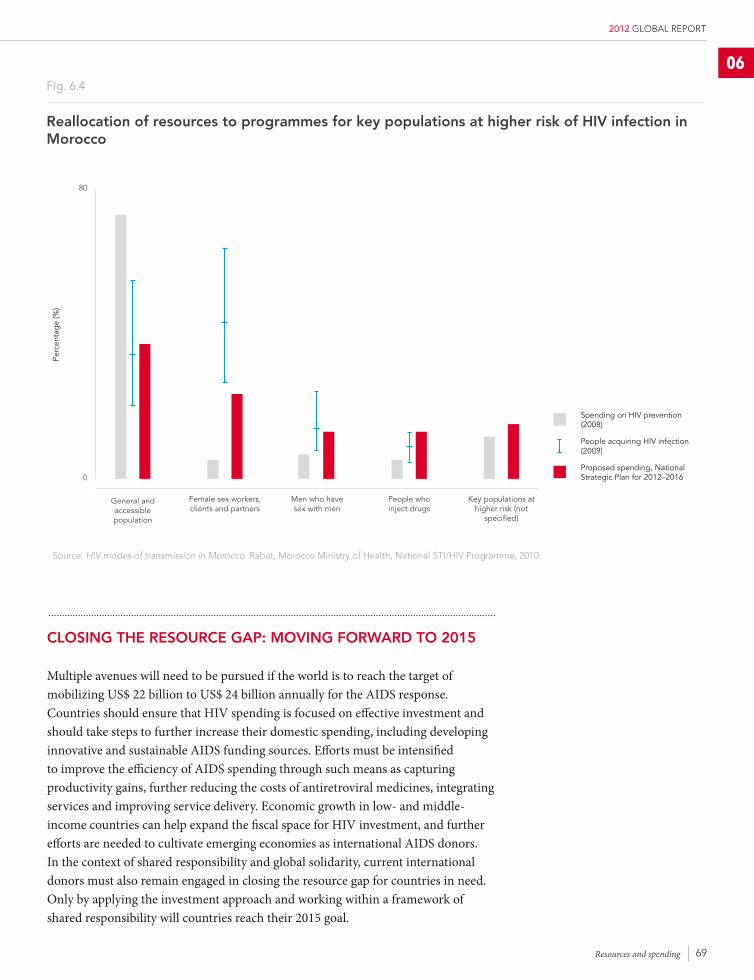
69
2012 GLOBAL REPORT
cloSINg The ReSoURce gAp: MoVINg foRwARD To 2015
Multiple avenues will need to be pursued if the world is to reach the target of mobilizing US$ 22 billion to US$ 24 billion annually for the AIDS response. Countries should ensure that HIV spending is focused on effective investment and should take steps to further increase their domestic spending, including developing innovative and sustainable AIDS funding sources. Efforts must be intensified to improve the efficiency of AIDS spending through such means as capturing productivity gains, further reducing the costs of antiretroviral medicines, integrating services and improving service delivery. Economic growth in low- and middle-income countries can help expand the fiscal space for HIV investment, and further efforts are needed to cultivate emerging economies as international AIDS donors. In the context of shared responsibility and global solidarity, current international donors must also remain engaged in closing the resource gap for countries in need. Only by applying the investment approach and working within a framework of shared responsibility will countries reach their 2015 goal.
Fig. 6.4
Reallocation of resources to programmes for key populations at higher risk of hIV infection in Morocco
Perc
enta
ge
(%)
Key populations athigher risk (not
specified)
General and accessible population
Female sex workers,clients and partners
Men who havesex with men
People who inject drugs
Source: HIV modes of transmission in Morocco. Rabat, Morocco Ministry of Health, National STI/HIV Programme, 2010.
80
0
Spending on HIV prevention (2008)
People acquiring HIV infection (2009)
Proposed spending, National Strategic Plan for 2012–2016
Voluntary medical male circumcision
Behaviour change and condom promotion
Preventing mother-to-child transmission
Key populations at higher risk
Treatment, care and support
Resources and spending
06
70
UNAIDS
7 gender And tHe HIV resPonseIn the 2011 Political Declaration on HIV and AIDS, countries pledged to eliminate gender inequalities and gender-based abuse and violence and to increase the capacity of women and girls to protect themselves from HIV. Efforts to accelerate progress towards this goal continue to be undermined by inadequate resources for initiatives to address the epidemic’s gender dimensions as well as the persistence of gender-based violence. However, experiences from diverse settings provide inspiration and guidance, demonstrating the feasibility of the aspiration to end gender inequalities, combat gender-based violence and link women and girls to the services they need.
geNDeR INeqUAlITy DRIVeS The hIV epIDeMIc
HIV continues to profoundly affect women and girls across all regions. For example, in sub-Saharan Africa, the region most severely affected by HIV, women represent 58% of the people living with HIV and bear the greatest burden of care.
The lower socioeconomic and political status women are assigned, including unequal access to education and employment, and fear or experience of violence compound women’s greater physiological vulnerability to HIV. Because of social and economic power imbalances between men and women and the associated limitations in access to services, many women and girls have little capacity to negotiate sex, insist on condom use or otherwise take steps to protect themselves from HIV.
Gender norms also increase men’s vulnerability to HIV, encouraging high-risk behaviour and deterring them from seeking sexual health services or acknowledging their lack of knowledge about HIV (1). In addition, stigma and discrimination against transgender people render them highly vulnerable to HIV and impede their access to HIV service and secure livelihoods.
eNSURINg eqUITAble AcceSS To SeRVIceS
Although the growing availability of HIV testing and prevention services in antenatal settings offers women an entry point to HIV services, overall access to HIV services remains insufficient for pregnant women living with HIV and their male partners. Whereas 57% of pregnant women living with HIV in low- and
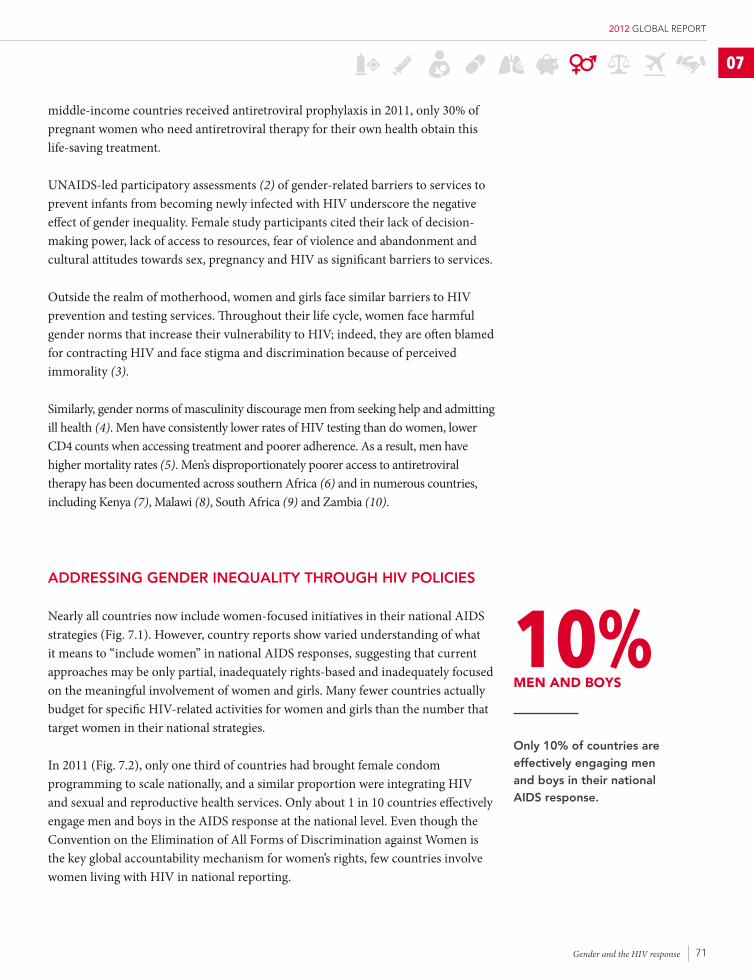
71
2012 GLOBAL REPORT
middle-income countries received antiretroviral prophylaxis in 2011, only 30% of pregnant women who need antiretroviral therapy for their own health obtain this life-saving treatment.
UNAIDS-led participatory assessments (2) of gender-related barriers to services to prevent infants from becoming newly infected with HIV underscore the negative effect of gender inequality. Female study participants cited their lack of decision-making power, lack of access to resources, fear of violence and abandonment and cultural attitudes towards sex, pregnancy and HIV as significant barriers to services.
Outside the realm of motherhood, women and girls face similar barriers to HIV prevention and testing services. Throughout their life cycle, women face harmful gender norms that increase their vulnerability to HIV; indeed, they are often blamed for contracting HIV and face stigma and discrimination because of perceived immorality (3).
Similarly, gender norms of masculinity discourage men from seeking help and admitting ill health (4). Men have consistently lower rates of HIV testing than do women, lower CD4 counts when accessing treatment and poorer adherence. As a result, men have higher mortality rates (5). Men’s disproportionately poorer access to antiretroviral therapy has been documented across southern Africa (6) and in numerous countries, including Kenya (7), Malawi (8), South Africa (9) and Zambia (10).
ADDReSSINg geNDeR INeqUAlITy ThRoUgh hIV polIcIeS
Nearly all countries now include women-focused initiatives in their national AIDS strategies (Fig. 7.1). However, country reports show varied understanding of what it means to “include women” in national AIDS responses, suggesting that current approaches may be only partial, inadequately rights-based and inadequately focused on the meaningful involvement of women and girls. Many fewer countries actually budget for specific HIV-related activities for women and girls than the number that target women in their national strategies.
In 2011 (Fig. 7.2), only one third of countries had brought female condom programming to scale nationally, and a similar proportion were integrating HIV and sexual and reproductive health services. Only about 1 in 10 countries effectively engage men and boys in the AIDS response at the national level. Even though the Convention on the Elimination of All Forms of Discrimination against Women is the key global accountability mechanism for women’s rights, few countries involve women living with HIV in national reporting.
07
Gender and the HIV response
10%meN AND boYS
only 10% of countries are effectively engaging men and boys in their national AIDS response.
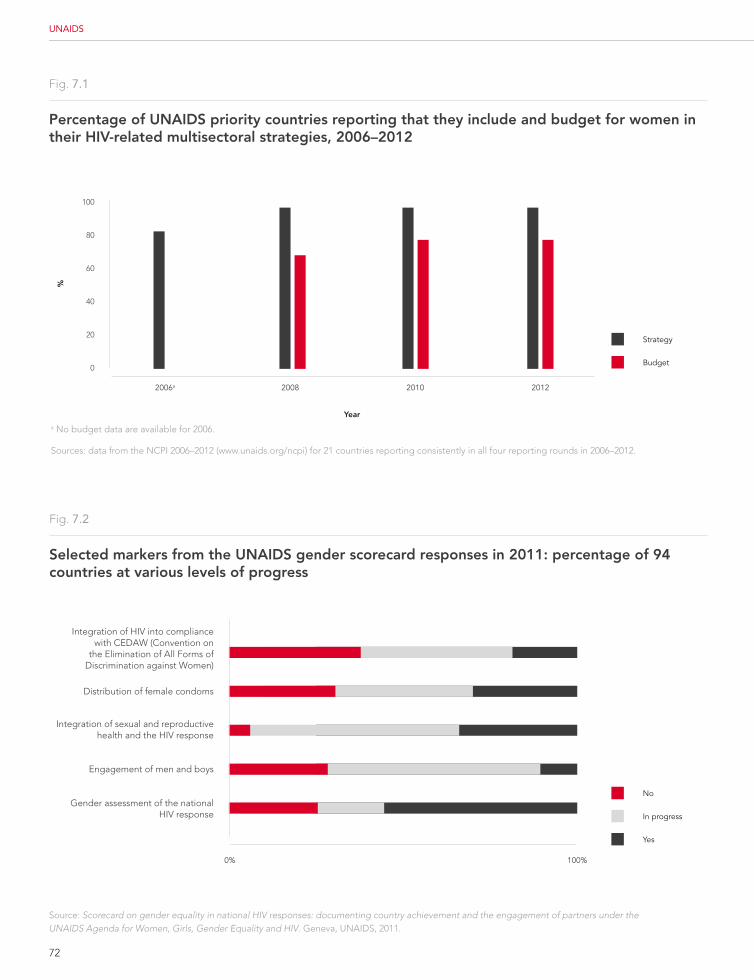
72
UNAIDS
No
In progress
Yes
Fig. 7.2
Selected markers from the UNAIDS gender scorecard responses in 2011: percentage of 94 countries at various levels of progress
Integration of HIV into compliance with CEDAW (Convention on
the Elimination of All Forms of Discrimination against Women)
Distribution of female condoms
Integration of sexual and reproductive health and the HIV response
Engagement of men and boys
Gender assessment of the national HIV response
0% 100%
Source: Scorecard on gender equality in national HIV responses: documenting country achievement and the engagement of partners under theUNAIDS Agenda for Women, Girls, Gender Equality and HIV. Geneva, UNAIDS, 2011.
Fig. 7.1
percentage of UNAIDS priority countries reporting that they include and budget for women in their hIV-related multisectoral strategies, 2006–2012
100
0
20
40
60
80
2006a 2008 2010 2012
%
year
Strategy
Budget
a No budget data are available for 2006.
Sources: data from the NCPI 2006–2012 (www.unaids.org/ncpi) for 21 countries reporting consistently in all four reporting rounds in 2006–2012.
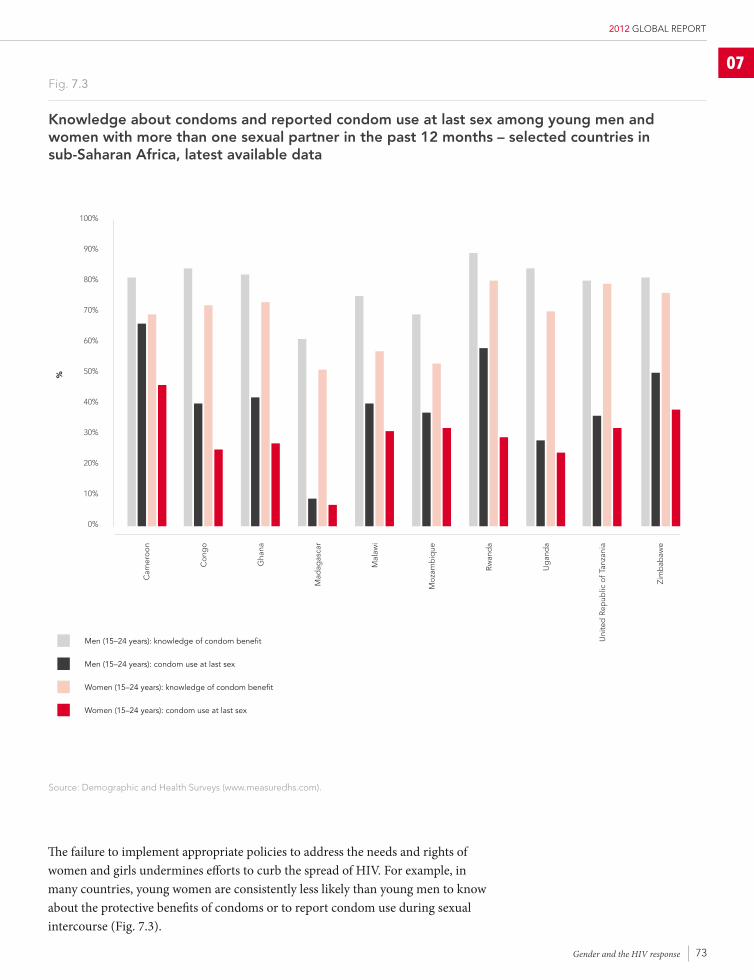
73
2012 GLOBAL REPORT
The failure to implement appropriate policies to address the needs and rights of women and girls undermines efforts to curb the spread of HIV. For example, in many countries, young women are consistently less likely than young men to know about the protective benefits of condoms or to report condom use during sexual intercourse (Fig. 7.3).
Strategy
Budget
07
Moz
amb
ique
Rwan
da
Ug
and
a
Uni
ted
Rep
ublic
of T
anza
nia
Zim
bab
awe
Fig. 7.3
Knowledge about condoms and reported condom use at last sex among young men and women with more than one sexual partner in the past 12 months – selected countries in sub-Saharan Africa, latest available data
Source: Demographic and Health Surveys (www.measuredhs.com).
100%
90%
80%
70%
60%
50%
40%
30%
20%
10%
0%
Men (15–24 years): knowledge of condom benefit
Men (15–24 years): condom use at last sex
Women (15–24 years): knowledge of condom benefit
Women (15–24 years): condom use at last sex
Cam
eroo
n
Con
go
Gha
na
Mad
agas
car
Mal
awi
%
Gender and the HIV response
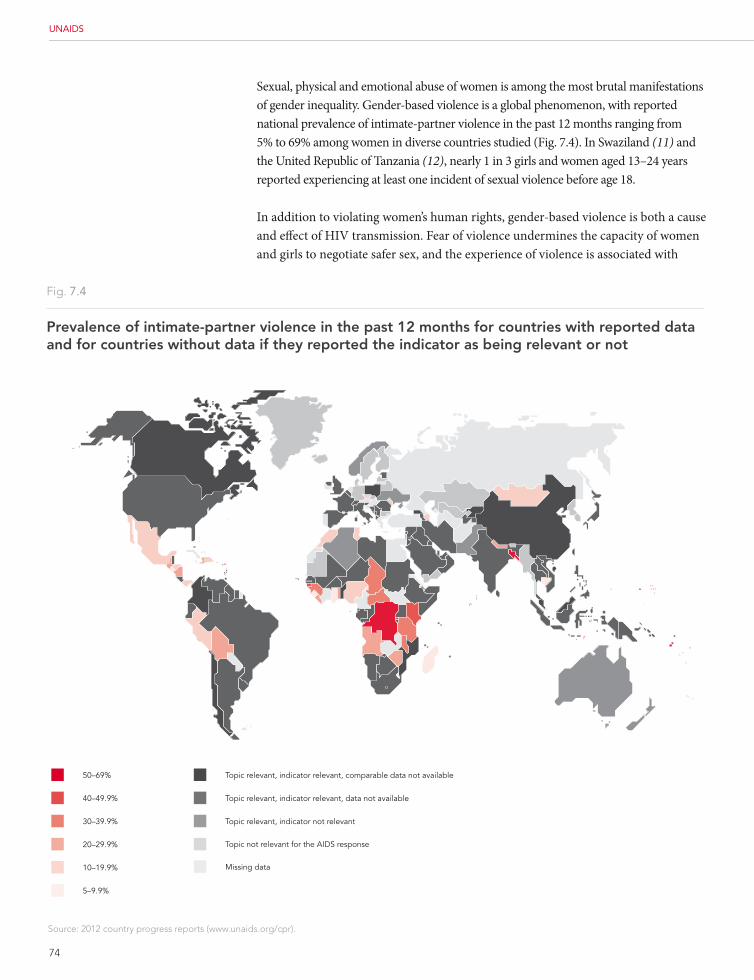
74
UNAIDS
Fig. 7.4
prevalence of intimate-partner violence in the past 12 months for countries with reported data and for countries without data if they reported the indicator as being relevant or not
Source: 2012 country progress reports (www.unaids.org/cpr).
50–69%
40–49.9%
30–39.9%
20–29.9%
10–19.9%
5–9.9%
Topic relevant, indicator relevant, comparable data not available
Topic relevant, indicator relevant, data not available
Topic relevant, indicator not relevant
Topic not relevant for the AIDS response
Missing data
Sexual, physical and emotional abuse of women is among the most brutal manifestations of gender inequality. Gender-based violence is a global phenomenon, with reported national prevalence of intimate-partner violence in the past 12 months ranging from 5% to 69% among women in diverse countries studied (Fig. 7.4). In Swaziland (11) and the United Republic of Tanzania (12), nearly 1 in 3 girls and women aged 13–24 years reported experiencing at least one incident of sexual violence before age 18.
In addition to violating women’s human rights, gender-based violence is both a cause and effect of HIV transmission. Fear of violence undermines the capacity of women and girls to negotiate safer sex, and the experience of violence is associated with
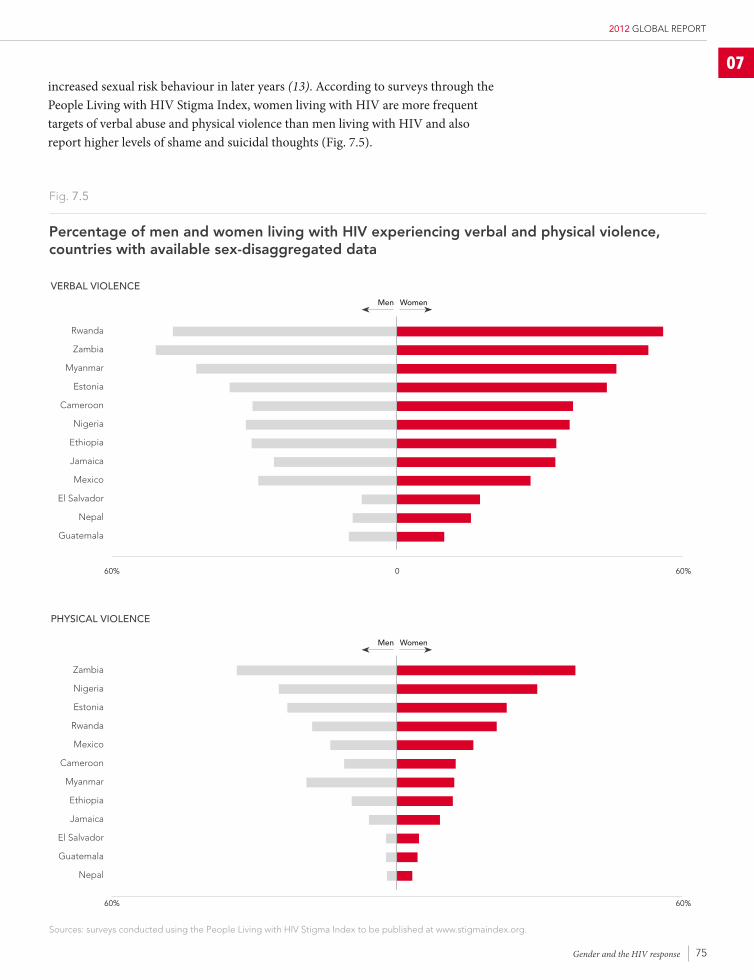
75
2012 GLOBAL REPORT
increased sexual risk behaviour in later years (13). According to surveys through the People Living with HIV Stigma Index, women living with HIV are more frequent targets of verbal abuse and physical violence than men living with HIV and also report higher levels of shame and suicidal thoughts (Fig. 7.5).
Zambia
Nigeria
Estonia
Rwanda
Mexico
Cameroon
Myanmar
Ethiopia
Jamaica
El Salvador
Guatemala
Nepal
60%
Womenmen
Rwanda
Zambia
Myanmar
Estonia
Cameroon
Nigeria
Ethiopia
Jamaica
Mexico
El Salvador
Nepal
Guatemala
0 60%60%
Fig. 7.5
percentage of men and women living with hIV experiencing verbal and physical violence, countries with available sex-disaggregated data
veRbAl vIoleNce
phySIcAl vIoleNce
60%
Womenmen
Sources: surveys conducted using the People Living with HIV Stigma Index to be published at www.stigmaindex.org.
07
Gender and the HIV response
76
UNAIDS
ADDReSSINg The hIV-RelATeD NeeDS of TRANSgeNDeR people
The estimated 15 million transgender people around the globe (14) have a disproportionate risk of acquiring HIV infection, with HIV prevalence as high as 68% (14,15) and considerable vulnerability to gender-based violence. Transgender people confront high rates of stigma and discrimination by engaging in a gender expression that differs from their birth-assigned sex. Their vulnerability is further exacerbated by inadequate access to information, services and economic opportunities. As a result, transgender people often rely on sex work as their only source of income and survival, with involvement in sex work by up to 44% of transgender people (16,17).
Although recognition is growing of the epidemic’s severity among transgender people and organization is increasing within transgender communities to advocate for their rights, transgender people remain severely underserved in the AIDS response. Prevention programmes rarely address the specific vulnerability of transgender people. As a result, transgender people remain largely invisible in the AIDS response: in 2012, only 43% of countries reported that their national AIDS strategies address transgender people. Forty per cent of countries report that government provides less than 25% of their transgender programmes and services (18,19).
bUIlDINg oN pRoVeN SUcceSSeS: The wAy foRwARD
Although the barriers posed by gender inequalities are severe and often daunting, these socially constructed impediments can be influenced by well-designed initiatives that aim to alter harmful gender norms. For example, in Malawi, where the HIV prevalence among women 15–24 years old is more than twice that of their male peers, the Coalition of Women Living with HIV/AIDS has used an evidence-informed approach to challenge prevailing gender norms through effective communication. Participants’ condom uptake had increased, gender-based violence declined and the number of men having multiple, concurrent partnerships had fallen. Broader community engagement also helped to alleviate HIV-related stigma and discrimination, as reflected in an increase in the number of people publicly disclosing their HIV status and a growth in support group participation (20).
Building on such successes, countries should empower women and girls in all their diversity, including women living with HIV, as leaders to catalyse essential cultural shifts towards gender equality and access to quality services. Adequate funding to address the epidemic’s gender dimensions is an essential element of the response. Countries should engage men and boys to promote healthy gender norms and adapt
43%tRANSgeNDeR polIcIeS
only 43% of countries report that their national AIDS
strategies address transgender people.
77
2012 GLOBAL REPORT
HIV programmes to ensure that they reach all those in need, including marginalized groups such as transgender people. Efforts to combat gender-based violence, which enhance women’s access to integrated HIV and sexual and reproductive health services, should be strengthened. In addition, the economic empowerment of women, including steps to ensure women’s full enjoyment of property and inheritance rights and pursuing other promising strategies such as conditional cash transfers to encourage school attendance and access to school-based information and support, are also critical elements of an effective HIV response and broader sustainable development as a whole.
07
Gender and the HIV response
78
UNAIDS
8 stIgMA, dIscrIMInAtIon And tHe lAw
Although much has been accomplished in addressing stigma, discrimination and punitive approaches since HIV infection first emerged, much work still remains to achieve the vision of zero discrimination by 2015. Eliminating stigma and discrimination will require laws and policies that ensure the full realization of all human rights in the context of HIV as well as programmatic responses that empower people living with HIV and help forge social norms of tolerance, solidarity and non-discrimination.
Fear, ignorance and discrimination regarding HIV continue to exact profound human costs, including in the worst forms – abusive treatment and violence. Negative attitudes and beliefs within communities can also increase internalized self-stigma, including guilt, shame and alienation felt by people living with HIV. According to data collected through the People Living with HIV Stigma Index,1 more than half (52%) of people living with HIV in Zambia report having been verbally abused as a result of their HIV status (Table 8.1), and 1 in 5 people living with HIV in Nigeria and Ethiopia reported feeling suicidal.
The persistence of stigma and discrimination also undermines efforts to deliver essential HIV prevention and treatment services. In Nigeria, more than 1 in 5 (21%) people living with HIV say they have been denied health services as a result of their HIV infection. According to a nine-country study by the International Labour Organization and the Global Network of People Living with HIV, the percentage of people living with HIV who reported discriminatory attitudes among employers and co-workers ranged from 8% in Estonia to 54% in Malaysia (1).
Highly marginalized and/or criminalized populations, including men who have sex with men, transgender people, people who use drugs and sex workers, face even higher levels of stigma and discrimination, including those relating to HIV (Fig. 8.1). In July 2012, the UNDP-led Global Commission on HIV and the Law, an independent body comprising health, social, legal and political leaders from around the world, detailed the close link between criminalized status, high levels of stigma (due to HIV and other status) and the inability to access and remain engaged in HIV services (2).
1 The People Living with HIV Stigma Index is a qualitative research tool developed by and for people living with HIV. More than 40 countries have already reported data under the index, with surveys undertaken from 2008 to 2011. See www.stigmaindex.org. Sampling methods differ between countries, and caution should be taken in comparing results from different countries.
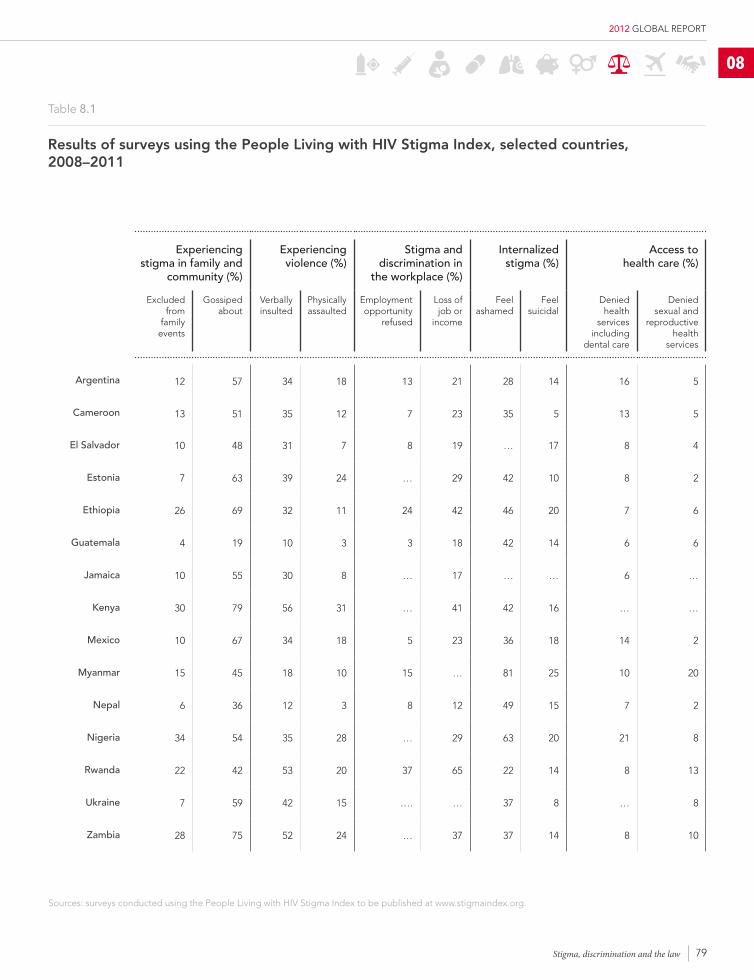
79
2012 GLOBAL REPORT
experiencing stigma in family and
community (%)
experiencing violence (%)
Stigma and discrimination in
the workplace (%)
Internalized stigma (%)
Access to health care (%)
Excluded from
family events
Gossiped about
Verbally insulted
Physically assaulted
Employment opportunity
refused
Loss of job or
income
Feel ashamed
Feel suicidal
Denied health
services including
dental care
Denied sexual and
reproductive health
services
Argentina 12 57 34 18 13 21 28 14 16 5
cameroon 13 51 35 12 7 23 35 5 13 5
el Salvador 10 48 31 7 8 19 … 17 8 4
estonia 7 63 39 24 … 29 42 10 8 2
ethiopia 26 69 32 11 24 42 46 20 7 6
guatemala 4 19 10 3 3 18 42 14 6 6
Jamaica 10 55 30 8 … 17 … … 6 …
Kenya 30 79 56 31 … 41 42 16 … …
mexico 10 67 34 18 5 23 36 18 14 2
myanmar 15 45 18 10 15 … 81 25 10 20
Nepal 6 36 12 3 8 12 49 15 7 2
Nigeria 34 54 35 28 … 29 63 20 21 8
Rwanda 22 42 53 20 37 65 22 14 8 13
Ukraine 7 59 42 15 …. … 37 8 … 8
Zambia 28 75 52 24 … 37 37 14 8 10
Table 8.1
Results of surveys using the people living with hIV Stigma Index, selected countries, 2008–2011
Sources: surveys conducted using the People Living with HIV Stigma Index to be published at www.stigmaindex.org.
08
Stigma, discrimination and the law
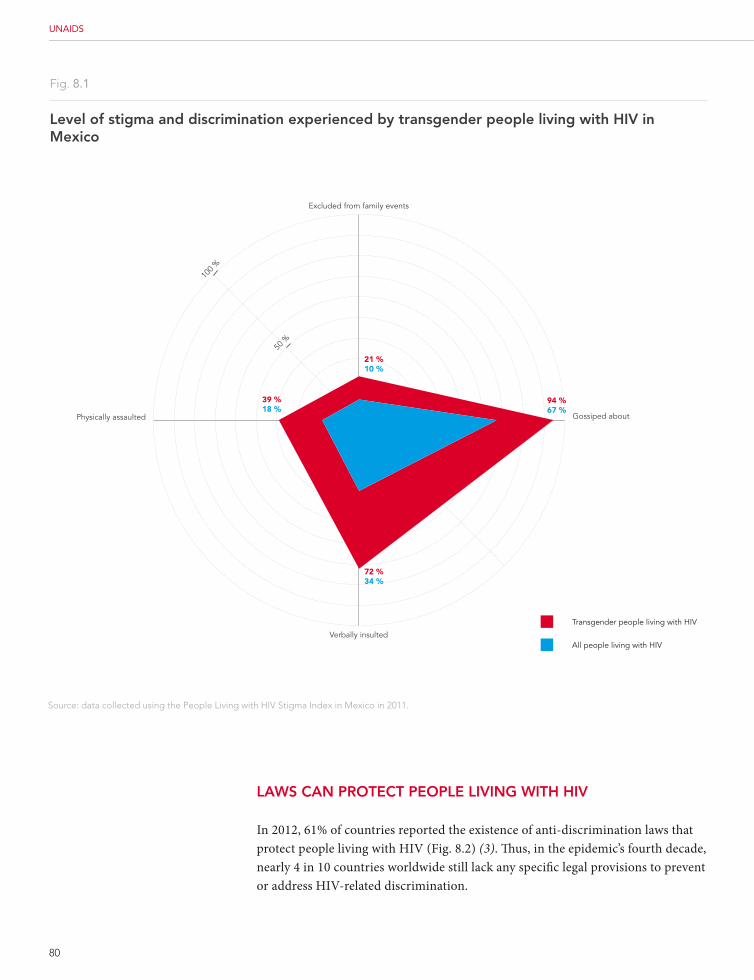
80
UNAIDS
Fig. 8.1
level of stigma and discrimination experienced by transgender people living with hIV in Mexico
Transgender people living with HIV
All people living with HIV
Physically assaulted
Excluded from family events
100 %
50 %
Verbally insulted
Gossiped about
21 %10 %
94 %67 %
72 %34 %
39 %18 %
Source: data collected using the People Living with HIV Stigma Index in Mexico in 2011.
lAwS cAN pRoTecT people lIVINg wITh hIV
In 2012, 61% of countries reported the existence of anti-discrimination laws that protect people living with HIV (Fig. 8.2) (3). Thus, in the epidemic’s fourth decade, nearly 4 in 10 countries worldwide still lack any specific legal provisions to prevent or address HIV-related discrimination.
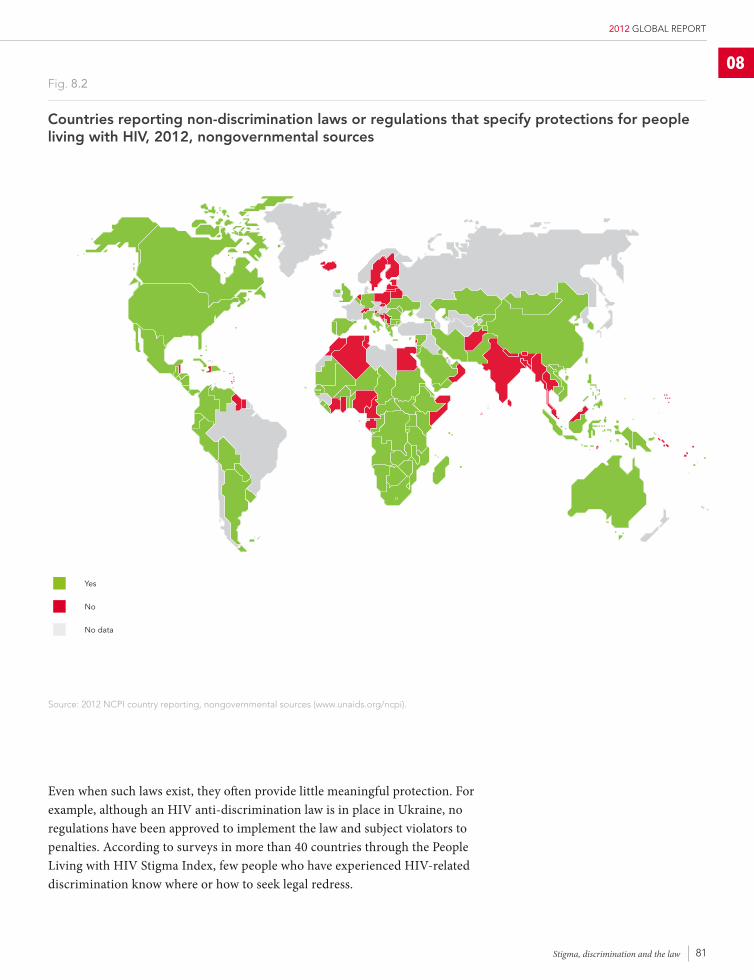
81
2012 GLOBAL REPORT
Fig. 8.2
countries reporting non-discrimination laws or regulations that specify protections for people living with hIV, 2012, nongovernmental sources
Transgender people living with HIV
All people living with HIV
Source: 2012 NCPI country reporting, nongovernmental sources (www.unaids.org/ncpi).
Yes
No
No data
Even when such laws exist, they often provide little meaningful protection. For example, although an HIV anti-discrimination law is in place in Ukraine, no regulations have been approved to implement the law and subject violators to penalties. According to surveys in more than 40 countries through the People Living with HIV Stigma Index, few people who have experienced HIV-related discrimination know where or how to seek legal redress.
08
Stigma, discrimination and the law
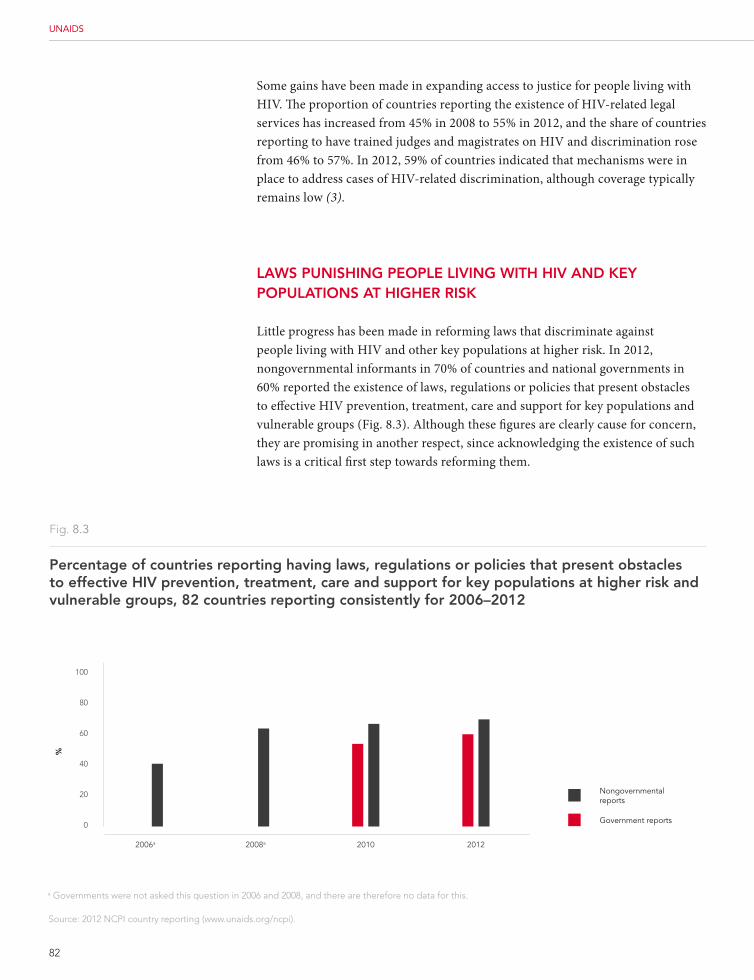
82
UNAIDS
Fig. 8.3
percentage of countries reporting having laws, regulations or policies that present obstacles to effective hIV prevention, treatment, care and support for key populations at higher risk and vulnerable groups, 82 countries reporting consistently for 2006–2012
100
80
60
40
20
0
Nongovernmentalreports
Government reports
2006a 2008a 2010 2012
a Governments were not asked this question in 2006 and 2008, and there are therefore no data for this.
Source: 2012 NCPI country reporting (www.unaids.org/ncpi).
%
Some gains have been made in expanding access to justice for people living with HIV. The proportion of countries reporting the existence of HIV-related legal services has increased from 45% in 2008 to 55% in 2012, and the share of countries reporting to have trained judges and magistrates on HIV and discrimination rose from 46% to 57%. In 2012, 59% of countries indicated that mechanisms were in place to address cases of HIV-related discrimination, although coverage typically remains low (3).
lAwS pUNIShINg people lIVINg wITh hIV AND Key popUlATIoNS AT hIgheR RISK
Little progress has been made in reforming laws that discriminate against people living with HIV and other key populations at higher risk. In 2012, nongovernmental informants in 70% of countries and national governments in 60% reported the existence of laws, regulations or policies that present obstacles to effective HIV prevention, treatment, care and support for key populations and vulnerable groups (Fig. 8.3). Although these figures are clearly cause for concern, they are promising in another respect, since acknowledging the existence of such laws is a critical first step towards reforming them.
83
2012 GLOBAL REPORT
Nongovernmentalreports
Government reports
As of 2012, about 60 countries have adopted laws that specifically criminalize HIV transmission, with some 600 convictions reported in 24 countries (2,4). According to a 2012 global review, more than 40% of United Nations Member States (78 of 193 countries) criminalize same-sex relations, with some jurisdictions permitting imposition of the death penalty for convictions under such laws (5). Similarly, a 2011 review (6) found that punitive policies pertaining to drug use − including criminalization of those dependent on drugs, compulsory drug detention or prohibiting syringe and needle programmes and other harm-reduction measures − undermine efforts to deliver life-saving HIV services for people who use drugs. Laws deeming some aspect of sex work to be illegal are in place in the majority of countries and are often used to justify harassment, extortion and violence against sex workers by police and clients, which places them at increased risk of HIV infection (7). By contrast, some countries have reformed laws to decriminalize key populations at higher risk: for instance, Portugal decriminalized drug possession and use in 2000, and New Zealand adopted the Prostitution Reform Act 2003 that decriminalized sex work. Elsewhere, pragmatic arrangements have been made with police to ensure that law enforcement does not act as an obstacle to HIV prevention and treatment. Such programmes are reported, among others, in Australia, India, Indonesia, Papua New Guinea and Thailand (8).
The urgent, evidence-informed recommendations of the Global Commission on HIV and the Law call on governments to review their legal frameworks and, as needed, repeal or reform laws to support a human rights–based AIDS response. The Global Commission recommended that countries prohibit HIV-related discrimination; refrain from explicitly criminalizing HIV exposure, non-disclosure or transmission; protect women and children in the context of HIV; use the law to ensure access to treatment; and take steps to remove punitive or discriminatory laws and policies regarding key populations at higher risk and vulnerable groups, including people who use drugs, sex workers, men who have sex with men, transgender people, prisoners and migrants (2).
Particular stigma frequently affects refugees, who are often erroneously accused of increasing HIV-related risks for local communities. In reality, refugees frequently migrate from areas with lower HIV prevalence (9), and experience demonstrates that access to information, goods and services within refugee camps improves knowledge and attitudes regarding safer sex (10). In yet another sign of stigma and discrimination, asylum-seekers are sometimes required to undergo mandatory HIV testing to be granted refugee status.
08
60coUNtRIeS cRImINAlIZe
In 2012, about 60 countries had laws criminalizing hIV transmission.
Stigma, discrimination and the law
84
UNAIDS
pRogRAMMATIc effoRTS ADDReSS STIgMA AND DIScRIMINATIoN
Specific programmatic initiatives are needed to accelerate progress towards the elimination of stigma and discrimination. In 2012, 81% of countries report having programmes in place to reduce stigma and discrimination as part of their national AIDS response (3).
There are some signs that these efforts are showing results. In Lesotho, where instances of HIV-related stigma and discrimination have declined, more than 80% of the population reported in 2009 that they would be willing to care for a person living with HIV, would accept teachers living with HIV in the classroom or would buy fresh fruits and vegetables from a vendor living with HIV – a sharp increase over the 50–55% who responded favourably to the same questions in 2006 (3). Haiti reports that a community-based stigma reduction campaign was associated with a significant increase in the number of people accessing testing for HIV and tuberculosis (3). In the United States, the Patient Protection and Affordable Care Act also prohibits discriminatory private insurance practices against people living with HIV (3).
People living with HIV are leading the way in combating HIV stigma and discrimination in many parts of the world. In a case brought by three women living with HIV who had been sterilized without their informed consent, the High Court of Namibia issued a ruling in July 2012 requiring medical practitioners to obtain informed consent before performing such a procedure (3). A woman living with HIV in Vanuatu has travelled throughout the country to challenge the stigmatizing perceptions of communities, church groups and other stakeholders (3).
Although programmatic gains have been made in addressing stigma and discrimination, more must be done. The percentage of Global Fund grants that include activities addressing stigma and human rights rose from 13% in Round 8 to 62% in Round 10, although such activities are frequently not integrated into grant work plans, budgets and performance frameworks (11). However, a Global Fund review in July 2012 (12) found “only feeble advances in improvement of the human rights environment as concerns disease outcomes”.
62%In Round 10 of global
fund grants, 62% included activities to address stigma and human rights, up from
13% in Round 8.
85
2012 GLOBAL REPORT
MoVINg foRwARD TowARDS 2015
The persistence of stigma, discrimination and punitive laws underscores the need for greatly expanded action to ground AIDS responses in human rights. Countries should take steps to better understand and address the factors that contribute to vulnerability to HIV and impede service access; take steps to measure and reduce stigma and discrimination; initiate legal reform as well as pragmatic steps to enforce protective laws and improve access to justice; and work to ensure a safe and dignified space to permit people living with HIV to lead the work against stigma and discrimination. The Positive Health, Dignity and Prevention policy framework provides a structure for this approach that places the voices, leadership and health of people living with HIV at the heart of any effective response to HIV (13).
08
Stigma, discrimination and the law
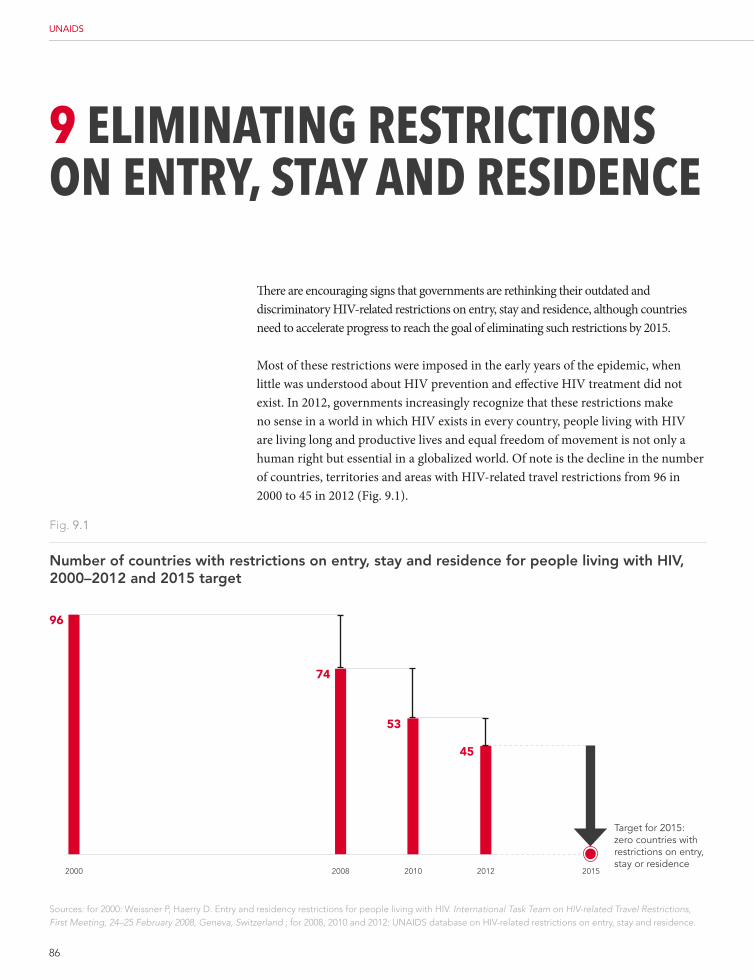
86
UNAIDS
9 elIMInAtIng restrIctIons on entry, stAy And resIdence
There are encouraging signs that governments are rethinking their outdated and discriminatory HIV-related restrictions on entry, stay and residence, although countries need to accelerate progress to reach the goal of eliminating such restrictions by 2015.
Most of these restrictions were imposed in the early years of the epidemic, when little was understood about HIV prevention and effective HIV treatment did not exist. In 2012, governments increasingly recognize that these restrictions make no sense in a world in which HIV exists in every country, people living with HIV are living long and productive lives and equal freedom of movement is not only a human right but essential in a globalized world. Of note is the decline in the number of countries, territories and areas with HIV-related travel restrictions from 96 in 2000 to 45 in 2012 (Fig. 9.1).
Fig. 9.1
Number of countries with restrictions on entry, stay and residence for people living with hIV, 2000–2012 and 2015 target
Sources: for 2000: Weissner P, Haerry D. Entry and residency restrictions for people living with HIV. International Task Team on HIV-related Travel Restrictions, First Meeting, 24–25 February 2008, Geneva, Switzerland ; for 2008, 2010 and 2012: UNAIDS database on HIV-related restrictions on entry, stay and residence.
2012
96
74
53
45
Target for 2015: zero countries with restrictions on entry, stay or residence
2000 2008 2010 2015
87
2012 GLOBAL REPORT
Since 2010, Armenia, China, Fiji, Namibia, the Republic of Korea, the Republic of Moldova, Ukraine and the United States of America have repealed such restrictions, bringing their national laws into accordance with recommended international norms. Countries that have removed these restrictions have reported no negative effects, either in terms of costs or public health (1).
The nature and severity of HIV-related restrictions on entry, stay and residence vary. Five countries (Brunei Darussalam, Oman, Sudan, United Arab Emirates and Yemen) maintain a blanket ban on entry by people living with HIV. Five other countries (Egypt, Iraq, Qatar, Singapore and Turks and Caicos Islands) require individuals wishing to stay for short periods (10–90 days) to demonstrate that they are HIV-negative. Laws in 20 countries provide for deporting individuals discovered to be living with HIV (Fig. 9.2). Where such restrictions continue to exist, other forms of HIV stigma and discrimination are usually common, including among nationals living with HIV.
HIV-related restrictions on entry, stay and residence impose severe burdens on people living with HIV and their households. The effects of such restrictions are most severe for migrant workers, who play an increasingly prominent role in the global economy and in development. From 2005 to 2010, the number of international migrants rose from 191 million to 214 million (2).
The negative consequences of HIV-related restrictions for migrant workers are vividly reflected by experience in the Gulf States, an important destination for millions of migrant workers. The six members of the Gulf Cooperation Council – Bahrain, Kuwait, Oman, Qatar, Saudi Arabia and the United Arab Emirates – all mandatorily test people seeking to come to the Gulf countries to work and require them to be periodically tested to renew visas. Those who become HIV-positive while working in the Gulf are often quarantined, summarily deported, denied appropriate health care and ostracized upon returning to their home countries. The effects of such discriminatory treatment include mental trauma, stress and loss of income and opportunity. Migrants’ HIV-positive test results are shared with all approved by the medical centres in the Gulf Cooperation Council, with such workers categorized as “permanently unfit” to enter any Gulf Cooperation Council country in the future, further denying opportunities (3).
Over time, HIV-related restrictions on entry, stay and residence have clearly become not only discriminatory, lacking in scientific basis, but also counterproductive for business. “HIV-related travel restrictions not only hurt individuals, they hurt businesses,” reports Chip Bergh, CEO of Levi Strauss & Co., a leading international apparel manufacturer. “In today’s competitive landscape, where global business travel is essential, we need to be able to send our talent and skills where they are needed.”
09
Eliminating restrictions on entry, stay and residence
20coUNtRIeS DepoRt
laws in 20 countries provide for deporting individuals discovered to be living with hIV.
88
UNAIDS
Swifter progress will be required to remove all HIV-related restrictions on entry, stay and residence by 2015. National coalitions or task forces can help to educate decision-makers and lay the groundwork for national action to remove such restrictions. Government officials, especially in health ministries, have an important role in showing how such restrictions do not protect public health and are irrational in today’s world. Labour ministries also have a role to play in ensuring that discriminatory practices against labour migrants are halted. As businesses increasingly recognize the potential damage these restrictions pose to international business, the private sector constitutes a potentially powerful voice for eliminating them. Instead of such restrictions, sufficient HIV information and services for HIV prevention and treatment should be ensured for all those entering and leaving each country – nationals and non-nationals alike.
MoVINg TowARDS 2015
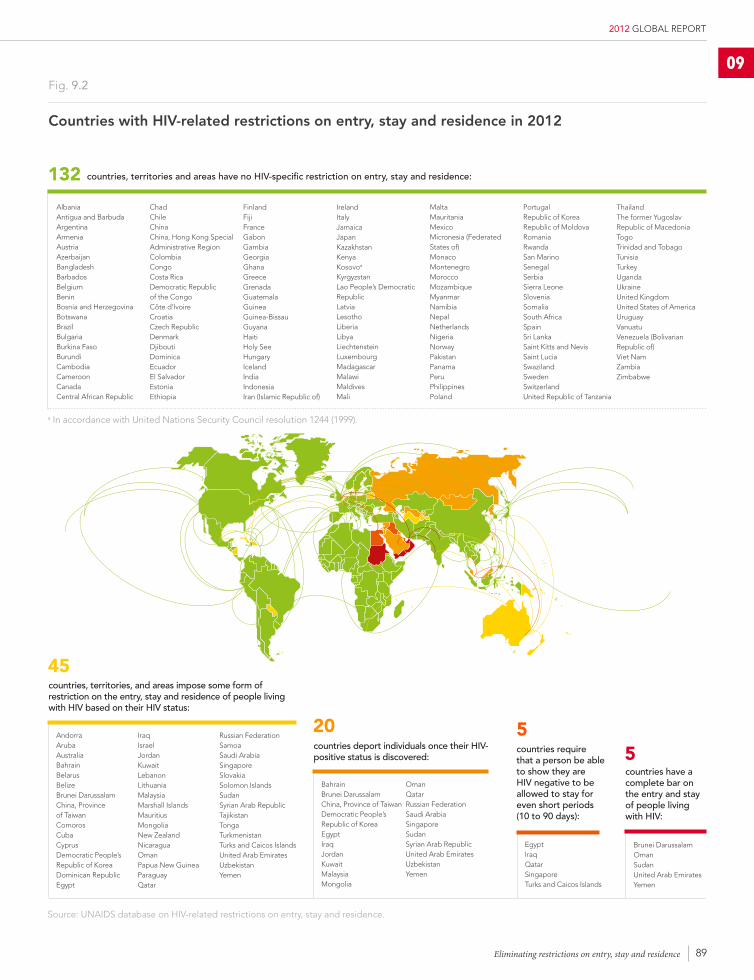
89
2012 GLOBAL REPORT
Fig. 9.2
countries with hIV-related restrictions on entry, stay and residence in 2012
WELCOME
countries, territories and areas have no hIv-specific restriction on entry, stay and residence:132
AlbaniaAntigua and Barbuda ArgentinaArmeniaAustriaAzerbaijan BangladeshBarbados BelgiumBeninBosnia and Herzegovina BotswanaBrazil BulgariaBurkina FasoBurundiCambodiaCameroonCanadaCentral African Republic
ChadChileChinaChina, Hong Kong Special Administrative RegionColombiaCongoCosta RicaDemocratic Republic of the CongoCôte d’Ivoire CroatiaCzech Republic Denmark Djibouti DominicaEcuador El SalvadorEstonia Ethiopia
Finland FijiFrance Gabon GambiaGeorgiaGhanaGreeceGrenadaGuatemalaGuineaGuinea-BissauGuyanaHaitiHoly SeeHungaryIcelandIndiaIndonesia Iran (Islamic Republic of)
IrelandItalyJamaica Japan KazakhstanKenyaKosovoa
Kyrgyzstan Lao People’s Democratic RepublicLatvia Lesotho LiberiaLibya Liechtenstein Luxembourg Madagascar Malawi Maldives Mali
Malta Mauritania MexicoMicronesia (Federated States of)MonacoMontenegroMoroccoMozambiqueMyanmarNamibiaNepalNetherlandsNigeria NorwayPakistanPanamaPeru Philippines Poland
Portugal Republic of KoreaRepublic of MoldovaRomania RwandaSan Marino Senegal Serbia Sierra Leone Slovenia SomaliaSouth Africa Spain Sri Lanka Saint Kitts and NevisSaint Lucia Swaziland Sweden Switzerland United Republic of Tanzania
Thailand The former Yugoslav Republic of MacedoniaTogo Trinidad and Tobago TunisiaTurkey UgandaUkraineUnited KingdomUnited States of AmericaUruguayVanuatuVenezuela (Bolivarian Republic of)Viet NamZambiaZimbabwe
countries have a complete bar on the entry and stay of people living with hIv:
5
Brunei DarussalamOmanSudanUnited Arab EmiratesYemen
countries require that a person be able to show they are hIv negative to be allowed to stay for even short periods (10 to 90 days):
5
EgyptIraqQatarSingaporeTurks and Caicos Islands
countries deport individuals once their hIv-positive status is discovered:
20
BahrainBrunei DarussalamChina, Province of TaiwanDemocratic People’s Republic of KoreaEgyptIraqJordanKuwaitMalaysia Mongolia
Oman Qatar Russian Federation Saudi Arabia SingaporeSudan Syrian Arab Republic United Arab Emirates Uzbekistan Yemen
countries, territories, and areas impose some form of restriction on the entry, stay and residence of people living with hIv based on their hIv status:
45
Andorra Aruba AustraliaBahrainBelarusBelizeBrunei DarussalamChina, Province of TaiwanComorosCubaCyprusDemocratic People’s Republic of KoreaDominican RepublicEgypt
IraqIsraelJordanKuwaitLebanonLithuaniaMalaysiaMarshall IslandsMauritiusMongoliaNew ZealandNicaraguaOmanPapua New GuineaParaguayQatar
Russian FederationSamoaSaudi ArabiaSingaporeSlovakiaSolomon IslandsSudanSyrian Arab RepublicTajikistanTongaTurkmenistanTurks and Caicos IslandsUnited Arab EmiratesUzbekistanYemen
Source: UNAIDS database on HIV-related restrictions on entry, stay and residence.
a In accordance with United Nations Security Council resolution 1244 (1999).
09
Eliminating restrictions on entry, stay and residence
90
UNAIDS
10 IntegrAtIonWith the aim of taking AIDS out of isolation, the 2011 Political Declaration on HIV and AIDS: Intensifying Our Efforts to Eliminate HIV and AIDS (1) calls for eliminating parallel systems for HIV-related services, broader health systems strengthening and integrating the AIDS response in global health and development efforts. A more integrated approach will strengthen the reach and impact of the AIDS response, leverage HIV-related gains to generate broader health and development advances and enhance the long-term sustainability of the AIDS response.
The AIDS movement has a tradition of leadership emerging from marginalized groups and refuses to accept that cutting-edge medicine is reserved for high-income countries and is therefore at the forefront of health and development efforts determined to shape a new world (2).
As the reach of AIDS programmes has expanded, so too have opportunities to integrate HIV into broader health efforts, and the resulting systems are proving greater than the sum of their parts. The number of health facilities with integrated HIV and TB screening, diagnosis and treatment has rapidly increased since 2005, with especially noteworthy progress in sub-Saharan Africa, the region with the highest prevalence of HIV, TB and HIV and TB coinfection (3). According to a recent programme evaluation of 16 community clinics and a district hospital in rural Swaziland, integrating TB case-finding into routine HIV care delivery is both operationally feasible and effective (4). In 2012, South Africa launched an integrated five-year strategy addressing HIV, TB and sexually transmitted infections.
Services to prevent children from acquiring HIV infection have been integrated into maternal and child health services in all 22 priority countries of the Global Plan towards the elimination of new HIV infections among children by 2015 and keeping their mothers alive. A review of 10 studies in diverse countries found that integrating provider-initiated HIV testing and counselling into antenatal settings increased testing levels by 10–66%, with testing uptake of at least 85% found in 8 studies (5). However, such gains are threatened in settings with limited access to facility-based antenatal care or weak systems for commodity forecasting, procurement and supply chain management.
HIV is also being integrated into sexual and reproductive health services in countries all over sub-Saharan Africa. For example, Tanzania, Malawi, Botswana, Burkina Faso and Zimbabwe have recently completed rapid assessment to inform their strategies and to determine priorities for their national plans towards the
91
2012 GLOBAL REPORT
scale-up and intensification of integration. Kenya is evaluating a national strategy that, beginning in 2002, integrated HIV counselling and testing into family planning services. Measuring the effectiveness and impact of these links has been hindered by the lack of standard indicators, prompting a group of experts from national governments, donors, United Nations agencies and civil society to identify a set of relevant indicators.
As access to antiretroviral therapy expands and survival improves for people living with HIV, HIV care and treatment programmes are increasingly focusing on managing chronic disease. In Ethiopia (6), lessons learned in the AIDS response are now informing clinical management of diabetes; two Médicins Sans Frontières clinics in Cambodia (6) have combined services for HIV, diabetes and hypertension; FHI360 has added services for noncommunicable diseases to existing HIV programmes in Kenya (6); and South Africa (6) has embarked on an integrated testing campaign focused on HIV, high blood pressure and diabetes (7). The September 2011 United Nations High-Level Meeting on Non-communicable Diseases renewed global efforts in tacking these growing challenges; arising from the Summit, UNAIDS and WHO have agreed to accelerate collaboration in integrating HIV and noncommunicable disease programmes.
Opportunities to multiply beneficial outcomes through joint approaches with AIDS initiatives exist across the range of social and economic development programmes. A recent review by the World Bank of more than 120 cash transfer programmes in sub-Saharan Africa (8) demonstrated that some types of social protection investment addressing economic and social vulnerabilities of those in greatest need are already reaching households with orphans and vulnerable children and high rates of dependence, providing opportunities for the most vulnerable HIV-affected households to leverage resources, mitigating the impact of the epidemic.
An estimated 10% of the world’s population is living with disabilities (9). Although there are few data on the prevalence of HIV infection among people with disabilities, studies on hearing-impaired populations suggest a prevalence equal to or higher than that of the rest of the community (10). In 2012, 41% of countries reported that their multisectoral AIDS strategy included integrated efforts to address people with disabilities (7,11).
Given the particular effects of HIV on marginalized and often criminalized populations, criminal justice and law enforcement programming is a clear candidate for more integrated efforts. One-time training sessions for police are giving way to an integrated approach, in which HIV becomes a permanent part of curricula and in-service training for uniformed services in several countries. For example, harm reduction began to be integrated into the training of the Royal Malaysian Police in 2009, and HIV training has been integrated at all levels of police in Nepal.
10
Integration
71coUNtRIeS INtegRAte DISAbIlItIeS
In 2012, 71 countries reported multisectoral AIDS strategies that integrate efforts to address people with disabilities.
92
UNAIDS
The Thai sex worker organization SWING partnered with the National Police Cadet Academy of Thailand in an effort to overcome a pattern of persistent violence and abuse male sex workers felt they were subjected to by police officers. Four years of an annual training programme created a core of police cadets on which sex workers and SWING have continued to be able to draw, with positive changes in the attitudes of police officers noted and new avenues of redress available in cases of harassment (12).
Maximizing synergy and integrating HIV responses into wider health and development efforts are critical to the effectiveness and sustainability of the response. The many programmatic opportunities for integration now require a more systematic evidence base that refines the current understanding of where, when and how programmes should optimally be placed and the circumstances in which positive synergy between programmes can be realized. Indicators for integrated approaches – and the integration of existing monitoring systems in different sectoral platforms – need to be developed, allowing regular reporting to track progress in integration.
MoVINg foRwARD TowARDS 2015: TAKINg AIDS oUT of ISolATIoN
93
2012 GLOBAL REPORT
10
box 10.1. Improving integration and increasing the involvement of men in reproductive, maternal, child and newborn health services
The involvement of men in the health of their families, whether as fathers or sexual partners, is now acknowledged to have beneficial effects (13–15). Providing services jointly to partners, instead of separate individuals, is associated with behaviour change to protect the uninfected partner and can significantly reduce the risk of HIV transmission (15). Many countries are therefore experimenting with various strategies to strengthen opportunities for engaging men within service delivery (16,17).
Efforts are being made in numerous situations to integrate services for men into reproductive, maternal, newborn and child health services. Increasing the number of male health personnel providing HIV services, offering men’s services in parallel with reproductive, maternal, newborn and child health services and providing services for couples are all examples of innovative and promising initiatives.
Studies in Rwanda and Zambia (18,19) have shown that the engagement of men was associated with a two thirds reduction in the number of people newly infected with HIV. Where couples counselling is offered, it must be sensitive to the needs of the women who may be deterred by the “requirement” that their husbands or partners attend with them. Similarly, programmes need to be sensitive to the fact that some pregnant women may not have partners.
In an effort to improve HIV services for men while expanding services to prevent mother-to-child transmission, Rwanda has developed a family package of support. The integrated package of services is in accordance with national strategies to prevent children from acquiring HIV infection but also emphasizes the participation of men and encourages male partners to participate in HIV counselling and testing. Elements of the campaign include:
• promoting HIV counselling and testing for couples as a national strategy;• mobilizing communities with local authorities and community health-care workers;• building the capacity of health care personnel on HIV counselling and testing for couples;• organizing weekend HIV counselling and testing sessions for partners who are not available on weekdays; and• introducing invitation letters for male partners.
The family package approach has been credited with a dramatic increase in couple testing, from a national average of 33% of male partners being tested in 2005 to 78% in 2008. The number of couples tested through the programme for preventing mother-to-child transmission increased from 58 700 in 2005 to 229 200 in 2008. Within the programme, HIV testing coverage increased from 10% of the total number of expected pregnant women in 2002 to 50% in 2005 and 75% in 2008. The prevalence of HIV among pregnant women and their male partners also declined: from 9.1% in 2003 to 3.0% in 2008 among pregnant women and from 10.2% in 2003 to 3.1% in 2008 among male partners (20).
A study of 456 pregnant women living with HIV and 140 partners in Kenya (21) showed that the women with a male partner attending at antenatal care had a 45% lower combined risk of the infant acquiring HIV infection or dying among compared with those with no male partner attending.
Integration
94
UNAIDS
box 10.2. pink Ribbon Red Ribbon
Pink Ribbon Red Ribbon is an innovative global health public private partnership that builds on the lessons and experiences gained in the AIDS response to combat cervical cancer and breast cancer in countries in sub-Saharan Africa and Latin America. Led by the George W. Bush Institute, UNAIDS, the United States President’s Emergency Plan for AIDS Relief and Susan G. Komen for the Cure, Pink Ribbon Red Ribbon is working to expand the availability of vital cervical cancer screening and treatment – especially for women living with HIV at high risk – and to promote breast cancer education.
Pink Ribbon Red Ribbon uses the scaling up of HIV prevention and treatment as a platform to provide additional life-saving prevention and treatment services to women, including human papillomavirus prevention and cervical cancer screening and treatment. Human papillomavirus coinfection is common among people living with HIV, in part because HIV and human papillomavirus share a set of risk factors and both are transmitted sexually. Infections with high-risk strains of human papillomavirus, when undetected and untreated, are the leading cause of cervical cancer in women and penile and anal cancer in men. The prevalence of human papillomavirus is often higher among people living with HIV (22).
Launched in September 2011, Pink Ribbon Red Ribbon has already making significant progress. Using the convening power and leadership of UNAIDS to ensure high-level commitment to achieving the goals of Pink Ribbon Red Ribbon in project countries, UNAIDS country offices have worked closely with the Governments of Botswana and Zambia to develop strategies for integrating cervical cancer screening into HIV services. Efforts to provide high-level advocacy and communication strategies linking HIV responses with cervical and breast cancer have generated calls to include preventing cervical cancer in the next Rwanda National Strategic Plan on HIV and AIDS (2013–2017) and to include cervical cancer in the Botswana National Operational Plan on HIV 2012–2016. As a part of the focus on mobilizing women living with HIV to become involved in planning and programme reviews, the United Nations Joint Team in Rwanda is advocating for including civil society organizations, especially women’s organizations, in national plans on HIV and cervical cancer.

10
96
UNAIDS
Introduction
1. Political Declaration on HIV and AIDS: Intensifying Our Efforts to Eliminate HIV and AIDS. Geneva, UNAIDS, 2011 (http://www.unaids.org/en/media/unaids/contentassets/documents/document/2011/06/20110610_un_a-res-65-277_en.pdf, accessed 1 November 2012).
2. Global AIDS Response Progress Reporting 2012: guidelines – construction of core indicators for monitoring the 2011 Political Declaration on HIV/AIDS. Geneva, UNAIDS, 2012 (http://www.unaids.org/en/media/unaids/contentassets/documents/document/2011/JC2215_Global_AIDS_Respose_Progress_Reporting_en.pdf, accessed 1 November 2012).
1. Sexual transmission
1. Hankins CA, de Zalduondo BO. Combination prevention: a deeper understanding of effective HIV prevention. AIDS, 2010, 24(Suppl. 4):S70–S80.
2. Schwartländer B et al. Towards an improved investment approach for an effective response to HIV/AIDS. Lancet, 2011, 377:2031–2041.
3. Marteau TM, Hollands, GJ, Fletcher PC. Changing human behavior to prevent disease: the importance of targeting automatic processes. Science, 2012, 337:1492–1495.
4. Hallett TB et al. Declines in HIV prevalence can be associated with changing sexual behaviour in Uganda, urban Kenya, Zimbabwe, and urban Haiti. Sexually Transmitted Infections, 2006, 82(Suppl. 1):i1–i8.
5. Gregson S et al. HIV decline associated with behavior change in eastern Zimbabwe. Science, 2006, 311:664–666.
6. Johnson LF et al. The effect of changes in condom usage and antiretroviral treatment coverage on human immunodeficiency virus incidence in South Africa: a model-based analysis. Journal of the Royal Society Interface, 2012, 9:1544–1554.
7. Jafa K, Chapman S. Reinvigorating condoms as an HIV prevention tool. Arlington, VA, AIDSTAR-One, 2012 (AIDSTAR-One Spotlight on Prevention series; http://www.aidstar-one.com/sites/default/files/Prev_Spotlight_Condoms_Final.pdf, accessed 1 November 2012).
8. UNAIDS resource needs for AIDS in low- and middle-income countries. Geneva, UNAIDS, 2007 (http://www.unaids.org/en/resources/presscentre/featurestories/2007/september/20070925resourceneedsmethodology, accessed 1 November 2012).
9. Papo JK et al. Exploring the condom gap: is supply or demand the limiting factor – condom access and use in an urban and a rural setting in Kilifi district, Kenya. AIDS, 2011, 25:247–255.
10. Njeuhmeli E et al. Voluntary medical male circumcision: modeling the impact and cost of expanding male circumcision for HIV prevention in eastern and southern Africa. PLoS Medicine, 2011, 8:e1001132.
reFerences
97
2012 GLOBAL REPORT
11. WHO and UNAIDS. Progress in scaling up voluntary medical male circumcision for HIV prevention in east and southern Africa. Geneva, World Health Organization, 2012.
12. Baral S et al. Burden of HIV among female sex workers in low-income and middle-income countries: a systematic review and meta-analysis. Lancet Infectious Diseases, 2012, 12:538–549.
13. Beyrer C et al. Global epidemiology of HIV infection in men who have sex with men. Lancet, 2012, 380:367–377.
14. van Griensven F, de Lind van Wijngaarden JW. A review of the epidemiology of HIV infection and prevention responses among MSM in Asia. AIDS, 2010, 24:S30–S40.
15. Handa S et al. Effect of a national social cash transfer program on HIV risk behavior in Kenya. XIX International AIDS Conference, Washington DC, USA, 22–27 July 2012 (Abstract FRLBD01; http://pag.aids2012.org/Abstracts.aspx?AID=21323, accessed 1 November 2012).
16. Baird SJ et al. Effect of a cash transfer programme for schooling on prevalence of HIV and herpes simplex type 2 in Malawi: a clustered randomized trial. Lancet, 2012, 379:1320–1329.
17. Cohen MS et al. Prevention of HIV-1 infection with early antiretroviral therapy. New England Journal of Medicine, 2011, 365:493–505.
18. Guidance on couples HIV testing and counselling, including antiretroviral therapy for treatment and prevention in serodiscordant couples: recommendations for a public health approach. Geneva, World Health Organization, 2012 (http://www.who.int/hiv/topics/vct/en, accessed 1 November 2012).
2. People who inject drugs
1. Mathers B et al. Global epidemiology of injecting drug use and HIV among people who inject drugs: a systematic review. Lancet, 2008, 372:1733–1745.
2. Wood E et al. Attendance at supervised injecting facilities and use of detoxification services. New England Journal of Medicine, 2006, 354:2512–2514.
3. Women, harm reduction, and HIV: key findings from Azerbaijan, Georgia, Kyrgyzstan, Russia, and Ukraine. New York, Open Society Institute Public Health Program, 2009.
4. Mathers BM et al. HIV prevention, treatment, and care services for people who inject drugs: a systematic review of global, regional, and national coverage. Lancet, 2010, 375:1014–1028.
5. Degenhardt L et al. Prevention of HIV infection for people who inject drugs: why individual, structural, and combination approaches are needed. Lancet, 2010, 376:285–301.
6. El-Bassel N, Terlikbaeva A, Pinkham S. HIV and women who use drugs: double neglect, double risk. Lancet, 2010, 376:312–314.
7. Strathdee SA et al. Social and structural factors associated with HIV infection among female sex workers who inject drugs in the Mexico–US border region. PLoS One, 2011, 6:e19048.
8. Brown QL et al. The impact of homelessness on recent sex trade among pregnant women in drug treatment. Journal of Substance Use, 2012, 17:287–293.
98
UNAIDS
9. Cavanaugh CE, Latimer WW. Recent sex trade and injection drug use among pregnant opiate and cocaine dependent women in treatment: the significance of psychiatric comorbidity. Addiction Disorders and Their Treatment, 2010, 9:32.
3. Eliminating HIV infection among children and keeping their mothers alive
1. Countdown to zero: Global Plan towards the elimination of new HIV infections among children by 2015 and keeping their mothers alive. Geneva, UNAIDS, 2011 (http://www.unaids.org/en/media/unaids/contentassets/documents/unaidspublication/2011/20110609_JC2137_Global-Plan-elimination-HIv-Children_en.pdf, accessed 1 November 2012).
2. Mofenson LM. Antiretroviral drugs to prevent breastfeeding HIV transmission. Antiviral Therapy, 2010, 15:537–553.
3. Antiretroviral therapy of HIV infection in infants and children: towards unviersal access. Recommendations for a public health approach: 2010 revision. Geneva, World Health Organization, 2010 (http://www.who.int/hiv/pub/paediatric/infants2010/en/index.html, accessed 1 November 2012).
4. Marston M et al. Net survival of perinatally and postnatally HIV-infected children: a pooled analysis of individual data from sub-Saharan Africa. International Journal of Epidemiology, 2011, 40:385–396.
5. Getahun H et al. Prevention, diagnosis, and treatment of tuberculosis in children and mothers: evidence for action for maternal, neonatal, and child health services. Journal of Infectious Diseases, 2012, 205(Suppl. 2):S216–S227.
6. Mahy M et al. What will it take to achieve virtual elimination of mother-to-child transmission of HIV? An assessment of current progress and future needs. Sexually Transmitted Infections, 2010, 86(Suppl 2):ii48–ii55.
7. Schouten EJ et al. Prevention of mother-to-child transmission of HIV and the health-related Millennium Development Goals: time for a public health approach. Lancet, 2011, 378:282–284.
8. El-Sadr WM et al. Bridging the divide. Journal of Acquired Immune Deficiency Syndromes, 2011, 57(Suppl. 2):S59–S60.
9. Thorne C et al. Prevention of mother-to-child transmission of human immunodeficiency virus among pregnant women using injecting drugs in Ukraine, 2000–10. Addiction, 2012, 107:118–128.
4. Treatment
1. Holmes CB et al. PEPFAR’s past and future efforts to cut costs, improve efficiency, and increase the impact of global HIV programs. Health Affairs, 2012, 31:1553–1660.
2. Press release: new study finds cost of treating HIV patients far lower than commonly believed; agreement with generic drug makers will bring prices down even further. New York, William J. Clinton Foundation, 2012 (http://www.clintonfoundation.org/main/news-and-media/press-releases-and-statements/press-release-agreement-with-generic-drug-makers-will-bring-prices-down-even-further.html, accessed 1 November 2012).
99
2012 GLOBAL REPORT
5. Tuberculosis and HIV
1. 2012 progress reports submitted by countries [online database]. Geneva, UNAIDS, 2012 (http://www.unaids.org/cpr, accessed 1 November 2012).
2. Suthar AB et al. Antiretroviral therapy for prevention of tuberculosis in adults with HIV: a systematic review and meta-analysis. PLoS Medicine, 2012, 9:e1001270.
3. Global tuberculosis control 2009. Geneva, World Health Organization, 2009.
4. Guidelines for intensified tuberculosis case-finding and isoniazid preventive therapy for people living with HIV in resource-constrained settings. Geneva, World Health Organization, 2011 (http://www.who.int/tb/publications/2011/en/index.html, accessed 1 November 2012).
5. WHO, United States President’s Emergency Plan for AIDS Relief and UNAIDS. A guide to monitoring and evaluation for collaborative TB/HIV activities. Geneva, World Health Organization, 2009 (http://www.who.int/tb/publications/2009/en/index.html, accessed 1 November 2012).
6. WHO, UNAIDS, UNICEF and Global Fund to Fight AIDS, Tuberculosis and Malaria. Three interlinked patient monitoring systems for HIV care/ART, MCH/PMTCT and TB/HIV: standardized minimum data set and illustrative tools. Geneva, World Health Organization, 2009 (http://www.who.int/hiv/pub/imai/three_patient_monitor/en, accessed 1 November 2012).
6. Resources and spending
1. 2012 progress reports submitted by countries [online database]. Geneva, UNAIDS, 2012 (http://www.unaids.org/cpr, accessed 1 November 2012).
2. Investing for results. Results for people. A people-centered investment tool towards ending AIDS. Geneva, UNAIDS, 2012 (http://www.unaids.org/en/media/unaids/contentassets/documents/pcb/2012/JC2359_investing-for-results_en.pdf, accessed 1 November 2012).
7. Gender and the HIV response
1. Peacock D. Men as partners: promoting men’s involvement in care and support activities for people living with HIV/AIDS. Expert Group Meeting on the Role of Men and Boys in Achieving Gender Equality, Brasilia, Brazil, 21–24 October 2003 (http://www.un.org/womenwatch/daw/egm/men-boys2003/EP5-Peacock,pdf, accessed 1 November 2012).
2. Rapid assessment of gender-related barriers to services to prevent vertical transmission of HIV. Geneva, UNAIDS, forthcoming.
3. Esplen E. Women and girls living with HIV/AIDS: overview and annotated bibliography. Brighton, Institute of Development Studies, University of Sussex, 2007 (http://www.bridge.ids.ac.uk/reports/BB18_HIV.pdf, accessed 1 November 2012).
4. Mullick S, Kuneni B, Wanjiru M. Involving men in maternity care: health service delivery issues. Washington, DC, Population Council, 2005 (http://www.popcouncil.org/pdfs/frontiers/journals/Agenda_Mullick05.pdf, accessed 1 November 2012).
100
UNAIDS
5. Cornell M, McIntyre J, Myer L. Men and antiretroviral therapy in Africa: our blind spot. Tropical Medicine and International Health, 2011, 16:828–829.
6. Mulula AS et al. Gender distribution of adult patients on highly active antiretroviral therapy (HAART) in South Africa: a systematic review. BMC Public Health, 2007, 25:7–63.
7. Ochieng-Ooko V et al. Influence of gender on loss to follow-up in a large HIV treatment programme in western Kenya. Bulletin of the World Health Organization, 2010, 88:681–688.
8. Taylor-Smith K et al. Gender differences in retention and survival on antiretroviral therapy of HIV-infected adults in Malawi. Malawi Medical Journal, 2010, 22:49–56.
9. Cornell M et al. Gender differences in survival among adult patients starting antiretroviral therapy in South Africa: a multicentre cohort study. PLoS Medicine, 2012,9:e1001304.
10. Stringer JS et al. Rapid scale-up of antiretroviral therapy at primary care sites in Zambia: feasibility and early outcomes. JAMA, 2006, 296:782–793.
11. A national study on violence against children and young women in Swaziland. New York, UNICEF, 2010.
12. UNICEF, United States Centres for Disease Control and Prevention and Muhimbili University of Health and Allied Sciences. Violence against children in Tanzania: findings from a national survey 2009. Dar es Salaam, Government of the United Republic of Tanzania, 2011.
13. Hillis SD et al. Adverse childhood experience and sexual risk behaviours in women: a retrospective cohort study. Family Planning Perspectives, 2001, 33:206–211.
14. Winter S. Lost in transition: transgender people, rights and HIV vulnerability in the Asia-Pacific Region. Bangkok, United Nations Development Programme, 2012.
15. Prevention and treatment of HIV and other sexually transmitted infections among men who have sex with men and transgender people: recommendations for a public health approach 2011. Geneva, World Health Organization, 2011 (http://www.who.int/hiv/pub/guidelines/msm_guidelines2011/en, accessed 1 November 2012).
16. Hounsfield VL et al. Transgender people attending a Sydney sexual health service over a 16-year period. Sexual Health, 2007, 4:189–193.
17. Schulden JD et al. Rapid HIV testing in transgender communities by community-based organizations in three cities. Public Health Reports, 2008, 123:101–114.
18. 2012 progress reports submitted by countries [online database]. Geneva, UNAIDS, 2012 (http://www.unaids.org/cpr, accessed 1 November 2012).
19. 2012 National Commitments and Policies Instrument (NCPI) – countries [online database]. Geneva, UNAIDS, 2012 (http://www.unaids.org/ncpi, accessed 1 November 2012).
20. Orza L. Community innovations: achieving sexual and reproductive health and rights for women and girls through the HIV response. Geneva, UNAIDS and Athena Network, 2011 (http://www.unaids.org/en/media/unaids/contentassets/documents/document/2011/07/20110719_Community%20innovation.pdf, accessed 1 November 2012).
101
2012 GLOBAL REPORT
8. Stigma, discrimination and the law
1. Sigma and discrimination at work: findings from the People Living with HIV Stigma Index. Amsterdam, Global Network of People Living with HIV, 2012 (http://www.gnpplus.net/images/stories/Rights_and_stigma/SI_WorkBriefing_Online.pdf, accessed 1 November 2012).
2. Global Commission on HIV and the Law. Risks, rights & health. New York, United Nations Development Programme, 2012.
3. 2012 country progress reports [online database]. Geneva, UNAIDS, 2012 (http://www.unaids.org/cpr, accessed 1 November 2012).
4. The global criminalisation scan report 2010: documenting trends, presenting evidence. Amsterdam, Global Network of People Living with HIV, 2010.
5. Itaborahy LP. State-sponsored homophobia: a world survey of laws criminalising same-sex sexual acts between consenting adults. Brussels, International Lesbian, Gay, Bisexual, Trans and Intersex Association (http://old.ilga.org/Statehomophobia/ILGA_State_Sponsored_Homophobia_2012.pdf, accessed 1 November 2012).
6. Chiu J, Burris S. Punitive drug law and the risk environment for injecting drug users: understanding the connections. New York, Global Commission on HIV and the Law, 2011 (Global Commission on HIV and the Law Working Paper; http://www.hivlawcommission.org/index.php/working-papers?task=document.viewdoc&id=98, accessed 1 November 2012).
7. Laws and policies affecting sex work. New York, Open Society Foundation, 2012 (http://www.soros.org/sites/default/files/sex-work-laws-policies-20120713.pdf, accessed 1 November 2012).
8. Police and HIV programs. Law Enforcement and HIV Network, 2012 (http://www.leahn.org/key-affected-populations, accessed 1 November 2012).
9. Spiegel B et al. Prevalence of HIV infection in conflict-affected and displaced people in seven sub-Saharan African countries: a systematic review. Lancet, 2007, 369:2187–2195.
10. Spiegel P, Nankoe A. UNHCR, HIV/AIDS and refugees: lessons learned. Geneva, Office of the United Nations High Commissioner for Refugees, 2011 (http://www.unhcr.org/403a1f2d4.html, accessed 1 November 2012).
11. Making a difference: the Global Fund results report 2011. Geneva, Global Fund to Fight AIDS, Tuberculosis and Malaria, 2011 (http://www.theglobalfund.org/en/library/publications/progressreports, accessed 1 November 2012).
12. Report of the Technical Review Panel and the Secretariat on the Transitional Funding Mechanism, 2012. Geneva, Global Fund to Fight AIDS, Tuberculosis and Malaria, 2012.
13. Positive health, dignity and prevention: a policy framework. Geneva, UNAIDS, 2011 (http://www.unaids.org/en/media/unaids/contentassets/document/unaidspublication/2011/20110701_phdp.pdf, accessed 1 November 2012).
102
UNAIDS
9. Eliminating restrictions on entry, stay and residence
1. Global Commission on HIV and the Law. Risks, rights & health. New York, United Nations Development Programme, 2012.
2. World migration report, 2011. Geneva, International Organization for Migration, 2011.
3. Marin M. Impact of HIV travel restrictions on migrant workers in Asia and the Gulf States. 19th International AIDS Conference, Washington, DC, 22–27 July 2012.
10. Integration
1. Political Declaration on HIV and AIDS: Intensifying Our Efforts to Eliminate HIV and AIDS. Geneva, UNAIDS, 2011 (http://www.unaids.org/en/media/unaids/contentassets/documents/document/2011/06/20110610_un_a-res-65-277_en.pdf, accessed 1 November 2012).
2. A strategic revolution in HIV and global health. Lancet, 2011, 377:2055.
3. Howard AA, El-Sadr WM. Integration of tuberculosis and HIV services in sub-Saharan Africa: lessons learned. Clinical and Infectious Diseases, 2010, 50:S3.
4. Elden S et al. Integrated intensified case finding of tuberculosis into HIV care: an evaluation from rural Swaziland. BMC Health Services Research, 2011, 11:118.
5. Hensen B et al. Universal voluntary HIV testing in antenatal care settings: a review of the contribution of provider-initiated testing & counseling. Tropical Medicine and Health, 2012, 17:59–70.
6. Chronic care of HIV and noncommunicable diseases: how to leverage the HIV experience. Geneva, UNAIDS, 2011 (http://www.unaids.org/en/media/unaids/contentassets/documents/unaidspublication/2011/20110526_JC2145_Chronic_care_of_HIV.pdf, accessed 1 November 2012).
7. 2012 progress reports submitted by countries [online database]. Geneva, UNAIDS, 2012 (http://www.unaids.org/cpr, accessed 1 November 2012).
8. Garcia M, Moore CMT. The cash dividend: the rise of cash transfer programmes in sub-Saharan Africa. Washington, DC, World Bank, 2012 (https://openknowledge.worldbank.org/handle/10986/2246, accessed 1 November 2012).
9. Mont D. Measuring disability prevalence. Washington, DC, World Bank, 2007 (SP Discussion Paper No. 0706).
10. Disability and HIV policy brief. Geneva, World Health Organization, 2009 (http://www.who.int/disabilities/jc1632_policy_brief_disability_en.pdf, accessed 1 November 2012).
11. 2012 National Commitments and Policies Instrument (NCPI) – countries [online database]. Geneva, UNAIDS, 2012 (http://www.unaids.org/ncpi, accessed 1 November 2012).
12. UNFPA, UNAIDS and Asia Pacific Network of Sex Workers. The HIV and sex work collection: innovative responses in Asia and the Pacific. Geneva, UNAIDS, forthcoming.
103
2012 GLOBAL REPORT
13. Sherr L. Fathers and HIV: considerations for families. Journal of the International AIDS Society, 2011, 13(Suppl 2):S4.
14. Betancourt T et al. Family-centred approaches to the prevention of mother to child transmission of HIV. Journal of the International AIDS Society, 2010, 13(Suppl 2):S2.
15. Guidance on couples HIV testing and counselling including antiretroviral therapy for treatment and prevention in serodiscordant couples: recommendations for a public health approach. Geneva, World Health Organization, 2012 (http://www.who.int/hiv/topics/vct/en, accessed 1 November 2012).
16. Byamugisha B et al. Male partner antenatal attendance and HIV testing in eastern Uganda: a randomized facility-based intervention trial. Journal of the International AIDS Society, 2011, 14:43.
17. Farquhar C et al. Antenatal couple counseling increases uptake of interventions to prevent HIV-1 transmission. Journal of Acquired Immune Deficiency Syndromes, 2004, 37:1620–1626.
18. Allen, S. et al. Effect of serotesting with counselling on condom use and seroconversion among HIV discordant couples in Africa. BMJ, 1992, 304:1605–1609.
19. Dunkle K et al. New heterosexually transmitted HIV infections in married or cohabiting couples in urban Zambia and Rwanda: an analysis of survey and clinical data. Lancet, 2008, 371:2183–2191.
20. Male involvement in the prevention of mother-to-child transmission of HIV. Geneva, World Health Organization, 2012 (http://www.who.int/reproductivehealth/publications/rtis/9789241503679/en/index.html, accessed 1 November 2012).
21. Aluisi A et al. Male antenatal attendance and HIV testing are associated with decreased infant HIV infection and increased HIV-free survival. Journal of Acquired Immune Deficiency Syndromes, 2011, 56:76–82.
22. Ng’andwe C et al. The distribution of sexually-transmitted human papillomaviruses in HIV positive and negative patients in Zambia, Africa. BMC Infectious Diseases, 2007, 7:77.

annexes
A
2012 GLOBAL REPORT
Annexes | A1
EpidEmiology Epidemiological Status A4
TARgET 1 Sexual transmission A28
TARgET 2 People who inject drugs A46
TARgET 3 HIV infection among children and keeping their mothers alive A52
TARgET 4 Treatment A60
TARgET 5 Tuberculosis and HIV A78
TARgET 6 Resources and spending A82
TARgET 7 Gender and the HIV response A92
TARgET 9 Eliminating restrictions on entry, stay and residence A98
TARgET 10 Integration A100
Contents
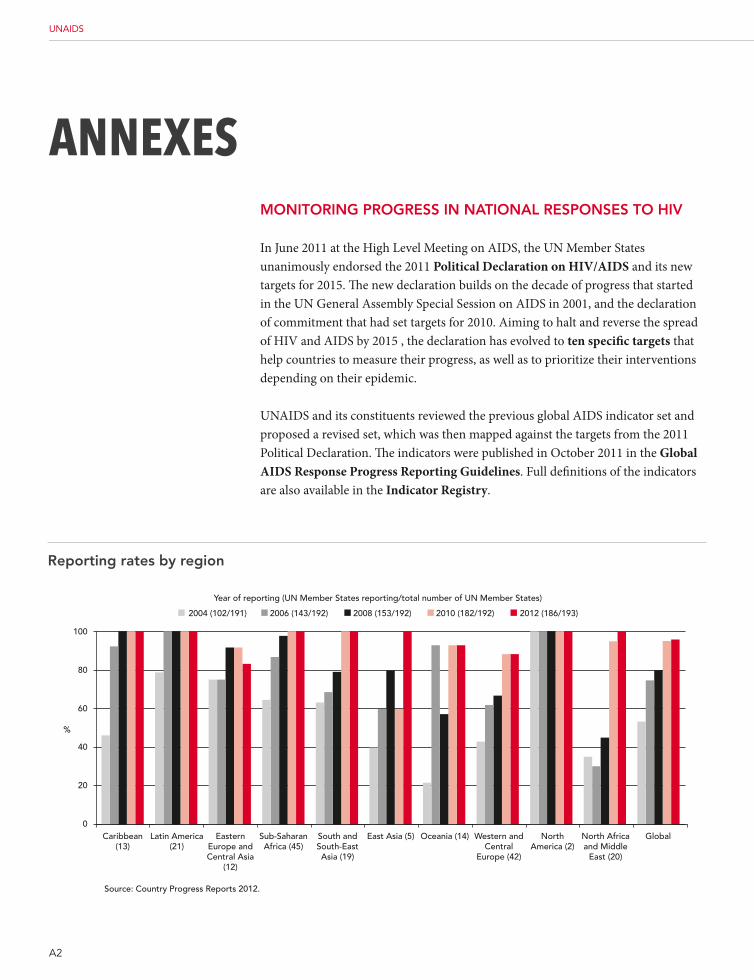
A2
UNAIDS
AnneXesMonitoring progress in national responses to HiV
In June 2011 at the High Level Meeting on AIDS, the UN Member States unanimously endorsed the 2011 Political Declaration on HIV/AIDS and its new targets for 2015. The new declaration builds on the decade of progress that started in the UN General Assembly Special Session on AIDS in 2001, and the declaration of commitment that had set targets for 2010. Aiming to halt and reverse the spread of HIV and AIDS by 2015 , the declaration has evolved to ten specific targets that help countries to measure their progress, as well as to prioritize their interventions depending on their epidemic.
UNAIDS and its constituents reviewed the previous global AIDS indicator set and proposed a revised set, which was then mapped against the targets from the 2011 Political Declaration. The indicators were published in October 2011 in the Global AIDS Response Progress Reporting Guidelines. Full definitions of the indicators are also available in the Indicator Registry.
100
80
60
%
40
20
0GlobalNorth Africa
and MiddleEast (20)
NorthAmerica (2)
Western andCentral
Europe (42)
Oceania (14)East Asia (5)South andSouth-EastAsia (19)
Sub-SaharanAfrica (45)
EasternEurope andCentral Asia
(12)
(total number of UN Member States in the region)Source: Country Progress Reports 2012.
Year of reporting (UN Member States reporting/total number of UN Member States)
2012 (186/193)2010 (182/192)2008 (153/192)2006 (143/192)2004 (102/191)
Latin America(21)
Caribbean(13)
reporting rates by region
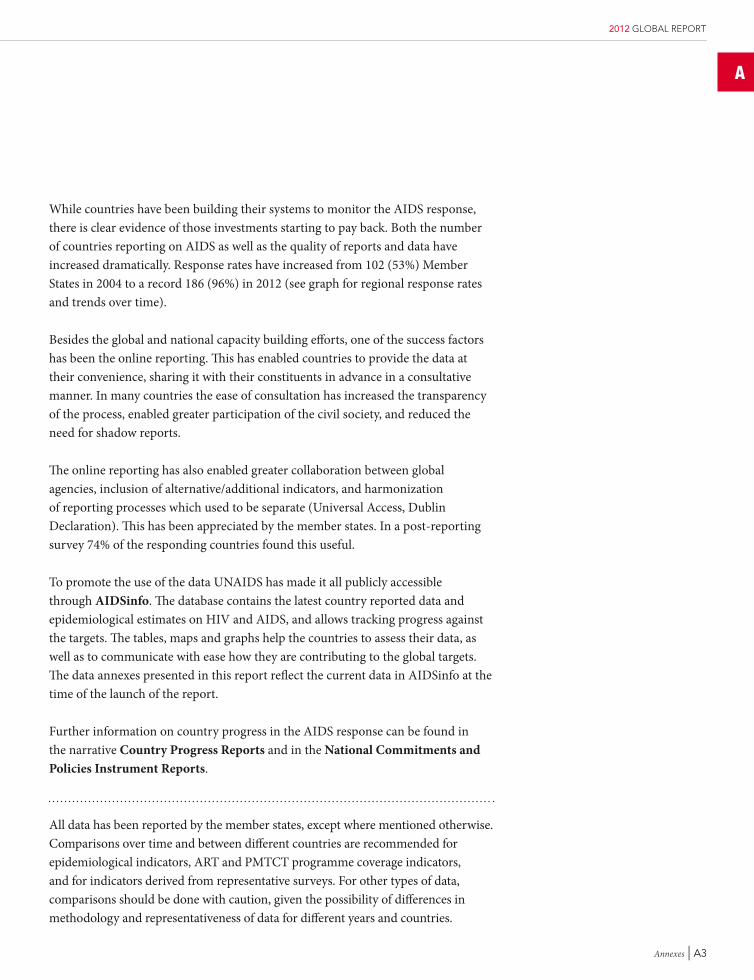
A
2012 GLOBAL REPORT
Annexes | A3
While countries have been building their systems to monitor the AIDS response, there is clear evidence of those investments starting to pay back. Both the number of countries reporting on AIDS as well as the quality of reports and data have increased dramatically. Response rates have increased from 102 (53%) Member States in 2004 to a record 186 (96%) in 2012 (see graph for regional response rates and trends over time).
Besides the global and national capacity building efforts, one of the success factors has been the online reporting. This has enabled countries to provide the data at their convenience, sharing it with their constituents in advance in a consultative manner. In many countries the ease of consultation has increased the transparency of the process, enabled greater participation of the civil society, and reduced the need for shadow reports.
The online reporting has also enabled greater collaboration between global agencies, inclusion of alternative/additional indicators, and harmonization of reporting processes which used to be separate (Universal Access, Dublin Declaration). This has been appreciated by the member states. In a post-reporting survey 74% of the responding countries found this useful.
To promote the use of the data UNAIDS has made it all publicly accessible through AIDSinfo. The database contains the latest country reported data and epidemiological estimates on HIV and AIDS, and allows tracking progress against the targets. The tables, maps and graphs help the countries to assess their data, as well as to communicate with ease how they are contributing to the global targets. The data annexes presented in this report reflect the current data in AIDSinfo at the time of the launch of the report.
Further information on country progress in the AIDS response can be found in the narrative Country Progress Reports and in the National Commitments and Policies Instrument Reports.
All data has been reported by the member states, except where mentioned otherwise. Comparisons over time and between different countries are recommended for epidemiological indicators, ART and PMTCT programme coverage indicators, and for indicators derived from representative surveys. For other types of data, comparisons should be done with caution, given the possibility of differences in methodology and representativeness of data for different years and countries.
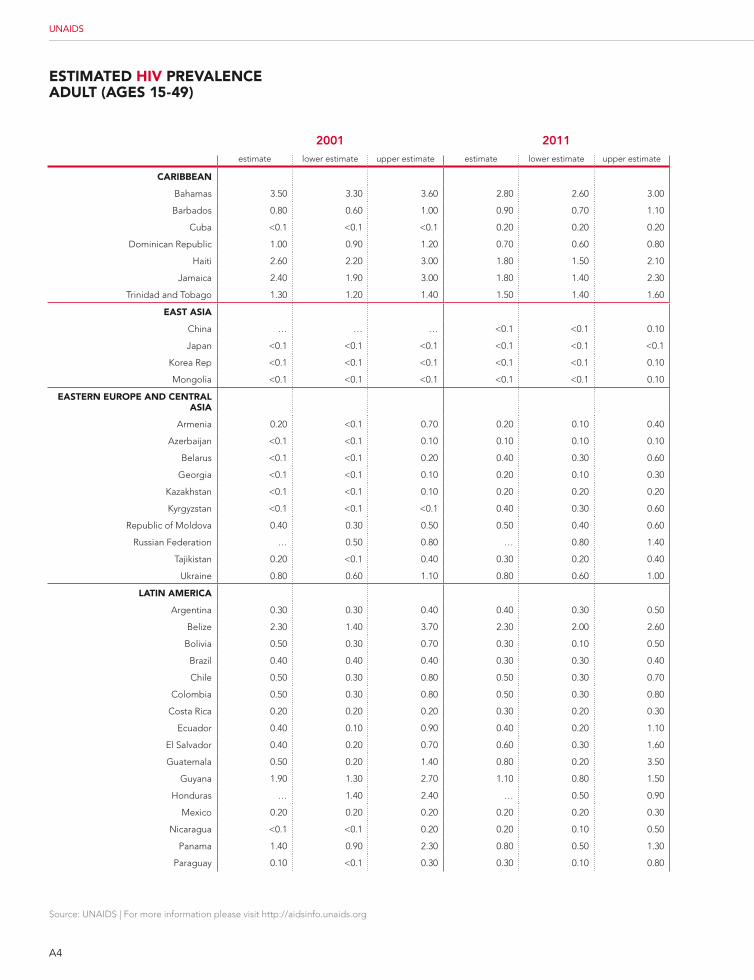
A4
Source: UNAIDS | For more information please visit http://aidsinfo.unaids.org
UNAIDS
EstimatEd HiV PrEValEncE adult (agEs 15-49)
2001 2011estimate lower estimate upper estimate estimate lower estimate upper estimate
caribbEan
Bahamas 3.50 3.30 3.60 2.80 2.60 3.00
Barbados 0.80 0.60 1.00 0.90 0.70 1.10
Cuba <0.1 <0.1 <0.1 0.20 0.20 0.20
Dominican Republic 1.00 0.90 1.20 0.70 0.60 0.80
Haiti 2.60 2.20 3.00 1.80 1.50 2.10
Jamaica 2.40 1.90 3.00 1.80 1.40 2.30
Trinidad and Tobago 1.30 1.20 1.40 1.50 1.40 1.60
East asia
China … … … <0.1 <0.1 0.10
Japan <0.1 <0.1 <0.1 <0.1 <0.1 <0.1
Korea Rep <0.1 <0.1 <0.1 <0.1 <0.1 0.10
Mongolia <0.1 <0.1 <0.1 <0.1 <0.1 0.10
EastErn EuroPE and cEntral asia
Armenia 0.20 <0.1 0.70 0.20 0.10 0.40
Azerbaijan <0.1 <0.1 0.10 0.10 0.10 0.10
Belarus <0.1 <0.1 0.20 0.40 0.30 0.60
Georgia <0.1 <0.1 0.10 0.20 0.10 0.30
Kazakhstan <0.1 <0.1 0.10 0.20 0.20 0.20
Kyrgyzstan <0.1 <0.1 <0.1 0.40 0.30 0.60
Republic of Moldova 0.40 0.30 0.50 0.50 0.40 0.60
Russian Federation … 0.50 0.80 … 0.80 1.40
Tajikistan 0.20 <0.1 0.40 0.30 0.20 0.40
Ukraine 0.80 0.60 1.10 0.80 0.60 1.00
latin amErica
Argentina 0.30 0.30 0.40 0.40 0.30 0.50
Belize 2.30 1.40 3.70 2.30 2.00 2.60
Bolivia 0.50 0.30 0.70 0.30 0.10 0.50
Brazil 0.40 0.40 0.40 0.30 0.30 0.40
Chile 0.50 0.30 0.80 0.50 0.30 0.70
Colombia 0.50 0.30 0.80 0.50 0.30 0.80
Costa Rica 0.20 0.20 0.20 0.30 0.20 0.30
Ecuador 0.40 0.10 0.90 0.40 0.20 1.10
El Salvador 0.40 0.20 0.70 0.60 0.30 1.60
Guatemala 0.50 0.20 1.40 0.80 0.20 3.50
Guyana 1.90 1.30 2.70 1.10 0.80 1.50
Honduras … 1.40 2.40 … 0.50 0.90
Mexico 0.20 0.20 0.20 0.20 0.20 0.30
Nicaragua <0.1 <0.1 0.20 0.20 0.10 0.50
Panama 1.40 0.90 2.30 0.80 0.50 1.30
Paraguay 0.10 <0.1 0.30 0.30 0.10 0.80
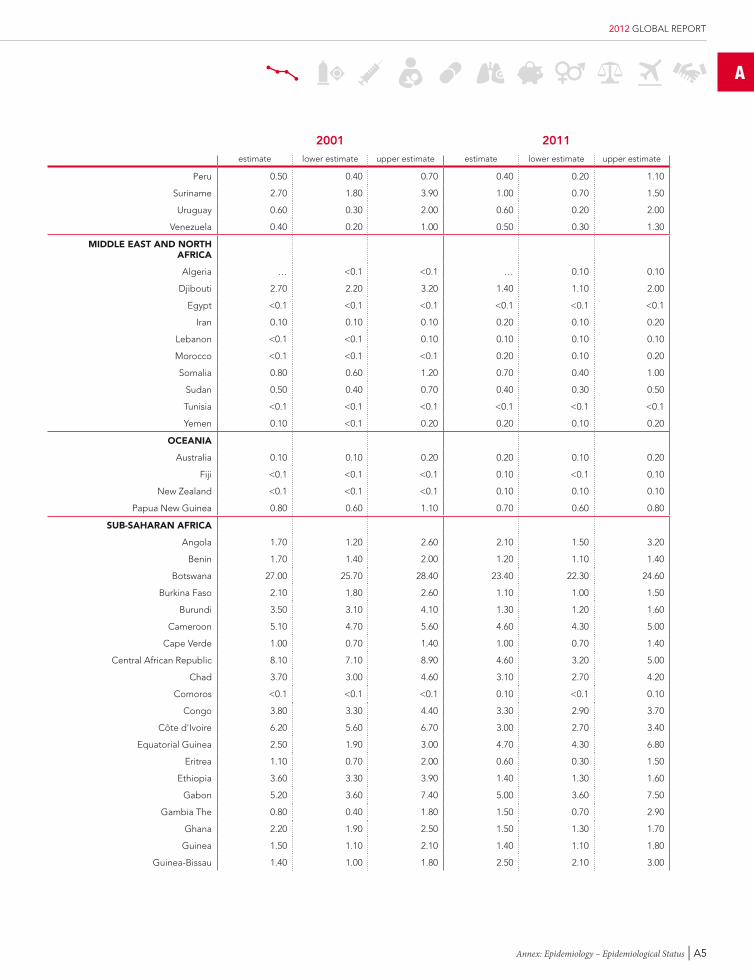
A
Annex: Epidemiology – Epidemiological Status | A5
2012 GLOBAL REPORT
2001 2011estimate lower estimate upper estimate estimate lower estimate upper estimate
Peru 0.50 0.40 0.70 0.40 0.20 1.10
Suriname 2.70 1.80 3.90 1.00 0.70 1.50
Uruguay 0.60 0.30 2.00 0.60 0.20 2.00
Venezuela 0.40 0.20 1.00 0.50 0.30 1.30
middlE East and nortH africa
Algeria … <0.1 <0.1 … 0.10 0.10
Djibouti 2.70 2.20 3.20 1.40 1.10 2.00
Egypt <0.1 <0.1 <0.1 <0.1 <0.1 <0.1
Iran 0.10 0.10 0.10 0.20 0.10 0.20
Lebanon <0.1 <0.1 0.10 0.10 0.10 0.10
Morocco <0.1 <0.1 <0.1 0.20 0.10 0.20
Somalia 0.80 0.60 1.20 0.70 0.40 1.00
Sudan 0.50 0.40 0.70 0.40 0.30 0.50
Tunisia <0.1 <0.1 <0.1 <0.1 <0.1 <0.1
Yemen 0.10 <0.1 0.20 0.20 0.10 0.20
ocEania
Australia 0.10 0.10 0.20 0.20 0.10 0.20
Fiji <0.1 <0.1 <0.1 0.10 <0.1 0.10
New Zealand <0.1 <0.1 <0.1 0.10 0.10 0.10
Papua New Guinea 0.80 0.60 1.10 0.70 0.60 0.80
sub-saHaran africa
Angola 1.70 1.20 2.60 2.10 1.50 3.20
Benin 1.70 1.40 2.00 1.20 1.10 1.40
Botswana 27.00 25.70 28.40 23.40 22.30 24.60
Burkina Faso 2.10 1.80 2.60 1.10 1.00 1.50
Burundi 3.50 3.10 4.10 1.30 1.20 1.60
Cameroon 5.10 4.70 5.60 4.60 4.30 5.00
Cape Verde 1.00 0.70 1.40 1.00 0.70 1.40
Central African Republic 8.10 7.10 8.90 4.60 3.20 5.00
Chad 3.70 3.00 4.60 3.10 2.70 4.20
Comoros <0.1 <0.1 <0.1 0.10 <0.1 0.10
Congo 3.80 3.30 4.40 3.30 2.90 3.70
Côte d'Ivoire 6.20 5.60 6.70 3.00 2.70 3.40
Equatorial Guinea 2.50 1.90 3.00 4.70 4.30 6.80
Eritrea 1.10 0.70 2.00 0.60 0.30 1.50
Ethiopia 3.60 3.30 3.90 1.40 1.30 1.60
Gabon 5.20 3.60 7.40 5.00 3.60 7.50
Gambia The 0.80 0.40 1.80 1.50 0.70 2.90
Ghana 2.20 1.90 2.50 1.50 1.30 1.70
Guinea 1.50 1.10 2.10 1.40 1.10 1.80
Guinea-Bissau 1.40 1.00 1.80 2.50 2.10 3.00
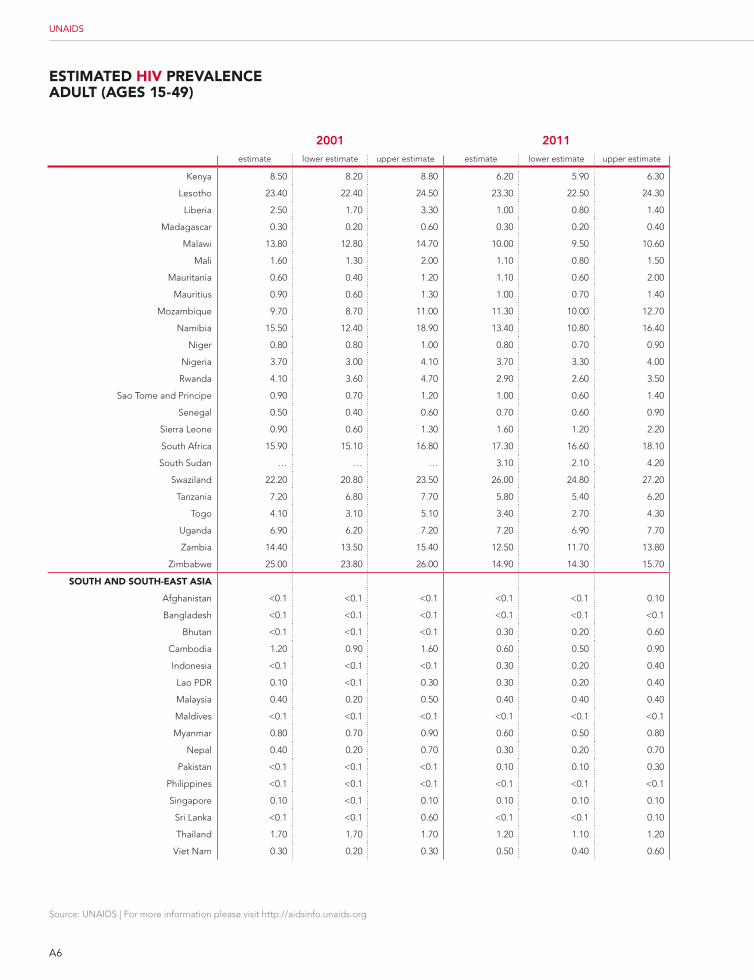
A6
Source: UNAIDS | For more information please visit http://aidsinfo.unaids.org
UNAIDS
EstimatEd HiV PrEValEncE adult (agEs 15-49)
2001 2011estimate lower estimate upper estimate estimate lower estimate upper estimate
Kenya 8.50 8.20 8.80 6.20 5.90 6.30
Lesotho 23.40 22.40 24.50 23.30 22.50 24.30
Liberia 2.50 1.70 3.30 1.00 0.80 1.40
Madagascar 0.30 0.20 0.60 0.30 0.20 0.40
Malawi 13.80 12.80 14.70 10.00 9.50 10.60
Mali 1.60 1.30 2.00 1.10 0.80 1.50
Mauritania 0.60 0.40 1.20 1.10 0.60 2.00
Mauritius 0.90 0.60 1.30 1.00 0.70 1.40
Mozambique 9.70 8.70 11.00 11.30 10.00 12.70
Namibia 15.50 12.40 18.90 13.40 10.80 16.40
Niger 0.80 0.80 1.00 0.80 0.70 0.90
Nigeria 3.70 3.00 4.10 3.70 3.30 4.00
Rwanda 4.10 3.60 4.70 2.90 2.60 3.50
Sao Tome and Principe 0.90 0.70 1.20 1.00 0.60 1.40
Senegal 0.50 0.40 0.60 0.70 0.60 0.90
Sierra Leone 0.90 0.60 1.30 1.60 1.20 2.20
South Africa 15.90 15.10 16.80 17.30 16.60 18.10
South Sudan … … … 3.10 2.10 4.20
Swaziland 22.20 20.80 23.50 26.00 24.80 27.20
Tanzania 7.20 6.80 7.70 5.80 5.40 6.20
Togo 4.10 3.10 5.10 3.40 2.70 4.30
Uganda 6.90 6.20 7.20 7.20 6.90 7.70
Zambia 14.40 13.50 15.40 12.50 11.70 13.80
Zimbabwe 25.00 23.80 26.00 14.90 14.30 15.70
soutH and soutH-East asia
Afghanistan <0.1 <0.1 <0.1 <0.1 <0.1 0.10
Bangladesh <0.1 <0.1 <0.1 <0.1 <0.1 <0.1
Bhutan <0.1 <0.1 <0.1 0.30 0.20 0.60
Cambodia 1.20 0.90 1.60 0.60 0.50 0.90
Indonesia <0.1 <0.1 <0.1 0.30 0.20 0.40
Lao PDR 0.10 <0.1 0.30 0.30 0.20 0.40
Malaysia 0.40 0.20 0.50 0.40 0.40 0.40
Maldives <0.1 <0.1 <0.1 <0.1 <0.1 <0.1
Myanmar 0.80 0.70 0.90 0.60 0.50 0.80
Nepal 0.40 0.20 0.70 0.30 0.20 0.70
Pakistan <0.1 <0.1 <0.1 0.10 0.10 0.30
Philippines <0.1 <0.1 <0.1 <0.1 <0.1 <0.1
Singapore 0.10 <0.1 0.10 0.10 0.10 0.10
Sri Lanka <0.1 <0.1 0.60 <0.1 <0.1 0.10
Thailand 1.70 1.70 1.70 1.20 1.10 1.20
Viet Nam 0.30 0.20 0.30 0.50 0.40 0.60
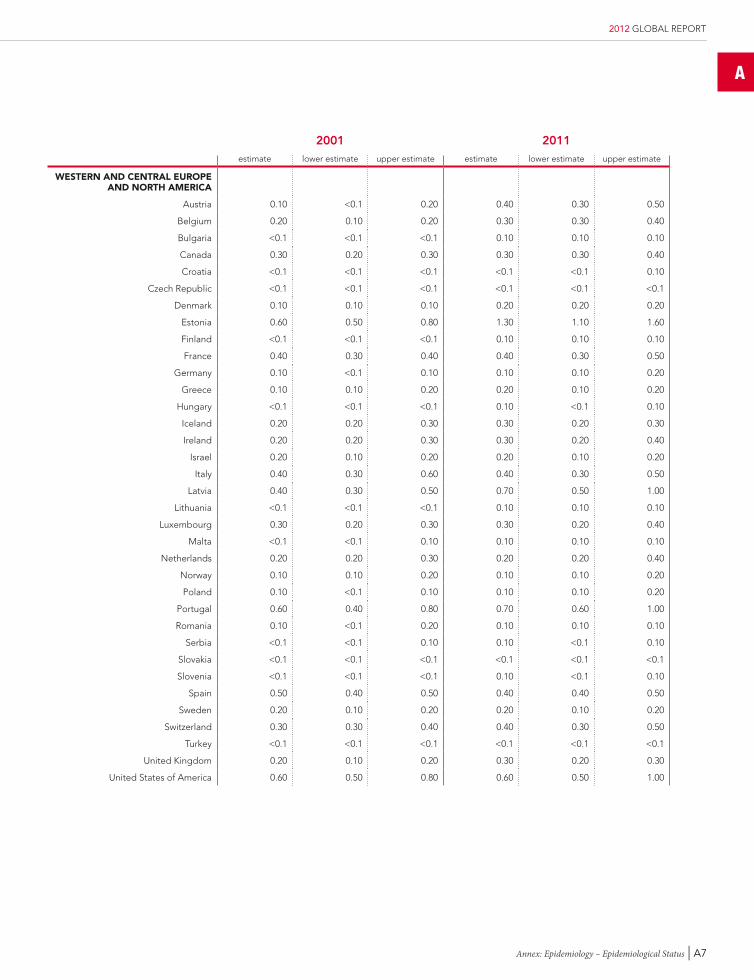
A
Annex: Epidemiology – Epidemiological Status | A7
2012 GLOBAL REPORT
2001 2011estimate lower estimate upper estimate estimate lower estimate upper estimate
WEstErn and cEntral EuroPE and nortH amErica
Austria 0.10 <0.1 0.20 0.40 0.30 0.50
Belgium 0.20 0.10 0.20 0.30 0.30 0.40
Bulgaria <0.1 <0.1 <0.1 0.10 0.10 0.10
Canada 0.30 0.20 0.30 0.30 0.30 0.40
Croatia <0.1 <0.1 <0.1 <0.1 <0.1 0.10
Czech Republic <0.1 <0.1 <0.1 <0.1 <0.1 <0.1
Denmark 0.10 0.10 0.10 0.20 0.20 0.20
Estonia 0.60 0.50 0.80 1.30 1.10 1.60
Finland <0.1 <0.1 <0.1 0.10 0.10 0.10
France 0.40 0.30 0.40 0.40 0.30 0.50
Germany 0.10 <0.1 0.10 0.10 0.10 0.20
Greece 0.10 0.10 0.20 0.20 0.10 0.20
Hungary <0.1 <0.1 <0.1 0.10 <0.1 0.10
Iceland 0.20 0.20 0.30 0.30 0.20 0.30
Ireland 0.20 0.20 0.30 0.30 0.20 0.40
Israel 0.20 0.10 0.20 0.20 0.10 0.20
Italy 0.40 0.30 0.60 0.40 0.30 0.50
Latvia 0.40 0.30 0.50 0.70 0.50 1.00
Lithuania <0.1 <0.1 <0.1 0.10 0.10 0.10
Luxembourg 0.30 0.20 0.30 0.30 0.20 0.40
Malta <0.1 <0.1 0.10 0.10 0.10 0.10
Netherlands 0.20 0.20 0.30 0.20 0.20 0.40
Norway 0.10 0.10 0.20 0.10 0.10 0.20
Poland 0.10 <0.1 0.10 0.10 0.10 0.20
Portugal 0.60 0.40 0.80 0.70 0.60 1.00
Romania 0.10 <0.1 0.20 0.10 0.10 0.10
Serbia <0.1 <0.1 0.10 0.10 <0.1 0.10
Slovakia <0.1 <0.1 <0.1 <0.1 <0.1 <0.1
Slovenia <0.1 <0.1 <0.1 0.10 <0.1 0.10
Spain 0.50 0.40 0.50 0.40 0.40 0.50
Sweden 0.20 0.10 0.20 0.20 0.10 0.20
Switzerland 0.30 0.30 0.40 0.40 0.30 0.50
Turkey <0.1 <0.1 <0.1 <0.1 <0.1 <0.1
United Kingdom 0.20 0.10 0.20 0.30 0.20 0.30
United States of America 0.60 0.50 0.80 0.60 0.50 1.00
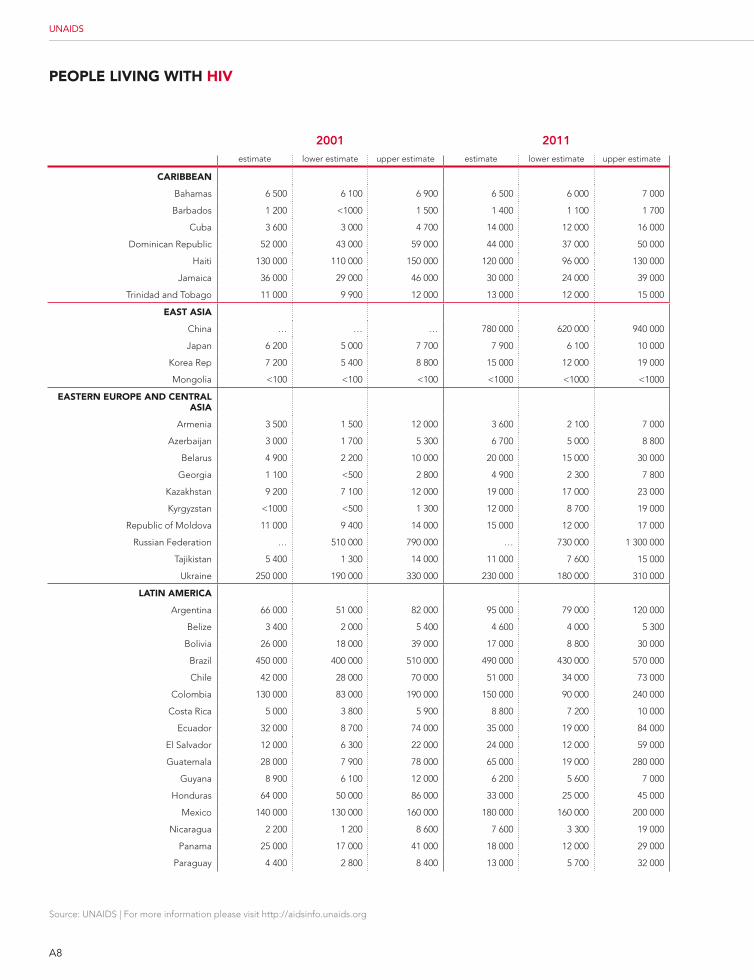
A8
Source: UNAIDS | For more information please visit http://aidsinfo.unaids.org
UNAIDS
PEoPlE liVing WitH HiV
2001 2011estimate lower estimate upper estimate estimate lower estimate upper estimate
caribbEan
Bahamas 6 500 6 100 6 900 6 500 6 000 7 000
Barbados 1 200 <1000 1 500 1 400 1 100 1 700
Cuba 3 600 3 000 4 700 14 000 12 000 16 000
Dominican Republic 52 000 43 000 59 000 44 000 37 000 50 000
Haiti 130 000 110 000 150 000 120 000 96 000 130 000
Jamaica 36 000 29 000 46 000 30 000 24 000 39 000
Trinidad and Tobago 11 000 9 900 12 000 13 000 12 000 15 000
East asia
China … … … 780 000 620 000 940 000
Japan 6 200 5 000 7 700 7 900 6 100 10 000
Korea Rep 7 200 5 400 8 800 15 000 12 000 19 000
Mongolia <100 <100 <100 <1000 <1000 <1000
EastErn EuroPE and cEntral asia
Armenia 3 500 1 500 12 000 3 600 2 100 7 000
Azerbaijan 3 000 1 700 5 300 6 700 5 000 8 800
Belarus 4 900 2 200 10 000 20 000 15 000 30 000
Georgia 1 100 <500 2 800 4 900 2 300 7 800
Kazakhstan 9 200 7 100 12 000 19 000 17 000 23 000
Kyrgyzstan <1000 <500 1 300 12 000 8 700 19 000
Republic of Moldova 11 000 9 400 14 000 15 000 12 000 17 000
Russian Federation … 510 000 790 000 … 730 000 1 300 000
Tajikistan 5 400 1 300 14 000 11 000 7 600 15 000
Ukraine 250 000 190 000 330 000 230 000 180 000 310 000
latin amErica
Argentina 66 000 51 000 82 000 95 000 79 000 120 000
Belize 3 400 2 000 5 400 4 600 4 000 5 300
Bolivia 26 000 18 000 39 000 17 000 8 800 30 000
Brazil 450 000 400 000 510 000 490 000 430 000 570 000
Chile 42 000 28 000 70 000 51 000 34 000 73 000
Colombia 130 000 83 000 190 000 150 000 90 000 240 000
Costa Rica 5 000 3 800 5 900 8 800 7 200 10 000
Ecuador 32 000 8 700 74 000 35 000 19 000 84 000
El Salvador 12 000 6 300 22 000 24 000 12 000 59 000
Guatemala 28 000 7 900 78 000 65 000 19 000 280 000
Guyana 8 900 6 100 12 000 6 200 5 600 7 000
Honduras 64 000 50 000 86 000 33 000 25 000 45 000
Mexico 140 000 130 000 160 000 180 000 160 000 200 000
Nicaragua 2 200 1 200 8 600 7 600 3 300 19 000
Panama 25 000 17 000 41 000 18 000 12 000 29 000
Paraguay 4 400 2 800 8 400 13 000 5 700 32 000

A
Annex: Epidemiology – Epidemiological Status | A9
2012 GLOBAL REPORT
2001 2011estimate lower estimate upper estimate estimate lower estimate upper estimate
Peru 79 000 56 000 110 000 74 000 38 000 200 000
Suriname 7 900 5 400 12 000 3 400 2 400 5 400
Uruguay 11 000 5 100 33 000 12 000 6 000 33 000
Venezuela 58 000 26 000 150 000 99 000 51 000 230 000
middlE East and nortH africa
Algeria … 5 000 9 100 … 13 000 28 000
Djibouti 12 000 9 700 15 000 9 200 7 100 12 000
Egypt 9 100 4 000 22 000 9 500 5 600 18 000
Iran 56 000 48 000 65 000 96 000 80 000 120 000
Lebanon 1 500 <1000 2 700 2 900 1 900 4 000
Morocco 12 000 8 200 15 000 32 000 21 000 46 000
Somalia 34 000 24 000 49 000 35 000 23 000 52 000
Sudan 69 000 53 000 87 000 69 000 56 000 84 000
Tunisia <1000 <500 <1000 1 700 1 500 1 900
Yemen 10 000 7 000 15 000 22 000 19 000 25 000
ocEania
Australia 13 000 11 000 16 000 22 000 18 000 27 000
Fiji <100 <100 <100 <500 <200 <500
New Zealand 1 600 1 400 2 000 2 600 2 200 3 400
Papua New Guinea 24 000 17 000 33 000 28 000 24 000 33 000
sub-saHaran africa
Angola 130 000 92 000 200 000 230 000 160 000 340 000
Benin 66 000 52 000 79 000 64 000 56 000 73 000
Botswana 270 000 250 000 290 000 300 000 280 000 310 000
Burkina Faso 150 000 130 000 190 000 120 000 100 000 150 000
Burundi 130 000 120 000 150 000 80 000 72 000 93 000
Cameroon 450 000 410 000 500 000 550 000 510 000 600 000
Cape Verde 2 700 1 900 3 800 3 300 2 400 4 700
Central African Republic 170 000 140 000 190 000 130 000 100 000 130 000
Chad 170 000 140 000 220 000 210 000 180 000 280 000
Comoros <100 <100 <100 <500 <500 <500
Congo 74 000 65 000 85 000 83 000 74 000 92 000
Côte d'Ivoire 560 000 510 000 620 000 360 000 320 000 400 000
Equatorial Guinea 7 900 5 900 10 000 20 000 17 000 29 000
Eritrea 23 000 14 000 45 000 23 000 13 000 52 000
Ethiopia 1 300 000 1 200 000 1 400 000 790 000 720 000 870 000
Gabon 35 000 24 000 49 000 46 000 34 000 67 000
Gambia The 5 700 2 500 12 000 14 000 7 300 28 000
Ghana 250 000 210 000 280 000 230 000 200 000 260 000
Guinea 72 000 50 000 100 000 85 000 68 000 100 000
Guinea-Bissau 9 800 7 100 13 000 24 000 20 000 28 000
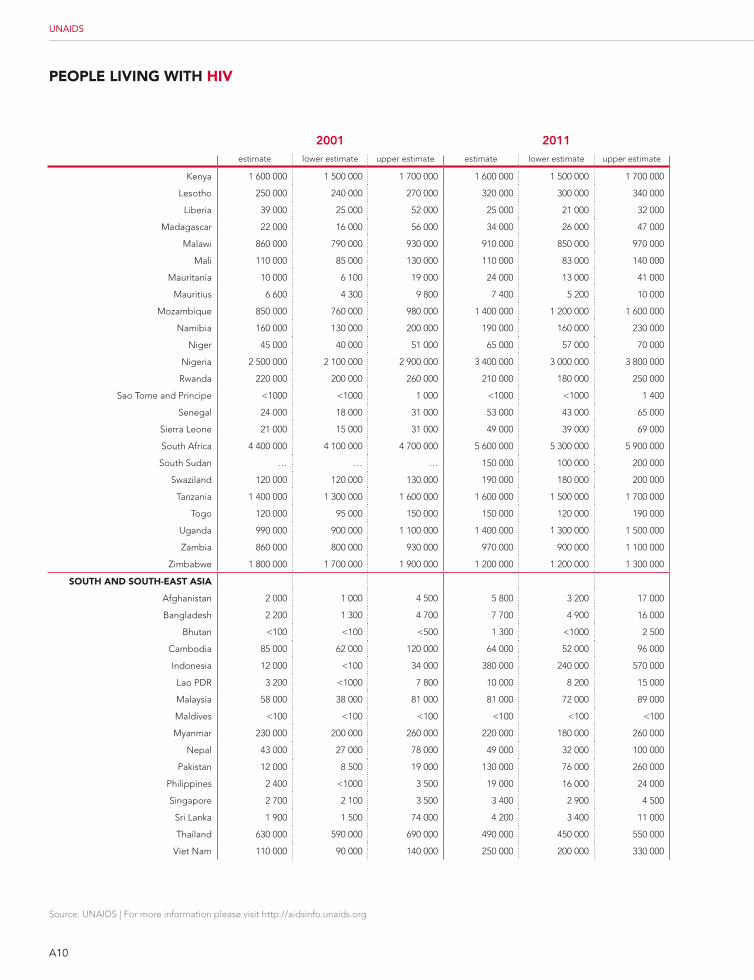
A10
Source: UNAIDS | For more information please visit http://aidsinfo.unaids.org
UNAIDS
PEoPlE liVing WitH HiV
2001 2011estimate lower estimate upper estimate estimate lower estimate upper estimate
Kenya 1 600 000 1 500 000 1 700 000 1 600 000 1 500 000 1 700 000
Lesotho 250 000 240 000 270 000 320 000 300 000 340 000
Liberia 39 000 25 000 52 000 25 000 21 000 32 000
Madagascar 22 000 16 000 56 000 34 000 26 000 47 000
Malawi 860 000 790 000 930 000 910 000 850 000 970 000
Mali 110 000 85 000 130 000 110 000 83 000 140 000
Mauritania 10 000 6 100 19 000 24 000 13 000 41 000
Mauritius 6 600 4 300 9 800 7 400 5 200 10 000
Mozambique 850 000 760 000 980 000 1 400 000 1 200 000 1 600 000
Namibia 160 000 130 000 200 000 190 000 160 000 230 000
Niger 45 000 40 000 51 000 65 000 57 000 70 000
Nigeria 2 500 000 2 100 000 2 900 000 3 400 000 3 000 000 3 800 000
Rwanda 220 000 200 000 260 000 210 000 180 000 250 000
Sao Tome and Principe <1000 <1000 1 000 <1000 <1000 1 400
Senegal 24 000 18 000 31 000 53 000 43 000 65 000
Sierra Leone 21 000 15 000 31 000 49 000 39 000 69 000
South Africa 4 400 000 4 100 000 4 700 000 5 600 000 5 300 000 5 900 000
South Sudan … … … 150 000 100 000 200 000
Swaziland 120 000 120 000 130 000 190 000 180 000 200 000
Tanzania 1 400 000 1 300 000 1 600 000 1 600 000 1 500 000 1 700 000
Togo 120 000 95 000 150 000 150 000 120 000 190 000
Uganda 990 000 900 000 1 100 000 1 400 000 1 300 000 1 500 000
Zambia 860 000 800 000 930 000 970 000 900 000 1 100 000
Zimbabwe 1 800 000 1 700 000 1 900 000 1 200 000 1 200 000 1 300 000
soutH and soutH-East asia
Afghanistan 2 000 1 000 4 500 5 800 3 200 17 000
Bangladesh 2 200 1 300 4 700 7 700 4 900 16 000
Bhutan <100 <100 <500 1 300 <1000 2 500
Cambodia 85 000 62 000 120 000 64 000 52 000 96 000
Indonesia 12 000 <100 34 000 380 000 240 000 570 000
Lao PDR 3 200 <1000 7 800 10 000 8 200 15 000
Malaysia 58 000 38 000 81 000 81 000 72 000 89 000
Maldives <100 <100 <100 <100 <100 <100
Myanmar 230 000 200 000 260 000 220 000 180 000 260 000
Nepal 43 000 27 000 78 000 49 000 32 000 100 000
Pakistan 12 000 8 500 19 000 130 000 76 000 260 000
Philippines 2 400 <1000 3 500 19 000 16 000 24 000
Singapore 2 700 2 100 3 500 3 400 2 900 4 500
Sri Lanka 1 900 1 500 74 000 4 200 3 400 11 000
Thailand 630 000 590 000 690 000 490 000 450 000 550 000
Viet Nam 110 000 90 000 140 000 250 000 200 000 330 000

A
Annex: Epidemiology – Epidemiological Status | A11
2012 GLOBAL REPORT
2001 2011estimate lower estimate upper estimate estimate lower estimate upper estimate
WEstErn and cEntral EuroPE and nortH amErica
Austria 5 500 4 000 7 300 18 000 13 000 24 000
Belgium 9 300 7 100 12 000 20 000 16 000 26 000
Bulgaria 1 700 1 300 2 300 3 900 2 700 5 700
Canada 48 000 40 000 57 000 71 000 63 000 89 000
Croatia <1000 <1000 <1000 1 200 <1000 1 500
Czech Republic 1 400 1 200 1 600 2 100 1 800 2 300
Denmark 3 500 3 000 4 000 6 100 5 300 7 200
Estonia 4 700 3 800 5 700 9 900 8 200 12 000
Finland 1 700 1 500 2 000 2 900 2 500 3 500
France 120 000 100 000 140 000 160 000 130 000 200 000
Germany 44 000 40 000 49 000 73 000 66 000 82 000
Greece 8 500 7 400 9 500 11 000 9 500 13 000
Hungary 3 400 2 600 4 400 4 100 3 100 5 200
Iceland <500 <500 <500 <1000 <500 <1000
Ireland 4 800 3 700 6 300 7 800 6 300 9 700
Israel 5 500 4 200 7 400 8 500 6 600 11 000
Italy 130 000 100 000 170 000 150 000 120 000 200 000
Latvia 4 900 3 700 6 500 9 100 6 500 13 000
Lithuania <1000 <1000 1 100 1 500 1 100 2 100
Luxembourg <1000 <500 <1000 <1000 <1000 1 100
Malta <500 <200 <500 <500 <500 <500
Netherlands 19 000 15 000 25 000 25 000 20 000 36 000
Norway 3 200 2 500 4 400 4 500 3 500 6 200
Poland 24 000 18 000 32 000 35 000 28 000 46 000
Portugal 34 000 26 000 45 000 48 000 37 000 62 000
Romania 16 000 12 000 20 000 16 000 13 000 20 000
Serbia 3 100 <500 4 300 3 500 2 400 5 100
Slovakia <200 <200 <500 <500 <500 <1000
Slovenia <500 <200 <500 <1000 <500 <1000
Spain 120 000 110 000 140 000 150 000 130 000 160 000
Sweden 6 900 5 400 10 000 9 100 7 100 13 000
Switzerland 14 000 11 000 18 000 20 000 16 000 27 000
Turkey 1 800 1 400 2 400 5 500 4 000 7 600
United Kingdom 46 000 37 000 57 000 94 000 74 000 120 000
United States of America 1 000 000 790 000 1 300 000 1 300 000 1 000 000 2 000 000
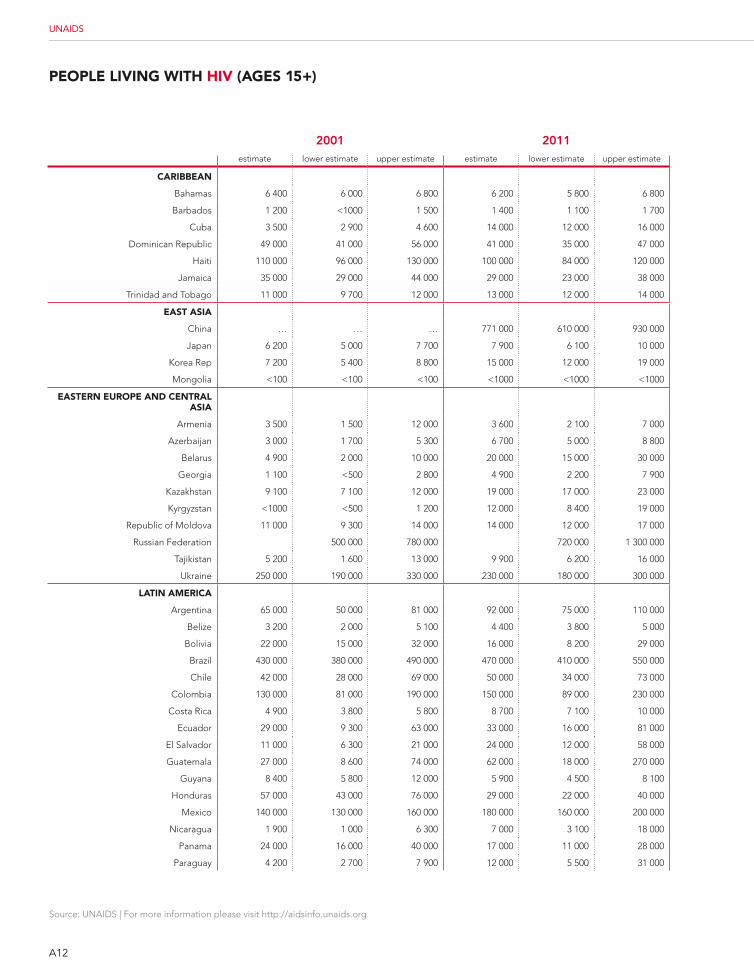
A12
Source: UNAIDS | For more information please visit http://aidsinfo.unaids.org
UNAIDS
PEoPlE liVing WitH HiV (agEs 15+)
2001 2011estimate lower estimate upper estimate estimate lower estimate upper estimate
caribbEan
Bahamas 6 400 6 000 6 800 6 200 5 800 6 800
Barbados 1 200 <1000 1 500 1 400 1 100 1 700
Cuba 3 500 2 900 4 600 14 000 12 000 16 000
Dominican Republic 49 000 41 000 56 000 41 000 35 000 47 000
Haiti 110 000 96 000 130 000 100 000 84 000 120 000
Jamaica 35 000 29 000 44 000 29 000 23 000 38 000
Trinidad and Tobago 11 000 9 700 12 000 13 000 12 000 14 000
East asia
China … … … 771 000 610 000 930 000
Japan 6 200 5 000 7 700 7 900 6 100 10 000
Korea Rep 7 200 5 400 8 800 15 000 12 000 19 000
Mongolia <100 <100 <100 <1000 <1000 <1000
EastErn EuroPE and cEntral asia
Armenia 3 500 1 500 12 000 3 600 2 100 7 000
Azerbaijan 3 000 1 700 5 300 6 700 5 000 8 800
Belarus 4 900 2 000 10 000 20 000 15 000 30 000
Georgia 1 100 <500 2 800 4 900 2 200 7 900
Kazakhstan 9 100 7 100 12 000 19 000 17 000 23 000
Kyrgyzstan <1000 <500 1 200 12 000 8 400 19 000
Republic of Moldova 11 000 9 300 14 000 14 000 12 000 17 000
Russian Federation 500 000 780 000 720 000 1 300 000
Tajikistan 5 200 1 600 13 000 9 900 6 200 16 000
Ukraine 250 000 190 000 330 000 230 000 180 000 300 000
latin amErica
Argentina 65 000 50 000 81 000 92 000 75 000 110 000
Belize 3 200 2 000 5 100 4 400 3 800 5 000
Bolivia 22 000 15 000 32 000 16 000 8 200 29 000
Brazil 430 000 380 000 490 000 470 000 410 000 550 000
Chile 42 000 28 000 69 000 50 000 34 000 73 000
Colombia 130 000 81 000 190 000 150 000 89 000 230 000
Costa Rica 4 900 3 800 5 800 8 700 7 100 10 000
Ecuador 29 000 9 300 63 000 33 000 16 000 81 000
El Salvador 11 000 6 300 21 000 24 000 12 000 58 000
Guatemala 27 000 8 600 74 000 62 000 18 000 270 000
Guyana 8 400 5 800 12 000 5 900 4 500 8 100
Honduras 57 000 43 000 76 000 29 000 22 000 40 000
Mexico 140 000 130 000 160 000 180 000 160 000 200 000
Nicaragua 1 900 1 000 6 300 7 000 3 100 18 000
Panama 24 000 16 000 40 000 17 000 11 000 28 000
Paraguay 4 200 2 700 7 900 12 000 5 500 31 000
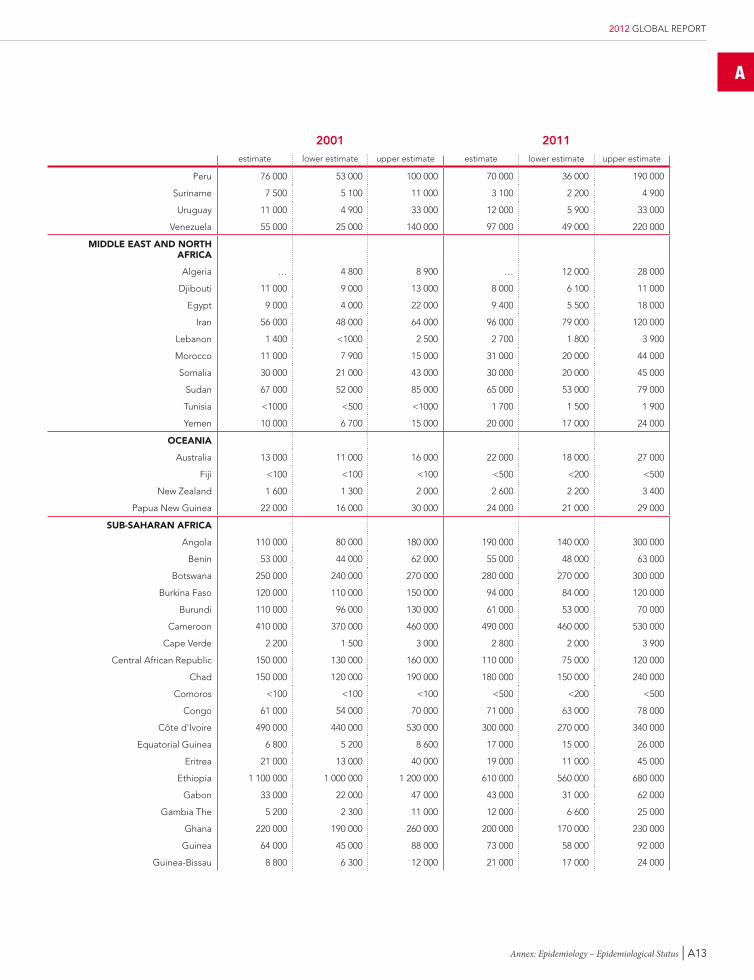
A
Annex: Epidemiology – Epidemiological Status | A13
2012 GLOBAL REPORT
2001 2011estimate lower estimate upper estimate estimate lower estimate upper estimate
Peru 76 000 53 000 100 000 70 000 36 000 190 000
Suriname 7 500 5 100 11 000 3 100 2 200 4 900
Uruguay 11 000 4 900 33 000 12 000 5 900 33 000
Venezuela 55 000 25 000 140 000 97 000 49 000 220 000
middlE East and nortH africa
Algeria … 4 800 8 900 … 12 000 28 000
Djibouti 11 000 9 000 13 000 8 000 6 100 11 000
Egypt 9 000 4 000 22 000 9 400 5 500 18 000
Iran 56 000 48 000 64 000 96 000 79 000 120 000
Lebanon 1 400 <1000 2 500 2 700 1 800 3 900
Morocco 11 000 7 900 15 000 31 000 20 000 44 000
Somalia 30 000 21 000 43 000 30 000 20 000 45 000
Sudan 67 000 52 000 85 000 65 000 53 000 79 000
Tunisia <1000 <500 <1000 1 700 1 500 1 900
Yemen 10 000 6 700 15 000 20 000 17 000 24 000
ocEania
Australia 13 000 11 000 16 000 22 000 18 000 27 000
Fiji <100 <100 <100 <500 <200 <500
New Zealand 1 600 1 300 2 000 2 600 2 200 3 400
Papua New Guinea 22 000 16 000 30 000 24 000 21 000 29 000
sub-saHaran africa
Angola 110 000 80 000 180 000 190 000 140 000 300 000
Benin 53 000 44 000 62 000 55 000 48 000 63 000
Botswana 250 000 240 000 270 000 280 000 270 000 300 000
Burkina Faso 120 000 110 000 150 000 94 000 84 000 120 000
Burundi 110 000 96 000 130 000 61 000 53 000 70 000
Cameroon 410 000 370 000 460 000 490 000 460 000 530 000
Cape Verde 2 200 1 500 3 000 2 800 2 000 3 900
Central African Republic 150 000 130 000 160 000 110 000 75 000 120 000
Chad 150 000 120 000 190 000 180 000 150 000 240 000
Comoros <100 <100 <100 <500 <200 <500
Congo 61 000 54 000 70 000 71 000 63 000 78 000
Côte d'Ivoire 490 000 440 000 530 000 300 000 270 000 340 000
Equatorial Guinea 6 800 5 200 8 600 17 000 15 000 26 000
Eritrea 21 000 13 000 40 000 19 000 11 000 45 000
Ethiopia 1 100 000 1 000 000 1 200 000 610 000 560 000 680 000
Gabon 33 000 22 000 47 000 43 000 31 000 62 000
Gambia The 5 200 2 300 11 000 12 000 6 600 25 000
Ghana 220 000 190 000 260 000 200 000 170 000 230 000
Guinea 64 000 45 000 88 000 73 000 58 000 92 000
Guinea-Bissau 8 800 6 300 12 000 21 000 17 000 24 000
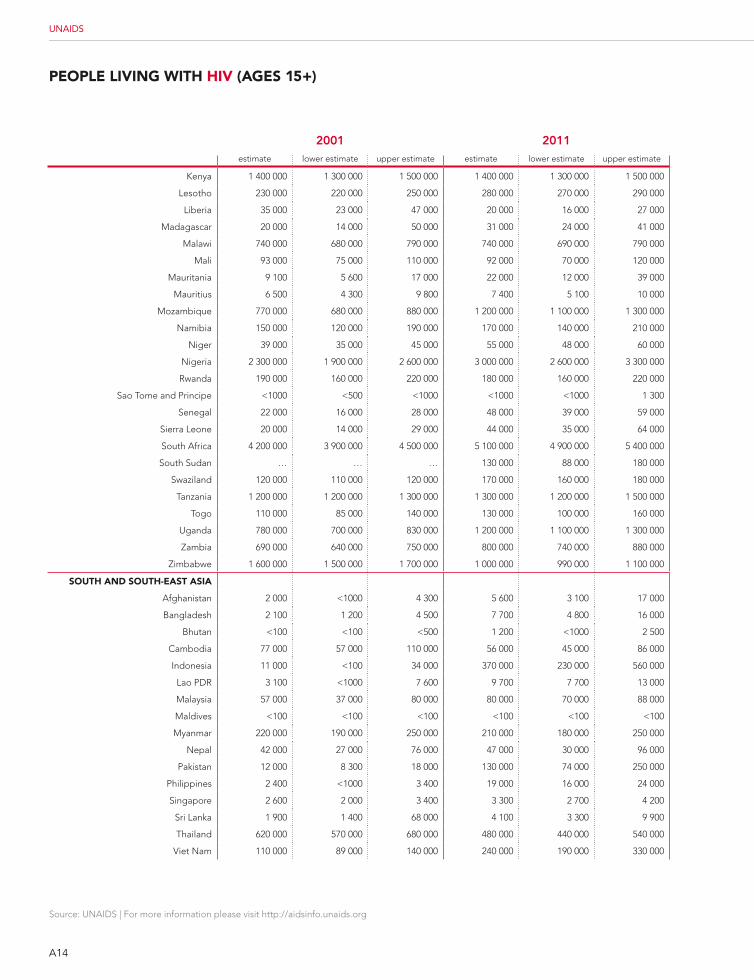
A14
Source: UNAIDS | For more information please visit http://aidsinfo.unaids.org
UNAIDS
PEoPlE liVing WitH HiV (agEs 15+)
2001 2011estimate lower estimate upper estimate estimate lower estimate upper estimate
Kenya 1 400 000 1 300 000 1 500 000 1 400 000 1 300 000 1 500 000
Lesotho 230 000 220 000 250 000 280 000 270 000 290 000
Liberia 35 000 23 000 47 000 20 000 16 000 27 000
Madagascar 20 000 14 000 50 000 31 000 24 000 41 000
Malawi 740 000 680 000 790 000 740 000 690 000 790 000
Mali 93 000 75 000 110 000 92 000 70 000 120 000
Mauritania 9 100 5 600 17 000 22 000 12 000 39 000
Mauritius 6 500 4 300 9 800 7 400 5 100 10 000
Mozambique 770 000 680 000 880 000 1 200 000 1 100 000 1 300 000
Namibia 150 000 120 000 190 000 170 000 140 000 210 000
Niger 39 000 35 000 45 000 55 000 48 000 60 000
Nigeria 2 300 000 1 900 000 2 600 000 3 000 000 2 600 000 3 300 000
Rwanda 190 000 160 000 220 000 180 000 160 000 220 000
Sao Tome and Principe <1000 <500 <1000 <1000 <1000 1 300
Senegal 22 000 16 000 28 000 48 000 39 000 59 000
Sierra Leone 20 000 14 000 29 000 44 000 35 000 64 000
South Africa 4 200 000 3 900 000 4 500 000 5 100 000 4 900 000 5 400 000
South Sudan … … … 130 000 88 000 180 000
Swaziland 120 000 110 000 120 000 170 000 160 000 180 000
Tanzania 1 200 000 1 200 000 1 300 000 1 300 000 1 200 000 1 500 000
Togo 110 000 85 000 140 000 130 000 100 000 160 000
Uganda 780 000 700 000 830 000 1 200 000 1 100 000 1 300 000
Zambia 690 000 640 000 750 000 800 000 740 000 880 000
Zimbabwe 1 600 000 1 500 000 1 700 000 1 000 000 990 000 1 100 000
soutH and soutH-East asia
Afghanistan 2 000 <1000 4 300 5 600 3 100 17 000
Bangladesh 2 100 1 200 4 500 7 700 4 800 16 000
Bhutan <100 <100 <500 1 200 <1000 2 500
Cambodia 77 000 57 000 110 000 56 000 45 000 86 000
Indonesia 11 000 <100 34 000 370 000 230 000 560 000
Lao PDR 3 100 <1000 7 600 9 700 7 700 13 000
Malaysia 57 000 37 000 80 000 80 000 70 000 88 000
Maldives <100 <100 <100 <100 <100 <100
Myanmar 220 000 190 000 250 000 210 000 180 000 250 000
Nepal 42 000 27 000 76 000 47 000 30 000 96 000
Pakistan 12 000 8 300 18 000 130 000 74 000 250 000
Philippines 2 400 <1000 3 400 19 000 16 000 24 000
Singapore 2 600 2 000 3 400 3 300 2 700 4 200
Sri Lanka 1 900 1 400 68 000 4 100 3 300 9 900
Thailand 620 000 570 000 680 000 480 000 440 000 540 000
Viet Nam 110 000 89 000 140 000 240 000 190 000 330 000
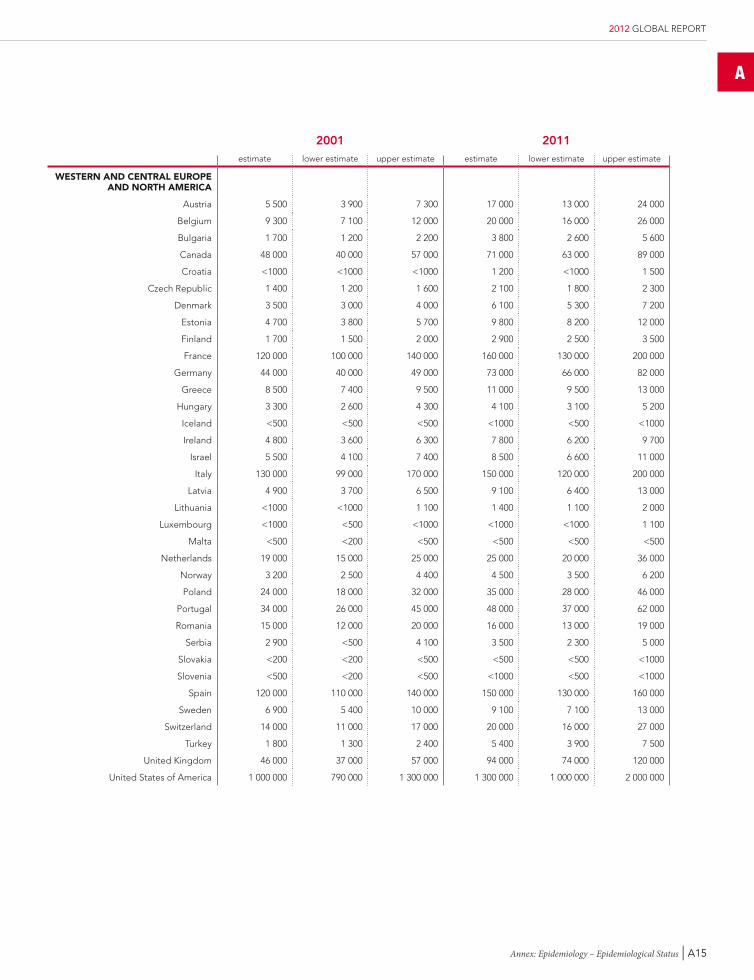
A
Annex: Epidemiology – Epidemiological Status | A15
2012 GLOBAL REPORT
2001 2011estimate lower estimate upper estimate estimate lower estimate upper estimate
WEstErn and cEntral EuroPE and nortH amErica
Austria 5 500 3 900 7 300 17 000 13 000 24 000
Belgium 9 300 7 100 12 000 20 000 16 000 26 000
Bulgaria 1 700 1 200 2 200 3 800 2 600 5 600
Canada 48 000 40 000 57 000 71 000 63 000 89 000
Croatia <1000 <1000 <1000 1 200 <1000 1 500
Czech Republic 1 400 1 200 1 600 2 100 1 800 2 300
Denmark 3 500 3 000 4 000 6 100 5 300 7 200
Estonia 4 700 3 800 5 700 9 800 8 200 12 000
Finland 1 700 1 500 2 000 2 900 2 500 3 500
France 120 000 100 000 140 000 160 000 130 000 200 000
Germany 44 000 40 000 49 000 73 000 66 000 82 000
Greece 8 500 7 400 9 500 11 000 9 500 13 000
Hungary 3 300 2 600 4 300 4 100 3 100 5 200
Iceland <500 <500 <500 <1000 <500 <1000
Ireland 4 800 3 600 6 300 7 800 6 200 9 700
Israel 5 500 4 100 7 400 8 500 6 600 11 000
Italy 130 000 99 000 170 000 150 000 120 000 200 000
Latvia 4 900 3 700 6 500 9 100 6 400 13 000
Lithuania <1000 <1000 1 100 1 400 1 100 2 000
Luxembourg <1000 <500 <1000 <1000 <1000 1 100
Malta <500 <200 <500 <500 <500 <500
Netherlands 19 000 15 000 25 000 25 000 20 000 36 000
Norway 3 200 2 500 4 400 4 500 3 500 6 200
Poland 24 000 18 000 32 000 35 000 28 000 46 000
Portugal 34 000 26 000 45 000 48 000 37 000 62 000
Romania 15 000 12 000 20 000 16 000 13 000 19 000
Serbia 2 900 <500 4 100 3 500 2 300 5 000
Slovakia <200 <200 <500 <500 <500 <1000
Slovenia <500 <200 <500 <1000 <500 <1000
Spain 120 000 110 000 140 000 150 000 130 000 160 000
Sweden 6 900 5 400 10 000 9 100 7 100 13 000
Switzerland 14 000 11 000 17 000 20 000 16 000 27 000
Turkey 1 800 1 300 2 400 5 400 3 900 7 500
United Kingdom 46 000 37 000 57 000 94 000 74 000 120 000
United States of America 1 000 000 790 000 1 300 000 1 300 000 1 000 000 2 000 000
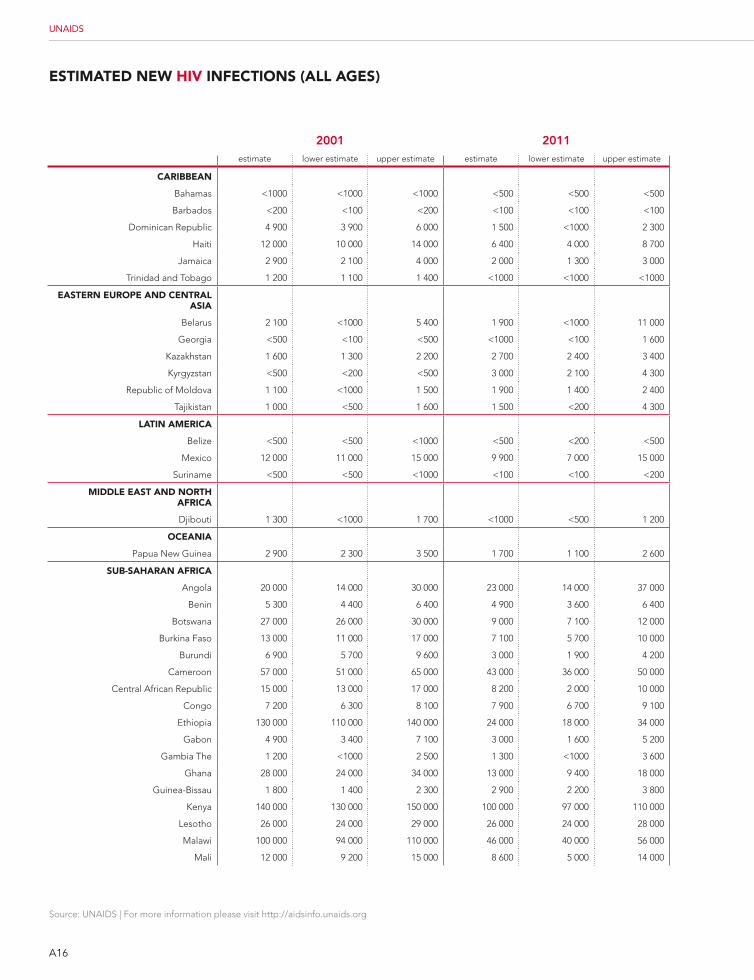
A16
Source: UNAIDS | For more information please visit http://aidsinfo.unaids.org
UNAIDS
EstimatEd nEW HiV infEctions (all agEs)
2001 2011estimate lower estimate upper estimate estimate lower estimate upper estimate
caribbEan
Bahamas <1000 <1000 <1000 <500 <500 <500
Barbados <200 <100 <200 <100 <100 <100
Dominican Republic 4 900 3 900 6 000 1 500 <1000 2 300
Haiti 12 000 10 000 14 000 6 400 4 000 8 700
Jamaica 2 900 2 100 4 000 2 000 1 300 3 000
Trinidad and Tobago 1 200 1 100 1 400 <1000 <1000 <1000
EastErn EuroPE and cEntral asia
Belarus 2 100 <1000 5 400 1 900 <1000 11 000
Georgia <500 <100 <500 <1000 <100 1 600
Kazakhstan 1 600 1 300 2 200 2 700 2 400 3 400
Kyrgyzstan <500 <200 <500 3 000 2 100 4 300
Republic of Moldova 1 100 <1000 1 500 1 900 1 400 2 400
Tajikistan 1 000 <500 1 600 1 500 <200 4 300
latin amErica
Belize <500 <500 <1000 <500 <200 <500
Mexico 12 000 11 000 15 000 9 900 7 000 15 000
Suriname <500 <500 <1000 <100 <100 <200
middlE East and nortH africa
Djibouti 1 300 <1000 1 700 <1000 <500 1 200
ocEania
Papua New Guinea 2 900 2 300 3 500 1 700 1 100 2 600
sub-saHaran africa
Angola 20 000 14 000 30 000 23 000 14 000 37 000
Benin 5 300 4 400 6 400 4 900 3 600 6 400
Botswana 27 000 26 000 30 000 9 000 7 100 12 000
Burkina Faso 13 000 11 000 17 000 7 100 5 700 10 000
Burundi 6 900 5 700 9 600 3 000 1 900 4 200
Cameroon 57 000 51 000 65 000 43 000 36 000 50 000
Central African Republic 15 000 13 000 17 000 8 200 2 000 10 000
Congo 7 200 6 300 8 100 7 900 6 700 9 100
Ethiopia 130 000 110 000 140 000 24 000 18 000 34 000
Gabon 4 900 3 400 7 100 3 000 1 600 5 200
Gambia The 1 200 <1000 2 500 1 300 <1000 3 600
Ghana 28 000 24 000 34 000 13 000 9 400 18 000
Guinea-Bissau 1 800 1 400 2 300 2 900 2 200 3 800
Kenya 140 000 130 000 150 000 100 000 97 000 110 000
Lesotho 26 000 24 000 29 000 26 000 24 000 28 000
Malawi 100 000 94 000 110 000 46 000 40 000 56 000
Mali 12 000 9 200 15 000 8 600 5 000 14 000
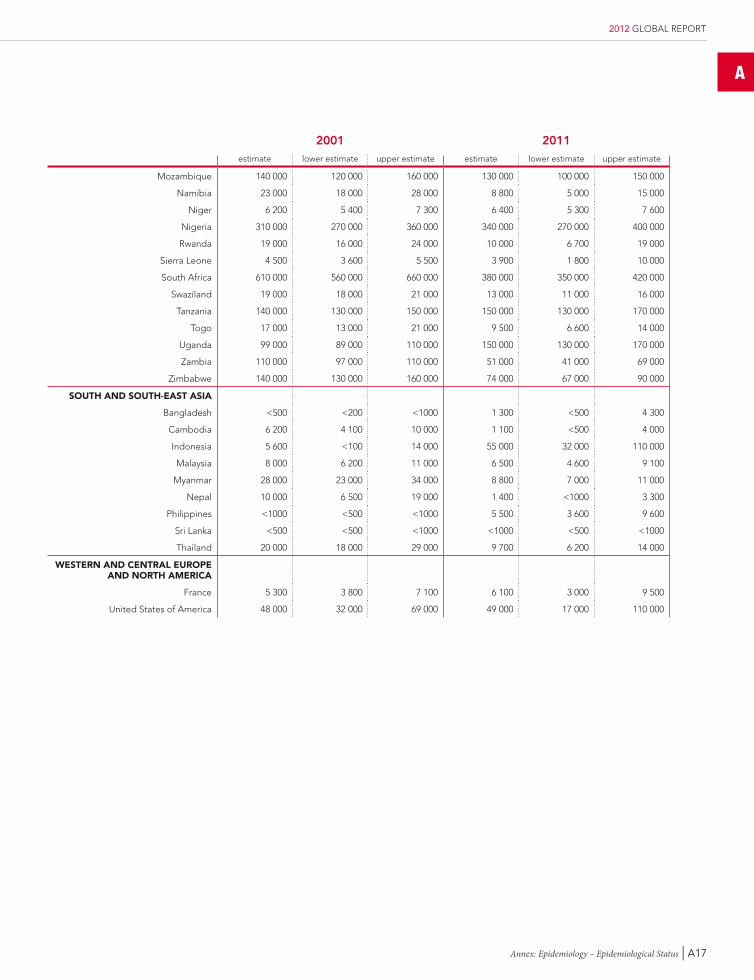
A
Annex: Epidemiology – Epidemiological Status | A17
2012 GLOBAL REPORT
2001 2011estimate lower estimate upper estimate estimate lower estimate upper estimate
Mozambique 140 000 120 000 160 000 130 000 100 000 150 000
Namibia 23 000 18 000 28 000 8 800 5 000 15 000
Niger 6 200 5 400 7 300 6 400 5 300 7 600
Nigeria 310 000 270 000 360 000 340 000 270 000 400 000
Rwanda 19 000 16 000 24 000 10 000 6 700 19 000
Sierra Leone 4 500 3 600 5 500 3 900 1 800 10 000
South Africa 610 000 560 000 660 000 380 000 350 000 420 000
Swaziland 19 000 18 000 21 000 13 000 11 000 16 000
Tanzania 140 000 130 000 150 000 150 000 130 000 170 000
Togo 17 000 13 000 21 000 9 500 6 600 14 000
Uganda 99 000 89 000 110 000 150 000 130 000 170 000
Zambia 110 000 97 000 110 000 51 000 41 000 69 000
Zimbabwe 140 000 130 000 160 000 74 000 67 000 90 000
soutH and soutH-East asia
Bangladesh <500 <200 <1000 1 300 <500 4 300
Cambodia 6 200 4 100 10 000 1 100 <500 4 000
Indonesia 5 600 <100 14 000 55 000 32 000 110 000
Malaysia 8 000 6 200 11 000 6 500 4 600 9 100
Myanmar 28 000 23 000 34 000 8 800 7 000 11 000
Nepal 10 000 6 500 19 000 1 400 <1000 3 300
Philippines <1000 <500 <1000 5 500 3 600 9 600
Sri Lanka <500 <500 <1000 <1000 <500 <1000
Thailand 20 000 18 000 29 000 9 700 6 200 14 000
WEstErn and cEntral EuroPE and nortH amErica
France 5 300 3 800 7 100 6 100 3 000 9 500
United States of America 48 000 32 000 69 000 49 000 17 000 110 000
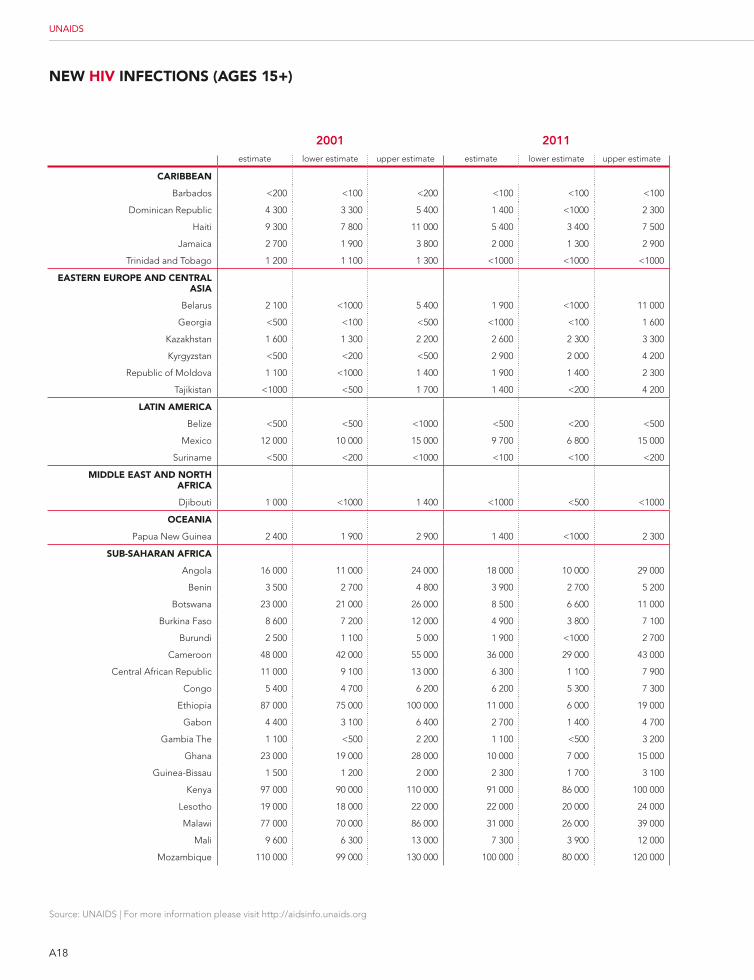
A18
Source: UNAIDS | For more information please visit http://aidsinfo.unaids.org
UNAIDS
nEW HiV infEctions (agEs 15+)
2001 2011estimate lower estimate upper estimate estimate lower estimate upper estimate
caribbEan
Barbados <200 <100 <200 <100 <100 <100
Dominican Republic 4 300 3 300 5 400 1 400 <1000 2 300
Haiti 9 300 7 800 11 000 5 400 3 400 7 500
Jamaica 2 700 1 900 3 800 2 000 1 300 2 900
Trinidad and Tobago 1 200 1 100 1 300 <1000 <1000 <1000
EastErn EuroPE and cEntral asia
Belarus 2 100 <1000 5 400 1 900 <1000 11 000
Georgia <500 <100 <500 <1000 <100 1 600
Kazakhstan 1 600 1 300 2 200 2 600 2 300 3 300
Kyrgyzstan <500 <200 <500 2 900 2 000 4 200
Republic of Moldova 1 100 <1000 1 400 1 900 1 400 2 300
Tajikistan <1000 <500 1 700 1 400 <200 4 200
latin amErica
Belize <500 <500 <1000 <500 <200 <500
Mexico 12 000 10 000 15 000 9 700 6 800 15 000
Suriname <500 <200 <1000 <100 <100 <200
middlE East and nortH africa
Djibouti 1 000 <1000 1 400 <1000 <500 <1000
ocEania
Papua New Guinea 2 400 1 900 2 900 1 400 <1000 2 300
sub-saHaran africa
Angola 16 000 11 000 24 000 18 000 10 000 29 000
Benin 3 500 2 700 4 800 3 900 2 700 5 200
Botswana 23 000 21 000 26 000 8 500 6 600 11 000
Burkina Faso 8 600 7 200 12 000 4 900 3 800 7 100
Burundi 2 500 1 100 5 000 1 900 <1000 2 700
Cameroon 48 000 42 000 55 000 36 000 29 000 43 000
Central African Republic 11 000 9 100 13 000 6 300 1 100 7 900
Congo 5 400 4 700 6 200 6 200 5 300 7 300
Ethiopia 87 000 75 000 100 000 11 000 6 000 19 000
Gabon 4 400 3 100 6 400 2 700 1 400 4 700
Gambia The 1 100 <500 2 200 1 100 <500 3 200
Ghana 23 000 19 000 28 000 10 000 7 000 15 000
Guinea-Bissau 1 500 1 200 2 000 2 300 1 700 3 100
Kenya 97 000 90 000 110 000 91 000 86 000 100 000
Lesotho 19 000 18 000 22 000 22 000 20 000 24 000
Malawi 77 000 70 000 86 000 31 000 26 000 39 000
Mali 9 600 6 300 13 000 7 300 3 900 12 000
Mozambique 110 000 99 000 130 000 100 000 80 000 120 000
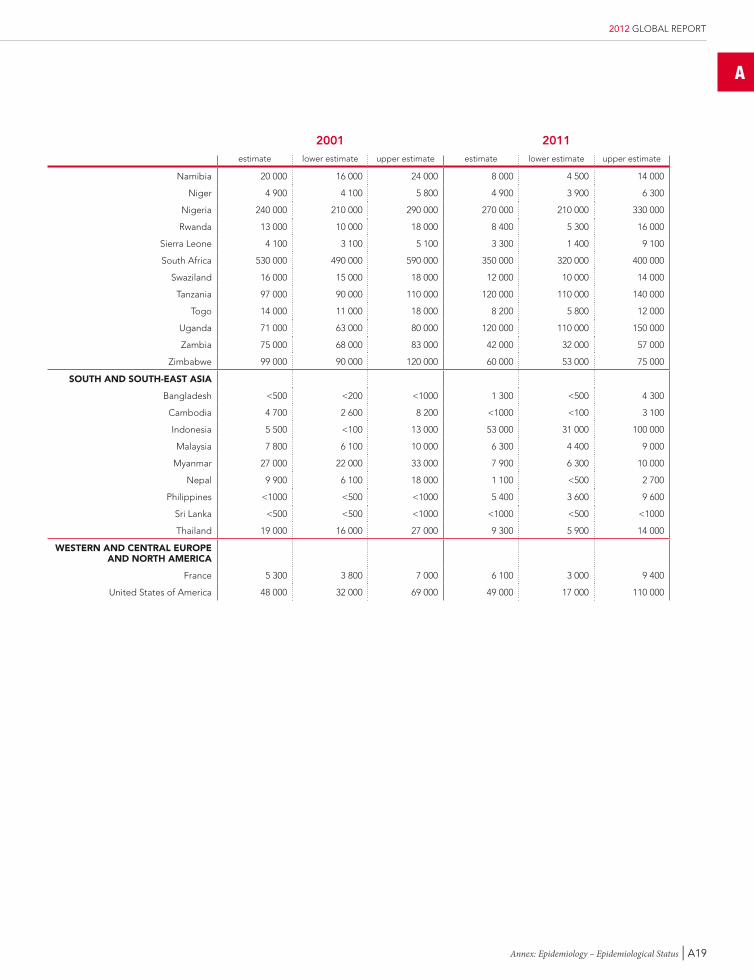
A
Annex: Epidemiology – Epidemiological Status | A19
2012 GLOBAL REPORT
2001 2011estimate lower estimate upper estimate estimate lower estimate upper estimate
Namibia 20 000 16 000 24 000 8 000 4 500 14 000
Niger 4 900 4 100 5 800 4 900 3 900 6 300
Nigeria 240 000 210 000 290 000 270 000 210 000 330 000
Rwanda 13 000 10 000 18 000 8 400 5 300 16 000
Sierra Leone 4 100 3 100 5 100 3 300 1 400 9 100
South Africa 530 000 490 000 590 000 350 000 320 000 400 000
Swaziland 16 000 15 000 18 000 12 000 10 000 14 000
Tanzania 97 000 90 000 110 000 120 000 110 000 140 000
Togo 14 000 11 000 18 000 8 200 5 800 12 000
Uganda 71 000 63 000 80 000 120 000 110 000 150 000
Zambia 75 000 68 000 83 000 42 000 32 000 57 000
Zimbabwe 99 000 90 000 120 000 60 000 53 000 75 000
soutH and soutH-East asia
Bangladesh <500 <200 <1000 1 300 <500 4 300
Cambodia 4 700 2 600 8 200 <1000 <100 3 100
Indonesia 5 500 <100 13 000 53 000 31 000 100 000
Malaysia 7 800 6 100 10 000 6 300 4 400 9 000
Myanmar 27 000 22 000 33 000 7 900 6 300 10 000
Nepal 9 900 6 100 18 000 1 100 <500 2 700
Philippines <1000 <500 <1000 5 400 3 600 9 600
Sri Lanka <500 <500 <1000 <1000 <500 <1000
Thailand 19 000 16 000 27 000 9 300 5 900 14 000
WEstErn and cEntral EuroPE and nortH amErica
France 5 300 3 800 7 000 6 100 3 000 9 400
United States of America 48 000 32 000 69 000 49 000 17 000 110 000
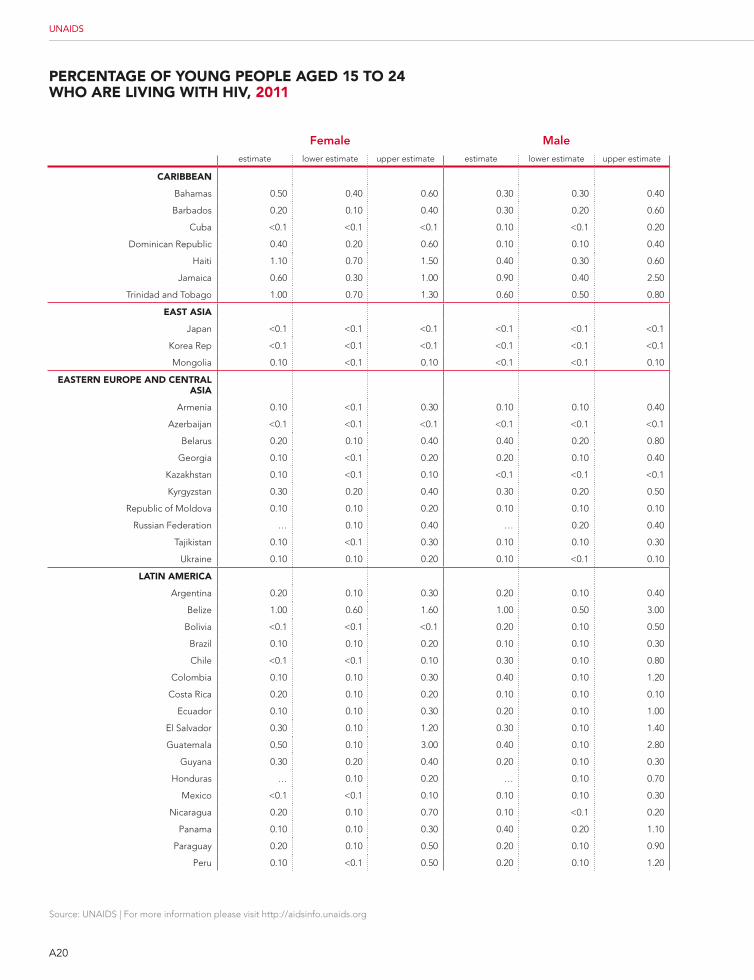
A20
Source: UNAIDS | For more information please visit http://aidsinfo.unaids.org
UNAIDS
PErcEntagE of Young PEoPlE agEd 15 to 24 WHo arE liVing WitH HiV, 2011
Female Maleestimate lower estimate upper estimate estimate lower estimate upper estimate
caribbEan
Bahamas 0.50 0.40 0.60 0.30 0.30 0.40
Barbados 0.20 0.10 0.40 0.30 0.20 0.60
Cuba <0.1 <0.1 <0.1 0.10 <0.1 0.20
Dominican Republic 0.40 0.20 0.60 0.10 0.10 0.40
Haiti 1.10 0.70 1.50 0.40 0.30 0.60
Jamaica 0.60 0.30 1.00 0.90 0.40 2.50
Trinidad and Tobago 1.00 0.70 1.30 0.60 0.50 0.80
East asia
Japan <0.1 <0.1 <0.1 <0.1 <0.1 <0.1
Korea Rep <0.1 <0.1 <0.1 <0.1 <0.1 <0.1
Mongolia 0.10 <0.1 0.10 <0.1 <0.1 0.10
EastErn EuroPE and cEntral asia
Armenia 0.10 <0.1 0.30 0.10 0.10 0.40
Azerbaijan <0.1 <0.1 <0.1 <0.1 <0.1 <0.1
Belarus 0.20 0.10 0.40 0.40 0.20 0.80
Georgia 0.10 <0.1 0.20 0.20 0.10 0.40
Kazakhstan 0.10 <0.1 0.10 <0.1 <0.1 <0.1
Kyrgyzstan 0.30 0.20 0.40 0.30 0.20 0.50
Republic of Moldova 0.10 0.10 0.20 0.10 0.10 0.10
Russian Federation … 0.10 0.40 … 0.20 0.40
Tajikistan 0.10 <0.1 0.30 0.10 0.10 0.30
Ukraine 0.10 0.10 0.20 0.10 <0.1 0.10
latin amErica
Argentina 0.20 0.10 0.30 0.20 0.10 0.40
Belize 1.00 0.60 1.60 1.00 0.50 3.00
Bolivia <0.1 <0.1 <0.1 0.20 0.10 0.50
Brazil 0.10 0.10 0.20 0.10 0.10 0.30
Chile <0.1 <0.1 0.10 0.30 0.10 0.80
Colombia 0.10 0.10 0.30 0.40 0.10 1.20
Costa Rica 0.20 0.10 0.20 0.10 0.10 0.10
Ecuador 0.10 0.10 0.30 0.20 0.10 1.00
El Salvador 0.30 0.10 1.20 0.30 0.10 1.40
Guatemala 0.50 0.10 3.00 0.40 0.10 2.80
Guyana 0.30 0.20 0.40 0.20 0.10 0.30
Honduras … 0.10 0.20 … 0.10 0.70
Mexico <0.1 <0.1 0.10 0.10 0.10 0.30
Nicaragua 0.20 0.10 0.70 0.10 <0.1 0.20
Panama 0.10 0.10 0.30 0.40 0.20 1.10
Paraguay 0.20 0.10 0.50 0.20 0.10 0.90
Peru 0.10 <0.1 0.50 0.20 0.10 1.20
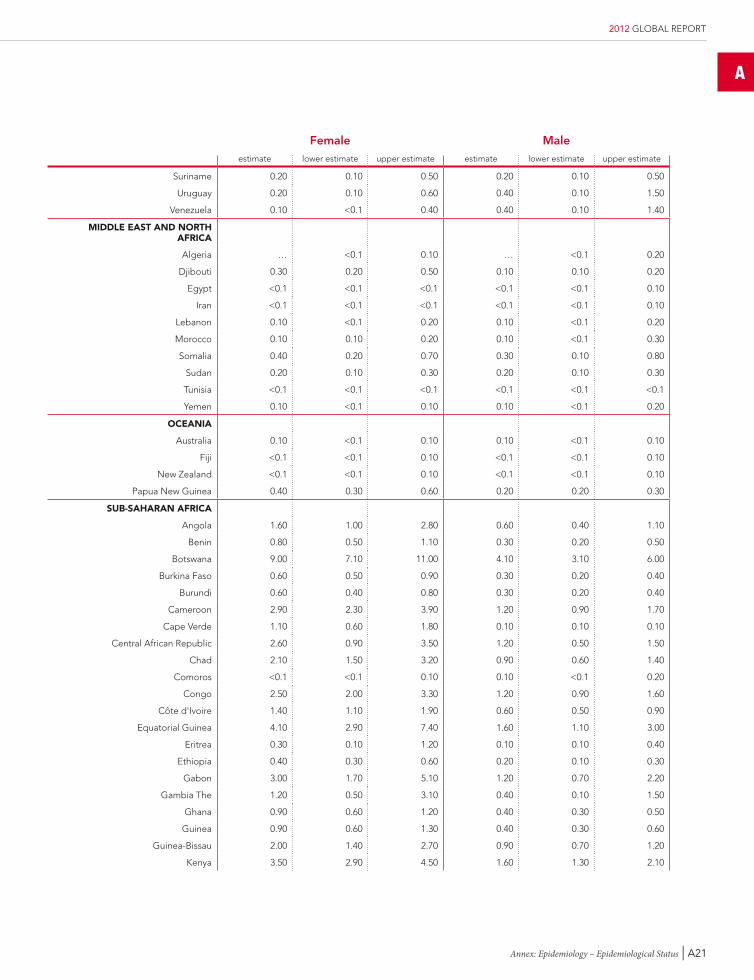
A
Annex: Epidemiology – Epidemiological Status | A21
2012 GLOBAL REPORT
Female Maleestimate lower estimate upper estimate estimate lower estimate upper estimate
Suriname 0.20 0.10 0.50 0.20 0.10 0.50
Uruguay 0.20 0.10 0.60 0.40 0.10 1.50
Venezuela 0.10 <0.1 0.40 0.40 0.10 1.40
middlE East and nortH africa
Algeria … <0.1 0.10 … <0.1 0.20
Djibouti 0.30 0.20 0.50 0.10 0.10 0.20
Egypt <0.1 <0.1 <0.1 <0.1 <0.1 0.10
Iran <0.1 <0.1 <0.1 <0.1 <0.1 0.10
Lebanon 0.10 <0.1 0.20 0.10 <0.1 0.20
Morocco 0.10 0.10 0.20 0.10 <0.1 0.30
Somalia 0.40 0.20 0.70 0.30 0.10 0.80
Sudan 0.20 0.10 0.30 0.20 0.10 0.30
Tunisia <0.1 <0.1 <0.1 <0.1 <0.1 <0.1
Yemen 0.10 <0.1 0.10 0.10 <0.1 0.20
ocEania
Australia 0.10 <0.1 0.10 0.10 <0.1 0.10
Fiji <0.1 <0.1 0.10 <0.1 <0.1 0.10
New Zealand <0.1 <0.1 0.10 <0.1 <0.1 0.10
Papua New Guinea 0.40 0.30 0.60 0.20 0.20 0.30
sub-saHaran africa
Angola 1.60 1.00 2.80 0.60 0.40 1.10
Benin 0.80 0.50 1.10 0.30 0.20 0.50
Botswana 9.00 7.10 11.00 4.10 3.10 6.00
Burkina Faso 0.60 0.50 0.90 0.30 0.20 0.40
Burundi 0.60 0.40 0.80 0.30 0.20 0.40
Cameroon 2.90 2.30 3.90 1.20 0.90 1.70
Cape Verde 1.10 0.60 1.80 0.10 0.10 0.10
Central African Republic 2.60 0.90 3.50 1.20 0.50 1.50
Chad 2.10 1.50 3.20 0.90 0.60 1.40
Comoros <0.1 <0.1 0.10 0.10 <0.1 0.20
Congo 2.50 2.00 3.30 1.20 0.90 1.60
Côte d'Ivoire 1.40 1.10 1.90 0.60 0.50 0.90
Equatorial Guinea 4.10 2.90 7.40 1.60 1.10 3.00
Eritrea 0.30 0.10 1.20 0.10 0.10 0.40
Ethiopia 0.40 0.30 0.60 0.20 0.10 0.30
Gabon 3.00 1.70 5.10 1.20 0.70 2.20
Gambia The 1.20 0.50 3.10 0.40 0.10 1.50
Ghana 0.90 0.60 1.20 0.40 0.30 0.50
Guinea 0.90 0.60 1.30 0.40 0.30 0.60
Guinea-Bissau 2.00 1.40 2.70 0.90 0.70 1.20
Kenya 3.50 2.90 4.50 1.60 1.30 2.10
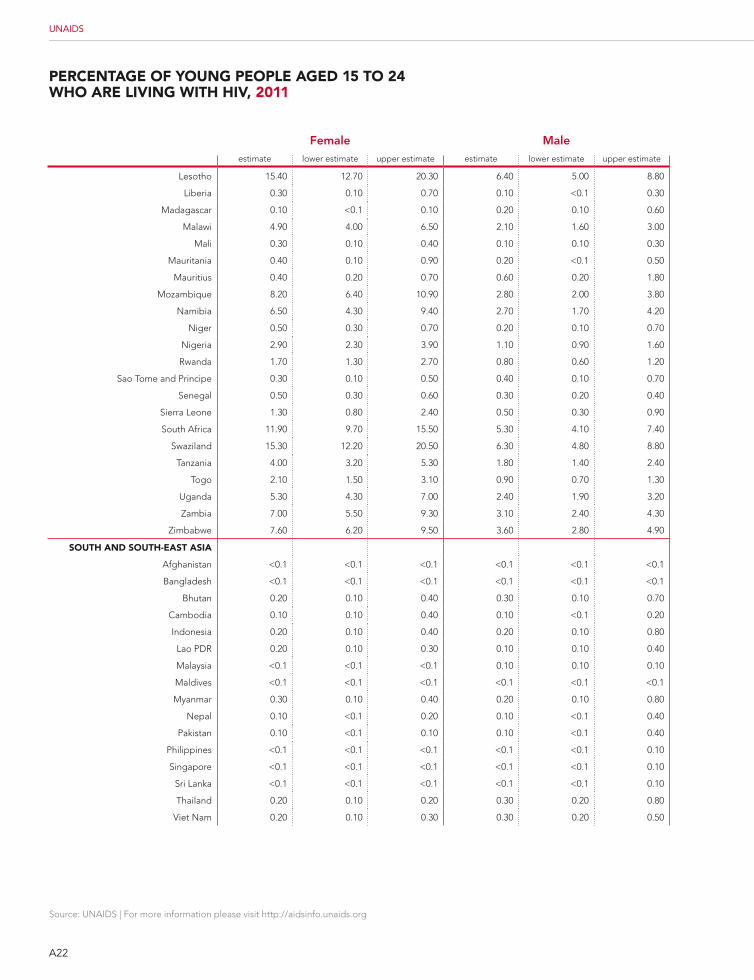
A22
Source: UNAIDS | For more information please visit http://aidsinfo.unaids.org
UNAIDS
PErcEntagE of Young PEoPlE agEd 15 to 24 WHo arE liVing WitH HiV, 2011
Female Maleestimate lower estimate upper estimate estimate lower estimate upper estimate
Lesotho 15.40 12.70 20.30 6.40 5.00 8.80
Liberia 0.30 0.10 0.70 0.10 <0.1 0.30
Madagascar 0.10 <0.1 0.10 0.20 0.10 0.60
Malawi 4.90 4.00 6.50 2.10 1.60 3.00
Mali 0.30 0.10 0.40 0.10 0.10 0.30
Mauritania 0.40 0.10 0.90 0.20 <0.1 0.50
Mauritius 0.40 0.20 0.70 0.60 0.20 1.80
Mozambique 8.20 6.40 10.90 2.80 2.00 3.80
Namibia 6.50 4.30 9.40 2.70 1.70 4.20
Niger 0.50 0.30 0.70 0.20 0.10 0.70
Nigeria 2.90 2.30 3.90 1.10 0.90 1.60
Rwanda 1.70 1.30 2.70 0.80 0.60 1.20
Sao Tome and Principe 0.30 0.10 0.50 0.40 0.10 0.70
Senegal 0.50 0.30 0.60 0.30 0.20 0.40
Sierra Leone 1.30 0.80 2.40 0.50 0.30 0.90
South Africa 11.90 9.70 15.50 5.30 4.10 7.40
Swaziland 15.30 12.20 20.50 6.30 4.80 8.80
Tanzania 4.00 3.20 5.30 1.80 1.40 2.40
Togo 2.10 1.50 3.10 0.90 0.70 1.30
Uganda 5.30 4.30 7.00 2.40 1.90 3.20
Zambia 7.00 5.50 9.30 3.10 2.40 4.30
Zimbabwe 7.60 6.20 9.50 3.60 2.80 4.90
soutH and soutH-East asia
Afghanistan <0.1 <0.1 <0.1 <0.1 <0.1 <0.1
Bangladesh <0.1 <0.1 <0.1 <0.1 <0.1 <0.1
Bhutan 0.20 0.10 0.40 0.30 0.10 0.70
Cambodia 0.10 0.10 0.40 0.10 <0.1 0.20
Indonesia 0.20 0.10 0.40 0.20 0.10 0.80
Lao PDR 0.20 0.10 0.30 0.10 0.10 0.40
Malaysia <0.1 <0.1 <0.1 0.10 0.10 0.10
Maldives <0.1 <0.1 <0.1 <0.1 <0.1 <0.1
Myanmar 0.30 0.10 0.40 0.20 0.10 0.80
Nepal 0.10 <0.1 0.20 0.10 <0.1 0.40
Pakistan 0.10 <0.1 0.10 0.10 <0.1 0.40
Philippines <0.1 <0.1 <0.1 <0.1 <0.1 0.10
Singapore <0.1 <0.1 <0.1 <0.1 <0.1 0.10
Sri Lanka <0.1 <0.1 <0.1 <0.1 <0.1 0.10
Thailand 0.20 0.10 0.20 0.30 0.20 0.80
Viet Nam 0.20 0.10 0.30 0.30 0.20 0.50

A
Annex: Epidemiology – Epidemiological Status | A23
2012 GLOBAL REPORT
Female Maleestimate lower estimate upper estimate estimate lower estimate upper estimate
WEstErn and cEntral EuroPE and nortH amErica
Austria 0.20 0.10 0.40 0.30 0.20 0.50
Belgium 0.20 0.10 0.30 0.20 0.10 0.40
Bulgaria 0.10 <0.1 0.10 0.10 <0.1 0.30
Canada 0.10 <0.1 0.10 0.10 0.10 0.20
Croatia <0.1 <0.1 <0.1 <0.1 <0.1 0.10
Czech Republic <0.1 <0.1 <0.1 <0.1 <0.1 <0.1
Denmark 0.10 <0.1 0.10 0.10 0.10 0.20
Estonia 0.20 0.10 0.30 0.20 0.20 0.30
Finland <0.1 <0.1 <0.1 <0.1 <0.1 0.10
France 0.10 0.10 0.20 0.20 0.10 0.20
Germany <0.1 <0.1 <0.1 0.10 0.10 0.10
Greece 0.10 <0.1 0.10 0.10 0.10 0.10
Hungary <0.1 <0.1 0.10 0.10 <0.1 0.20
Iceland 0.10 <0.1 0.10 0.10 0.10 0.20
Ireland 0.10 <0.1 0.20 0.10 0.10 0.20
Israel <0.1 <0.1 0.10 0.10 <0.1 0.10
Italy 0.10 <0.1 0.20 0.10 <0.1 0.20
Latvia 0.10 0.10 0.20 0.20 0.10 0.30
Lithuania <0.1 <0.1 <0.1 <0.1 <0.1 <0.1
Luxembourg 0.10 <0.1 0.10 0.10 0.10 0.20
Malta <0.1 <0.1 <0.1 <0.1 <0.1 0.10
Netherlands 0.10 <0.1 0.10 0.10 <0.1 0.20
Norway <0.1 <0.1 0.10 0.10 <0.1 0.10
Poland <0.1 <0.1 0.10 0.10 <0.1 0.10
Portugal 0.20 0.10 0.40 0.30 0.10 0.50
Romania <0.1 <0.1 0.10 <0.1 <0.1 0.10
Serbia <0.1 <0.1 <0.1 <0.1 <0.1 0.20
Slovakia <0.1 <0.1 <0.1 <0.1 <0.1 <0.1
Slovenia <0.1 <0.1 0.10 0.10 <0.1 0.10
Spain 0.10 0.10 0.10 0.20 0.10 0.30
Sweden <0.1 <0.1 0.10 <0.1 <0.1 0.10
Switzerland 0.10 <0.1 0.20 0.20 0.10 0.30
Turkey <0.1 <0.1 <0.1 <0.1 <0.1 <0.1
United Kingdom 0.10 0.10 0.20 0.10 0.10 0.20
United States of America 0.20 0.10 0.40 0.30 0.10 0.50
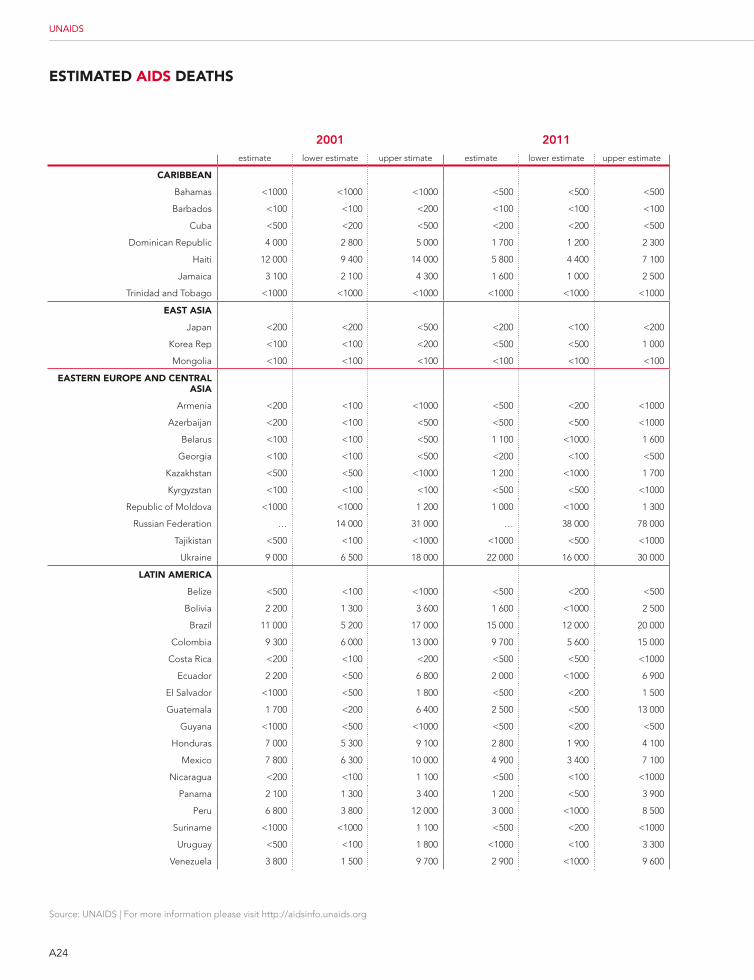
A24
Source: UNAIDS | For more information please visit http://aidsinfo.unaids.org
UNAIDS
EstimatEd aids dEatHs
2001 2011estimate lower estimate upper stimate estimate lower estimate upper estimate
caribbEan
Bahamas <1000 <1000 <1000 <500 <500 <500
Barbados <100 <100 <200 <100 <100 <100
Cuba <500 <200 <500 <200 <200 <500
Dominican Republic 4 000 2 800 5 000 1 700 1 200 2 300
Haiti 12 000 9 400 14 000 5 800 4 400 7 100
Jamaica 3 100 2 100 4 300 1 600 1 000 2 500
Trinidad and Tobago <1000 <1000 <1000 <1000 <1000 <1000
East asia
Japan <200 <200 <500 <200 <100 <200
Korea Rep <100 <100 <200 <500 <500 1 000
Mongolia <100 <100 <100 <100 <100 <100
EastErn EuroPE and cEntral asia
Armenia <200 <100 <1000 <500 <200 <1000
Azerbaijan <200 <100 <500 <500 <500 <1000
Belarus <100 <100 <500 1 100 <1000 1 600
Georgia <100 <100 <500 <200 <100 <500
Kazakhstan <500 <500 <1000 1 200 <1000 1 700
Kyrgyzstan <100 <100 <100 <500 <500 <1000
Republic of Moldova <1000 <1000 1 200 1 000 <1000 1 300
Russian Federation … 14 000 31 000 … 38 000 78 000
Tajikistan <500 <100 <1000 <1000 <500 <1000
Ukraine 9 000 6 500 18 000 22 000 16 000 30 000
latin amErica
Belize <500 <100 <1000 <500 <200 <500
Bolivia 2 200 1 300 3 600 1 600 <1000 2 500
Brazil 11 000 5 200 17 000 15 000 12 000 20 000
Colombia 9 300 6 000 13 000 9 700 5 600 15 000
Costa Rica <200 <100 <200 <500 <500 <1000
Ecuador 2 200 <500 6 800 2 000 <1000 6 900
El Salvador <1000 <500 1 800 <500 <200 1 500
Guatemala 1 700 <200 6 400 2 500 <500 13 000
Guyana <1000 <500 <1000 <500 <200 <500
Honduras 7 000 5 300 9 100 2 800 1 900 4 100
Mexico 7 800 6 300 10 000 4 900 3 400 7 100
Nicaragua <200 <100 1 100 <500 <100 <1000
Panama 2 100 1 300 3 400 1 200 <500 3 900
Peru 6 800 3 800 12 000 3 000 <1000 8 500
Suriname <1000 <1000 1 100 <500 <200 <1000
Uruguay <500 <100 1 800 <1000 <100 3 300
Venezuela 3 800 1 500 9 700 2 900 <1000 9 600
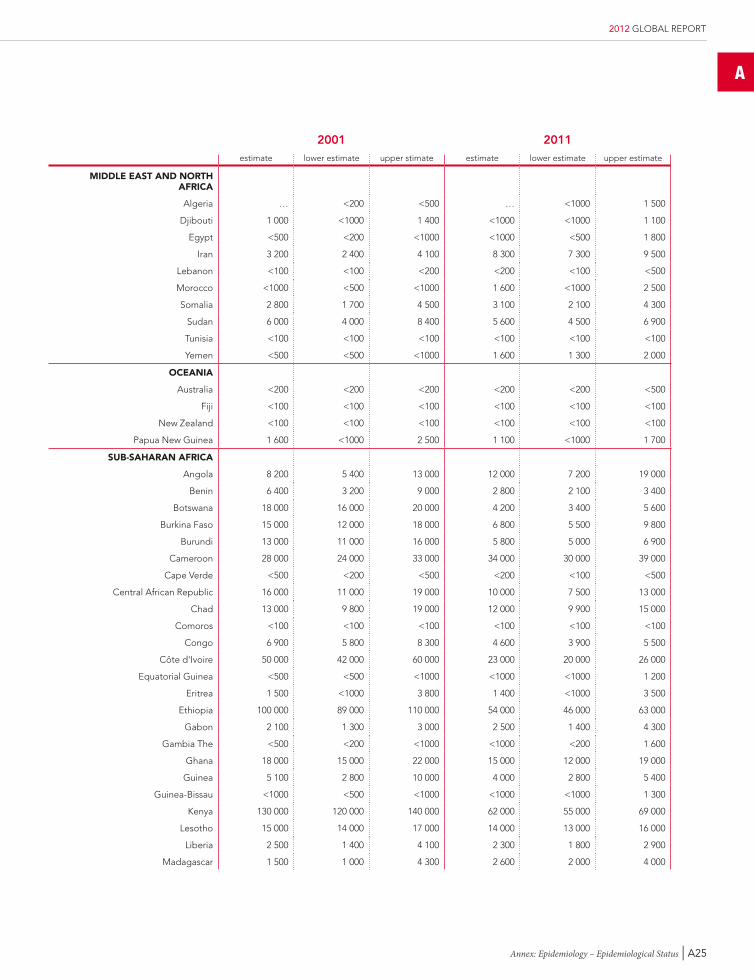
A
Annex: Epidemiology – Epidemiological Status | A25
2012 GLOBAL REPORT
2001 2011estimate lower estimate upper stimate estimate lower estimate upper estimate
middlE East and nortH africa
Algeria … <200 <500 … <1000 1 500
Djibouti 1 000 <1000 1 400 <1000 <1000 1 100
Egypt <500 <200 <1000 <1000 <500 1 800
Iran 3 200 2 400 4 100 8 300 7 300 9 500
Lebanon <100 <100 <200 <200 <100 <500
Morocco <1000 <500 <1000 1 600 <1000 2 500
Somalia 2 800 1 700 4 500 3 100 2 100 4 300
Sudan 6 000 4 000 8 400 5 600 4 500 6 900
Tunisia <100 <100 <100 <100 <100 <100
Yemen <500 <500 <1000 1 600 1 300 2 000
ocEania
Australia <200 <200 <200 <200 <200 <500
Fiji <100 <100 <100 <100 <100 <100
New Zealand <100 <100 <100 <100 <100 <100
Papua New Guinea 1 600 <1000 2 500 1 100 <1000 1 700
sub-saHaran africa
Angola 8 200 5 400 13 000 12 000 7 200 19 000
Benin 6 400 3 200 9 000 2 800 2 100 3 400
Botswana 18 000 16 000 20 000 4 200 3 400 5 600
Burkina Faso 15 000 12 000 18 000 6 800 5 500 9 800
Burundi 13 000 11 000 16 000 5 800 5 000 6 900
Cameroon 28 000 24 000 33 000 34 000 30 000 39 000
Cape Verde <500 <200 <500 <200 <100 <500
Central African Republic 16 000 11 000 19 000 10 000 7 500 13 000
Chad 13 000 9 800 19 000 12 000 9 900 15 000
Comoros <100 <100 <100 <100 <100 <100
Congo 6 900 5 800 8 300 4 600 3 900 5 500
Côte d'Ivoire 50 000 42 000 60 000 23 000 20 000 26 000
Equatorial Guinea <500 <500 <1000 <1000 <1000 1 200
Eritrea 1 500 <1000 3 800 1 400 <1000 3 500
Ethiopia 100 000 89 000 110 000 54 000 46 000 63 000
Gabon 2 100 1 300 3 000 2 500 1 400 4 300
Gambia The <500 <200 <1000 <1000 <200 1 600
Ghana 18 000 15 000 22 000 15 000 12 000 19 000
Guinea 5 100 2 800 10 000 4 000 2 800 5 400
Guinea-Bissau <1000 <500 <1000 <1000 <1000 1 300
Kenya 130 000 120 000 140 000 62 000 55 000 69 000
Lesotho 15 000 14 000 17 000 14 000 13 000 16 000
Liberia 2 500 1 400 4 100 2 300 1 800 2 900
Madagascar 1 500 1 000 4 300 2 600 2 000 4 000
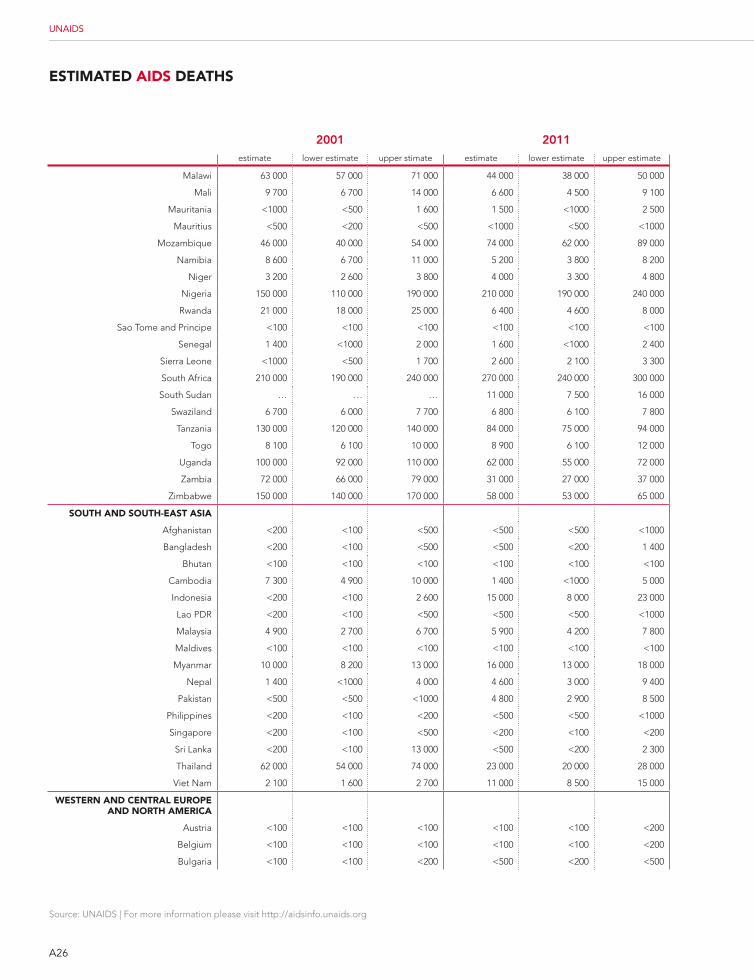
A26
Source: UNAIDS | For more information please visit http://aidsinfo.unaids.org
UNAIDS
EstimatEd aids dEatHs
2001 2011estimate lower estimate upper stimate estimate lower estimate upper estimate
Malawi 63 000 57 000 71 000 44 000 38 000 50 000
Mali 9 700 6 700 14 000 6 600 4 500 9 100
Mauritania <1000 <500 1 600 1 500 <1000 2 500
Mauritius <500 <200 <500 <1000 <500 <1000
Mozambique 46 000 40 000 54 000 74 000 62 000 89 000
Namibia 8 600 6 700 11 000 5 200 3 800 8 200
Niger 3 200 2 600 3 800 4 000 3 300 4 800
Nigeria 150 000 110 000 190 000 210 000 190 000 240 000
Rwanda 21 000 18 000 25 000 6 400 4 600 8 000
Sao Tome and Principe <100 <100 <100 <100 <100 <100
Senegal 1 400 <1000 2 000 1 600 <1000 2 400
Sierra Leone <1000 <500 1 700 2 600 2 100 3 300
South Africa 210 000 190 000 240 000 270 000 240 000 300 000
South Sudan … … … 11 000 7 500 16 000
Swaziland 6 700 6 000 7 700 6 800 6 100 7 800
Tanzania 130 000 120 000 140 000 84 000 75 000 94 000
Togo 8 100 6 100 10 000 8 900 6 100 12 000
Uganda 100 000 92 000 110 000 62 000 55 000 72 000
Zambia 72 000 66 000 79 000 31 000 27 000 37 000
Zimbabwe 150 000 140 000 170 000 58 000 53 000 65 000
soutH and soutH-East asia
Afghanistan <200 <100 <500 <500 <500 <1000
Bangladesh <200 <100 <500 <500 <200 1 400
Bhutan <100 <100 <100 <100 <100 <100
Cambodia 7 300 4 900 10 000 1 400 <1000 5 000
Indonesia <200 <100 2 600 15 000 8 000 23 000
Lao PDR <200 <100 <500 <500 <500 <1000
Malaysia 4 900 2 700 6 700 5 900 4 200 7 800
Maldives <100 <100 <100 <100 <100 <100
Myanmar 10 000 8 200 13 000 16 000 13 000 18 000
Nepal 1 400 <1000 4 000 4 600 3 000 9 400
Pakistan <500 <500 <1000 4 800 2 900 8 500
Philippines <200 <100 <200 <500 <500 <1000
Singapore <200 <100 <500 <200 <100 <200
Sri Lanka <200 <100 13 000 <500 <200 2 300
Thailand 62 000 54 000 74 000 23 000 20 000 28 000
Viet Nam 2 100 1 600 2 700 11 000 8 500 15 000
WEstErn and cEntral EuroPE and nortH amErica
Austria <100 <100 <100 <100 <100 <200
Belgium <100 <100 <100 <100 <100 <200
Bulgaria <100 <100 <200 <500 <200 <500
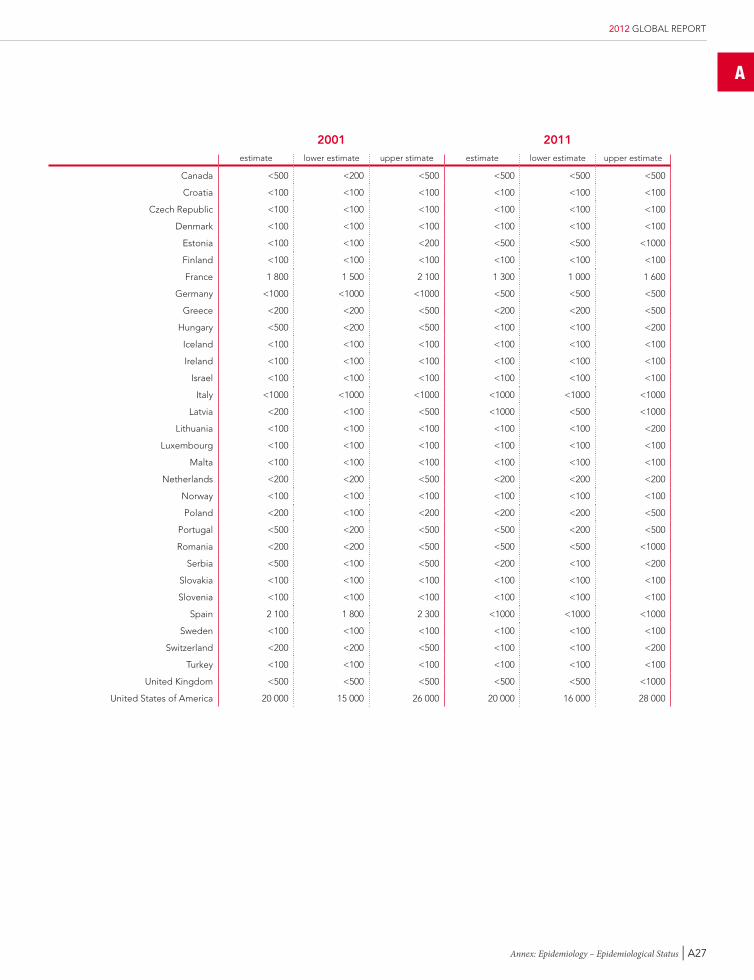
A
Annex: Epidemiology – Epidemiological Status | A27
2012 GLOBAL REPORT
2001 2011estimate lower estimate upper stimate estimate lower estimate upper estimate
Canada <500 <200 <500 <500 <500 <500
Croatia <100 <100 <100 <100 <100 <100
Czech Republic <100 <100 <100 <100 <100 <100
Denmark <100 <100 <100 <100 <100 <100
Estonia <100 <100 <200 <500 <500 <1000
Finland <100 <100 <100 <100 <100 <100
France 1 800 1 500 2 100 1 300 1 000 1 600
Germany <1000 <1000 <1000 <500 <500 <500
Greece <200 <200 <500 <200 <200 <500
Hungary <500 <200 <500 <100 <100 <200
Iceland <100 <100 <100 <100 <100 <100
Ireland <100 <100 <100 <100 <100 <100
Israel <100 <100 <100 <100 <100 <100
Italy <1000 <1000 <1000 <1000 <1000 <1000
Latvia <200 <100 <500 <1000 <500 <1000
Lithuania <100 <100 <100 <100 <100 <200
Luxembourg <100 <100 <100 <100 <100 <100
Malta <100 <100 <100 <100 <100 <100
Netherlands <200 <200 <500 <200 <200 <200
Norway <100 <100 <100 <100 <100 <100
Poland <200 <100 <200 <200 <200 <500
Portugal <500 <200 <500 <500 <200 <500
Romania <200 <200 <500 <500 <500 <1000
Serbia <500 <100 <500 <200 <100 <200
Slovakia <100 <100 <100 <100 <100 <100
Slovenia <100 <100 <100 <100 <100 <100
Spain 2 100 1 800 2 300 <1000 <1000 <1000
Sweden <100 <100 <100 <100 <100 <100
Switzerland <200 <200 <500 <100 <100 <200
Turkey <100 <100 <100 <100 <100 <100
United Kingdom <500 <500 <500 <500 <500 <1000
United States of America 20 000 15 000 26 000 20 000 16 000 28 000
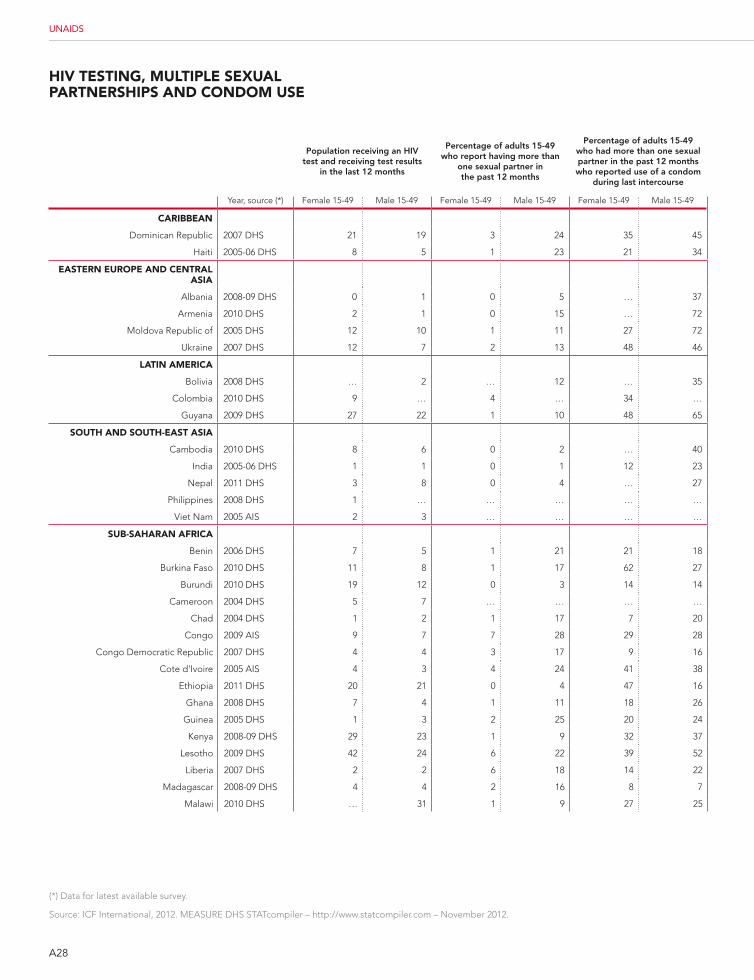
population receiving an HiV test and receiving test results
in the last 12 months
percentage of adults 15-49 who report having more than
one sexual partner in the past 12 months
percentage of adults 15-49 who had more than one sexual partner in the past 12 months who reported use of a condom
during last intercourse
Year, source (*) Female 15-49 Male 15-49 Female 15-49 Male 15-49 Female 15-49 Male 15-49
caribbEan
Dominican Republic 2007 DHS 21 19 3 24 35 45
Haiti 2005-06 DHS 8 5 1 23 21 34
EastErn EuroPE and cEntral asia
Albania 2008-09 DHS 0 1 0 5 … 37
Armenia 2010 DHS 2 1 0 15 … 72
Moldova Republic of 2005 DHS 12 10 1 11 27 72
Ukraine 2007 DHS 12 7 2 13 48 46
latin amErica
Bolivia 2008 DHS … 2 … 12 … 35
Colombia 2010 DHS 9 … 4 … 34 …
Guyana 2009 DHS 27 22 1 10 48 65
soutH and soutH-East asia
Cambodia 2010 DHS 8 6 0 2 … 40
India 2005-06 DHS 1 1 0 1 12 23
Nepal 2011 DHS 3 8 0 4 … 27
Philippines 2008 DHS 1 … … … … …
Viet Nam 2005 AIS 2 3 … … … …
sub-saHaran africa
Benin 2006 DHS 7 5 1 21 21 18
Burkina Faso 2010 DHS 11 8 1 17 62 27
Burundi 2010 DHS 19 12 0 3 14 14
Cameroon 2004 DHS 5 7 … … … …
Chad 2004 DHS 1 2 1 17 7 20
Congo 2009 AIS 9 7 7 28 29 28
Congo Democratic Republic 2007 DHS 4 4 3 17 9 16
Cote d'Ivoire 2005 AIS 4 3 4 24 41 38
Ethiopia 2011 DHS 20 21 0 4 47 16
Ghana 2008 DHS 7 4 1 11 18 26
Guinea 2005 DHS 1 3 2 25 20 24
Kenya 2008-09 DHS 29 23 1 9 32 37
Lesotho 2009 DHS 42 24 6 22 39 52
Liberia 2007 DHS 2 2 6 18 14 22
Madagascar 2008-09 DHS 4 4 2 16 8 7
Malawi 2010 DHS … 31 1 9 27 25
A28
UNAIDS
(*) Data for latest available survey.
Source: ICF International, 2012. MEASURE DHS STATcompiler – http://www.statcompiler.com – November 2012.
HiV tEsting, multiPlE sExual PartnErsHiPs and condom usE
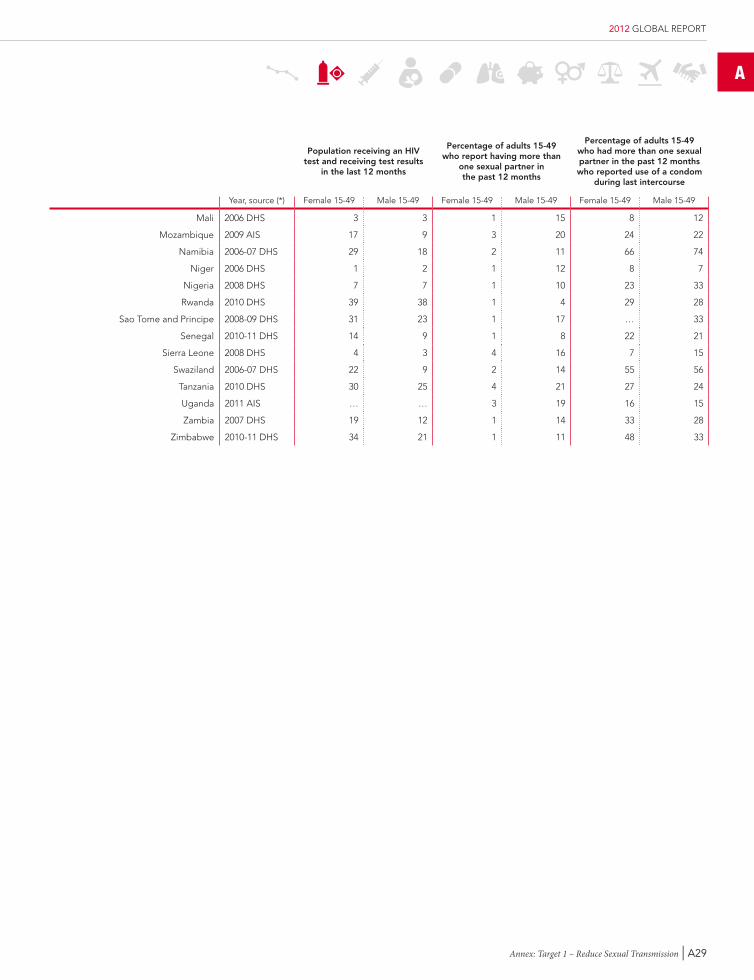
population receiving an HiV test and receiving test results
in the last 12 months
percentage of adults 15-49 who report having more than
one sexual partner in the past 12 months
percentage of adults 15-49 who had more than one sexual partner in the past 12 months who reported use of a condom
during last intercourse
Year, source (*) Female 15-49 Male 15-49 Female 15-49 Male 15-49 Female 15-49 Male 15-49
Mali 2006 DHS 3 3 1 15 8 12
Mozambique 2009 AIS 17 9 3 20 24 22
Namibia 2006-07 DHS 29 18 2 11 66 74
Niger 2006 DHS 1 2 1 12 8 7
Nigeria 2008 DHS 7 7 1 10 23 33
Rwanda 2010 DHS 39 38 1 4 29 28
Sao Tome and Principe 2008-09 DHS 31 23 1 17 … 33
Senegal 2010-11 DHS 14 9 1 8 22 21
Sierra Leone 2008 DHS 4 3 4 16 7 15
Swaziland 2006-07 DHS 22 9 2 14 55 56
Tanzania 2010 DHS 30 25 4 21 27 24
Uganda 2011 AIS … … 3 19 16 15
Zambia 2007 DHS 19 12 1 14 33 28
Zimbabwe 2010-11 DHS 34 21 1 11 48 33
A
Annex: Target 1 – Reduce Sexual Transmission | A29
2012 GLOBAL REPORT
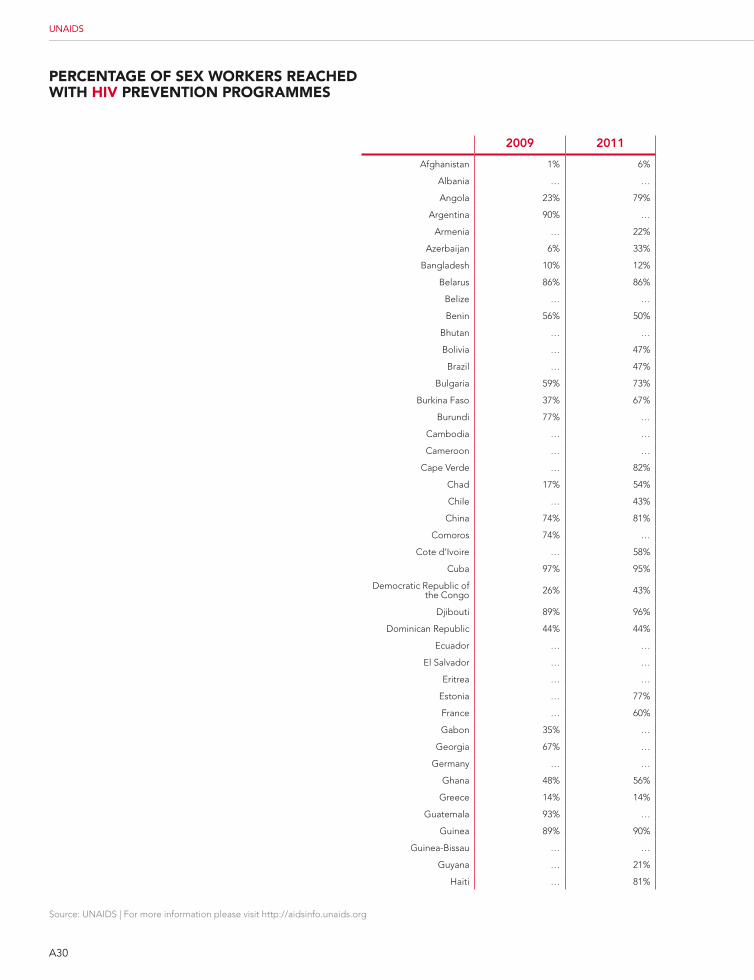
A30
Source: UNAIDS | For more information please visit http://aidsinfo.unaids.org
UNAIDS
PErcEntagE of sEx WorkErs rEacHEd WitH HiV PrEVEntion ProgrammEs
2009 2011
Afghanistan 1% 6%
Albania … …
Angola 23% 79%
Argentina 90% …
Armenia … 22%
Azerbaijan 6% 33%
Bangladesh 10% 12%
Belarus 86% 86%
Belize … …
Benin 56% 50%
Bhutan … …
Bolivia … 47%
Brazil … 47%
Bulgaria 59% 73%
Burkina Faso 37% 67%
Burundi 77% …
Cambodia … …
Cameroon … …
Cape Verde … 82%
Chad 17% 54%
Chile … 43%
China 74% 81%
Comoros 74% …
Cote d’Ivoire … 58%
Cuba 97% 95%
Democratic Republic of the Congo 26% 43%
Djibouti 89% 96%
Dominican Republic 44% 44%
Ecuador … …
El Salvador … …
Eritrea … …
Estonia … 77%
France … 60%
Gabon 35% …
Georgia 67% …
Germany … …
Ghana 48% 56%
Greece 14% 14%
Guatemala 93% …
Guinea 89% 90%
Guinea-Bissau … …
Guyana … 21%
Haiti … 81%
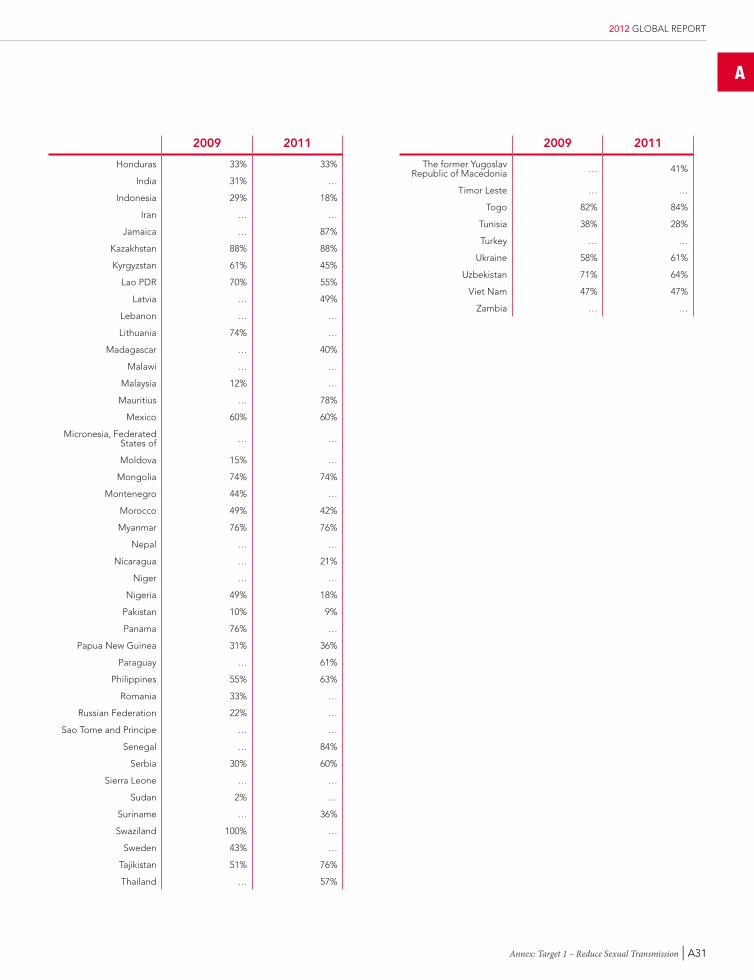
A
Annex: Target 1 – Reduce Sexual Transmission | A31
2012 GLOBAL REPORT
2009 2011
Honduras 33% 33%
India 31% …
Indonesia 29% 18%
Iran … …
Jamaica … 87%
Kazakhstan 88% 88%
Kyrgyzstan 61% 45%
Lao PDR 70% 55%
Latvia … 49%
Lebanon … …
Lithuania 74% …
Madagascar … 40%
Malawi … …
Malaysia 12% …
Mauritius … 78%
Mexico 60% 60%
Micronesia, Federated States of … …
Moldova 15% …
Mongolia 74% 74%
Montenegro 44% …
Morocco 49% 42%
Myanmar 76% 76%
Nepal … …
Nicaragua … 21%
Niger … …
Nigeria 49% 18%
Pakistan 10% 9%
Panama 76% …
Papua New Guinea 31% 36%
Paraguay … 61%
Philippines 55% 63%
Romania 33% …
Russian Federation 22% …
Sao Tome and Principe … …
Senegal … 84%
Serbia 30% 60%
Sierra Leone … …
Sudan 2% …
Suriname … 36%
Swaziland 100% …
Sweden 43% …
Tajikistan 51% 76%
Thailand … 57%
2009 2011
The former Yugoslav Republic of Macedonia … 41%
Timor Leste … …
Togo 82% 84%
Tunisia 38% 28%
Turkey … …
Ukraine 58% 61%
Uzbekistan 71% 64%
Viet Nam 47% 47%
Zambia … …
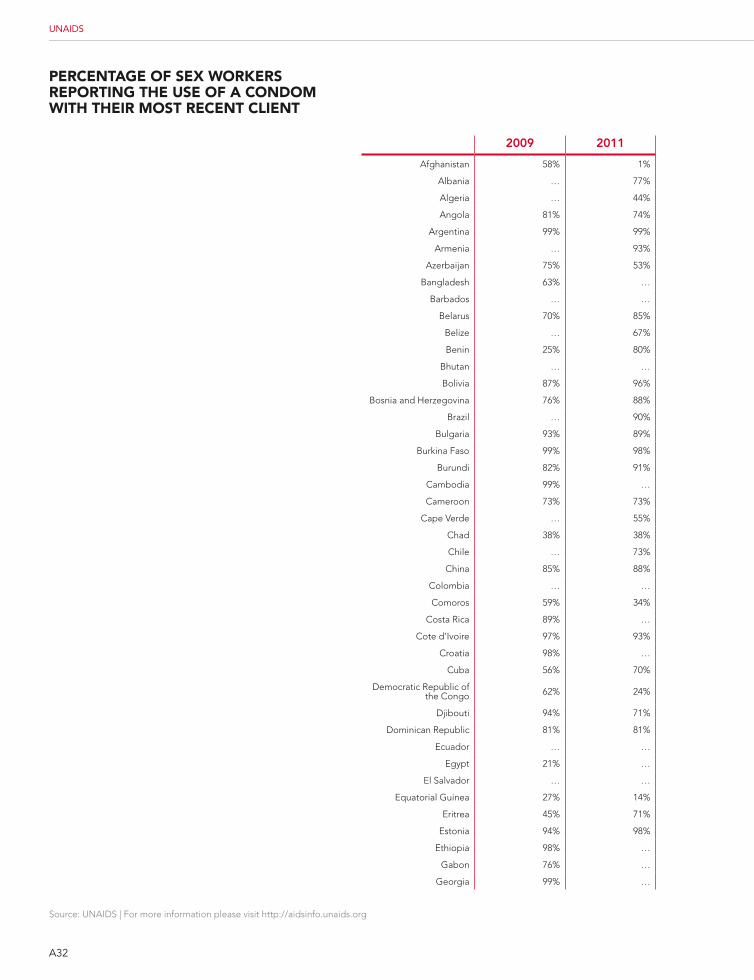
A32
Source: UNAIDS | For more information please visit http://aidsinfo.unaids.org
UNAIDS
PErcEntagE of sEx WorkErs rEPorting tHE usE of a condom WitH tHEir most rEcEnt cliEnt
2009 2011
Afghanistan 58% 1%
Albania … 77%
Algeria … 44%
Angola 81% 74%
Argentina 99% 99%
Armenia … 93%
Azerbaijan 75% 53%
Bangladesh 63% …
Barbados … …
Belarus 70% 85%
Belize … 67%
Benin 25% 80%
Bhutan … …
Bolivia 87% 96%
Bosnia and Herzegovina 76% 88%
Brazil … 90%
Bulgaria 93% 89%
Burkina Faso 99% 98%
Burundi 82% 91%
Cambodia 99% …
Cameroon 73% 73%
Cape Verde … 55%
Chad 38% 38%
Chile … 73%
China 85% 88%
Colombia … …
Comoros 59% 34%
Costa Rica 89% …
Cote d’Ivoire 97% 93%
Croatia 98% …
Cuba 56% 70%
Democratic Republic of the Congo 62% 24%
Djibouti 94% 71%
Dominican Republic 81% 81%
Ecuador … …
Egypt 21% …
El Salvador … …
Equatorial Guinea 27% 14%
Eritrea 45% 71%
Estonia 94% 98%
Ethiopia 98% …
Gabon 76% …
Georgia 99% …
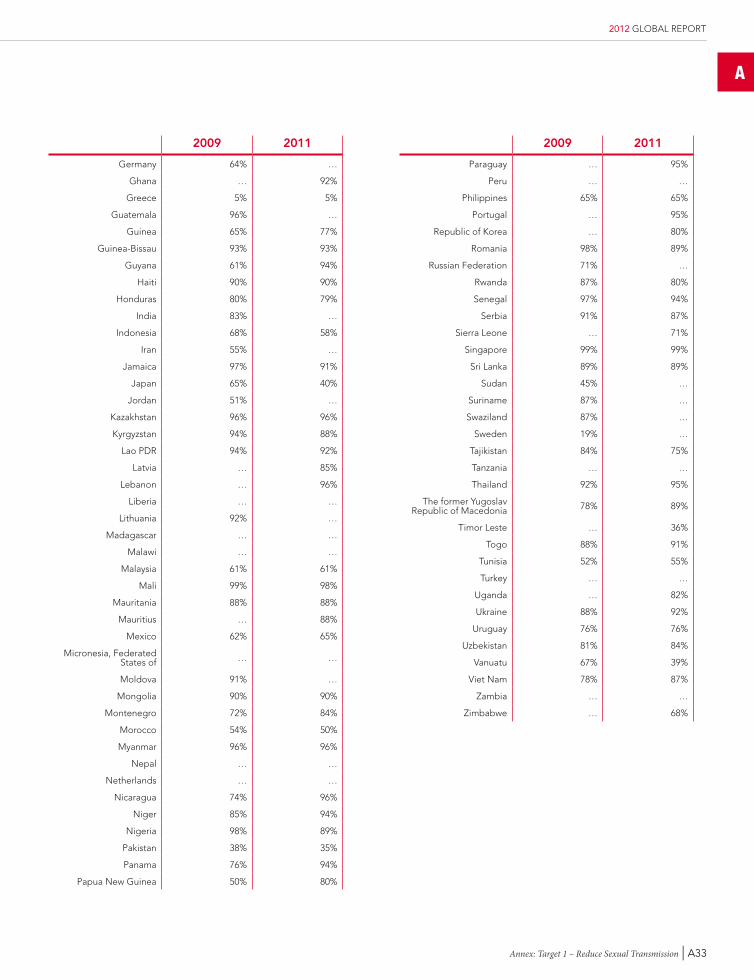
A
Annex: Target 1 – Reduce Sexual Transmission | A33
2012 GLOBAL REPORT
2009 2011
Germany 64% …
Ghana … 92%
Greece 5% 5%
Guatemala 96% …
Guinea 65% 77%
Guinea-Bissau 93% 93%
Guyana 61% 94%
Haiti 90% 90%
Honduras 80% 79%
India 83% …
Indonesia 68% 58%
Iran 55% …
Jamaica 97% 91%
Japan 65% 40%
Jordan 51% …
Kazakhstan 96% 96%
Kyrgyzstan 94% 88%
Lao PDR 94% 92%
Latvia … 85%
Lebanon … 96%
Liberia … …
Lithuania 92% …
Madagascar … …
Malawi … …
Malaysia 61% 61%
Mali 99% 98%
Mauritania 88% 88%
Mauritius … 88%
Mexico 62% 65%
Micronesia, Federated States of … …
Moldova 91% …
Mongolia 90% 90%
Montenegro 72% 84%
Morocco 54% 50%
Myanmar 96% 96%
Nepal … …
Netherlands … …
Nicaragua 74% 96%
Niger 85% 94%
Nigeria 98% 89%
Pakistan 38% 35%
Panama 76% 94%
Papua New Guinea 50% 80%
2009 2011
Paraguay … 95%
Peru … …
Philippines 65% 65%
Portugal … 95%
Republic of Korea … 80%
Romania 98% 89%
Russian Federation 71% …
Rwanda 87% 80%
Senegal 97% 94%
Serbia 91% 87%
Sierra Leone … 71%
Singapore 99% 99%
Sri Lanka 89% 89%
Sudan 45% …
Suriname 87% …
Swaziland 87% …
Sweden 19% …
Tajikistan 84% 75%
Tanzania … …
Thailand 92% 95%
The former Yugoslav Republic of Macedonia 78% 89%
Timor Leste … 36%
Togo 88% 91%
Tunisia 52% 55%
Turkey … …
Uganda … 82%
Ukraine 88% 92%
Uruguay 76% 76%
Uzbekistan 81% 84%
Vanuatu 67% 39%
Viet Nam 78% 87%
Zambia … …
Zimbabwe … 68%
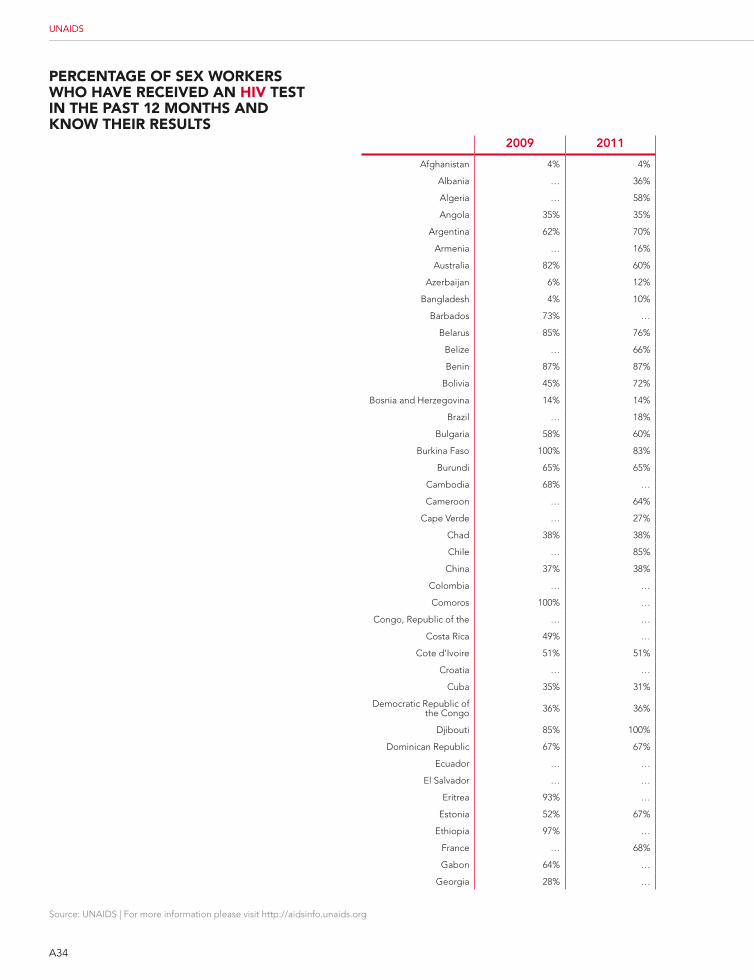
A34
Source: UNAIDS | For more information please visit http://aidsinfo.unaids.org
UNAIDS
PErcEntagE of sEx WorkErs WHo HaVE rEcEiVEd an HiV tEst in tHE Past 12 montHs and knoW tHEir rEsults
2009 2011
Afghanistan 4% 4%
Albania … 36%
Algeria … 58%
Angola 35% 35%
Argentina 62% 70%
Armenia … 16%
Australia 82% 60%
Azerbaijan 6% 12%
Bangladesh 4% 10%
Barbados 73% …
Belarus 85% 76%
Belize … 66%
Benin 87% 87%
Bolivia 45% 72%
Bosnia and Herzegovina 14% 14%
Brazil … 18%
Bulgaria 58% 60%
Burkina Faso 100% 83%
Burundi 65% 65%
Cambodia 68% …
Cameroon … 64%
Cape Verde … 27%
Chad 38% 38%
Chile … 85%
China 37% 38%
Colombia … …
Comoros 100% …
Congo, Republic of the … …
Costa Rica 49% …
Cote d’Ivoire 51% 51%
Croatia … …
Cuba 35% 31%
Democratic Republic of the Congo 36% 36%
Djibouti 85% 100%
Dominican Republic 67% 67%
Ecuador … …
El Salvador … …
Eritrea 93% …
Estonia 52% 67%
Ethiopia 97% …
France … 68%
Gabon 64% …
Georgia 28% …
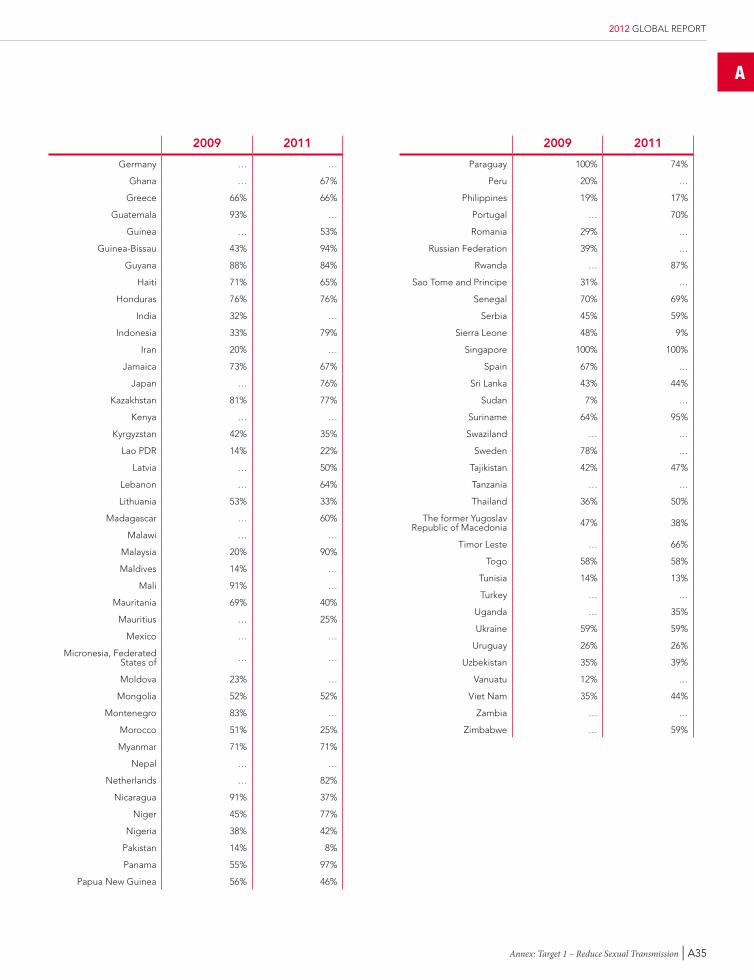
A
Annex: Target 1 – Reduce Sexual Transmission | A35
2012 GLOBAL REPORT
2009 2011
Germany … …
Ghana … 67%
Greece 66% 66%
Guatemala 93% …
Guinea … 53%
Guinea-Bissau 43% 94%
Guyana 88% 84%
Haiti 71% 65%
Honduras 76% 76%
India 32% …
Indonesia 33% 79%
Iran 20% …
Jamaica 73% 67%
Japan … 76%
Kazakhstan 81% 77%
Kenya … …
Kyrgyzstan 42% 35%
Lao PDR 14% 22%
Latvia … 50%
Lebanon … 64%
Lithuania 53% 33%
Madagascar … 60%
Malawi … …
Malaysia 20% 90%
Maldives 14% …
Mali 91% …
Mauritania 69% 40%
Mauritius … 25%
Mexico … …
Micronesia, Federated States of … …
Moldova 23% …
Mongolia 52% 52%
Montenegro 83% …
Morocco 51% 25%
Myanmar 71% 71%
Nepal … …
Netherlands … 82%
Nicaragua 91% 37%
Niger 45% 77%
Nigeria 38% 42%
Pakistan 14% 8%
Panama 55% 97%
Papua New Guinea 56% 46%
2009 2011
Paraguay 100% 74%
Peru 20% …
Philippines 19% 17%
Portugal … 70%
Romania 29% …
Russian Federation 39% …
Rwanda … 87%
Sao Tome and Principe 31% …
Senegal 70% 69%
Serbia 45% 59%
Sierra Leone 48% 9%
Singapore 100% 100%
Spain 67% …
Sri Lanka 43% 44%
Sudan 7% …
Suriname 64% 95%
Swaziland … …
Sweden 78% …
Tajikistan 42% 47%
Tanzania … …
Thailand 36% 50%
The former Yugoslav Republic of Macedonia 47% 38%
Timor Leste … 66%
Togo 58% 58%
Tunisia 14% 13%
Turkey … …
Uganda … 35%
Ukraine 59% 59%
Uruguay 26% 26%
Uzbekistan 35% 39%
Vanuatu 12% …
Viet Nam 35% 44%
Zambia … …
Zimbabwe … 59%
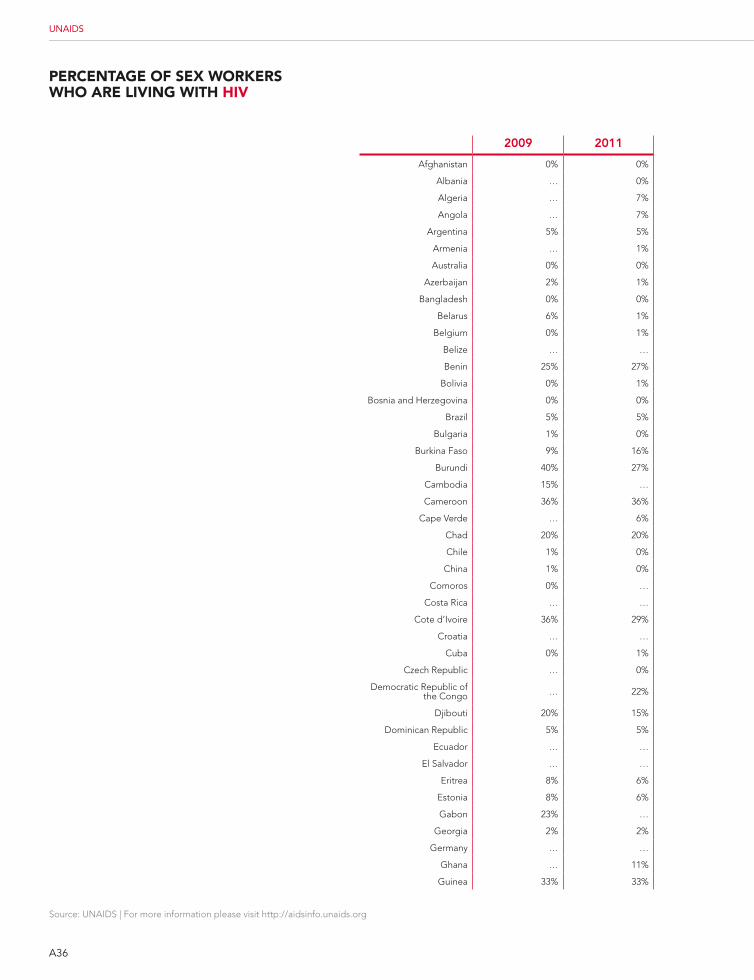
2009 2011
Afghanistan 0% 0%
Albania … 0%
Algeria … 7%
Angola … 7%
Argentina 5% 5%
Armenia … 1%
Australia 0% 0%
Azerbaijan 2% 1%
Bangladesh 0% 0%
Belarus 6% 1%
Belgium 0% 1%
Belize … …
Benin 25% 27%
Bolivia 0% 1%
Bosnia and Herzegovina 0% 0%
Brazil 5% 5%
Bulgaria 1% 0%
Burkina Faso 9% 16%
Burundi 40% 27%
Cambodia 15% …
Cameroon 36% 36%
Cape Verde … 6%
Chad 20% 20%
Chile 1% 0%
China 1% 0%
Comoros 0% …
Costa Rica … …
Cote d’Ivoire 36% 29%
Croatia … …
Cuba 0% 1%
Czech Republic … 0%
Democratic Republic of the Congo … 22%
Djibouti 20% 15%
Dominican Republic 5% 5%
Ecuador … …
El Salvador … …
Eritrea 8% 6%
Estonia 8% 6%
Gabon 23% …
Georgia 2% 2%
Germany … …
Ghana … 11%
Guinea 33% 33%
PErcEntagE of sEx WorkErs WHo arE liVing WitH HiV
A36
Source: UNAIDS | For more information please visit http://aidsinfo.unaids.org
UNAIDS
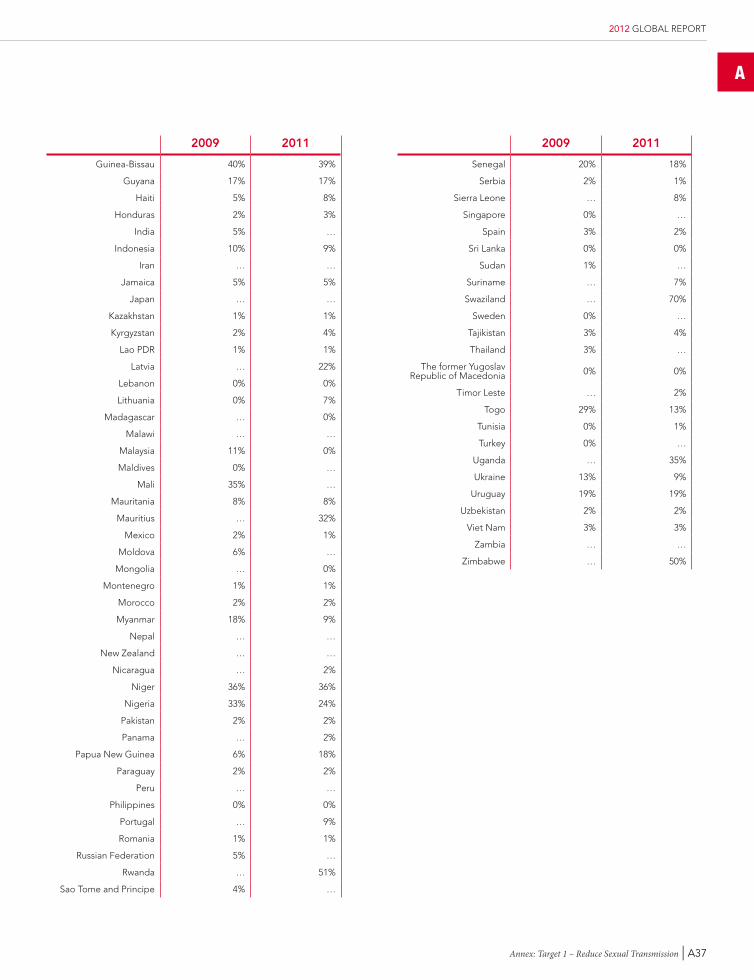
2009 2011
Guinea-Bissau 40% 39%
Guyana 17% 17%
Haiti 5% 8%
Honduras 2% 3%
India 5% …
Indonesia 10% 9%
Iran … …
Jamaica 5% 5%
Japan … …
Kazakhstan 1% 1%
Kyrgyzstan 2% 4%
Lao PDR 1% 1%
Latvia … 22%
Lebanon 0% 0%
Lithuania 0% 7%
Madagascar … 0%
Malawi … …
Malaysia 11% 0%
Maldives 0% …
Mali 35% …
Mauritania 8% 8%
Mauritius … 32%
Mexico 2% 1%
Moldova 6% …
Mongolia … 0%
Montenegro 1% 1%
Morocco 2% 2%
Myanmar 18% 9%
Nepal … …
New Zealand … …
Nicaragua … 2%
Niger 36% 36%
Nigeria 33% 24%
Pakistan 2% 2%
Panama … 2%
Papua New Guinea 6% 18%
Paraguay 2% 2%
Peru … …
Philippines 0% 0%
Portugal … 9%
Romania 1% 1%
Russian Federation 5% …
Rwanda … 51%
Sao Tome and Principe 4% …
2009 2011
Senegal 20% 18%
Serbia 2% 1%
Sierra Leone … 8%
Singapore 0% …
Spain 3% 2%
Sri Lanka 0% 0%
Sudan 1% …
Suriname … 7%
Swaziland … 70%
Sweden 0% …
Tajikistan 3% 4%
Thailand 3% …
The former Yugoslav Republic of Macedonia 0% 0%
Timor Leste … 2%
Togo 29% 13%
Tunisia 0% 1%
Turkey 0% …
Uganda … 35%
Ukraine 13% 9%
Uruguay 19% 19%
Uzbekistan 2% 2%
Viet Nam 3% 3%
Zambia … …
Zimbabwe … 50%
A
Annex: Target 1 – Reduce Sexual Transmission | A37
2012 GLOBAL REPORT
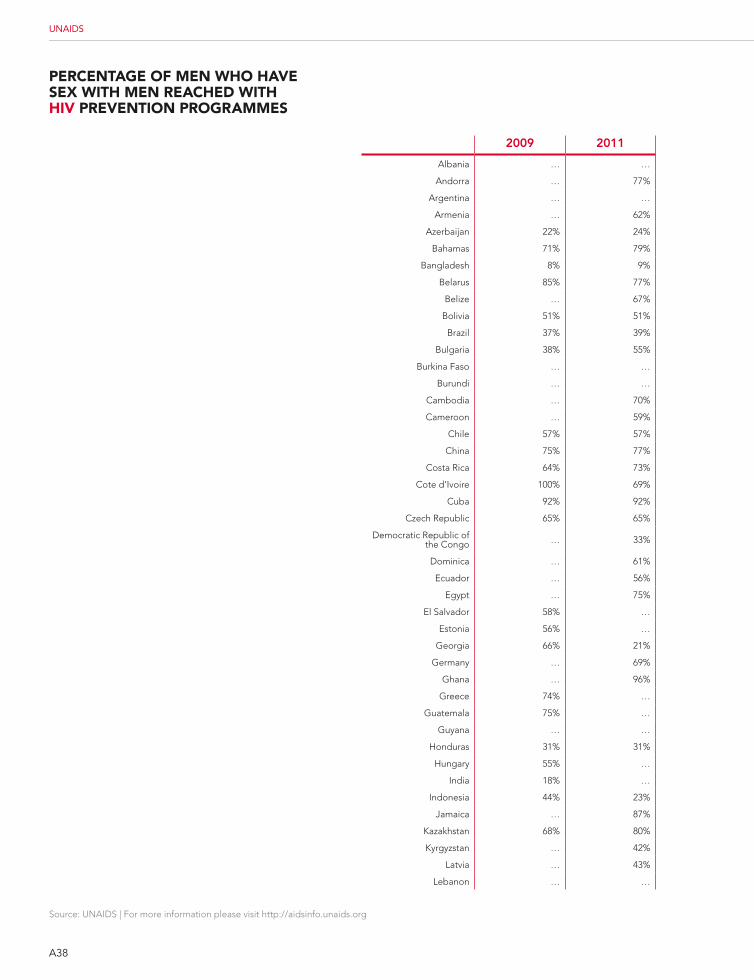
A38
Source: UNAIDS | For more information please visit http://aidsinfo.unaids.org
UNAIDS
PErcEntagE of mEn WHo HaVE sEx WitH mEn rEacHEd WitH HiV PrEVEntion ProgrammEs
2009 2011
Albania … …
Andorra … 77%
Argentina … …
Armenia … 62%
Azerbaijan 22% 24%
Bahamas 71% 79%
Bangladesh 8% 9%
Belarus 85% 77%
Belize … 67%
Bolivia 51% 51%
Brazil 37% 39%
Bulgaria 38% 55%
Burkina Faso … …
Burundi … …
Cambodia … 70%
Cameroon … 59%
Chile 57% 57%
China 75% 77%
Costa Rica 64% 73%
Cote d’Ivoire 100% 69%
Cuba 92% 92%
Czech Republic 65% 65%
Democratic Republic of the Congo … 33%
Dominica … 61%
Ecuador … 56%
Egypt … 75%
El Salvador 58% …
Estonia 56% …
Georgia 66% 21%
Germany … 69%
Ghana … 96%
Greece 74% …
Guatemala 75% …
Guyana … …
Honduras 31% 31%
Hungary 55% …
India 18% …
Indonesia 44% 23%
Jamaica … 87%
Kazakhstan 68% 80%
Kyrgyzstan … 42%
Latvia … 43%
Lebanon … …
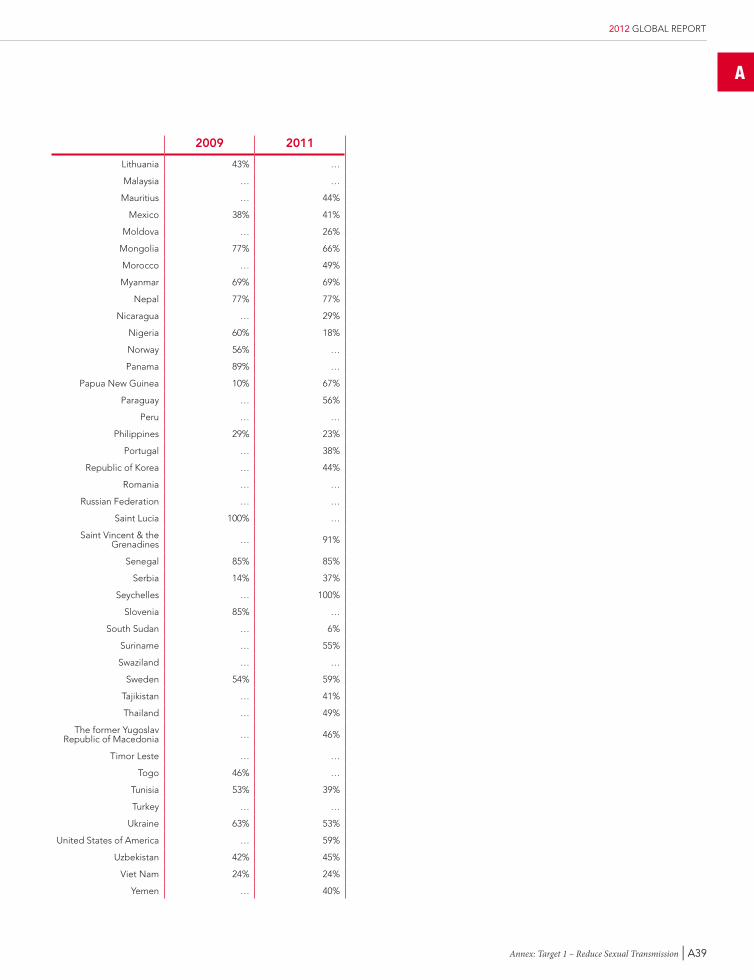
A
Annex: Target 1 – Reduce Sexual Transmission | A39
2012 GLOBAL REPORT
2009 2011
Lithuania 43% …
Malaysia … …
Mauritius … 44%
Mexico 38% 41%
Moldova … 26%
Mongolia 77% 66%
Morocco … 49%
Myanmar 69% 69%
Nepal 77% 77%
Nicaragua … 29%
Nigeria 60% 18%
Norway 56% …
Panama 89% …
Papua New Guinea 10% 67%
Paraguay … 56%
Peru … …
Philippines 29% 23%
Portugal … 38%
Republic of Korea … 44%
Romania … …
Russian Federation … …
Saint Lucia 100% …
Saint Vincent & the Grenadines … 91%
Senegal 85% 85%
Serbia 14% 37%
Seychelles … 100%
Slovenia 85% …
South Sudan … 6%
Suriname … 55%
Swaziland … …
Sweden 54% 59%
Tajikistan … 41%
Thailand … 49%
The former Yugoslav Republic of Macedonia … 46%
Timor Leste … …
Togo 46% …
Tunisia 53% 39%
Turkey … …
Ukraine 63% 53%
United States of America … 59%
Uzbekistan 42% 45%
Viet Nam 24% 24%
Yemen … 40%
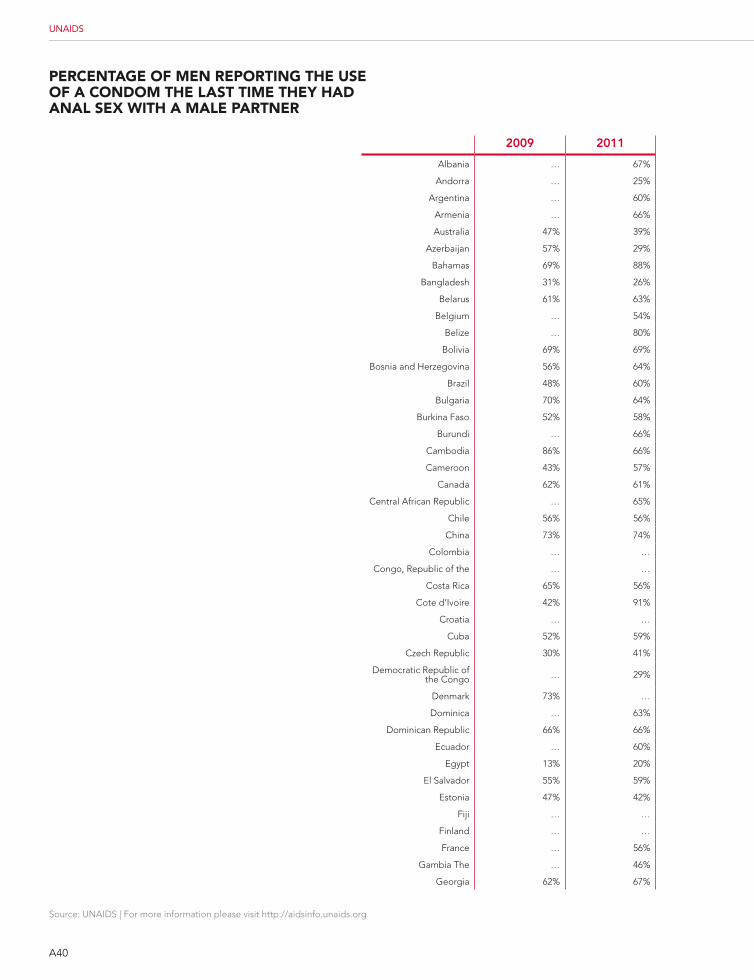
2009 2011
Albania … 67%
Andorra … 25%
Argentina … 60%
Armenia … 66%
Australia 47% 39%
Azerbaijan 57% 29%
Bahamas 69% 88%
Bangladesh 31% 26%
Belarus 61% 63%
Belgium … 54%
Belize … 80%
Bolivia 69% 69%
Bosnia and Herzegovina 56% 64%
Brazil 48% 60%
Bulgaria 70% 64%
Burkina Faso 52% 58%
Burundi … 66%
Cambodia 86% 66%
Cameroon 43% 57%
Canada 62% 61%
Central African Republic … 65%
Chile 56% 56%
China 73% 74%
Colombia … …
Congo, Republic of the … …
Costa Rica 65% 56%
Cote d’Ivoire 42% 91%
Croatia … …
Cuba 52% 59%
Czech Republic 30% 41%
Democratic Republic of the Congo … 29%
Denmark 73% …
Dominica … 63%
Dominican Republic 66% 66%
Ecuador … 60%
Egypt 13% 20%
El Salvador 55% 59%
Estonia 47% 42%
Fiji … …
Finland … …
France … 56%
Gambia The … 46%
Georgia 62% 67%
A40
Source: UNAIDS | For more information please visit http://aidsinfo.unaids.org
UNAIDS
PErcEntagE of mEn rEPorting tHE usE of a condom tHE last timE tHEY Had anal sEx WitH a malE PartnEr
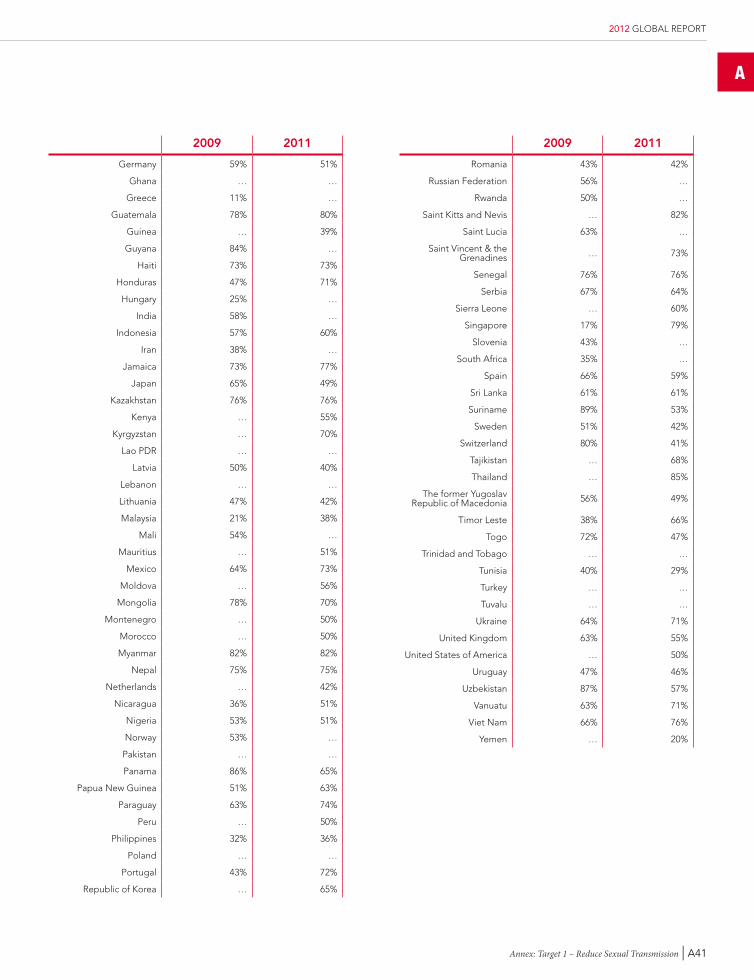
2009 2011
Germany 59% 51%
Ghana … …
Greece 11% …
Guatemala 78% 80%
Guinea … 39%
Guyana 84% …
Haiti 73% 73%
Honduras 47% 71%
Hungary 25% …
India 58% …
Indonesia 57% 60%
Iran 38% …
Jamaica 73% 77%
Japan 65% 49%
Kazakhstan 76% 76%
Kenya … 55%
Kyrgyzstan … 70%
Lao PDR … …
Latvia 50% 40%
Lebanon … …
Lithuania 47% 42%
Malaysia 21% 38%
Mali 54% …
Mauritius … 51%
Mexico 64% 73%
Moldova … 56%
Mongolia 78% 70%
Montenegro … 50%
Morocco … 50%
Myanmar 82% 82%
Nepal 75% 75%
Netherlands … 42%
Nicaragua 36% 51%
Nigeria 53% 51%
Norway 53% …
Pakistan … …
Panama 86% 65%
Papua New Guinea 51% 63%
Paraguay 63% 74%
Peru … 50%
Philippines 32% 36%
Poland … …
Portugal 43% 72%
Republic of Korea … 65%
2009 2011
Romania 43% 42%
Russian Federation 56% …
Rwanda 50% …
Saint Kitts and Nevis … 82%
Saint Lucia 63% …
Saint Vincent & the Grenadines … 73%
Senegal 76% 76%
Serbia 67% 64%
Sierra Leone … 60%
Singapore 17% 79%
Slovenia 43% …
South Africa 35% …
Spain 66% 59%
Sri Lanka 61% 61%
Suriname 89% 53%
Sweden 51% 42%
Switzerland 80% 41%
Tajikistan … 68%
Thailand … 85%
The former Yugoslav Republic of Macedonia 56% 49%
Timor Leste 38% 66%
Togo 72% 47%
Trinidad and Tobago … …
Tunisia 40% 29%
Turkey … …
Tuvalu … …
Ukraine 64% 71%
United Kingdom 63% 55%
United States of America … 50%
Uruguay 47% 46%
Uzbekistan 87% 57%
Vanuatu 63% 71%
Viet Nam 66% 76%
Yemen … 20%
A
Annex: Target 1 – Reduce Sexual Transmission | A41
2012 GLOBAL REPORT
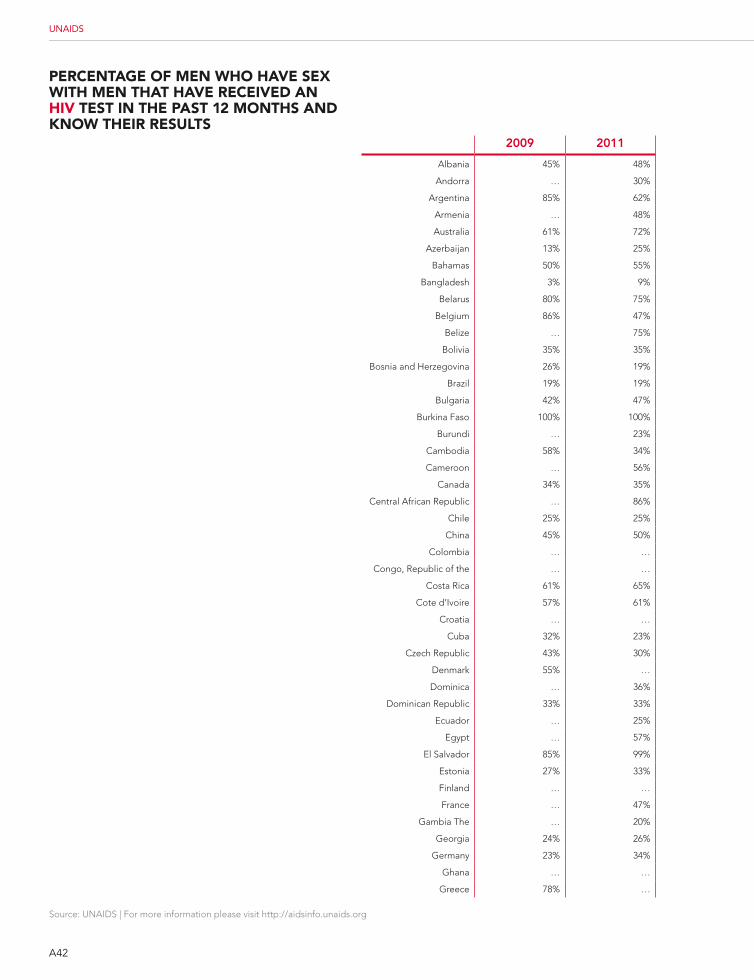
2009 2011
Albania 45% 48%
Andorra … 30%
Argentina 85% 62%
Armenia … 48%
Australia 61% 72%
Azerbaijan 13% 25%
Bahamas 50% 55%
Bangladesh 3% 9%
Belarus 80% 75%
Belgium 86% 47%
Belize … 75%
Bolivia 35% 35%
Bosnia and Herzegovina 26% 19%
Brazil 19% 19%
Bulgaria 42% 47%
Burkina Faso 100% 100%
Burundi … 23%
Cambodia 58% 34%
Cameroon … 56%
Canada 34% 35%
Central African Republic … 86%
Chile 25% 25%
China 45% 50%
Colombia … …
Congo, Republic of the … …
Costa Rica 61% 65%
Cote d’Ivoire 57% 61%
Croatia … …
Cuba 32% 23%
Czech Republic 43% 30%
Denmark 55% …
Dominica … 36%
Dominican Republic 33% 33%
Ecuador … 25%
Egypt … 57%
El Salvador 85% 99%
Estonia 27% 33%
Finland … …
France … 47%
Gambia The … 20%
Georgia 24% 26%
Germany 23% 34%
Ghana … …
Greece 78% …
A42
Source: UNAIDS | For more information please visit http://aidsinfo.unaids.org
UNAIDS
PErcEntagE of mEn WHo HaVE sEx WitH mEn tHat HaVE rEcEiVEd an HiV tEst in tHE Past 12 montHs and knoW tHEir rEsults
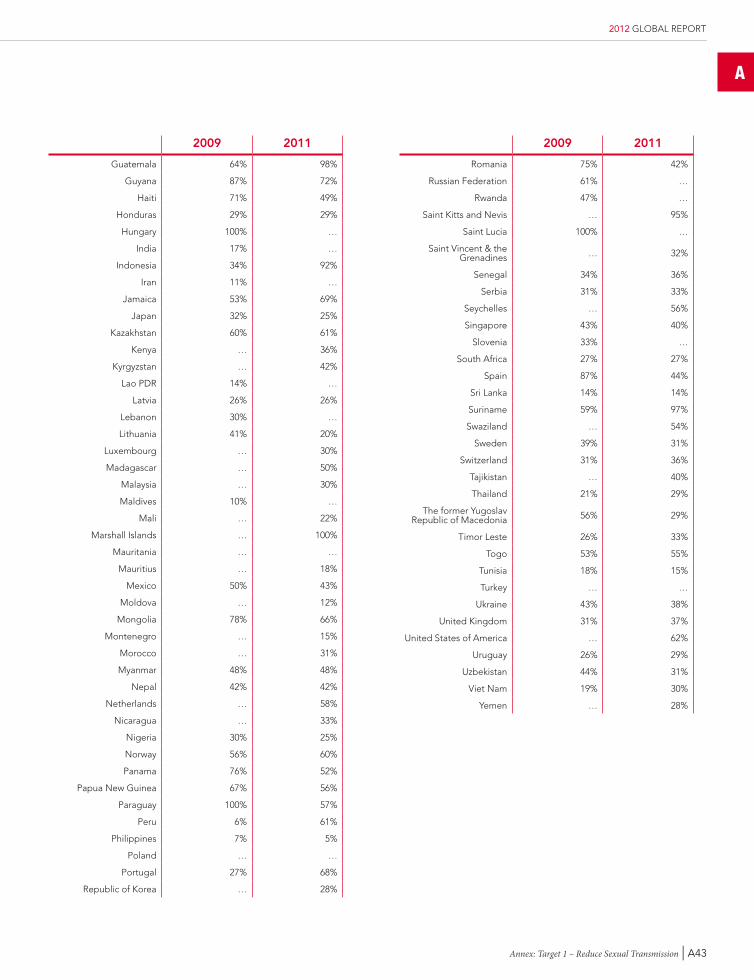
2009 2011
Guatemala 64% 98%
Guyana 87% 72%
Haiti 71% 49%
Honduras 29% 29%
Hungary 100% …
India 17% …
Indonesia 34% 92%
Iran 11% …
Jamaica 53% 69%
Japan 32% 25%
Kazakhstan 60% 61%
Kenya … 36%
Kyrgyzstan … 42%
Lao PDR 14% …
Latvia 26% 26%
Lebanon 30% …
Lithuania 41% 20%
Luxembourg … 30%
Madagascar … 50%
Malaysia … 30%
Maldives 10% …
Mali … 22%
Marshall Islands … 100%
Mauritania … …
Mauritius … 18%
Mexico 50% 43%
Moldova … 12%
Mongolia 78% 66%
Montenegro … 15%
Morocco … 31%
Myanmar 48% 48%
Nepal 42% 42%
Netherlands … 58%
Nicaragua … 33%
Nigeria 30% 25%
Norway 56% 60%
Panama 76% 52%
Papua New Guinea 67% 56%
Paraguay 100% 57%
Peru 6% 61%
Philippines 7% 5%
Poland … …
Portugal 27% 68%
Republic of Korea … 28%
2009 2011
Romania 75% 42%
Russian Federation 61% …
Rwanda 47% …
Saint Kitts and Nevis … 95%
Saint Lucia 100% …
Saint Vincent & the Grenadines … 32%
Senegal 34% 36%
Serbia 31% 33%
Seychelles … 56%
Singapore 43% 40%
Slovenia 33% …
South Africa 27% 27%
Spain 87% 44%
Sri Lanka 14% 14%
Suriname 59% 97%
Swaziland … 54%
Sweden 39% 31%
Switzerland 31% 36%
Tajikistan … 40%
Thailand 21% 29%
The former Yugoslav Republic of Macedonia 56% 29%
Timor Leste 26% 33%
Togo 53% 55%
Tunisia 18% 15%
Turkey … …
Ukraine 43% 38%
United Kingdom 31% 37%
United States of America … 62%
Uruguay 26% 29%
Uzbekistan 44% 31%
Viet Nam 19% 30%
Yemen … 28%
A
Annex: Target 1 – Reduce Sexual Transmission | A43
2012 GLOBAL REPORT
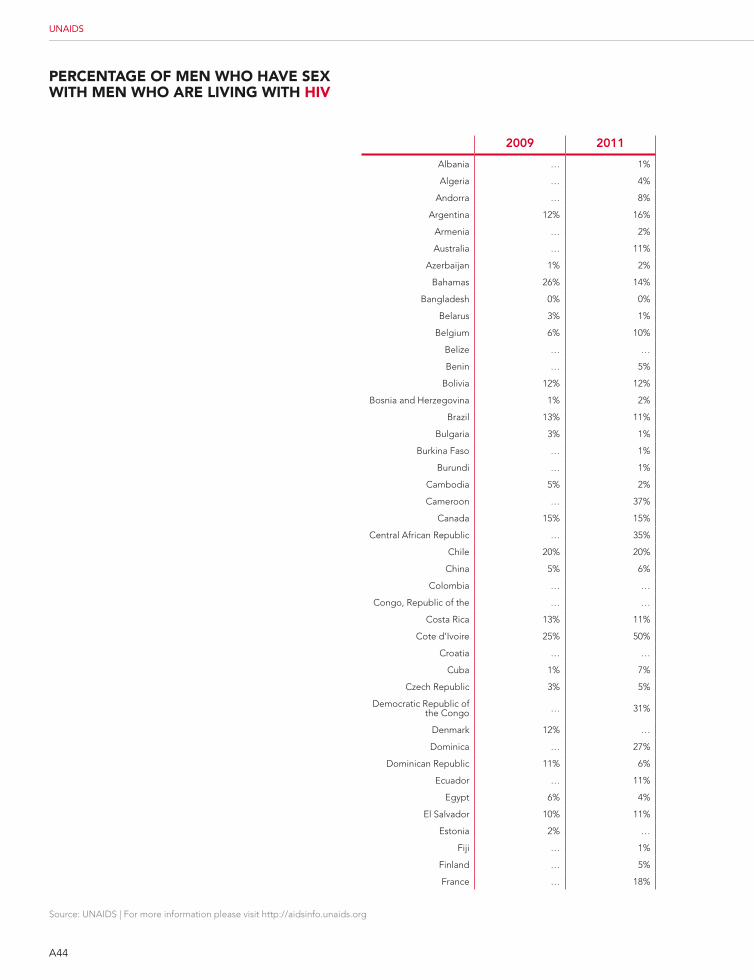
2009 2011
Albania … 1%
Algeria … 4%
Andorra … 8%
Argentina 12% 16%
Armenia … 2%
Australia … 11%
Azerbaijan 1% 2%
Bahamas 26% 14%
Bangladesh 0% 0%
Belarus 3% 1%
Belgium 6% 10%
Belize … …
Benin … 5%
Bolivia 12% 12%
Bosnia and Herzegovina 1% 2%
Brazil 13% 11%
Bulgaria 3% 1%
Burkina Faso … 1%
Burundi … 1%
Cambodia 5% 2%
Cameroon … 37%
Canada 15% 15%
Central African Republic … 35%
Chile 20% 20%
China 5% 6%
Colombia … …
Congo, Republic of the … …
Costa Rica 13% 11%
Cote d’Ivoire 25% 50%
Croatia … …
Cuba 1% 7%
Czech Republic 3% 5%
Democratic Republic of the Congo … 31%
Denmark 12% …
Dominica … 27%
Dominican Republic 11% 6%
Ecuador … 11%
Egypt 6% 4%
El Salvador 10% 11%
Estonia 2% …
Fiji … 1%
Finland … 5%
France … 18%
A44
Source: UNAIDS | For more information please visit http://aidsinfo.unaids.org
UNAIDS
PErcEntagE of mEn WHo HaVE sEx WitH mEn WHo arE liVing WitH HiV
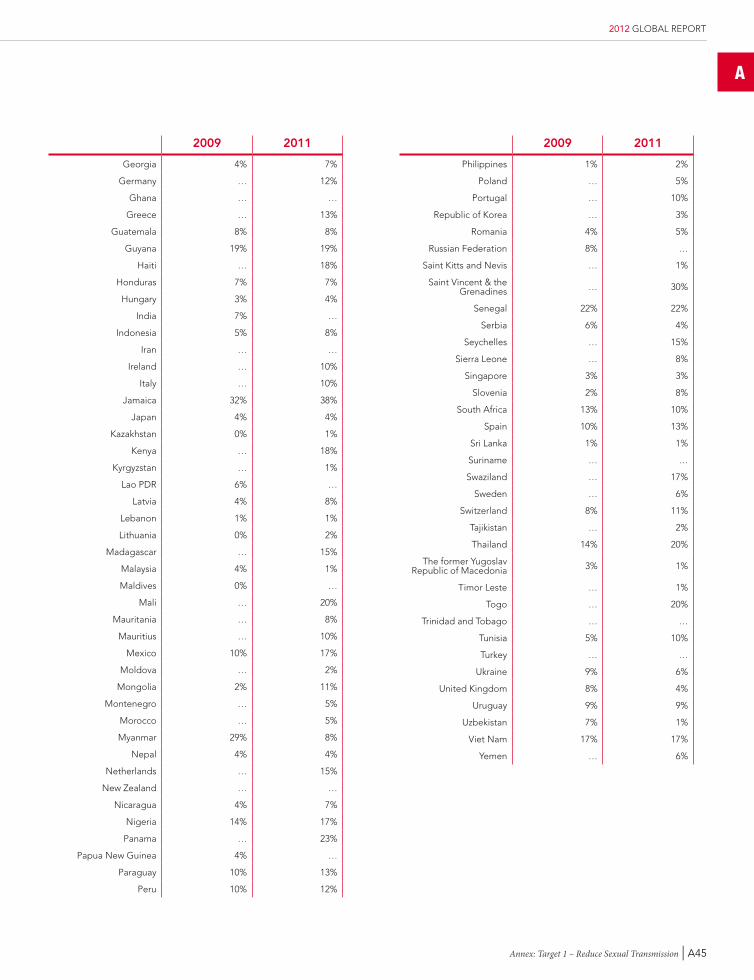
2009 2011
Georgia 4% 7%
Germany … 12%
Ghana … …
Greece … 13%
Guatemala 8% 8%
Guyana 19% 19%
Haiti … 18%
Honduras 7% 7%
Hungary 3% 4%
India 7% …
Indonesia 5% 8%
Iran … …
Ireland … 10%
Italy … 10%
Jamaica 32% 38%
Japan 4% 4%
Kazakhstan 0% 1%
Kenya … 18%
Kyrgyzstan … 1%
Lao PDR 6% …
Latvia 4% 8%
Lebanon 1% 1%
Lithuania 0% 2%
Madagascar … 15%
Malaysia 4% 1%
Maldives 0% …
Mali … 20%
Mauritania … 8%
Mauritius … 10%
Mexico 10% 17%
Moldova … 2%
Mongolia 2% 11%
Montenegro … 5%
Morocco … 5%
Myanmar 29% 8%
Nepal 4% 4%
Netherlands … 15%
New Zealand … …
Nicaragua 4% 7%
Nigeria 14% 17%
Panama … 23%
Papua New Guinea 4% …
Paraguay 10% 13%
Peru 10% 12%
2009 2011
Philippines 1% 2%
Poland … 5%
Portugal … 10%
Republic of Korea … 3%
Romania 4% 5%
Russian Federation 8% …
Saint Kitts and Nevis … 1%
Saint Vincent & the Grenadines … 30%
Senegal 22% 22%
Serbia 6% 4%
Seychelles … 15%
Sierra Leone … 8%
Singapore 3% 3%
Slovenia 2% 8%
South Africa 13% 10%
Spain 10% 13%
Sri Lanka 1% 1%
Suriname … …
Swaziland … 17%
Sweden … 6%
Switzerland 8% 11%
Tajikistan … 2%
Thailand 14% 20%
The former Yugoslav Republic of Macedonia 3% 1%
Timor Leste … 1%
Togo … 20%
Trinidad and Tobago … …
Tunisia 5% 10%
Turkey … …
Ukraine 9% 6%
United Kingdom 8% 4%
Uruguay 9% 9%
Uzbekistan 7% 1%
Viet Nam 17% 17%
Yemen … 6%
A
Annex: Target 1 – Reduce Sexual Transmission | A45
2012 GLOBAL REPORT
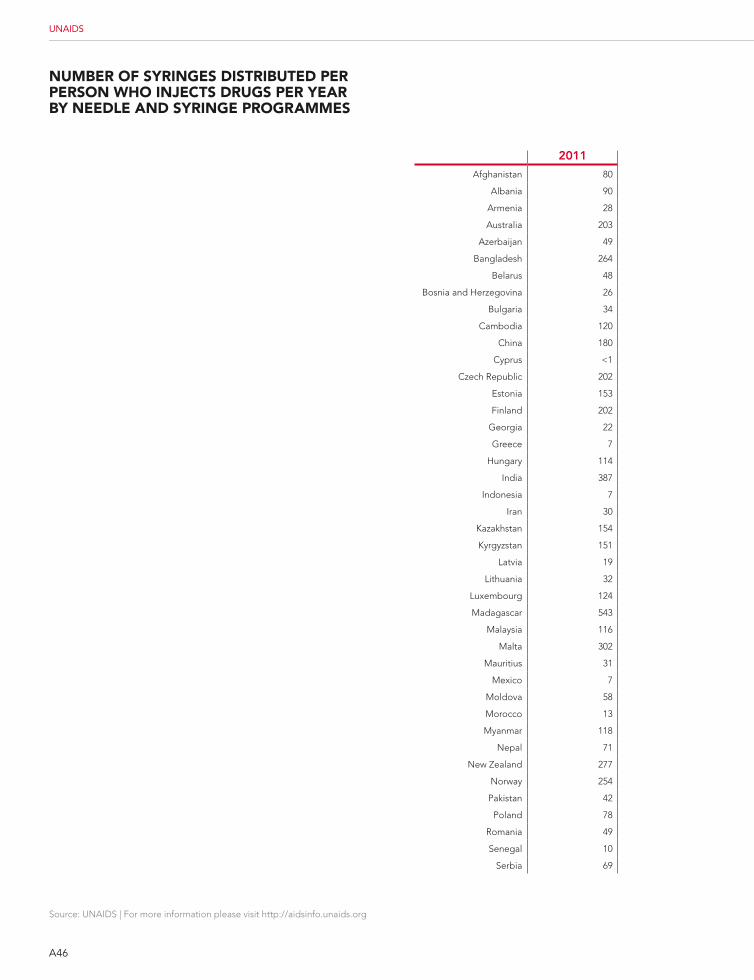
A46
Source: UNAIDS | For more information please visit http://aidsinfo.unaids.org
UNAIDS
numbEr of sYringEs distributEd PEr PErson WHo injEcts drugs PEr YEar bY nEEdlE and sYringE ProgrammEs
2011
Afghanistan 80
Albania 90
Armenia 28
Australia 203
Azerbaijan 49
Bangladesh 264
Belarus 48
Bosnia and Herzegovina 26
Bulgaria 34
Cambodia 120
China 180
Cyprus <1
Czech Republic 202
Estonia 153
Finland 202
Georgia 22
Greece 7
Hungary 114
India 387
Indonesia 7
Iran 30
Kazakhstan 154
Kyrgyzstan 151
Latvia 19
Lithuania 32
Luxembourg 124
Madagascar 543
Malaysia 116
Malta 302
Mauritius 31
Mexico 7
Moldova 58
Morocco 13
Myanmar 118
Nepal 71
New Zealand 277
Norway 254
Pakistan 42
Poland 78
Romania 49
Senegal 10
Serbia 69
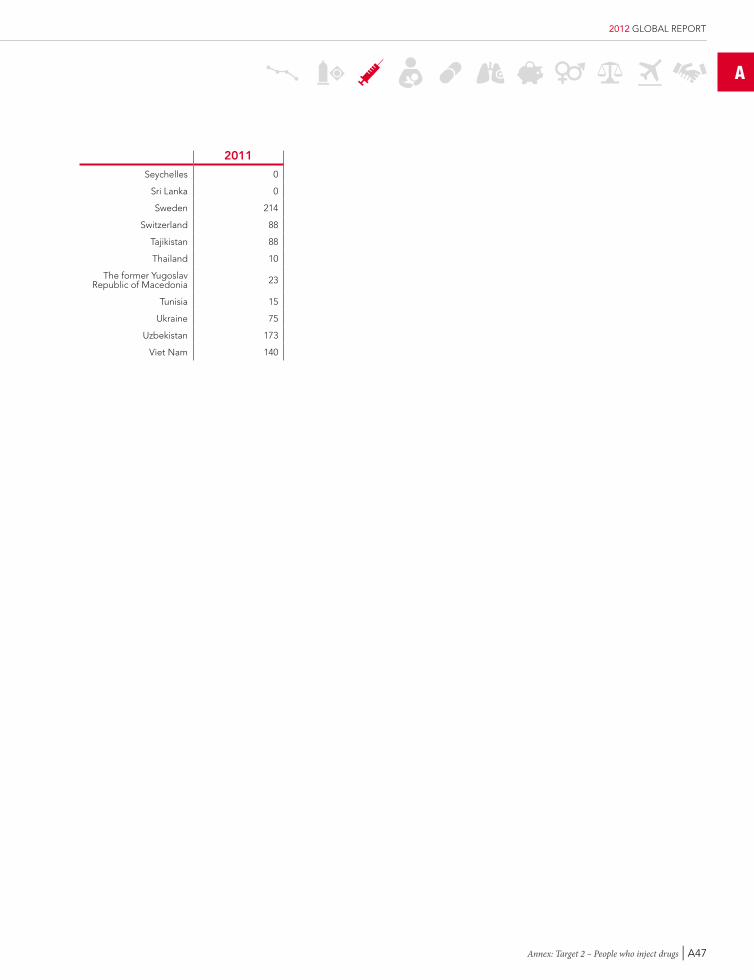
A
Annex: Target 2 – People who inject drugs | A47
2012 GLOBAL REPORT
2011
Seychelles 0
Sri Lanka 0
Sweden 214
Switzerland 88
Tajikistan 88
Thailand 10
The former Yugoslav Republic of Macedonia 23
Tunisia 15
Ukraine 75
Uzbekistan 173
Viet Nam 140
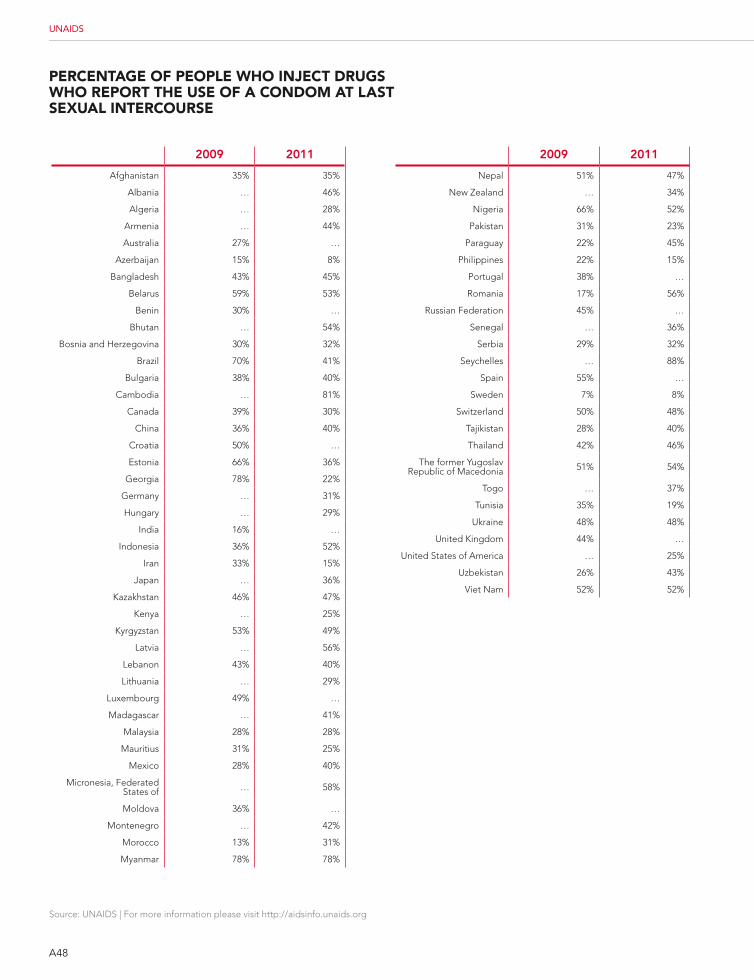
A48
Source: UNAIDS | For more information please visit http://aidsinfo.unaids.org
UNAIDS
PErcEntagE of PEoPlE WHo injEct drugs WHo rEPort tHE usE of a condom at last sExual intErcoursE
2009 2011
Nepal 51% 47%
New Zealand … 34%
Nigeria 66% 52%
Pakistan 31% 23%
Paraguay 22% 45%
Philippines 22% 15%
Portugal 38% …
Romania 17% 56%
Russian Federation 45% …
Senegal … 36%
Serbia 29% 32%
Seychelles … 88%
Spain 55% …
Sweden 7% 8%
Switzerland 50% 48%
Tajikistan 28% 40%
Thailand 42% 46%
The former Yugoslav Republic of Macedonia 51% 54%
Togo … 37%
Tunisia 35% 19%
Ukraine 48% 48%
United Kingdom 44% …
United States of America … 25%
Uzbekistan 26% 43%
Viet Nam 52% 52%
2009 2011
Afghanistan 35% 35%
Albania … 46%
Algeria … 28%
Armenia … 44%
Australia 27% …
Azerbaijan 15% 8%
Bangladesh 43% 45%
Belarus 59% 53%
Benin 30% …
Bhutan … 54%
Bosnia and Herzegovina 30% 32%
Brazil 70% 41%
Bulgaria 38% 40%
Cambodia … 81%
Canada 39% 30%
China 36% 40%
Croatia 50% …
Estonia 66% 36%
Georgia 78% 22%
Germany … 31%
Hungary … 29%
India 16% …
Indonesia 36% 52%
Iran 33% 15%
Japan … 36%
Kazakhstan 46% 47%
Kenya … 25%
Kyrgyzstan 53% 49%
Latvia … 56%
Lebanon 43% 40%
Lithuania … 29%
Luxembourg 49% …
Madagascar … 41%
Malaysia 28% 28%
Mauritius 31% 25%
Mexico 28% 40%
Micronesia, Federated States of … 58%
Moldova 36% …
Montenegro … 42%
Morocco 13% 31%
Myanmar 78% 78%
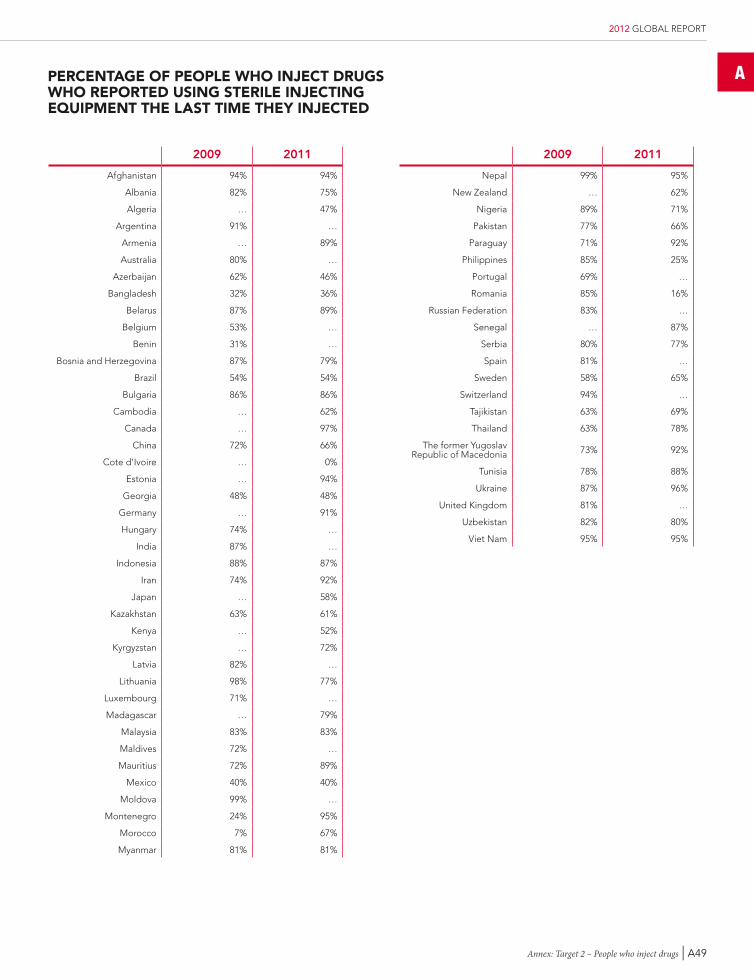
A
Annex: Target 2 – People who inject drugs | A49
2012 GLOBAL REPORT
PErcEntagE of PEoPlE WHo injEct drugs WHo rEPortEd using stErilE injEcting EquiPmEnt tHE last timE tHEY injEctEd
2009 2011
Afghanistan 94% 94%
Albania 82% 75%
Algeria … 47%
Argentina 91% …
Armenia … 89%
Australia 80% …
Azerbaijan 62% 46%
Bangladesh 32% 36%
Belarus 87% 89%
Belgium 53% …
Benin 31% …
Bosnia and Herzegovina 87% 79%
Brazil 54% 54%
Bulgaria 86% 86%
Cambodia … 62%
Canada … 97%
China 72% 66%
Cote d’Ivoire … 0%
Estonia … 94%
Georgia 48% 48%
Germany … 91%
Hungary 74% …
India 87% …
Indonesia 88% 87%
Iran 74% 92%
Japan … 58%
Kazakhstan 63% 61%
Kenya … 52%
Kyrgyzstan … 72%
Latvia 82% …
Lithuania 98% 77%
Luxembourg 71% …
Madagascar … 79%
Malaysia 83% 83%
Maldives 72% …
Mauritius 72% 89%
Mexico 40% 40%
Moldova 99% …
Montenegro 24% 95%
Morocco 7% 67%
Myanmar 81% 81%
2009 2011
Nepal 99% 95%
New Zealand … 62%
Nigeria 89% 71%
Pakistan 77% 66%
Paraguay 71% 92%
Philippines 85% 25%
Portugal 69% …
Romania 85% 16%
Russian Federation 83% …
Senegal … 87%
Serbia 80% 77%
Spain 81% …
Sweden 58% 65%
Switzerland 94% …
Tajikistan 63% 69%
Thailand 63% 78%
The former Yugoslav Republic of Macedonia 73% 92%
Tunisia 78% 88%
Ukraine 87% 96%
United Kingdom 81% …
Uzbekistan 82% 80%
Viet Nam 95% 95%
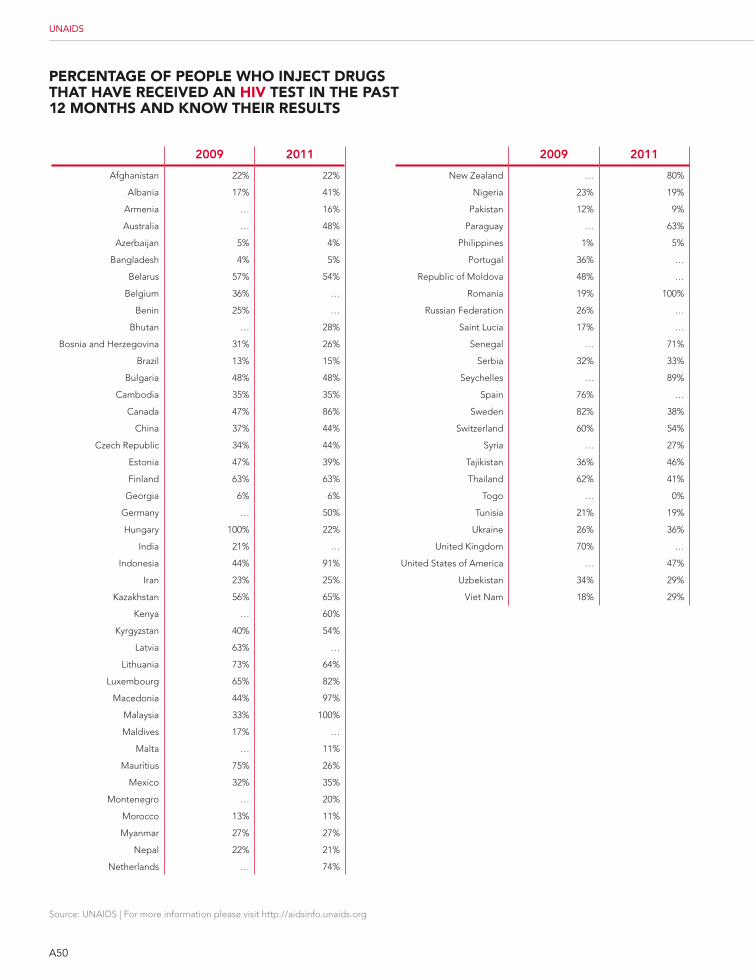
A50
Source: UNAIDS | For more information please visit http://aidsinfo.unaids.org
UNAIDS
PErcEntagE of PEoPlE WHo injEct drugs tHat HaVE rEcEiVEd an HiV tEst in tHE Past 12 montHs and knoW tHEir rEsults
2009 2011
New Zealand … 80%
Nigeria 23% 19%
Pakistan 12% 9%
Paraguay … 63%
Philippines 1% 5%
Portugal 36% …
Republic of Moldova 48% …
Romania 19% 100%
Russian Federation 26% …
Saint Lucia 17% …
Senegal … 71%
Serbia 32% 33%
Seychelles … 89%
Spain 76% …
Sweden 82% 38%
Switzerland 60% 54%
Syria … 27%
Tajikistan 36% 46%
Thailand 62% 41%
Togo … 0%
Tunisia 21% 19%
Ukraine 26% 36%
United Kingdom 70% …
United States of America … 47%
Uzbekistan 34% 29%
Viet Nam 18% 29%
2009 2011
Afghanistan 22% 22%
Albania 17% 41%
Armenia … 16%
Australia … 48%
Azerbaijan 5% 4%
Bangladesh 4% 5%
Belarus 57% 54%
Belgium 36% …
Benin 25% …
Bhutan … 28%
Bosnia and Herzegovina 31% 26%
Brazil 13% 15%
Bulgaria 48% 48%
Cambodia 35% 35%
Canada 47% 86%
China 37% 44%
Czech Republic 34% 44%
Estonia 47% 39%
Finland 63% 63%
Georgia 6% 6%
Germany … 50%
Hungary 100% 22%
India 21% …
Indonesia 44% 91%
Iran 23% 25%
Kazakhstan 56% 65%
Kenya … 60%
Kyrgyzstan 40% 54%
Latvia 63% …
Lithuania 73% 64%
Luxembourg 65% 82%
Macedonia 44% 97%
Malaysia 33% 100%
Maldives 17% …
Malta … 11%
Mauritius 75% 26%
Mexico 32% 35%
Montenegro … 20%
Morocco 13% 11%
Myanmar 27% 27%
Nepal 22% 21%
Netherlands … 74%
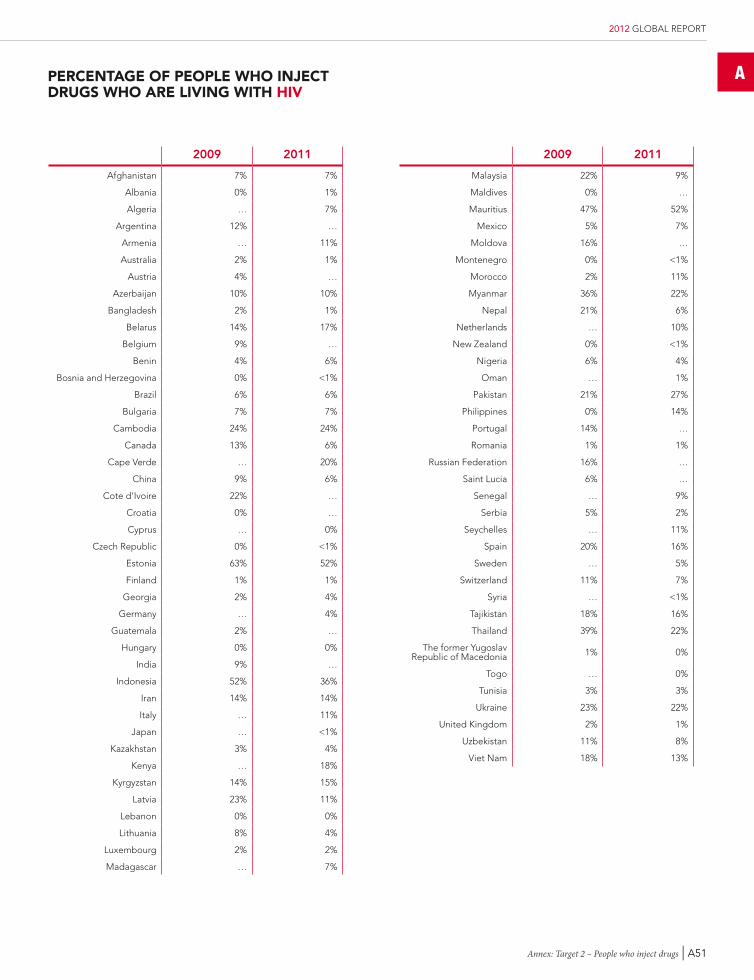
A
Annex: Target 2 – People who inject drugs | A51
2012 GLOBAL REPORT
PErcEntagE of PEoPlE WHo injEct drugs WHo arE liVing WitH HiV
2009 2011
Afghanistan 7% 7%
Albania 0% 1%
Algeria … 7%
Argentina 12% …
Armenia … 11%
Australia 2% 1%
Austria 4% …
Azerbaijan 10% 10%
Bangladesh 2% 1%
Belarus 14% 17%
Belgium 9% …
Benin 4% 6%
Bosnia and Herzegovina 0% <1%
Brazil 6% 6%
Bulgaria 7% 7%
Cambodia 24% 24%
Canada 13% 6%
Cape Verde … 20%
China 9% 6%
Cote d’Ivoire 22% …
Croatia 0% …
Cyprus … 0%
Czech Republic 0% <1%
Estonia 63% 52%
Finland 1% 1%
Georgia 2% 4%
Germany … 4%
Guatemala 2% …
Hungary 0% 0%
India 9% …
Indonesia 52% 36%
Iran 14% 14%
Italy … 11%
Japan … <1%
Kazakhstan 3% 4%
Kenya … 18%
Kyrgyzstan 14% 15%
Latvia 23% 11%
Lebanon 0% 0%
Lithuania 8% 4%
Luxembourg 2% 2%
Madagascar … 7%
2009 2011
Malaysia 22% 9%
Maldives 0% …
Mauritius 47% 52%
Mexico 5% 7%
Moldova 16% …
Montenegro 0% <1%
Morocco 2% 11%
Myanmar 36% 22%
Nepal 21% 6%
Netherlands … 10%
New Zealand 0% <1%
Nigeria 6% 4%
Oman … 1%
Pakistan 21% 27%
Philippines 0% 14%
Portugal 14% …
Romania 1% 1%
Russian Federation 16% …
Saint Lucia 6% …
Senegal … 9%
Serbia 5% 2%
Seychelles … 11%
Spain 20% 16%
Sweden … 5%
Switzerland 11% 7%
Syria … <1%
Tajikistan 18% 16%
Thailand 39% 22%
The former Yugoslav Republic of Macedonia 1% 0%
Togo … 0%
Tunisia 3% 3%
Ukraine 23% 22%
United Kingdom 2% 1%
Uzbekistan 11% 8%
Viet Nam 18% 13%
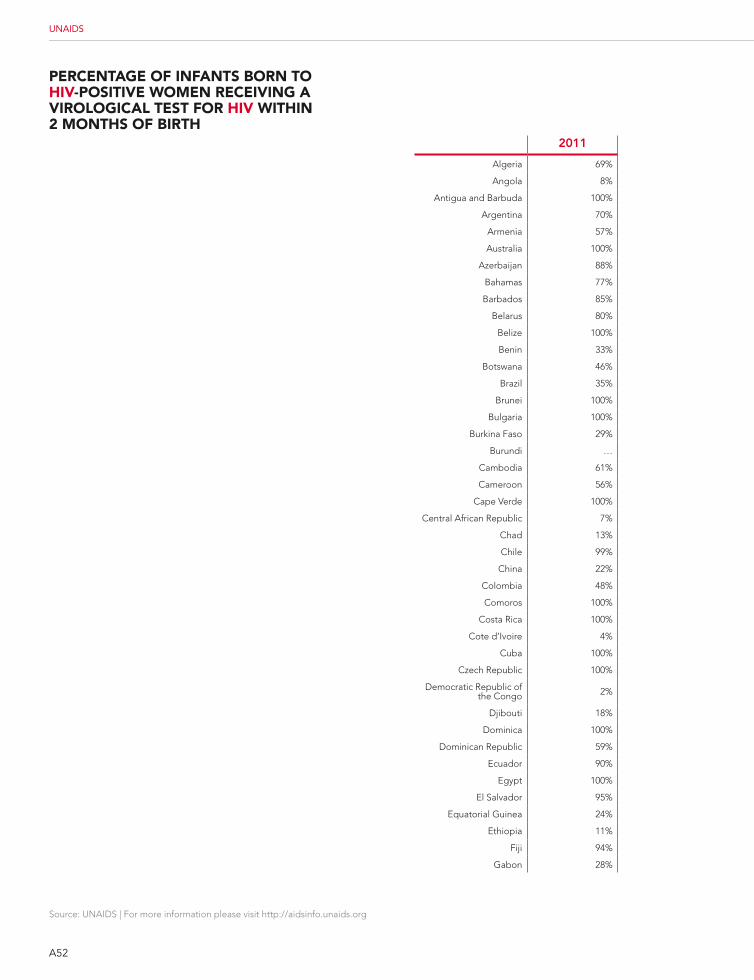
A52
Source: UNAIDS | For more information please visit http://aidsinfo.unaids.org
UNAIDS
PErcEntagE of infants born to HiV-PositiVE WomEn rEcEiVing a Virological tEst for HiV WitHin 2 montHs of birtH
2011
Algeria 69%
Angola 8%
Antigua and Barbuda 100%
Argentina 70%
Armenia 57%
Australia 100%
Azerbaijan 88%
Bahamas 77%
Barbados 85%
Belarus 80%
Belize 100%
Benin 33%
Botswana 46%
Brazil 35%
Brunei 100%
Bulgaria 100%
Burkina Faso 29%
Burundi …
Cambodia 61%
Cameroon 56%
Cape Verde 100%
Central African Republic 7%
Chad 13%
Chile 99%
China 22%
Colombia 48%
Comoros 100%
Costa Rica 100%
Cote d’Ivoire 4%
Cuba 100%
Czech Republic 100%
Democratic Republic of the Congo 2%
Djibouti 18%
Dominica 100%
Dominican Republic 59%
Ecuador 90%
Egypt 100%
El Salvador 95%
Equatorial Guinea 24%
Ethiopia 11%
Fiji 94%
Gabon 28%
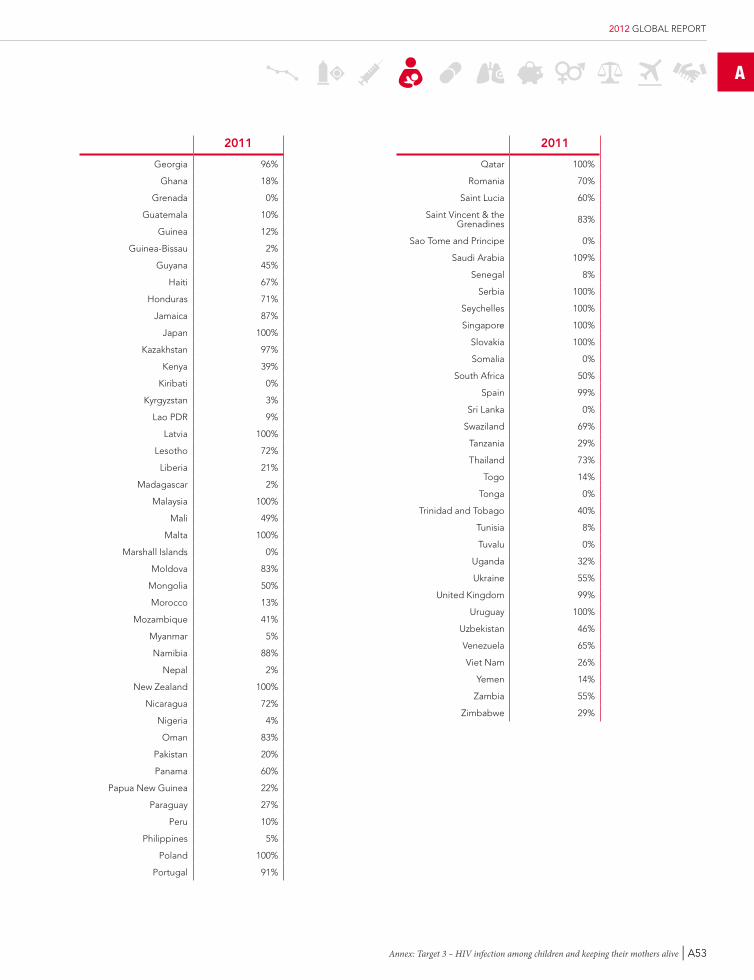
A
Annex: Target 3 – HIV infection among children and keeping their mothers alive | A53
2012 GLOBAL REPORT
2011
Georgia 96%
Ghana 18%
Grenada 0%
Guatemala 10%
Guinea 12%
Guinea-Bissau 2%
Guyana 45%
Haiti 67%
Honduras 71%
Jamaica 87%
Japan 100%
Kazakhstan 97%
Kenya 39%
Kiribati 0%
Kyrgyzstan 3%
Lao PDR 9%
Latvia 100%
Lesotho 72%
Liberia 21%
Madagascar 2%
Malaysia 100%
Mali 49%
Malta 100%
Marshall Islands 0%
Moldova 83%
Mongolia 50%
Morocco 13%
Mozambique 41%
Myanmar 5%
Namibia 88%
Nepal 2%
New Zealand 100%
Nicaragua 72%
Nigeria 4%
Oman 83%
Pakistan 20%
Panama 60%
Papua New Guinea 22%
Paraguay 27%
Peru 10%
Philippines 5%
Poland 100%
Portugal 91%
2011
Qatar 100%
Romania 70%
Saint Lucia 60%
Saint Vincent & the Grenadines 83%
Sao Tome and Principe 0%
Saudi Arabia 109%
Senegal 8%
Serbia 100%
Seychelles 100%
Singapore 100%
Slovakia 100%
Somalia 0%
South Africa 50%
Spain 99%
Sri Lanka 0%
Swaziland 69%
Tanzania 29%
Thailand 73%
Togo 14%
Tonga 0%
Trinidad and Tobago 40%
Tunisia 8%
Tuvalu 0%
Uganda 32%
Ukraine 55%
United Kingdom 99%
Uruguay 100%
Uzbekistan 46%
Venezuela 65%
Viet Nam 26%
Yemen 14%
Zambia 55%
Zimbabwe 29%
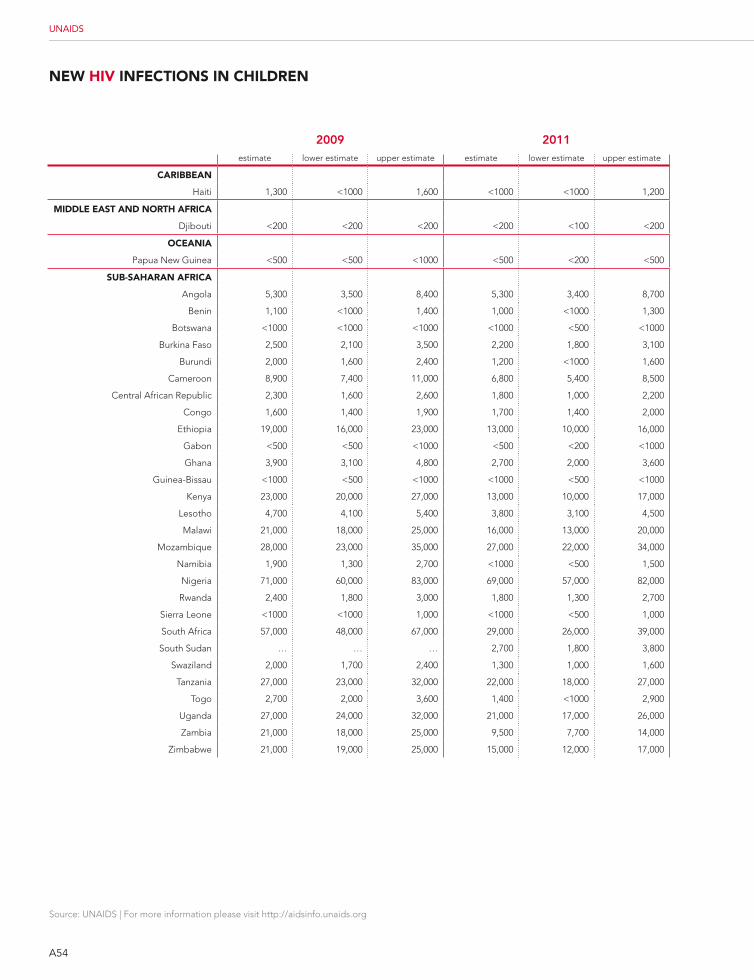
A54
Source: UNAIDS | For more information please visit http://aidsinfo.unaids.org
UNAIDS
nEW HiV infEctions in cHildrEn
2009 2011estimate lower estimate upper estimate estimate lower estimate upper estimate
caribbEan
Haiti 1,300 <1000 1,600 <1000 <1000 1,200
middlE East and nortH africa
Djibouti <200 <200 <200 <200 <100 <200
ocEania
Papua New Guinea <500 <500 <1000 <500 <200 <500
sub-saHaran africa
Angola 5,300 3,500 8,400 5,300 3,400 8,700
Benin 1,100 <1000 1,400 1,000 <1000 1,300
Botswana <1000 <1000 <1000 <1000 <500 <1000
Burkina Faso 2,500 2,100 3,500 2,200 1,800 3,100
Burundi 2,000 1,600 2,400 1,200 <1000 1,600
Cameroon 8,900 7,400 11,000 6,800 5,400 8,500
Central African Republic 2,300 1,600 2,600 1,800 1,000 2,200
Congo 1,600 1,400 1,900 1,700 1,400 2,000
Ethiopia 19,000 16,000 23,000 13,000 10,000 16,000
Gabon <500 <500 <1000 <500 <200 <1000
Ghana 3,900 3,100 4,800 2,700 2,000 3,600
Guinea-Bissau <1000 <500 <1000 <1000 <500 <1000
Kenya 23,000 20,000 27,000 13,000 10,000 17,000
Lesotho 4,700 4,100 5,400 3,800 3,100 4,500
Malawi 21,000 18,000 25,000 16,000 13,000 20,000
Mozambique 28,000 23,000 35,000 27,000 22,000 34,000
Namibia 1,900 1,300 2,700 <1000 <500 1,500
Nigeria 71,000 60,000 83,000 69,000 57,000 82,000
Rwanda 2,400 1,800 3,000 1,800 1,300 2,700
Sierra Leone <1000 <1000 1,000 <1000 <500 1,000
South Africa 57,000 48,000 67,000 29,000 26,000 39,000
South Sudan … … … 2,700 1,800 3,800
Swaziland 2,000 1,700 2,400 1,300 1,000 1,600
Tanzania 27,000 23,000 32,000 22,000 18,000 27,000
Togo 2,700 2,000 3,600 1,400 <1000 2,900
Uganda 27,000 24,000 32,000 21,000 17,000 26,000
Zambia 21,000 18,000 25,000 9,500 7,700 14,000
Zimbabwe 21,000 19,000 25,000 15,000 12,000 17,000
A
Annex: Target 3 – HIV infection among children and keeping their mothers alive | A55
2012 GLOBAL REPORT
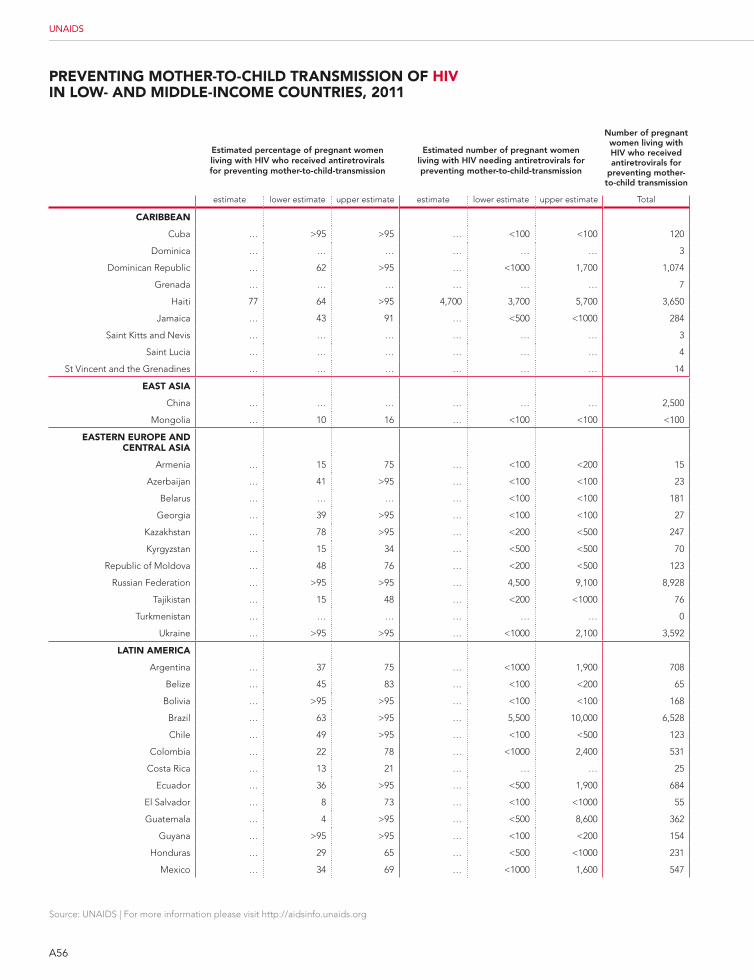
A56
Source: UNAIDS | For more information please visit http://aidsinfo.unaids.org
UNAIDS
PrEVEnting motHEr-to-cHild transmission of HiV in loW- and middlE-incomE countriEs, 2011
estimated percentage of pregnant women living with HiV who received antiretrovirals for preventing mother-to-child-transmission
estimated number of pregnant women living with HiV needing antiretrovirals for preventing mother-to-child-transmission
number of pregnant women living with HiV who received antiretrovirals for
preventing mother-to-child transmission
estimate lower estimate upper estimate estimate lower estimate upper estimate Total
caribbEan
Cuba … >95 >95 … <100 <100 120
Dominica … … … … … … 3
Dominican Republic … 62 >95 … <1000 1,700 1,074
Grenada … … … … … … 7
Haiti 77 64 >95 4,700 3,700 5,700 3,650
Jamaica … 43 91 … <500 <1000 284
Saint Kitts and Nevis … … … … … … 3
Saint Lucia … … … … … … 4
St Vincent and the Grenadines … … … … … … 14
East asia
China … … … … … … 2,500
Mongolia … 10 16 … <100 <100 <100
EastErn EuroPE and cEntral asia
Armenia … 15 75 … <100 <200 15
Azerbaijan … 41 >95 … <100 <100 23
Belarus … … … … <100 <100 181
Georgia … 39 >95 … <100 <100 27
Kazakhstan … 78 >95 … <200 <500 247
Kyrgyzstan … 15 34 … <500 <500 70
Republic of Moldova … 48 76 … <200 <500 123
Russian Federation … >95 >95 … 4,500 9,100 8,928
Tajikistan … 15 48 … <200 <1000 76
Turkmenistan … … … … … … 0
Ukraine … >95 >95 … <1000 2,100 3,592
latin amErica
Argentina … 37 75 … <1000 1,900 708
Belize … 45 83 … <100 <200 65
Bolivia … >95 >95 … <100 <100 168
Brazil … 63 >95 … 5,500 10,000 6,528
Chile … 49 >95 … <100 <500 123
Colombia … 22 78 … <1000 2,400 531
Costa Rica … 13 21 … … … 25
Ecuador … 36 >95 … <500 1,900 684
El Salvador … 8 73 … <100 <1000 55
Guatemala … 4 >95 … <500 8,600 362
Guyana … >95 >95 … <100 <200 154
Honduras … 29 65 … <500 <1000 231
Mexico … 34 69 … <1000 1,600 547
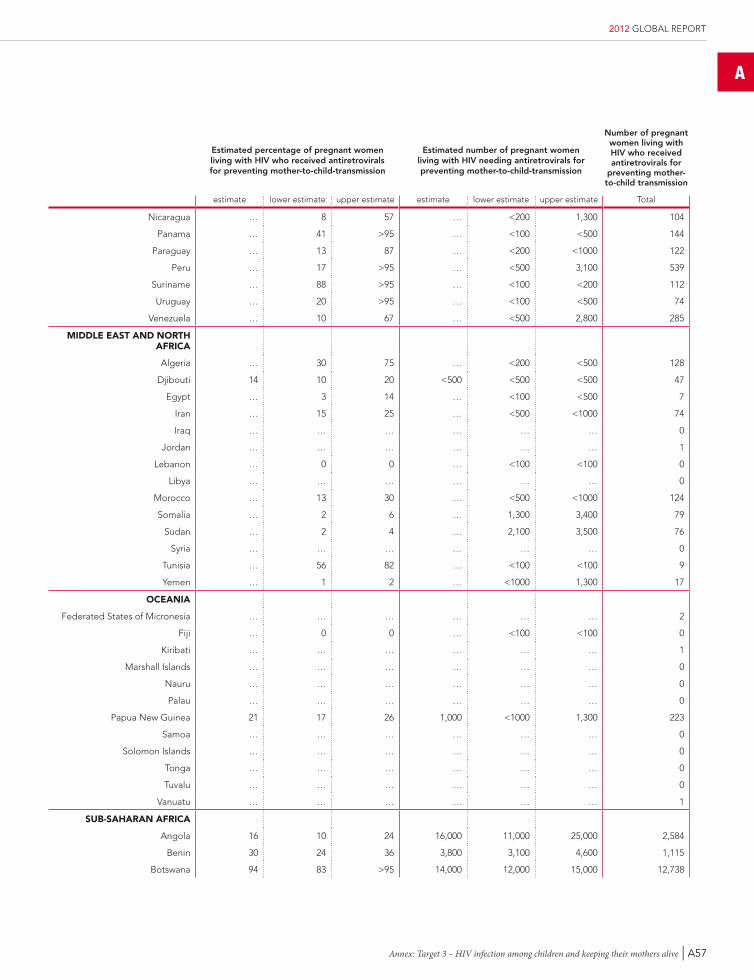
A
Annex: Target 3 – HIV infection among children and keeping their mothers alive | A57
2012 GLOBAL REPORT
estimated percentage of pregnant women living with HiV who received antiretrovirals for preventing mother-to-child-transmission
estimated number of pregnant women living with HiV needing antiretrovirals for preventing mother-to-child-transmission
number of pregnant women living with HiV who received antiretrovirals for
preventing mother-to-child transmission
estimate lower estimate upper estimate estimate lower estimate upper estimate Total
Nicaragua … 8 57 … <200 1,300 104
Panama … 41 >95 … <100 <500 144
Paraguay … 13 87 … <200 <1000 122
Peru … 17 >95 … <500 3,100 539
Suriname … 88 >95 … <100 <200 112
Uruguay … 20 >95 … <100 <500 74
Venezuela … 10 67 … <500 2,800 285
middlE East and nortH africa
Algeria … 30 75 … <200 <500 128
Djibouti 14 10 20 <500 <500 <500 47
Egypt … 3 14 … <100 <500 7
Iran … 15 25 … <500 <1000 74
Iraq … … … … … … 0
Jordan … … … … … … 1
Lebanon … 0 0 … <100 <100 0
Libya … … … … … … 0
Morocco … 13 30 … <500 <1000 124
Somalia … 2 6 … 1,300 3,400 79
Sudan … 2 4 … 2,100 3,500 76
Syria … … … … … … 0
Tunisia … 56 82 … <100 <100 9
Yemen … 1 2 … <1000 1,300 17
ocEania
Federated States of Micronesia … … … … … … 2
Fiji … 0 0 … <100 <100 0
Kiribati … … … … … … 1
Marshall Islands … … … … … … 0
Nauru … … … … … … 0
Palau … … … … … … 0
Papua New Guinea 21 17 26 1,000 <1000 1,300 223
Samoa … … … … … … 0
Solomon Islands … … … … … … 0
Tonga … … … … … … 0
Tuvalu … … … … … … 0
Vanuatu … … … … … … 1
sub-saHaran africa
Angola 16 10 24 16,000 11,000 25,000 2,584
Benin 30 24 36 3,800 3,100 4,600 1,115
Botswana 94 83 >95 14,000 12,000 15,000 12,738
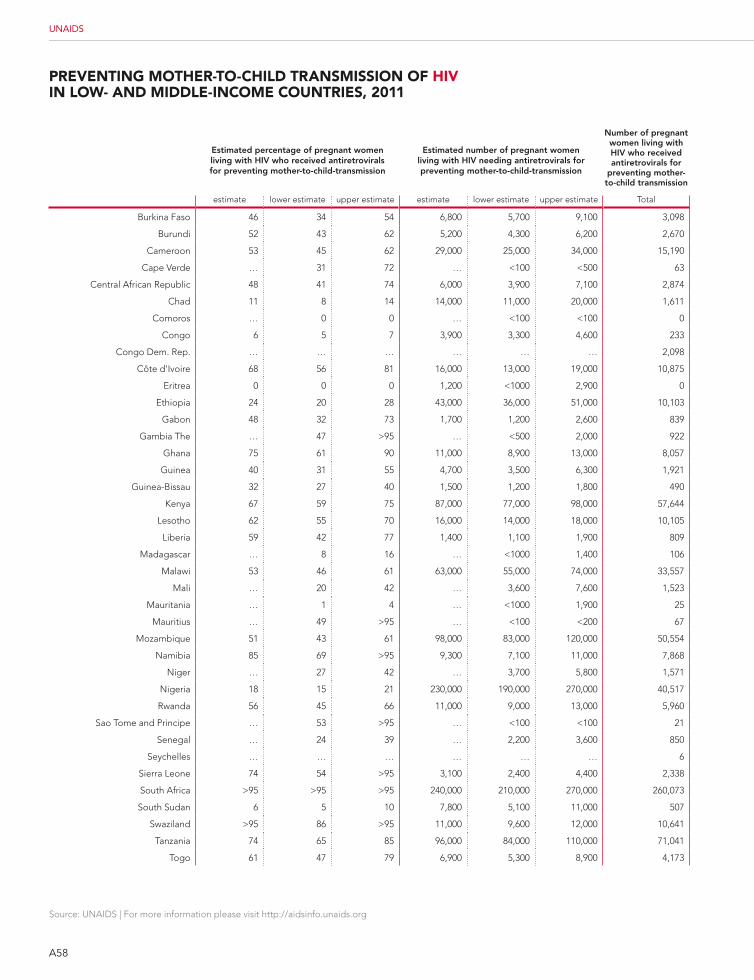
A58
Source: UNAIDS | For more information please visit http://aidsinfo.unaids.org
UNAIDS
PrEVEnting motHEr-to-cHild transmission of HiV in loW- and middlE-incomE countriEs, 2011
estimated percentage of pregnant women living with HiV who received antiretrovirals for preventing mother-to-child-transmission
estimated number of pregnant women living with HiV needing antiretrovirals for preventing mother-to-child-transmission
number of pregnant women living with HiV who received antiretrovirals for
preventing mother-to-child transmission
estimate lower estimate upper estimate estimate lower estimate upper estimate Total
Burkina Faso 46 34 54 6,800 5,700 9,100 3,098
Burundi 52 43 62 5,200 4,300 6,200 2,670
Cameroon 53 45 62 29,000 25,000 34,000 15,190
Cape Verde … 31 72 … <100 <500 63
Central African Republic 48 41 74 6,000 3,900 7,100 2,874
Chad 11 8 14 14,000 11,000 20,000 1,611
Comoros … 0 0 … <100 <100 0
Congo 6 5 7 3,900 3,300 4,600 233
Congo Dem. Rep. … … … … … … 2,098
Côte d'Ivoire 68 56 81 16,000 13,000 19,000 10,875
Eritrea 0 0 0 1,200 <1000 2,900 0
Ethiopia 24 20 28 43,000 36,000 51,000 10,103
Gabon 48 32 73 1,700 1,200 2,600 839
Gambia The … 47 >95 … <500 2,000 922
Ghana 75 61 90 11,000 8,900 13,000 8,057
Guinea 40 31 55 4,700 3,500 6,300 1,921
Guinea-Bissau 32 27 40 1,500 1,200 1,800 490
Kenya 67 59 75 87,000 77,000 98,000 57,644
Lesotho 62 55 70 16,000 14,000 18,000 10,105
Liberia 59 42 77 1,400 1,100 1,900 809
Madagascar … 8 16 … <1000 1,400 106
Malawi 53 46 61 63,000 55,000 74,000 33,557
Mali … 20 42 … 3,600 7,600 1,523
Mauritania … 1 4 … <1000 1,900 25
Mauritius … 49 >95 … <100 <200 67
Mozambique 51 43 61 98,000 83,000 120,000 50,554
Namibia 85 69 >95 9,300 7,100 11,000 7,868
Niger … 27 42 … 3,700 5,800 1,571
Nigeria 18 15 21 230,000 190,000 270,000 40,517
Rwanda 56 45 66 11,000 9,000 13,000 5,960
Sao Tome and Principe … 53 >95 … <100 <100 21
Senegal … 24 39 … 2,200 3,600 850
Seychelles … … … … … … 6
Sierra Leone 74 54 >95 3,100 2,400 4,400 2,338
South Africa >95 >95 >95 240,000 210,000 270,000 260,073
South Sudan 6 5 10 7,800 5,100 11,000 507
Swaziland >95 86 >95 11,000 9,600 12,000 10,641
Tanzania 74 65 85 96,000 84,000 110,000 71,041
Togo 61 47 79 6,900 5,300 8,900 4,173
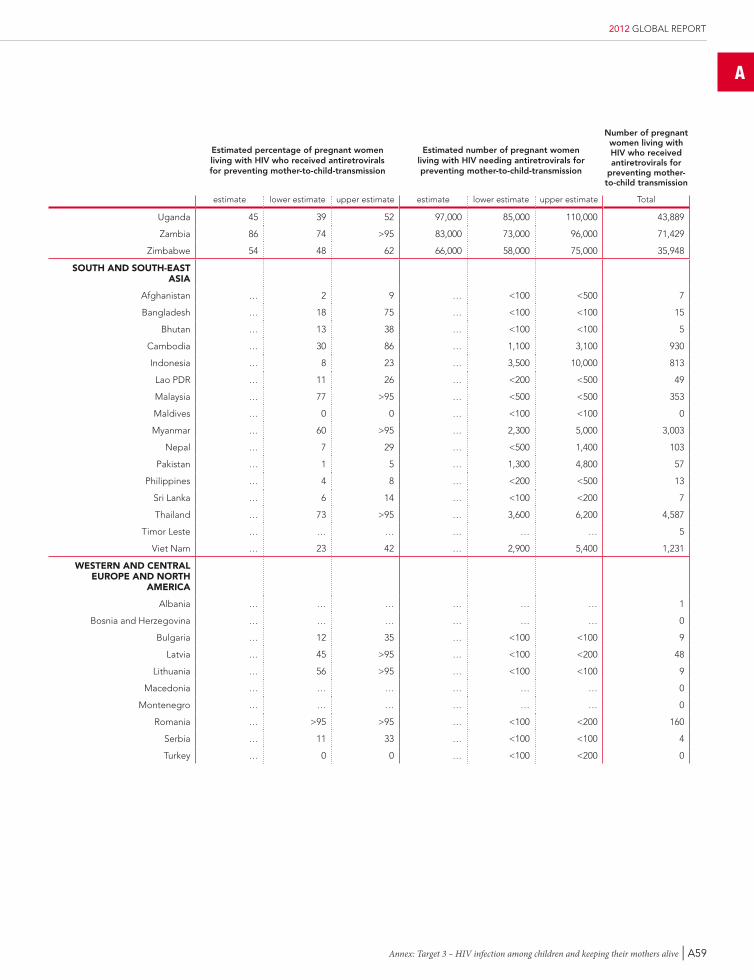
A
Annex: Target 3 – HIV infection among children and keeping their mothers alive | A59
2012 GLOBAL REPORT
estimated percentage of pregnant women living with HiV who received antiretrovirals for preventing mother-to-child-transmission
estimated number of pregnant women living with HiV needing antiretrovirals for preventing mother-to-child-transmission
number of pregnant women living with HiV who received antiretrovirals for
preventing mother-to-child transmission
estimate lower estimate upper estimate estimate lower estimate upper estimate Total
Uganda 45 39 52 97,000 85,000 110,000 43,889
Zambia 86 74 >95 83,000 73,000 96,000 71,429
Zimbabwe 54 48 62 66,000 58,000 75,000 35,948
soutH and soutH-East asia
Afghanistan … 2 9 … <100 <500 7
Bangladesh … 18 75 … <100 <100 15
Bhutan … 13 38 … <100 <100 5
Cambodia … 30 86 … 1,100 3,100 930
Indonesia … 8 23 … 3,500 10,000 813
Lao PDR … 11 26 … <200 <500 49
Malaysia … 77 >95 … <500 <500 353
Maldives … 0 0 … <100 <100 0
Myanmar … 60 >95 … 2,300 5,000 3,003
Nepal … 7 29 … <500 1,400 103
Pakistan … 1 5 … 1,300 4,800 57
Philippines … 4 8 … <200 <500 13
Sri Lanka … 6 14 … <100 <200 7
Thailand … 73 >95 … 3,600 6,200 4,587
Timor Leste … … … … … … 5
Viet Nam … 23 42 … 2,900 5,400 1,231
WEstErn and cEntral EuroPE and nortH
amErica
Albania … … … … … … 1
Bosnia and Herzegovina … … … … … … 0
Bulgaria … 12 35 … <100 <100 9
Latvia … 45 >95 … <100 <200 48
Lithuania … 56 >95 … <100 <100 9
Macedonia … … … … … … 0
Montenegro … … … … … … 0
Romania … >95 >95 … <100 <200 160
Serbia … 11 33 … <100 <100 4
Turkey … 0 0 … <100 <200 0
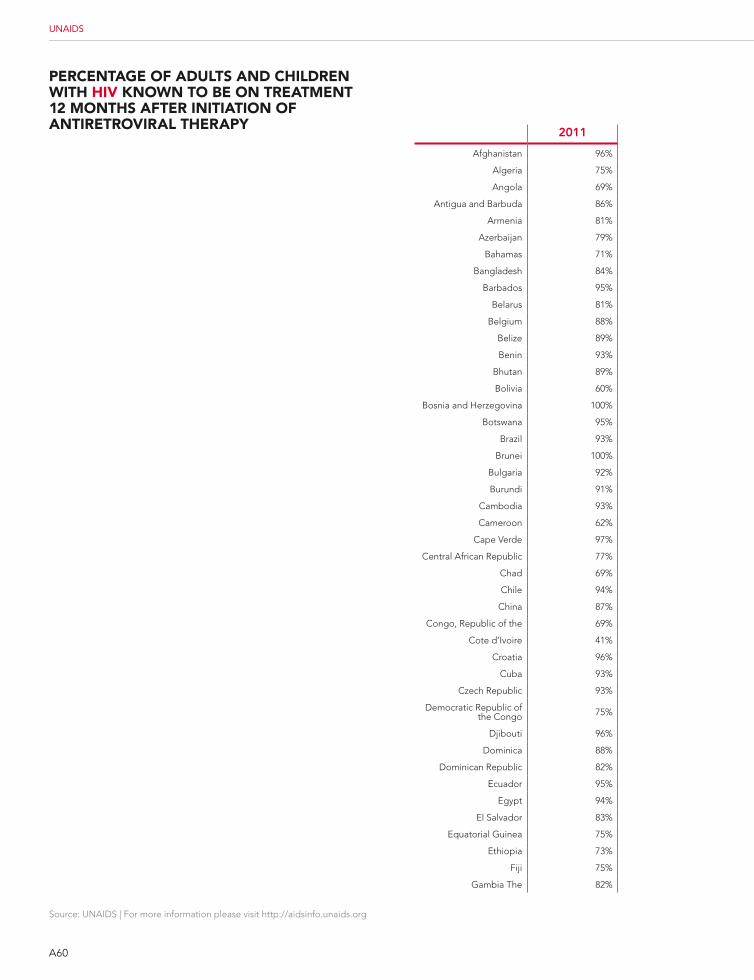
A60
Source: UNAIDS | For more information please visit http://aidsinfo.unaids.org
UNAIDS
PErcEntagE of adults and cHildrEn WitH HiV knoWn to bE on trEatmEnt 12 montHs aftEr initiation of antirEtroViral tHEraPY
2011
Afghanistan 96%
Algeria 75%
Angola 69%
Antigua and Barbuda 86%
Armenia 81%
Azerbaijan 79%
Bahamas 71%
Bangladesh 84%
Barbados 95%
Belarus 81%
Belgium 88%
Belize 89%
Benin 93%
Bhutan 89%
Bolivia 60%
Bosnia and Herzegovina 100%
Botswana 95%
Brazil 93%
Brunei 100%
Bulgaria 92%
Burundi 91%
Cambodia 93%
Cameroon 62%
Cape Verde 97%
Central African Republic 77%
Chad 69%
Chile 94%
China 87%
Congo, Republic of the 69%
Cote d’Ivoire 41%
Croatia 96%
Cuba 93%
Czech Republic 93%
Democratic Republic of the Congo 75%
Djibouti 96%
Dominica 88%
Dominican Republic 82%
Ecuador 95%
Egypt 94%
El Salvador 83%
Equatorial Guinea 75%
Ethiopia 73%
Fiji 75%
Gambia The 82%
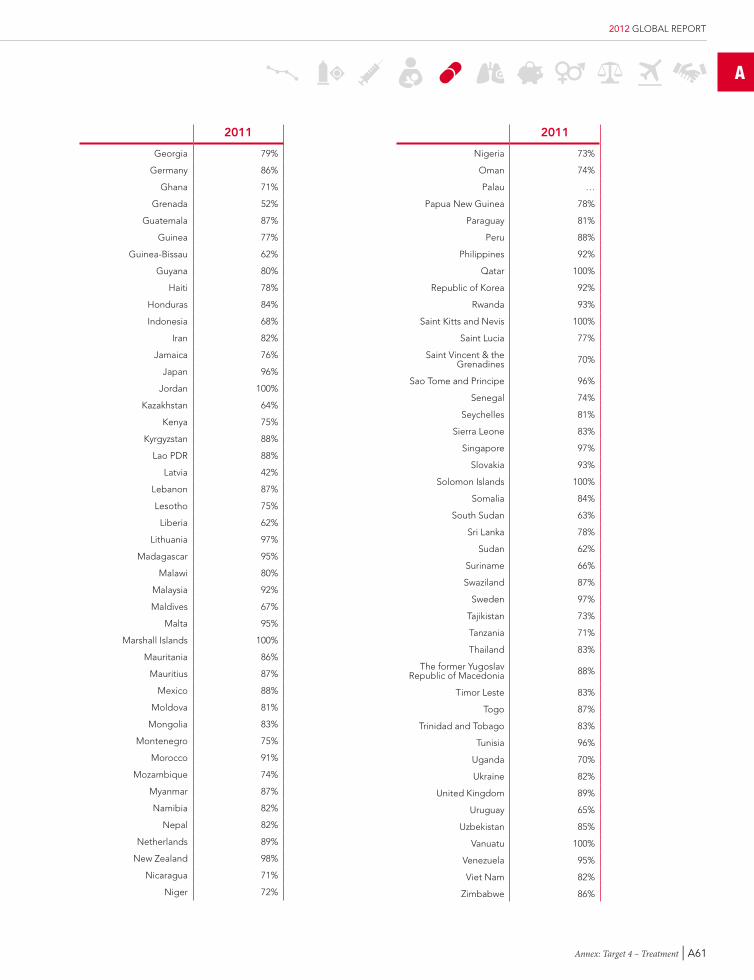
A
Annex: Target 4 – Treatment | A61
2012 GLOBAL REPORT
2011
Georgia 79%
Germany 86%
Ghana 71%
Grenada 52%
Guatemala 87%
Guinea 77%
Guinea-Bissau 62%
Guyana 80%
Haiti 78%
Honduras 84%
Indonesia 68%
Iran 82%
Jamaica 76%
Japan 96%
Jordan 100%
Kazakhstan 64%
Kenya 75%
Kyrgyzstan 88%
Lao PDR 88%
Latvia 42%
Lebanon 87%
Lesotho 75%
Liberia 62%
Lithuania 97%
Madagascar 95%
Malawi 80%
Malaysia 92%
Maldives 67%
Malta 95%
Marshall Islands 100%
Mauritania 86%
Mauritius 87%
Mexico 88%
Moldova 81%
Mongolia 83%
Montenegro 75%
Morocco 91%
Mozambique 74%
Myanmar 87%
Namibia 82%
Nepal 82%
Netherlands 89%
New Zealand 98%
Nicaragua 71%
Niger 72%
2011
Nigeria 73%
Oman 74%
Palau …
Papua New Guinea 78%
Paraguay 81%
Peru 88%
Philippines 92%
Qatar 100%
Republic of Korea 92%
Rwanda 93%
Saint Kitts and Nevis 100%
Saint Lucia 77%
Saint Vincent & the Grenadines 70%
Sao Tome and Principe 96%
Senegal 74%
Seychelles 81%
Sierra Leone 83%
Singapore 97%
Slovakia 93%
Solomon Islands 100%
Somalia 84%
South Sudan 63%
Sri Lanka 78%
Sudan 62%
Suriname 66%
Swaziland 87%
Sweden 97%
Tajikistan 73%
Tanzania 71%
Thailand 83%
The former Yugoslav Republic of Macedonia 88%
Timor Leste 83%
Togo 87%
Trinidad and Tobago 83%
Tunisia 96%
Uganda 70%
Ukraine 82%
United Kingdom 89%
Uruguay 65%
Uzbekistan 85%
Vanuatu 100%
Venezuela 95%
Viet Nam 82%
Zimbabwe 86%
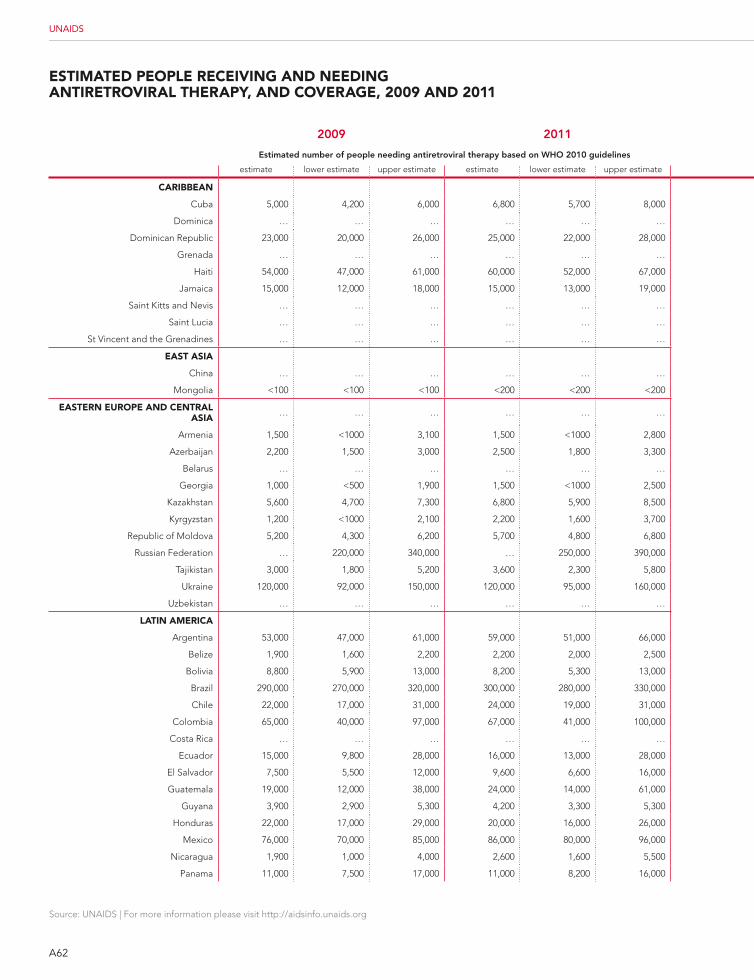
A62
Source: UNAIDS | For more information please visit http://aidsinfo.unaids.org
UNAIDS
2009 2011 2009 2011 2009 2011
estimated number of people needing antiretroviral therapy based on WHo 2010 guidelines estimated art Coverage based on WHo 2010 guidelines reported number of people on art
estimate lower estimate upper estimate estimate lower estimate upper estimate estimate lower estimate upper estimate estimate lower estimate upper estimate Total Total
caribbEan
Cuba 5,000 4,200 6,000 6,800 5,700 8,000 >95 84 >95 >95 87 >95 5,034 7,018
Dominica … … … … … … … … … … … … 38 39
Dominican Republic 23,000 20,000 26,000 25,000 22,000 28,000 60 54 69 80 72 90 13,785 20,247
Grenada … … … … … … … … … … … … 54 73
Haiti 54,000 47,000 61,000 60,000 52,000 67,000 48 43 56 58 52 67 26,007 34,935
Jamaica 15,000 12,000 18,000 15,000 13,000 19,000 50 40 60 60 48 71 7,244 9,167
Saint Kitts and Nevis … … … … … … … … … … … … … 50
Saint Lucia … … … … … … … … … … … … 124 170
St Vincent and the Grenadines … … … … … … … … … … … … 162 184
East asia
China … … … … … … … … … … … … 65,481 126,448
Mongolia <100 <100 <100 <200 <200 <200 15 13 17 27 23 31 10 38
EastErn EuroPE and cEntral asia … … … … … … … … … … … … … …
Armenia 1,500 <1000 3,100 1,500 <1000 2,800 12 6 20 22 12 34 179 330
Azerbaijan 2,200 1,500 3,000 2,500 1,800 3,300 11 8 16 28 22 38 238 707
Belarus … … … … … … 28 20 37 40 29 54 1,776 3,223
Georgia 1,000 <500 1,900 1,500 <1000 2,500 63 34 >95 76 44 >95 655 1,122
Kazakhstan 5,600 4,700 7,300 6,800 5,900 8,500 18 14 22 27 21 31 1,035 1,830
Kyrgyzstan 1,200 <1000 2,100 2,200 1,600 3,700 19 11 29 23 14 33 231 510
Republic of Moldova 5,200 4,300 6,200 5,700 4,800 6,800 19 16 23 29 24 35 984 1,666
Russian Federation … 220,000 340,000 … 250,000 390,000 … 22 27 … 22 27 75,900 85,716
Tajikistan 3,000 1,800 5,200 3,600 2,300 5,800 11 6 18 22 13 33 322 769
Ukraine 120,000 92,000 150,000 120,000 95,000 160,000 13 10 17 22 17 28 15,871 26,720
Uzbekistan … … … … … … … … … … … … 1,753 3,832
latin amErica
Argentina 53,000 47,000 61,000 59,000 51,000 66,000 81 70 92 79 69 91 42,815 46,000
Belize 1,900 1,600 2,200 2,200 2,000 2,500 45 38 52 62 55 69 855 1,358
Bolivia 8,800 5,900 13,000 8,200 5,300 13,000 13 8 19 15 10 24 1,115 1,261
Brazil 290,000 270,000 320,000 300,000 280,000 330,000 64 58 69 71 65 77 185,982 215,676
Chile 22,000 17,000 31,000 24,000 19,000 31,000 59 42 76 66 50 83 12,762 15,617
Colombia 65,000 40,000 97,000 67,000 41,000 100,000 25 17 40 46 30 74 16,302 30,612
Costa Rica … … … … … … 68 60 80 73 65 85 3,064 3,663
Ecuador 15,000 9,800 28,000 16,000 13,000 28,000 36 20 57 68 40 90 5,538 11,201
El Salvador 7,500 5,500 12,000 9,600 6,600 16,000 >95 70 >95 72 43 >95 … 6,923
Guatemala 19,000 12,000 38,000 24,000 14,000 61,000 55 27 88 56 22 >95 10,362 13,585
Guyana 3,900 2,900 5,300 4,200 3,300 5,300 72 53 >95 82 65 >95 2,832 3,432
Honduras 22,000 17,000 29,000 20,000 16,000 26,000 32 25 41 41 32 51 7,075 8,355
Mexico 76,000 70,000 85,000 86,000 80,000 96,000 80 72 87 84 75 90 60,911 71,849
Nicaragua 1,900 1,000 4,000 2,600 1,600 5,500 57 26 >95 65 31 >95 1,063 1,686
Panama 11,000 7,500 17,000 11,000 8,200 16,000 42 27 59 49 32 63 4,463 5,156
EstimatEd PEoPlE rEcEiVing and nEEding antirEtroViral tHEraPY, and coVEragE, 2009 and 2011
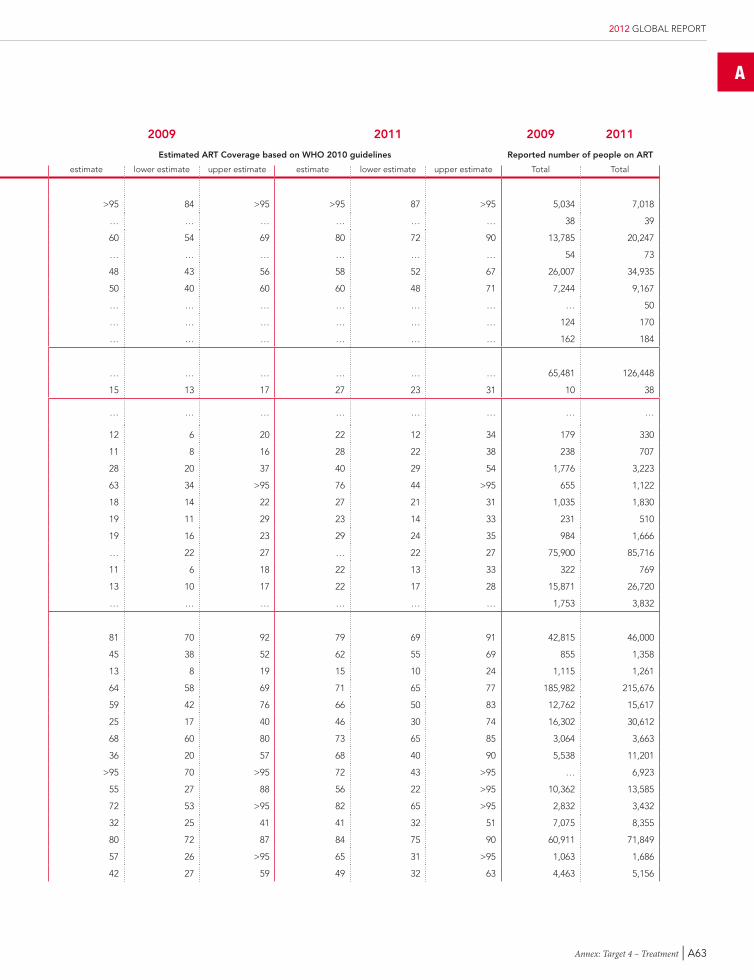
A
Annex: Target 4 – Treatment | A63
2012 GLOBAL REPORT
2009 2011 2009 2011 2009 2011
estimated number of people needing antiretroviral therapy based on WHo 2010 guidelines estimated art Coverage based on WHo 2010 guidelines reported number of people on art
estimate lower estimate upper estimate estimate lower estimate upper estimate estimate lower estimate upper estimate estimate lower estimate upper estimate Total Total
caribbEan
Cuba 5,000 4,200 6,000 6,800 5,700 8,000 >95 84 >95 >95 87 >95 5,034 7,018
Dominica … … … … … … … … … … … … 38 39
Dominican Republic 23,000 20,000 26,000 25,000 22,000 28,000 60 54 69 80 72 90 13,785 20,247
Grenada … … … … … … … … … … … … 54 73
Haiti 54,000 47,000 61,000 60,000 52,000 67,000 48 43 56 58 52 67 26,007 34,935
Jamaica 15,000 12,000 18,000 15,000 13,000 19,000 50 40 60 60 48 71 7,244 9,167
Saint Kitts and Nevis … … … … … … … … … … … … … 50
Saint Lucia … … … … … … … … … … … … 124 170
St Vincent and the Grenadines … … … … … … … … … … … … 162 184
East asia
China … … … … … … … … … … … … 65,481 126,448
Mongolia <100 <100 <100 <200 <200 <200 15 13 17 27 23 31 10 38
EastErn EuroPE and cEntral asia … … … … … … … … … … … … … …
Armenia 1,500 <1000 3,100 1,500 <1000 2,800 12 6 20 22 12 34 179 330
Azerbaijan 2,200 1,500 3,000 2,500 1,800 3,300 11 8 16 28 22 38 238 707
Belarus … … … … … … 28 20 37 40 29 54 1,776 3,223
Georgia 1,000 <500 1,900 1,500 <1000 2,500 63 34 >95 76 44 >95 655 1,122
Kazakhstan 5,600 4,700 7,300 6,800 5,900 8,500 18 14 22 27 21 31 1,035 1,830
Kyrgyzstan 1,200 <1000 2,100 2,200 1,600 3,700 19 11 29 23 14 33 231 510
Republic of Moldova 5,200 4,300 6,200 5,700 4,800 6,800 19 16 23 29 24 35 984 1,666
Russian Federation … 220,000 340,000 … 250,000 390,000 … 22 27 … 22 27 75,900 85,716
Tajikistan 3,000 1,800 5,200 3,600 2,300 5,800 11 6 18 22 13 33 322 769
Ukraine 120,000 92,000 150,000 120,000 95,000 160,000 13 10 17 22 17 28 15,871 26,720
Uzbekistan … … … … … … … … … … … … 1,753 3,832
latin amErica
Argentina 53,000 47,000 61,000 59,000 51,000 66,000 81 70 92 79 69 91 42,815 46,000
Belize 1,900 1,600 2,200 2,200 2,000 2,500 45 38 52 62 55 69 855 1,358
Bolivia 8,800 5,900 13,000 8,200 5,300 13,000 13 8 19 15 10 24 1,115 1,261
Brazil 290,000 270,000 320,000 300,000 280,000 330,000 64 58 69 71 65 77 185,982 215,676
Chile 22,000 17,000 31,000 24,000 19,000 31,000 59 42 76 66 50 83 12,762 15,617
Colombia 65,000 40,000 97,000 67,000 41,000 100,000 25 17 40 46 30 74 16,302 30,612
Costa Rica … … … … … … 68 60 80 73 65 85 3,064 3,663
Ecuador 15,000 9,800 28,000 16,000 13,000 28,000 36 20 57 68 40 90 5,538 11,201
El Salvador 7,500 5,500 12,000 9,600 6,600 16,000 >95 70 >95 72 43 >95 … 6,923
Guatemala 19,000 12,000 38,000 24,000 14,000 61,000 55 27 88 56 22 >95 10,362 13,585
Guyana 3,900 2,900 5,300 4,200 3,300 5,300 72 53 >95 82 65 >95 2,832 3,432
Honduras 22,000 17,000 29,000 20,000 16,000 26,000 32 25 41 41 32 51 7,075 8,355
Mexico 76,000 70,000 85,000 86,000 80,000 96,000 80 72 87 84 75 90 60,911 71,849
Nicaragua 1,900 1,000 4,000 2,600 1,600 5,500 57 26 >95 65 31 >95 1,063 1,686
Panama 11,000 7,500 17,000 11,000 8,200 16,000 42 27 59 49 32 63 4,463 5,156
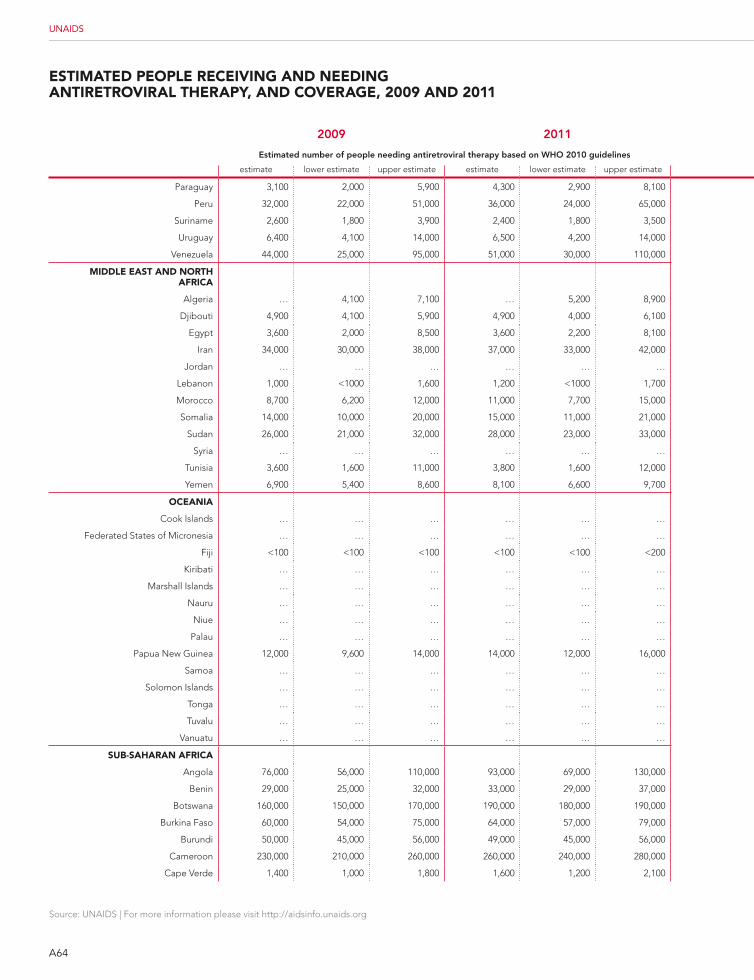
A64
Source: UNAIDS | For more information please visit http://aidsinfo.unaids.org
UNAIDS
EstimatEd PEoPlE rEcEiVing and nEEding antirEtroViral tHEraPY, and coVEragE, 2009 and 2011
2009 2011 2009 2011 2009 2011
estimated number of people needing antiretroviral therapy based on WHo 2010 guidelines estimated art Coverage based on WHo 2010 guidelines reported number of people on art
estimate lower estimate upper estimate estimate lower estimate upper estimate estimate lower estimate upper estimate estimate lower estimate upper estimate Total Total
Paraguay 3,100 2,000 5,900 4,300 2,900 8,100 66 35 >95 69 36 >95 2,073 2,952
Peru 32,000 22,000 51,000 36,000 24,000 65,000 46 29 66 60 33 90 14,780 21,509
Suriname 2,600 1,800 3,900 2,400 1,800 3,500 38 25 54 53 36 72 973 1,276
Uruguay 6,400 4,100 14,000 6,500 4,200 14,000 39 18 61 41 19 63 2,510 2,658
Venezuela 44,000 25,000 95,000 51,000 30,000 110,000 74 34 >95 79 38 >95 32,302 40,384
middlE East and nortH africa
Algeria … 4,100 7,100 … 5,200 8,900 28 22 37 39 30 51 1,526 2,680
Djibouti 4,900 4,100 5,900 4,900 4,000 6,100 19 16 22 27 22 33 913 1,328
Egypt 3,600 2,000 8,500 3,600 2,200 8,100 10 4 18 21 9 34 359 760
Iran 34,000 30,000 38,000 37,000 33,000 42,000 4 4 5 7 7 8 1,486 2,752
Jordan … … … … … … … … … … … … 63 108
Lebanon 1,000 <1000 1,600 1,200 <1000 1,700 35 23 54 36 25 52 354 425
Morocco 8,700 6,200 12,000 11,000 7,700 15,000 31 22 43 37 27 52 2,647 4,047
Somalia 14,000 10,000 20,000 15,000 11,000 21,000 4 3 6 7 5 11 578 1,139
Sudan 26,000 21,000 32,000 28,000 23,000 33,000 8 6 9 9 7 11 1,996 2,500
Syria … … … … … … … … … … … … 99 130
Tunisia 3,600 1,600 11,000 3,800 1,600 12,000 70 61 81 67 61 76 412 483
Yemen 6,900 5,400 8,600 8,100 6,600 9,700 4 3 5 8 6 9 274 625
ocEania
Cook Islands … … … … … … … … … … … … … 0
Federated States of Micronesia … … … … … … … … … … … … 5 …
Fiji <100 <100 <100 <100 <100 <200 93 78 >95 87 71 >95 52 74
Kiribati … … … … … … … … … … … … … 6
Marshall Islands … … … … … … … … … … … … 4 7
Nauru … … … … … … … … … … … … … 0
Niue … … … … … … … … … … … … … 0
Palau … … … … … … … … … … … … 3 2
Papua New Guinea 12,000 9,600 14,000 14,000 12,000 16,000 58 47 71 68 58 79 6,751 9,435
Samoa … … … … … … … … … … … … … 12
Solomon Islands … … … … … … … … … … … … 8 8
Tonga … … … … … … … … … … … … … 0
Tuvalu … … … … … … … … … … … … 1 0
Vanuatu … … … … … … … … … … … … 2 3
sub-saHaran africa
Angola 76,000 56,000 110,000 93,000 69,000 130,000 27 19 37 36 26 49 20,640 33,515
Benin 29,000 25,000 32,000 33,000 29,000 37,000 53 47 60 61 54 68 15,401 19,930
Botswana 160,000 150,000 170,000 190,000 180,000 190,000 90 86 94 >95 92 >95 145,190 178,684
Burkina Faso 60,000 54,000 75,000 64,000 57,000 79,000 44 35 49 57 46 63 26,448 36,248
Burundi 50,000 45,000 56,000 49,000 45,000 56,000 35 31 39 54 47 58 17,661 26,402
Cameroon 230,000 210,000 260,000 260,000 240,000 280,000 33 30 36 41 38 44 76,228 105,653
Cape Verde 1,400 1,000 1,800 1,600 1,200 2,100 44 33 59 46 34 60 611 719
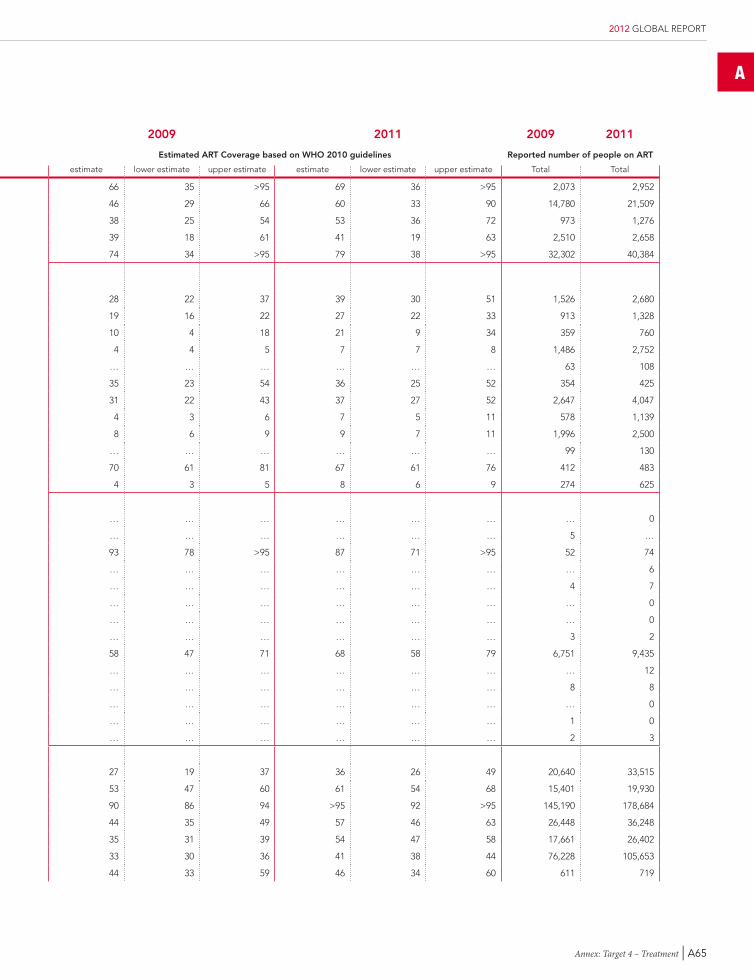
A
Annex: Target 4 – Treatment | A65
2012 GLOBAL REPORT
2009 2011 2009 2011 2009 2011
estimated number of people needing antiretroviral therapy based on WHo 2010 guidelines estimated art Coverage based on WHo 2010 guidelines reported number of people on art
estimate lower estimate upper estimate estimate lower estimate upper estimate estimate lower estimate upper estimate estimate lower estimate upper estimate Total Total
Paraguay 3,100 2,000 5,900 4,300 2,900 8,100 66 35 >95 69 36 >95 2,073 2,952
Peru 32,000 22,000 51,000 36,000 24,000 65,000 46 29 66 60 33 90 14,780 21,509
Suriname 2,600 1,800 3,900 2,400 1,800 3,500 38 25 54 53 36 72 973 1,276
Uruguay 6,400 4,100 14,000 6,500 4,200 14,000 39 18 61 41 19 63 2,510 2,658
Venezuela 44,000 25,000 95,000 51,000 30,000 110,000 74 34 >95 79 38 >95 32,302 40,384
middlE East and nortH africa
Algeria … 4,100 7,100 … 5,200 8,900 28 22 37 39 30 51 1,526 2,680
Djibouti 4,900 4,100 5,900 4,900 4,000 6,100 19 16 22 27 22 33 913 1,328
Egypt 3,600 2,000 8,500 3,600 2,200 8,100 10 4 18 21 9 34 359 760
Iran 34,000 30,000 38,000 37,000 33,000 42,000 4 4 5 7 7 8 1,486 2,752
Jordan … … … … … … … … … … … … 63 108
Lebanon 1,000 <1000 1,600 1,200 <1000 1,700 35 23 54 36 25 52 354 425
Morocco 8,700 6,200 12,000 11,000 7,700 15,000 31 22 43 37 27 52 2,647 4,047
Somalia 14,000 10,000 20,000 15,000 11,000 21,000 4 3 6 7 5 11 578 1,139
Sudan 26,000 21,000 32,000 28,000 23,000 33,000 8 6 9 9 7 11 1,996 2,500
Syria … … … … … … … … … … … … 99 130
Tunisia 3,600 1,600 11,000 3,800 1,600 12,000 70 61 81 67 61 76 412 483
Yemen 6,900 5,400 8,600 8,100 6,600 9,700 4 3 5 8 6 9 274 625
ocEania
Cook Islands … … … … … … … … … … … … … 0
Federated States of Micronesia … … … … … … … … … … … … 5 …
Fiji <100 <100 <100 <100 <100 <200 93 78 >95 87 71 >95 52 74
Kiribati … … … … … … … … … … … … … 6
Marshall Islands … … … … … … … … … … … … 4 7
Nauru … … … … … … … … … … … … … 0
Niue … … … … … … … … … … … … … 0
Palau … … … … … … … … … … … … 3 2
Papua New Guinea 12,000 9,600 14,000 14,000 12,000 16,000 58 47 71 68 58 79 6,751 9,435
Samoa … … … … … … … … … … … … … 12
Solomon Islands … … … … … … … … … … … … 8 8
Tonga … … … … … … … … … … … … … 0
Tuvalu … … … … … … … … … … … … 1 0
Vanuatu … … … … … … … … … … … … 2 3
sub-saHaran africa
Angola 76,000 56,000 110,000 93,000 69,000 130,000 27 19 37 36 26 49 20,640 33,515
Benin 29,000 25,000 32,000 33,000 29,000 37,000 53 47 60 61 54 68 15,401 19,930
Botswana 160,000 150,000 170,000 190,000 180,000 190,000 90 86 94 >95 92 >95 145,190 178,684
Burkina Faso 60,000 54,000 75,000 64,000 57,000 79,000 44 35 49 57 46 63 26,448 36,248
Burundi 50,000 45,000 56,000 49,000 45,000 56,000 35 31 39 54 47 58 17,661 26,402
Cameroon 230,000 210,000 260,000 260,000 240,000 280,000 33 30 36 41 38 44 76,228 105,653
Cape Verde 1,400 1,000 1,800 1,600 1,200 2,100 44 33 59 46 34 60 611 719
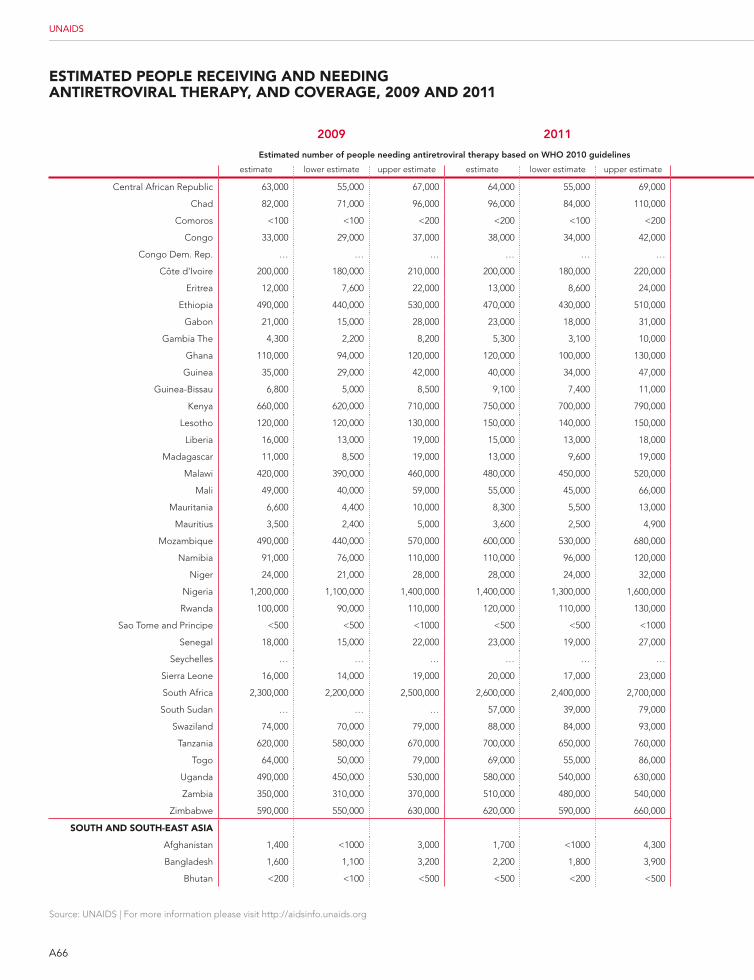
A66
Source: UNAIDS | For more information please visit http://aidsinfo.unaids.org
UNAIDS
EstimatEd PEoPlE rEcEiVing and nEEding antirEtroViral tHEraPY, and coVEragE, 2009 and 2011
2009 2011 2009 2011 2009 2011
estimated number of people needing antiretroviral therapy based on WHo 2010 guidelines estimated art Coverage based on WHo 2010 guidelines reported number of people on art
estimate lower estimate upper estimate estimate lower estimate upper estimate estimate lower estimate upper estimate estimate lower estimate upper estimate Total Total
Central African Republic 63,000 55,000 67,000 64,000 55,000 69,000 23 22 26 22 21 26 14,474 14,405
Chad 82,000 71,000 96,000 96,000 84,000 110,000 39 34 45 34 29 39 32,288 32,832
Comoros <100 <100 <200 <200 <100 <200 15 11 19 19 14 26 12 19
Congo 33,000 29,000 37,000 38,000 34,000 42,000 24 21 27 44 40 49 7,998 16,861
Congo Dem. Rep. … … … … … … … … … … … … 34,967 53,554
Côte d'Ivoire 200,000 180,000 210,000 200,000 180,000 220,000 37 34 40 41 37 45 72,011 82,721
Eritrea 12,000 7,600 22,000 13,000 8,600 24,000 43 23 65 49 26 72 4,955 6,245
Ethiopia 490,000 440,000 530,000 470,000 430,000 510,000 36 33 40 56 52 62 176,632 265,174
Gabon 21,000 15,000 28,000 23,000 18,000 31,000 48 36 65 53 40 69 9,976 12,280
Gambia The 4,300 2,200 8,200 5,300 3,100 10,000 21 11 42 54 29 92 921 2,891
Ghana 110,000 94,000 120,000 120,000 100,000 130,000 28 24 32 47 41 54 30,265 54,589
Guinea 35,000 29,000 42,000 40,000 34,000 47,000 43 36 53 58 49 69 14,999 23,135
Guinea-Bissau 6,800 5,000 8,500 9,100 7,400 11,000 41 33 55 56 47 69 2,764 5,104
Kenya 660,000 620,000 710,000 750,000 700,000 790,000 51 48 54 72 68 76 336,980 538,983
Lesotho 120,000 120,000 130,000 150,000 140,000 150,000 50 47 53 58 54 61 61,736 83,626
Liberia 16,000 13,000 19,000 15,000 13,000 18,000 19 15 23 38 32 45 2,970 5,839
Madagascar 11,000 8,500 19,000 13,000 9,600 19,000 2 1 3 3 2 4 214 383
Malawi 420,000 390,000 460,000 480,000 450,000 520,000 47 44 51 67 62 72 198,846 322,209
Mali 49,000 40,000 59,000 55,000 45,000 66,000 43 36 52 53 44 65 21,100 29,237
Mauritania 6,600 4,400 10,000 8,300 5,500 13,000 21 14 32 21 14 32 1,401 1,738
Mauritius 3,500 2,400 5,000 3,600 2,500 4,900 19 13 27 37 27 53 652 1,349
Mozambique 490,000 440,000 570,000 600,000 530,000 680,000 34 30 39 46 40 51 170,198 273,561
Namibia 91,000 76,000 110,000 110,000 96,000 120,000 78 66 93 >95 85 >95 70,498 104,531
Niger 24,000 21,000 28,000 28,000 24,000 32,000 27 23 31 34 30 39 6,445 9,420
Nigeria 1,200,000 1,100,000 1,400,000 1,400,000 1,300,000 1,600,000 25 22 28 30 28 34 302,973 432,285
Rwanda 100,000 90,000 110,000 120,000 110,000 130,000 77 70 86 82 75 90 76,726 96,123
Sao Tome and Principe <500 <500 <1000 <500 <500 <1000 39 30 51 52 39 68 169 252
Senegal 18,000 15,000 22,000 23,000 19,000 27,000 68 56 82 56 47 67 12,249 12,762
Seychelles … … … … … … … … … … … … 139 181
Sierra Leone 16,000 14,000 19,000 20,000 17,000 23,000 22 19 26 41 35 49 3,660 8,115
South Africa 2,300,000 2,200,000 2,500,000 2,600,000 2,400,000 2,700,000 42 40 45 66 62 70 971,556 1,702,060
South Sudan … … … 57,000 39,000 79,000 … … … 6 4 9 1,829 3,442
Swaziland 74,000 70,000 79,000 88,000 84,000 93,000 64 60 68 83 78 87 47,241 72,402
Tanzania 620,000 580,000 670,000 700,000 650,000 760,000 32 30 34 40 37 43 199,413 277,070
Togo 64,000 50,000 79,000 69,000 55,000 86,000 26 21 33 42 34 53 16,710 29,045
Uganda 490,000 450,000 530,000 580,000 540,000 630,000 41 38 44 54 50 58 200,413 313,117
Zambia 350,000 310,000 370,000 510,000 480,000 540,000 81 77 90 82 76 87 283,863 415,685
Zimbabwe 590,000 550,000 630,000 620,000 590,000 660,000 37 35 39 77 72 81 218,589 476,321
soutH and soutH-East asia
Afghanistan 1,400 <1000 3,000 1,700 <1000 4,300 1 1 3 6 3 11 19 111
Bangladesh 1,600 1,100 3,200 2,200 1,800 3,900 22 11 32 31 17 38 353 681
Bhutan <200 <100 <500 <500 <200 <500 19 14 45 24 17 33 … 64
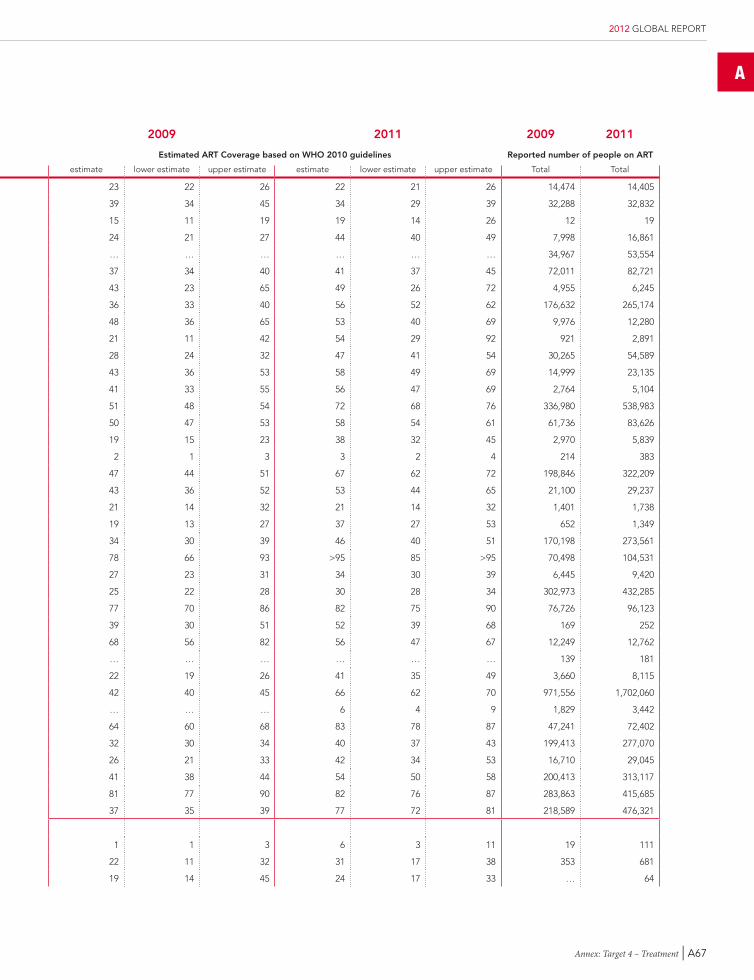
A
Annex: Target 4 – Treatment | A67
2012 GLOBAL REPORT
2009 2011 2009 2011 2009 2011
estimated number of people needing antiretroviral therapy based on WHo 2010 guidelines estimated art Coverage based on WHo 2010 guidelines reported number of people on art
estimate lower estimate upper estimate estimate lower estimate upper estimate estimate lower estimate upper estimate estimate lower estimate upper estimate Total Total
Central African Republic 63,000 55,000 67,000 64,000 55,000 69,000 23 22 26 22 21 26 14,474 14,405
Chad 82,000 71,000 96,000 96,000 84,000 110,000 39 34 45 34 29 39 32,288 32,832
Comoros <100 <100 <200 <200 <100 <200 15 11 19 19 14 26 12 19
Congo 33,000 29,000 37,000 38,000 34,000 42,000 24 21 27 44 40 49 7,998 16,861
Congo Dem. Rep. … … … … … … … … … … … … 34,967 53,554
Côte d'Ivoire 200,000 180,000 210,000 200,000 180,000 220,000 37 34 40 41 37 45 72,011 82,721
Eritrea 12,000 7,600 22,000 13,000 8,600 24,000 43 23 65 49 26 72 4,955 6,245
Ethiopia 490,000 440,000 530,000 470,000 430,000 510,000 36 33 40 56 52 62 176,632 265,174
Gabon 21,000 15,000 28,000 23,000 18,000 31,000 48 36 65 53 40 69 9,976 12,280
Gambia The 4,300 2,200 8,200 5,300 3,100 10,000 21 11 42 54 29 92 921 2,891
Ghana 110,000 94,000 120,000 120,000 100,000 130,000 28 24 32 47 41 54 30,265 54,589
Guinea 35,000 29,000 42,000 40,000 34,000 47,000 43 36 53 58 49 69 14,999 23,135
Guinea-Bissau 6,800 5,000 8,500 9,100 7,400 11,000 41 33 55 56 47 69 2,764 5,104
Kenya 660,000 620,000 710,000 750,000 700,000 790,000 51 48 54 72 68 76 336,980 538,983
Lesotho 120,000 120,000 130,000 150,000 140,000 150,000 50 47 53 58 54 61 61,736 83,626
Liberia 16,000 13,000 19,000 15,000 13,000 18,000 19 15 23 38 32 45 2,970 5,839
Madagascar 11,000 8,500 19,000 13,000 9,600 19,000 2 1 3 3 2 4 214 383
Malawi 420,000 390,000 460,000 480,000 450,000 520,000 47 44 51 67 62 72 198,846 322,209
Mali 49,000 40,000 59,000 55,000 45,000 66,000 43 36 52 53 44 65 21,100 29,237
Mauritania 6,600 4,400 10,000 8,300 5,500 13,000 21 14 32 21 14 32 1,401 1,738
Mauritius 3,500 2,400 5,000 3,600 2,500 4,900 19 13 27 37 27 53 652 1,349
Mozambique 490,000 440,000 570,000 600,000 530,000 680,000 34 30 39 46 40 51 170,198 273,561
Namibia 91,000 76,000 110,000 110,000 96,000 120,000 78 66 93 >95 85 >95 70,498 104,531
Niger 24,000 21,000 28,000 28,000 24,000 32,000 27 23 31 34 30 39 6,445 9,420
Nigeria 1,200,000 1,100,000 1,400,000 1,400,000 1,300,000 1,600,000 25 22 28 30 28 34 302,973 432,285
Rwanda 100,000 90,000 110,000 120,000 110,000 130,000 77 70 86 82 75 90 76,726 96,123
Sao Tome and Principe <500 <500 <1000 <500 <500 <1000 39 30 51 52 39 68 169 252
Senegal 18,000 15,000 22,000 23,000 19,000 27,000 68 56 82 56 47 67 12,249 12,762
Seychelles … … … … … … … … … … … … 139 181
Sierra Leone 16,000 14,000 19,000 20,000 17,000 23,000 22 19 26 41 35 49 3,660 8,115
South Africa 2,300,000 2,200,000 2,500,000 2,600,000 2,400,000 2,700,000 42 40 45 66 62 70 971,556 1,702,060
South Sudan … … … 57,000 39,000 79,000 … … … 6 4 9 1,829 3,442
Swaziland 74,000 70,000 79,000 88,000 84,000 93,000 64 60 68 83 78 87 47,241 72,402
Tanzania 620,000 580,000 670,000 700,000 650,000 760,000 32 30 34 40 37 43 199,413 277,070
Togo 64,000 50,000 79,000 69,000 55,000 86,000 26 21 33 42 34 53 16,710 29,045
Uganda 490,000 450,000 530,000 580,000 540,000 630,000 41 38 44 54 50 58 200,413 313,117
Zambia 350,000 310,000 370,000 510,000 480,000 540,000 81 77 90 82 76 87 283,863 415,685
Zimbabwe 590,000 550,000 630,000 620,000 590,000 660,000 37 35 39 77 72 81 218,589 476,321
soutH and soutH-East asia
Afghanistan 1,400 <1000 3,000 1,700 <1000 4,300 1 1 3 6 3 11 19 111
Bangladesh 1,600 1,100 3,200 2,200 1,800 3,900 22 11 32 31 17 38 353 681
Bhutan <200 <100 <500 <500 <200 <500 19 14 45 24 17 33 … 64
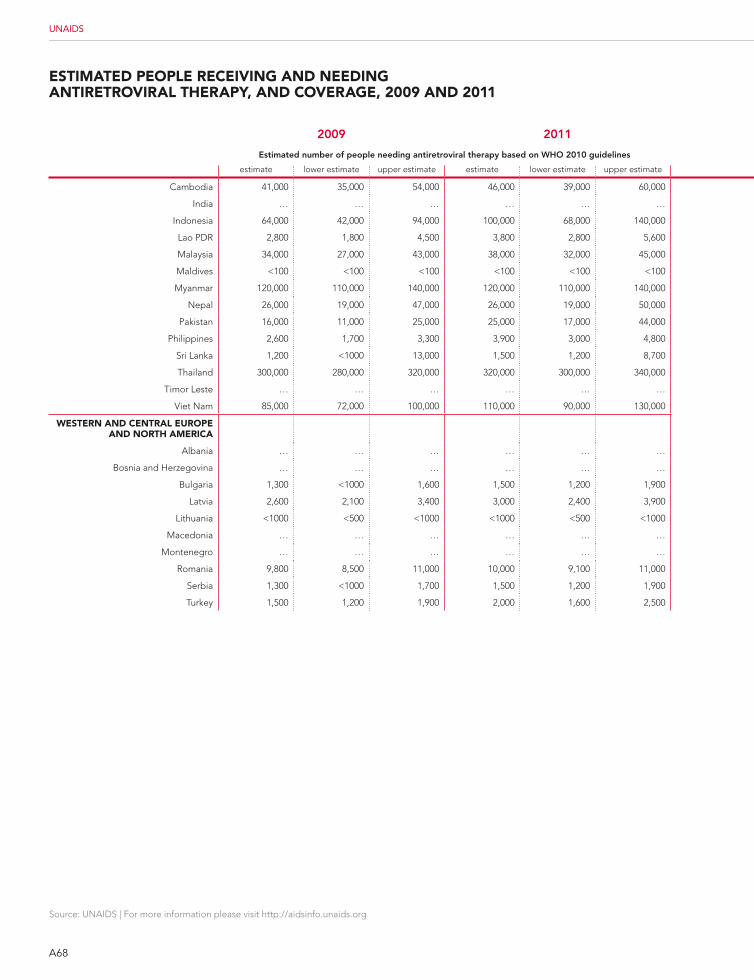
A68
Source: UNAIDS | For more information please visit http://aidsinfo.unaids.org
UNAIDS
EstimatEd PEoPlE rEcEiVing and nEEding antirEtroViral tHEraPY, and coVEragE, 2009 and 2011
2009 2011 2009 2011 2009 2011
estimated number of people needing antiretroviral therapy based on WHo 2010 guidelines estimated art Coverage based on WHo 2010 guidelines reported number of people on art
estimate lower estimate upper estimate estimate lower estimate upper estimate estimate lower estimate upper estimate estimate lower estimate upper estimate Total Total
Cambodia 41,000 35,000 54,000 46,000 39,000 60,000 91 69 >95 >95 78 >95 37,315 46,473
India … … … … … … … … … … … … 330,300 543,000
Indonesia 64,000 42,000 94,000 100,000 68,000 140,000 24 16 37 24 17 36 15,442 24,410
Lao PDR 2,800 1,800 4,500 3,800 2,800 5,600 48 30 75 53 36 71 1,345 1,988
Malaysia 34,000 27,000 43,000 38,000 32,000 45,000 29 23 37 37 31 43 9,962 14,002
Maldives <100 <100 <100 <100 <100 <100 22 18 26 22 17 26 3 3
Myanmar 120,000 110,000 140,000 120,000 110,000 140,000 17 15 20 32 28 37 21,138 40,128
Nepal 26,000 19,000 47,000 26,000 19,000 50,000 14 7 19 24 13 34 3,550 6,483
Pakistan 16,000 11,000 25,000 25,000 17,000 44,000 8 5 12 10 6 15 1,320 2,491
Philippines 2,600 1,700 3,300 3,900 3,000 4,800 29 22 44 51 41 66 750 1,992
Sri Lanka 1,200 <1000 13,000 1,500 1,200 8,700 17 2 21 21 4 26 207 311
Thailand 300,000 280,000 320,000 320,000 300,000 340,000 72 67 76 71 66 75 216,118 225,272
Timor Leste … … … … … … … … … … … … 31 60
Viet Nam 85,000 72,000 100,000 110,000 90,000 130,000 44 37 53 58 48 68 37,995 60,924
WEstErn and cEntral EuroPE and nortH amErica
Albania … … … … … … … … … … … … 114 161
Bosnia and Herzegovina … … … … … … … … … … … … 38 63
Bulgaria 1,300 <1000 1,600 1,500 1,200 1,900 26 20 33 25 20 33 327 383
Latvia 2,600 2,100 3,400 3,000 2,400 3,900 17 13 21 18 14 23 439 560
Lithuania <1000 <500 <1000 <1000 <500 <1000 29 22 36 25 20 32 145 …
Macedonia … … … … … … … … … … … … 24 45
Montenegro … … … … … … … … … … … … 31 58
Romania 9,800 8,500 11,000 10,000 9,100 11,000 74 65 86 74 66 83 7,244 7,536
Serbia 1,300 <1000 1,700 1,500 1,200 1,900 60 46 >95 65 51 86 790 987
Turkey 1,500 1,200 1,900 2,000 1,600 2,500 67 52 86 50 39 63 1,000 …
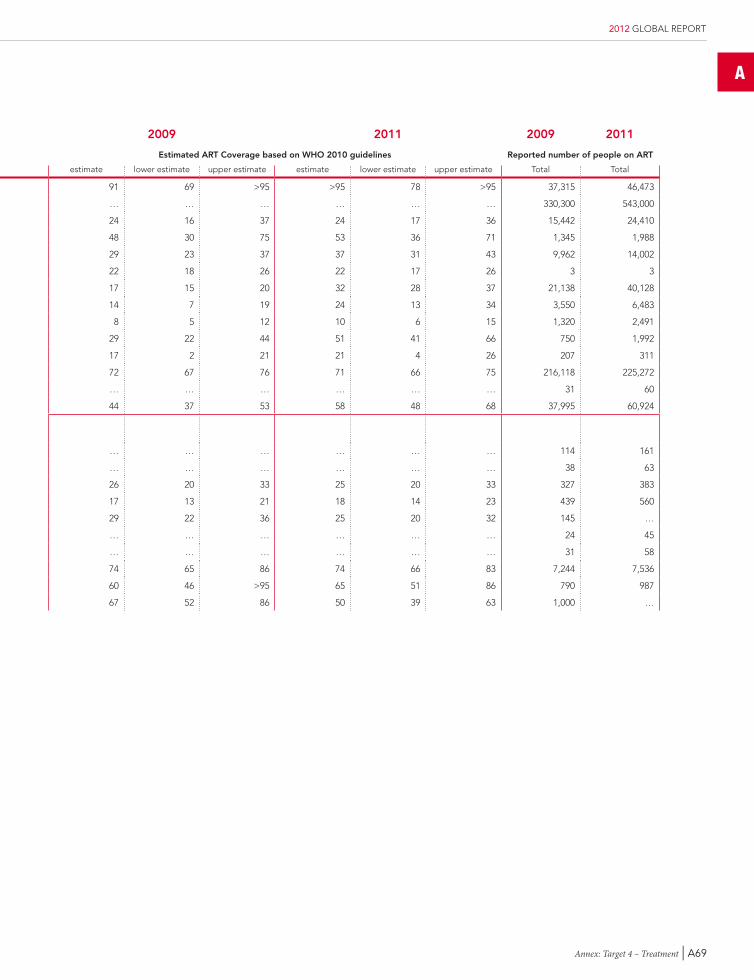
A
Annex: Target 4 – Treatment | A69
2012 GLOBAL REPORT
2009 2011 2009 2011 2009 2011
estimated number of people needing antiretroviral therapy based on WHo 2010 guidelines estimated art Coverage based on WHo 2010 guidelines reported number of people on art
estimate lower estimate upper estimate estimate lower estimate upper estimate estimate lower estimate upper estimate estimate lower estimate upper estimate Total Total
Cambodia 41,000 35,000 54,000 46,000 39,000 60,000 91 69 >95 >95 78 >95 37,315 46,473
India … … … … … … … … … … … … 330,300 543,000
Indonesia 64,000 42,000 94,000 100,000 68,000 140,000 24 16 37 24 17 36 15,442 24,410
Lao PDR 2,800 1,800 4,500 3,800 2,800 5,600 48 30 75 53 36 71 1,345 1,988
Malaysia 34,000 27,000 43,000 38,000 32,000 45,000 29 23 37 37 31 43 9,962 14,002
Maldives <100 <100 <100 <100 <100 <100 22 18 26 22 17 26 3 3
Myanmar 120,000 110,000 140,000 120,000 110,000 140,000 17 15 20 32 28 37 21,138 40,128
Nepal 26,000 19,000 47,000 26,000 19,000 50,000 14 7 19 24 13 34 3,550 6,483
Pakistan 16,000 11,000 25,000 25,000 17,000 44,000 8 5 12 10 6 15 1,320 2,491
Philippines 2,600 1,700 3,300 3,900 3,000 4,800 29 22 44 51 41 66 750 1,992
Sri Lanka 1,200 <1000 13,000 1,500 1,200 8,700 17 2 21 21 4 26 207 311
Thailand 300,000 280,000 320,000 320,000 300,000 340,000 72 67 76 71 66 75 216,118 225,272
Timor Leste … … … … … … … … … … … … 31 60
Viet Nam 85,000 72,000 100,000 110,000 90,000 130,000 44 37 53 58 48 68 37,995 60,924
WEstErn and cEntral EuroPE and nortH amErica
Albania … … … … … … … … … … … … 114 161
Bosnia and Herzegovina … … … … … … … … … … … … 38 63
Bulgaria 1,300 <1000 1,600 1,500 1,200 1,900 26 20 33 25 20 33 327 383
Latvia 2,600 2,100 3,400 3,000 2,400 3,900 17 13 21 18 14 23 439 560
Lithuania <1000 <500 <1000 <1000 <500 <1000 29 22 36 25 20 32 145 …
Macedonia … … … … … … … … … … … … 24 45
Montenegro … … … … … … … … … … … … 31 58
Romania 9,800 8,500 11,000 10,000 9,100 11,000 74 65 86 74 66 83 7,244 7,536
Serbia 1,300 <1000 1,700 1,500 1,200 1,900 60 46 >95 65 51 86 790 987
Turkey 1,500 1,200 1,900 2,000 1,600 2,500 67 52 86 50 39 63 1,000 …
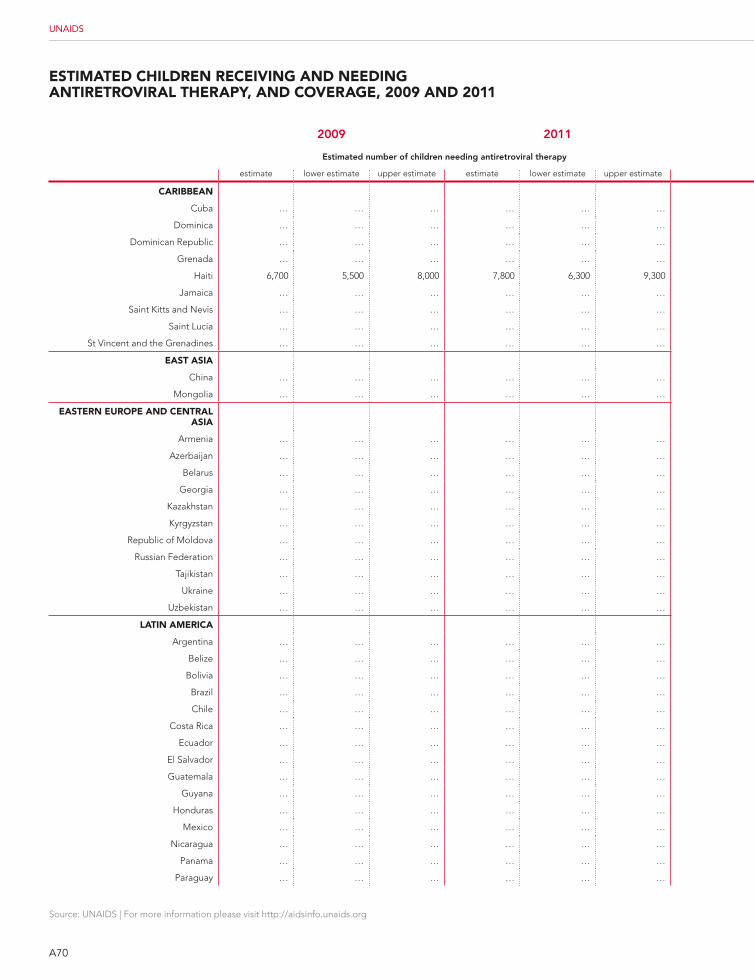
A70
Source: UNAIDS | For more information please visit http://aidsinfo.unaids.org
UNAIDS
EstimatEd cHildrEn rEcEiVing and nEEding antirEtroViral tHEraPY, and coVEragE, 2009 and 2011
2009 2011 2009 2011 2009 2011
estimated number of children needing antiretroviral therapy estimated antiretroviral therapy coverage among childrenreported number of children
0-14 years receiving artestimate lower estimate upper estimate estimate lower estimate upper estimate estimate lower estimate upper estimate estimate lower estimate upper estimate Total Total
caribbEan
Cuba … … … … … … … … … … … … 20 15
Dominica … … … … … … … … … … … … 1 0
Dominican Republic … … … … … … … … … … … … 782 1,010
Grenada … … … … … … … … … … … … 3 3
Haiti 6,700 5,500 8,000 7,800 6,300 9,300 19 13 41 25 21 31 1,098 1,969
Jamaica … … … … … … … … … … … … 436 462
Saint Kitts and Nevis … … … … … … … … … … … … … 1
Saint Lucia … … … … … … … … … … … … 3 3
St Vincent and the Grenadines … … … … … … … … … … … … 3 4
East asia
China … … … … … … … … … … … … 1,594 2,322
Mongolia … … … … … … … … … … … … … 0
EastErn EuroPE and cEntral asia
Armenia … … … … … … … … … … … … 7 11
Azerbaijan … … … … … … … … … … … … 3 15
Belarus … … … … … … … … … … … … 95 139
Georgia … … … … … … … … … … … … 28 35
Kazakhstan … … … … … … … … … … … … 191 247
Kyrgyzstan … … … … … … … … … … … … 101 170
Republic of Moldova … … … … … … … … … … … … 34 52
Russian Federation … … … … … … … … … … … … 1,998 …
Tajikistan … … … … … … … … … … … … 9 56
Ukraine … … … … … … … … … … … … 1,720 2,268
Uzbekistan … … … … … … … … … … … … 225 1,794
latin amErica
Argentina … … … … … … … … … … … … 2,000 1,286
Belize … … … … … … … … … … … … 80 88
Bolivia … … … … … … … … … … … … 50 61
Brazil … … … … … … … … … … … … 7,939 5,215
Chile … … … … … … … … … … … … 186 199
Costa Rica … … … … … … … … … … … … 61 61
Ecuador … … … … … … … … … … … … 407 576
El Salvador … … … … … … … … … … … … 300 390
Guatemala … … … … … … … … … … … … 768 935
Guyana … … … … … … … … … … … … 165 201
Honduras … … … … … … … … … … … … 719 736
Mexico … … … … … … … … … … … … 1,594 1,630
Nicaragua … … … … … … … … … … … … 56 64
Panama … … … … … … … … … … … … 256 250
Paraguay … … … … … … … … … … … … 130 167
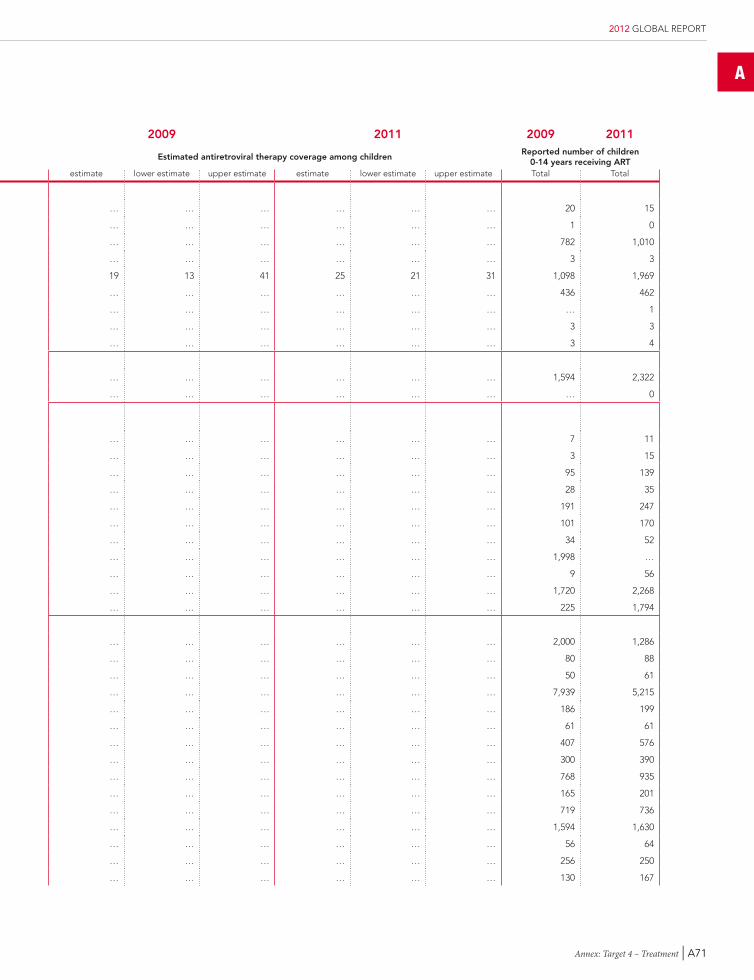
A
Annex: Target 4 – Treatment | A71
2012 GLOBAL REPORT
2009 2011 2009 2011 2009 2011
estimated number of children needing antiretroviral therapy estimated antiretroviral therapy coverage among childrenreported number of children
0-14 years receiving artestimate lower estimate upper estimate estimate lower estimate upper estimate estimate lower estimate upper estimate estimate lower estimate upper estimate Total Total
caribbEan
Cuba … … … … … … … … … … … … 20 15
Dominica … … … … … … … … … … … … 1 0
Dominican Republic … … … … … … … … … … … … 782 1,010
Grenada … … … … … … … … … … … … 3 3
Haiti 6,700 5,500 8,000 7,800 6,300 9,300 19 13 41 25 21 31 1,098 1,969
Jamaica … … … … … … … … … … … … 436 462
Saint Kitts and Nevis … … … … … … … … … … … … … 1
Saint Lucia … … … … … … … … … … … … 3 3
St Vincent and the Grenadines … … … … … … … … … … … … 3 4
East asia
China … … … … … … … … … … … … 1,594 2,322
Mongolia … … … … … … … … … … … … … 0
EastErn EuroPE and cEntral asia
Armenia … … … … … … … … … … … … 7 11
Azerbaijan … … … … … … … … … … … … 3 15
Belarus … … … … … … … … … … … … 95 139
Georgia … … … … … … … … … … … … 28 35
Kazakhstan … … … … … … … … … … … … 191 247
Kyrgyzstan … … … … … … … … … … … … 101 170
Republic of Moldova … … … … … … … … … … … … 34 52
Russian Federation … … … … … … … … … … … … 1,998 …
Tajikistan … … … … … … … … … … … … 9 56
Ukraine … … … … … … … … … … … … 1,720 2,268
Uzbekistan … … … … … … … … … … … … 225 1,794
latin amErica
Argentina … … … … … … … … … … … … 2,000 1,286
Belize … … … … … … … … … … … … 80 88
Bolivia … … … … … … … … … … … … 50 61
Brazil … … … … … … … … … … … … 7,939 5,215
Chile … … … … … … … … … … … … 186 199
Costa Rica … … … … … … … … … … … … 61 61
Ecuador … … … … … … … … … … … … 407 576
El Salvador … … … … … … … … … … … … 300 390
Guatemala … … … … … … … … … … … … 768 935
Guyana … … … … … … … … … … … … 165 201
Honduras … … … … … … … … … … … … 719 736
Mexico … … … … … … … … … … … … 1,594 1,630
Nicaragua … … … … … … … … … … … … 56 64
Panama … … … … … … … … … … … … 256 250
Paraguay … … … … … … … … … … … … 130 167
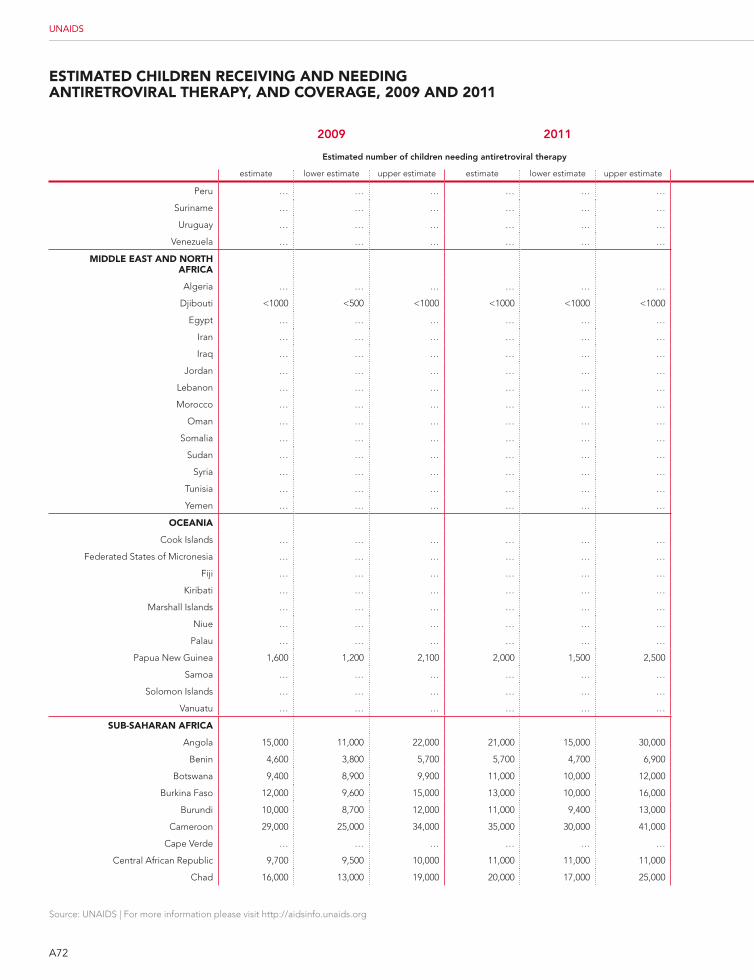
A72
Source: UNAIDS | For more information please visit http://aidsinfo.unaids.org
UNAIDS
EstimatEd cHildrEn rEcEiVing and nEEding antirEtroViral tHEraPY, and coVEragE, 2009 and 2011
2009 2011 2009 2011 2009 2011
estimated number of children needing antiretroviral therapy estimated antiretroviral therapy coverage among childrenreported number of children
0-14 years receiving artestimate lower estimate upper estimate estimate lower estimate upper estimate estimate lower estimate upper estimate estimate lower estimate upper estimate Total Total
Peru … … … … … … … … … … … … 517 495
Suriname … … … … … … … … … … … … 80 82
Uruguay … … … … … … … … … … … … 160 82
Venezuela … … … … … … … … … … … … 784 962
middlE East and nortH africa
Algeria … … … … … … … … … … … … 97 200
Djibouti <1000 <500 <1000 <1000 <1000 <1000 4 2 8 6 5 8 24 41
Egypt … … … … … … … … … … … … 27 32
Iran … … … … … … … … … … … … 54 97
Iraq … … … … … … … … … … … … … 0
Jordan … … … … … … … … … … … … 2 2
Lebanon … … … … … … … … … … … … 9 4
Morocco … … … … … … … … … … … … 145 205
Oman … … … … … … … … … … … … 26 …
Somalia … … … … … … … … … … … … 9 48
Sudan … … … … … … … … … … … … … 263
Syria … … … … … … … … … … … … 8 1
Tunisia … … … … … … … … … … … … 12 19
Yemen … … … … … … … … … … … … 9 38
ocEania
Cook Islands … … … … … … … … … … … … … 0
Federated States of Micronesia … … … … … … … … … … … … … 0
Fiji … … … … … … … … … … … … 1 2
Kiribati … … … … … … … … … … … … … 1
Marshall Islands … … … … … … … … … … … … … 0
Niue … … … … … … … … … … … … … 0
Palau … … … … … … … … … … … … … 0
Papua New Guinea 1,600 1,200 2,100 2,000 1,500 2,500 26 17 49 31 24 40 427 608
Samoa … … … … … … … … … … … … … 3
Solomon Islands … … … … … … … … … … … … … 0
Vanuatu … … … … … … … … … … … … 1 2
sub-saHaran africa
Angola 15,000 11,000 22,000 21,000 15,000 30,000 13 8 25 11 8 16 1,548 2,314
Benin 4,600 3,800 5,700 5,700 4,700 6,900 41 28 77 23 19 28 1,135 1,300
Botswana 9,400 8,900 9,900 11,000 10,000 12,000 90 76 >95 88 84 93 8,490 9,702
Burkina Faso 12,000 9,600 15,000 13,000 10,000 16,000 17 11 35 14 11 17 1,354 1,776
Burundi 10,000 8,700 12,000 11,000 9,400 13,000 11 8 19 17 15 20 1,596 1,927
Cameroon 29,000 25,000 34,000 35,000 30,000 41,000 11 8 20 13 11 15 3,114 4,440
Cape Verde … … … … … … … … … … … … 37 58
Central African Republic 9,700 9,500 10,000 11,000 11,000 11,000 9 6 20 7 7 7 724 825
Chad 16,000 13,000 19,000 20,000 17,000 25,000 6 4 12 8 6 9 774 1,531

A
Annex: Target 4 – Treatment | A73
2012 GLOBAL REPORT
2009 2011 2009 2011 2009 2011
estimated number of children needing antiretroviral therapy estimated antiretroviral therapy coverage among childrenreported number of children
0-14 years receiving artestimate lower estimate upper estimate estimate lower estimate upper estimate estimate lower estimate upper estimate estimate lower estimate upper estimate Total Total
Peru … … … … … … … … … … … … 517 495
Suriname … … … … … … … … … … … … 80 82
Uruguay … … … … … … … … … … … … 160 82
Venezuela … … … … … … … … … … … … 784 962
middlE East and nortH africa
Algeria … … … … … … … … … … … … 97 200
Djibouti <1000 <500 <1000 <1000 <1000 <1000 4 2 8 6 5 8 24 41
Egypt … … … … … … … … … … … … 27 32
Iran … … … … … … … … … … … … 54 97
Iraq … … … … … … … … … … … … … 0
Jordan … … … … … … … … … … … … 2 2
Lebanon … … … … … … … … … … … … 9 4
Morocco … … … … … … … … … … … … 145 205
Oman … … … … … … … … … … … … 26 …
Somalia … … … … … … … … … … … … 9 48
Sudan … … … … … … … … … … … … … 263
Syria … … … … … … … … … … … … 8 1
Tunisia … … … … … … … … … … … … 12 19
Yemen … … … … … … … … … … … … 9 38
ocEania
Cook Islands … … … … … … … … … … … … … 0
Federated States of Micronesia … … … … … … … … … … … … … 0
Fiji … … … … … … … … … … … … 1 2
Kiribati … … … … … … … … … … … … … 1
Marshall Islands … … … … … … … … … … … … … 0
Niue … … … … … … … … … … … … … 0
Palau … … … … … … … … … … … … … 0
Papua New Guinea 1,600 1,200 2,100 2,000 1,500 2,500 26 17 49 31 24 40 427 608
Samoa … … … … … … … … … … … … … 3
Solomon Islands … … … … … … … … … … … … … 0
Vanuatu … … … … … … … … … … … … 1 2
sub-saHaran africa
Angola 15,000 11,000 22,000 21,000 15,000 30,000 13 8 25 11 8 16 1,548 2,314
Benin 4,600 3,800 5,700 5,700 4,700 6,900 41 28 77 23 19 28 1,135 1,300
Botswana 9,400 8,900 9,900 11,000 10,000 12,000 90 76 >95 88 84 93 8,490 9,702
Burkina Faso 12,000 9,600 15,000 13,000 10,000 16,000 17 11 35 14 11 17 1,354 1,776
Burundi 10,000 8,700 12,000 11,000 9,400 13,000 11 8 19 17 15 20 1,596 1,927
Cameroon 29,000 25,000 34,000 35,000 30,000 41,000 11 8 20 13 11 15 3,114 4,440
Cape Verde … … … … … … … … … … … … 37 58
Central African Republic 9,700 9,500 10,000 11,000 11,000 11,000 9 6 20 7 7 7 724 825
Chad 16,000 13,000 19,000 20,000 17,000 25,000 6 4 12 8 6 9 774 1,531
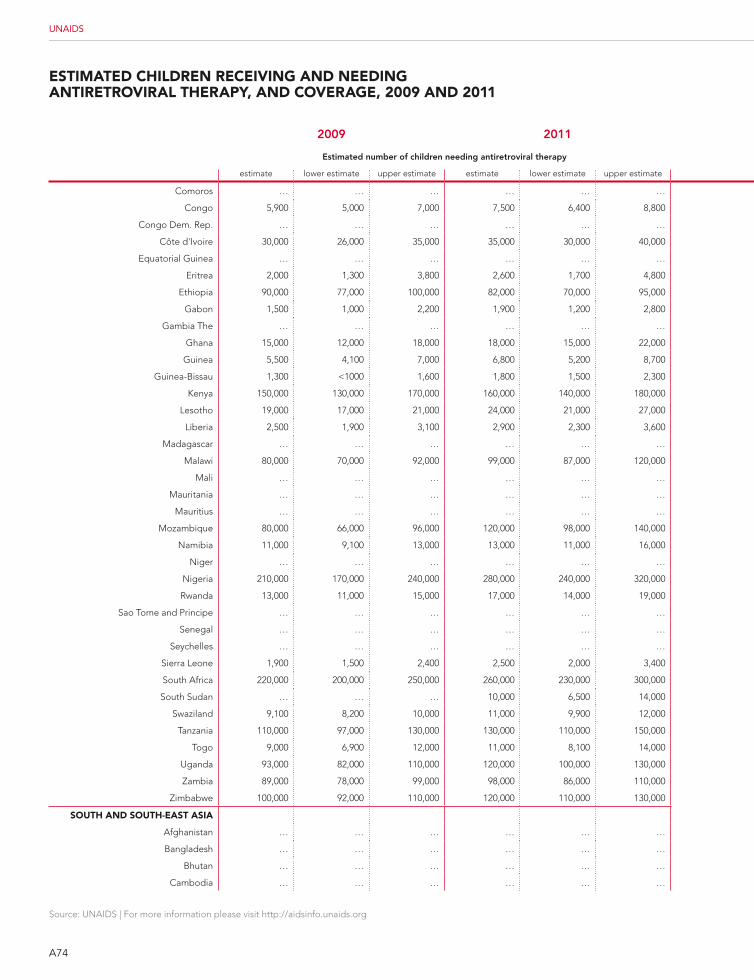
A74
Source: UNAIDS | For more information please visit http://aidsinfo.unaids.org
UNAIDS
EstimatEd cHildrEn rEcEiVing and nEEding antirEtroViral tHEraPY, and coVEragE, 2009 and 2011
2009 2011 2009 2011 2009 2011
estimated number of children needing antiretroviral therapy estimated antiretroviral therapy coverage among childrenreported number of children
0-14 years receiving artestimate lower estimate upper estimate estimate lower estimate upper estimate estimate lower estimate upper estimate estimate lower estimate upper estimate Total Total
Comoros … … … … … … … … … … … … 1 1
Congo 5,900 5,000 7,000 7,500 6,400 8,800 12 8 24 14 12 16 488 1,051
Congo Dem. Rep. … … … … … … … … … … … … 4,053 6,238
Côte d'Ivoire 30,000 26,000 35,000 35,000 30,000 40,000 15 10 30 15 13 17 4,349 5,190
Equatorial Guinea … … … … … … 3 2 7 … … … 27 …
Eritrea 2,000 1,300 3,800 2,600 1,700 4,800 21 14 45 20 11 31 324 517
Ethiopia 90,000 77,000 100,000 82,000 70,000 95,000 14 38 19 17 23 9,992 16,000
Gabon 1,500 1,000 2,200 1,900 1,200 2,800 17 11 34 22 15 33 275 414
Gambia The … … … … … … … … … … … … 309 161
Ghana 15,000 12,000 18,000 18,000 15,000 22,000 12 8 24 14 12 17 1,617 2,480
Guinea 5,500 4,100 7,000 6,800 5,200 8,700 15 10 32 11 9 14 674 745
Guinea-Bissau 1,300 <1000 1,600 1,800 1,500 2,300 10 7 21 14 11 18 118 260
Kenya 150,000 130,000 170,000 160,000 140,000 180,000 32 22 59 31 27 36 28,370 48,546
Lesotho 19,000 17,000 21,000 24,000 21,000 27,000 23 17 39 25 22 28 3,038 6,095
Liberia 2,500 1,900 3,100 2,900 2,300 3,600 9 6 19 20 16 25 266 570
Madagascar … … … … … … … … … … … … 5 13
Malawi 80,000 70,000 92,000 99,000 87,000 120,000 29 21 51 29 25 33 17,364 28,722
Mali … … … … … … … … … … … … 1,266 1,732
Mauritania … … … … … … … … … … … … 42 76
Mauritius … … … … … … … … … … … … … 11
Mozambique 80,000 66,000 96,000 120,000 98,000 140,000 14 10 26 20 16 24 … 23,053
Namibia 11,000 9,100 13,000 13,000 11,000 16,000 89 65 >95 76 63 91 8,188 10,284
Niger … … … … … … … … … … … … 258 496
Nigeria 210,000 170,000 240,000 280,000 240,000 320,000 10 7 19 13 11 16 18,092 36,716
Rwanda 13,000 11,000 15,000 17,000 14,000 19,000 60 40 >95 46 39 55 6,679 7,597
Sao Tome and Principe … … … … … … … … … … … … 5 8
Senegal … … … … … … … … … … … … 794 599
Seychelles … … … … … … … … … … … … 9 5
Sierra Leone 1,900 1,500 2,400 2,500 2,000 3,400 14 9 25 21 16 27 237 533
South Africa 220,000 200,000 250,000 260,000 230,000 300,000 54 41 94 58 51 65 86,270 151,860
South Sudan … … … 10,000 6,500 14,000 1 1 2 … 138
Swaziland 9,100 8,200 10,000 11,000 9,900 12,000 70 53 >95 60 53 66 4,772 6,567
Tanzania 110,000 97,000 130,000 130,000 110,000 150,000 17 11 34 14 12 16 12,822 18,298
Togo 9,000 6,900 12,000 11,000 8,100 14,000 20 12 58 16 12 21 1,028 1,676
Uganda 93,000 82,000 110,000 120,000 100,000 130,000 18 12 33 21 19 25 13,413 24,735
Zambia 89,000 78,000 99,000 98,000 86,000 110,000 36 26 65 31 27 35 21,120 30,187
Zimbabwe 100,000 92,000 110,000 120,000 110,000 130,000 30 23 50 34 30 38 21,521 40,140
soutH and soutH-East asia
Afghanistan … … … … … … … … … … … … … 4
Bangladesh … … … … … … … … … … … … 6 37
Bhutan … … … … … … … … … … … … 1 3
Cambodia … … … … … … … … … … … … 3,638 4,439
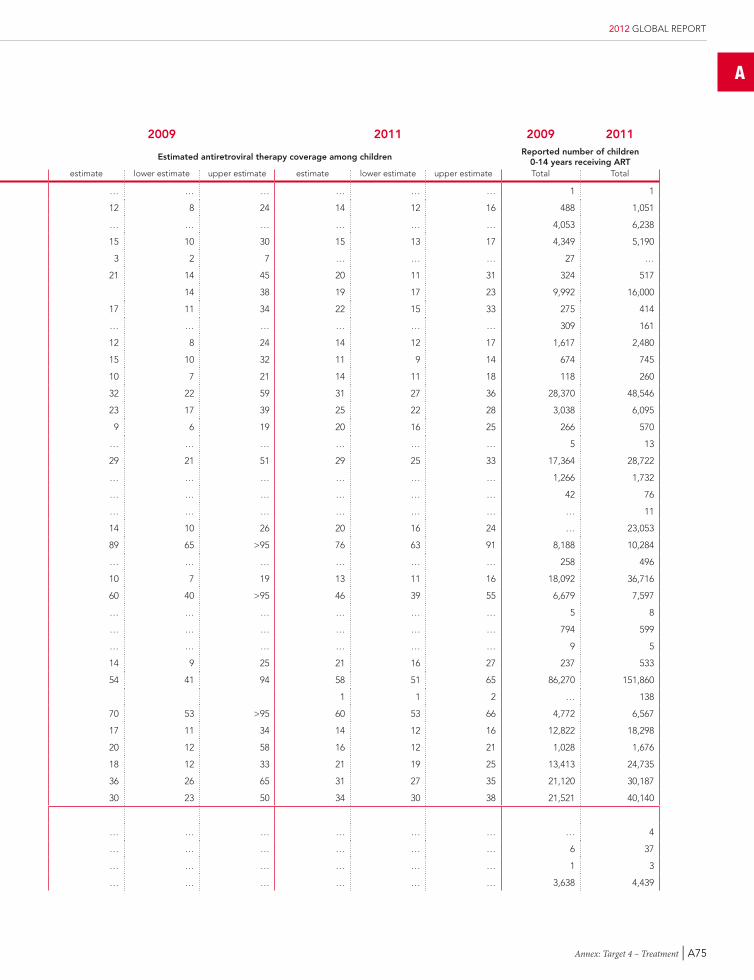
A
Annex: Target 4 – Treatment | A75
2012 GLOBAL REPORT
2009 2011 2009 2011 2009 2011
estimated number of children needing antiretroviral therapy estimated antiretroviral therapy coverage among childrenreported number of children
0-14 years receiving artestimate lower estimate upper estimate estimate lower estimate upper estimate estimate lower estimate upper estimate estimate lower estimate upper estimate Total Total
Comoros … … … … … … … … … … … … 1 1
Congo 5,900 5,000 7,000 7,500 6,400 8,800 12 8 24 14 12 16 488 1,051
Congo Dem. Rep. … … … … … … … … … … … … 4,053 6,238
Côte d'Ivoire 30,000 26,000 35,000 35,000 30,000 40,000 15 10 30 15 13 17 4,349 5,190
Equatorial Guinea … … … … … … 3 2 7 … … … 27 …
Eritrea 2,000 1,300 3,800 2,600 1,700 4,800 21 14 45 20 11 31 324 517
Ethiopia 90,000 77,000 100,000 82,000 70,000 95,000 14 38 19 17 23 9,992 16,000
Gabon 1,500 1,000 2,200 1,900 1,200 2,800 17 11 34 22 15 33 275 414
Gambia The … … … … … … … … … … … … 309 161
Ghana 15,000 12,000 18,000 18,000 15,000 22,000 12 8 24 14 12 17 1,617 2,480
Guinea 5,500 4,100 7,000 6,800 5,200 8,700 15 10 32 11 9 14 674 745
Guinea-Bissau 1,300 <1000 1,600 1,800 1,500 2,300 10 7 21 14 11 18 118 260
Kenya 150,000 130,000 170,000 160,000 140,000 180,000 32 22 59 31 27 36 28,370 48,546
Lesotho 19,000 17,000 21,000 24,000 21,000 27,000 23 17 39 25 22 28 3,038 6,095
Liberia 2,500 1,900 3,100 2,900 2,300 3,600 9 6 19 20 16 25 266 570
Madagascar … … … … … … … … … … … … 5 13
Malawi 80,000 70,000 92,000 99,000 87,000 120,000 29 21 51 29 25 33 17,364 28,722
Mali … … … … … … … … … … … … 1,266 1,732
Mauritania … … … … … … … … … … … … 42 76
Mauritius … … … … … … … … … … … … … 11
Mozambique 80,000 66,000 96,000 120,000 98,000 140,000 14 10 26 20 16 24 … 23,053
Namibia 11,000 9,100 13,000 13,000 11,000 16,000 89 65 >95 76 63 91 8,188 10,284
Niger … … … … … … … … … … … … 258 496
Nigeria 210,000 170,000 240,000 280,000 240,000 320,000 10 7 19 13 11 16 18,092 36,716
Rwanda 13,000 11,000 15,000 17,000 14,000 19,000 60 40 >95 46 39 55 6,679 7,597
Sao Tome and Principe … … … … … … … … … … … … 5 8
Senegal … … … … … … … … … … … … 794 599
Seychelles … … … … … … … … … … … … 9 5
Sierra Leone 1,900 1,500 2,400 2,500 2,000 3,400 14 9 25 21 16 27 237 533
South Africa 220,000 200,000 250,000 260,000 230,000 300,000 54 41 94 58 51 65 86,270 151,860
South Sudan … … … 10,000 6,500 14,000 1 1 2 … 138
Swaziland 9,100 8,200 10,000 11,000 9,900 12,000 70 53 >95 60 53 66 4,772 6,567
Tanzania 110,000 97,000 130,000 130,000 110,000 150,000 17 11 34 14 12 16 12,822 18,298
Togo 9,000 6,900 12,000 11,000 8,100 14,000 20 12 58 16 12 21 1,028 1,676
Uganda 93,000 82,000 110,000 120,000 100,000 130,000 18 12 33 21 19 25 13,413 24,735
Zambia 89,000 78,000 99,000 98,000 86,000 110,000 36 26 65 31 27 35 21,120 30,187
Zimbabwe 100,000 92,000 110,000 120,000 110,000 130,000 30 23 50 34 30 38 21,521 40,140
soutH and soutH-East asia
Afghanistan … … … … … … … … … … … … … 4
Bangladesh … … … … … … … … … … … … 6 37
Bhutan … … … … … … … … … … … … 1 3
Cambodia … … … … … … … … … … … … 3,638 4,439
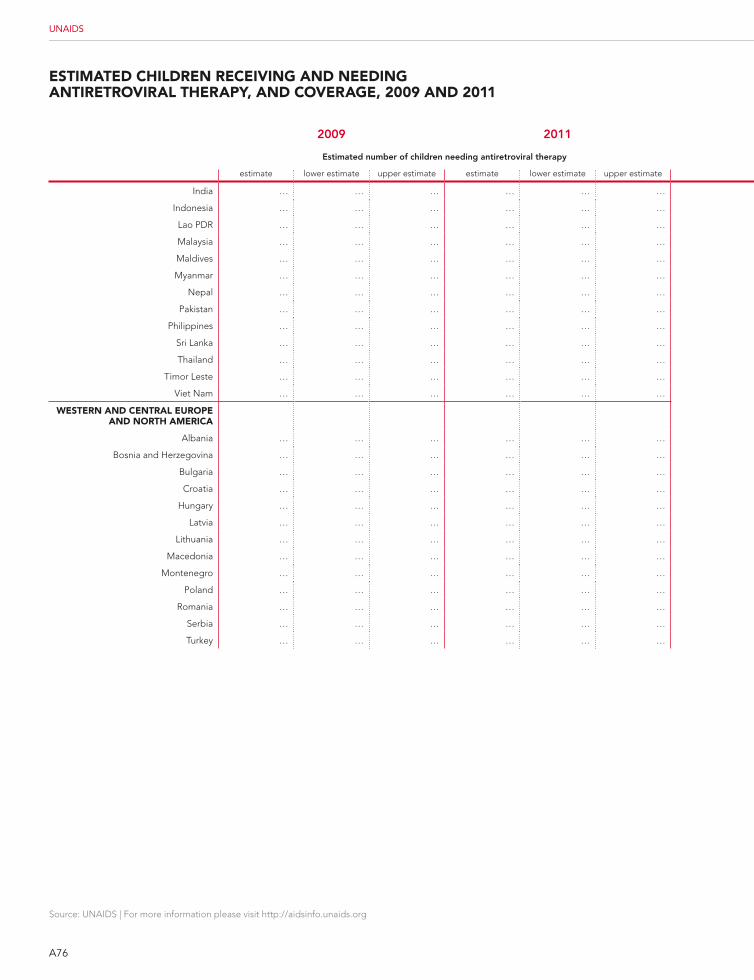
A76
Source: UNAIDS | For more information please visit http://aidsinfo.unaids.org
UNAIDS
EstimatEd cHildrEn rEcEiVing and nEEding antirEtroViral tHEraPY, and coVEragE, 2009 and 2011
2009 2011 2009 2011 2009 2011
estimated number of children needing antiretroviral therapy estimated antiretroviral therapy coverage among childrenreported number of children
0-14 years receiving artestimate lower estimate upper estimate estimate lower estimate upper estimate estimate lower estimate upper estimate estimate lower estimate upper estimate Total Total
India … … … … … … … … … … … … … 22,896
Indonesia … … … … … … … … … … … … 356 759
Lao PDR … … … … … … … … … … … … 95 133
Malaysia … … … … … … … … … … … … 501 487
Maldives … … … … … … … … … … … … … 0
Myanmar … … … … … … … … … … … … 1,535 2,995
Nepal … … … … … … … … … … … … 178 432
Pakistan … … … … … … … … … … … … 57 105
Philippines … … … … … … … … … … … … 11 19
Sri Lanka … … … … … … … … … … … … 11 18
Thailand … … … … … … … … … … … … 8,076 6,510
Timor Leste … … … … … … … … … … … … 3 3
Viet Nam … … … … … … … … … … … … 1,987 2,668
WEstErn and cEntral EuroPE and nortH amErica
Albania … … … … … … … … … … … … 15 14
Bosnia and Herzegovina … … … … … … … … … … … … 1 1
Bulgaria … … … … … … … … … … … … 3 6
Croatia … … … … … … … … … … … … 3 …
Hungary … … … … … … … … … … … … 6 …
Latvia … … … … … … … … … … … … 26 25
Lithuania … … … … … … … … … … … … 2 2
Macedonia … … … … … … … … … … … … 1 0
Montenegro … … … … … … … … … … … … 1 1
Poland … … … … … … … … … … … … 137 …
Romania … … … … … … … … … … … … 192 189
Serbia … … … … … … … … … … … … 11 9
Turkey … … … … … … … … … … … … 9 0

A
Annex: Target 4 – Treatment | A77
2012 GLOBAL REPORT
2009 2011 2009 2011 2009 2011
estimated number of children needing antiretroviral therapy estimated antiretroviral therapy coverage among childrenreported number of children
0-14 years receiving artestimate lower estimate upper estimate estimate lower estimate upper estimate estimate lower estimate upper estimate estimate lower estimate upper estimate Total Total
India … … … … … … … … … … … … … 22,896
Indonesia … … … … … … … … … … … … 356 759
Lao PDR … … … … … … … … … … … … 95 133
Malaysia … … … … … … … … … … … … 501 487
Maldives … … … … … … … … … … … … … 0
Myanmar … … … … … … … … … … … … 1,535 2,995
Nepal … … … … … … … … … … … … 178 432
Pakistan … … … … … … … … … … … … 57 105
Philippines … … … … … … … … … … … … 11 19
Sri Lanka … … … … … … … … … … … … 11 18
Thailand … … … … … … … … … … … … 8,076 6,510
Timor Leste … … … … … … … … … … … … 3 3
Viet Nam … … … … … … … … … … … … 1,987 2,668
WEstErn and cEntral EuroPE and nortH amErica
Albania … … … … … … … … … … … … 15 14
Bosnia and Herzegovina … … … … … … … … … … … … 1 1
Bulgaria … … … … … … … … … … … … 3 6
Croatia … … … … … … … … … … … … 3 …
Hungary … … … … … … … … … … … … 6 …
Latvia … … … … … … … … … … … … 26 25
Lithuania … … … … … … … … … … … … 2 2
Macedonia … … … … … … … … … … … … 1 0
Montenegro … … … … … … … … … … … … 1 1
Poland … … … … … … … … … … … … 137 …
Romania … … … … … … … … … … … … 192 189
Serbia … … … … … … … … … … … … 11 9
Turkey … … … … … … … … … … … … 9 0
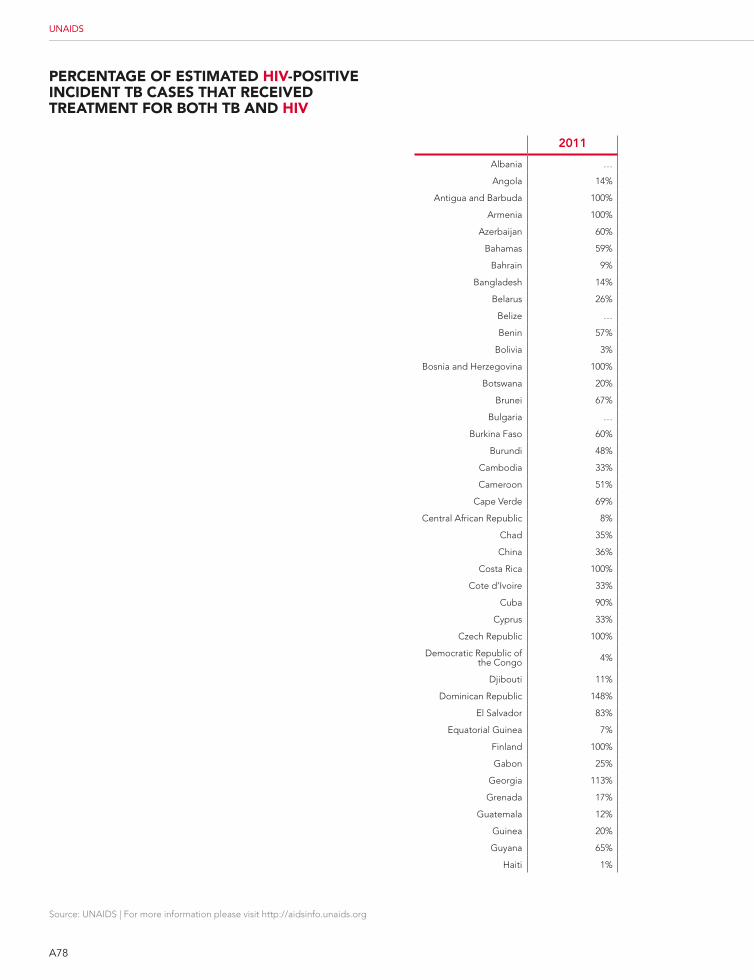
A78
Source: UNAIDS | For more information please visit http://aidsinfo.unaids.org
UNAIDS
PErcEntagE of EstimatEd HiV-PositiVE incidEnt tb casEs tHat rEcEiVEd trEatmEnt for botH tb and HiV
2011
Albania …
Angola 14%
Antigua and Barbuda 100%
Armenia 100%
Azerbaijan 60%
Bahamas 59%
Bahrain 9%
Bangladesh 14%
Belarus 26%
Belize …
Benin 57%
Bolivia 3%
Bosnia and Herzegovina 100%
Botswana 20%
Brunei 67%
Bulgaria …
Burkina Faso 60%
Burundi 48%
Cambodia 33%
Cameroon 51%
Cape Verde 69%
Central African Republic 8%
Chad 35%
China 36%
Costa Rica 100%
Cote d’Ivoire 33%
Cuba 90%
Cyprus 33%
Czech Republic 100%
Democratic Republic of the Congo 4%
Djibouti 11%
Dominican Republic 148%
El Salvador 83%
Equatorial Guinea 7%
Finland 100%
Gabon 25%
Georgia 113%
Grenada 17%
Guatemala 12%
Guinea 20%
Guyana 65%
Haiti 1%
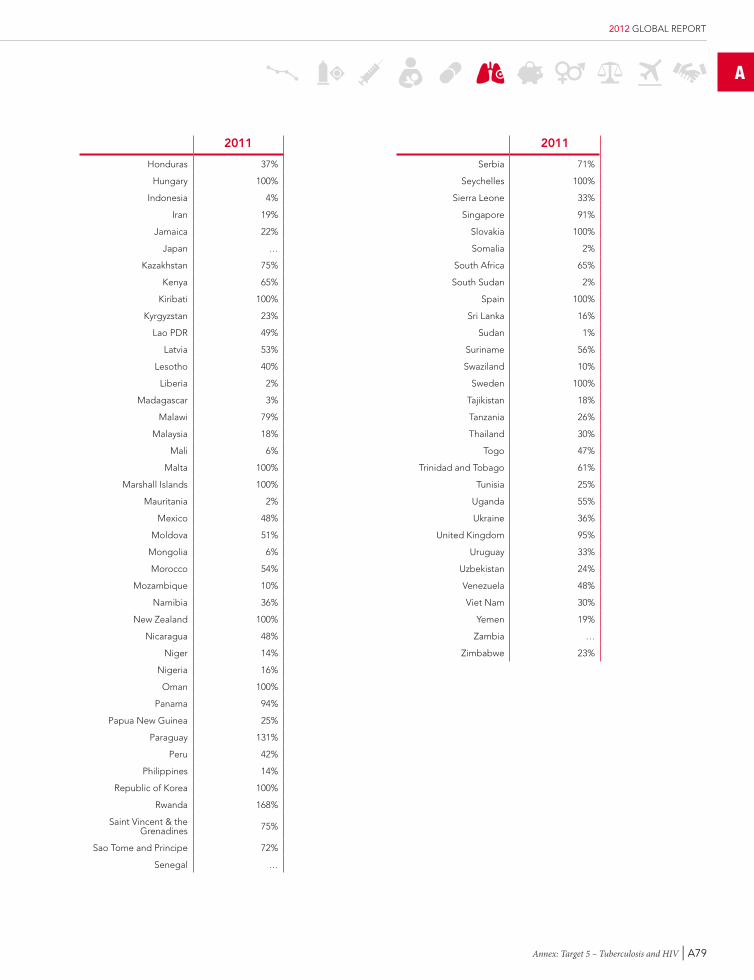
A
Annex: Target 5 – Tuberculosis and HIV | A79
2012 GLOBAL REPORT
2011
Honduras 37%
Hungary 100%
Indonesia 4%
Iran 19%
Jamaica 22%
Japan …
Kazakhstan 75%
Kenya 65%
Kiribati 100%
Kyrgyzstan 23%
Lao PDR 49%
Latvia 53%
Lesotho 40%
Liberia 2%
Madagascar 3%
Malawi 79%
Malaysia 18%
Mali 6%
Malta 100%
Marshall Islands 100%
Mauritania 2%
Mexico 48%
Moldova 51%
Mongolia 6%
Morocco 54%
Mozambique 10%
Namibia 36%
New Zealand 100%
Nicaragua 48%
Niger 14%
Nigeria 16%
Oman 100%
Panama 94%
Papua New Guinea 25%
Paraguay 131%
Peru 42%
Philippines 14%
Republic of Korea 100%
Rwanda 168%
Saint Vincent & the Grenadines 75%
Sao Tome and Principe 72%
Senegal …
2011
Serbia 71%
Seychelles 100%
Sierra Leone 33%
Singapore 91%
Slovakia 100%
Somalia 2%
South Africa 65%
South Sudan 2%
Spain 100%
Sri Lanka 16%
Sudan 1%
Suriname 56%
Swaziland 10%
Sweden 100%
Tajikistan 18%
Tanzania 26%
Thailand 30%
Togo 47%
Trinidad and Tobago 61%
Tunisia 25%
Uganda 55%
Ukraine 36%
United Kingdom 95%
Uruguay 33%
Uzbekistan 24%
Venezuela 48%
Viet Nam 30%
Yemen 19%
Zambia …
Zimbabwe 23%
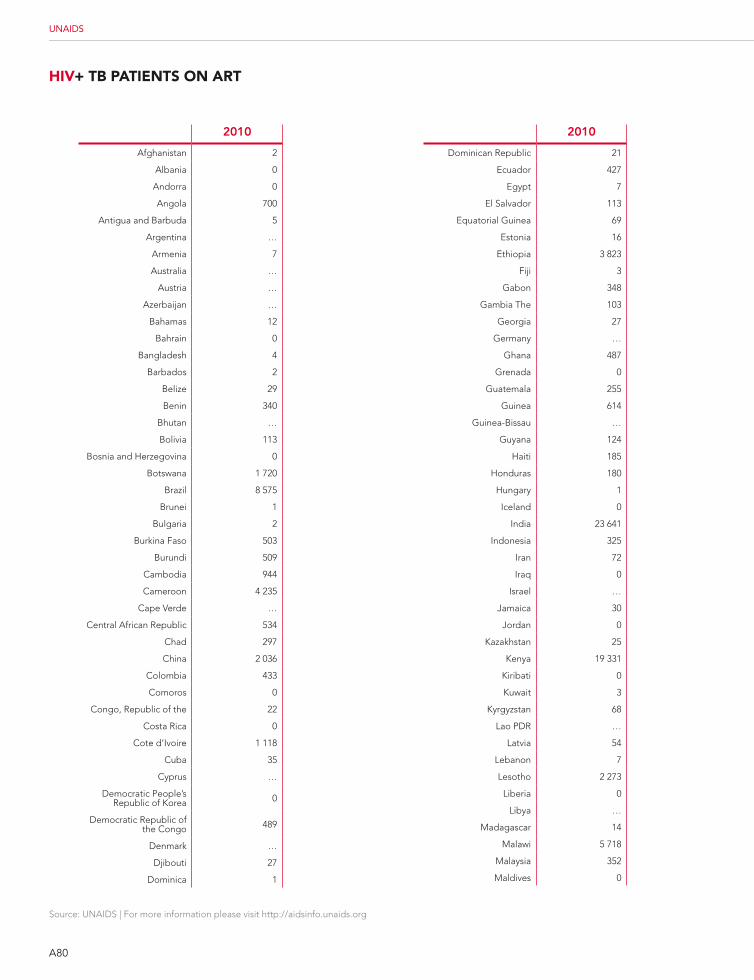
A80
Source: UNAIDS | For more information please visit http://aidsinfo.unaids.org
UNAIDS
HiV+ tb PatiEnts on art
2010
Dominican Republic 21
Ecuador 427
Egypt 7
El Salvador 113
Equatorial Guinea 69
Estonia 16
Ethiopia 3 823
Fiji 3
Gabon 348
Gambia The 103
Georgia 27
Germany …
Ghana 487
Grenada 0
Guatemala 255
Guinea 614
Guinea-Bissau …
Guyana 124
Haiti 185
Honduras 180
Hungary 1
Iceland 0
India 23 641
Indonesia 325
Iran 72
Iraq 0
Israel …
Jamaica 30
Jordan 0
Kazakhstan 25
Kenya 19 331
Kiribati 0
Kuwait 3
Kyrgyzstan 68
Lao PDR …
Latvia 54
Lebanon 7
Lesotho 2 273
Liberia 0
Libya …
Madagascar 14
Malawi 5 718
Malaysia 352
Maldives 0
2010
Afghanistan 2
Albania 0
Andorra 0
Angola 700
Antigua and Barbuda 5
Argentina …
Armenia 7
Australia …
Austria …
Azerbaijan …
Bahamas 12
Bahrain 0
Bangladesh 4
Barbados 2
Belize 29
Benin 340
Bhutan …
Bolivia 113
Bosnia and Herzegovina 0
Botswana 1 720
Brazil 8 575
Brunei 1
Bulgaria 2
Burkina Faso 503
Burundi 509
Cambodia 944
Cameroon 4 235
Cape Verde …
Central African Republic 534
Chad 297
China 2 036
Colombia 433
Comoros 0
Congo, Republic of the 22
Costa Rica 0
Cote d’Ivoire 1 118
Cuba 35
Cyprus …
Democratic People’s Republic of Korea 0
Democratic Republic of the Congo 489
Denmark …
Djibouti 27
Dominica 1
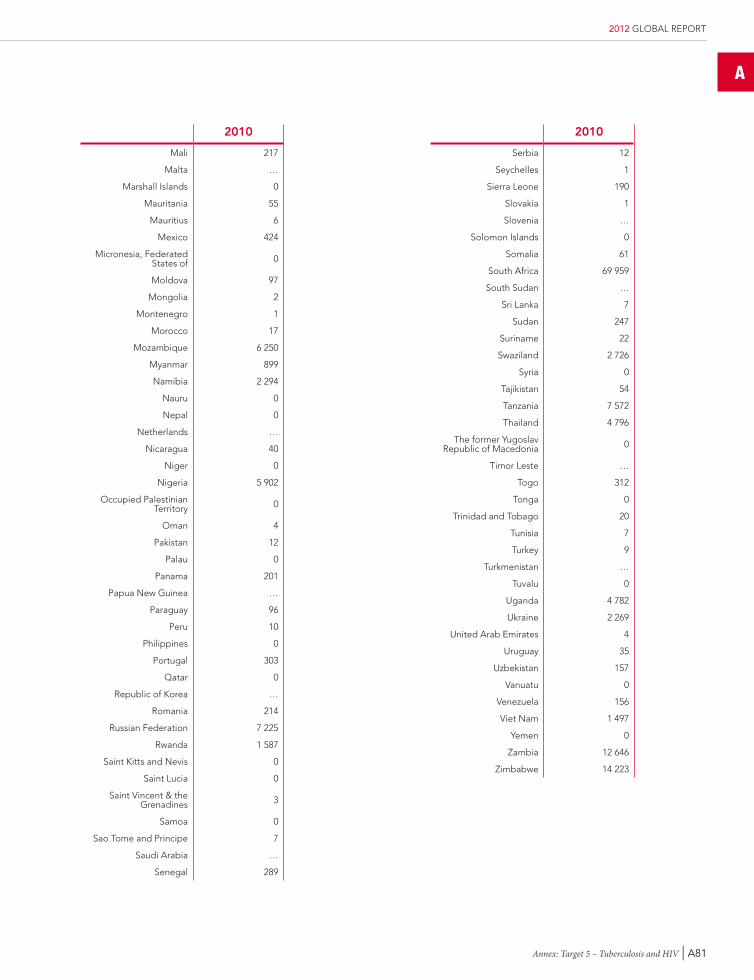
A
Annex: Target 5 – Tuberculosis and HIV | A81
2012 GLOBAL REPORT
2010
Mali 217
Malta …
Marshall Islands 0
Mauritania 55
Mauritius 6
Mexico 424
Micronesia, Federated States of 0
Moldova 97
Mongolia 2
Montenegro 1
Morocco 17
Mozambique 6 250
Myanmar 899
Namibia 2 294
Nauru 0
Nepal 0
Netherlands …
Nicaragua 40
Niger 0
Nigeria 5 902
Occupied Palestinian Territory 0
Oman 4
Pakistan 12
Palau 0
Panama 201
Papua New Guinea …
Paraguay 96
Peru 10
Philippines 0
Portugal 303
Qatar 0
Republic of Korea …
Romania 214
Russian Federation 7 225
Rwanda 1 587
Saint Kitts and Nevis 0
Saint Lucia 0
Saint Vincent & the Grenadines 3
Samoa 0
Sao Tome and Principe 7
Saudi Arabia …
Senegal 289
2010
Serbia 12
Seychelles 1
Sierra Leone 190
Slovakia 1
Slovenia …
Solomon Islands 0
Somalia 61
South Africa 69 959
South Sudan …
Sri Lanka 7
Sudan 247
Suriname 22
Swaziland 2 726
Syria 0
Tajikistan 54
Tanzania 7 572
Thailand 4 796
The former Yugoslav Republic of Macedonia 0
Timor Leste …
Togo 312
Tonga 0
Trinidad and Tobago 20
Tunisia 7
Turkey 9
Turkmenistan …
Tuvalu 0
Uganda 4 782
Ukraine 2 269
United Arab Emirates 4
Uruguay 35
Uzbekistan 157
Vanuatu 0
Venezuela 156
Viet Nam 1 497
Yemen 0
Zambia 12 646
Zimbabwe 14 223
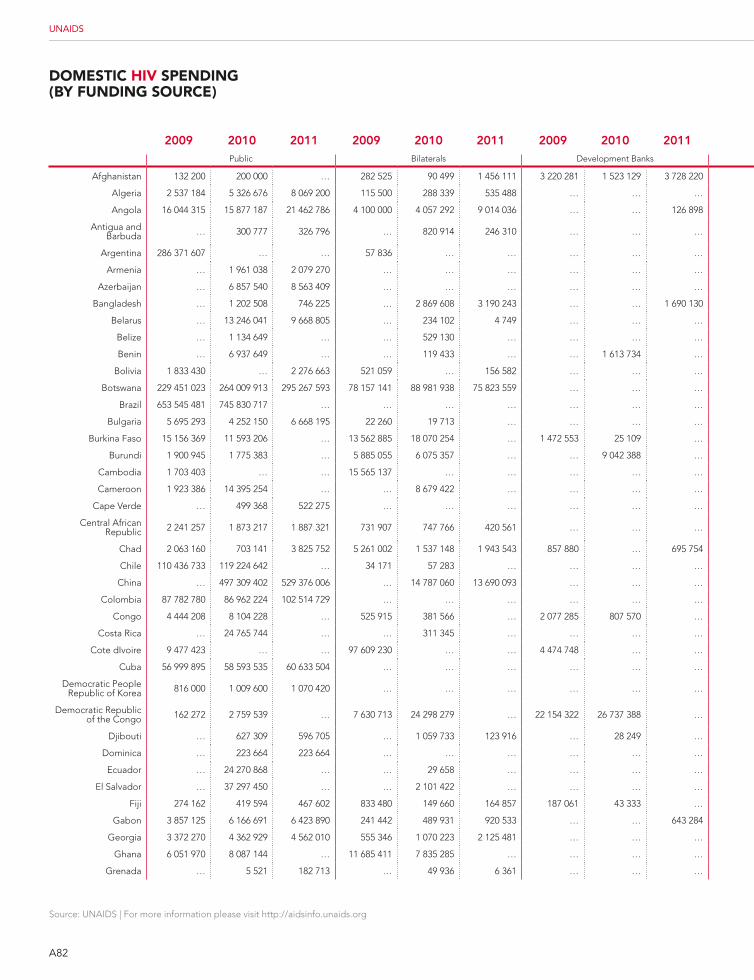
A82
Source: UNAIDS | For more information please visit http://aidsinfo.unaids.org
UNAIDS
domEstic HiV sPEnding (bY funding sourcE)
2009 2010 2011 2009 2010 2011 2009 2010 2011 2009 2010 2011 2009 2010 2011 2009 2010 2011Public Bilaterals Development Banks Global Fund Multilaterals All Other (Multilat. & Internat.)
Afghanistan 132 200 200 000 … 282 525 90 499 1 456 111 3 220 281 1 523 129 3 728 220 1 087 983 1 774 255 1 645 560 435 563 849 942 1 172 183 … … …
Algeria 2 537 184 5 326 676 8 069 200 115 500 288 339 535 488 … … … … … … 55 500 180 060 312 046 … 402 4 421
Angola 16 044 315 15 877 187 21 462 786 4 100 000 4 057 292 9 014 036 … … 126 898 8 285 337 8 199 031 263 478 3 920 587 3 879 748 894 705 2 073 250 2 051 653 1 715 635
Antigua and Barbuda … 300 777 326 796 … 820 914 246 310 … … … … 233 300 37 290 … 6 866 6 866 … … …
Argentina 286 371 607 … … 57 836 … … … … … … … … 671 049 … … … … …
Armenia … 1 961 038 2 079 270 … … … … … … … 2 885 885 3 227 460 … 126 671 188 352 … 72 194 85 353
Azerbaijan … 6 857 540 8 563 409 … … … … … … … 616 197 5 416 440 … 171 014 152 855 … 591 500 423 000
Bangladesh … 1 202 508 746 225 … 2 869 608 3 190 243 … … 1 690 130 … 10 461 394 12 389 199 … 232 797 202 846 … 348 682 428 488
Belarus … 13 246 041 9 668 805 … 234 102 4 749 … … … … 5 946 198 9 778 974 … 238 119 266 925 … 58 522 145 031
Belize … 1 134 649 … … 529 130 … … … … … … … … 280 346 … … 603 420 …
Benin … 6 937 649 … … 119 433 … … 1 613 734 … … 2 368 720 … … 3 228 966 … … 3 929 033 …
Bolivia 1 833 430 … 2 276 663 521 059 … 156 582 … … … 5 215 054 … 4 799 828 613 437 … 499 221 1 550 455 … 1 519 416
Botswana 229 451 023 264 009 913 295 267 593 78 157 141 88 981 938 75 823 559 … … … 882 026 … … 1 796 277 2 040 884 2 689 349 9 012 985 10 264 133 11 733 337
Brazil 653 545 481 745 830 717 … … … … … … … … … … 2 968 684 7 468 124 … 334 701 1 699 227 …
Bulgaria 5 695 293 4 252 150 6 668 195 22 260 19 713 … … … … 4 746 955 5 494 807 6 382 691 293 858 81 000 95 000 292 666 44 937 …
Burkina Faso 15 156 369 11 593 206 … 13 562 885 18 070 254 … 1 472 553 25 109 … 13 141 980 14 559 973 … 4 868 194 7 574 732 … 2 571 000 432 584 …
Burundi 1 900 945 1 775 383 … 5 885 055 6 075 357 … … 9 042 388 … 8 605 500 19 840 902 … 3 185 897 2 260 516 … 7 273 624 2 713 322 …
Cambodia 1 703 403 … … 15 565 137 … … … … … 19 023 377 … … 7 547 437 … … 9 858 889 … …
Cameroon 1 923 386 14 395 254 … … 8 679 422 … … … … … 17 134 894 … … 3 562 002 … … 11 539 968 …
Cape Verde … 499 368 522 275 … … … … … … … 1 711 088 2 853 473 … 149 724 94 703 … 185 032 124 985
Central African Republic 2 241 257 1 873 217 1 887 321 731 907 747 766 420 561 … … … 2 285 032 3 979 986 6 189 238 6 073 868 8 055 827 7 063 516 110 195 240 603 112 671
Chad 2 063 160 703 141 3 825 752 5 261 002 1 537 148 1 943 543 857 880 … 695 754 2 016 340 1 053 196 3 917 486 1 991 867 6 652 445 3 185 094 336 280 1 440 835 770 991
Chile 110 436 733 119 224 642 … 34 171 57 283 … … … … … … … 275 061 411 244 … … … …
China … 497 309 402 529 376 006 … 14 787 060 13 690 093 … … … … 40 436 517 27 664 861 … 5 675 752 2 935 759 … 25 418 125 15 706 811
Colombia 87 782 780 86 962 224 102 514 729 … … … … … … … … … 220 541 275 591 332 684 … … …
Congo 4 444 208 8 104 228 … 525 915 381 566 … 2 077 285 807 570 … 4 105 659 6 354 280 … 531 830 337 139 … 291 851 487 802 …
Costa Rica … 24 765 744 … … 311 345 … … … … … … … … 338 411 … … 1 529 141 …
Cote dIvoire 9 477 423 … … 97 609 230 … … 4 474 748 … … 9 240 931 … … 3 854 000 … … 4 404 619 … …
Cuba 56 999 895 58 593 535 60 633 504 … … … … … … 11 631 474 8 261 407 9 321 423 … … … 89 457 … …
Democratic People Republic of Korea 816 000 1 009 600 1 070 420 … … … … … … … … … 52 500 5 000 75 000 … … …
Democratic Republic of the Congo 162 272 2 759 539 … 7 630 713 24 298 279 … 22 154 322 26 737 388 … 34 910 098 30 107 409 … 12 952 358 16 480 566 … 7 399 533 4 814 175 …
Djibouti … 627 309 596 705 … 1 059 733 123 916 … 28 249 … … 1 358 827 1 975 708 … 1 971 916 1 597 164 … … …
Dominica … 223 664 223 664 … … … … … … … … … … … … … … …
Ecuador … 24 270 868 … … 29 658 … … … … … 26 364 … … 1 336 249 … … 1 583 268 …
El Salvador … 37 297 450 … … 2 101 422 … … … … … 7 451 451 … … 273 174 … … 1 629 385 …
Fiji 274 162 419 594 467 602 833 480 149 660 164 857 187 061 43 333 … 371 646 72 512 206 829 643 536 339 790 653 830 22 366 1 072 100 762 094
Gabon 3 857 125 6 166 691 6 423 890 241 442 489 931 920 533 … … 643 284 1 874 376 1 288 011 915 788 427 711 578 116 1 124 598 … … …
Georgia 3 372 270 4 362 929 4 562 010 555 346 1 070 223 2 125 481 … … … 4 460 231 5 300 330 5 146 960 326 033 212 468 401 494 373 447 249 945 847 976
Ghana 6 051 970 8 087 144 … 11 685 411 7 835 285 … … … … 24 680 506 27 525 703 … 1 147 421 3 384 797 … 3 030 977 9 269 696 …
Grenada … 5 521 182 713 … 49 936 6 361 … … … … 14 839 11 355 … 1 178 34 666 … 22 028 51 709
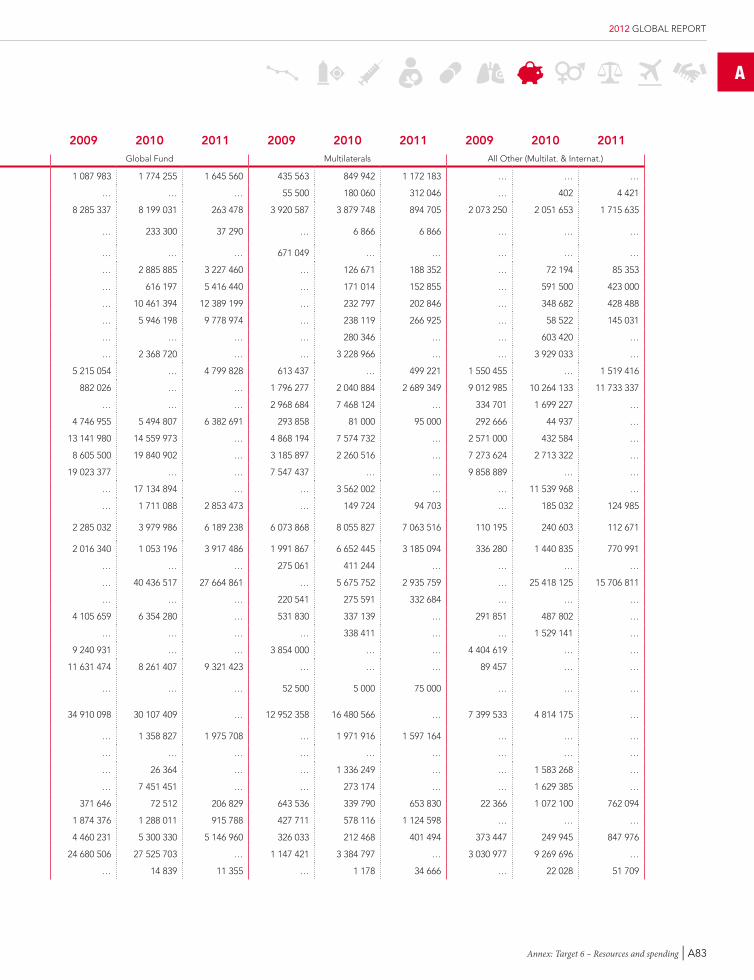
A
Annex: Target 6 – Resources and spending | A83
2012 GLOBAL REPORT
2009 2010 2011 2009 2010 2011 2009 2010 2011 2009 2010 2011 2009 2010 2011 2009 2010 2011Public Bilaterals Development Banks Global Fund Multilaterals All Other (Multilat. & Internat.)
Afghanistan 132 200 200 000 … 282 525 90 499 1 456 111 3 220 281 1 523 129 3 728 220 1 087 983 1 774 255 1 645 560 435 563 849 942 1 172 183 … … …
Algeria 2 537 184 5 326 676 8 069 200 115 500 288 339 535 488 … … … … … … 55 500 180 060 312 046 … 402 4 421
Angola 16 044 315 15 877 187 21 462 786 4 100 000 4 057 292 9 014 036 … … 126 898 8 285 337 8 199 031 263 478 3 920 587 3 879 748 894 705 2 073 250 2 051 653 1 715 635
Antigua and Barbuda … 300 777 326 796 … 820 914 246 310 … … … … 233 300 37 290 … 6 866 6 866 … … …
Argentina 286 371 607 … … 57 836 … … … … … … … … 671 049 … … … … …
Armenia … 1 961 038 2 079 270 … … … … … … … 2 885 885 3 227 460 … 126 671 188 352 … 72 194 85 353
Azerbaijan … 6 857 540 8 563 409 … … … … … … … 616 197 5 416 440 … 171 014 152 855 … 591 500 423 000
Bangladesh … 1 202 508 746 225 … 2 869 608 3 190 243 … … 1 690 130 … 10 461 394 12 389 199 … 232 797 202 846 … 348 682 428 488
Belarus … 13 246 041 9 668 805 … 234 102 4 749 … … … … 5 946 198 9 778 974 … 238 119 266 925 … 58 522 145 031
Belize … 1 134 649 … … 529 130 … … … … … … … … 280 346 … … 603 420 …
Benin … 6 937 649 … … 119 433 … … 1 613 734 … … 2 368 720 … … 3 228 966 … … 3 929 033 …
Bolivia 1 833 430 … 2 276 663 521 059 … 156 582 … … … 5 215 054 … 4 799 828 613 437 … 499 221 1 550 455 … 1 519 416
Botswana 229 451 023 264 009 913 295 267 593 78 157 141 88 981 938 75 823 559 … … … 882 026 … … 1 796 277 2 040 884 2 689 349 9 012 985 10 264 133 11 733 337
Brazil 653 545 481 745 830 717 … … … … … … … … … … 2 968 684 7 468 124 … 334 701 1 699 227 …
Bulgaria 5 695 293 4 252 150 6 668 195 22 260 19 713 … … … … 4 746 955 5 494 807 6 382 691 293 858 81 000 95 000 292 666 44 937 …
Burkina Faso 15 156 369 11 593 206 … 13 562 885 18 070 254 … 1 472 553 25 109 … 13 141 980 14 559 973 … 4 868 194 7 574 732 … 2 571 000 432 584 …
Burundi 1 900 945 1 775 383 … 5 885 055 6 075 357 … … 9 042 388 … 8 605 500 19 840 902 … 3 185 897 2 260 516 … 7 273 624 2 713 322 …
Cambodia 1 703 403 … … 15 565 137 … … … … … 19 023 377 … … 7 547 437 … … 9 858 889 … …
Cameroon 1 923 386 14 395 254 … … 8 679 422 … … … … … 17 134 894 … … 3 562 002 … … 11 539 968 …
Cape Verde … 499 368 522 275 … … … … … … … 1 711 088 2 853 473 … 149 724 94 703 … 185 032 124 985
Central African Republic 2 241 257 1 873 217 1 887 321 731 907 747 766 420 561 … … … 2 285 032 3 979 986 6 189 238 6 073 868 8 055 827 7 063 516 110 195 240 603 112 671
Chad 2 063 160 703 141 3 825 752 5 261 002 1 537 148 1 943 543 857 880 … 695 754 2 016 340 1 053 196 3 917 486 1 991 867 6 652 445 3 185 094 336 280 1 440 835 770 991
Chile 110 436 733 119 224 642 … 34 171 57 283 … … … … … … … 275 061 411 244 … … … …
China … 497 309 402 529 376 006 … 14 787 060 13 690 093 … … … … 40 436 517 27 664 861 … 5 675 752 2 935 759 … 25 418 125 15 706 811
Colombia 87 782 780 86 962 224 102 514 729 … … … … … … … … … 220 541 275 591 332 684 … … …
Congo 4 444 208 8 104 228 … 525 915 381 566 … 2 077 285 807 570 … 4 105 659 6 354 280 … 531 830 337 139 … 291 851 487 802 …
Costa Rica … 24 765 744 … … 311 345 … … … … … … … … 338 411 … … 1 529 141 …
Cote dIvoire 9 477 423 … … 97 609 230 … … 4 474 748 … … 9 240 931 … … 3 854 000 … … 4 404 619 … …
Cuba 56 999 895 58 593 535 60 633 504 … … … … … … 11 631 474 8 261 407 9 321 423 … … … 89 457 … …
Democratic People Republic of Korea 816 000 1 009 600 1 070 420 … … … … … … … … … 52 500 5 000 75 000 … … …
Democratic Republic of the Congo 162 272 2 759 539 … 7 630 713 24 298 279 … 22 154 322 26 737 388 … 34 910 098 30 107 409 … 12 952 358 16 480 566 … 7 399 533 4 814 175 …
Djibouti … 627 309 596 705 … 1 059 733 123 916 … 28 249 … … 1 358 827 1 975 708 … 1 971 916 1 597 164 … … …
Dominica … 223 664 223 664 … … … … … … … … … … … … … … …
Ecuador … 24 270 868 … … 29 658 … … … … … 26 364 … … 1 336 249 … … 1 583 268 …
El Salvador … 37 297 450 … … 2 101 422 … … … … … 7 451 451 … … 273 174 … … 1 629 385 …
Fiji 274 162 419 594 467 602 833 480 149 660 164 857 187 061 43 333 … 371 646 72 512 206 829 643 536 339 790 653 830 22 366 1 072 100 762 094
Gabon 3 857 125 6 166 691 6 423 890 241 442 489 931 920 533 … … 643 284 1 874 376 1 288 011 915 788 427 711 578 116 1 124 598 … … …
Georgia 3 372 270 4 362 929 4 562 010 555 346 1 070 223 2 125 481 … … … 4 460 231 5 300 330 5 146 960 326 033 212 468 401 494 373 447 249 945 847 976
Ghana 6 051 970 8 087 144 … 11 685 411 7 835 285 … … … … 24 680 506 27 525 703 … 1 147 421 3 384 797 … 3 030 977 9 269 696 …
Grenada … 5 521 182 713 … 49 936 6 361 … … … … 14 839 11 355 … 1 178 34 666 … 22 028 51 709
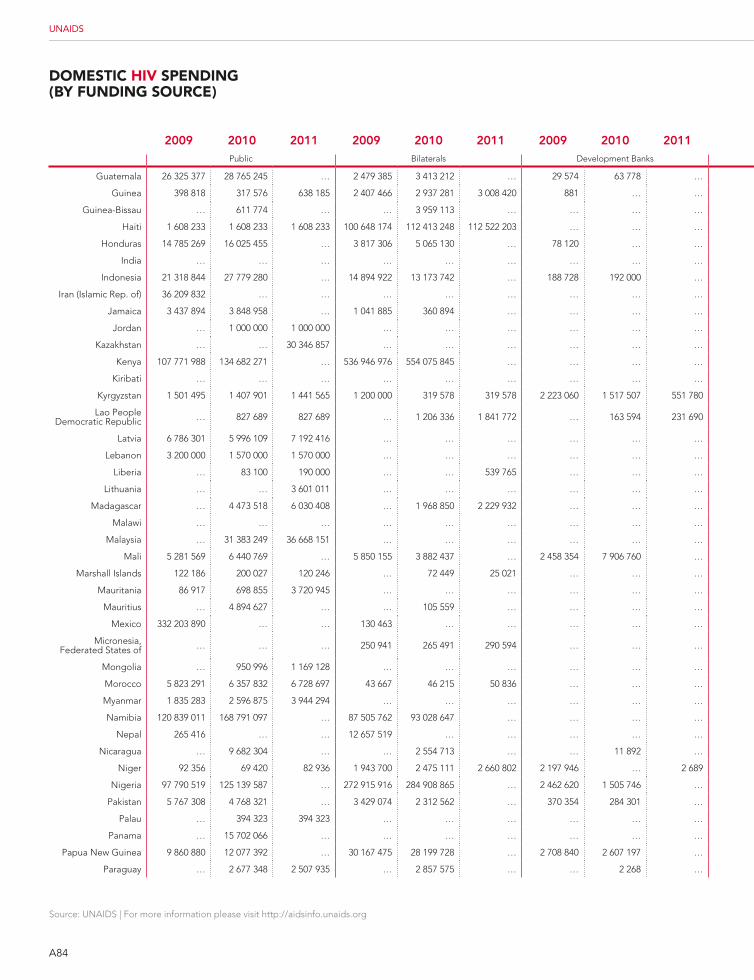
A84
Source: UNAIDS | For more information please visit http://aidsinfo.unaids.org
UNAIDS
domEstic HiV sPEnding (bY funding sourcE)
2009 2010 2011 2009 2010 2011 2009 2010 2011 2009 2010 2011 2009 2010 2011 2009 2010 2011Public Bilaterals Development Banks Global Fund Multilaterals All Other (Multilat. & Internat.)
Guatemala 26 325 377 28 765 245 … 2 479 385 3 413 212 … 29 574 63 778 … 6 528 435 5 661 421 … 3 128 050 1 569 879 … 2 314 853 2 177 406 …
Guinea 398 818 317 576 638 185 2 407 466 2 937 281 3 008 420 881 … … 792 154 1 463 210 4 611 586 2 582 965 1 780 330 1 355 255 6 938 806 4 925 974 5 163 845
Guinea-Bissau … 611 774 … … 3 959 113 … … … … … … … … 687 951 … … … …
Haiti 1 608 233 1 608 233 1 608 233 100 648 174 112 413 248 112 522 203 … … … 18 056 398 21 587 726 8 607 148 16 292 267 13 250 596 49 276 067 … … …
Honduras 14 785 269 16 025 455 … 3 817 306 5 065 130 … 78 120 … … 7 668 106 8 010 680 … 1 181 044 1 344 386 … 640 556 1 296 149 …
India … … … … … … … … … … … … … … … … … …
Indonesia 21 318 844 27 779 280 … 14 894 922 13 173 742 … 188 728 192 000 … 19 208 072 23 588 860 … 4 674 854 4 412 998 … … … …
Iran (Islamic Rep. of) 36 209 832 … … … … … … … … … … … 4 551 488 … … … … …
Jamaica 3 437 894 3 848 958 … 1 041 885 360 894 … … … … 9 986 758 9 680 362 … 433 556 258 577 … 246 417 472 073 …
Jordan … 1 000 000 1 000 000 … … … … … … … 723 768 433 831 … … … … … …
Kazakhstan … … 30 346 857 … … … … … … … … 5 151 157 … … 338 007 … … 1 050 997
Kenya 107 771 988 134 682 271 … 536 946 976 554 075 845 … … … … 5 345 199 15 266 186 … … … … 20 800 000 22 034 292 …
Kiribati … … … … … … … … … … 424 106 83 959 … … … … 5 694 174 929
Kyrgyzstan 1 501 495 1 407 901 1 441 565 1 200 000 319 578 319 578 2 223 060 1 517 507 551 780 4 999 241 5 836 715 2 152 922 1 600 000 1 753 560 905 000 630 000 400 000 350 000
Lao People Democratic Republic … 827 689 827 689 … 1 206 336 1 841 772 … 163 594 231 690 … 4 357 227 7 562 540 … 972 646 934 476 … 1 052 247 345 968
Latvia 6 786 301 5 996 109 7 192 416 … … … … … … … … … 323 503 146 569 25 228 17 888 25 990 70 621
Lebanon 3 200 000 1 570 000 1 570 000 … … … … … … … … … … … … … … …
Liberia … 83 100 190 000 … … 539 765 … … … … 25 511 143 22 804 922 … 2 763 451 7 588 885 … … …
Lithuania … … 3 601 011 … … … … … … … … … … … … … … 68 390
Madagascar … 4 473 518 6 030 408 … 1 968 850 2 229 932 … … … … 1 485 034 4 147 480 … 1 417 801 1 422 281 … 66 330 45 725
Malawi … … … … … … … … … … … … … … … … … …
Malaysia … 31 383 249 36 668 151 … … … … … … … … 2 232 176 … 561 880 307 629 … … …
Mali 5 281 569 6 440 769 … 5 850 155 3 882 437 … 2 458 354 7 906 760 … 9 451 472 14 802 895 … 995 376 470 510 … 4 124 590 2 669 735 …
Marshall Islands 122 186 200 027 120 246 … 72 449 25 021 … … … 3 655 118 457 83 557 … … … … … …
Mauritania 86 917 698 855 3 720 945 … … … … … … … … … … … … … … …
Mauritius … 4 894 627 … … 105 559 … … … … … 1 675 382 … … 291 226 … … 291 753 …
Mexico 332 203 890 … … 130 463 … … … … … … … … 803 282 … … 445 281 … …
Micronesia, Federated States of … … … 250 941 265 491 290 594 … … … 77 180 115 772 86 810 142 793 68 898 … 215 012 71 645 96 066
Mongolia … 950 996 1 169 128 … … … … … … … … … … … … … … …
Morocco 5 823 291 6 357 832 6 728 697 43 667 46 215 50 836 … … … 5 392 539 4 811 881 4 190 951 850 994 881 906 742 118 1 342 176 1 359 102 1 405 370
Myanmar 1 835 283 2 596 875 3 944 294 … … … … … … … … … … … … 32 428 850 37 904 167 42 349 184
Namibia 120 839 011 168 791 097 … 87 505 762 93 028 647 … … … … 26 141 080 9 324 333 … 8 332 120 7 860 111 … … … …
Nepal 265 416 … … 12 657 519 … … … … … 6 402 853 … … 652 766 … … … … …
Nicaragua … 9 682 304 … … 2 554 713 … … 11 892 … … 9 155 592 … … 2 113 283 … … 226 491 …
Niger 92 356 69 420 82 936 1 943 700 2 475 111 2 660 802 2 197 946 … 2 689 3 437 444 9 493 223 5 824 701 1 179 132 581 263 5 987 007 1 230 114 1 561 547 1 097 893
Nigeria 97 790 519 125 139 587 … 272 915 916 284 908 865 … 2 462 620 1 505 746 … 35 087 474 65 899 650 … 6 581 611 18 410 698 … 170 987 202 378 …
Pakistan 5 767 308 4 768 321 … 3 429 074 2 312 562 … 370 354 284 301 … 435 890 388 442 … 3 148 777 3 996 848 … 877 807 1 181 821 …
Palau … 394 323 394 323 … … … … … … … … … … … … … … …
Panama … 15 702 066 … … … … … … … … … … … … … … … …
Papua New Guinea 9 860 880 12 077 392 … 30 167 475 28 199 728 … 2 708 840 2 607 197 … 4 718 066 4 572 622 … 1 881 653 2 495 709 … 656 632 946 413 …
Paraguay … 2 677 348 2 507 935 … 2 857 575 … … 2 268 … … 3 588 531 4 115 637 … 318 962 739 922 … … 239 221
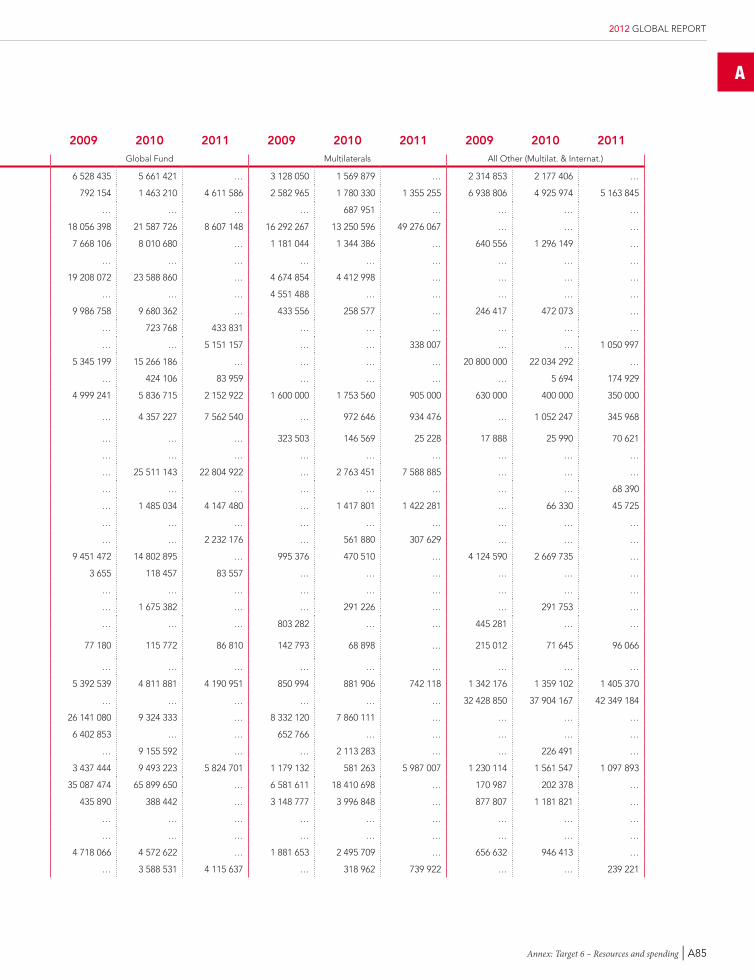
A
Annex: Target 6 – Resources and spending | A85
2012 GLOBAL REPORT
2009 2010 2011 2009 2010 2011 2009 2010 2011 2009 2010 2011 2009 2010 2011 2009 2010 2011Public Bilaterals Development Banks Global Fund Multilaterals All Other (Multilat. & Internat.)
Guatemala 26 325 377 28 765 245 … 2 479 385 3 413 212 … 29 574 63 778 … 6 528 435 5 661 421 … 3 128 050 1 569 879 … 2 314 853 2 177 406 …
Guinea 398 818 317 576 638 185 2 407 466 2 937 281 3 008 420 881 … … 792 154 1 463 210 4 611 586 2 582 965 1 780 330 1 355 255 6 938 806 4 925 974 5 163 845
Guinea-Bissau … 611 774 … … 3 959 113 … … … … … … … … 687 951 … … … …
Haiti 1 608 233 1 608 233 1 608 233 100 648 174 112 413 248 112 522 203 … … … 18 056 398 21 587 726 8 607 148 16 292 267 13 250 596 49 276 067 … … …
Honduras 14 785 269 16 025 455 … 3 817 306 5 065 130 … 78 120 … … 7 668 106 8 010 680 … 1 181 044 1 344 386 … 640 556 1 296 149 …
India … … … … … … … … … … … … … … … … … …
Indonesia 21 318 844 27 779 280 … 14 894 922 13 173 742 … 188 728 192 000 … 19 208 072 23 588 860 … 4 674 854 4 412 998 … … … …
Iran (Islamic Rep. of) 36 209 832 … … … … … … … … … … … 4 551 488 … … … … …
Jamaica 3 437 894 3 848 958 … 1 041 885 360 894 … … … … 9 986 758 9 680 362 … 433 556 258 577 … 246 417 472 073 …
Jordan … 1 000 000 1 000 000 … … … … … … … 723 768 433 831 … … … … … …
Kazakhstan … … 30 346 857 … … … … … … … … 5 151 157 … … 338 007 … … 1 050 997
Kenya 107 771 988 134 682 271 … 536 946 976 554 075 845 … … … … 5 345 199 15 266 186 … … … … 20 800 000 22 034 292 …
Kiribati … … … … … … … … … … 424 106 83 959 … … … … 5 694 174 929
Kyrgyzstan 1 501 495 1 407 901 1 441 565 1 200 000 319 578 319 578 2 223 060 1 517 507 551 780 4 999 241 5 836 715 2 152 922 1 600 000 1 753 560 905 000 630 000 400 000 350 000
Lao People Democratic Republic … 827 689 827 689 … 1 206 336 1 841 772 … 163 594 231 690 … 4 357 227 7 562 540 … 972 646 934 476 … 1 052 247 345 968
Latvia 6 786 301 5 996 109 7 192 416 … … … … … … … … … 323 503 146 569 25 228 17 888 25 990 70 621
Lebanon 3 200 000 1 570 000 1 570 000 … … … … … … … … … … … … … … …
Liberia … 83 100 190 000 … … 539 765 … … … … 25 511 143 22 804 922 … 2 763 451 7 588 885 … … …
Lithuania … … 3 601 011 … … … … … … … … … … … … … … 68 390
Madagascar … 4 473 518 6 030 408 … 1 968 850 2 229 932 … … … … 1 485 034 4 147 480 … 1 417 801 1 422 281 … 66 330 45 725
Malawi … … … … … … … … … … … … … … … … … …
Malaysia … 31 383 249 36 668 151 … … … … … … … … 2 232 176 … 561 880 307 629 … … …
Mali 5 281 569 6 440 769 … 5 850 155 3 882 437 … 2 458 354 7 906 760 … 9 451 472 14 802 895 … 995 376 470 510 … 4 124 590 2 669 735 …
Marshall Islands 122 186 200 027 120 246 … 72 449 25 021 … … … 3 655 118 457 83 557 … … … … … …
Mauritania 86 917 698 855 3 720 945 … … … … … … … … … … … … … … …
Mauritius … 4 894 627 … … 105 559 … … … … … 1 675 382 … … 291 226 … … 291 753 …
Mexico 332 203 890 … … 130 463 … … … … … … … … 803 282 … … 445 281 … …
Micronesia, Federated States of … … … 250 941 265 491 290 594 … … … 77 180 115 772 86 810 142 793 68 898 … 215 012 71 645 96 066
Mongolia … 950 996 1 169 128 … … … … … … … … … … … … … … …
Morocco 5 823 291 6 357 832 6 728 697 43 667 46 215 50 836 … … … 5 392 539 4 811 881 4 190 951 850 994 881 906 742 118 1 342 176 1 359 102 1 405 370
Myanmar 1 835 283 2 596 875 3 944 294 … … … … … … … … … … … … 32 428 850 37 904 167 42 349 184
Namibia 120 839 011 168 791 097 … 87 505 762 93 028 647 … … … … 26 141 080 9 324 333 … 8 332 120 7 860 111 … … … …
Nepal 265 416 … … 12 657 519 … … … … … 6 402 853 … … 652 766 … … … … …
Nicaragua … 9 682 304 … … 2 554 713 … … 11 892 … … 9 155 592 … … 2 113 283 … … 226 491 …
Niger 92 356 69 420 82 936 1 943 700 2 475 111 2 660 802 2 197 946 … 2 689 3 437 444 9 493 223 5 824 701 1 179 132 581 263 5 987 007 1 230 114 1 561 547 1 097 893
Nigeria 97 790 519 125 139 587 … 272 915 916 284 908 865 … 2 462 620 1 505 746 … 35 087 474 65 899 650 … 6 581 611 18 410 698 … 170 987 202 378 …
Pakistan 5 767 308 4 768 321 … 3 429 074 2 312 562 … 370 354 284 301 … 435 890 388 442 … 3 148 777 3 996 848 … 877 807 1 181 821 …
Palau … 394 323 394 323 … … … … … … … … … … … … … … …
Panama … 15 702 066 … … … … … … … … … … … … … … … …
Papua New Guinea 9 860 880 12 077 392 … 30 167 475 28 199 728 … 2 708 840 2 607 197 … 4 718 066 4 572 622 … 1 881 653 2 495 709 … 656 632 946 413 …
Paraguay … 2 677 348 2 507 935 … 2 857 575 … … 2 268 … … 3 588 531 4 115 637 … 318 962 739 922 … … 239 221
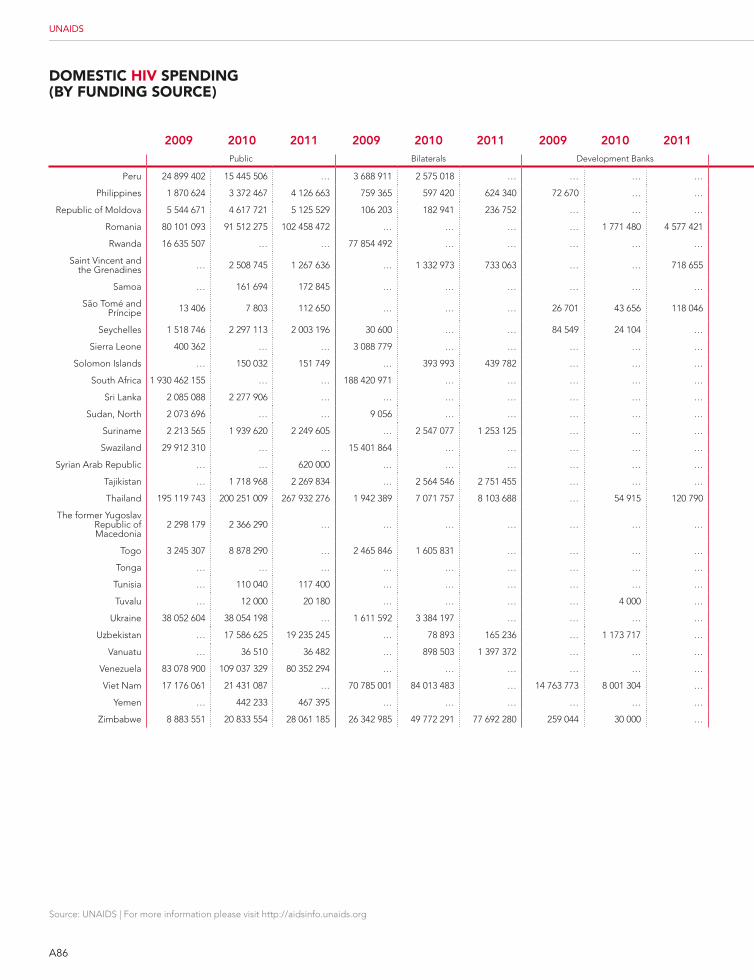
A86
Source: UNAIDS | For more information please visit http://aidsinfo.unaids.org
UNAIDS
domEstic HiV sPEnding (bY funding sourcE)
2009 2010 2011 2009 2010 2011 2009 2010 2011 2009 2010 2011 2009 2010 2011 2009 2010 2011Public Bilaterals Development Banks Global Fund Multilaterals All Other (Multilat. & Internat.)
Peru 24 899 402 15 445 506 … 3 688 911 2 575 018 … … … … 16 022 244 7 278 840 … 1 103 254 403 751 … 8 736 388 2 216 561 …
Philippines 1 870 624 3 372 467 4 126 663 759 365 597 420 624 340 72 670 … … 6 687 850 3 278 792 1 955 077 1 223 488 1 007 266 1 171 076 19 936 119 242 121 650
Republic of Moldova 5 544 671 4 617 721 5 125 529 106 203 182 941 236 752 … … … 3 760 803 5 302 443 7 161 464 1 277 549 403 777 979 690 789 171 214 054 141 112
Romania 80 101 093 91 512 275 102 458 472 … … … … 1 771 480 4 577 421 3 324 074 1 417 679 … 460 900 660 616 716 706 369 873 145 980 382 997
Rwanda 16 635 507 … … 77 854 492 … … … … … 63 649 284 … … 1 917 394 … … 13 256 962 … …
Saint Vincent and the Grenadines … 2 508 745 1 267 636 … 1 332 973 733 063 … … 718 655 … 116 050 82 558 … 33 512 … … … 34 434
Samoa … 161 694 172 845 … … … … … … … 82 661 102 625 … 95 536 29 583 … 5 137 2 430
São Tomé and Príncipe 13 406 7 803 112 650 … … … 26 701 43 656 118 046 131 292 260 248 294 122 251 662 259 461 273 686 37 508 34 585 82 365
Seychelles 1 518 746 2 297 113 2 003 196 30 600 … … 84 549 24 104 … … … … 63 538 17 581 53 040 51 217 15 811 13 174
Sierra Leone 400 362 … … 3 088 779 … … … … … 8 357 853 … … 1 783 802 … … 648 000 … …
Solomon Islands … 150 032 151 749 … 393 993 439 782 … … … … … … … 44 612 17 435 … 215 690 299 462
South Africa 1 930 462 155 … … 188 420 971 … … … … … 22 239 662 … … 2 857 022 … … 51 612 969 … …
Sri Lanka 2 085 088 2 277 906 … … … … … … … 421 802 267 539 … 622 525 818 769 … 1 090 393 949 938 …
Sudan, North 2 073 696 … … 9 056 … … … … … 10 907 580 … … 2 182 723 … … 185 569 … …
Suriname 2 213 565 1 939 620 2 249 605 … 2 547 077 1 253 125 … … … 1 541 834 1 485 037 1 009 894 199 973 73 872 67 700 … … 12 385
Swaziland 29 912 310 … … 15 401 864 … … … … … 18 503 024 … … 3 996 246 … … 4 936 578 … …
Syrian Arab Republic … … 620 000 … … … … … … … … … … … 189 850 … … …
Tajikistan … 1 718 968 2 269 834 … 2 564 546 2 751 455 … … … … 9 825 871 8 815 922 … 537 086 743 891 … 586 650 720 935
Thailand 195 119 743 200 251 009 267 932 276 1 942 389 7 071 757 8 103 688 … 54 915 120 790 10 735 812 26 021 888 35 359 954 1 308 590 1 473 326 1 488 538 … 1 304 782 1 357 422
The former Yugoslav Republic of Macedonia
2 298 179 2 366 290 … … … … … … … 1 966 542 1 723 215 … 373 635 462 347 … 114 901 171 120 …
Togo 3 245 307 8 878 290 … 2 465 846 1 605 831 … … … … 5 488 906 6 937 675 … 1 347 355 1 506 109 … 2 119 594 3 463 112 …
Tonga … … … … … … … … … … … … … … … … … …
Tunisia … 110 040 117 400 … … … … … … … 2 928 100 2 615 149 … … … … … 10 000
Tuvalu … 12 000 20 180 … … … … 4 000 … … 43 641 121 916 … … … … … 35 000
Ukraine 38 052 604 38 054 198 … 1 611 592 3 384 197 … … … … 22 079 767 26 858 256 … 1 253 446 1 758 678 … 1 613 814 1 876 599 …
Uzbekistan … 17 586 625 19 235 245 … 78 893 165 236 … 1 173 717 … … 50 000 6 045 177 … 173 000 468 000 … 201 764 357 488
Vanuatu … 36 510 36 482 … 898 503 1 397 372 … … … … 177 211 328 393 … 38 888 28 769 … 510 411 92 474
Venezuela 83 078 900 109 037 329 80 352 294 … … … … … … … … … 345 384 626 411 133 327 … … …
Viet Nam 17 176 061 21 431 087 … 70 785 001 84 013 483 … 14 763 773 8 001 304 … 5 829 561 6 650 517 … 1 640 997 1 343 508 … 1 142 572 2 212 967 …
Yemen … 442 233 467 395 … … … … … … … … 351 385 … 923 775 461 636 … 844 990 333 504
Zimbabwe 8 883 551 20 833 554 28 061 185 26 342 985 49 772 291 77 692 280 259 044 30 000 … 8 545 029 66 042 408 26 233 338 7 452 677 17 972 300 27 240 021 18 952 442 30 302 187 44 865 531
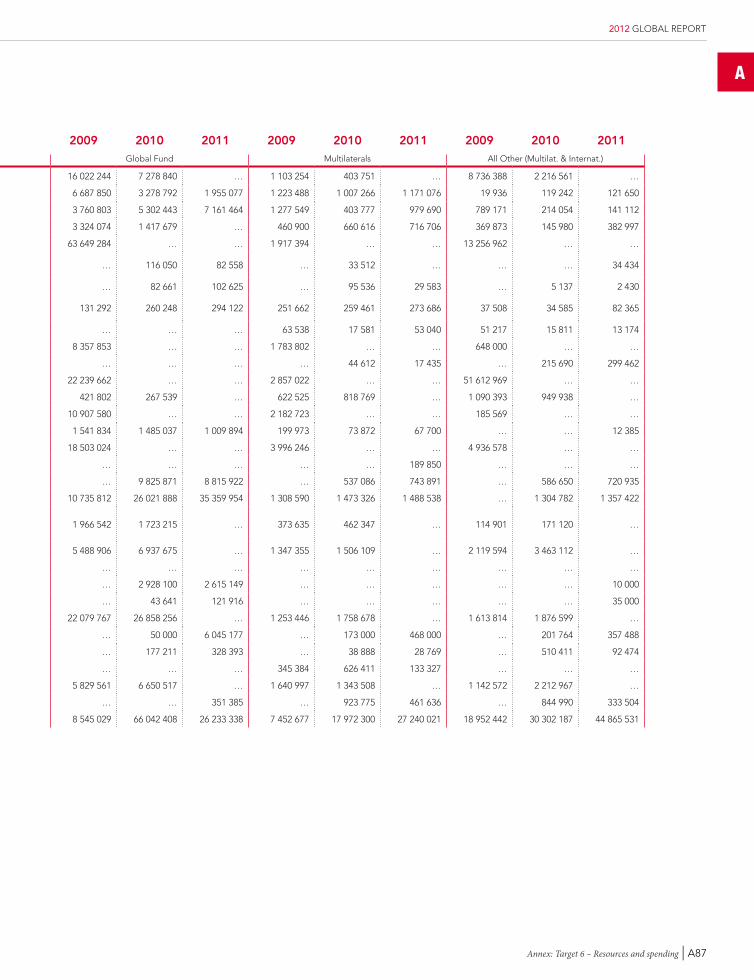
A
Annex: Target 6 – Resources and spending | A87
2012 GLOBAL REPORT
2009 2010 2011 2009 2010 2011 2009 2010 2011 2009 2010 2011 2009 2010 2011 2009 2010 2011Public Bilaterals Development Banks Global Fund Multilaterals All Other (Multilat. & Internat.)
Peru 24 899 402 15 445 506 … 3 688 911 2 575 018 … … … … 16 022 244 7 278 840 … 1 103 254 403 751 … 8 736 388 2 216 561 …
Philippines 1 870 624 3 372 467 4 126 663 759 365 597 420 624 340 72 670 … … 6 687 850 3 278 792 1 955 077 1 223 488 1 007 266 1 171 076 19 936 119 242 121 650
Republic of Moldova 5 544 671 4 617 721 5 125 529 106 203 182 941 236 752 … … … 3 760 803 5 302 443 7 161 464 1 277 549 403 777 979 690 789 171 214 054 141 112
Romania 80 101 093 91 512 275 102 458 472 … … … … 1 771 480 4 577 421 3 324 074 1 417 679 … 460 900 660 616 716 706 369 873 145 980 382 997
Rwanda 16 635 507 … … 77 854 492 … … … … … 63 649 284 … … 1 917 394 … … 13 256 962 … …
Saint Vincent and the Grenadines … 2 508 745 1 267 636 … 1 332 973 733 063 … … 718 655 … 116 050 82 558 … 33 512 … … … 34 434
Samoa … 161 694 172 845 … … … … … … … 82 661 102 625 … 95 536 29 583 … 5 137 2 430
São Tomé and Príncipe 13 406 7 803 112 650 … … … 26 701 43 656 118 046 131 292 260 248 294 122 251 662 259 461 273 686 37 508 34 585 82 365
Seychelles 1 518 746 2 297 113 2 003 196 30 600 … … 84 549 24 104 … … … … 63 538 17 581 53 040 51 217 15 811 13 174
Sierra Leone 400 362 … … 3 088 779 … … … … … 8 357 853 … … 1 783 802 … … 648 000 … …
Solomon Islands … 150 032 151 749 … 393 993 439 782 … … … … … … … 44 612 17 435 … 215 690 299 462
South Africa 1 930 462 155 … … 188 420 971 … … … … … 22 239 662 … … 2 857 022 … … 51 612 969 … …
Sri Lanka 2 085 088 2 277 906 … … … … … … … 421 802 267 539 … 622 525 818 769 … 1 090 393 949 938 …
Sudan, North 2 073 696 … … 9 056 … … … … … 10 907 580 … … 2 182 723 … … 185 569 … …
Suriname 2 213 565 1 939 620 2 249 605 … 2 547 077 1 253 125 … … … 1 541 834 1 485 037 1 009 894 199 973 73 872 67 700 … … 12 385
Swaziland 29 912 310 … … 15 401 864 … … … … … 18 503 024 … … 3 996 246 … … 4 936 578 … …
Syrian Arab Republic … … 620 000 … … … … … … … … … … … 189 850 … … …
Tajikistan … 1 718 968 2 269 834 … 2 564 546 2 751 455 … … … … 9 825 871 8 815 922 … 537 086 743 891 … 586 650 720 935
Thailand 195 119 743 200 251 009 267 932 276 1 942 389 7 071 757 8 103 688 … 54 915 120 790 10 735 812 26 021 888 35 359 954 1 308 590 1 473 326 1 488 538 … 1 304 782 1 357 422
The former Yugoslav Republic of Macedonia
2 298 179 2 366 290 … … … … … … … 1 966 542 1 723 215 … 373 635 462 347 … 114 901 171 120 …
Togo 3 245 307 8 878 290 … 2 465 846 1 605 831 … … … … 5 488 906 6 937 675 … 1 347 355 1 506 109 … 2 119 594 3 463 112 …
Tonga … … … … … … … … … … … … … … … … … …
Tunisia … 110 040 117 400 … … … … … … … 2 928 100 2 615 149 … … … … … 10 000
Tuvalu … 12 000 20 180 … … … … 4 000 … … 43 641 121 916 … … … … … 35 000
Ukraine 38 052 604 38 054 198 … 1 611 592 3 384 197 … … … … 22 079 767 26 858 256 … 1 253 446 1 758 678 … 1 613 814 1 876 599 …
Uzbekistan … 17 586 625 19 235 245 … 78 893 165 236 … 1 173 717 … … 50 000 6 045 177 … 173 000 468 000 … 201 764 357 488
Vanuatu … 36 510 36 482 … 898 503 1 397 372 … … … … 177 211 328 393 … 38 888 28 769 … 510 411 92 474
Venezuela 83 078 900 109 037 329 80 352 294 … … … … … … … … … 345 384 626 411 133 327 … … …
Viet Nam 17 176 061 21 431 087 … 70 785 001 84 013 483 … 14 763 773 8 001 304 … 5 829 561 6 650 517 … 1 640 997 1 343 508 … 1 142 572 2 212 967 …
Yemen … 442 233 467 395 … … … … … … … … 351 385 … 923 775 461 636 … 844 990 333 504
Zimbabwe 8 883 551 20 833 554 28 061 185 26 342 985 49 772 291 77 692 280 259 044 30 000 … 8 545 029 66 042 408 26 233 338 7 452 677 17 972 300 27 240 021 18 952 442 30 302 187 44 865 531
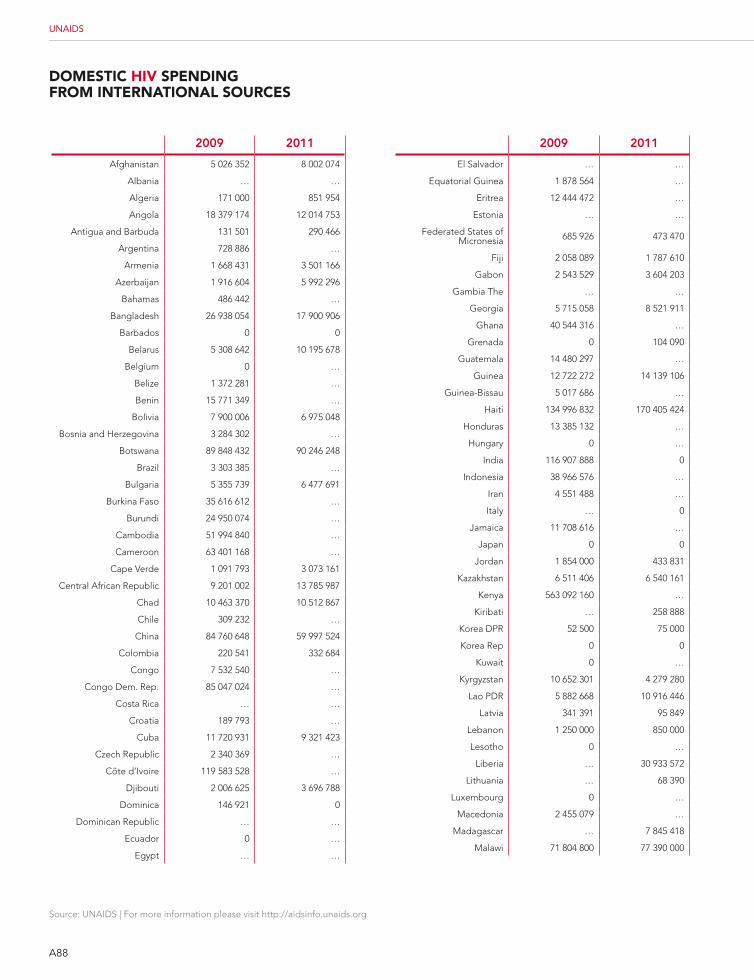
A88
Source: UNAIDS | For more information please visit http://aidsinfo.unaids.org
UNAIDS
domEstic HiV sPEnding from intErnational sourcEs
2009 2011
El Salvador … …
Equatorial Guinea 1 878 564 …
Eritrea 12 444 472 …
Estonia … …
Federated States of Micronesia 685 926 473 470
Fiji 2 058 089 1 787 610
Gabon 2 543 529 3 604 203
Gambia The … …
Georgia 5 715 058 8 521 911
Ghana 40 544 316 …
Grenada 0 104 090
Guatemala 14 480 297 …
Guinea 12 722 272 14 139 106
Guinea-Bissau 5 017 686 …
Haiti 134 996 832 170 405 424
Honduras 13 385 132 …
Hungary 0 …
India 116 907 888 0
Indonesia 38 966 576 …
Iran 4 551 488 …
Italy … 0
Jamaica 11 708 616 …
Japan 0 0
Jordan 1 854 000 433 831
Kazakhstan 6 511 406 6 540 161
Kenya 563 092 160 …
Kiribati … 258 888
Korea DPR 52 500 75 000
Korea Rep 0 0
Kuwait 0 …
Kyrgyzstan 10 652 301 4 279 280
Lao PDR 5 882 668 10 916 446
Latvia 341 391 95 849
Lebanon 1 250 000 850 000
Lesotho 0 …
Liberia … 30 933 572
Lithuania … 68 390
Luxembourg 0 …
Macedonia 2 455 079 …
Madagascar … 7 845 418
Malawi 71 804 800 77 390 000
2009 2011
Afghanistan 5 026 352 8 002 074
Albania … …
Algeria 171 000 851 954
Angola 18 379 174 12 014 753
Antigua and Barbuda 131 501 290 466
Argentina 728 886 …
Armenia 1 668 431 3 501 166
Azerbaijan 1 916 604 5 992 296
Bahamas 486 442 …
Bangladesh 26 938 054 17 900 906
Barbados 0 0
Belarus 5 308 642 10 195 678
Belgium 0 …
Belize 1 372 281 …
Benin 15 771 349 …
Bolivia 7 900 006 6 975 048
Bosnia and Herzegovina 3 284 302 …
Botswana 89 848 432 90 246 248
Brazil 3 303 385 …
Bulgaria 5 355 739 6 477 691
Burkina Faso 35 616 612 …
Burundi 24 950 074 …
Cambodia 51 994 840 …
Cameroon 63 401 168 …
Cape Verde 1 091 793 3 073 161
Central African Republic 9 201 002 13 785 987
Chad 10 463 370 10 512 867
Chile 309 232 …
China 84 760 648 59 997 524
Colombia 220 541 332 684
Congo 7 532 540 …
Congo Dem. Rep. 85 047 024 …
Costa Rica … …
Croatia 189 793 …
Cuba 11 720 931 9 321 423
Czech Republic 2 340 369 …
Côte d’Ivoire 119 583 528 …
Djibouti 2 006 625 3 696 788
Dominica 146 921 0
Dominican Republic … …
Ecuador 0 …
Egypt … …
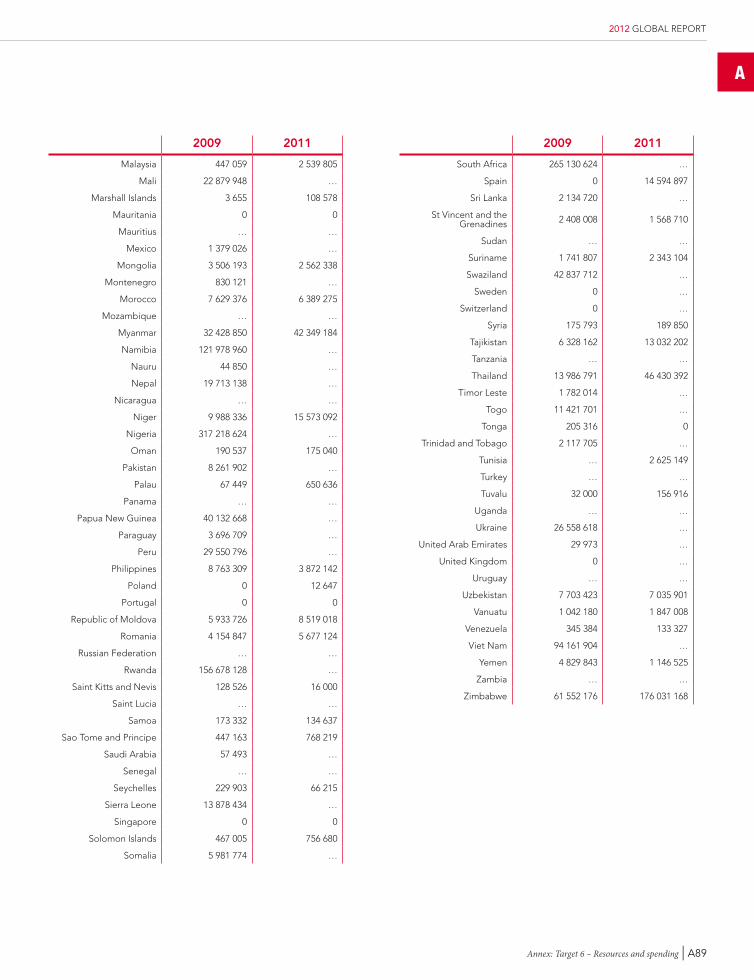
A
Annex: Target 6 – Resources and spending | A89
2012 GLOBAL REPORT
2009 2011
Malaysia 447 059 2 539 805
Mali 22 879 948 …
Marshall Islands 3 655 108 578
Mauritania 0 0
Mauritius … …
Mexico 1 379 026 …
Mongolia 3 506 193 2 562 338
Montenegro 830 121 …
Morocco 7 629 376 6 389 275
Mozambique … …
Myanmar 32 428 850 42 349 184
Namibia 121 978 960 …
Nauru 44 850 …
Nepal 19 713 138 …
Nicaragua … …
Niger 9 988 336 15 573 092
Nigeria 317 218 624 …
Oman 190 537 175 040
Pakistan 8 261 902 …
Palau 67 449 650 636
Panama … …
Papua New Guinea 40 132 668 …
Paraguay 3 696 709 …
Peru 29 550 796 …
Philippines 8 763 309 3 872 142
Poland 0 12 647
Portugal 0 0
Republic of Moldova 5 933 726 8 519 018
Romania 4 154 847 5 677 124
Russian Federation … …
Rwanda 156 678 128 …
Saint Kitts and Nevis 128 526 16 000
Saint Lucia … …
Samoa 173 332 134 637
Sao Tome and Principe 447 163 768 219
Saudi Arabia 57 493 …
Senegal … …
Seychelles 229 903 66 215
Sierra Leone 13 878 434 …
Singapore 0 0
Solomon Islands 467 005 756 680
Somalia 5 981 774 …
2009 2011
South Africa 265 130 624 …
Spain 0 14 594 897
Sri Lanka 2 134 720 …
St Vincent and the Grenadines 2 408 008 1 568 710
Sudan … …
Suriname 1 741 807 2 343 104
Swaziland 42 837 712 …
Sweden 0 …
Switzerland 0 …
Syria 175 793 189 850
Tajikistan 6 328 162 13 032 202
Tanzania … …
Thailand 13 986 791 46 430 392
Timor Leste 1 782 014 …
Togo 11 421 701 …
Tonga 205 316 0
Trinidad and Tobago 2 117 705 …
Tunisia … 2 625 149
Turkey … …
Tuvalu 32 000 156 916
Uganda … …
Ukraine 26 558 618 …
United Arab Emirates 29 973 …
United Kingdom 0 …
Uruguay … …
Uzbekistan 7 703 423 7 035 901
Vanuatu 1 042 180 1 847 008
Venezuela 345 384 133 327
Viet Nam 94 161 904 …
Yemen 4 829 843 1 146 525
Zambia … …
Zimbabwe 61 552 176 176 031 168
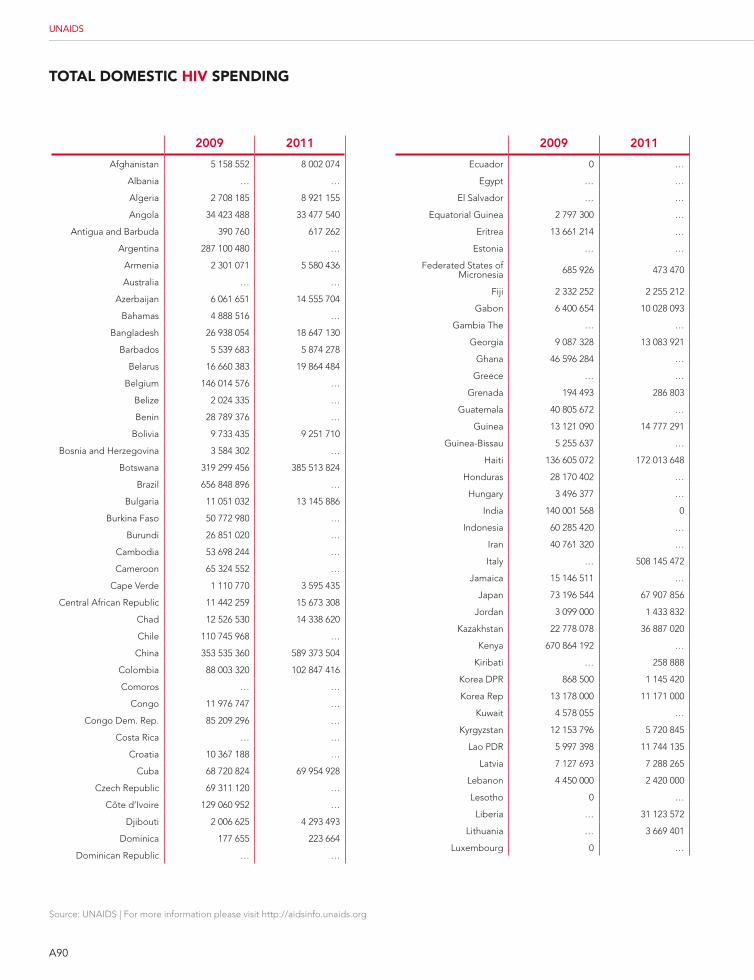
A90
Source: UNAIDS | For more information please visit http://aidsinfo.unaids.org
UNAIDS
total domEstic HiV sPEnding
2009 2011
Ecuador 0 …
Egypt … …
El Salvador … …
Equatorial Guinea 2 797 300 …
Eritrea 13 661 214 …
Estonia … …
Federated States of Micronesia 685 926 473 470
Fiji 2 332 252 2 255 212
Gabon 6 400 654 10 028 093
Gambia The … …
Georgia 9 087 328 13 083 921
Ghana 46 596 284 …
Greece … …
Grenada 194 493 286 803
Guatemala 40 805 672 …
Guinea 13 121 090 14 777 291
Guinea-Bissau 5 255 637 …
Haiti 136 605 072 172 013 648
Honduras 28 170 402 …
Hungary 3 496 377 …
India 140 001 568 0
Indonesia 60 285 420 …
Iran 40 761 320 …
Italy … 508 145 472
Jamaica 15 146 511 …
Japan 73 196 544 67 907 856
Jordan 3 099 000 1 433 832
Kazakhstan 22 778 078 36 887 020
Kenya 670 864 192 …
Kiribati … 258 888
Korea DPR 868 500 1 145 420
Korea Rep 13 178 000 11 171 000
Kuwait 4 578 055 …
Kyrgyzstan 12 153 796 5 720 845
Lao PDR 5 997 398 11 744 135
Latvia 7 127 693 7 288 265
Lebanon 4 450 000 2 420 000
Lesotho 0 …
Liberia … 31 123 572
Lithuania … 3 669 401
Luxembourg 0 …
2009 2011
Afghanistan 5 158 552 8 002 074
Albania … …
Algeria 2 708 185 8 921 155
Angola 34 423 488 33 477 540
Antigua and Barbuda 390 760 617 262
Argentina 287 100 480 …
Armenia 2 301 071 5 580 436
Australia … …
Azerbaijan 6 061 651 14 555 704
Bahamas 4 888 516 …
Bangladesh 26 938 054 18 647 130
Barbados 5 539 683 5 874 278
Belarus 16 660 383 19 864 484
Belgium 146 014 576 …
Belize 2 024 335 …
Benin 28 789 376 …
Bolivia 9 733 435 9 251 710
Bosnia and Herzegovina 3 584 302 …
Botswana 319 299 456 385 513 824
Brazil 656 848 896 …
Bulgaria 11 051 032 13 145 886
Burkina Faso 50 772 980 …
Burundi 26 851 020 …
Cambodia 53 698 244 …
Cameroon 65 324 552 …
Cape Verde 1 110 770 3 595 435
Central African Republic 11 442 259 15 673 308
Chad 12 526 530 14 338 620
Chile 110 745 968 …
China 353 535 360 589 373 504
Colombia 88 003 320 102 847 416
Comoros … …
Congo 11 976 747 …
Congo Dem. Rep. 85 209 296 …
Costa Rica … …
Croatia 10 367 188 …
Cuba 68 720 824 69 954 928
Czech Republic 69 311 120 …
Côte d’Ivoire 129 060 952 …
Djibouti 2 006 625 4 293 493
Dominica 177 655 223 664
Dominican Republic … …
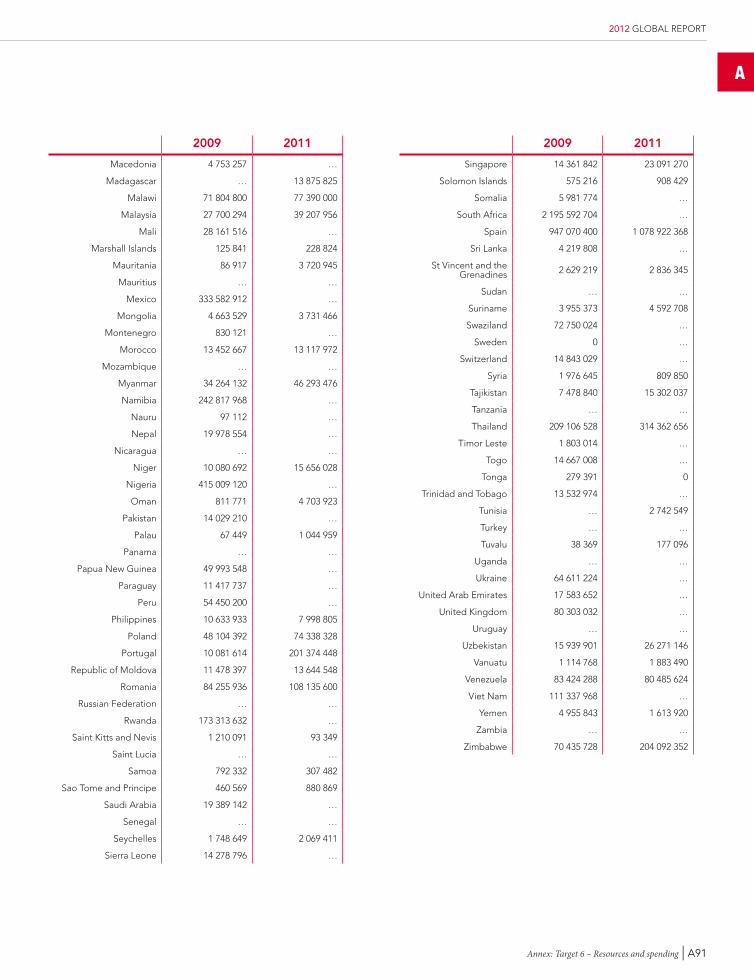
A
Annex: Target 6 – Resources and spending | A91
2012 GLOBAL REPORT
2009 2011
Macedonia 4 753 257 …
Madagascar … 13 875 825
Malawi 71 804 800 77 390 000
Malaysia 27 700 294 39 207 956
Mali 28 161 516 …
Marshall Islands 125 841 228 824
Mauritania 86 917 3 720 945
Mauritius … …
Mexico 333 582 912 …
Mongolia 4 663 529 3 731 466
Montenegro 830 121 …
Morocco 13 452 667 13 117 972
Mozambique … …
Myanmar 34 264 132 46 293 476
Namibia 242 817 968 …
Nauru 97 112 …
Nepal 19 978 554 …
Nicaragua … …
Niger 10 080 692 15 656 028
Nigeria 415 009 120 …
Oman 811 771 4 703 923
Pakistan 14 029 210 …
Palau 67 449 1 044 959
Panama … …
Papua New Guinea 49 993 548 …
Paraguay 11 417 737 …
Peru 54 450 200 …
Philippines 10 633 933 7 998 805
Poland 48 104 392 74 338 328
Portugal 10 081 614 201 374 448
Republic of Moldova 11 478 397 13 644 548
Romania 84 255 936 108 135 600
Russian Federation … …
Rwanda 173 313 632 …
Saint Kitts and Nevis 1 210 091 93 349
Saint Lucia … …
Samoa 792 332 307 482
Sao Tome and Principe 460 569 880 869
Saudi Arabia 19 389 142 …
Senegal … …
Seychelles 1 748 649 2 069 411
Sierra Leone 14 278 796 …
2009 2011
Singapore 14 361 842 23 091 270
Solomon Islands 575 216 908 429
Somalia 5 981 774 …
South Africa 2 195 592 704 …
Spain 947 070 400 1 078 922 368
Sri Lanka 4 219 808 …
St Vincent and the Grenadines 2 629 219 2 836 345
Sudan … …
Suriname 3 955 373 4 592 708
Swaziland 72 750 024 …
Sweden 0 …
Switzerland 14 843 029 …
Syria 1 976 645 809 850
Tajikistan 7 478 840 15 302 037
Tanzania … …
Thailand 209 106 528 314 362 656
Timor Leste 1 803 014 …
Togo 14 667 008 …
Tonga 279 391 0
Trinidad and Tobago 13 532 974 …
Tunisia … 2 742 549
Turkey … …
Tuvalu 38 369 177 096
Uganda … …
Ukraine 64 611 224 …
United Arab Emirates 17 583 652 …
United Kingdom 80 303 032 …
Uruguay … …
Uzbekistan 15 939 901 26 271 146
Vanuatu 1 114 768 1 883 490
Venezuela 83 424 288 80 485 624
Viet Nam 111 337 968 …
Yemen 4 955 843 1 613 920
Zambia … …
Zimbabwe 70 435 728 204 092 352
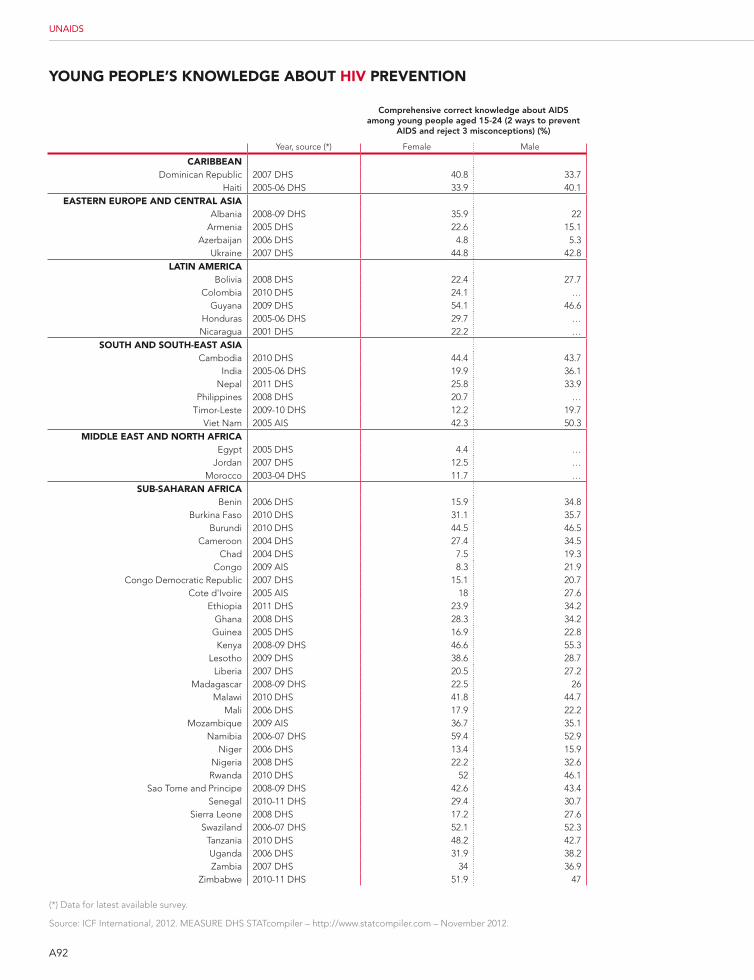
Comprehensive correct knowledge about aiDs among young people aged 15-24 (2 ways to prevent
aiDs and reject 3 misconceptions) (%)
Year, source (*) Female Male
caribbEanDominican Republic 2007 DHS 40.8 33.7
Haiti 2005-06 DHS 33.9 40.1EastErn EuroPE and cEntral asia
Albania 2008-09 DHS 35.9 22Armenia 2005 DHS 22.6 15.1
Azerbaijan 2006 DHS 4.8 5.3Ukraine 2007 DHS 44.8 42.8
latin amEricaBolivia 2008 DHS 22.4 27.7
Colombia 2010 DHS 24.1 …Guyana 2009 DHS 54.1 46.6
Honduras 2005-06 DHS 29.7 …Nicaragua 2001 DHS 22.2 …
soutH and soutH-East asiaCambodia 2010 DHS 44.4 43.7
India 2005-06 DHS 19.9 36.1Nepal 2011 DHS 25.8 33.9
Philippines 2008 DHS 20.7 …Timor-Leste 2009-10 DHS 12.2 19.7
Viet Nam 2005 AIS 42.3 50.3middlE East and nortH africa
Egypt 2005 DHS 4.4 …Jordan 2007 DHS 12.5 …
Morocco 2003-04 DHS 11.7 …sub-saHaran africa
Benin 2006 DHS 15.9 34.8Burkina Faso 2010 DHS 31.1 35.7
Burundi 2010 DHS 44.5 46.5Cameroon 2004 DHS 27.4 34.5
Chad 2004 DHS 7.5 19.3Congo 2009 AIS 8.3 21.9
Congo Democratic Republic 2007 DHS 15.1 20.7Cote d'Ivoire 2005 AIS 18 27.6
Ethiopia 2011 DHS 23.9 34.2Ghana 2008 DHS 28.3 34.2
Guinea 2005 DHS 16.9 22.8Kenya 2008-09 DHS 46.6 55.3
Lesotho 2009 DHS 38.6 28.7Liberia 2007 DHS 20.5 27.2
Madagascar 2008-09 DHS 22.5 26Malawi 2010 DHS 41.8 44.7
Mali 2006 DHS 17.9 22.2Mozambique 2009 AIS 36.7 35.1
Namibia 2006-07 DHS 59.4 52.9Niger 2006 DHS 13.4 15.9
Nigeria 2008 DHS 22.2 32.6Rwanda 2010 DHS 52 46.1
Sao Tome and Principe 2008-09 DHS 42.6 43.4Senegal 2010-11 DHS 29.4 30.7
Sierra Leone 2008 DHS 17.2 27.6Swaziland 2006-07 DHS 52.1 52.3
Tanzania 2010 DHS 48.2 42.7Uganda 2006 DHS 31.9 38.2Zambia 2007 DHS 34 36.9
Zimbabwe 2010-11 DHS 51.9 47
A92
UNAIDS
Young PEoPlE’s knoWlEdgE about HiV PrEVEntion
(*) Data for latest available survey.
Source: ICF International, 2012. MEASURE DHS STATcompiler – http://www.statcompiler.com – November 2012.
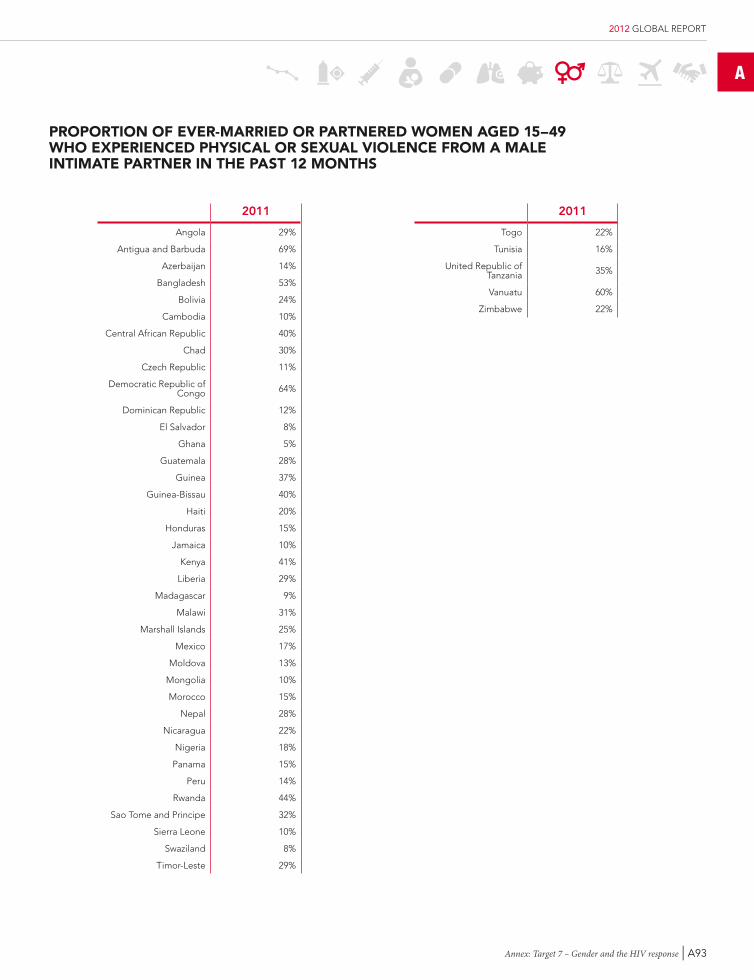
A
Annex: Target 7 – Gender and the HIV response | A93
2012 GLOBAL REPORT
ProPortion of EVEr-marriEd or PartnErEd WomEn agEd 15–49 WHo ExPEriEncEd PHYsical or sExual ViolEncE from a malE intimatE PartnEr in tHE Past 12 montHs
2011
Angola 29%
Antigua and Barbuda 69%
Azerbaijan 14%
Bangladesh 53%
Bolivia 24%
Cambodia 10%
Central African Republic 40%
Chad 30%
Czech Republic 11%
Democratic Republic of Congo 64%
Dominican Republic 12%
El Salvador 8%
Ghana 5%
Guatemala 28%
Guinea 37%
Guinea-Bissau 40%
Haiti 20%
Honduras 15%
Jamaica 10%
Kenya 41%
Liberia 29%
Madagascar 9%
Malawi 31%
Marshall Islands 25%
Mexico 17%
Moldova 13%
Mongolia 10%
Morocco 15%
Nepal 28%
Nicaragua 22%
Nigeria 18%
Panama 15%
Peru 14%
Rwanda 44%
Sao Tome and Principe 32%
Sierra Leone 10%
Swaziland 8%
Timor-Leste 29%
2011
Togo 22%
Tunisia 16%
United Republic of Tanzania 35%
Vanuatu 60%
Zimbabwe 22%
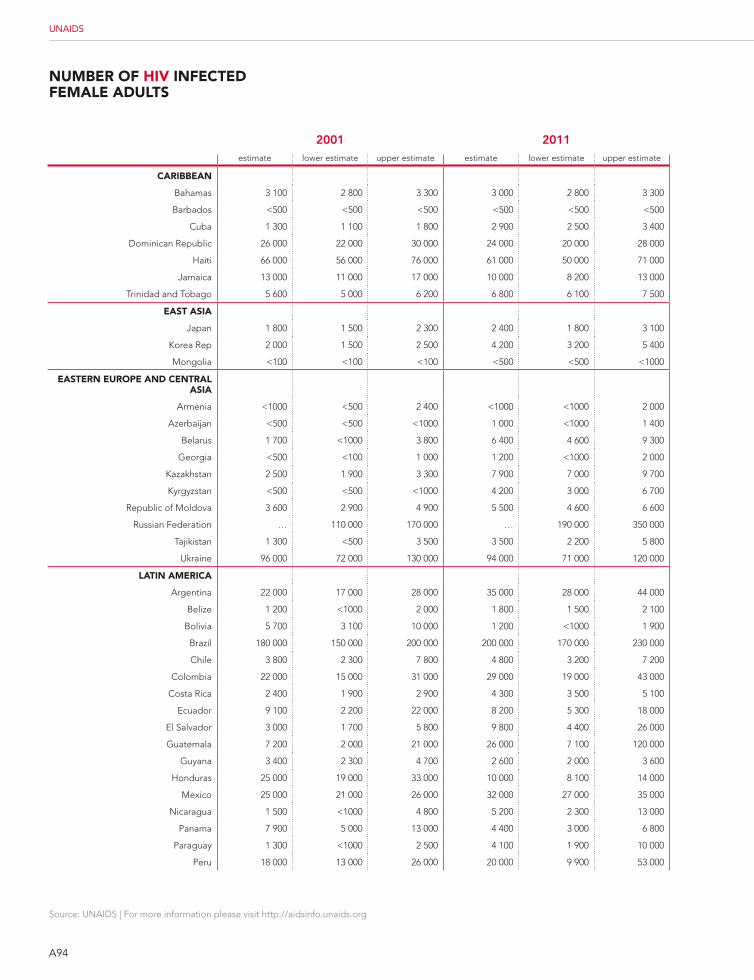
A94
Source: UNAIDS | For more information please visit http://aidsinfo.unaids.org
UNAIDS
numbEr of HiV infEctEd fEmalE adults
2001 2011estimate lower estimate upper estimate estimate lower estimate upper estimate
caribbEan
Bahamas 3 100 2 800 3 300 3 000 2 800 3 300
Barbados <500 <500 <500 <500 <500 <500
Cuba 1 300 1 100 1 800 2 900 2 500 3 400
Dominican Republic 26 000 22 000 30 000 24 000 20 000 28 000
Haiti 66 000 56 000 76 000 61 000 50 000 71 000
Jamaica 13 000 11 000 17 000 10 000 8 200 13 000
Trinidad and Tobago 5 600 5 000 6 200 6 800 6 100 7 500
East asia
Japan 1 800 1 500 2 300 2 400 1 800 3 100
Korea Rep 2 000 1 500 2 500 4 200 3 200 5 400
Mongolia <100 <100 <100 <500 <500 <1000
EastErn EuroPE and cEntral asia
Armenia <1000 <500 2 400 <1000 <1000 2 000
Azerbaijan <500 <500 <1000 1 000 <1000 1 400
Belarus 1 700 <1000 3 800 6 400 4 600 9 300
Georgia <500 <100 1 000 1 200 <1000 2 000
Kazakhstan 2 500 1 900 3 300 7 900 7 000 9 700
Kyrgyzstan <500 <500 <1000 4 200 3 000 6 700
Republic of Moldova 3 600 2 900 4 900 5 500 4 600 6 600
Russian Federation … 110 000 170 000 … 190 000 350 000
Tajikistan 1 300 <500 3 500 3 500 2 200 5 800
Ukraine 96 000 72 000 130 000 94 000 71 000 120 000
latin amErica
Argentina 22 000 17 000 28 000 35 000 28 000 44 000
Belize 1 200 <1000 2 000 1 800 1 500 2 100
Bolivia 5 700 3 100 10 000 1 200 <1000 1 900
Brazil 180 000 150 000 200 000 200 000 170 000 230 000
Chile 3 800 2 300 7 800 4 800 3 200 7 200
Colombia 22 000 15 000 31 000 29 000 19 000 43 000
Costa Rica 2 400 1 900 2 900 4 300 3 500 5 100
Ecuador 9 100 2 200 22 000 8 200 5 300 18 000
El Salvador 3 000 1 700 5 800 9 800 4 400 26 000
Guatemala 7 200 2 000 21 000 26 000 7 100 120 000
Guyana 3 400 2 300 4 700 2 600 2 000 3 600
Honduras 25 000 19 000 33 000 10 000 8 100 14 000
Mexico 25 000 21 000 26 000 32 000 27 000 35 000
Nicaragua 1 500 <1000 4 800 5 200 2 300 13 000
Panama 7 900 5 000 13 000 4 400 3 000 6 800
Paraguay 1 300 <1000 2 500 4 100 1 900 10 000
Peru 18 000 13 000 26 000 20 000 9 900 53 000
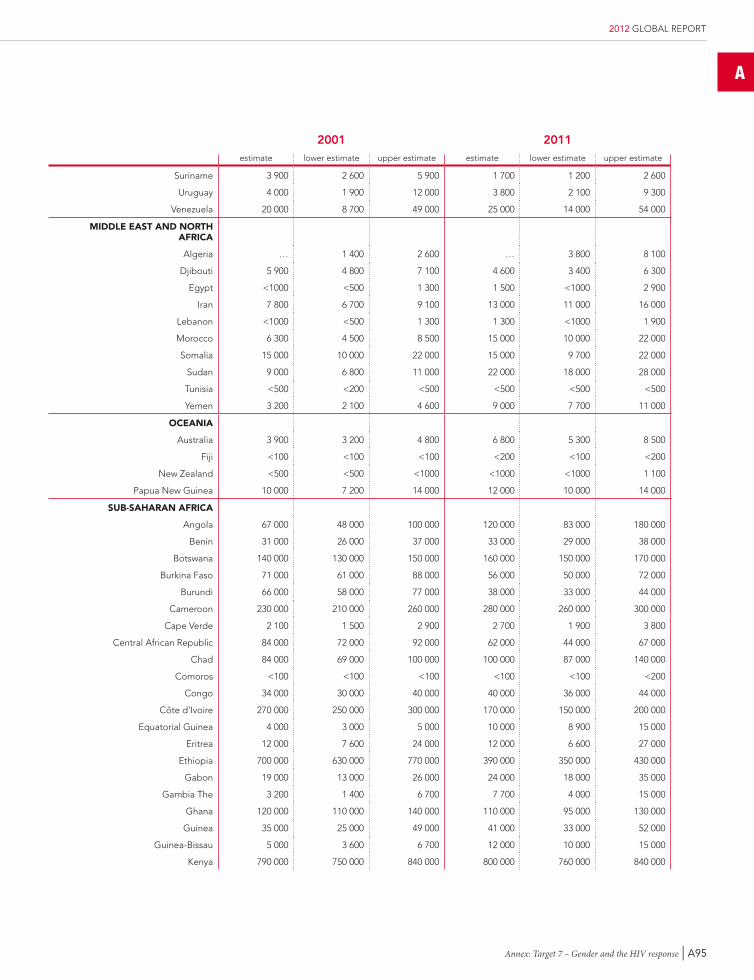
A
Annex: Target 7 – Gender and the HIV response | A95
2012 GLOBAL REPORT
2001 2011estimate lower estimate upper estimate estimate lower estimate upper estimate
Suriname 3 900 2 600 5 900 1 700 1 200 2 600
Uruguay 4 000 1 900 12 000 3 800 2 100 9 300
Venezuela 20 000 8 700 49 000 25 000 14 000 54 000
middlE East and nortH africa
Algeria … 1 400 2 600 … 3 800 8 100
Djibouti 5 900 4 800 7 100 4 600 3 400 6 300
Egypt <1000 <500 1 300 1 500 <1000 2 900
Iran 7 800 6 700 9 100 13 000 11 000 16 000
Lebanon <1000 <500 1 300 1 300 <1000 1 900
Morocco 6 300 4 500 8 500 15 000 10 000 22 000
Somalia 15 000 10 000 22 000 15 000 9 700 22 000
Sudan 9 000 6 800 11 000 22 000 18 000 28 000
Tunisia <500 <200 <500 <500 <500 <500
Yemen 3 200 2 100 4 600 9 000 7 700 11 000
ocEania
Australia 3 900 3 200 4 800 6 800 5 300 8 500
Fiji <100 <100 <100 <200 <100 <200
New Zealand <500 <500 <1000 <1000 <1000 1 100
Papua New Guinea 10 000 7 200 14 000 12 000 10 000 14 000
sub-saHaran africa
Angola 67 000 48 000 100 000 120 000 83 000 180 000
Benin 31 000 26 000 37 000 33 000 29 000 38 000
Botswana 140 000 130 000 150 000 160 000 150 000 170 000
Burkina Faso 71 000 61 000 88 000 56 000 50 000 72 000
Burundi 66 000 58 000 77 000 38 000 33 000 44 000
Cameroon 230 000 210 000 260 000 280 000 260 000 300 000
Cape Verde 2 100 1 500 2 900 2 700 1 900 3 800
Central African Republic 84 000 72 000 92 000 62 000 44 000 67 000
Chad 84 000 69 000 100 000 100 000 87 000 140 000
Comoros <100 <100 <100 <100 <100 <200
Congo 34 000 30 000 40 000 40 000 36 000 44 000
Côte d'Ivoire 270 000 250 000 300 000 170 000 150 000 200 000
Equatorial Guinea 4 000 3 000 5 000 10 000 8 900 15 000
Eritrea 12 000 7 600 24 000 12 000 6 600 27 000
Ethiopia 700 000 630 000 770 000 390 000 350 000 430 000
Gabon 19 000 13 000 26 000 24 000 18 000 35 000
Gambia The 3 200 1 400 6 700 7 700 4 000 15 000
Ghana 120 000 110 000 140 000 110 000 95 000 130 000
Guinea 35 000 25 000 49 000 41 000 33 000 52 000
Guinea-Bissau 5 000 3 600 6 700 12 000 10 000 15 000
Kenya 790 000 750 000 840 000 800 000 760 000 840 000
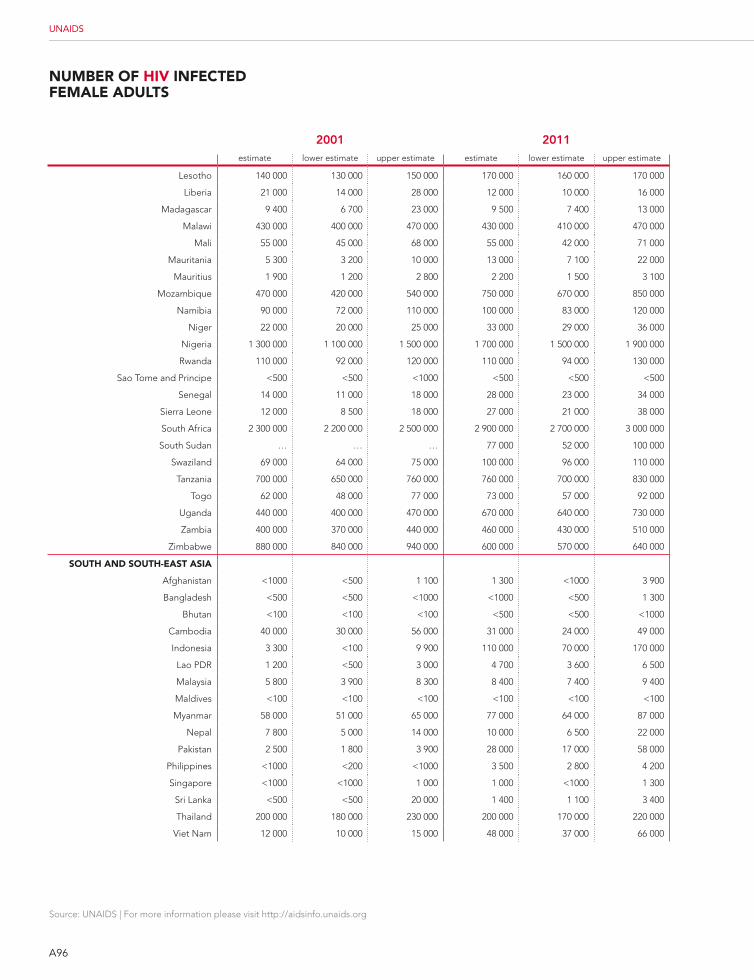
A96
Source: UNAIDS | For more information please visit http://aidsinfo.unaids.org
UNAIDS
numbEr of HiV infEctEd fEmalE adults
2001 2011estimate lower estimate upper estimate estimate lower estimate upper estimate
Lesotho 140 000 130 000 150 000 170 000 160 000 170 000
Liberia 21 000 14 000 28 000 12 000 10 000 16 000
Madagascar 9 400 6 700 23 000 9 500 7 400 13 000
Malawi 430 000 400 000 470 000 430 000 410 000 470 000
Mali 55 000 45 000 68 000 55 000 42 000 71 000
Mauritania 5 300 3 200 10 000 13 000 7 100 22 000
Mauritius 1 900 1 200 2 800 2 200 1 500 3 100
Mozambique 470 000 420 000 540 000 750 000 670 000 850 000
Namibia 90 000 72 000 110 000 100 000 83 000 120 000
Niger 22 000 20 000 25 000 33 000 29 000 36 000
Nigeria 1 300 000 1 100 000 1 500 000 1 700 000 1 500 000 1 900 000
Rwanda 110 000 92 000 120 000 110 000 94 000 130 000
Sao Tome and Principe <500 <500 <1000 <500 <500 <500
Senegal 14 000 11 000 18 000 28 000 23 000 34 000
Sierra Leone 12 000 8 500 18 000 27 000 21 000 38 000
South Africa 2 300 000 2 200 000 2 500 000 2 900 000 2 700 000 3 000 000
South Sudan … … … 77 000 52 000 100 000
Swaziland 69 000 64 000 75 000 100 000 96 000 110 000
Tanzania 700 000 650 000 760 000 760 000 700 000 830 000
Togo 62 000 48 000 77 000 73 000 57 000 92 000
Uganda 440 000 400 000 470 000 670 000 640 000 730 000
Zambia 400 000 370 000 440 000 460 000 430 000 510 000
Zimbabwe 880 000 840 000 940 000 600 000 570 000 640 000
soutH and soutH-East asia
Afghanistan <1000 <500 1 100 1 300 <1000 3 900
Bangladesh <500 <500 <1000 <1000 <500 1 300
Bhutan <100 <100 <100 <500 <500 <1000
Cambodia 40 000 30 000 56 000 31 000 24 000 49 000
Indonesia 3 300 <100 9 900 110 000 70 000 170 000
Lao PDR 1 200 <500 3 000 4 700 3 600 6 500
Malaysia 5 800 3 900 8 300 8 400 7 400 9 400
Maldives <100 <100 <100 <100 <100 <100
Myanmar 58 000 51 000 65 000 77 000 64 000 87 000
Nepal 7 800 5 000 14 000 10 000 6 500 22 000
Pakistan 2 500 1 800 3 900 28 000 17 000 58 000
Philippines <1000 <200 <1000 3 500 2 800 4 200
Singapore <1000 <1000 1 000 1 000 <1000 1 300
Sri Lanka <500 <500 20 000 1 400 1 100 3 400
Thailand 200 000 180 000 230 000 200 000 170 000 220 000
Viet Nam 12 000 10 000 15 000 48 000 37 000 66 000
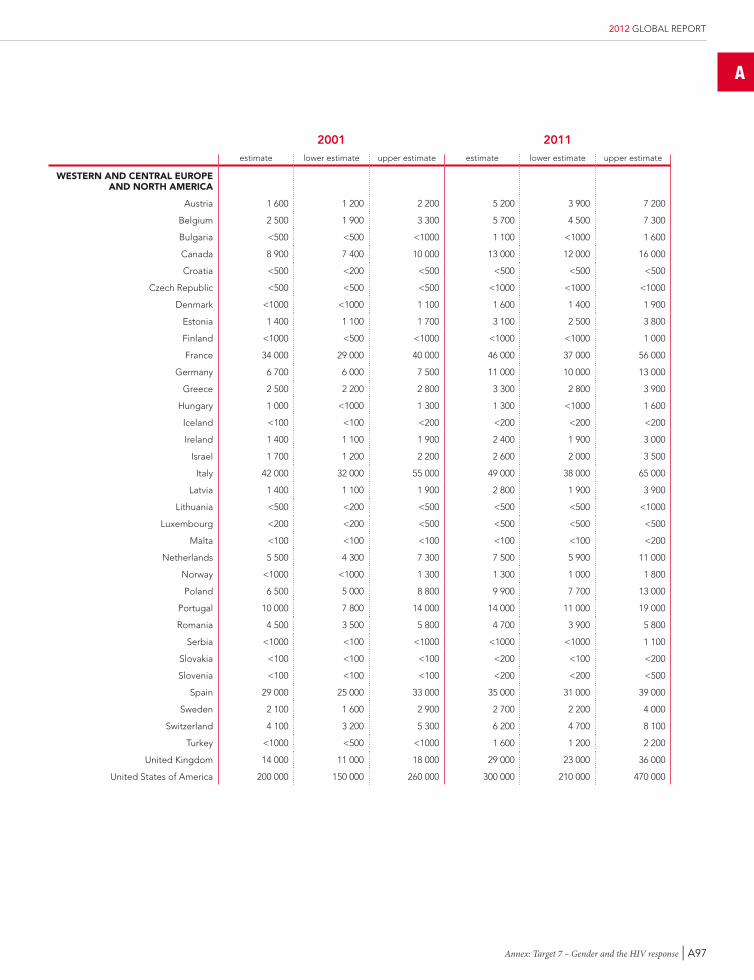
A
Annex: Target 7 – Gender and the HIV response | A97
2012 GLOBAL REPORT
2001 2011estimate lower estimate upper estimate estimate lower estimate upper estimate
WEstErn and cEntral EuroPE and nortH amErica
Austria 1 600 1 200 2 200 5 200 3 900 7 200
Belgium 2 500 1 900 3 300 5 700 4 500 7 300
Bulgaria <500 <500 <1000 1 100 <1000 1 600
Canada 8 900 7 400 10 000 13 000 12 000 16 000
Croatia <500 <200 <500 <500 <500 <500
Czech Republic <500 <500 <500 <1000 <1000 <1000
Denmark <1000 <1000 1 100 1 600 1 400 1 900
Estonia 1 400 1 100 1 700 3 100 2 500 3 800
Finland <1000 <500 <1000 <1000 <1000 1 000
France 34 000 29 000 40 000 46 000 37 000 56 000
Germany 6 700 6 000 7 500 11 000 10 000 13 000
Greece 2 500 2 200 2 800 3 300 2 800 3 900
Hungary 1 000 <1000 1 300 1 300 <1000 1 600
Iceland <100 <100 <200 <200 <200 <200
Ireland 1 400 1 100 1 900 2 400 1 900 3 000
Israel 1 700 1 200 2 200 2 600 2 000 3 500
Italy 42 000 32 000 55 000 49 000 38 000 65 000
Latvia 1 400 1 100 1 900 2 800 1 900 3 900
Lithuania <500 <200 <500 <500 <500 <1000
Luxembourg <200 <200 <500 <500 <500 <500
Malta <100 <100 <100 <100 <100 <200
Netherlands 5 500 4 300 7 300 7 500 5 900 11 000
Norway <1000 <1000 1 300 1 300 1 000 1 800
Poland 6 500 5 000 8 800 9 900 7 700 13 000
Portugal 10 000 7 800 14 000 14 000 11 000 19 000
Romania 4 500 3 500 5 800 4 700 3 900 5 800
Serbia <1000 <100 <1000 <1000 <1000 1 100
Slovakia <100 <100 <100 <200 <100 <200
Slovenia <100 <100 <100 <200 <200 <500
Spain 29 000 25 000 33 000 35 000 31 000 39 000
Sweden 2 100 1 600 2 900 2 700 2 200 4 000
Switzerland 4 100 3 200 5 300 6 200 4 700 8 100
Turkey <1000 <500 <1000 1 600 1 200 2 200
United Kingdom 14 000 11 000 18 000 29 000 23 000 36 000
United States of America 200 000 150 000 260 000 300 000 210 000 470 000
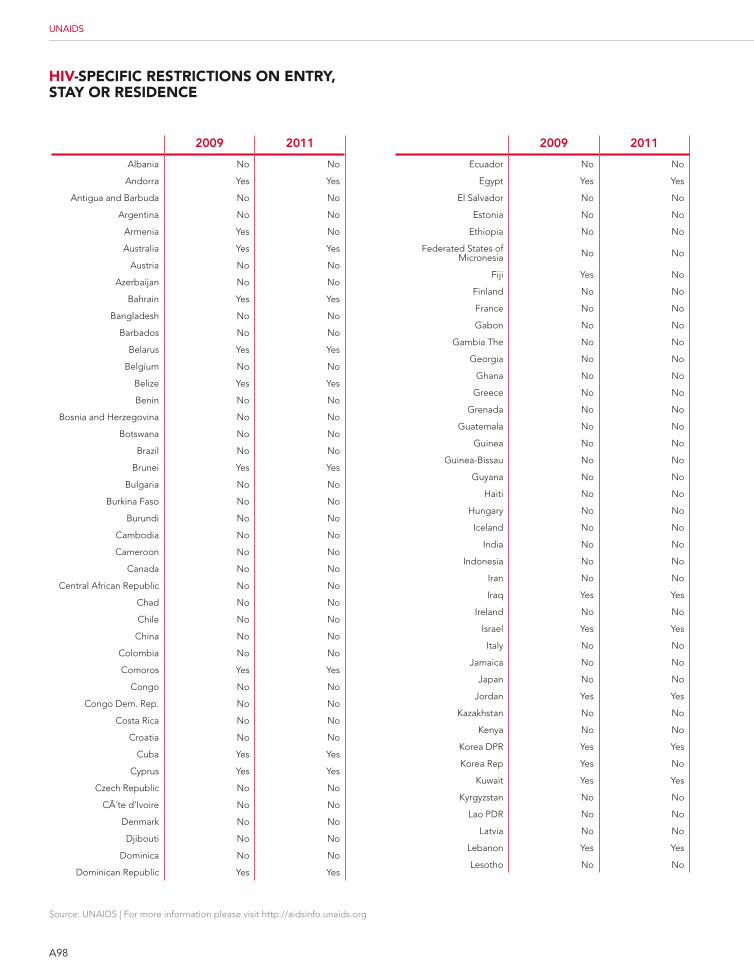
A98
Source: UNAIDS | For more information please visit http://aidsinfo.unaids.org
UNAIDS
HiV-sPEcific rEstrictions on EntrY, staY or rEsidEncE
2009 2011
Ecuador No No
Egypt Yes Yes
El Salvador No No
Estonia No No
Ethiopia No No
Federated States of Micronesia No No
Fiji Yes No
Finland No No
France No No
Gabon No No
Gambia The No No
Georgia No No
Ghana No No
Greece No No
Grenada No No
Guatemala No No
Guinea No No
Guinea-Bissau No No
Guyana No No
Haiti No No
Hungary No No
Iceland No No
India No No
Indonesia No No
Iran No No
Iraq Yes Yes
Ireland No No
Israel Yes Yes
Italy No No
Jamaica No No
Japan No No
Jordan Yes Yes
Kazakhstan No No
Kenya No No
Korea DPR Yes Yes
Korea Rep Yes No
Kuwait Yes Yes
Kyrgyzstan No No
Lao PDR No No
Latvia No No
Lebanon Yes Yes
Lesotho No No
2009 2011
Albania No No
Andorra Yes Yes
Antigua and Barbuda No No
Argentina No No
Armenia Yes No
Australia Yes Yes
Austria No No
Azerbaijan No No
Bahrain Yes Yes
Bangladesh No No
Barbados No No
Belarus Yes Yes
Belgium No No
Belize Yes Yes
Benin No No
Bosnia and Herzegovina No No
Botswana No No
Brazil No No
Brunei Yes Yes
Bulgaria No No
Burkina Faso No No
Burundi No No
Cambodia No No
Cameroon No No
Canada No No
Central African Republic No No
Chad No No
Chile No No
China No No
Colombia No No
Comoros Yes Yes
Congo No No
Congo Dem. Rep. No No
Costa Rica No No
Croatia No No
Cuba Yes Yes
Cyprus Yes Yes
Czech Republic No No
Côte d’Ivoire No No
Denmark No No
Djibouti No No
Dominica No No
Dominican Republic Yes Yes
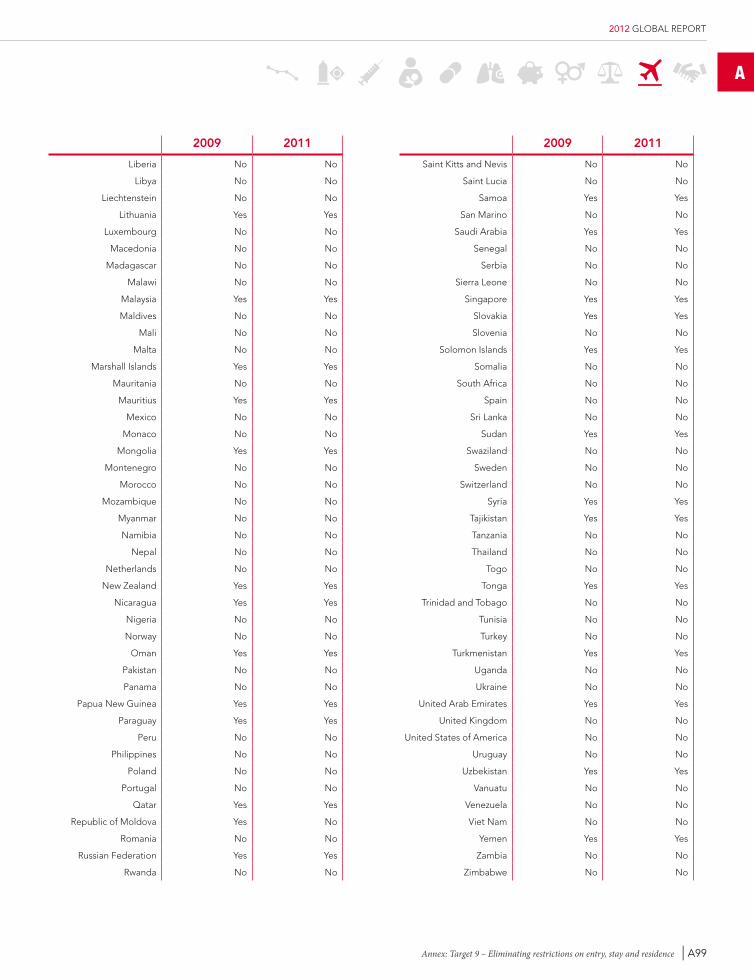
A
Annex: Target 9 – Eliminating restrictions on entry, stay and residence | A99
2012 GLOBAL REPORT
2009 2011
Liberia No No
Libya No No
Liechtenstein No No
Lithuania Yes Yes
Luxembourg No No
Macedonia No No
Madagascar No No
Malawi No No
Malaysia Yes Yes
Maldives No No
Mali No No
Malta No No
Marshall Islands Yes Yes
Mauritania No No
Mauritius Yes Yes
Mexico No No
Monaco No No
Mongolia Yes Yes
Montenegro No No
Morocco No No
Mozambique No No
Myanmar No No
Namibia No No
Nepal No No
Netherlands No No
New Zealand Yes Yes
Nicaragua Yes Yes
Nigeria No No
Norway No No
Oman Yes Yes
Pakistan No No
Panama No No
Papua New Guinea Yes Yes
Paraguay Yes Yes
Peru No No
Philippines No No
Poland No No
Portugal No No
Qatar Yes Yes
Republic of Moldova Yes No
Romania No No
Russian Federation Yes Yes
Rwanda No No
2009 2011
Saint Kitts and Nevis No No
Saint Lucia No No
Samoa Yes Yes
San Marino No No
Saudi Arabia Yes Yes
Senegal No No
Serbia No No
Sierra Leone No No
Singapore Yes Yes
Slovakia Yes Yes
Slovenia No No
Solomon Islands Yes Yes
Somalia No No
South Africa No No
Spain No No
Sri Lanka No No
Sudan Yes Yes
Swaziland No No
Sweden No No
Switzerland No No
Syria Yes Yes
Tajikistan Yes Yes
Tanzania No No
Thailand No No
Togo No No
Tonga Yes Yes
Trinidad and Tobago No No
Tunisia No No
Turkey No No
Turkmenistan Yes Yes
Uganda No No
Ukraine No No
United Arab Emirates Yes Yes
United Kingdom No No
United States of America No No
Uruguay No No
Uzbekistan Yes Yes
Vanuatu No No
Venezuela No No
Viet Nam No No
Yemen Yes Yes
Zambia No No
Zimbabwe No No
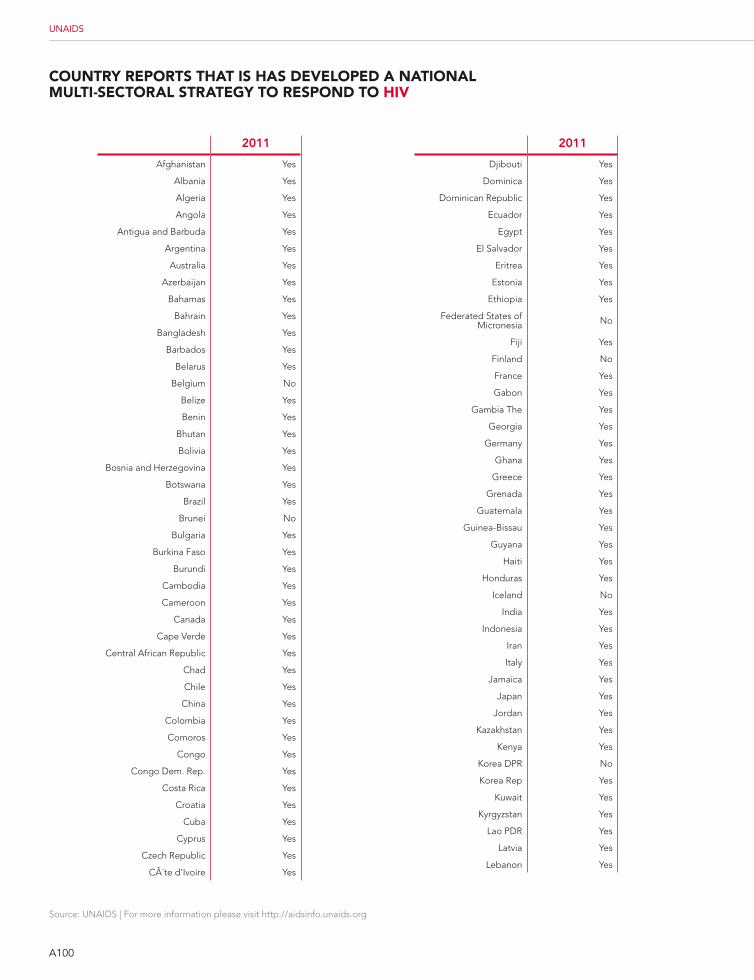
A100
Source: UNAIDS | For more information please visit http://aidsinfo.unaids.org
UNAIDS
countrY rEPorts tHat is Has dEVEloPEd a national multi-sEctoral stratEgY to rEsPond to HiV
2011
Djibouti Yes
Dominica Yes
Dominican Republic Yes
Ecuador Yes
Egypt Yes
El Salvador Yes
Eritrea Yes
Estonia Yes
Ethiopia Yes
Federated States of Micronesia No
Fiji Yes
Finland No
France Yes
Gabon Yes
Gambia The Yes
Georgia Yes
Germany Yes
Ghana Yes
Greece Yes
Grenada Yes
Guatemala Yes
Guinea-Bissau Yes
Guyana Yes
Haiti Yes
Honduras Yes
Iceland No
India Yes
Indonesia Yes
Iran Yes
Italy Yes
Jamaica Yes
Japan Yes
Jordan Yes
Kazakhstan Yes
Kenya Yes
Korea DPR No
Korea Rep Yes
Kuwait Yes
Kyrgyzstan Yes
Lao PDR Yes
Latvia Yes
Lebanon Yes
2011
Afghanistan Yes
Albania Yes
Algeria Yes
Angola Yes
Antigua and Barbuda Yes
Argentina Yes
Australia Yes
Azerbaijan Yes
Bahamas Yes
Bahrain Yes
Bangladesh Yes
Barbados Yes
Belarus Yes
Belgium No
Belize Yes
Benin Yes
Bhutan Yes
Bolivia Yes
Bosnia and Herzegovina Yes
Botswana Yes
Brazil Yes
Brunei No
Bulgaria Yes
Burkina Faso Yes
Burundi Yes
Cambodia Yes
Cameroon Yes
Canada Yes
Cape Verde Yes
Central African Republic Yes
Chad Yes
Chile Yes
China Yes
Colombia Yes
Comoros Yes
Congo Yes
Congo Dem. Rep. Yes
Costa Rica Yes
Croatia Yes
Cuba Yes
Cyprus Yes
Czech Republic Yes
Côte d’Ivoire Yes
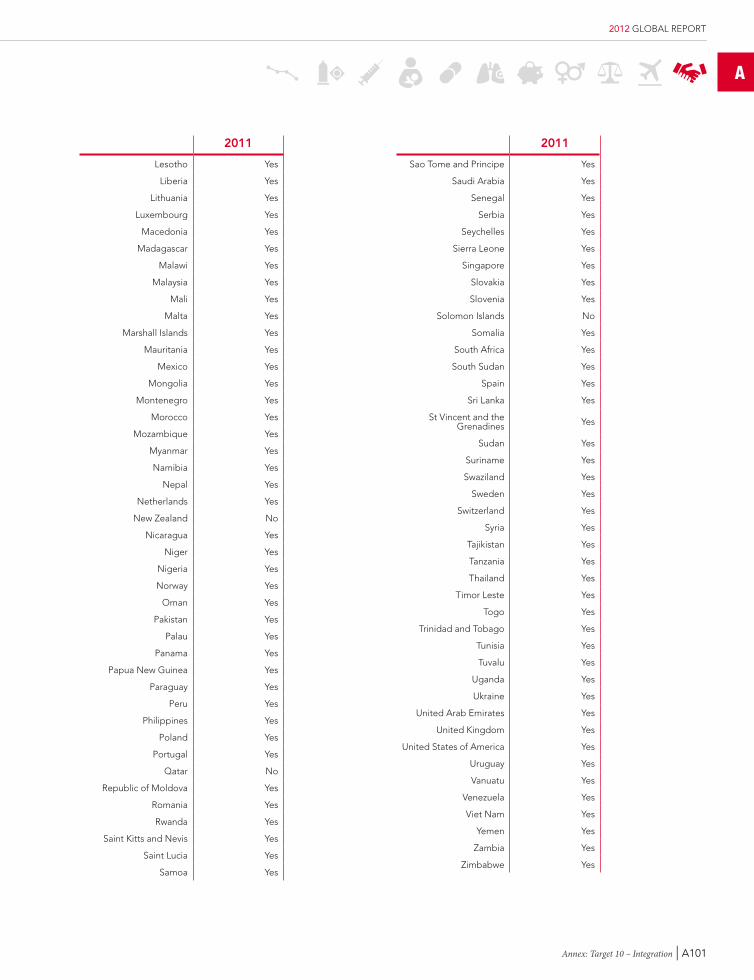
A
Annex: Target 10 – Integration | A101
2012 GLOBAL REPORT
2011
Lesotho Yes
Liberia Yes
Lithuania Yes
Luxembourg Yes
Macedonia Yes
Madagascar Yes
Malawi Yes
Malaysia Yes
Mali Yes
Malta Yes
Marshall Islands Yes
Mauritania Yes
Mexico Yes
Mongolia Yes
Montenegro Yes
Morocco Yes
Mozambique Yes
Myanmar Yes
Namibia Yes
Nepal Yes
Netherlands Yes
New Zealand No
Nicaragua Yes
Niger Yes
Nigeria Yes
Norway Yes
Oman Yes
Pakistan Yes
Palau Yes
Panama Yes
Papua New Guinea Yes
Paraguay Yes
Peru Yes
Philippines Yes
Poland Yes
Portugal Yes
Qatar No
Republic of Moldova Yes
Romania Yes
Rwanda Yes
Saint Kitts and Nevis Yes
Saint Lucia Yes
Samoa Yes
2011
Sao Tome and Principe Yes
Saudi Arabia Yes
Senegal Yes
Serbia Yes
Seychelles Yes
Sierra Leone Yes
Singapore Yes
Slovakia Yes
Slovenia Yes
Solomon Islands No
Somalia Yes
South Africa Yes
South Sudan Yes
Spain Yes
Sri Lanka Yes
St Vincent and the Grenadines Yes
Sudan Yes
Suriname Yes
Swaziland Yes
Sweden Yes
Switzerland Yes
Syria Yes
Tajikistan Yes
Tanzania Yes
Thailand Yes
Timor Leste Yes
Togo Yes
Trinidad and Tobago Yes
Tunisia Yes
Tuvalu Yes
Uganda Yes
Ukraine Yes
United Arab Emirates Yes
United Kingdom Yes
United States of America Yes
Uruguay Yes
Vanuatu Yes
Venezuela Yes
Viet Nam Yes
Yemen Yes
Zambia Yes
Zimbabwe Yes
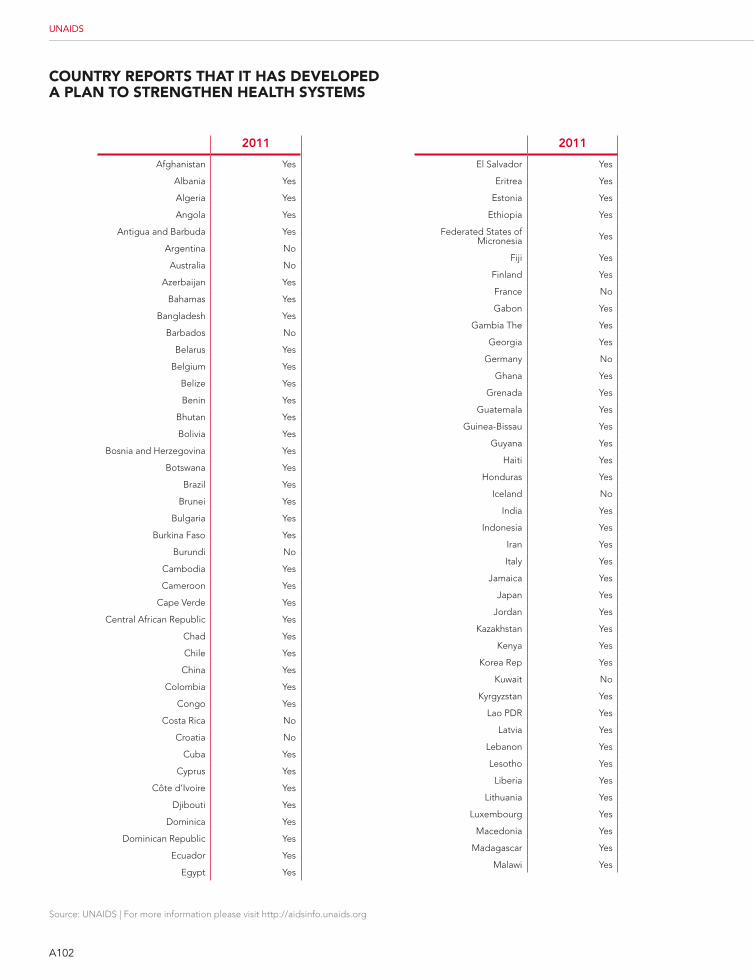
A102
Source: UNAIDS | For more information please visit http://aidsinfo.unaids.org
UNAIDS
countrY rEPorts tHat it Has dEVEloPEd a Plan to strEngtHEn HEaltH sYstEms
2011
El Salvador Yes
Eritrea Yes
Estonia Yes
Ethiopia Yes
Federated States of Micronesia Yes
Fiji Yes
Finland Yes
France No
Gabon Yes
Gambia The Yes
Georgia Yes
Germany No
Ghana Yes
Grenada Yes
Guatemala Yes
Guinea-Bissau Yes
Guyana Yes
Haiti Yes
Honduras Yes
Iceland No
India Yes
Indonesia Yes
Iran Yes
Italy Yes
Jamaica Yes
Japan Yes
Jordan Yes
Kazakhstan Yes
Kenya Yes
Korea Rep Yes
Kuwait No
Kyrgyzstan Yes
Lao PDR Yes
Latvia Yes
Lebanon Yes
Lesotho Yes
Liberia Yes
Lithuania Yes
Luxembourg Yes
Macedonia Yes
Madagascar Yes
Malawi Yes
2011
Afghanistan Yes
Albania Yes
Algeria Yes
Angola Yes
Antigua and Barbuda Yes
Argentina No
Australia No
Azerbaijan Yes
Bahamas Yes
Bangladesh Yes
Barbados No
Belarus Yes
Belgium Yes
Belize Yes
Benin Yes
Bhutan Yes
Bolivia Yes
Bosnia and Herzegovina Yes
Botswana Yes
Brazil Yes
Brunei Yes
Bulgaria Yes
Burkina Faso Yes
Burundi No
Cambodia Yes
Cameroon Yes
Cape Verde Yes
Central African Republic Yes
Chad Yes
Chile Yes
China Yes
Colombia Yes
Congo Yes
Costa Rica No
Croatia No
Cuba Yes
Cyprus Yes
Côte d’Ivoire Yes
Djibouti Yes
Dominica Yes
Dominican Republic Yes
Ecuador Yes
Egypt Yes
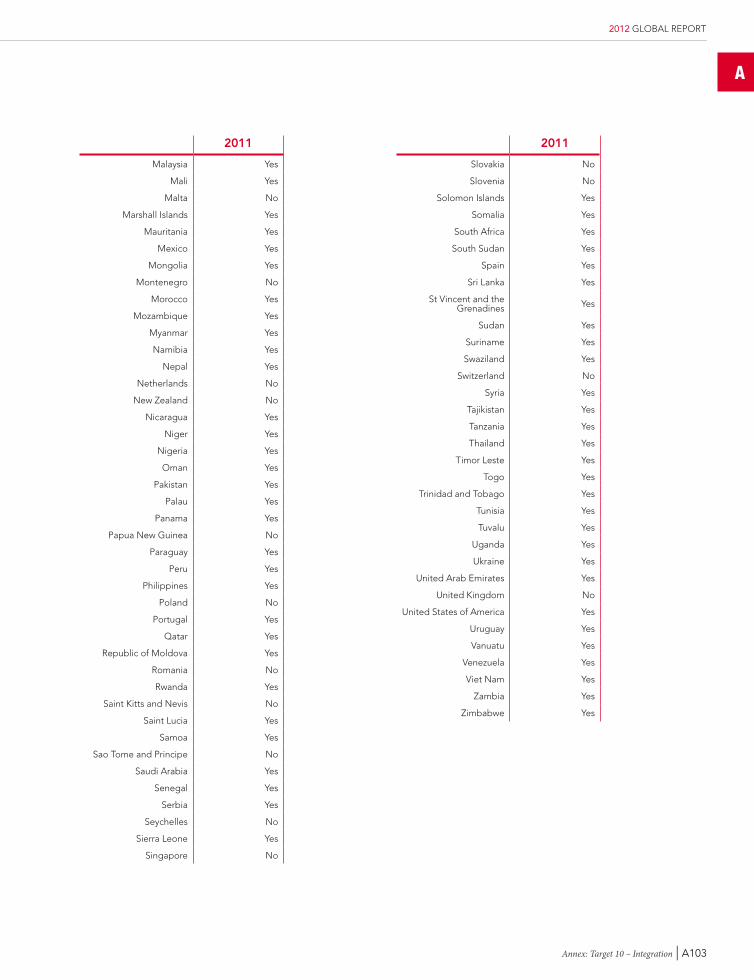
A
Annex: Target 10 – Integration | A103
2012 GLOBAL REPORT
2011
Malaysia Yes
Mali Yes
Malta No
Marshall Islands Yes
Mauritania Yes
Mexico Yes
Mongolia Yes
Montenegro No
Morocco Yes
Mozambique Yes
Myanmar Yes
Namibia Yes
Nepal Yes
Netherlands No
New Zealand No
Nicaragua Yes
Niger Yes
Nigeria Yes
Oman Yes
Pakistan Yes
Palau Yes
Panama Yes
Papua New Guinea No
Paraguay Yes
Peru Yes
Philippines Yes
Poland No
Portugal Yes
Qatar Yes
Republic of Moldova Yes
Romania No
Rwanda Yes
Saint Kitts and Nevis No
Saint Lucia Yes
Samoa Yes
Sao Tome and Principe No
Saudi Arabia Yes
Senegal Yes
Serbia Yes
Seychelles No
Sierra Leone Yes
Singapore No
2011
Slovakia No
Slovenia No
Solomon Islands Yes
Somalia Yes
South Africa Yes
South Sudan Yes
Spain Yes
Sri Lanka Yes
St Vincent and the Grenadines Yes
Sudan Yes
Suriname Yes
Swaziland Yes
Switzerland No
Syria Yes
Tajikistan Yes
Tanzania Yes
Thailand Yes
Timor Leste Yes
Togo Yes
Trinidad and Tobago Yes
Tunisia Yes
Tuvalu Yes
Uganda Yes
Ukraine Yes
United Arab Emirates Yes
United Kingdom No
United States of America Yes
Uruguay Yes
Vanuatu Yes
Venezuela Yes
Viet Nam Yes
Zambia Yes
Zimbabwe Yes
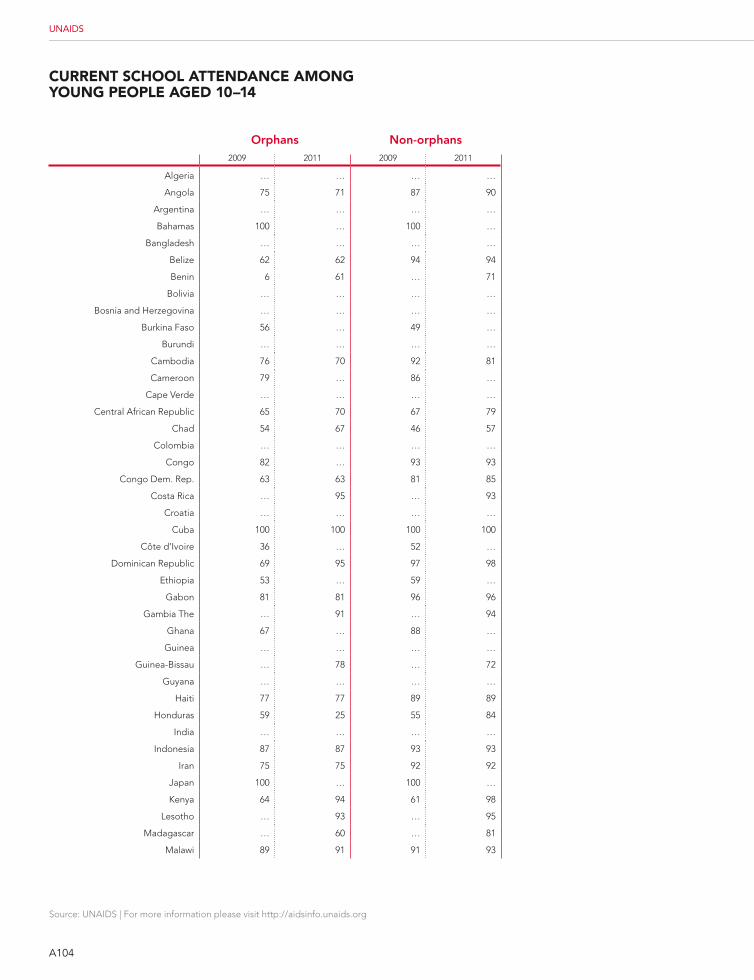
A104
Source: UNAIDS | For more information please visit http://aidsinfo.unaids.org
UNAIDS
currEnt scHool attEndancE among Young PEoPlE agEd 10–14
orphans non-orphans2009 2011 2009 2011
Algeria … … … …
Angola 75 71 87 90
Argentina … … … …
Bahamas 100 … 100 …
Bangladesh … … … …
Belize 62 62 94 94
Benin 6 61 … 71
Bolivia … … … …
Bosnia and Herzegovina … … … …
Burkina Faso 56 … 49 …
Burundi … … … …
Cambodia 76 70 92 81
Cameroon 79 … 86 …
Cape Verde … … … …
Central African Republic 65 70 67 79
Chad 54 67 46 57
Colombia … … … …
Congo 82 … 93 93
Congo Dem. Rep. 63 63 81 85
Costa Rica … 95 … 93
Croatia … … … …
Cuba 100 100 100 100
Côte d’Ivoire 36 … 52 …
Dominican Republic 69 95 97 98
Ethiopia 53 … 59 …
Gabon 81 81 96 96
Gambia The … 91 … 94
Ghana 67 … 88 …
Guinea … … … …
Guinea-Bissau … 78 … 72
Guyana … … … …
Haiti 77 77 89 89
Honduras 59 25 55 84
India … … … …
Indonesia 87 87 93 93
Iran 75 75 92 92
Japan 100 … 100 …
Kenya 64 94 61 98
Lesotho … 93 … 95
Madagascar … 60 … 81
Malawi 89 91 91 93
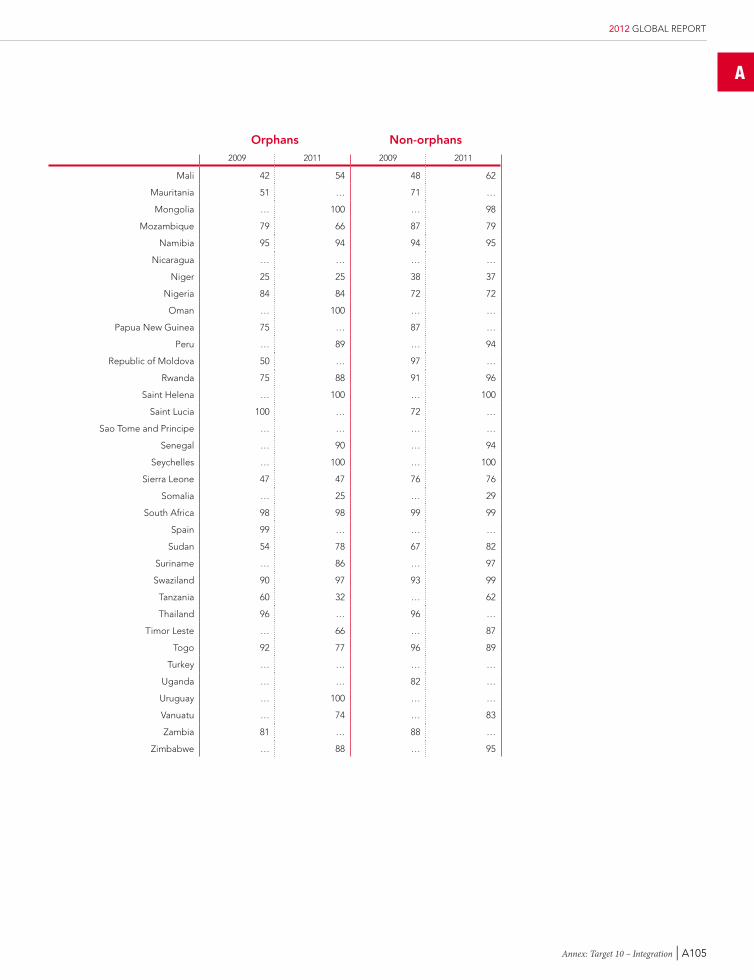
A
Annex: Target 10 – Integration | A105
2012 GLOBAL REPORT
orphans non-orphans2009 2011 2009 2011
Mali 42 54 48 62
Mauritania 51 … 71 …
Mongolia … 100 … 98
Mozambique 79 66 87 79
Namibia 95 94 94 95
Nicaragua … … … …
Niger 25 25 38 37
Nigeria 84 84 72 72
Oman … 100 … …
Papua New Guinea 75 … 87 …
Peru … 89 … 94
Republic of Moldova 50 … 97 …
Rwanda 75 88 91 96
Saint Helena … 100 … 100
Saint Lucia 100 … 72 …
Sao Tome and Principe … … … …
Senegal … 90 … 94
Seychelles … 100 … 100
Sierra Leone 47 47 76 76
Somalia … 25 … 29
South Africa 98 98 99 99
Spain 99 … … …
Sudan 54 78 67 82
Suriname … 86 … 97
Swaziland 90 97 93 99
Tanzania 60 32 … 62
Thailand 96 … 96 …
Timor Leste … 66 … 87
Togo 92 77 96 89
Turkey … … … …
Uganda … … 82 …
Uruguay … 100 … …
Vanuatu … 74 … 83
Zambia 81 … 88 …
Zimbabwe … 88 … 95


![When and how to start ARV treatment. HIV... · Total available resources for AIDS 1986-2008 [i] 1996-2005 data: Extracted from 2006 Report on the Global AIDS Epidemic (UNAIDS, 2006);](https://static.cupdf.com/doc/110x72/5c7521d709d3f2ba1a8c58a1/when-and-how-to-start-arv-treatment-hiv-total-available-resources-for-aids.jpg)