GLOBAL REPORT UNAIDS REPORT ON THE GLOBAL AIDS EPIDEMIC | 2010

Welcome message from author
This document is posted to help you gain knowledge. Please leave a comment to let me know what you think about it! Share it to your friends and learn new things together.
Transcript

GLOBAL REPORT
UNAIDS REPORT ON THEGLOBAL AIDS EPIDEMIC | 2010

Copyright © 2010Joint United Nations Programme on HIV/AIDS (UNAIDS)All rights reserved
The designations employed and the presentation of the material in this publication do not imply the expression of any opinion whatsoever on the part of UNAIDS concerning the legal status of any country, territory, city or area or of its authorities, or concerning the delimitation of its frontiers or boundaries. UNAIDS does not warrant that the information published in this publication is complete and correct and shall not be liable for any damages incurred as a result of its use.
WHO Library Cataloguing-in-Publication Data
Global report: UNAIDS report on the global AIDS epidemic 2010.
“UNAIDS/10.11E | JC1958E”
1.Acquired immunodefi ciency syndrome − epidemiology. 2.Acquired immunodefi ciency syndrome − prevention and control. 3.HIV infections − epidemiology. 4.HIV infections − prevention and control. I.UNAIDS.
ISBN 978-92-9173-871-7 (NLM classifi cation: WC 503.4)

GLOBAL REPORTUNAIDS REPORT ON THE
GLOBAL AIDS EPIDEMIC | 2010

UNAIDS VISION
ZERO NEW HIV INFECTIONS.
ZERO DISCRIMINATION.
ZERO AIDS-RELATED DEATHS.

04 FOREWORD
06 CHAPTER 1 INTRODUCTION
16 CHAPTER 2 EPIDEMIC UPDATE
62 CHAPTER 3 HIV PREVENTION
94 CHAPTER 4 HIV TREATMENT
120 CHAPTER 5 HUMAN RIGHTS AND GENDER
144 CHAPTER 6 HIV INVESTMENTS
164 REFERENCES
178 ANNEX 1 HIV AND AIDS ESTIMATES AND DATA, 2009 AND 2001
208 ANNEX 2 COUNTRY PROGRESS INDICATORS AND DATA, 2004 TO 2010
TABLE OF CONTENTS

FOREWORD
Ebube Sylvia Taylor at the 2010 United Nations Millennium Development Goals Summit

“No child should be born with HIV; no child should be an orphan because of HIV; no child should die due to lack of access to treatment,” urged Ebube Sylvia Taylor, an eleven year old born free of HIV, to world leaders gathered in New York to share progress made towards achieving the Millennium Development Goals by 2015.
We have halted and begun to reverse the epidemic. Fewer people are becoming infected with HIV and fewer people are dying from AIDS.
We must be proud of these successes and the potential of our shared future—breakthroughs in a prevention revolution are at hand with a new microbicide gel holding promise for a generation of women who will be able to initiate usage and take control of their ability to stop HIV. Political breakthroughs will be achieved as more countries abolish discriminatory practices led by voices of a new law commission, and Treatment 2.0—a breakthrough that could save an additional 10 million lives.
However we are not yet in a position to say “mission accomplished”.
Growth in investment for the AIDS response has fl attened for the fi rst time in 2009. Demand is outstripping supply. Stigma, discrimination, and bad laws continue to place roadblocks for people living with HIV and people on the margins.
To fulfi ll Ebube’s hope, we must break the trajectory of the AIDS epidemic by redoubling our eff orts to ensure countries meet their goals towards universal access to HIV prevention, treatment, care and support. We must leverage the growing integration of AIDS with maternal and child health and all of our Millennium Development Goals.
We know that there are solutions. We know that there is political and societal will to bring change. Th e real challenge is following through. Th is new fourth decade of the epidemic should be one of moving towards effi cient, focused and scaled-up programmes to accelerate progress for Results. Results. Results.
Michel SidibéUNAIDS Executive Director Under Secretary-General of the United Nations

6 Chapter 1: Introduction | 2010 GLOBAL REPORT
CHAPTER 1

7Chapter 1: Introduction | 2010 GLOBAL REPORT
1
On the cusp of the fourth decade of the AIDS epidemic, the world has turned the corner—it has halted and begun to reverse the spread of HIV (Millennium Development Goal 6.A). The question remains how quickly the response can chart a new course towards UNAIDS’ vision of zero discrimination, zero new HIV infections, and zero AIDS-related deaths through universal access to effective HIV prevention, treatment, care and support.
Since 1999, the year in which it is thought that the epidemic peaked, globally, the number of new infections has fallen by 19%. Of the estimated 15 million people living with HIV in low- and middle-income countries who need treatment today, 5.2 million have access—translating into fewer AIDS-related deaths. For the estimated 33.3 million people living with HIV after nearly 30 years into a very complex epidemic, the gains are real but still fragile. Future progress will depend heavily on the joint efforts of everyone involved in the HIV response.
At a time of fi nancial constraint, good investments are more important than ever. The evidence supporting increased investment in the HIV response has never been clearer or more compelling. New data from 182 countries, along with extensive input from civil society and other sources, clearly show that steady progress is being made towards achieving universal access to HIV prevention, treatment, care and support. HIV prevention is working. Treatment is working.
Increasing evidence defi nitively demonstrates that investments in the HIV response can lead to clear reductions in discrimination and stigma, help people in accessing information and services to reduce their risk of HIV infection, and deliver the treatment, care, and support that will extend and improve the lives of people living with HIV.
INTRODUCTION

8 Chapter 1: Introduction | 2010 GLOBAL REPORT
More than 5 million people are now receiving HIV treatment In 2009 alone, 1.2 million people received HIV antiretroviral therapy for the fi rst time—an increase in the number of people receiving treatment of 30% in a single year. Overall, the number of people receiving therapy has grown 13-fold, more than fi ve million people in low- and middle-income countries, since 2004. Expanding access to treatment has contributed to a 19% decline in deaths among people living with HIV between 2004 and 2009. Th is is just the beginning: 10 million people living with HIV who are eligible for treatment under the new WHO guidelines are still in need.
Eff orts are now underway for Treatment 2.0, a new approach to simplify the way HIV treatment is currently provided and to scale up access to life-saving medicines. Using a combination of eff orts, this new approach could bring down treatment costs, make treatment regimens simpler and smarter, reduce the bur-den on health systems, and improve the quality of life for people living with HIV and their families. Modelling suggests that, compared with current treatment approaches, Treatment 2.0 could avert an additional 10 million deaths by 2025.
In addition, the new platform could reduce the number of people newly infect-ed with HIV by up to one million annually if countries provide antiretroviral therapy to all people in need, following revised WHO treatment guidelines.
HIV prevention works—new HIV infections are declining in many countries most aff ected by the epidemicIn 33 countries, HIV incidence has fallen by more than 25% between 2001 and 2009. Of these countries 22 are in sub-Saharan Africa. Th e biggest epi-demics in sub-Saharan Africa—Ethiopia, Nigeria, South Africa, Zambia, and Zimbabwe—have either stabilized or are showing signs of decline.
Howevever, several regions and countries do not fi t the overall trend. In seven countries, fi ve of them in Eastern Europe and Central Asia, HIV incidence increased by more than 25% between 2001 and 2009.
Th ese fi gures demonstrate that positive behaviour change can alter the course of the epidemic—while stigma and discrimination, lack of access to services and bad laws can make epidemics worse. In both cases, the eff ects are oft en profound.
CHAPTER 1 | INTRODUCTION
»

9Chapter 1: Introduction | 2010 GLOBAL REPORT
1
Figure 1.1The virtual elimination of mother-to-child transmission of HIV is possible Estimated New HIV infections among children 0-14: Different scenarios for 25 countries
Source: Mahy M, Stover J, Kiragu K, et al. What will it take to achieve virtual elimina-tion of mother-to-child transmission of HIV? An assessment of current progress and future needs. Sex Trans Infect (Suppl) 2010.
Among young people in 15 of the most severely aff ected countries, HIV prevalence has fallen by more than 25% as these young people have adopted safer sexual practices. Similar to treatment access, the room for continued improvement on this success is great. Young people’s knowledge about HIV is increasing but needs to grow further.
Virtual elimination of mother-to-child transmission of HIV is possibleIn 2009, an estimated 370 000 children [220 000–520 000] contracted HIV during the perinatal and breastfeeding period, down from 500 000 [320 000–670 000] in 2001.
500000
450000
400000
350000
300000
250000
200000
150000
100000
50000
02009 2010 2011 2012 2013 2014 2015
No ARV prophylaxis for PMTCT
Constant 2009 coverage of ARV prophylaxis
90% of women reached with services matching WHO guidelines
90% of women reached with services matching WHO guidelines, incidence reduced by 50%, and eliminate unmet need for family planning
90% of women reached with services matching WHO guidelines, incidence reduced by 50%, eliminate unmet need for family planning, restrict breastfeeding to 12 months

10 Chapter 1: Introduction | 2010 GLOBAL REPORT
Although this is a signifi cant reduction, HIV continues to weigh heavily on maternal and child mortality in some countries. But in South Africa, which achieved almost 90% coverage of treatment to prevent mother-to-child transmission of HIV, transmission to infants has been drastically reduced. In many communities, countries and regions of the world, however, access to services to halt mother-to-child transmission needs to be scaled up.
In 2009, UNAIDS called for the virtual elimination of mother-to-child trans-mission of HIV by 2015 (Figure 1.1). In the 10 most severely aff ected countries, this is a realistic aim and can be achieved with signifi cantly increased action to implement proven strategies to eliminate HIV transmission to young people.
Women and girls need supportSlightly more than half of all people living with HIV are women and girls. In sub-Saharan Africa, more women than men are living with HIV, and young women aged 15–24 years are as much as eight times more likely than men to be HIV positive. Protecting women and girls from HIV means protecting against gender-based violence and promoting economic independence from older men.
Human rights are increasingly a part of national strategiesHuman rights are no longer considered peripheral to the AIDS response. Today, the vast majority of countries (89%) explicitly acknowledge or address human rights in their national AIDS strategies, with 92% of countries reporting that they have programmes in place to reduce HIV-related stigma and discrimination.
At the same time, however, criminalization of people living with HIV still presents signifi cant challenges to the AIDS response. More than 80 countries across the world have laws against same-sex behaviour, and the free travel of people living with HIV is restricted in 51 countries, territories and areas. Such laws are not only discriminatory and unjust—they also drive HIV underground and inhibit eff orts to expand access to life-saving HIV prevention, treatment, care and support.
Financing the response is a shared responsibilityIncreasingly, countries with heavy HIV burdens are assuming their responsibilities to resource the response to the degree that their means permit. Domestic expenditure is the largest source of HIV fi nancing globally today, accounting for 52% of resources for the HIV response in low- and middle-income countries. Improving fi nancing for the global response will require ongoing eff orts to mobilize domestic resources among countries that appear to be under-investing in the HIV response, increasing the effi cient use of funds for HIV and other related health and development programmes, and increasing external aid in a global environment of constrained resources.
A fragile progressDespite extensive progress against a number of indicators on the global scale, many countries will fail to achieve Millennium Development Goal 6: halting and reversing the spread of HIV (Figure 1.2 and Figure 1.3).
10mTreatment 2.0 could
avert an additional 10 million deaths by 2025.
>50%Slightly more than half
of all people living with HIV are women and girls.

11Chapter 1: Introduction | 2010 GLOBAL REPORT
1Figure 1.2 Millennium Development Goal 6 indicatorsPopulation-adjusted averages for indicators for Millennium Development Goal target 6.A (halt and begin to reverse the spread of HIV/AIDS), 1999–2003 and 2004–2009.
Source: DHS and UN Population Statistics.
Figure 1.3Young people and sexual risk People aged 15–25 years who had sex before age 15 years and who had multiple partners in the past 12 months.
Source: DHS and UN Population Statistics.
1999-2003 2004-2009
Orphan School Attendance (n=19)
Non-Orphan School Attendance (n=16)
Knowledge Males 15–24 years old (n=17)
Knowledge Females 15–24 years old (n=17)
Condom Use Males (n=23)
Condom Use Females (n=23)
% 10 20 30 40 50 60 70 80 90 100
Multiple partners in last 12 months
1999–2003
1999–2003
2004–2009
2004–2009
Sex before 15
Males Females
% 2.0 4.0 6.0 8.0 10.0 12.0 14.0 16.0

12 Chapter 1: Introduction | 2010 GLOBAL REPORT
Having more than 5 million people receiving treatment is a major public health achievement—but still represents only 35% of the people who need HIV therapy now, according to WHO guidelines issued in early 2010. Reaching the two thirds of people who need treatment, but are not yet receiving it, and fi nancing this expansion in access to HIV therapy will require a continued and expanded global commitment to providing high quality HIV care for all.
Knowledge of the epidemic and how to prevent HIV infection has increased among young people aged 15–24 years—people frequently at the highest risk for infection. Six countries have achieved greater than 80% condom use at last higher-risk sex among males, and two countries have achieved this high level of condom use among females (see the HIV prevention scorecard).
Young people still lack knowledge and, importantly, oft en lack the tools they need to practice HIV risk-reduction strategies, however. Many people still lack ready access to condoms and lubrication, and people who inject drugs also lack suffi cient access to sterile needles.
A new visionFulfi lling the UNAIDS vision of zero new infections will require a hard look at the societal structures, beliefs and value systems that present obstacles to eff ec-tive HIV prevention eff orts. Poverty, gender inequity, inequity in health and the education system, discrimination against marginalized people, and unequal resource pathways all aff ect—and oft en slow—the HIV response.
In a world that has had to learn to live with an evolving and seemingly unstop-pable epidemic over the course of three decades, UNAIDS’ vision of zero discrimination, zero new infections and zero AIDS-related deaths poses a challenge. But it is not a hopeless challenge. Th e vision of eliminating the toll that HIV imposes on human life can be made real using the knowledge and resources available today. Planners, programme administrators and imple-menters must make a sustained and dedicated eff ort to use the best social and scientifi c knowledge available. Strengthened programming using the latest knowledge and best practices to deliver eff ective prevention, treatment and care services to people in need, or at risk, is highly eff ective.
Building social coalitions to reduce vulnerability to HIV infection supports individuals and strengthens communities. Safeguarding the health of mothers and infants and optimizing infant feeding provides a strong basis for the growth of new generations. Investing in health care and social support systems, work-ing to eliminate violence against women and girls and promote gender equality and working to end stigma and discrimination against people living with HIV and members of other marginalized groups help to provide social environ-ments that are eff ective against the spread of HIV and promote more general mental and physical well-being. And in providing HIV-specifi c services with an awareness of other health and social issues and forging appropriate linkages, the response to HIV can make an important contribution to global health.
“MANY PEOPLE STILL LACK READY ACCESS TO CONDOMS
AND LUBRICATION, AND PEOPLE WHO INJECT DRUGS
ALSO LACK SUFFICIENT ACCESS TO STERILE NEEDLES.”

13Chapter 1: Introduction | 2010 GLOBAL REPORT
1Figure 1.4Treatment coverage in low- and middle-income countries Population-adjusted averages for treatment coverage in low- and middle-income countries by geographical region in 2009 based on 2010 WHO guidelines: Millennium Development Goal target 6.B (achieve, by 2010, universal access to treatment for HIV/AIDS for all those who need it). The regional fi gure for North America is not shown because of lack of data.
Source: WHO Towards Universal Access 2010.
sub-Saharan Africa
Latin America
Caribbean
East, South and South-east Asia
Europe and Central Asia
North Africa and the Middle East
% 10 20 30 40 50 60

14 Chapter 1: Introduction | 2010 GLOBAL REPORT
Th e Millennium Development Goals are intertwined. Without achieving sub-stantive progress towards the HIV-specifi c Goal 6, few other Goals are likely to be reached; likewise, without integration and signifi cant progress towards most other Goals being made, Goal 6 will probably not be achieved.
Stopping infections, saving lives and improving the quality of life of people living with HIV have always been at the heart of the global AIDS response. Th e successes and continuing challenges described in this report should serve as catalysts for continued action. ■

15Chapter 1: Introduction | 2010 GLOBAL REPORT
1
AIDS SCORECARDS
For the fi rst time, UNAIDS is publishing scorecards to provide a quick overview of the progress made by United Nations Member States in the global AIDS response. Five scorecards for (1) HIV incidence (2) prevention, (3) treatment, care, and support, (4) human rights and gender equality, and (5) investment, show the top national values for key indicators at the end of each chapter. They provide a snapshot of achievements, failures and obstacles in achieving universal access to HIV prevention, treatment, care and support. Readers seeking more detailed data can fi nd a comprehensive tabulation of all available data on each of the indicators used for the international monitoring of national responses to HIV in the annexes.

16 Chapter 2: Epidemic update | 2010 GLOBAL REPORT
THE OVERALL GROWTH OF THE GLOBAL AIDS EPIDEMIC APPEARS TO HAVE STABILIZED. THE ANNUAL NUMBER OF NEW HIV INFECTIONS HAS BEEN STEADILY DECLINING SINCE THE LATE 1990S AND THERE ARE FEWER AIDS-RELATED DEATHS DUE TO THE SIGNIFICANT SCALE UP OF ANTIRETROVIRAL THERAPY OVER THE PAST FEW YEARS. ALTHOUGH THE NUMBER OF NEW INFECTIONS HAS BEEN FALLING, LEVELS OF NEW INFECTIONS OVERALL ARE STILL HIGH, AND WITH SIGNIFICANT REDUCTIONS IN MORTALITY THE NUMBER OF PEOPLE LIVING WITH HIV WORLDWIDE HAS INCREASED.
New HIV infections are decliningIn 2009, there were an estimated 2.6 million [2.3 million–2.8 million] people who became newly infected with HIV. Th is is nearly one fi ft h (19%) fewer than the 3.1 million [2.9 million–3.4 million] people newly infected in 1999, and more than one fi ft h (21%) fewer than the estimated 3.2 million [3.0 million–3.5 million] in 1997, the year in which annual new infections peaked (Figure 2.1).
In 33 countries, the HIV incidence has fallen by more than 25% between 2001 and 2009 (Figure. 2.2); 22 of these countries are in sub-Saharan Africa. In sub-Saharan Africa, where the majority of new HIV infections continue to occur, an estimated 1.8 million [1.6 million–2.0 million] people became infected in 2009; considerably lower than the estimated 2.2 million [1.9 million–2.4 mil-lion] people in sub-Saharan Africa newly infected with HIV in 2001. Th is trend refl ects a combination of factors, including the impact of HIV prevention eff orts and the natural course of HIV epidemics.
CHAPTER 2 | EPIDEMIC UPDATE
»
Figure 2.1 Number of people newly infected with HIV
‘90
MIL
LIO
NS
‘98‘91 ‘99‘92 ‘00‘93 ‘01 ‘06‘94 ‘02 ‘07‘95 ‘03 ‘08‘96 ‘04 ‘09 ‘97 ‘05
4.0
3.5
3.0
2.5
2.0
1.5
1.0
0.5
0.0
EPIDEMIC UPDATE

17Chapter 2: Epidemic update | 2010 GLOBAL REPORT
2
Figure 2.2Changes in the incidence rate of HIV infection, 2001 to 2009, selected countries
Source: UNAIDS.
In the absence of a reliable diagnostic test that can directly measure the level of new HIV infections in a population, estimates of HIV incidence have been produced through modeling The map includes 60 countries for which reliable estimates of new HIV infections over time were available from the 2010 round of country-specific estimation using the EPP/Spectrum tools, and 3 countries for which peer-reviewed publications with incidence trends were available. The EPP/Spectrum methods estimate HIV incidence trends from HIV prevalence over time combined with the changing level of antiretroviral therapy. The criteria for including countries in this analysis were as follows. EPP files were available and trends in EPP were not derived from workbook prevalence estimates; prevalence data were available up to at least 2007; there were at least four time points between 2001 and 2009 for which prevalence data were available for concentrated epidemics and at least three data points in the same period for generalized epidemics; for the majority of epidemic curves for a given country, EPP did not produce an artificial increase in HIV prevalence in recent years due to scarcity of prevalence data points; data were representative of the country; the EPP/Spectrum–derived incidence trend was not in conflict with the trend in case reports of new HIV diagnoses; and the EPP/Spectrum–derived incidence trend was not in conflict with modelled incidence trends derived from age-specific prevalence in national survey results. For some countries with complex epidemics including multiple populations groups with different risk behaviours as well as major geographic differences, such as Brazil, China and the Russian Federation, this type of assessment is highly complex and it could not be concluded in the 2010 estimation round. UNAIDS will continue to work with countries and partners to improve the quality of available information and modeling methodologies to include HIV incidence data for additional countries in future reports.
Several regions and countries do not fi t the overall trend. In seven countries, the HIV incidence increased by more than 25% between 2001 and 2009. In Western, Central, and Eastern Europe, Central Asia, and North America, the rates of annual new HIV infections have been stable for at least the past fi ve years. However, evidence is increasing of a resurgence of HIV in several high-income countries among men who have sex with men. In Eastern Europe and Central Asia, high rates of HIV transmission continue to occur in networks of people who inject drugs and their sexual partners.
Young people leading a revolution in HIV preventionA recent analysis among young people provides further evidence of decreasing incidence and safer sexual behaviour (Table 2.1). Seven countries showed a sta-tistically signifi cant decline of 25% or more in HIV prevalence (the percentage of people living with HIV) by 2008 among young pregnant women attending antenatal clinics.
Increasing >25%StableDecreasing >25%Not included in analysis
Note about Figures:Dotted lines in fi gures represent ranges, solid lines represent the best estimate.

18 Chapter 2: Epidemic update | 2010 GLOBAL REPORT
Table 2.1 HIV prevalence and behaviourTrends in HIV prevalence and behaviour among young people in countries most severely affected by HIV
Source: UNAIDS.
Angola
Bahamas
Belize
Botswana
Burundi
Cameroon
Central African Republic
Chad
Congo
Côte d’Ivoire
Djibouti
Ethiopia
Gabon
Guyana
Haiti
Kenya
Lesotho
Malawi
Mozambique
Namibia
Nigeria
Rwanda
South Africa
Suriname
Swaziland
Togo
Uganda
United Republic of Tanzania
Zambia
Zimbabwe
Trend in HIV prevalence from national surveys
Prevalence trend among antenatal care attendees
National HIV prevalence surveys conducted
Prevalence data were available from antenatal care surveillance
Percentage who have had sex by age 15
Percentage who have had sex with more than one partner in past year
Proportion who have had more than one partner not using condoms during last sex
URBAN RURAL F M F M F M F M
2004–2007
2000–2008
NA
2001–2006
2000–2007
NA
ID
ID
NA
2000–2008
ID
2001–2005
ID
NA
2000–2007
2000–2005
2003–2007
1999–2007
2001–2007
2002–2008
2003–2008
2002–2007
2000–2007
NA
2002–2008
2004–2007
2003–2008
2002–2006
2002–2006
2000–2006
2004, 2008
2002, 2007
2003, 2007
2002, 2007
2002, 2006
2002,2005,2007
2003,2004,2007
PERIOD YEARS
NOTES: NA=Not Available ID=Insuffi cient Data M=Male F=Female
Declining trend is statistically signifi cantIncreasing Trends Decreasing Trends No Evidence of Change

19Chapter 2: Epidemic update | 2010 GLOBAL REPORT
2
Five countries—Botswana, South Africa, United Republic of Tanzania, Zambia, and Zimbabwe—showed a signifi cant decline in HIV prevalence among young women or men in national surveys. Sexual behaviour changed in most coun-tries. In eight countries with signifi cant declines in HIV prevalence, the sexual behaviour of either men or women also changed signifi cantly.
New infections among children decreasingAs access to services for preventing the mother-to-child transmission of HIV has increased, the total number of children being born with HIV has decreased. An estimated 370 000 [230 000–510 000] children were newly infected with HIV in 2009 (a drop of 24% from fi ve years earlier).
AIDS-related deaths are decreasingTh e number of annual AIDS-related deaths worldwide is steadily decreasing from the peak of 2.1 million [1.9 million–2.3 million] in 2004 to an estimated 1.8 million [1.6 million–2.1 million] in 2009 (Figure 2.3). Th e decline refl ects the increased availability of antiretroviral therapy, as well as care and support, to people living with HIV, particularly in middle- and low-income countries; it is also a result of decreasing incidence starting in the late 1990s.
Th e eff ects of antiretroviral therapy are especially evident in sub-Saharan Africa, where an estimated 320 000 (or 20%) fewer people died of AIDS-related causes in 2009 than in 2004, when antiretroviral therapy began to be dramatically expanded (Figure 2.5).
AIDS-related mortality began to decline in sub-Saharan Africa and the Caribbean in 2005. Diff erent patterns have emerged in other regions. In North America and Western and Central Europe, deaths due to AIDS began to decline soon aft er antiretroviral therapy was introduced in 1996. In Asia and Central and South America, the number of deaths has stabilized, but there is no indica-tion yet of decline. Deaths continue to increase in Eastern Europe.
Globally, deaths among children younger than 15 years of age are also declining. Th e estimated 260 000 [150 000–360 000] children who died from AIDS-related illnesses in 2009 were 19% fewer than the estimated 320 000 [210 000–430 000] who died in 2004. Th is trend refl ects the steady expansion of services to prevent transmission of HIV to infants and an increase (albeit slow) in access to treat-ment for children.
19%Estimated decrease in AIDS-related deaths globally among children from 2004 to 2009.

20 Chapter 2: Epidemic update | 2010 GLOBAL REPORT
Table 2.2 Regional HIV and AIDS statistics, 2001 and 2009Regional fi gures on adults and children newly infected and living with HIV and AIDS-related deaths
Source: UNAIDS.
Adults and children living with HIV
SUB-SAHARAN AFRICA
2009
2001
22.5 million[20.9–24.2 million]
1.8 million[1.6–2.0 million]
5.0[4.7–5.2]
1.3 million[1.1–1.5 million]
20.3 million[18.9–21.7 million]
2.2 million[1.9–2.4 million]
5.9[5.6–6.1]
1.4 million[1.2–1.6 million]
MIDDLE EAST ANDNORTH AFRICA
2009
2001
460 000[400 000–530 000]
75 000[61 000–92 000]
0.2[0.2–0.3]
24 000[20 000–27 000]
180 000[150 000–210 000]
36 000[32 000–42 000]
0.1[0.1–0.1]
8300[6300–11 000]
SOUTH AND SOUTH-EAST ASIA
2009
2001
4.1 million[3.7–4.6 million]
270 000[240 000–320 000]
0.3[0.3–0.3]
260 000[230 000–300 000]
3.8 million[3.5–4.2 million]
380 000[350 000–430 000]
0.4[0.3–0.4]
230 000[210 000–280 000]
EAST ASIA 2009
2001
770 000[560 000–1.0 million]
82 000[48 000–140 000]
0.1[0.1–0.1]
36 000[25 000–50 000]
350 000[250 000–480 000]
64 000[47 000–88 000]
<0.1[<0.1–<0.1]
15 000[9400–28 000]
OCEANIA 2009
2001
57 000[50 000–64 000]
4500[3400–6000]
0.3[0.2–0.3]
1400[<1000–2400]
29 000[23 000–35 000]
4700[3800–5600]
0.2[0.1–0.2]
<1000[<500–1100]
CENTRAL AND SOUTH AMERICA
2009
2001
1.4 million[1.2–1.6 million]
92 000[70 000–120 000]
0.5[0.4–0.6]
58 000[43 000–70 000]
1.1 million[1.0–1.3 million]
99 000[85 000–120 000]
0.5[0.4–0.5]
53 000[44 000–65 000]
Adults and children newly infected with HIV
% Adult prevalence (15–49 years)
AIDS-related deaths among adults and children

21Chapter 2: Epidemic update | 2010 GLOBAL REPORT
2
Adults and children living with HIV
CARIBBEAN 2009
2001
240 000[220 000–270 000]
17 000[13 000–21 000]
1.0[0.9–1.1]
12 000[8500–15 000]
240 000[210 000–270 000]
20 000[17 000–23 000]
1.1[1.0–1.2]
19 000[16 000–23 000]
EASTERN EUROPE AND CENTRAL
ASIA
2009
2001
1.4 million[1.3–1.6 million]
130 000[110 000–160 000]
0.8[0.7–0.9]
76 000[60 000–95 000]
760 000[670 000–890 000]
240 000[210 000–300 000]
0.4[0.4–0.5]
18 000[14 000–23 000]
WESTERN AND CENTRAL EUROPE
2009
2001
820 000[720 000–910 000]
31 000[23 000– 40 000]
0.2[0.2–0.2]
8500[6800–19 000]
630 000[570 000–700 000]
31 000[27 000–35 000]
0.2[0.2–0.2]
7300[5700–11 000]
NORTH AMERICA 2009
2001
1.5 million[1.2–2.0 million]
70 000[44 000–130 000]
0.5[0.4–0.7]
26 000[22 000–44 000]
1.2 million[960 000–1.4 million]
66 000[54 000–81 000]
0.4[0.4–0.5]
30 000[26 000–35 000]
Adults and children newly infected with HIV
% Adult prevalence (15–49 years)
TOTAL 2009
2001
33.3 million[31.4–35.3 million]
2.6 million[2.3–2.8 million]
0.8[0.7–0.8]
1.8 million[1.6–2.1 million]
28.6 million[27.1–30.3 million]
3.1 million[2.9–3.4 million]
0.8[0.7–0.8]
1.8 million[1.6–2.0 million]
AIDS-related deaths among adults and children

22 Chapter 2: Epidemic update | 2010 GLOBAL REPORT
Figure 2.3 Annual AIDS-related deaths by region, 1990-2009
Source: UNAIDS.
TH
OU
SA
ND
S
‘92 ‘94 ‘96 ‘98 ‘00 ‘02 ‘04 ‘06 ‘08‘90
20
40
60
80
100
Eastern Europe + Central Asia Caribbean
TH
OU
SA
ND
S
‘92 ‘94 ‘96 ‘98 ‘00 ‘02 ‘04 ‘06 ‘08‘90
5
10
15
20
25
Central + South America
TH
OU
SA
ND
S
‘92 ‘94 ‘96 ‘98 ‘00 ‘02 ‘04 ‘06 ‘08‘90
20
40
60
80
Sub-Saharan Africa
MIL
LIO
NS
‘92 ‘94 ‘96 ‘98 ‘00 ‘02 ‘04 ‘06 ‘08‘90
0.5
1.0
1.5
2.0
North America + Western and Central Europe
TH
OU
SA
ND
S
‘92 ‘94 ‘96 ‘98 ‘00 ‘02 ‘04 ‘06 ‘08‘90
25
50
75
125
100
Asia
TH
OU
SA
ND
S‘92 ‘94 ‘96 ‘98 ‘00 ‘02 ‘04 ‘06 ‘08‘90
100
200
300
400
500
350
250
150
50
450

23Chapter 2: Epidemic update | 2010 GLOBAL REPORT
2
Trends in the number of people living with HIVUNAIDS estimates that there were 33.3 million [31.4 million–35.3 million] people living with HIV at the end of 2009 compared with 26.2 million [24.6 mil-lion–27.8 million] in 1999—a 27% increase (Figure 2.4 and Figure 2.5). Although the annual number of new HIV infections has been steadily declining since the late 1990s, this decrease is off set by the reduction in AIDS-related deaths due to the signifi cant scale up of antiretroviral therapy over the past few years (Table 2.2).
Th is report revises the estimate of the number of people living with HIV in 2008 of 33.4 million [31.1 million–35.8 million] published in AIDS epidemic update: November 2009, to 32.8 million [30.9 million–34.7 million], which is within the uncertainty range of the previous estimate. Th is revision is based on additional data becoming available for many countries, including data from population-based surveys such as in Mozambique. AIDS epidemic update: November 2009 included Mexico in Latin America. Th is report includes Mexico in North America and categorizes the rest of Latin America as Central and South America. Th is report presents trend analysis based on the new defi nition of these regions.
Th e estimated number of children living with HIV increased to 2.5 million [1.7 million–3.4 million] in 2009 (Figure 2.3). Th e proportion of women living with HIV has remained stable, at slightly less than 52% of the global total.
Figure 2.4Global prevalence of HIV, 2009
Source: UNAIDS.
No data <.1% .1% – <.5% .5% – <1% 1% – <5% 5% – <15% >15% – 28%

24 Chapter 2: Epidemic update | 2010 GLOBAL REPORT
Figure 2.5 Global HIV trends, 1990 to 2009
Source: UNAIDS.
‘90
MIL
LIO
NS
‘98‘91 ‘99‘92 ‘00‘93 ‘01 ‘06‘94 ‘02 ‘07‘95 ‘03 ‘08‘96 ‘04 ‘09 ‘97 ‘05
40
35
30
25
20
15
10
5
0
Number of people living with HIV
‘90
MIL
LIO
NS
‘98‘91 ‘99‘92 ‘00‘93 ‘01 ‘06‘94 ‘02 ‘07‘95 ‘03 ‘08‘96 ‘04 ‘09 ‘97 ‘05
4.0
3.5
3.0
2.5
2.0
1.5
1.0
0.5
0.0
Number of children living with HIV
‘90
MIL
LIO
NS
‘98‘91 ‘99‘92 ‘00‘93 ‘01 ‘06‘94 ‘02 ‘07‘95 ‘03 ‘08‘96 ‘04 ‘09 ‘97 ‘05
2.5
2.0
1.5
1.0
0.5
0.0
Adult and child deaths due to AIDS
Number of orphans due to AIDS
‘90
MIL
LIO
NS
20
16
12
8
4
0‘98‘91 ‘99‘92 ‘00‘93 ‘01 ‘06‘94 ‘02 ‘07‘95 ‘03 ‘08‘96 ‘04 ‘09 ‘97 ‘05

25Chapter 2: Epidemic update | 2010 GLOBAL REPORT
2
Sub-Saharan Africa still bears an inordinate share of the global HIV burden. Although the rate of new HIV infections has decreased, the total number of people living with HIV continues to rise. In 2009, that number reached 22.5 million [20.9 million–24.2 million], 68% of the global total. Sub-Saharan Africa has more women than men living with HIV.
Th e largest epidemics in sub-Saharan Africa—Ethiopia, Nigeria, South Africa, Zambia, and Zimbabwe—have either stabilized or are showing signs of decline. Th e estimated 1.3 million [1.1 million–1.5 million] people who died of HIV-related illnesses in sub-Saharan Africa in 2009 comprised 72% of the global total of 1.8 million [1.6 million–2.0 million] deaths attributable to the epidemic.
Figure 2.6Trends in women living with HIV Proportion of people 15 years and older living with HIV who are women, 1990–2009.
Source: UNAIDS.
Sub-Saharan Africa
Caribbean
Global
Eastern Europe and Central Asia
Central and South America
Asia
Western and Central Europe and North America
70
60
50
40
30
20
10
%‘90 ‘91 ‘92 ‘93 ‘94 ‘97 ‘98 ‘99 ‘00 ‘05‘01 ‘06‘02 ‘07‘95 ‘03 ‘08‘96 ‘04 ‘09

26 Chapter 2: Epidemic update | 2010 GLOBAL REPORT
Table 2.3 AIDS statistics for sub-Saharan Africa, 2001 and 2009
Source: UNAIDS.
Figure 2.7 HIV prevalence in sub-Saharan AfricaHIV prevalence among adults aged 15–49 years old in sub-Saharan Africa, 1990 to 2009.
Source: UNAIDS.
SUB-SAHARAN AFRICA
No data <1% 1% – <5% 5% – <10% 10% – <20% 20% – 28%
SUB-SAHARAN AFRICA
2009
2001
People living with HIV
22.5 million[20.9–24.2 million]
20.3 million[18.9–21.7 million]
People newly infected with HIV
1.8 million[1.6–2.0 million]
2.2 million[1.9–2.4 million]
Children living with HIV
2.3 million[1.4–3.1 million]
1.8 million[1.1–2.5 million]
AIDS-related deaths
1.3 million[1.1–1.5 million]
1.4 million[1.2–1.6 million]

27Chapter 2: Epidemic update | 2010 GLOBAL REPORT
2
Figure 2.8 HIV trends in sub-Saharan Africa
Source: UNAIDS.
‘90
MIL
LIO
NS
25
20
15
10
5
0‘98‘91 ‘99‘92 ‘00‘93 ‘01 ‘06‘94 ‘02 ‘07‘95 ‘03 ‘08‘96 ‘04 ‘09 ‘97 ‘05
Number of people living with HIV
‘90
MIL
LIO
NS
3.5
3.0
2.5
2.0
1.5
1.0
.5
0‘98‘91 ‘99‘92 ‘00‘93 ‘01 ‘06‘94 ‘02 ‘07‘95 ‘03 ‘08‘96 ‘04 ‘09 ‘97 ‘05
Number of children living with HIV
‘90
MIL
LIO
NS
2.0
1.5
1.0
.5
0‘98‘91 ‘99‘92 ‘00‘93 ‘01 ‘06‘94 ‘02 ‘07‘95 ‘03 ‘08‘96 ‘04 ‘09 ‘97 ‘05
Adult and child deaths due to AIDS
‘90
MIL
LIO
NS
3.0
2.5
2.0
1.5
1.0
.5
0‘98‘91 ‘99‘92 ‘00‘93 ‘01 ‘06‘94 ‘02 ‘07‘95 ‘03 ‘08‘96 ‘04 ‘09 ‘97 ‘05
Number of people newly infected with HIV

28 Chapter 2: Epidemic update | 2010 GLOBAL REPORT
Sub-Saharan Africa still bears an inordinate share of the global HIV burdenTh e epidemics in sub-Saharan Africa vary considerably, with southern Africa1 still the most severely aff ected (Table 2.2 and Figure 2.8). An esti-mated 11.3 million [10.6 million–11.9 million] people were living with HIV in southern Africa in 2009, nearly one third (31%) more than the 8.6 million [8.2 million– 9.1 million] people living with HIV in the region a decade earlier.
Globally, 34% of people living with HIV in 2009 resided in the 10 countries in southern Africa; 31% of new HIV infections in the same year occurred in these 10 countries, as did 34% of all AIDS-related deaths. About 40% of all adult women with HIV live in southern Africa.
HIV incidence falling in 22 countries in sub-Saharan AfricaTh e HIV incidence (number of people newly infected with HIV) appears to have peaked in the mid-1990s, and there is evidence of declines in incidence in several countries in sub-Saharan Africa. Between 2001 and 2009, the incidence of HIV infection declined by more than 25% in an estimated 22 countries.
In Zimbabwe, the main behavioural change appears to have been a reduction in the proportion of men with casual partners, while condom use with non-regular partners has remained high since the late 1990s (1,2).
With an estimated 5.6 million [5.4 million–5.8 million] people living with HIV in 2009, South Africa’s epidemic remains the largest in the world. New indi-cations show a slowing of HIV incidence amid some signs of a shift towards safer sex among young people (3). Th e annual HIV incidence among 18-year-olds declined sharply from 1.8% in 2005 to 0.8% in 2008, and among women 15–24 years old it dropped from 5.5% in 2003–2005 to 2.2% in 2005–2008 (4).
Other epidemics in southern Africa have also levelled off at very high levels. At an estimated 25.9% [24.9%–27.0%] in 2009, Swaziland has the highest adult HIV prevalence in the world.
Th e epidemics in East Africa have declined since 2000 but are stabilizing in many countries. Th e HIV incidence slowed in the United Republic of Tanzania to about 3.4 per 1000 person-years between 2004 and 2008 (5). Th e national HIV prevalence in Kenya fell from about 14% in the mid-1990s to 5% in 2006 (6). Th e HIV prevalence in Uganda has stabilized at between 6.5% and 7.0% since 2001. Th e HIV prevalence in Rwanda has been about 3.0% since 2005.
Th e HIV prevalence in West and Central Africa remains comparatively low, with the adult HIV prevalence estimated at 2% or under in 12 countries in 2009 (Benin, Burkina Faso, Democratic Republic of the Congo, Gambia, Ghana, Guinea, Liberia, Mali, Mauritania, Niger, Senegal, and Sierra Leone). Th e prevalence of HIV is highest in Cameroon at 5.3% [4.9%–5.8%], Central African Republic 4.7% [4.2%–5.2%], Côte d’Ivoire 3.4% [3.1%–3.9%], Gabon 5.2% [4.2%–6.2%], and Nigeria 3.6% [3.3%–4.0%].
1 Angola, Botswana, Lesotho, Malawi, Mozambique, Namibia, South Africa, Swaziland, Zambia, and Zimbabwe.
SUB-SAHARAN AFRICA
5.6mWith an estimated 5.6 million
people living with HIV in 2009, South Africa’s epidemic remains the
largest in the world.

29Chapter 2: Epidemic update | 2010 GLOBAL REPORT
2
Slight declines in prevalence have been detected in household surveys in Mali and Niger and among antenatal clinic attendees in Benin, Burkina Faso, Côte d’Ivoire, and Togo (7).
Reducing new HIV infections among childrenTh ere has been pronounced progress in reducing the incidence and impact of HIV among children younger than 15 years in southern Africa. Th ere were 32% fewer children newly infected—an estimated 130 000 [90 000–160 000] versus 190 000 [140 000–230 000]—and 26% fewer AIDS-related deaths among children—90 000 [61 000–110 000] versus 120 000 [88 000–150 000]—in 2009 compared with 2004. About 890 children became newly infected with HIV in Botswana in 2007, down from 4600 in 1999 (information from NACA).
South Africa is one of the few countries in the world where child and maternal mortality has risen since the 1990s (8). AIDS is the largest cause of maternal mortality in South Africa and also accounts for 35% of deaths in children younger than fi ve years (3).
AIDS-related mortality decreasingTh e scaling up of treatment is profoundly aff ecting sub-Saharan Africa. At the end of 2009, 37% of adults and children eligible for antiretroviral therapy were receiving it in the region overall (41% in Eastern and Southern Africa and 25% in Western and Central Africa), compared with only 2% seven years earlier (9).AIDS-related deaths decreased by 18% in southern Africa—an estimated 610 000 [530 000–700 000] people died from AIDS-related illnesses in southern Africa in 2009, compared with 740 000 [670 000–820 000] fi ve years earlier.
In Botswana, where antiretroviral therapy coverage exceeds 90%, the estimated annual number of AIDS-related deaths declined by half (from 18 000 [15 000–22 000] in 2002 to 9100 [2400–19 000] in 2009), while the estimated number of children newly orphaned by AIDS fell by 40% (10). Th e extensive provision of antiretroviral therapy has averted an estimated 50 000 adult deaths and, if this is sustained, Botswana could avert a further estimated 130 000 deaths through 2016 (11).
AIDS-related deaths in Kenya fell by 29% between 2002 and 2007 (6). In rural Malawi, provision of antiretroviral therapy was linked to a 10% drop in the adult death rate between 2004 and 2008 (12). Antiretroviral therapy and other types of treatment have expanded since the early 2000s, but the number of AIDS-related deaths remains high.
Most people receiving antiretroviral therapy in sub-Saharan Africa start treat-ment late (13), which limits the overall impact of HIV treatment programmes. Th e infrastructure, systems, and staff required to properly monitor treatment retention and loss are becoming increasingly inadequate as programmes are scaled up. As HIV testing expands, systems are strengthened to monitor the health status of people living with HIV, and access to treatment is provided at the appropriate time, AIDS-related mortality is likely to further reduce.
25.9%At an estimated 25.9% in 2009, Swaziland has the highest adult HIV prevalence in the world.

30 Chapter 2: Epidemic update | 2010 GLOBAL REPORT
Addressing sexual behaviour to prevent the sexual transmission of HIVTh e vast majority of people newly infected with HIV in sub-Saharan Africa are infected during unprotected heterosexual intercourse (including paid sex) and onward transmission of HIV to newborns and breastfed babies. Having unprotected sex with multiple partners remains the greatest risk factor for HIV in this region. Large proportions of people living with HIV are in long-term relationships—62% in Kenya and 78% in Malawi, for example (14).
As mainly heterosexual epidemics evolve, the numbers of discordant couples (only one person is infected with HIV) increase and HIV transmission within long-term relationships increases (15). Research in 12 countries in eastern and southern Africa shows that prevalence of discordant couples is high, ranging between 36% and 85% (16).
Urban data in Zambia suggest that 60% of the people newly infected through heterosexual transmission are infected within marriage or cohabitation (17), compared with more than half (50%–65%) in Swaziland (18), 35%–62% in Lesotho (19) and an estimated 44% in Kenya (20).
Prevention strategies, however, oft en do not adequately address the patterns of HIV transmission. Couples testing and other prevention services for serodis-cordant couples receive inadequate support (20).
Increasing evidence indicates that unprotected paid sex, sex between men, and the use of contaminated drug-injecting equipment by two or more people on the same occasion are signifi cant factors in the HIV epidemics of several coun-tries with generalized epidemics. Together, those modes of transmission are believed to account for about 33% of new HIV infections in Kenya and almost 40% in Ghana, for example. However, comparatively little funding is chan-nelled into prevention services for populations at higher risk (20).
Paid sex remains an important factor in many of the HIV epidemics in Western, Central and Eastern Africa. It is estimated that almost one third (32%) of new HIV infections in Ghana, 14% in Kenya and 10% in Uganda are linked to sex work (HIV infection among sex workers, their clients, or their other sex partners) (20, 21).
Results from recent studies in sub-Saharan Africa indicate the existence of groups of men who have sex with men and high levels of HIV infection among them (Figure 2.9) (22). Up to 20% of new HIV infections in Senegal (23) and 15% of those in Kenya (20) and Rwanda (24) could be linked to unprotected sex between men. Available evidence suggests that in sub-Saharan Africa, as elsewhere in the world, the majority of men who have sex with men also have sex with women. In Senegal, four fi ft hs (82%) of the surveyed men who have sex with men said that they also have sex with women (25). In Malawi, one third of men who have sex with men were married or cohabiting with a woman (26), as were two thirds of those surveyed in the Nigerian state of Enugu (27).
SUB-SAHARAN AFRICA

31Chapter 2: Epidemic update | 2010 GLOBAL REPORT
2
Figure 2.9 HIV among men who have sex with men in sub-Saharan AfricaHIV prevalence (%) among male adults 15–49 years old who have sex with men in seven countries in sub-Saharan Africa, 2009 or latest available year.
Source: Baral et al. (28); Nigeria Federal Ministry of Health (29); Lane et al. (30); Parry et al. (31); Sander et al. (32); Sander et al. (33); and Wade et al. (34).
Injecting drug use appearing in sub-Saharan AfricaInjecting drug use is a relatively recent phenomenon in sub-Saharan Africa that features in some of the region’s epidemics, including in Kenya, Mauritius, South Africa, and the United Republic of Tanzania. Uniquely in sub-Saharan Africa, injecting drug use is the main driver of the comparatively small HIV epidemic in Mauritius (35). Available research shows high HIV prevalence among people who inject drugs: 36% among those tested in Nairobi (Kenya) (36), 26% in Zanzibar (37), and an estimated 12% in South Africa (38). In 2007, 10% of people who inject drugs surveyed in the Kano region of Nigeria tested HIV-positive (29). Overall, however, injecting drug use remains a minor factor in most of the epidemics in the region. In Kenya, for example, it accounted for an estimated 3.8% of people newly infected with HIV in 2006 (20). ■
Botswana
Kilifi , Kenya
Mombasa, Kenya
Malawi
Namibia
Lagos, Nigeria
fi ve urban areas of Senegal
Cape Town, South Africa
Durban, South Africa
Pretoria, South Africa
Soweto, South Africa
% 10 20 30 40 50

32 Chapter 2: Epidemic update | 2010 GLOBAL REPORT
Table 2.4 AIDS statistics for Asia, 2001 and 2009
Source: UNAIDS.
Figure 2.10 HIV prevalence in AsiaHIV prevalence among adults aged 15–49 years old in Asia, 1990 to 2009.
Source: UNAIDS.
ASIA
ASIA 2009
2001
People living with HIV
4.9 million[4.5–5.5 million]
4.2 million[3.8–4.6 million]
People newly infected with HIV
360 000[300 000–430 000]
450 000[410 000–500 000]
Children living with HIV
160 000[110 000–210 000]
100 000[69 000–140 000]
AIDS-related deaths
300 000[260 000–340 000]
250 000[220 000–300 000]
No data <.1% .1% – <.5% .5% – <1% 1% – <1.5% 1.5% – 2.5%

33Chapter 2: Epidemic update | 2010 GLOBAL REPORT
2
Figure 2.11 HIV trends in Asia
Source: UNAIDS.
‘90
MIL
LIO
NS
6
5
4
3
2
1
0‘98‘91 ‘99‘92 ‘00‘93 ‘01 ‘06‘94 ‘02 ‘07‘95 ‘03 ‘08‘96 ‘04 ‘09 ‘97 ‘05
Number of people living with HIV
‘90
TH
OU
SA
ND
S
250
200
150
100
50
0‘98‘91 ‘99‘92 ‘00‘93 ‘01 ‘06‘94 ‘02 ‘07‘95 ‘03 ‘08‘96 ‘04 ‘09 ‘97 ‘05
Number of children living with HIV
‘90
TH
OU
SA
ND
S
400
300
200
100
0‘98‘91 ‘99‘92 ‘00‘93 ‘01 ‘06‘94 ‘02 ‘07‘95 ‘03 ‘08‘96 ‘04 ‘09 ‘97 ‘05
Adult and child deaths due to AIDS
‘90
TH
OU
SA
ND
S
700
600
500
400
300
200
100
0‘98‘91 ‘99‘92 ‘00‘93 ‘01 ‘06‘94 ‘02 ‘07‘95 ‘03 ‘08‘96 ‘04 ‘09 ‘97 ‘05
Number of people newly infected with HIV

34 Chapter 2: Epidemic update | 2010 GLOBAL REPORT
Asian epidemic largely stableIn Asia, an estimated 4.9 million [4.5 million–5.5 million] people were living with HIV in 2009, about the same as fi ve years earlier (Table 2.4 and Figure 2.11). Most national HIV epidemics appear to have stabilized. No country in the region has a generalized epidemic. Th ailand is the only country in this region in which the prevalence is close to 1%, and its epidemic appears to be stable overall. A resurgent epidemic in the late 1990s (when up to 60 000 people were becoming newly infected annually) has since receded. Th e adult HIV prevalence was 1.3% [0.8%–1.4%] in 2009, and the HIV incidence had slowed to 0.1% (39). In Cambodia, the adult HIV prevalence declined to 0.5% [0.4%–0.8%] in 2009, down from 1.2% [0.8%–1.6%] in 2001. But the HIV prevalence is increasing in such low-prevalence countries as Bangladesh, Pakistan (where drug injecting is the main mode of HIV transmission), and the Philippines.
New HIV infections—mixed progressTh ere were 360 000 [300 000–430 000] people newly infected with HIV in 2009, 20% lower than the 450 000 [410 000–500 000] in 2001. Incidence fell by more than 25% in India, Nepal, and Th ailand between 2001 and 2009. Th e epidemic remained stable in Malaysia and Sri Lanka during this time period.
Incidence increased by 25% in Bangladesh and Philippines between 2001 and 2009 even as the countries continue to have relatively low epidemic levels.
Epidemic patterns vary—between and within countriesTh e overall trends in this region hide important variation in the epidemics, both between and within countries. In most of them, the epidemics appear sta-ble. In many countries in the region, national epidemics are concentrated in a relatively small number of provinces. In China, fi ve provinces account for just over half (53%) of the people living with HIV (40), and HIV infection levels in Indonesia’s Papua province are 15 times higher than the national average (41).
Asia’s epidemics remain concentrated largely among people who inject drugs, sex workers and their clients, and men who have sex with men. Incidence pat-terns can vary considerably in large countries such as India. About 90% of people newly infected with HIV in India are believed to have acquired it during unprotected sex, but the common use of contaminated injecting equipment by two or more people on the same occasion is the main mode of HIV transmission in the country’s north-eastern states (42).
Sex work—central to the region’s epidemicsPaid sex features centrally in the region’s HIV epidemics. In some countries such as Viet Nam, condom use during commercial sex is infrequent. Further, the peo-ple who inject drugs in some countries are also buying or selling sex. Almost one in fi ve (18%) surveyed female sex workers in Myanmar tested HIV-positive in the mid-2000s. In southern India, up to 15% of female sex workers were living with HIV (43). Th e Indian state of Karnataka has shown evidence that intensive HIV prevention eff orts among female sex workers can be highly eff ective. A four-year prevention programme in 18 of the state’s 27 districts almost halved HIV preva-lence among young antenatal clinic attendees (from 1.4% to 0.8%) (44).
ASIA
“HIV PREVALENCE IS INCREASING IN LOW-
PREVALENCE COUNTRIES SUCH AS PAKISTAN, WHERE DRUG
INJECTING IS THE MAIN MODE OF HIV TRANSMISSION.”

35Chapter 2: Epidemic update | 2010 GLOBAL REPORT
2
Injecting drug use—fuelling new epidemicsIt is estimated that as many as 4.5 million people in Asia inject drugs, more than half of whom live in China (38). India, Pakistan, and Viet Nam also have large numbers of people who inject drugs. In Asia, on average, an estimated 16% of the people who inject drugs are living with HIV, although the prevalence is considerably higher in some countries. In studies in Myanmar, up to 38% of the people who inject drugs have tested HIV-positive; this is estimated to be 30%–50% in Th ailand and more than half in parts of Indonesia (41,45,46). In Viet Nam, between 32% and 58% of people who inject drugs are living with HIV in various provinces (47–49). In China, an estimated 7%–13% of the people who inject drugs are living with HIV (40).
Men who have sex with men—marginalized but not marginal to the growth of the epidemicHigh HIV prevalence among men who have sex with men has been reported in several countries: 29% in Myanmar (50), 5% nationally in Indonesia (41), 6% in the Laotian capital of Vientiane (51), between 7% and 18% in parts of southern India (52), and 9% in rural parts of Tamil Nadu state in India (53). Th e epidemic among men who have sex with men in Th ailand had been largely ignored until a study uncovered 17% prevalence in Bangkok in 2005. Subsequent studies in 2005 and 2007 found that the infection levels had risen to 28% and 31% (54), and an annual HIV incidence of 5.5% was recorded in 2008 (55).
Surveys have also found rising HIV prevalence in China among men who have sex with men, including in Shandong (56) and Jiangsu provinces (57) and in the city of Beijing (58). Although studies in Asia suggest that a signifi cant proportion of men who have sex with men also have sex with women (51), the risk of living with HIV appears to be much higher for men who only have sex with men (56,59).
As the epidemics mature in Asia, HIV is spreading more widely, especially to the female partners of people who inject drugs and the clients of sex workers and their other sex partners. In Asia overall, women account for a growing propor-tion of HIV infections: from 21% in 1990 to 35% in 2009.
New HIV infections among childrenTh e estimated number of children younger than 15 years living with HIV has increased marginally, from 140 000 [92 000–190 000] in 2005 to 160 000 [110 000 –210 000] in 2009. But decreasing HIV incidence and slowly widening access to services that prevent mother-to-child transmission of HIV have led to a steep drop in the number of children becoming newly infected. An estimated 22 000 [15 000–31 000] children aged 0–14 years became infected in 2009—a 15% decrease on the 1999 estimate of 26 000 [18 000–38 000]. AIDS-related deaths in this age group have declined by 15% since 2004, from 18 000 [11 000–25 000] to 15 000 [9000–22 000].
AIDS-related mortality stableTh e number of deaths has stabilized in Asia, but there are no indications of a decline. Th ere were an estimated 300 000 [260 000–340 000] AIDS-related deaths in 2009 compared with 250 000 [220 000–300 000] in 2001. ■

36 Chapter 2: Epidemic update | 2010 GLOBAL REPORT
Table 2.5 AIDS statistics for Eastern Europe and Central Asia, 2001 and 2009
Source: UNAIDS.
Figure 2.12 HIV prevalence in Eastern Europe and Central Asia HIV prevalence among adults aged 15–49 years old in Eastern Europe and Central Asia, 1990 to 2009.
Source: UNAIDS.
EASTERN EUROPE AND CENTRAL ASIA
EASTERN EUROPE + CENTRAL ASIA
2009
2001
People living with HIV
1.4 million[1.3–1.6 million]
760 000[670 000–890 000]
People newly infected with HIV
130 000[110 000–160 000]
240 000[210 000–300 000]
Children living with HIV
18 000[8600–29 000]
4000[2000–6100]
AIDS-related deaths
76 000[60 000–95 000]
18 000[14 000–23 000]
No data <.1% .1% – <.5% .5% – <1% 1% – <2% 2% – 5%

37Chapter 2: Epidemic update | 2010 GLOBAL REPORT
2
Figure 2.13 HIV trends in Eastern Europe and Central Asia
Source: UNAIDS.
‘90
MIL
LIO
NS
2.0
1.5
1.0
.5
0
‘98‘91 ‘99‘92 ‘00‘93 ‘01 ‘06‘94 ‘02 ‘07‘95 ‘03 ‘08‘96 ‘04 ‘09 ‘97 ‘05
Number of people living with HIV
‘90
TH
OU
SA
ND
S
30
25
20
15
10
5
0‘98‘91 ‘99‘92 ‘00‘93 ‘01 ‘06‘94 ‘02 ‘07‘95 ‘03 ‘08‘96 ‘04 ‘09 ‘97 ‘05
Number of children living with HIV
‘90
TH
OU
SA
ND
S
100
75
50
25
0‘98‘91 ‘99‘92 ‘00‘93 ‘01 ‘06‘94 ‘02 ‘07‘95 ‘03 ‘08‘96 ‘04 ‘09 ‘97 ‘05
Adult and child deaths due to AIDS
‘90
TH
OU
SA
ND
S
350
300
250
200
150
100
50
0‘98‘91 ‘99‘92 ‘00‘93 ‘01 ‘06‘94 ‘02 ‘07‘95 ‘03 ‘08‘96 ‘04 ‘09 ‘97 ‘05
Number of people newly infected with HIV

38 Chapter 2: Epidemic update | 2010 GLOBAL REPORT
Th e largest regional increase in HIV prevalenceIn Eastern Europe and Central Asia, the number of people living with HIV has almost tripled since 2000 and reached an estimated total of 1.4 million [1.3 million–1.6 million] in 2009 compared with 760 000 [670 000–890 000] in 2001 (Table 2.5 and Figure 2.13). A rapid rise in HIV infections among people who inject drugs at the turn of the century caused the epidemic in this region to surge.
Overall, the HIV prevalence is 1% or higher in two countries in this region, the Russian Federation and Ukraine, which together account for almost 90% of newly reported HIV diagnoses.
At 1.1% [1.0%–1.3%], the adult HIV prevalence in Ukraine is higher than in any other country in all of Europe and Central Asia (60). Annual HIV diagnoses in Ukraine have more than doubled since 2001.
Th e HIV epidemic in the Russian Federation also continues to grow, but at a slower pace than in the late 1990s. Newly reported HIV cases have increased in several of the countries in Central Asia, including Uzbekistan, which has the largest epidemic in Central Asia (61).
Concentrated epidemics—sex work, drug use and sex between men linkedTh e HIV epidemics in Eastern Europe and Central Asia are concentrated mainly among people who inject drugs, sex workers, their sexual partners and, to a much lesser extent, men who have sex with men. An estimated one quarter of the 3.7 million people (most of whom are men) who inject drugs in the region are living with HIV (38). In the Russian Federation, more than one third (37%) of the country’s estimated 1.8 million people who inject drugs are believed to be living with HIV (38), compared with between 39% and 50% in Ukraine (60). Surveys among people who inject drugs in 2007 found HIV prevalence as high as 88% (in the city of Kryvyi Rih) (62).
High HIV prevalence has also been found in prison populations, especially among incarcerated people who inject drugs (63). An estimated 10 000 prison-ers are living with HIV in Ukraine (60).
Th e interplay between sex work and injecting drug use is accelerating the spread of HIV in the region. At least 30% of sex workers in the Russian Federation, for example, have injected drugs (64), and the high HIV infection levels found among sex workers in Ukraine (14% to 31% in various studies) (60) are almost certainly due to the overlap of paid sex with injecting drug use.
Because most people who inject drugs are sexually active, sexual transmission of HIV has increased in older epidemics such as that in Ukraine, making these more challenging to manage (65). As the epidemic spreads from (predomi-nantly male) people who inject drugs to their sexual partners, the proportion of women living with HIV is also growing. By 2009, an estimated 45% of the people living with HIV in Ukraine were women, compared with 41% in 2004
EASTERN EUROPE AND CENTRAL ASIA
200%The number of people living
with HIV in Eastern Europe and Central Asia has almost
tripled since 2000.

39Chapter 2: Epidemic update | 2010 GLOBAL REPORT
2
and 37% in 1999. Diff erent people using the same contaminated injecting equipment within a short time frame remains a core driver of these epidemics. An estimated 35% of women living with HIV probably acquired HIV through injecting drug use, while an additional 50% were probably infected by partners who inject drugs (61,66).
Unprotected sex between men is responsible for a small share of new infections in the region—less than 1% of people newly diagnosed with HIV infection for whom the route of transmission was identifi ed (67). Nevertheless, offi cial data may underplay the actual extent of infection in this highly stigmatized popula-tion (68). In small surveys, the HIV prevalence among men who have sex with men has ranged from zero in Belarus, Lithuania and parts of Central Asia to 5% in Georgia (69), 6% in the Russian Federation (70) and between 4% (in Kyiv) and 23% (in Odessa) in Ukraine (60).
AIDS-related mortalityAIDS-related deaths continue to rise in the region. Th ere were an estimated 76 000 [60 000–95 000] AIDS-related deaths in 2009 compared with 18 000 [14 000–23 000] in 2001, a four-fold increase during this period. ■
“AS THE EPIDEMIC SPREADS FROM PREDOMINANTLY MALE POPULATIONS WHO INJECT DRUGS TO THEIR SEXUAL PARTNERS, THE PROPORTION OF WOMEN LIVING WITH HIV IS ALSO GROWING.”

40 Chapter 2: Epidemic update | 2010 GLOBAL REPORT
Table 2.6 AIDS statistics for the Caribbean, 2001 and 2009
Source: UNAIDS.
Figure 2.14 HIV prevalence in the Caribbean HIV prevalence among adults aged 15–49 years old in the Caribbean, 1990 to 2009.
Source: UNAIDS.
CARIBBEAN
CARIBBEAN 2009
2001
People living with HIV
240 000[220 000–270 000]
240 000[210 000–270 000]
People newly infected with HIV
17 000[13 000–21 000]
20 000[17 000–23 000]
Children living with HIV
17 000[8500–26 000]
18 000[9100–27 000]
AIDS-related deaths
12 000[8500–15 000]
19 000[16 000–23 000]
No data <.1% .1% – <.5% .5% – <1% 1% – <2% 2% – 5%

41Chapter 2: Epidemic update | 2010 GLOBAL REPORT
2
Figure 2.15 HIV trends in the Caribbean
Source: UNAIDS.
‘90
TH
OU
SA
ND
S
300
250
200
150
100
50
0‘98‘91 ‘99‘92 ‘00‘93 ‘01 ‘06‘94 ‘02 ‘07‘95 ‘03 ‘08‘96 ‘04 ‘09 ‘97 ‘05
‘90
TH
OU
SA
ND
S
30
25
20
15
10
5
0‘98‘91 ‘99‘92 ‘00‘93 ‘01 ‘06‘94 ‘02 ‘07‘95 ‘03 ‘08‘96 ‘04 ‘09 ‘97 ‘05
‘90
TH
OU
SA
ND
S
175
150
125
100
75
50
25
0‘98‘91 ‘99‘92 ‘00‘93 ‘01 ‘06‘94 ‘02 ‘07‘95 ‘03 ‘08‘96 ‘04 ‘09 ‘97 ‘05
‘90
TH
OU
SA
ND
S
25
20
15
10
5
0‘98‘91 ‘99‘92 ‘00‘93 ‘01 ‘06‘94 ‘02 ‘07‘95 ‘03 ‘08‘96 ‘04 ‘09 ‘97 ‘05
Number of people living with HIV
Number of children living with HIV
Adult and child deaths due to AIDS
Number of people newly infected with HIV

42 Chapter 2: Epidemic update | 2010 GLOBAL REPORT
High HIV prevalence but fewer people living with HIVTh e HIV prevalence among adults in the Caribbean is about 1.0% [0.9%–1.1%], which is higher than in other all regions outside sub-Saharan Africa (Table 2.5 and Figure 2.13). However, the number of people living with HIV in the Caribbean is relatively small—240 000 [220 000–270 000] in 2009—and has varied little since the late 1990s.
Th e burden of HIV varies considerably between and within countries. Th e exceptionally low HIV prevalence in Cuba (0.1% [0.08%–0.13%]) contrasts, for example, with a 3.1% [1.2%–5.4%] adult HIV prevalence in the Bahamas (64). Meanwhile, 12% of pregnant women using antenatal facilities in one of Haiti’s cities have tested HIV-positive, compared with less than 1% in the west of the country (71). In the neighbouring Dominican Republic, HIV infection levels also vary considerably, with HIV prevalence among communities near sugar plantations (the bateyes) about four times higher than the national average (72).
New HIV infections slightly decliningNew infections have slightly declined between 2001 and 2009. An estimated 17 000 [13 000–21 000] people became newly infected with HIV in 2009, about 3000 less than the 20 000 [17 000–23 000] in 2001.
Unprotected sex between men and women—especially paid sex—is believed to be the main mode of HIV transmission in this region (73,74). Th e Caribbean remains the only region, besides sub-Saharan Africa, where women and girls outnumber men and boys among people living with HIV. In 2009, an estimated 53% of people with HIV were female.
High infection levels have been found among female sex workers, including 4% in the Dominican Republic (72,76), 9% in Jamaica (77), and 27% in Guyana (78). Most countries in the region have focused their HIV prevention eff orts on paid sex.
CARIBBEAN
0.1%Estimated HIV prevalence
in Cuba, which is exceptionally low.

43Chapter 2: Epidemic update | 2010 GLOBAL REPORT
2
Unsafe sex between men is a signifi cant but largely hidden facet of the epidemics in this region, where several countries still criminalize sexual relations between men (79). One in fi ve men who have sex with men surveyed in Trinidad and Tobago were living with HIV, for example, and one in four said they regularly also had sex with women (69). In Jamaica, a study found an HIV prevalence of 32% among men who have sex with men (73). Evidence indicates increasing HIV infections among men who have sex with men in Cuba (80) and the Dominican Republic (81).
In Bermuda and Puerto Rico, unsafe injecting drug use contributes signifi -cantly to the spread of HIV. In Puerto Rico, contaminated injecting equipment accounted for about 40% of males becoming newly infected in 2006 and for 27% among females (82).
AIDS-related mortality decliningAIDS-related deaths are falling in the Caribbean. An estimated 12 000 [8500–15 000] people lost their lives due to AIDS in 2009 compared with 19 000 [16 000–23 000] deaths in 2001. ■
“THE CARIBBEAN REMAINS THE ONLY REGION, BESIDES SUB-SAHARAN AFRICA, WHERE WOMEN AND GIRLS OUTNUMBER MEN AND BOYS AMONG PEOPLE LIVING WITH HIV.”

44 Chapter 2: Epidemic update | 2010 GLOBAL REPORT
Table 2.7 AIDS statistics for Central and South America, 2001 and 2009
Source: UNAIDS.
Figure 2.16 HIV prevalence in Central and South America HIV prevalence among adults aged 15–49 years old in Central and South America, 1990 to 2009.
Source: UNAIDS.
CENTRAL AND SOUTH AMERICA
CENTRAL AND SOUTH AMERICA
2009
2001
People living with HIV
1.4 million[1.2–1.6 million]
1.1 million[1.0–1.3 million]
People newly infected with HIV
92 000[70 000–120 000]
99 000[85 000–120 000]
Children living with HIV
36 000[25 000–50 000]
30 000[20 000–42 000]
AIDS-related deaths
58 000[43 000–70 000]
53 000[44 000–65 000]
No data <.1% .1% – <.5% .5% – <1% 1% – <2% 2% – 5%

45Chapter 2: Epidemic update | 2010 GLOBAL REPORT
2
Figure 2.17 HIV trends in Central and South America
Source: UNAIDS.
‘90
MIL
LIO
NS
2.0
1.5
1.0
.5
0
‘98‘91 ‘99‘92 ‘00‘93 ‘01 ‘06‘94 ‘02 ‘07‘95 ‘03 ‘08‘96 ‘04 ‘09 ‘97 ‘05
‘90
TH
OU
SA
ND
S
60
50
40
30
20
10
0‘98‘91 ‘99‘92 ‘00‘93 ‘01 ‘06‘94 ‘02 ‘07‘95 ‘03 ‘08‘96 ‘04 ‘09 ‘97 ‘05
‘90
TH
OU
SA
ND
S
140
120
100
80
60
40
20
0‘98‘91 ‘99‘92 ‘00‘93 ‘01 ‘06‘94 ‘02 ‘07‘95 ‘03 ‘08‘96 ‘04 ‘09 ‘97 ‘05
‘90
TH
OU
SA
ND
S
80
60
40
20
0‘98‘91 ‘99‘92 ‘00‘93 ‘01 ‘06‘94 ‘02 ‘07‘95 ‘03 ‘08‘96 ‘04 ‘09 ‘97 ‘05
Number of people living with HIV
Number of children living with HIV
Adult and child deaths due to AIDS
Number of people newly infected with HIV

46 Chapter 2: Epidemic update | 2010 GLOBAL REPORT
Stable epidemic—but HIV prevalence rises with high access to antiretroviral therapyTh e HIV epidemics in South and Central America have changed little in recent years (Table 2.6 and Figure 2.14). Th e total number of people living with HIV continues to grow to an estimated 1.4 million [1.2 million–1.6 million] in 2009 from 1.1 million [1.0 million–1.3 million] in 2001) due largely to the availability of antiretroviral therapy.
About one third of all people living with HIV in Central and South America live in populous Brazil, where early and ongoing HIV prevention and treatment eff orts have contained the epidemic. Th e adult HIV prevalence in Brazil has remained well under 1% for at least the past decade.
Concentrated epidemics—primarily among men who have sex with menMost of the HIV epidemics in this region are concentrated in and around net-works of men who have sex with men. Surveys conducted in groups of urban men who have sex with men have found HIV prevalence of at least 10% in 12 of 14 countries (69), including in Costa Rica (83). High rates of HIV infection have been found in networks of men who have sex with men. In fi ve Central American countries, the annual HIV incidence was 5.1% (84) among men who have sex with men, while an incidence of 3.5% has been found among men who have sex with men who attended public health clinics in Lima, Peru. Th ese rates were higher than those observed among the men who have sex with men in Europe and North America (85).
Social stigma, however, has kept many of these epidemics among men who have sex with men hidden and unacknowledged. Several countries, especially in Central America and in the Andes, continue to have fewer programmes that address the key role of unsafe sex between men in their HIV epidemics (64).
Fear of being stigmatized can compel many men who have sex with men to also have sexual relationships with women. In Central America, for example, more than one in fi ve men who said that they had sex with other men reported having had sex with at least one woman in the previous six months (84).
Stopping HIV among sex workers—investments are reaping dividendsMost countries have focused attention on preventing HIV transmission during paid sex, and there are indications that these eff orts are paying off . High condom use rates and low HIV prevalence have been reported among female sex workers in Santiago, Chile (86), El Salvador (87) and Guatemala (88).
Injecting drug use has been the other main route of HIV transmission in this region, especially in the southern cone of South America. It has been estimated that as many as 2 million people in Central and South America inject drugs and that more than one quarter of these might be living with HIV (38).
CENTRAL AND SOUTH AMERICA
1/3Proportion of the population
living with HIV in Central and South America that live
in Brazil.

47Chapter 2: Epidemic update | 2010 GLOBAL REPORT
2
As in other regions with many people who inject drugs, prisoners and detainees also have a high HIV prevalence. Close to 6% of male inmates tested at a São Paulo (Brazil) penitentiary, for example, were living with HIV (89). Such evidence has prompted some countries to move towards introducing HIV prevention services in prisons.
Meanwhile, heterosexual HIV transmission is increasing in the older epidemics in South America. When injecting drug use receded as a mode of transmis-sion in Argentina’s HIV epidemic, for example, an estimated four of fi ve new HIV diagnoses in the mid-2000s were attributed to unprotected sexual inter-course, mainly between men and women (90). Almost half (43%) of the new HIV infections in Peru are now attributed to heterosexual transmission (91), although most of those infections are believed to occur during paid and other forms of higher-risk sex.
HIV among childrenTh e number of children (younger than 15 years of age) living with HIV, how-ever, remains small in Central and South America (around 4000 children newly infected in 2009) and appears to be declining. Th is trend is occurring despite the comparatively low coverage of services for preventing the transmission of HIV to infants. At the end of 2009, 54% [39%–83%] of the pregnant women living with HIV in the region were receiving antiretroviral drugs to prevent transmission to their newborns, only slightly higher than the global coverage of 53% [40%–79%] in low- and middle-income countries (9). ■
“THE NUMBER OF CHILDREN LIVING WITH HIV REMAINS SMALL IN CENTRAL AND SOUTH AMERICA AND APPEARS TO BE DECLINING.”

48 Chapter 2: Epidemic update | 2010 GLOBAL REPORT
Table 2.8 AIDS statistics for North America and Western and Central Europe, 2001 and 2009
Source: UNAIDS.
Figure 2.18 HIV prevalence in North America and Western and Central Europe HIV prevalence among adults aged 15-49 years old in North America and Western and Central Europe, 1990 to 2009.
Source: UNAIDS.
NORTH AMERICA AND WESTERN AND CENTRAL EUROPE
NORTH AMERICA AND WESTERN AND
CENTRAL EUROPE
2009
2001
People living with HIV
2.3 million[2.0–2.7 million]
1.8 million[1.6–2.0 million]
People newly infected with HIV
100 000[73 000–150 000]
97 000[82 000–110 000]
Children living with HIV
6000[3500– 8000]
7400[4500–10 000]
AIDS-related deaths
35 000[29 000–56 000]
37 000[32 000–44 000]
No data <.1% .1% – <.5% .5% – 1% 1% – 1.5% 1.5% – 2%

49Chapter 2: Epidemic update | 2010 GLOBAL REPORT
2
Figure 2.19 HIV trends in North America and Western and Central Europe
Source: UNAIDS.
Adult and child deaths due to AIDS
‘90
TH
OU
SA
ND
S
150
125
100
75
50
25
0‘98‘91 ‘99‘92 ‘00‘93 ‘01 ‘06‘94 ‘02 ‘07‘95 ‘03 ‘08‘96 ‘04 ‘09 ‘97 ‘05
‘90
MIL
LIO
NS
3.0
2.5
2.0
1.5
1.0
.5
0
‘98‘91 ‘99‘92 ‘00‘93 ‘01 ‘06‘94 ‘02 ‘07‘95 ‘03 ‘08‘96 ‘04 ‘09 ‘97 ‘05
Number of people living with HIV

50 Chapter 2: Epidemic update | 2010 GLOBAL REPORT
AIDS is not over in the higher-income countriesTh e total number of people living with HIV in North America and Western and Central Europe continues to grow and reached an estimated 2.3 million [2.0 million–2.7 million] in 2009—30% more than in 2001 (Table 2.8, Figure 2.18).
Unprotected sex between men continues to dominate patterns of HIV transmission in North America and Western and Central Europe, although injecting drug use and unprotected paid sex also feature (especially in Mexico and parts of southern Europe).
In France, for example, men who have sex with men account for more than half the men newly diagnosed with HIV, yet they represent only 1.6% of the country’s population (92,93). Th is epidemic pattern means that men outnumber women among people living with HIV. In 2009, women comprised about 26% of the people living with HIV in North America and 29% of those in Western and Central Europe.
Resurging epidemics among men who have sex with menTh ere is strong evidence of resurgent HIV epidemics among men who have sex with men in North America and in Western Europe (94). Data from 23 European countries show that the annual number of HIV diagnoses among men who have sex with men rose by 86% between 2000 and 2006 (95).
Th e 3160 new HIV diagnoses among men who have sex with men in 2007 in the United Kingdom were the most ever reported up to that point (96). National surveillance data also show signifi cant increases in new HIV diagnoses between 2000 and 2005 among men who have sex with men in Canada, Germany, the Netherlands, Spain, and the United States of America (97). In the United States of America, new HIV infections attributed to unprotected sex between men increased by more than 50% from 1991–1993 to 2003–2006 (98). Similar trends have been reported in Canada (99).
Increases in higher-risk sexual behaviour are associated with this trend. Researchers in Catalonia (Spain), for example, have reported that one third (32%) of men who have sex with men had recently had unprotected anal sex with a casual partner (100), and surveys in Denmark and Amsterdam (the Netherlands) have reported similar fi ndings (101,102).
Th e HIV epidemics are disproportionately concentrated in racial and ethnic minorities in some countries. In the United States of America, for example, African-Americans constitute 12% of the population but accounted for 45% of the people newly infected with HIV in 2006 (98). African-American males are 6.5 times and African-American females 19 times more likely to acquire HIV compared with their Caucasian counterparts (103).
NORTH AMERICA AND WESTERN AND CENTRAL EUROPE
3160Number of new HIV diagnoses among men who have sex with
men in 2007 in the UK, the most ever reported up to that point.

51Chapter 2: Epidemic update | 2010 GLOBAL REPORT
2
In Canada in the mid-2000s, aboriginal people comprised 3.8% of the popula-tion but accounted for 8% of the cumulative people living with HIV and 13% of the people newly infected annually. Two thirds (66%) of the people newly infected inject drugs (99).
Rates of new infections among people who inject drugs have been falling overall—largely due to harm-reduction services. In the Netherlands (67) and Switzerland (98), for example, HIV infections due to ‘social’ drug using—several people using the same contaminated injecting equipment—have almost been eliminated: at most 5% of new infections (in 2008 and 2007, respectively) were attributable to injecting drug use.
Th e epidemic is also declining among people who inject drugs in North America. Fewer than 10 000 people who inject drugs contracted HIV in 2006 in the United States of America, for example, one third as many as in 1984–1986.
Multiple use by diff erent people of contaminated drug-injecting equipment can still dramatically accelerate an HIV epidemic, as Estonia has discovered. Hardly any people newly infected with HIV were detected there a decade ago; within a few years, a majority of the surveyed people who inject drugs (72% in one survey) were living with HIV (38).
Th ere are also fl ashpoints along the border between Mexico and the United States of America where intersecting networks of drug use and paid sex appear to be driving the spread of HIV. Studies have found an HIV prevalence of 12% among female sex workers who inject drugs in Ciudad Juarez and Tijuana (104) and 3% among other people who inject drugs (105) in Tijuana. Th ese localized epidemics have considerable potential for growth. In a large study among preg-nant women in Tijuana, for example, the HIV prevalence was 1%, and among those who used drugs it was 6% (106).
Immigrants living with HIV have become a growing feature of the epidemics in several countries in Europe. Heterosexual transmission accounts for about half of the people newly infected with HIV in Central Europe (67), but many of these people were infected abroad (mostly in sub-Saharan Africa, the Caribbean, and Asia).
In the United Kingdom, about 44% of the people newly infected with HIV in 2007 had acquired HIV abroad, mainly in sub-Saharan Africa (96). Overall in Europe, almost one in fi ve (17%) people newly diagnosed with HIV in 2007 were from countries with generalized epidemics (107). ■
19xIncrease in likelihood that African-American females will aquire HIV, compared to their Caucasian counterparts, in the United States.

52 Chapter 2: Epidemic update | 2010 GLOBAL REPORT
Table 2.9 AIDS statistics for the Middle East and North Africa, 2001 and 2009
Source: UNAIDS.
Figure 2.20HIV prevalence in Middle East and North Africa HIV prevalence among adults aged 15–49 years old in Middle East and North Africa, 1990 to 2009.
Source: UNAIDS.
MIDDLE EAST AND NORTH AFRICA
MIDDLE EAST AND NORTH AFRICA
2009
2001
People living with HIV
460 000[400 000–530 000]
180 000[150 000–210 000]
People newly infected with HIV
75 000[61 000–92 000]
36 000[32 000– 42 000]
Children living with HIV
21 000[13 000–28 000]
7100[3800–13 000]
AIDS-related deaths
24 000[20 000–27 000]
8300[6300–11 000]
No data <.1% .1% – <.5% .5% – <1% 1% – <1.5% 1.5% – 3%

53Chapter 2: Epidemic update | 2010 GLOBAL REPORT
2
Figure 2.21 HIV trends in the Middle East and North Africa
Source: UNAIDS.
‘90
TH
OU
SA
ND
S
600
500
400
300
200
100
0‘98‘91 ‘99‘92 ‘00‘93 ‘01 ‘06‘94 ‘02 ‘07‘95 ‘03 ‘08‘96 ‘04 ‘09 ‘97 ‘05
Number of people living with HIV
‘90
TH
OU
SA
ND
S
30
25
20
15
10
5
0‘98‘91 ‘99‘92 ‘00‘93 ‘01 ‘06‘94 ‘02 ‘07‘95 ‘03 ‘08‘96 ‘04 ‘09 ‘97 ‘05
Number of children living with HIV
‘90
TH
OU
SA
ND
S
30
25
20
15
10
5
0
‘98‘91 ‘99‘92 ‘00‘93 ‘01 ‘06‘94 ‘02 ‘07‘95 ‘03 ‘08‘96 ‘04 ‘09 ‘97 ‘05
Adult and child deaths due to AIDS
‘90
TH
OU
SA
ND
S
100
80
60
40
20
0‘98‘91 ‘99‘92 ‘00‘93 ‘01 ‘06‘94 ‘02 ‘07‘95 ‘03 ‘08‘96 ‘04 ‘09 ‘97 ‘05
Number of people newly infected with HIV

54 Chapter 2: Epidemic update | 2010 GLOBAL REPORT
Increasing HIV prevalence, new HIV infections and AIDS-related deathsAn estimated 460 000 [400 000–530 000] people were living with HIV in the Middle East and North Africa at the end of 2009, up from 180 000 [150 000–200 000] in 2001 (Table 2.9 and Figure 2.20). Th e number of people newly infected has also increased over the last decade. Th ere were 75 000 [61 000–92 000] people newly infected in 2009, more than twice the number (36 000 [32 000–42 000]) in 2001. AIDS-related deaths have nearly tripled: from 8300 [6300–11 000] in 2001 to 23 000 [20 000–27 000] at the end of 2009.
Reliable data on the epidemics in the Middle East and North Africa remain in short supply, creating diffi culty in tracking recent trends with confi dence. Th e available evidence points to increases in HIV prevalence, new HIV infections, and AIDS-related deaths.
Th e HIV prevalence is low—with the exceptions of Djibouti and southern Sudan, where HIV is spreading in the general population, and pregnant women using antenatal services have a HIV prevalence of more than 1%.
Th e Islamic Republic of Iran is believed to have the largest number of people who inject drugs in the region, and its HIV epidemic is centred mainly within this population group. An estimated 14% of people who inject drugs country-wide were living with HIV in 2007 (108).
Th e extremely high prevalence of hepatitis C virus (80%) found among detained people who inject drugs in Tehran (109) indicates considerable potential for the spread of HIV among and beyond people who inject drugs. It has been esti-mated that close to half (45%) of the Iranian prison population is incarcerated for drug-related off ences (110,111). Exposure to contaminated drug-injecting equipment features in the epidemics of Algeria, Egypt, Lebanon, the Libyan Arab Jamahiriya, Morocco, Oman, the Syrian Arab Republic, and Tunisia.
MIDDLE EAST AND NORTH AFRICA
80%Prevalence of hepatitis C
virus among detained people who inject drugs in Tehran.

55Chapter 2: Epidemic update | 2010 GLOBAL REPORT
2
Men who have sex with men disproportionately aff ectedSex between men is heavily stigmatized in this region and is a punishable off ence in many countries. HIV services for men who have sex with men tend to be limited (112). Evidence indicates that men who have sex with men bear a disproportionate share of the HIV burden in at least some countries.
In surveys in Sudan, 8%–9% of men who have sex with men were living with HIV (70), compared with 6% in Egypt (113). As in other regions, many men who have sex with men also have sex with women (114).
Sex work networks exist but have low HIV prevalenceTh e available evidence suggests that HIV transmission is still limited in paid sex networks. When surveyed in 2006, about 1% of female sex workers in Egypt were living with HIV (113), compared with an estimated 2%–4% in Algeria, Morocco and Yemen (112). Th ere are not enough data to determine the extent to which HIV is being transmitted to sex workers’ male clients and other sex partners and to their respective partners. ■
“SEX BETWEEN MEN IS HEAVILY STIGMATIZED IN THE MIDDLE EAST AND NORTH AFRICA AND IS A PUNISHABLE OFFENCE IN MANY COUNTRIES.”

56 Chapter 2: Epidemic update | 2010 GLOBAL REPORT
Table 2.10 AIDS statistics for Oceania, 2001 and 2009
Source: UNAIDS.
Figure 2.22HIV prevalence in Oceania HIV prevalence among adults aged 15–49 years old in Oceania, 1990 to 2009.
Source: UNAIDS.
OCEANIA
OCEANIA 2009
2001
People living with HIV
57 000[50 000–64 000]
28 000[23 000–35 000]
People newly infected with HIV
4500[3400–6000]
4700[3800–5600]
Children living with HIV
3100[1500– 4800]
<1000[<500–1600]
AIDS-related deaths
1400[<1000–2400]
<1000[<500–1100]
No data <.1% .1% – .5% .5% – <1% 1% – <1.5% 1.5% – 2%

57Chapter 2: Epidemic update | 2010 GLOBAL REPORT
2
Figure 2.23 HIV trends in Oceania
Source: UNAIDS.
‘90
TH
OU
SA
ND
S
80
60
40
20
0
‘98‘91 ‘99‘92 ‘00‘93 ‘01 ‘06‘94 ‘02 ‘07‘95 ‘03 ‘08‘96 ‘04 ‘09 ‘97 ‘05
‘90
TH
OU
SA
ND
S
5
4
3
2
1
0‘98‘91 ‘99‘92 ‘00‘93 ‘01 ‘06‘94 ‘02 ‘07‘95 ‘03 ‘08‘96 ‘04 ‘09 ‘97 ‘05
‘90
TH
OU
SA
ND
S
8
6
4
2
0‘98‘91 ‘99‘92 ‘00‘93 ‘01 ‘06‘94 ‘02 ‘07‘95 ‘03 ‘08‘96 ‘04 ‘09 ‘97 ‘05
‘90
TH
OU
SA
ND
S
2.5
2.0
1.5
1.0
.5
0‘98‘91 ‘99‘92 ‘00‘93 ‘01 ‘06‘94 ‘02 ‘07‘95 ‘03 ‘08‘96 ‘04 ‘09 ‘97 ‘05
Number of people living with HIV
Number of children living with HIV
Adult and child deaths due to AIDS
Number of people newly infected with HIV

58 Chapter 2: Epidemic update | 2010 GLOBAL REPORT
HIV epidemic begins to stabilizeTh e HIV epidemic in Oceania is small, but the number of people living with HIV in this region nearly doubled between 2001 and 2009—from 28 000 [23 000–35 000] to 57 000 [50 000–64 000] (Table 2.10 and Figure 2.22). However, the number of people newly infected with HIV has begun to decline from 4700 [3800–5600] in 2001 to 4500 [3400–6000] in 2009.
Th e HIV epidemic in Papua New Guinea is the largest and the only generalized one in this region. Recent analysis of available data across the country shows that the epidemic is starting to level off . Th e national adult HIV prevalence in 2009 was estimated at 0.9% [0.8%–1.0%], with about 34 000 [30 000–39 000] people living with HIV. Th e estimates were calculated using data from antenatal clinics in all parts of Papua New Guinea that off er HIV testing to pregnant women as part of routine care. Programmes that aim to prevent mother-to-child transmission of HIV substantially increased the number of sites providing testing services to women during recent years, from 17 in 2005 to 178 in 2009, also resulting in more information available for the estimation process.
Sexual transmission promotes HIV epidemicsTh e HIV epidemics in Oceania are mainly driven by sexual transmission. Unprotected heterosexual intercourse is the main mode of transmission in Papua New Guinea, whereas unprotected sex between men predominates in the epidemics of the smaller Pacifi c countries and in those of Australia and New Zealand (115).
As in many other high-income countries with older HIV epidemics, new HIV diagnoses have increased among men who have sex with men in Australia and New Zealand in the past decade. Th e trend may point to increased higher-risk sexual behaviour in this population group (116,117).
A lack of survey data creates diffi culty in determining the role of commercial sex work in Papua New Guinea’s epidemic, but paid sex appears to be com-monplace among mobile populations, including migrant workers, transport workers, and military personnel (118).
OCEANIA
“THE HIV EPIDEMIC IN PAPUA NEW GUINEA IS THE LARGEST AND THE
ONLY GENERALIZED ONE IN OCEANIA.”
161From 2005 to 2009, increase
in number of testing sites with programmes that aim to prevent mother-to-child
transmission of HIV.

59Chapter 2: Epidemic update | 2010 GLOBAL REPORT
2
Injecting drug use—a small but signifi cant factorInjecting drug use is a minor factor in the epidemics in this region. But in parts of Australia, it features prominently in the HIV epidemic among aboriginal people. HIV infection among Aboriginal and Torres Strait Islander people was attributed to injecting drug use in 22% of cases over the past fi ve years (117). However, in French Polynesia and Melanesia (excluding Papua New Guinea), people who inject drugs comprise 12% and 6%, respectively, of cumulative HIV case reports (115).
Children newly infected—Papua New Guinea has most of the burdenMother-to-child transmission of HIV is a signifi cant factor only in Papua New Guinea’s epidemic, where nearly 10% of all people newly diagnosed with HIV to date acquired it during perinatal exposure (115). ■

60 Chapter 2: Epidemic update | 2010 GLOBAL REPORT
SCORECARD: INCIDENCEChanges in the incidence rate of HIV infection, 2001 to 2009, selected countries
Increasing >25%StableDecreasing >25%Not included in analysis

61Chapter 2: Epidemic update | 2010 GLOBAL REPORT
2Increasing >25%
ArmeniaBangladeshGeorgiaKazakhstanKyrgyzstanPhilippinesTajikistan
Stable
AngolaArgentinaBelarusBeninCameroonDemocratic Republic of the CongoDjibouti FranceGermanyGhanaHaitiKenyaLesothoLithuaniaMalaysiaNigerNigeriaPanamaRepublic of MoldovaSenegalSri LankaUgandaUnited States of America
Decreasing >25%
BelizeBotswanaBurkina FasoCambodiaCentral African RepublicCongoCôte d’IvoireDominican RepublicEritreaEthiopiaGabonGuineaGuinea-BissauIndiaJamaicaLatviaMalawiMaliMozambiqueMyanmarNamibiaNepalPapua New GuineaRwandaSierra LeoneSouth AfricaSurinameSwazilandThailandTogoUnited Republic of TanzaniaZambiaZimbabwe
In the absence of a reliable diagnostic test that can directly measure the level of new HIV infections in a population, estimates of HIV incidence have been produced through modeling The map includes 60 countries for which reliable estimates of new HIV infections over time were available from the 2010 round of country-specifi c estimation using the EPP/Spectrum tools, and 3 countries for which peer-reviewed publications with incidence trends were available. The EPP/Spectrum methods estimate HIV incidence trends from HIV prevalence over time combined with the changing level of antiretroviral therapy. The criteria for including countries in this analysis were as follows. EPP fi les were available and trends in EPP were not derived from workbook prevalence estimates; prevalence data were available up to at least 2007; there were at least four time points between 2001 and 2009 for which prevalence data were available for concentrated epidemics and at least three data points in the same period for generalized epidemics; for the majority of epidemic curves for a given country, EPP did not produce an artifi cial increase in HIV prevalence in recent years due to scarcity of prevalence data points; data were representative of the country; the EPP/Spectrum–derived incidence trend was not in confl ict with the trend in case reports of new HIV diagnoses; and the EPP/Spectrum–derived incidence trend was not in confl ict with modelled incidence trends derived from age-specifi c prevalence in national survey results. For some countries with complex epidemics including multiple populations groups with different risk behaviours as well as major geographic differences, such as Brazil, China and the Russian Federation, this type of assessment is highly complex and it could not be concluded in the 2010 estimation round. UNAIDS will continue to work with countries and partners to improve the quality of available information and modeling methodologies to include HIV incidence data for additional countries in future reports.

62 Chapter 3: HIV prevention | 2010 GLOBAL REPORT
CHAPTER 3

63Chapter 3: HIV prevention | 2010 GLOBAL REPORT
3
KEY FINDINGS
■ The global incidence of HIV infection declined by 19% between 1999 (the year of peak incidence) and 2009; the decline exceeded 25% in 33 countries, including 22 countries in sub-Saharan Africa.
■ In 2009, 370 000 [230 000–510 000] children were infected with HIV through mother-to-child transmission. This is a drop of 24% from fi ve years earlier. However, rapid expansion of delivery of effective advances in preventing mother-to-child transmission is being held back by inadequate access to antenatal and postnatal services.
■ HIV prevention investments are about 22% of all AIDS spending in 106 low- and middle-income countries.
■ Globally, comprehensive and correct knowledge about HIV among both young men and young women has increased slightly since 2008—but at only 34%, the number of young people with this comprehensive knowledge is barely one third of the UNGASS target of 95%.
■ Trend analysis shows a general decline in the percentage of people who have had more than one sexual partner in the past year in sub-Saharan Africa.
■ Condom availability in places of need is increasing signifi cantly, with 25.8 million female condoms provided through international and nongovernmental funding sources in 2009. Female condom distribution increased by 10 million between 2008 and 2009.
■ Recent promising results of a tenofovir-based gel have raised hopes that an additional effective female-initiated prevention option may soon become viable.
HIV PREVENTION

64 Chapter 3: HIV prevention | 2010 GLOBAL REPORT
New HIV infections are declining globallyDedicated eff orts to promote and support combination HIV prevention are producing clear and impressive results. Th e incidence of HIV infection declined by 19% between 1999 and 2009 globally; the decline exceeded 25% in 33 countries, including 22 countries in sub-Saharan Africa. But while parts of the world experienced signifi cant and encouraging decreases in HIV incidence between 2001 and 2009, during the same period the incidence increased by more than 25% in seven countries, including fi ve in Eastern Europe and Central Asia. And HIV incidence remained stable in 23 countries between 2001 and 2009. Behaviour change is the most important factor accounting for these encouraging declines in new HIV infections in many countries. Among young people, noteworthy drops in HIV incidence have been associated with a signifi cant positive trend (for either or both sexes) in important behaviour indicators, including increased condom use, delayed sexual debut, and reductions in multiple partnerships (1).
Correct and consistent condom use has been found to be greater than 90% eff ective in preventing transmission of HIV and other sexually transmitted infections. Eleven countries reported levels of 75% or greater among either men or women for condom use at last higher-risk sex. Major successes in HIV prevention have been achieved in concentrated epidemic countries that have devoted substantial programming eff orts and funds to prevention among people at higher risk of exposure to HIV. Too oft en, however, prevention responses still do not focus on these key populations.
In 2009, 370 000 [230 000–510 000] children were infected with HIV through mother-to-child transmission (down from 500 000 [320 000–680 000] in 2001). Although this is an important achievement for the health of both mothers and infants, further rapid expansion in delivering advances in preventing mother-to-child transmission is being held back by inadequate access to antenatal and postnatal services.
Focusing HIV-prevention investments appropriatelyHIV prevention investments are about 22% of all AIDS spending in 106 low- and middle-income countries. Even with existing resources, one notable challenge to strengthening the eff ects of the response to the epidemic has been the reluctance of planners and implementers to focus prevention eff orts where they produce maximum impact. HIV prevention investments do not always fol-low epidemic patterns. In Eastern Europe and Central Asia, areas experiencing
CHAPTER 3 | HIV PREVENTION
»

65Chapter 3: HIV prevention | 2010 GLOBAL REPORT
3
primarily concentrated epidemics, 89% of HIV-prevention investments in these regions are not focused on people at higher risk, such as people who inject drugs, sex workers and their clients, and men who have sex with men. A nota-ble proportion of new infections are found among these population groups, even in countries with generalized epidemics, yet prevention spending oft en ignores this reality. For example, the proportion of HIV prevention expenditure devoted to programmes for sex workers and their clients, men who have sex with men and people who inject drugs is only 1.7% in Burkina Faso, 0.4% in Côte d’Ivoire and 0.24% in Ghana, yet the percentage of new infections in these population groups is 30%, 28% and 43%, respectively (2).
In both Kenya and Mozambique, between one quarter and one third of new HIV infections occur among people who inject drugs, men who have sex with men, and sex workers and their clients (3). Th e proportions of Kenya’s and Mozambique’s total AIDS spending directed to HIV prevention among these key populations are 0.35% and 0.25% respectively, and almost all is from inter-national sources. Spending directed specifi cally to support these populations in their response to HIV is only one hundredth of their respective share of the national epidemic (4).
Similarly, investment focused on young people oft en does not achieve an appropriate balance between the need for continued investment in HIV prevention among all young people and the need to pay particular attention to the special needs of young people at higher risk from drug use, sex work, or unprotected sex between men. For example in Asia, 90% of resources for young people are spent on low-risk youth, who represent just 5% of the people becoming infected with HIV (5).
Combination HIV prevention eff orts are bearing resultsWhere key behavioural indicators related to the risk of HIV infection—condom use, sex before age 15 years (early sexual debut) and multiple partnerships—all have positive trends, the incidence of HIV infection is markedly reduced (1).Evidence that combination HIV prevention eff orts that address the most press-ing HIV risks have decisively changed the course of the epidemic continues to accumulate. In Namibia, improvements across key knowledge and behaviour indicators—including comprehensive knowledge, age of sexual debut, engage-ment in higher-risk sex, and condom use among both males and females aged 15–24 years—were associated with declines in HIV prevalence among young people, from slightly more than 10% in 2007 to about 5% in 2009.
370KIn 2009, an estimated 370 000 children were infected with HIV through mother-to-child transmission (down from 500 000 in 2001).

66 Chapter 3: HIV prevention | 2010 GLOBAL REPORT
100
90
80
70
60
50
40
30
20
10
%
2003 20052000 2009
Young people never having had sex (15-19 years)
Males 15–24 years
Young people never having had sex (15-24 years)
Never married respondents who had sex in the last 12 months who used a condom with their last sexual partner
Condom use at last sex with a non-marital, non-cohabiting sexual partner
Condom use at last sex, among respondents who had >1 partner in the last year
Proportion of respondents who had had sex before age 15
Proportion of respondents that had >1 partner in past year
Figure 3.1
HIV prevention in Zambia, 2000-2009
Source: Zambia Sexual Behavior Survey.
100
90
80
70
60
50
40
30
20
10
%
2003 20052000 2009
Young people never having had sex (15-19 years)
Females 15–24 years
Young people never having had sex (15-24 years)
Never married respondents who had sex in the last 12 months who used a condom with their last sexual partner
Condom use at last sex with a non-marital, non-cohabiting sexual partner
Condom use at last sex, among respondents who had >1 partner in the last year
Proportion of respondents who had had sex before age 15
Proportion of respondents that had >1 partner in past year

67Chapter 3: HIV prevention | 2010 GLOBAL REPORT
3100
90
80
70
60
50
40
30
20
10
%
2003 20052000 2009
Condom use at last sex with a non-marital, non-cohabiting sexual partner
Males 25–49 years
Condom use at last sex among respondents who had >1 partner in the last year
Proportion of respondents that had >1 partner in past year
100
90
80
70
60
50
40
30
20
10
%
2003 20052000 2009
Condom use at last sex with a non-marital, non-cohabiting sexual partner
Females 25–49 years
Condom use at last sex among respondents who had >1 partner in the last year
Proportion of respondents that had >1 partner in past year

68 Chapter 3: HIV prevention | 2010 GLOBAL REPORT
Between 2001 and 2009, overall HIV incidence in Namibia decreased by more than 25%. Similar trends were also recorded in Zimbabwe. But when diff erent types of behaviour change vary—for example, when condom use increases and multiple partnerships do also, or vice versa—the eff ects of changes in reducing incidence are less easy to identify clearly.
In Zambia, HIV incidence declined by more than 25% between 2001 and 2009. Th e country has successfully increased both the age of sexual debut and abstinence among young people (6). Th e number of both young and older adults who have multiple partners has also declined. However, the proportion of men and women 15–24 years old with more than one partner in the past year who used a condom at last sex has also markedly declined.
Although fewer young men and women in Zambia are sexually active and fewer have had more than one partner in the past 12 months, condom use within this population has decreased rather than increased. For maximum eff ect, all routes to reducing the risk of sexual exposure to HIV must be pursued simultaneously (Figure 3.1).
Behaviour change and increased comprehensive correct knowledge reduces HIV incidence and prevalence in most countries with high HIV prevalenceGlobally, comprehensive and correct knowledge about HIV among both young men and young women has increased slightly since 2003—but at only 34%, the number of young people with this comprehensive knowledge is only slightly greater than one third of the UNGASS target of 95%.1 Ten countries have achieved comprehensive correct knowledge levels above 60% for either men or women 15–24 years old (Figure 3.2).
Opportunities to improve HIV prevention knowledge and behaviour still abound. Less than half of young people living in 15 of the 25 countries with the highest HIV prevalence can correctly answer fi ve basic questions about HIV and its transmission (these include Botswana, Burundi, Cameroon, Central African Republic, Chad, Congo, Cote d’Ivoire, Guinea-Bissau, Kenya, Malawi, Nigeria, South Africa, Togo, United Republic of Tanzania and Zambia). Young people aged 15–24 years old showed gradually improving knowledge about HIV in these 25 countries but still fall short of the global targets for comprehensive knowledge set in 2001.
Complex, changing, and multiple relationshipsUnderstanding the varieties and patterns of sexual relationships is a necessary element in implementing eff ective prevention programmes. In most countries, a minority of males and females report having had sex with more than one partner in the last year. Trend analysis shows a general decline in the percentage of people who had more than one partner in the past year in sub-Saharan Africa, with some exceptions, such as Botswana, Congo, South Africa and Uganda. In Uganda, men older than 25 years are increasingly
1 Limited data (nine of 41 countries) are available from Western and Central Europe, and to a lesser extent, the Middle East and North Africa (eight of 20 countries). Sub-Saharan Africa is the region with the most complete data on comprehensive knowledge of HIV, largely due to the Demographic and Health Surveys that have been undertaken in 85 countries, with major support from the United States Government together with participating countries and other funders.

69Chapter 3: HIV prevention | 2010 GLOBAL REPORT
3
Males Females
Figure 3.2Young people’s knowledge of HIVCountries with comprehensive correct knowledge of HIV exceeding 60% among people 15–24 years old.
Source: Country Progress Reports 2010.
Sweden
Saint Lucia
Tuvalu
Namibia
Cape Verde
Norway
Liberia
Belarus
Eritrea
Chile
% 10 20 30 40 50 60 70 80 90 100
Figure 3.3Multiple sexual partners in the past year, Uganda Percentage of the population (ages 15–49 years old) that have had multiple sex partners in the past year in Uganda, by sex and age group, 1989–2006.
Source: Demographic and Health Surveys and other population-based behavioural survey data.
15-24 M
25-49 M
15-49 M
15-24 F
25-49 F
15-49 F
‘89
% H
IGH
ER
RIS
K S
EX
(IN
DIC
AT
OR
16
)
Y E A R
40
35
30
25
20
15
10
5
0‘97‘90 ‘98‘91 ‘99‘92 ‘00 ‘05‘93 ‘01 ‘06‘94 ‘02 ‘07‘95 ‘03 ‘08 ‘09 ‘96 ‘04

70 Chapter 3: HIV prevention | 2010 GLOBAL REPORT
reporting multiple partners, while the number of women reporting sex with more than one partner has remained fairly stable (Figure 3.3).
In 59 of the 93 countries reporting these data—including 18 of the 25 coun-tries with the highest prevalence of HIV—less than 25% of men reported sex with more than one partner in the last 12 months. A substantially larger num-ber—84 countries—reported that less than 25% of women had sex with more than one partner in the past 12 months. On average, the proportion of men who reported having had sex with more than one partner in the past year was 16 percentage points higher than among women. Ten countries reported that 26% to 50% of men had more than one partner in the past year; two countries reported that 26% to 50% of women did so.
Condom availability and condom uptake is improving
Eleven countries reported levels of 75% or greater among either men or women for condom use at last higher-risk sex—these countries include Botswana, India and South Africa. Country progress reports show that the median percentage of condom use at last sex for males with more than one partner in the past 12 months is 48% versus 38% for women. Of the 83 countries for which data are available, 32 reported 60% or greater condom use at last sex among the men who have had sex with more than one partner in the past 12 months versus 20 of 80 reporting countries among women.
Trend data from Demographic and Health Surveys show that condom use is increasing in sub-Saharan Africa. Botswana reported that at least 80% of men used a condom at last higher-risk sex; no countries reported this level of condom use for women. In contrast, 14 countries report condom use rates of 20% or less at last sex for those with more than one partner in the past year among either males or females, including the high-prevalence countries of the Democratic Republic of the Congo, Ethiopia, Malawi, Rwanda, Uganda and the United Republic of Tanzania.
In Asia, women in Cambodia, Myanmar and Th ailand and men in Timor-Leste reported lower than 25% condom use at last higher-risk sex. Th e other coun-tries in Asia showed higher rates of condom use at last higher-risk sex or did not report on this indicator. Of the countries reporting this indicator in Eastern Europe and Central Asia, most reported between 51% and 80% using a condom at last higher-risk sex.
Reports of condom use by sex workers at last sex with a client are encouraging. Of 86 countries providing data, 26 reported that 90% or more of sex workers report having used a condom with their last client, with another 13 countries reporting condom use levels from 80% to 90%. At the same time, 47 countries—more than half of those reporting—report rates of condom use by sex workers with their last client below 80%, including less than 60% in 17 countries. Greater condom promotion eff orts are needed to increase the levels of usage of this tech-nology for protection against HIV by sex workers and their clients.Th e availability of female condoms in places of need is signifi cantly increasing,
75%Level of condom use
in risky sex by men and women reported
by 11 countries

71Chapter 3: HIV prevention | 2010 GLOBAL REPORT
3
70
60
50
40
30
20
10
02006 2007 20082004 2009
Figure 3.4Harm reduction programmes and HIV prevalence in Ukraine Association between harm reduction programmes and HIV prevalence in Ukraine, 2004–2009.
Sources: Country Progress Reports 2010. M Mahy, C Chhea, T Saliuk, O Varetska, R Lyerla (2010). A proxy measure for HIV incidence among populations at increased risk to HIV Vol 2(1):8, Journal of HIV/AIDS Surveillance and Epidemiology.
Recent Initiators
Young IDUs (15-24) HIV prevalence
IDUs HIV prevalence(15 cities, mean)
Coverage of harm reduction sites(right axis)
Coverage of harm reduction sites (15-24) (right axis)
Ukraine—significant strides in protecting people who use drugs from HIV infection
For many years, Ukraine has had the most severe HIV epidemic among people who inject drugs in Eastern Europe and Central Asia. However, four years of comprehensive, sustained funding for and implementation of evidence-based harm reduction programming have helped reduce the HIV incidence among people who inject drugs in Ukraine. Data from multiple sources, from behavioural surveillance, sentinel surveys and programmes serving people who inject drugs all indicate that HIV transmission among people who inject drugs in Ukraine appears to be signifi cantly decreasing. HIV infections among people who started injecting drugs in only the past two years (and are thus more likely to represent incident infections rather than ones acquired much earlier) decreased from a peak of 30% in 2004 to 11% in 2008 (14).
Behavioural surveillance in Ukraine shows that people who inject drugs are increasingly adapting key HIV risk-reduction measures. The percentage of people who inject drugs who report using sterile injecting equipment at last injection rose from 80% in 2006 to 86% in 2008. In 2009, about 4600 people who inject drugs were accessing opioid substitution therapy at any time (15). Although the HIV epidemic among people who inject drugs in Ukraine has stabilized, they remain at high risk of acquiring HIV, whether by sharing contaminated equipment or through the sexual transmission of HIV from people who inject drugs to their partners (Figure 3.4).
30000
25000
20000
15000
10000
5000
0
PE
RC
EN
T
PE
OP
LE

72 Chapter 3: HIV prevention | 2010 GLOBAL REPORT
Figure 3.5Availability of sterile injecting equipment, 2010 Global estimates of the availability of sterile injecting equipment per person who uses drugs per year, 2010.
Source: Mathers BM, Degenhardt L, Ali H, Wiessing L, Hickman M, Mattick R, et al. HIV prevention, treatment and care for people who inject drugs: A systematic review of global, regional and national coverage. The Lancet 2010;375:1014-28.
>0-20 needles-syringes per IDU per year20-50 needles-syringes per IDU per year50-100 needles-syringes per IDU per year>100 needles-syringes per IDU per yearNSP present but coverage data not availableNSP absentNo reports of IDUNo data available
with 25.8 million condoms provided through international and nongovern-mental funding sources in 2009, as opposed to 10.7 million condoms fi nanced through these sources in 2006. Between 2008 and 2009 alone, female condom distribution increased by 10 million. Global distribution of female condoms, however, still lags far behind that of male condoms.
HIV prevention eff orts focused on people who inject drugsAn estimated 15.9 million [11.0 million–21.2 million] people inject drugs worldwide; of these, nearly 20%, an estimated 3 million [500 000–5.5 million] are living with HIV (12)(Table 3.1). Access to HIV prevention services, including harm-reduction programmes assisting people who use drugs, has increased, but not at the required scale. Globally, the median coverage of HIV prevention services was 32%. Although both men and women who inject drugs experience a signifi cant burden of HIV disease, infection with other

73Chapter 3: HIV prevention | 2010 GLOBAL REPORT
3
Table 3.1Countries in which HIV infections among people who inject drugs represent 20% or more of the total number of people living with HIV
Source: Mathers et al. (12), UNAIDS, European Centre for Disease Prevention and Control/WHO Regional Offi ce for Europe: HIV/AIDS surveillance in Europe 2009.
Azerbaijan ArmeniaBelarusCanada ChinaEstonia GeorgiaIndonesiaIran (Islamic Republic of)ItalyKazakhstanKyrgyzstanLatviaLithuaniaMalaysiaMoldovaPakistanPortugalRussian FederationSpainTajikistanUkraineUnited States of AmericaUzbekistan
bloodborne viruses and also potentially life-threatening conditions such as tuberculosis, women who inject drugs face even greater risks. Studies indicate that women who inject drugs are more likely to face violence and greater levels of stigma and are more likely to die earlier (13).
Making injecting safer for people who use drugs by providing sterile equipment is relatively easy and inexpensive and can signifi cantly reduce levels of HIV transmission. Half of the 50 countries that report data about the use of safe injec-tion equipment estimate that 80% or more of the people who inject drugs used a sterile needle at last injection. In Eastern Europe and Central Asia, where the HIV epidemics are primarily driven by injecting drug use, fi ve of nine coun-tries (Belarus, the Republic of Moldova, the Russian Federation, Ukraine and Uzbekistan) reported in 2009 that more than 80% of people who inject drugs used sterile injecting equipment at last injection. Eight of 12 countries reporting in South and South-East Asia report rates of sterile needle usage at last injection exceeding 80%. In Central and South America, Argentina reports more than 80% using a sterile needle at last injection (most other countries do not report on this indicator). In Oceania, Australia reports more than 80% using a sterile needle at last injection (other countries not reporting).
In North America and Europe, 10 countries report exceeding 80% usage of sterile equipment and nine below. In the Middle East and North Africa, all three reporting countries had levels below 80%. In the other regions, a large majority of countries did not report on this indicator.
According to WHO, UNODC and UNAIDS target-setting guidelines (16), the availability of fewer than 100 syringes per person who injects drugs per year is considered low, 100–200 medium, and more than 200 high. In addition to the survey data on the extent to which sterile needles were used at the most recent injection, Figure 3.5 illustrates that the number of sterile needles made available per estimated person who injects drugs is very low.
Men who have sex with men—a key population still needing supportAccess to HIV prevention programmes and services for men who have sex with men has increased somewhat in the past two years but remains inadequate overall (Figure 3.6). Safer sex behaviour, especially not having unprotected penetrative sex, is eff ective in protecting individuals and the larger communi-ties of men who have sex with men from HIV and other sexually transmitted infections. Data from 78 countries show that condom use by men who have sex with men was less than 50% in 24 countries, between 50% to 60% in 16 coun-tries, 60% to 80% in 28 countries and more than 80% in only seven countries: Andorra, Cambodia, Guyana, Myanmar, Panama, Suriname, and Uzbekistan. Figure 3.7 gives the median and range of the proportion of reported condom use at last sex by men who have sex with men by geographical region.
Among countries reporting to UNGASS in 2010, a global median of 42% of men who have sex with men reported receiving an HIV test and the result in the past 12 months. A man knowing his HIV-positive status can protect his health by receiving appropriate treatment early and also be encouraged through

74 Chapter 3: HIV prevention | 2010 GLOBAL REPORT
counselling and support to lessen the risk of transmitting the virus to his future partners. A man who tests HIV-negative can be supported to continue to avoid being infected. Some regions report testing rates considerably above the median, such as in Central and South America, where Argentina, El Salvador, Guyana, and Paraguay reported that more than 80% of men who have sex with men have had an HIV test and know the results in the past 12 months.
A recent survey by the Global Forum on MSM and HIV assessed the availability of and access to testing and prevention services for sexually transmitted infections and HIV among men who have sex with men in eight regions (18). Of the 17 services assessed (including sexually transmitted infection and HIV testing and counselling, HIV treatment, free condoms, mental health services, circumcision, and mass-media campaigns to reduce HIV and to reduce homophobia), only in two areas (sexually transmitted infection testing and circumcision) did a majority of respondents (only 51% in both cases) report that the services were easily accessible. Respondents also noted the many barriers to their access to services, including homophobia, stigma, criminalization of same-sex acts, policy barriers, and insensitivity or lack of awareness among health care providers.
Commercial and transactional sexHIV prevention programmes among sex workers have achieved major progress both in increasing condom use in sex work and in reducing associated HIV infections. Considerable room remains, however, to improve the availability and use of condoms among sex workers and their clients. In 27 of 87 countries, data indicate that 90% or more of sex workers report condom use with their last client. A further 17 countries report condom use by sex workers at 80% to 90%. In contrast, 17 countries report rates of less than 60%.
In countries with concentrated epidemics, HIV prevalence trends among recent initiates into sex work provide insight into the trajectory of the HIV epidemic and are a proxy measure of HIV incidence. Figure 3.8 illustrates the case of sex workers in Cambodia: HIV prevalence among those engaged in sex work for less than one year declined steadily from 2002 to 2006, tracking a decline in estimated incidence. HIV prevalence also declined among sex workers who have been working for more than two years, but prevalence remains consider-ably higher than for those more recently engaged in sex work.
In India, the Avahan programme, underway since 2003, has demonstrated signifi cant results among sex workers (19). Th e combined prevention approach of Avahan (community outreach, empowerment, condom programming and sexually transmitted infection and HIV testing services) explicitly addresses individuals with great vulnerability to HIV infection in six high-prevalence states: sex workers, men who have sex with men, people who inject drugs, and men at higher risk along key trucking routes. Recent results from an Avahan study of sex workers in Karnataka, in south India, showed that, from the time the programme was fi rst implemented, the HIV prevalence in this population declined from 20% to 16% and condom use at last client sex increased from 66% to 84% (20).
80%Argentina, El Salvador, Guyana, and
Paraguay reported that more than 80% of men who have sex with men have had an HIV test and know the
results in the past 12 months.

75Chapter 3: HIV prevention | 2010 GLOBAL REPORT
3
Figure 3.6HIV prevention programmes for selected populationsMedian coverage of HIV prevention programmes for selected population groups, 2008 and 2010.
Source: Country Progress Reports 2010.
2008
Median
Medians were not calculated where number of countries was 5 or less
2010
% 10 20 30 40 50 60
Sex workers(60 countries in 2008, 54 countries in 2010)
MSM(37 countries in 2008, 43 countries in 2010)
IDU (19 countries in 2008, 29 countries in 2010)
Figure 3.7Condom use by men who have sex with menPercentage (median and range) of men who have sex with men who used a condom at last sex by geographical region, 2010.
Source: Country Progress Reports 2010
Caribbean (n=6)
East Asia (n=3)
EECA (n=7)
Central and South America (n=13)
MENA (n=3)
North America (n=2)
Oceania (n=3)
West and Central Europe (n=20)
South and South-East Asia (n=12)
sub-Saharan Africa (n=9)
Total (n=78)
% 10 20 30 40 50 60 70 80 90 100
M E D I A N %

76 Chapter 3: HIV prevention | 2010 GLOBAL REPORT
Structural approaches to HIV prevention
Tackling the social and economic drivers of HIV risk and vulnerability can signifi cantly infl uence the epidemic if these approaches are implemented systematically.
One example of social change that could directly reduce the number of new HIV infections is reducing the violence faced by people who inject drugs. Moving beyond the availability of sterile needles and syringes and treatment programmes to reduce HIV for people who inject drugs—changes in the social, economic and policy environment can also have a marked effect. For example, an association has been observed between police violence against people who inject drugs and specifi c types of higher-risk behaviour such as using preloaded syringes. Building on this association, recent model-ling has estimated the number of HIV infections that could be averted if police violence against people who inject drugs was eliminated (Figure 3.9).
Another approach is the IMAGE Programme in South Africa, which combines microfi nance for women with gender training and community mobilization. The programme was evaluated as a randomized trial and found positive effects on household economic well-being and women’s empowerment, a 50% reduction in intimate partner violence, and reduced HIV risk behaviour among young women participants. The programme has scaled up to reach more than 12 000 women in South Africa.
Schooling for girls has the potential to reduce HIV risk. The positive effects of both school participation and HIV pro-grammes in schools on HIV-related risks have been well established (22). Age-disparate partnerships, in which young women are in relationships with men at least fi ve years older, are also associated with elevated risk of HIV infection (23). Cash transfers are emerging as a potential intervention to mitigate certain social or economic drivers of HIV vulnerability.
Several recent studies provide evidence of the effectiveness of cash transfers in educational retention and HIV prevention. In Zomba, Malawi, for example, both conditional and unconditional cash transfers for adolescent girls resulted in increased school attendance among benefi ciaries (24). Early marriage, pregnancy, and self-reported sexual activity declined notably among benefi ciaries of both types of cash transfers. According to the evidence, observed changes in self-reported sexual `account for less than half of the programme’s effects on HIV, with the rest due to a change in the risk profi le of the girls’ sexual partners (25). These results suggest that structural interventions such as cash transfers might be a promising tactic for overcoming age-disparate sex, a key driver of the epidemic in several countries.
In addition, structural approaches that strengthen solidarity and collective action `can play a critical role in enhancing resil-ience to HIV among marginalized groups, including sex workers. Avahan, the India AIDS Initiative funded by the Bill & Melinda Gates Foundation (19), has found that structural activities can be feasible and cost-effective, and can contribute to more sustainable HIV prevention when integrated into a package of prevention activities. Pathfi nder International, a key part-ner of Avahan, and its local implementing nongovernmental organization partner in Kolhapur are implementing a structural intervention that provides supported peer-led outreach, crisis response services and community mobilization to street-based sex workers, whose visibility makes them vulnerable to arrest and to violence from police, clients, and gangs (26).
Food insecurity is widespread globally (more than 1 billion people are undernourished) and forces people to use various types of coping behaviour, some of which increase the likelihood of engaging in unprotected sex, particularly sexual risk-taking among women, as they may engage in transactional sex to procure food for themselves and their children. A study, conducted in Botswana and Swaziland, showed that food insecurity was associated with inconsistent condom use with a “non-primary” partner: women reporting food insuffi ciency in the previous 12 months had 80% increased odds of selling sex for money or resources, 70% increased odds of engaging in unprotected sex and reporting lack of sexual control and 50% increased odds of intergenerational sex (27). Similarly, a study in Uganda that investigated the relationship between food insecurity and transactional sex showed the negative effects of food insecurity on control over condom use and the risk of staying in abusive relationships (28). Gender inequality, often reinforced by intergenerational sex, further weakens women’s negotiating power. A study from Nigeria reported that 35% of female sex workers said that poverty and lack of means to obtain food caused them to join the sex trade, and to engage in unprotected sex with clients (29). These associations remained even when controlling for other markers of socioeconomic status.

77Chapter 3: HIV prevention | 2010 GLOBAL REPORT
3
Figure 3.8
Condom use and HIV prevalence among sex workers in CambodiaPercentage of sex workers using condoms and HIV prevalence among broth-el-based sex workers in Cambodia by length of time involved in sex work, 1998–2007.
Source: M Mahy, C Chhea, T Saliuk, O Varetska, R Lyerla (2010). A proxy measure for HIV inci-dence among populations at increased risk to HIV Vol 2(1):8, Journal of HIV/AIDS Surveillance and Epidemiology.
Percent of sex workers reporting condom use at last sex
HIV prevalence among women working less than 2 years at brothel
HIV prevalence among women working less than 1 year at brothel
PE
RC
EN
T
Y E A R
100
90
80
70
60
50
40
30
20
10
0
‘98 ‘02‘99 ‘03 ‘06‘00 ‘04 ‘07‘01 ‘05
Figure 3.9Averting HIV infection by eliminating police beatings of people who inject drugs, UkraineHIV infections that could be averted by eliminating police beatings of people who inject drugs in three cities in Ukraine
Source: Strathdee et al 2010
Odessa
Makeevka
Kiev
0 200 400 600 800 1,000
HIV INFECTIONS AVERTED BY STRUCTURAL CHANGES
Elimination of police beatings

78 Chapter 3: HIV prevention | 2010 GLOBAL REPORT
Signifi cant strides in preventing mother-to-child transmissionPreventing mother-to-child transmission of HIV has been a fundamental advance in the AIDS response for the past decade. Infection rates among children born to mothers living with HIV have dropped signifi cantly in recent years, from 500 000 [320 000–680 000] in 2001 to 370 000 [230 000–510 000] children infected with HIV in 2009.
Several countries have advanced eff orts to prevent the mother-to-child transmission of HIV. Botswana, Namibia, South Africa and Swaziland have achieved more than 80% coverage of antiretroviral prophylaxis to prevent mother-to-child transmission. Seven other countries in sub-Saharan Africa have coverage levels of 50% to 80%. Sub-Saharan Africa as a whole achieved 54% [40%–84%] coverage. In East and Southern Africa, 68% [53%–95%] of pregnant women living with HIV received antiretroviral medication to prevent mother-to-child transmission in 2009 (up substantially from 15% in 2005). In West and Central Africa, however, coverage lags at 23% [16%–44%] (30).
Worldwide, 53% [40%–79%] of pregnant women living with HIV in low- and middle-income countries received antiretroviral medication to prevent the mother-to-child transmission of HIV in 2009, versus 45% [37%–57%] in 2008 and 15% in 2005 (31). Th e gap in reaching the target of 80% coverage of anti-retroviral prophylaxis for preventing mother-to-child transmission is becoming more concentrated in a handful of countries, with 14 countries comprising more than 80% of the global gap. Nigeria alone now contributes to 32% of the gap, with the Democratic Republic of the Congo next, contributing 7% of the gap (Figure 3.10, Figure 3.11).
Th e proportion of pregnant women in low- and middle-income countries who received an HIV test reached 26%, up from 21% in 2008 and 7% in 2005 (31)—progress, but still a low fi gure, on the path towards the UNAIDS goal of virtually eliminating the mother-to-child transmission of HIV by 2015. In the 25 countries with the greatest number of pregnant women living with HIV,2 the percentage receiving HIV testing and counselling varied greatly—from more than 95% in South Africa and Zambia to 9% in the Democratic Republic of the Congo and 6% in Chad (31).
Coverage for services for preventing mother-to-child transmission has lagged behind antenatal care access (Figure 3.12). In addition, women living with HIV continue to have a high unmet need for family planning: in some countries, more than one quarter of women living with HIV do not desire their current pregnan-cy or would like to delay their next pregnancy by two years. Strengthening family planning services and the delivery of maternal, newborn and child health care would produce better outcomes for babies and their mothers.
Th e effi cacy of antiretroviral drugs in preventing mother-to-child transmission of HIV varies with the type of regimen used and the duration over which it is given. Combination regimens which include diff erent types of antiretroviral drugs are more effi cacious than monotherapies. Monotherapies are also prone to building antiretroviral resistance in the virus, which may limit future therapeutic
2 Countries with the largest number of pregnant women living with HIV in 2009: Angola, Botswana, Burkina Faso, Burundi, Cameroon, Chad, Cote d’Ivoire, Democratic Republic of the Congo, Ethiopia, Ghana, India, Kenya, Lesotho, Malawi, Mozambique, Namibia, Nigeria, Rwanda, South Africa, Sudan, Swaziland, Uganda, United Republic of Tanzania, Zambia, Zimbabwe.

79Chapter 3: HIV prevention | 2010 GLOBAL REPORT
3
Figure 3.10
Gaps in antiretroviral therapy to prevent mother-to-child transmission Global gap in providing antiretroviral therapy to 80% of mothers to prevent mother-to-child transmission in low- and middle-income countries.
Source: WHO Towards Universal Access 2010.
Nigeria
DR Congo
India
Uganda
Ethiopia
Cameroon
Malawi
Chad
Zimbabwe
Sudan
Burundi
Angola
Mozambique
Tanzania
Other
32%
7%
6%
6%
5%
5%
3%
3%
3%
3%
3%
3%
3%
2%
16%
options when treatment is needed. According to the 2010 WHO treatment guidelines it is recommended that pregnant women living with HIV and their exposed infants receive combination therapy rather than single-dose Nevirapine. Antiretroviral prophylaxis is also recommended during breastfeeding in settings where breastfeeding is judged to be the safest infant feeding option. In addition, all women eligible for treatment under WHO guidelines should receive an appropriate combination therapy for their own health.
In the 59 low- and middle-income countries that provided disaggregated data for their prevention of mother-to-child regimens around 30% of pregnant women received single-dose Nevirapine, while 54% received a combination regimen to avoid mother-to-child transmission of HIV. About 15% of all mothers received ongoing antiretroviral therapy based on eligibility criteria for treatment. Figure 3.11 shows the distribution of regimens given for the prevention of mother-to-child transmission in 2009 for the 25 countries with the greatest number of HIV positive pregnant women. Of those countries 10 have moved from using single-dose Nevirapine to providing more effi cacious combination regimens.

80 Chapter 3: HIV prevention | 2010 GLOBAL REPORT
However, in India, Ethiopia, the Democratic Republic of Congo, Zimbabwe and Malawi over two thirds of women who were provided with antiretrovial drugs for the prevention of mother-to-child transmission were still off ered single dose Nevirapine. In these countries there is an urgent need to update the regimens in line with the global standards.
New tools to expanding eff ective HIV preventionTh e goals and targets set at the United Nations General Assembly Special Session on HIV/AIDS (UNGASS) in 2001, which emphasize increasing knowledge and behaviour change, continue to be the mainstay of HIV prevention eff orts. Since 2001, major advances in HIV prevention tools and methods have been integrated progressively into increasingly eff ective HIV prevention programmes.
Figure 3.11
Distribution of prophylactic regimens for the prevention of mother-to-child transmission
Source: Country Progress Reports 2010
Lesotho
Chad
Burundi
Burkina Faso
Angola
Côte d'Ivoire
Botswana
Nigeria
Sudan
Ghana
Rwanda
South Africa
Kenya
Cameroon
Swaziland
Zambia
Mozambique
United Republic of Tanzania
Namibia
Uganda
Malawi
Zimbabwe
Democratic Republic of the Congo
Ethiopia
India
Single-dose Nevirapine only
Prophylactic regimens using a combination of two antiretroviral drugs
Prophylactic regimens using a combination of three antiretroviral drugs
Antiretroviral drugs for HIV-infected pregnant women eligible for treatment
Other/Uncategorized
% 10 20 30 40 50 60 70 80 90 100

81Chapter 3: HIV prevention | 2010 GLOBAL REPORT
3
Figure 3.12Preventing mother-to-child transmission Coverage of antenatal care services and services for preventing mother-to-child transmission among women living with HIV in high-prevalence countries, 2010
Source: WHO and UN Statistics Division
PM
TC
T C
ov
era
ge
A N C Coverage (1 visit)
100
80
60
40
20
0
200 40 60 80 100
1
4
3713
5
8
129
6
1011
15
16
14
2
PMTCT coverage, ANC coverage and number of HIV+ pregnant women (bubble size)
1
2
3
4
Angola
Botswana
Burundi
Cameroon
Chad
Côte d’Ivoire
D.R. Congo
Ethiopia
5
6
7
8
Ghana
Kenya
Lesotho
Mozambique
Nigeria
South Africa
Uganda
Zambia
9
10
11
12
13
14
15
16
Among these are eff orts to prevent mother-to-child transmission and to promote male circumcision. On the horizon is the potential of expanded eff orts to reap the prevention benefi ts of access to antiretroviral therapy, topical uses of antiretroviral drugs in microbicides, and the potential expansion of the prophylactic use of antiretroviral drugs before exposure to HIV.
Male circumcisionTh ree clinical trials have demonstrated that adult male circumcision signifi cantly reduces the likelihood of uninfected men acquiring HIV from an HIV-infected female sex partner. UNAIDS and WHO have recommended that male circumcision be scaled up in areas of high HIV prevalence and low rates of male circumcision. A review of nine country experiences of scaling up adult male circumcision in Southern and Eastern Africa shows signifi cant roll-out in the Nyanza province of Kenya and considerable experience gained in other areas (Table 3.2).

82 Chapter 3: HIV prevention | 2010 GLOBAL REPORT
BOTSWANA
KENYA
NAMIBIA
RWANDA
SWAZILAND
UGANDA
UNITED REPUBLIC OF TANZANIA
ZAMBIA
ZIMBABWE
Number circumcised
6 180 April 2009 – March 2010 35
91 300 2009 – June 2010 (90 000 in Nyanza alone)
350 September 2009 – June 2010 3
542 October 2009 – April 2010 9
10 000 2008 – June 2010
5 340 October 2008 – March 2010
4 700 September 2009 – May 2010 3
9 906 January – June 2010 56 10 000 2009 9 179 2007 – 2008
6 070 May 2009 – April 2010 5
Time period Number of sites established
Table 3.2Scaling up male circumcisionRecent roll-out of the scaling up of adult male circumcision in nine countries.
Source: Meeting reports and presentations. Durham, NC, Clearinghouse on Male Circumcision for HIV Prevention, 2010.

83Chapter 3: HIV prevention | 2010 GLOBAL REPORT
3
THE HIV TREATMENT AND PREVENTION CONTINUUM
When the United Nations General Assembly Special Session on HIV/AIDS was held in 2001, access to antiretroviral therapy in low- and middle-income countries was in its infancy. By 2006, Member States unanimously supported goals towards universal access to HIV prevention, treatment, care and support. This commitment was underpinned by successful country experiences in accelerating access to HIV treatment.Antiretroviral therapy is now better seen as having several crucial roles in the AIDS response. This is especially true when prevention and treatment interact in synergy, for example in the prevention of mother-to-child transmission, in post-exposure prophylaxis, and in the benefi cial results from reduced viral load at both the individual and population levels in reducing the onward transmission of HIV. Trials are also underway to examine their role in pre-exposure prophylaxis.A concerted focus on bridging the gap between HIV treatment need and HIV treatment access will maximize the potential of antiretroviral therapy to contribute to secondary individual, family and population-level HIV prevention benefi ts. These secondary benefi ts will be realized where antiret-roviral therapy reaches everyone in need of treatment and where people living with HIV are able to shape HIV prevention programming in a framework of “positive health, dignity and prevention”.Treatment is not a “magic bullet” to bring HIV epidemics to a halt (35), but antiretroviral therapy as an element of combination HIV prevention programmes seems likely to have potentially signifi -cant secondary benefi ts beyond prevention programmes that do not include increased treatment access. The action agenda to build stronger prevention and treatment responses in tandem requires:
■ non-stigmatizing health services;
■ effective referral systems across HIV, tuberculosis, and sexually transmitted infection behaviour and social support services;
■ increased investment in the capacities of people living with HIV and key affected communities to organize and empower themselves; and
■ social and behavioural change communication around risk and treatment.
MicrobicidesRecent promising results of a tenofovir-based gel have raised hopes that an additional female-initiated prevention option may soon become viable. Th is landmark proof-of-concept study by the Centre for the AIDS Programme of Research in South Africa (CAPRISA) (34) found that the microbicide gel studied reduced HIV infection by 39% and herpes simplex virus-2 infection by 51% and that the gel was both safe and acceptable when used once in the 12 hours before sex and once in the 12 hours aft er sex by women aged 18–40 years.
Moving forward, based on these data, and making a safe and eff ective tenofovir gel available to women who want it will require: rapidly moving to additional trials to confi rm results; determining the requirements for the approval by national drug regulatory authorities of this new indication for tenofovir; conducting the operations research needed to determine how to deliver and sustain product supplies within combination prevention programmes; determining the frequency of HIV testing needed to ensure the safe use of the microbicide gel; and accelerating studies to expand knowledge of whether the product is safe and eff ective for women younger than 18 years of age and pregnant women. ■
“RECENT PROMISING RESULTS OF A TENOFOVIR-BASED GEL HAVE RAISED HOPES THAT AN ADDITIONAL FEMALE-INITIATED PREVENTION OPTION MAY SOON BECOME VIABLE.”

84 Chapter 3: HIV prevention | 2010 GLOBAL REPORT

85Chapter 3: HIV prevention | 2010 GLOBAL REPORT
3
ACTION ITEMS
■ HIV prevention programmes must be scaled up rapidly to change the trajectory of the epidemic.
■ Investments in HIV prevention programmes are insuffi cient and should increase. National programmes should ensure that investments are given pri-ority according to epidemic patterns to reach the populations most in need.
■ HIV prevention programmes must include a combination of behavioural, biomedical, and structural responses, and these activities should operate in synergy.
■ HIV prevention programmes should reach men who have sex with men, sex workers and their clients, transgender people, and people who inject drugs. Behaviour change and condom promotion efforts must work in tandem.
■ The virtual elimination of mother-to-child transmission of HIV is possible. Current advances in stopping new infections among children must be accel-erated by integrating services in antenatal care settings.
■ New HIV prevention methods such as male circumcision must be scaled up in countries with generalized epidemics.
■ The results from the CAPRISA microbicide gel trial hold promise for a woman-initiated and controlled HIV prevention option. The international community must fully support the next steps to confi rm the trial results at the earliest.

86 Chapter 3: HIV prevention | 2010 GLOBAL REPORT
25
25
25
25
50
50
50
50
75
75
75
75% % % %
Angola
Benin
Botswana
Burkina Faso
Burundi
Cameroon
Cape Verde
Central African Republic
Chad
Comoros
Congo
Côte d’Ivoire
Democratic Republic of Congo
Equatorial Guinea
Eritrea
Ethiopia
Gabon
Gambia
Ghana
Guinea
Guinea-Bissau
Kenya
Lesotho
Liberia
Madagascar
Malawi
Mali
Mauritania
Mauritius
Mozambique
Namibia
Niger
SCORECARD: HIV PREVENTION
SUB-SAHARAN AFRICA
Knowledge Higher risk sex Condom use Condom use by sex workers
MaleFemaleNo Data Available

87Chapter 3: HIV prevention | 2010 GLOBAL REPORT
3Nigeria
Rwanda
Sao Tome and Principe
Senegal
Seychelles
Sierra Leone
South Africa
Swaziland
Togo
Uganda
United Republic of Tanzania
Zambia
Zimbabwe
China
Democratic People’s Republic of Korea
Japan
Mongolia
Republic of Korea
Australia
Fiji
Kiribati
Marshall Islands
Micronesia, Federated States Of
Nauru
New Zealand
Palau
Papua New Guinea
Samoa
Solomon Islands
Tonga
25
25
25
25
50
50
50
50
75
75
75
75% % % %
SUB-SAHARAN AFRICA Continued
EAST ASIA
OCEANIA
Knowledge Higher risk sex Condom use Condom use by sex workers

88 Chapter 3: HIV prevention | 2010 GLOBAL REPORT
Tuvalu
Vanuatu
Afghanistan
Bangladesh
Bhutan
Brunei Darussalam
Cambodia
India
Indonesia
Lao People’s Democratic Republic
Malaysia
Maldives
Myanmar
Nepal
Pakistan
Philippines
Singapore
Sri Lanka
Thailand
Timor-Leste
Viet Nam
Armenia
Azerbaijan
Belarus
Georgia
Kazakhstan
Kyrgyzstan
Moldova
Russian Federation
Tajikistan
25
25
25
25
50
50
50
50
75
75
75
75% % % %
OCEANIAContinued
SOUTH ANDSOUTH-EAST ASIA
EASTERN EUROPE AND CENTRAL ASIA
Knowledge Higher risk sex Condom use Condom use by sex workers
SCORECARD: HIV PREVENTION
MaleFemaleNo Data Available

89Chapter 3: HIV prevention | 2010 GLOBAL REPORT
3Turkmenistan
Ukraine
Uzbekistan
Albania
Andorra
Austria
Belgium
Bosnia and Herzegovina
Bulgaria
Croatia
Cyprus
Czech Republic
Denmark
Estonia
Finland
France
Germany
Greece
Hungary
Iceland
Ireland
Israel
Italy
Latvia
Liechtenstein
Lithuania
Luxembourg
Malta
Monaco
Montenegro
Netherlands
25
25
25
25
50
50
50
50
75
75
75
75% % % %
EASTERN EUROPE AND CENTRAL ASIA Continued
WESTERN AND CENTRAL EUROPE
Knowledge Higher risk sex Condom use Condom use by sex workers

90 Chapter 3: HIV prevention | 2010 GLOBAL REPORT
Norway
Poland
Portugal
Romania
San Marino
Serbia
Slovakia
Slovenia
Spain
Sweden
Switzerland
The Former Yugoslav Republic of Macedonia
Turkey
United Kingdom of Great Britain and Northern Ireland
Canada
Mexico
United States of America
Algeria
Bahrain
Djibouti
Egypt
Iran, Islamic Republic Of
Iraq
Jordan
Kuwait
Lebanon
Libyan Arab Jamahiriya
Morocco
Oman
Qatar
25
25
25
25
50
50
50
50
75
75
75
75% % % %
WESTERN AND CENTRAL EUROPE Continued
NORTH AMERICA
MIDDLE EAST AND NORTH AFRICA
Knowledge Higher risk sex Condom use Condom use by sex workers
SCORECARD: HIV PREVENTION
MaleFemaleNo Data Available

91Chapter 3: HIV prevention | 2010 GLOBAL REPORT
3Saudi Arabia
Somalia
Sudan
Syrian Arab Republic
Tunisia
United Arab Emirates
Yemen
Antigua and Barbuda
Bahamas
Barbados
Cuba
Dominica
Dominican Republic
Grenada
Haiti
Jamaica
Saint Kitts and Nevis
Saint Lucia
Saint Vincent and the Grenadines
Trinidad and Tobago
Argentina
Belize
Bolivia
Brazil
Chile
Colombia
Costa Rica
Ecuador
El Salvador
Guatemala
25
25
25
25
50
50
50
50
75
75
75
75% % % %
MIDDLE EAST AND NORTH AFRICA Continued
CARIBBEAN
CENTRAL AND SOUTH AMERICA
Knowledge Higher risk sex Condom use Condom use by sex workers

92 Chapter 3: HIV prevention | 2010 GLOBAL REPORT
Guyana
Honduras
Nicaragua
Panama
Paraguay
Peru
Suriname
Uruguay
Venezuela
25
25
25
25
50
50
50
50
75
75
75
75% % % %
CENTRAL AND SOUTH AMERICA Continued
Knowledge Higher risk sex Condom use Condom use by sex workers
SCORECARD: HIV PREVENTION
MaleFemaleNo Data Available

93Chapter 3: HIV prevention | 2010 GLOBAL REPORT
3

94 Chapter 4: HIV treatment | 2010 GLOBAL REPORT
CHAPTER 4

95Chapter 4: HIV treatment | 2010 GLOBAL REPORT
4
KEY FINDINGS
■ An additional 1.2 million people received antiretroviral therapy in 2009, bringing the total number of people receiving treatment in low- and middle-income countries to 5.2 million, a 30% increase over 2008.
■ At the end of 2009, 36% (about 5.2 million) of the 15 million people in need in low- and middle-income countries were receiving antiretroviral therapy.
■ Fewer people are dying from AIDS-related causes. About 14.4 million life-years have been gained by providing antiretroviral therapy since 1996.
■ About 50% of pregnant women testing HIV positive were assessed for their eligibility to receive antiretroviral therapy for their own health.
■ Children and marginalized populations (such as people who inject drugs) are less likely to receive antiretroviral therapy than the population at large.
■ While steady progress is being made in scaling up access to HIV services for people with tuberculosis (TB), the percentage of people with TB who received an HIV test in 2009 remained low, at 26%. Progress in scaling up TB services for people living with HIV is also very slow.
■ Children orphaned by AIDS were nearly as likely to attend school as other children.
■ The availability of palliative and home-based care services for people living with HIV remains uneven.
HIV TREATMENT

96 Chapter 4: HIV treatment | 2010 GLOBAL REPORT
More people received antiretroviral therapy in all regions in 2009Advances toward universal access to treatment, care and support services were a signifi cant achievement in 2009, especially given the considerable challenges that accompanied the fl attening of global funding for HIV programmes in low- and middle-income countries. More people are receiving antiretroviral therapy in all regions of the world than at any previous time in the epidemic. However, progress toward universal access goals remained mixed, with substantially greater gains in some settings and on certain aspects of treatment, care, and support than in others.
As of December 2009, an estimated 5.2 million people in low- and middle-income countries were receiving antiretroviral therapy (1). Th is represented an increase of 1.2 million people, or 30%, over the number receiving such treat-ment 12 months earlier.
In sub-Saharan Africa, nearly 37% [34%–40%] of people eligible for treatment were able to access life-saving medicines in 2009. Similarly 42% [35%–47%] in Central and South America, 51% [40%–60%] in Oceania, 48% [42%–55%] in the Caribbean, and 19% [15%-21%] in Eastern Europe and Central Asia were accessing such treatment. Th e increase in the number of people receiv-ing antiretroviral therapy in 2009 was virtually even across Eastern Europe (34%), sub-Saharan Africa (33%), Asia (29%) and the Caribbean (30%). Only in Central and South America (6%), where antiretroviral therapy coverage was already high, was the rate of increase in access in 2009 signifi cantly lower.Antiretroviral therapy coverage for children is lower than that for adults; a low percentage of pregnant women were assessed for their eligibility and received antiretroviral therapy for their own health; limited data show low coverage for key populations at higher risk. Coverage needs to be more equitable.
Th e number of health facilities delivering antiretroviral therapy increased by 36% in 2009, and the average number of people receiving antiretroviral therapy per health facility rose from 260 in 2008 to 274 in 2009, according to data sub-mitted by 99 countries.
In 2010, WHO issued revised treatment guidelines (2) recommending earlier initiation of antiretroviral therapy, at a CD4 count of <350 cells/mm3. Th ese new criteria increased the total number of people medically eligible for antiret-roviral therapy by roughly 50%—from 10 million to 15 million in 2009.
CHAPTER 4 | HIV TREATMENT
»

97Chapter 4: HIV treatment | 2010 GLOBAL REPORT
4
Half or more of all adults eligible for treatment (CD4 <350 cells/mm3) were receiving antiretroviral therapy in 29 of the 109 low- and middle-income countries for which data are available by December 2009. Eight countries—Botswana, Cambodia, Croatia, Cuba, Guyana, Namibia, Romania and Rwanda —achieved antiretroviral therapy coverage of 80% or more.
Of the 19 of the 25 low- and middle-income countries with the largest number of people living with HIV, Rwanda achieved 88% coverage among adults, Botswana 83%, and Namibia 76%. Eleven countries (Cameroon, Côte d’Ivoire, Ghana, India, Indonesia, Mozambique, South Africa, Ukraine, United Republic of Tanzania, Viet Nam and Zimbabwe) had coverage of less than 40%. Indonesia and Ukraine reported less than 20% of eligible adults were receiving antiretroviral therapy (Table 4.1).
Antiretroviral therapy coverage for children is lower than that for adultsTh e number of children younger than 15 years receiving antiretroviral therapy increased by about 80 000 (or 29%) in 2009, from 275 000 to 354 000. However,
37%People in sub-Saharan Africa eligible for treatment who were able to access life-saving medicines in 2009.
KEY ELEMENTS OF WHO’S 2010 REVISION OF ANTIRETROVIRAL TREATMENT THERAPY GUIDELINES
Start antiretroviral therapy earlier: Begin antiretroviral therapy when the CD4 cell count is less than 350 cells/mm3.
Use less toxic and more patient-friendly options: Reduce the risk of adverse events and improve adherence by using less toxic drugs and fi xed-dose antiretroviral therapy combinations.
Improve management of coinfections between HIV and TB or hepatitis B: Start antiretroviral therapy in all people living with HIV who have active TB and chronic active hepatitis B disease irrespective of CD4 cell count.
Promote strategic use of laboratory monitoring: Use laboratory monitoring such as CD4 and viral load counts to improve the effi ciency and quality of HIV treatment and care.

98 Chapter 4: HIV treatment | 2010 GLOBAL REPORT
Point Estimate a Point Estimate Point Estimate
Table 4.1Treatment coverage for adults and children, 2009 (2006 and 2010 WHO guidelines)Coverage of antiretroviral therapy among adults and children in 25 countries with the most people living with HIV, 2009 based on 2006 and 2010 WHO guidelines.
Source: Country Progress Reports 2010 and UNAIDS estimates.
Botswana
Brazil b
Cameroon b
China b
Côte d’Ivoire b
Democratic Republic of the Congo
Ethiopia b
Ghana
India b
Indonesia
Kenya
Lesotho
Malawi
Mozambique
Nigeria
Russian Federation b
South Africa
Sudan b,e
Thailand
Uganda
Ukraine
United Republic of Tanzania
Viet Nam
Zambia
Zimbabwe
Low Low LowHigh High High
90%
11%
15%
12%
32%
23%
29%
14%
10%
54%
2%
18%
17%
36%
30%
83%
30%
29%
25%
21%
50%
50%
48%
32%
23%
36%
61%
43%
9%
32%
33%
68%
34%
>95%
46%
44%
40%
34%
72%
75%
72%
51%
35%
56%
75%
62%
15%
49%
44%
>95%
52%
76%
65%
8%
21%
10%
9%
14%
8%
24%
14%
22%
17%
21%
10%
7%
17%
41%
1%
73%
12%
69%
11%
54%
26%
23%
77%
50%
27%
19%
26%
15%
52%
23%
23%
14%
46%
45%
44%
29%
21%
16%
35%
49%
38%
8%
29%
25%
62%
32%
>95%
65%
40%
31%
38%
22%
72%
34%
37%
24%
64%
65%
62%
43%
30%
27%
49%
61%
54%
13%
43%
35%
84%
47%
>95%
>95%
20%
74%
30%
23%
38%
24%
59%
48%
59%
39%
51%
26%
19%
60%
94%
4%
>95%
33%
>95%
34%
>95%
65%
50%
>95%
89%
34%
38%
32%
20%
65%
29%
27%
30%
55%
54%
54%
35%
25%
23%
37%
77%
48%
10%
35%
44%
76%
37%
>95%
>95%
54%
67%
49%
32%
94%
46%
45%
58%
81%
86%
81%
59%
41%
42%
63%
95%
72%
17%
55%
55%
>95%
57%
Children d Adult Coverage 2010 Guidelines (CD4 350) C
Adult Coverage 2006 Guidelines (CD4 200) C
a Point estimates published for countries with generalized epidemics only.b Estimates of the number of people needing antiretroviral therapy are currently being reviewed and will be adjusted, as appropriate, based on ongoing data collection and analysis.c The coverage estimates are based on the estimated unrounded numbers of adults receiving antiretroviral therapy and the estimated unrounded need for antiretroviral therapy (based on UNAIDS/WHO methods). The ranges in coverage estimates are based on plausibility bounds in the denominator: that is, low and high estimates of need. The estimates are standardized for comparability according to UNAIDS/WHO methods.d The coverage estimates are based on the estimated unrounded numbers of children receiving antiretroviral therapy and the estimated unrounded need for antiretroviral therapy (based on UNAIDS/WHO methods). The ranges in coverage estimates are based on plausibility bounds in the denominator: that is, low and high estimates of need. e Data for antiretroviral therapy coverage for adults in Sudan are not available for 2009.

99Chapter 4: HIV treatment | 2010 GLOBAL REPORT
4
children continued to have less access to antiretroviral therapy than adults (28% coverage of children, compared with 37% coverage of adults).
An estimated 90% of the world’s children living with HIV reside in sub-Saharan Africa. Antiretroviral therapy coverage of children in the region is slightly below the global average, at just 26%. Among the 25 countries with the great-est number of people living with HIV, only Botswana reported antiretroviral therapy coverage of children of greater than 80% (Table 4.1).
A number of countries report sharply lower antiretroviral therapy coverage for children than for adults. Adult coverage is higher in 12 of the 14 high-burden countries for which coverage estimates for both adults and children are available. In six countries, antiretroviral therapy coverage of children is less than half that of adults, with particularly large diff erences in countries such as Cameroon (30% adults versus 11% children), Mozambique (32% versus 12%) and Uganda (43% versus 18%). By contrast, two of the 12 countries (South Africa and Botswana) report greater antiretroviral therapy coverage for children than for adults.
Very few pregnant women living with HIV receive antiretroviral therapy for their own healthAccess to services for preventing mother-child-transmission of HIV increased between 2008 and 2009, but still few pregnant women living with HIV are screened for their own health. Th e proportion of pregnant women who tested positive for HIV and were assessed for their eligibility to receive antiretroviral therapy for their own health increased from 34% to 51%. Only 15% of pregnant women living with HIV whose HIV status is detected while accessing maternal and child health services were also provided antiretroviral therapy for their own health at the same time.
In the 12 high-prevalence countries that reported on antiretroviral therapy access for pregnant women in both 2007 and 2009, the total number of women enrolled in treatment roughly doubled, from more than 18 000 to more than 37 000. In Swaziland, a major eff ort to provide antiretroviral therapy in maternal and child health settings increased the number of women beginning therapy from 259 in 2007 to 1844 in 2009.
Access to antiretroviral therapy eludes marginalized populationsFew data are available about access to antiretroviral therapy by sex workers, men who have sex with men and people who inject drugs. Most countries do not collect such data. For example, in Eastern Europe and Central Asia, only four of the 12 countries collect such data. Many countries in Asia, Central and South America and other regions report that negative attitudes on the part of health care workers oft en deter people at high risk of HIV infection from seek-ing treatment services (4). Further obstacles to antiretroviral therapy access include laws in a number of countries with sizeable populations of people born outside national borders that limit antiretroviral therapy access to citizens (5). Many prison systems limit access to antiretroviral therapy, according to country reports to UNAIDS (6).
15%15% of pregnant women living with HIV whose HIV status is detected while accessing maternal and child health services were also provided antiretroviral therapy for their own health at the same time.

100 Chapter 4: HIV treatment | 2010 GLOBAL REPORT
Of the 21 countries that have data on antiretroviral therapy coverage for people living with HIV who inject drugs, 14 countries treat 5% or fewer of all such individuals (7). In only nine countries does treatment reach more than 10% of people living with HIV who inject drugs.
Treatment retention is possible and can be achievedNew data provide strong evidence that high antiretroviral therapy retention rates are achievable. Of the countries for which data are available, 26 report that at least 95% of people are still receiving treatment one year aft er initiating anti-retroviral therapy. Of the 25 countries with the highest number of people living with HIV, Botswana, Brazil and Cameroon report that 90% or more remain on treatment 12 months aft er initiation. Ghana, India, Kenya, Lesotho, Th ailand, Uganda, Ukraine, and Viet Nam all report retaining at least 80% of people in treatment for at least one year. Sudan reports a 12-month retention rate of 56% and Chad only 47%.
One likely reason for lower treatment retention rates is initiating treatment at a late stage of HIV illness and the premature death of the treatment recipi-ent. Evidence shows that retention rates need to be improved, at least in part, through ongoing eff orts to initiate HIV treatment earlier. Long-term retention in treatment is critical for health outcomes, but many people are lost to follow-up during the fi rst year. Loss to follow-up in antiretroviral therapy programmes tends to increase over time.
In Malawi, which has rapidly scaled up antiretroviral therapy in recent years, data suggest that 70% of the people initiating treatment are still recorded as “in treatment” aft er 24 months, dropping to about 55% aft er 48 months (Figure 4.1). In Burundi and the Central African Republic, the 48-month retention rate is between 60% and 70%, whereas in Botswana it exceeds 80%. Retention rates may not always be directly comparable, however, as some countries may report data from tertiary hospitals only, report survival rather than retention, or erroneously record transfers to diff erent treatment sites as loss to follow-up.
Better understanding of the factors that depress longer-term retention is need-ed, and new strategies are needed to increase retention in antiretroviral therapy programmes. Possible factors limiting treatment retention include constraints within health and community systems such as overly centralized treatment programmes that limit geographical accessibility; health worker shortages; drug stock-outs; and weak community treatment literacy.
Health systems challenged by and benefi t from HIV treatment, care and supportIn many countries, overburdened health systems are struggling valiantly to address the challenges posed by HIV, including health worker shortages, cen-tralized programmes, fragmented rather than integrated and holistic services delivery, and weak procurement and supply systems. Th is is especially true for health systems in sub-Saharan Africa, which must care for two of three people living with HIV but have only 3% of the world’s health care provid-ers (8). Challenges associated with health-system capacity are not limited to
“NEW DATA PROVIDE STRONG EVIDENCE THAT
HIGH ANTIRETROVIRAL THERAPY RETENTION RATES
ARE ACHIEVABLE. OF THE COUNTRIES FOR WHICH
DATA ARE AVAILABLE, 26 REPORT THAT AT LEAST
95% OF PEOPLE ARE STILL RECEIVING TREATMENT ONE
YEAR AFTER INITIATING ANTIRETROVIRAL THERAPY.”

101Chapter 4: HIV treatment | 2010 GLOBAL REPORT
4
Figure 4.1Adult retention in antiretroviral therapy in selected countries, 0–48 months, 2009
Source: WHO Towards Universal Access 2010.
sub-Saharan Africa, however. Countries in Asia, the Middle East and North Africa report that an inadequate supply of health care workers skilled in deliv-ering antiretroviral therapy impedes treatment scale-up.
In response, many countries have implemented innovative strategies to expand the capacity of health systems to address HIV and other challenges. Th ese include increasing the use of civil society partners to manage health care facili-ties, other forms of task-shift ing in clinical settings, and institutional twinning arrangements between local clinics and institutions in high-income countries. Shortages of human resources for health have severely hampered the rolling out of antiretroviral therapy in sub-Saharan Africa. Current roll-out models are hospital- and physician-intensive. A recent review (9) has shown that task-shift ing, or delegating tasks performed by physicians to staff with lower-level qualifi cations, including lay and community workers, is an eff ective strategy for addressing shortages of human resources for health in HIV treatment and care.
South Africa is using a nurse-driven model to decentralize antiretroviral therapy provision and expedite treatment scale-up. A randomized controlled trial that has assessed the eff ectiveness of task-shift ing for antiretroviral therapy delivery in urban clinics of Johannesburg and Cape Town found that nurse-managed antiretroviral therapy was not inferior to doctor-managed antiretroviral therapy: both treatment arms had similar outcomes of viral suppression, adherence, toxicity, and death (10). Similarly, in Rwanda, nurses accurately determined eligibility for antiretroviral therapy for more than
100
90
80
70
60
50
12 240 36 48
Malawi
Uganda
Botswana
Burundi
Central African Republic
% K
NO
WN
TO
BE
ON
AR
T
M O N T H S

102 Chapter 4: HIV treatment | 2010 GLOBAL REPORT
INNOVATION AND FLEXIBILITY FOR INCREASING ACCESS TO ANTIRETROVIRAL MEDICINES
THE MEDICINES PATENT POOLThe Medicines Patent Pool was set up in July 2008 by the global health fi nancing mecha-nism UNITAID, to increase access to newer antiretroviral medicines by creating a pool of patents and intelligence on antiretroviral drug production.
The Medicines Patent Pool aims to increase access to treatment by promoting price reductions of existing antiretroviral drugs, stimulating the production of newer fi rst- and second-line drugs and increasing the number of generic producers of these medicines.
The United States National Institutes of Health recently announced that they will be shar-ing patents with the Medicines Patent Pool. This is the fi rst time that a patent holder has shared intellectual property on antiretroviral medicines with the newly established Medicines Patent Pool.
MAKING THE MOST OF THE TRIPS AGREEMENTThe World Trade Organization Declaration on the TRIPS Agreement and Public Health (the Doha Declaration) emphasizes that the TRIPS Agreement does not and should not prevent states from taking measures to protect public health and reaffi rms their right to use, to the full, the provisions of the TRIPS Agreement that provide fl exibility for public health purposes, in particular to promote access to medicines for all. The Doha Declaration also clarifi es some of the fl exibility contained in the TRIPS Agreement, includ-ing that national authorities are free to determine the grounds on which compulsory licences are granted to allow the purchase and use of otherwise protected products, correcting the misconception that some form of emergency is required for issuing a com-pulsory licence.
Although a number of middle- and low-income countries such as Brazil, Thailand and, more recently, Ecuador have used the fl exibility available to them under the TRIPS Agreement and Doha Declaration to make HIV medicines more affordable, in recent years fewer countries have taken advantage of such opportunities.
However, some middle- and low-income countries are entering bilateral and regional trade agreements with high-income countries that impose intellectual property protection that is stricter than necessary under the TRIPS Agreement and that may limit their rights to promote access to affordable HIV medicines and other pharmaceutical products in their countries.
99% of the people examined (11). In Mozambique, people seen by mid-level health workers (with 2.5 years of training) were almost 30% more likely to have CD4 counts done six months aft er antiretroviral therapy was initiated than those seen by doctors and were 44% less likely to be lost to follow-up. Th ere were no signifi cant diff erences in mortality, CD4 counts done at 12 months, or adherence rates (12). A study from Malawi found that the training of lay workers as pharmacy assistants reduced prescribing errors by 25% by unburdening the system (13). In the Democratic Republic of the Congo, a study (14) examined concordance between the decisions of doctors and nurses to initiate antiretroviral therapy and found 95% agreement on initiating therapy.

103Chapter 4: HIV treatment | 2010 GLOBAL REPORT
4
Task-shift ing off ers high-quality, cost-eff ective care to more people than a physician-centred model. Th e main challenges to implementation include adequate and sustainable training, support and pay for staff in new roles, integrating new members into health care teams, and compliance with regulations. Task-shift ing should be considered for careful implementation where shortages of human resources for health threaten roll-out programmes.
Systemic defi ciencies in commodity procurement and supply management undermine treatment eff orts in many countries. Of 94 countries, 38% respond-ing to surveys report at least one drug stock-out in 2009 (1). Th e Islamic Republic of Iran, Tunisia, Yemen and several countries in Central and South America cite drug supply interruptions as notable barriers to access to anti-retroviral therapy (6). In an eff ort to avoid stock-outs, Rwanda has moved to convene a Coordinated Procurement and Distribution System, which unites the national government, donors, international organizations, and other country-level partners in a common eff ort to ensure an uninterrupted supply of HIV drugs and other commodities (1).
Across health systems, scaling up antiretroviral therapy provision presents not only challenges but also opportunities and benefi ts that extend well beyond HIV. In hyper-endemic settings in which people living with HIV have account-ed for the bulk of hospital patients in recent years, the scaling up of therapy is freeing up health system capacity to address other health priorities and is reducing absenteeism and deaths among health care workers living with HIV. In addition, infrastructure improvements fi nanced by HIV funding—including refurbished clinics, improved laboratory capacity and strengthened systems for commodity procurement and supply management—are enhancing the avail-ability and quality of care services for everyone, regardless of HIV serostatus.
Reducing the burden of HIV among people with tuberculosis Tuberculosis (TB) is a leading cause of death among people living with HIV. In 2009, there were an estimated 380 000 deaths from TB among people living with HIV. In sub-Saharan Africa, which accounts for 78% of people with HIV-related TB (1), the HIV prevalence among people with TB is as high as 80% in some countries. However, only 79 000 (0.2%) people living with HIV received isoniazid preventive therapy, a treatment that can greatly reduce a person’s risk of developing TB disease.
Under newly released WHO guidelines, everyone with TB who is living with HIV should receive antiretroviral therapy, regardless of their CD4 count. In 2009, 1.6 million people with TB (26% of the total) were tested for HIV, up from 22% in 2008 and 4% in 2003. Of the people tested, 450 000 were found to be HIV positive; 75% of those who were positive received co-trimoxazole and 37% received antiretroviral therapy. Two of the 21 countries with the highest burden of HIV-related TB provide treatment for both diseases for over half the people who need it (Figure 4.2 and Figure 4.3).
Widening the provision of antiretroviral therapy reduces the incidence of TB and AIDS mortality. Multiple research studies show that antiretroviral therapy
“TUBERCULOSIS (TB) IS A LEADING CAUSE OF DEATH AMONG PEOPLE LIVING WITH HIV. IN 2009, THERE WERE AN ESTIMATED 380 000 DEATHS FROM TB AMONG PEOPLE LIVING WITH HIV.”

104 Chapter 4: HIV treatment | 2010 GLOBAL REPORT
Figure 4.2Coverage of TB services among people living with HIV, 2009Coverage services aimed to reduce the burden of TB per 1000 people living with HIV globally.
Source: UNAIDS estimates, WHO Towards Universal Access 2010 and WHO Global TB Control Report 2010.
Outer square equals 1000 HIV incident cases
Eligible for ART (441)
Know HIV status (333)
On ART (158)
Incident TB in people living with HIV (33)
Screened for TB (50)
TB ART (5)
IPT (2)

105Chapter 4: HIV treatment | 2010 GLOBAL REPORT
4
Figure 4.3Coverage of HIV services among people with TB, 2009Coverage of services aimed to reduce the burden of HIV per 1000 people with TB globally, 2009.
Source: WHO Global TB Control Report 2010.
Outer square equals 1000 TB incident cases
Diagnosed and registered to TB programme (656)
Offered HIV test (174)
HIV-positive incident TB cases (117)
HIV positive TB patients on ART (15)
HIV positive TB patients on co-trimoxazole (20)

106 Chapter 4: HIV treatment | 2010 GLOBAL REPORT
TREATMENT 2.0
Treatment 2.0 is a new approach to simplifying the way HIV treatment is currently pro-vided and to scale up access to life-saving medicines. Using a combination of efforts, it could reduce treatment costs, make treatment regimens simpler and smarter, reduce the burden on health systems and improve the quality of life for people living with HIV and their families. Modelling suggests that, compared with current treatment approaches, Treatment 2.0 could avert an additional 10 million deaths by 2025. (Figure 4.4)
In addition, the new approach could also reduce the number of people newly infected with HIV by up to 1 million annually if countries provide antiretroviral therapy to everyone who needs it, following the 2010 WHO treatment guidelines. Today, 5 million of the 15 million people in need are accessing these life-saving medicines.
Achieving the full benefi ts of Treatment 2.0 requires progress across fi ve areas.
1. Optimize drug regimens: UNAIDS calls for the development of new pharmaceutical compounds that will lead to a “smarter, better pill” that will be less toxic, longer-acting and easier to use. Combined with dose optimization and improved sequencing of fi rst and second line regimens this will simplify treatment protocols and improve effi cacy. Optimizing HIV treatment will also result in other health benefi ts, including much lower rates of TB and malaria among people living with HIV.
2. Provide access to point of care diagnostics: Monitoring treatment requires complex equipment and specialized laboratory technicians. Simplifying diagnostic tools in order to provide viral load and CD4 cell counts at the point of care could help to reduce the burden on health systems. Such a simplifi ed treatment platform will defray costs and increase people’s access to treatment.
3. Reduce costs: Despite drastic reductions in drug pricing over the past decade, the costs of antiretroviral therapy programmes continue to rise. While drugs must continue to be made more affordable- including fi rst and second line regimens – potential gains are highest in reducing the non-drug-related costs of providing treatment, such as hospitalization, monitoring treatment, and out-of-pocket expenses. These costs are currently twice the cost of the drugs themselves.
4. Adapt delivery systems: Simpler diagnostics and treatment regimes will also allow for further decentralizing and integrating service delivery systems, thereby reducing redundancy and complexity, and facilitating a more effective continuum of care. Task-shifting and strengthening procurement and supply systems will be important elements of this change.
5. Mobilize communities: Treatment access and adherence can be improved by involving the community in managing treatment programmes. Strengthening the demand and uptake for testing and treatment will both improve treatment coverage and help to reduce costs for extensive outreach. Greater involvement of community based organizations in treatment maintenance, adherence support and monitoring will reduce the burden on health systems.

107Chapter 4: HIV treatment | 2010 GLOBAL REPORT
4
Figure 4.4Five pillars of Treatment 2.0
TREATMENT 2.0
Optimize drug regimens
Mobilize communities
Reduce costsStrengthen delivery systems
Provide point of care diagnostics
can reduce the incidence of TB among people living with HIV. Data from Botswana (Figure 4.5) indicate a decline in the number of TB cases reported nationwide that has coincided with rapid antiretroviral therapy roll-out since 2002–2003. Improvements in Botswana’s national TB programme over this same period, including case detection and reporting, mean that this decline probably refl ects a true reduction in TB infections due to antiretroviral therapy.
Eff ect of antiretroviral therapy on mortalityTh e expansion of antiretroviral therapy has yielded remarkable health dividends in countries in which an HIV diagnosis was regarded as a death sentence only a decade ago. Emerging evidence shows associations between rolling out treatment and reduced population mortality in high-prevalence settings. In South Africa’s North West Province, the roll-out of antiretroviral therapy, one of the earliest and most aggressive eff orts to improve access, coincides and appears to be associated with a decline in mortality in most aff ected age groups (Figure 4.6). Th e data also suggest initial mortality declines by 2007 in the Western Cape and KwaZulu-Natal. Th e preliminary fi ndings of a study on death registration undertaken by the Medical Research Council of South Africa provide supporting evidence of continued declines in mortality.
Estimates suggest that, worldwide, about 14.4 million life-years have been gained due to the provision of antiretroviral therapy (Table 4.2). More than 1.2 million life-years are estimated to have been gained in Brazil between 1996 and 2009,

108 Chapter 4: HIV treatment | 2010 GLOBAL REPORT
700
600
500
400
300
200
100
0
100,000
90,000
80,000
70,000
60,000
50,000
40,000
30,000
20,000
10,000
0‘90 ‘94 ‘98 ‘02‘91 ‘95 ‘99 ‘03‘92 ‘96 ‘00 ‘04 ‘05‘93 ‘97 ‘01 ‘06 ‘07
Figure 4.5Antiretroviral therapy and TB incidence in Botswana Reported incidence of TB and number of people receiving antiretroviral therapy in Botswana, 1990–2007.
Source: Ministry of Health, Botswana.
INC
IDE
NC
E/1
00
,00
0
ART TB
12000
10000
8000
6000
4000
2000
0
40,000
35,000
30,000
25,000
20,000
15,000
10,000
5,000
0
On ART
15-24
25-34
35-44
45-54
65+
‘98 ‘02‘99 ‘03‘00 ‘04 ‘05‘97 ‘01 ‘06 ‘07
DE
AT
HS
Figure 4.6Antiretroviral therapy and mortality, Northwest Province, South Africa Number of people ever receiving antiretroviral therapy and annual number of deaths by age group, Northwest Province, South Africa, 1997–2007.
Source: Ministry of Health, South Africa.

109Chapter 4: HIV treatment | 2010 GLOBAL REPORT
4
which has had a long-standing policy of universal therapy coverage. In South Africa, more than 970 000 people are now enrolled in antiretroviral therapy and more than 700 000 life-years have already been gained. Kenya and Nigeria have both enrolled more than 300 000 in treatment, lead-ing to about 320 000 life-years gained in each country. Later roll-out of antiretroviral therapy and/or low coverage mean that signifi cant gains in life-years have yet to be documented in some of the concentrated epidemic countries such as Indonesia, Ukraine and Viet Nam.
Th e availability of palliative and home-based care services remains unevenPeople living with HIV, including people enrolled and peo-ple waiting for treatment, have a range of care and support needs in addition to antiretroviral therapy. Th ese include the need for psychosocial, physical, socioeconomic, and legal care and support. Home-based care, which includes the care of people who are home-bound or bedridden, distribution of basic supplies, palliative care, and providing care and support to children orphaned because of AIDS, are essential elements of care and support programmes.
Most countries (162 of 171) report they have “a policy or strategy to promote comprehensive HIV treatment, care and support”. Access to these comprehensive services is far from complete, however. Because of a lack of clarity about what comprises comprehensive care and support, current national HIV policies or strategies may not address many central aspects of care and support.
Only 44% of governments (and 35% of civil society responses) report that most people in need have access to home-based care services (Figure 4.7). As Uganda notes in its 2010 country report (6), inadequate political will and insuffi cient resourcing are signifi cant challenges in increas-ing access to high-quality care and support services.While 73% of governments responding agree with the statement that the majority of people in need have access to palliative care and treatment of common HIV-related infections, only 57% of civil society respondents agree that that statement is true (Figure 4.8).More oft en than not, volunteers rather than governments provide the bulk of needed psychosocial, physical, socio-economic, and legal care services and support. Families and communities—particularly women, whose contribu-tion to the HIV response oft en goes unrecognized and unsupported—meet most care and support responsibili-ties. At the same time, these families and communities
COMMUNITIES LEAD IN EXPANDING HIV TREATMENT
Community leadership helps drive the expansion of antiretroviral therapy worldwide. For example, the Lao People’s Democratic Republic has made concerted efforts to mobilize people living with HIV to support antiretrovi-ral therapy initiatives, resulting in earlier diagnosis of HIV infection and increased survival rates (4). Through support provided by the HIV Collaborative Fund, about 30 com-munity-based organizations headed by people living with HIV provide treatment literacy and adherence support services, home-based care, and HIV prevention education. In China, ongoing monitoring of more than 14 000 people by AIDS Care China indicates that individuals receiving such community-based services are more likely to adhere to treatment regimens and are better equipped to man-age drug toxicity.
In Kenya, the AIDS Law Project and the East African Treatment Access Movement fi led a legal challenge in 2008 requesting suspension of a national law prohibit-ing the importation or manufacture of affordable generic antiretroviral drugs. In April 2010, the court hearing the lawsuit stayed enforcement of the legislation, fi nding that people living with HIV would suffer irreparable damage as a result of the law.
Also in Kenya, in the Lurambi area in the west of the country, a mass campaign to mobilize the population for HIV testing and referral led to the testing of more than 47 000 residents in seven days, including 87% of the tar-get age group 15–49 years. The 4% who tested positive were given a three-month supply of co-trimoxazole and were referred to treatment (18).
Community groups mostly undertake these efforts with little fi nancial or technical support. At present, relatively few funding channels exist to build the capacity of grass-roots community groups, and many antiretroviral therapy programmes have yet to integrate community workers into their operations. In May 2010, the Global Fund to Fight AIDS, Tuberculosis and Malaria issued its fi rst guide on strengthening community systems in the context of Global Fund programming. The guide aims to encourage new funding channels to increase the capacity of communities to participate in designing, delivering, monitoring, and evaluating initiatives to improve health outcomes.

110 Chapter 4: HIV treatment | 2010 GLOBAL REPORT
Table 4.2Adult life-years gained by antiretroviral therapyAdult life years gained due to antiretroviral therapy in 25 countries with the highest number of persons living with HIV.
Source: UNAIDS estimates, WHO Towards Universal Access Report 2010 and WHO Global TB Control Report 2010.
Point Estimate
Botswana
Brazil
Cameroon
China
Côte d’Ivoire
D.R. Congo
Ethiopia
Ghana
India
Indonesia
Kenya
Lesotho
Malawi
Mozambique
Nigeria
Low High
83%
30%
29%
25%
21%
50%
50%
48%
32%
23%
145 190
76 228
12 762
72 011
34 967
176 632
30 265
320 074
15 442
336 980
61 736
198 846
170 198
302 973
320 000[300 000 - 350 000]
[460 000 - 810 000]
610 000[540 000 - 670 000]
740 000[540 000 - 1 000 000]
450 000[390 000 - 510 000]
[430 000 - 560 000]
260 000[230 000 - 300 000]
2 400 000[2 100 000 - 2 800 000]
310 000[200 000 - 460 000]
1 500 000[1 300 000 - 1 600 000]
290 000[260 000 - 310 000]
920 000[830 000 - 1 000 000]
1 400 000[1 200 000 - 1 500 000]
3 300 000[2 900 000 - 3 600 000]
271 000
1 215 000
97 000
84 000
80 000
42 000
160 000
26 000
233 000
13 000
326 000
48 000
161 000
139 000
316 000
>95%
50%
34%
38%
32%
20%
65%
29%
27%
30%
55%
54%
54%
35%
25%
77%
89%
27%
19%
26%
15%
52%
23%
23%
14%
46%
45%
44%
29%
21%
Number of people living with HIV, 2009
Life years among adults gained due to ART between 1996 and 2009
Number of people receiving antiretroviral therapy in December 2009
Antiretroviral therapy coverage (2010 WHO guidelines)

111Chapter 4: HIV treatment | 2010 GLOBAL REPORT
4
Point Estimate Low High
980 000[840 000 - 1 200 000]
5 600 000[5 400 000 - 5 900 000]
260 000[210 000 - 330 000]
530 000[420 000 - 660 000]
1 200 000[1 100 000 - 1 300 000]
350 000[300 000 - 410 000]
1 400 000[1 300 000 - 1 500 000]
280 000[220 000 - 350 000]
980 000[890 000 - 1 100 000]
1 200 000[1 100 000 - 1 300 000]
65 000
707 000
3 000
389 000
293 000
16 000
150 000
27 000
270 000
172 000
36%
61%
43%
9%
32%
33%
68%
34%
23%
37%
0%
77%
48%
10%
35%
44%
76%
37%
16%
35%
0%
49%
38%
8%
29%
25%
62%
32%
Number of people living with HIV, 2009
Life years among adults gained due to ART between 1996 and 2009
Number of people receiving antiretroviral therapy in December 2009
Antiretroviral therapy coverage (2010 WHO guidelines)
Russian Federation
South Africa
Sudan
Thailand
Uganda
Ukraine
United Republic of Tanzania
Viet Nam
Zambia
Zimbabwe
75 900
971 556
3 825
216 118
200 413
15 871
199 413
37 995
283 863
218 589

112 Chapter 4: HIV treatment | 2010 GLOBAL REPORT
oft en struggle to access adequate resources, training and support to provide these critical responses (Figure 4.9).
No decline in the number of children orphaned by AIDSDespite the modest decline in HIV adult prevalence worldwide and increasing access to treatment, the total number of children aged 0–17 years who have lost their parents due to HIV has not yet declined. Indeed, it has further increased from 14.6 million [12.4 million–17.1 million] in 2005 to 16.6 million [14.4 mil-lion–18.8 million] in 2009. Almost 90% live in sub-Saharan Africa. Th e number of orphans due to AIDS living in six countries—Kenya, Nigeria, South Africa, Uganda, United Republic of Tanzania, and Zimbabwe—is more than 9 mil-lion, with Nigeria alone counting 2.5 million orphans due to HIV. More than 10% of all children aged 0–17 years have lost one or two parents due to HIV in Zimbabwe (16%), Lesotho (13%), and Botswana and Swaziland (12%).
Among the most remarkable contributions to the global response to HIV are the systems and networks, both formal and informal, that have been established to support children orphaned by the epidemic (Figure 4.10). Th e narrowing of the diff erence in school attendance between orphans and non-orphans is one main achievement of this response. Most households caring for children aff ected by HIV, however, are still not accessing any external care and support. ■
Figure 4.7Access to home-based care Assessment by governments as to whether most people in need have access to home-based care.
Source: Country Progress Reports 2010.
Figure 4.8Availability of palliative care Assessment by governments as to whether most people in need have access to palliative care.
Source: Country Progress Reports 2010.
Yes76
Yes125
No74
No40
Not applicable19
Not applicable4
Missing2
Missing2

113Chapter 4: HIV treatment | 2010 GLOBAL REPORT
4
Figure 4.9Types of care and support work performed by volunteersTypes of care and support work for people living with HIV performed by 1366 volunteer caregivers interviewed in Cameroon, Kenya, Malawi, Nigeria, South Africa and Uganda.
Source: Compensation for Contributions: report on interviews with volunteer caregivers in six countries. Hairu Commission and Community Agency for Social Enquiry, Sept 2009.
Home visit
ART monitoring
Hospital visit
Advocacy
Training carers
Caring for orphans
Orphans school follow-up
Finding school bursaries for orphans
Distributing supplies from NGOs and government
Redressing land grabbing and widow’s inheritance
Working for referral organisations
% 20 40 60 80 100
ZambiaUgandaEthiopia
Figure 4.10Trends in support for orphans and vulnerable children, 2005 to 2010Changes in the coverage of support services for orphans and vulnerable children in three countries with high HIV prevalence, 2005 to 2010.
Source: World Vision.
Per cent of children whose births are registered
Proportion of households with orphans and vulnerable children (OVC) that receive free basic
external support in caring for the children
Proportion of OVC that have three, locally defi ned basic needs met compared to non-OVC
Proportion of OVC receiving appropriate psychosocial support
Proportion of OVC receiving normal meals compared to non-OVC
Healthcare access for OVC compared to non-OVC
School attendance of OVC compared to non-OVC
%-20-40 20 40 60
WORSE BETTER

114 Chapter 4: HIV treatment | 2010 GLOBAL REPORT

115Chapter 4: HIV treatment | 2010 GLOBAL REPORT
4
ACTION ITEMS
■ HIV treatment must be scaled up to keep pace with increasing demand.
■ HIV testing and counselling must be expanded, as most people get to know their status very late and access treatment later, which reduces the effective-ness of treatment programmes.
■ An integrated HIV and TB programme is essential to meet the challenges posed by the dual epidemics.
■ Maternal and child health services must be strengthened so that all pregnant women living with HIV can access comprehensive services for preventing maternal and child mortality and infants from becoming newly infected and for providing antiretroviral therapy for mothers.
■ Children’s access to antiretroviral therapy must improve. This will require maternal and child health and antiretroviral therapy centres to work closely. In addition, better diagnostic tools and antiretroviral therapy formulations for children continue to be needed.
■ Current approaches to treatment have not been optimal for the 15 million people in need. Treatment 2.0—a radically simplifi ed treatment platform—holds promise to simplify treatment and provide all people needing it with a better pill less likely to lead to resistance, simpler diagnostics and monitor-ing, easier HIV testing, and more community empowerment. All stakeholders should unite to make this a reality.
■ Social support for orphans must continue, and recent success in rolling out programmes of support such as cash transfers, food support, and education bursaries must be expanded and sustained.
■ Investments in treatment have brought results for AIDS-related mortality and reducing the number of people newly infected with HIV. These investments must be continued and sustained over the long term.

116 Chapter 4: HIV treatment | 2010 GLOBAL REPORT
ART Coverage (IDU)
25
25
25
25
25
50
50
50
50
50
75
75
75
75
75%%% % %
Angola
Benin
Botswana
Burkina Faso
Burundi
Cameroon
Cape Verde
Central African Republic
Chad
Comoros
Congo
Côte d’Ivoire
Democratic Republic of Congo
Equatorial Guinea
Eritrea
Ethiopia
Gabon
Gambia
Ghana
Guinea
Guinea-Bissau
Kenya
Lesotho
Liberia
Madagascar
Malawi
Mali
Mauritania
Mauritius
Mozambique
Namibia
Niger
Nigeria
Rwanda
Sao Tome and Principe
Senegal
Seychelles
Sierra Leone
South Africa
Swaziland
Togo
Uganda
United Republic of Tanzania
Zambia
Zimbabwe
China
Democratic People’s Republic of Korea
Japan
Mongolia
Republic of Korea
SCORECARD: HIV TREATMENT
SUB-SAHARAN AFRICA
EAST ASIA
ART Coverage (adults) ART Coverage (children) TB-ART Coverage ART Survival
Data not available

117Chapter 4: HIV treatment | 2010 GLOBAL REPORT
4
ART Coverage (IDU)
25
25
25
25
25
50
50
50
50
50
75
75
75
75
75%%% % %
Australia
Fiji
Kiribati
Marshall Islands
Micronesia, Federated States Of
Nauru
New Zealand
Palau
Papua New Guinea
Samoa
Solomon Islands
Tonga
Tuvalu
Vanuatu
Afghanistan
Bangladesh
Bhutan
Brunei Darussalam
Cambodia
India
Indonesia
Lao People’s Democratic Republic
Malaysia
Maldives
Myanmar
Nepal
Pakistan
Philippines
Singapore
Sri Lanka
Thailand
Timor-Leste
Viet Nam
Armenia
Azerbaijan
Belarus
Georgia
Kazakhstan
Kyrgyzstan
Moldova
Russian Federation
Tajikistan
Turkmenistan
Ukraine
Uzbekistan
OCEANIA
SOUTH ANDSOUTH-EAST ASIA
EASTERN EUROPE AND CENTRAL ASIA
ART Coverage (adults) ART Coverage (children) TB-ART Coverage ART Survival
To ensure data comparability, estimates of antiretroviral treatment coverage are based on the standardized Spectrum epidemiological model for estimating the number of people in need of treatment. Spectrum estimates are only available for low- and middle-income countries. For complete data provided by countries please refer to AIDSInfo (www.AIDSInfoOnline.org).

118 Chapter 4: HIV treatment | 2010 GLOBAL REPORT
Albania
Andorra
Austria
Belgium
Bosnia and Herzegovina
Bulgaria
Croatia
Cyprus
Czech Republic
Denmark
Estonia
Finland
France
Germany
Greece
Hungary
Iceland
Ireland
Israel
Italy
Latvia
Liechtenstein
Lithuania
Luxembourg
Malta
Monaco
Montenegro
Netherlands
Norway
Poland
Portugal
Romania
San Marino
Serbia
Slovakia
Slovenia
Spain
Sweden
Switzerland
The Former Yugoslav Republic of Macedonia
Turkey
United Kingdom of Great Britain and Northern Ireland
Canada
Mexico
United States of America
Algeria
Bahrain
Djibouti
MIDDLE EAST AND NORTH AFRICA
ART Coverage (IDU)
25
25
25
25
25
50
50
50
50
50
75
75
75
75
75%%% % %
WESTERN AND CENTRAL EUROPE
NORTH AMERICA
ART Coverage (adults) ART Coverage (children) TB-ART Coverage ART Survival
SCORECARD: HIV TREATMENT
Data not available

119Chapter 4: HIV treatment | 2010 GLOBAL REPORT
4
Egypt
Iran, Islamic Republic of
Iraq
Jordan
Kuwait
Lebanon
Libyan Arab Jamahiriya
Morocco
Oman
Qatar
Saudi Arabia
Somalia
Sudan
Syrian Arab Republic
Tunisia
United Arab Emirates
Yemen
Antigua & Barbuda
Bahamas
Barbados
Cuba
Dominica
Dominican Republic
Grenada
Haiti
Jamaica
Saint Kitts and Nevis
Saint Lucia
Saint Vincent and the Grenadines
Trinidad and Tobago
Argentina
Belize
Bolivia
Brazil
Chile
Colombia
Costa Rica
Ecuador
El Salvador
Guatemala
Guyana
Honduras
Nicaragua
Panama
Paraguay
Peru
Suriname
Uruguay
Venezuela
ART Coverage (IDU)
25
25
25
25
25
50
50
50
50
50
75
75
75
75
75%%% % %
MIDDLE EAST AND NORTH AFRICA Continued
CARIBBEAN
CENTRAL AND SOUTH AMERICA
ART Coverage (adults) ART Coverage (children) TB-ART Coverage ART Survival
To ensure data comparability, estimates of antiretroviral treatment coverage are based on the standardized Spectrum epidemiological model for estimating the number of people in need of treatment. Spectrum estimates are only available for low- and middle-income countries. For complete data provided by countries please refer to AIDSInfo (www.AIDSInfoOnline.org).

120 Chapter 5: Human rights and gender equality | 2010 GLOBAL REPORT
CHAPTER 5

121Chapter 5: Human rights and gender equality | 2010 GLOBAL REPORT
5
KEY FINDINGS
HUMAN RIGHTS
■ Failing to address the human rights of key populations at higher risk of exposure to HIV facilitates the growth of the epidemic and enhances its socially damaging effects.
■ Punitive laws that affect people living with HIV, or other people at higher risk of exposure, remain widespread. Laws protecting such people exist in many countries, but there are not enough data to show whether they are actively or widely enforced.
■ Stigma, discrimination, and violence against transgender people, and men who have sex with men, increase their risk of HIV infection and also for their male and female partners.
GENDER EQUALITY
■ The vulnerability of women and girls to HIV remains particularly high in sub-Saharan Africa; 80% of all women in the world living with HIV live in this region.
■ Efforts to promote universal access to HIV prevention, treatment, care and support services require a sharper focus on women and girls. Fewer than half of countries report having a specifi c budget for HIV-related programmes addressing women and girls.
■ Despite evidence that benefi cial behaviour change can be achieved, few HIV programmes engage men and boys.
HUMAN RIGHTSAND GENDER EQUALITY

122 Chapter 5: Human rights and gender equality | 2010 GLOBAL REPORT
Human rights and gender equality are critical to eff ective responses to HIVIn the context of HIV, protections comprise legal approaches that implement international human rights commitments as well as eff orts to address harm-ful social and gender norms that put women, men, and children at increased risk of HIV infection and increase its impact. A rights-based approach to HIV requires: realization and protection of the rights people need to avoid exposure to HIV; enabling and protecting people living with HIV so that they can live and thrive with dignity; attention to the most marginalized within societies; and empowerment of key populations through encouraging social participa-tion, promoting inclusion and raising rights-awareness. Signifi cant advances have been made in expanding HIV prevention, treatment, care, and support services in recent years but some key populations at higher risk such as sex workers, people who inject drugs, and men who have sex with men, remain oft en underserved. Resources directed towards the needs of these populations, including support for them to claim and exercise their rights, are oft en not pro-portional to the degree to which they are aff ected by the epidemic.
Stigma and discriminationIn 2010, 91% of governments reported that they address stigma and discrimination as cross cutting issues in their national strategies. Further, from nongovernmental sources that have consistently reported on the National Composite Policy Index (NCPI) since 2006, reports of programmes to address stigma and discrimination have doubled in less than fi ve years (92% in 2010 against 46% in 2006). Th is improvement indicates increased acknowledgement of the importance of working to eliminate stigmatization of, and discrimination against, people living with HIV.
However, these reports refer only to the existence of such programmes. Th ey do not confi rm whether eff orts are implemented at suffi cient scale and of a quality to make real and sustained improvements to the lives of people living with HIV and other members of key populations at higher risk of exposure.
In 2008–2009, the UNAIDS Secretariat commissioned the International HIV/AIDS Alliance to review the national AIDS planning documents of 56 countries to ascertain whether they included programmes to increase access to justice and reduce stigma and discrimination (e.g. law reform; know your rights/legal literacy; and human rights training for service providers, provision of legal services, and programmes supporting the human rights of women and
CHAPTER 5 | HUMAN RIGHTS AND GENDER EQUALITY
»

123Chapter 5: Human rights and gender equality | 2010 GLOBAL REPORT
5
Figure 5.1Countries with laws or regulations that create obstaclesPercentage of countries in which nongovernmental sources report laws or regulations that create obstacles to effective HIV prevention, treatment, care, and support for population groups at higher risk and other vulnerable population groups.
Source: Country Progress Reports 2006, 2008, 2010.
% 20 40 60 80 100
Overall
South and Central America (19)
Eastern Europe and Central Asia (11)
South and South-East Asia (18)
Sub-Saharan Africa (29)
Western and Central Europe (8)
2006
2008
2010
The following regions are not displayed due to insuffi cient countries: Caribbean, Middle East and North Africa, East Asia, Oceania, and North America.

124 Chapter 5: Human rights and gender equality | 2010 GLOBAL REPORT
girls). Th is study (to be published in 2010) found that, although about 90% of country activity plans included stigma and discrimination reduction pro-grammes, fewer than 50% of countries costed or budgeted such programmes. Further, the review indicated that countries rarely included a comprehensive package of programmes to reduce stigma and discrimination in their national strategies (1).
Th e United Nations Development Programme, UNAIDS, and the Global Fund to Fight AIDS, Tuberculosis and Malaria examined whether human rights programmes were included in the Global Fund’s HIV portfolio for Rounds 6 and 7. Th is 2009-2010 study found that one third of the key human-rights programmes identifi ed by Country Coordinating Mechanisms as being necessary for an eff ective HIV response were not implemented. Th e same study also found that less than one quarter of planned programmes explicitly engaged men who have sex with men, transgender people, people who use drugs, sex workers, and prisoners (2).
Results from the People Living with HIV Stigma Index illustrate the need to increase eff orts to reduce stigma and discrimination as part of national HIV responses. Th e Index, currently being rolled out in more than 70 countries and with preliminary results from 10 now available (Bangladesh, China, Dominican Republic, Fiji, Myanmar, Paraguay, Rwanda, United Kingdom—including a separate component for Scotland—and Zambia), provides rich evidence of the multi-layered ways in which stigma and discrimination manifest in the lives of people living with HIV.
In China, for example, more than 30% of people living with HIV said they had been subject to verbal abuse, 9% had been physically harassed, 14% refused employment, and 12% denied health care (2). In Paraguay, 12% were excluded from social gatherings, 11% were physically harassed and 9% physically assaulted (3). In Rwanda, more than 50% were verbally insulted, 36% physically harassed and 20% physically assaulted, 65% experienced loss of job or income and 88% were denied access to family planning services due to their HIV status (4). In the United Kingdom, 17% reported having been denied health care (5).
High percentages of respondents in all countries reported internalized stigma: feeling ashamed, guilty, suicidal, and blameworthy.An extensive survey by the nongovernmental organization representatives of the UNAIDS Programme Coordinating Board in 2010 showed that people living with HIV and key populations at higher risk continue to experience high levels of HIV-related stigma and discrimination. Slightly less than half of respondents experienced negative attitudes or exclusion from family members. Other experiences in at least one third of the sample included loss of employ-ment, refusal of care by health care workers, social or vocational exclusion, and/or involuntary disclosure (6). Several examples from the UNGASS narrative reports (7) also show that stigma and discrimination continue to hinder eff ec-tive HIV responses. Narrative reports from Cambodia, Malaysia, Nepal, and Pakistan include stigma and discrimination as barriers to providing prevention, treatment, and care services to key population groups and to providing treat-ment and care for people living with HIV (8).

125Chapter 5: Human rights and gender equality | 2010 GLOBAL REPORT
5
SOURCES TO ASSESS STIGMA AND DISCRIMINATION
UNGASS country report narrativesCountry progress reports submitted by governments (7) include a narrative on progress made in the AIDS response. Often these include narratives that provide a rich context on the impact of stigma and discrimination. In some instances nongovernmental organiza-tions also submit shadow reports, which provide a point of view different from the offi cial version. Together, they may provide a realistic picture of national and community efforts to eliminate stigma and discrimination.
National Composite Policy IndexThe National Composite Policy Index (NCPI) is an integral part of the core UNGASS indicators, which comprises a series of questions on each country’s legal and policy landscape in relation to HIV. The NCPI is divided into two parts: (a) the government’s responses to the questions and (b) the responses of civil society organizations, the United Nations and bilateral agencies (nongovernmental sources). Most questions are answered yes/no. The answers are not independently verifi ed but provide a snapshot of how differ-ent organizations view the various national AIDS policies and their implementation.
People Living with HIV Stigma IndexThe People Living with HIV Stigma Index is an innovative way to measure HIV-related stigma and discrimination experienced by people living with HIV. National networks of people living with HIV lead the implementation of the Index. The Index is supported jointly by the Global Network of People Living with HIV, International Community of Women Living with HIV, International Planned Parenthood Federation and UNAIDS.
Several countries reported that stigma and discrimination in health care facilities adversely aff ect access to and the provision of services. For example, in Central and South America, several reports note that some health care personnel are likely to discriminate against people living with HIV and deny services to population groups at higher risk such as sex workers and men who have sex with men; in Mexico, service providers may treat people who inject drugs as “delinquents” (8). Country progress reports for 2010 from Lesotho, Mozambique and Senegal (7) mentioned stigma and discrimination towards sex workers and sexual minorities as barriers to their accessing health services, HIV testing, and HIV treatment.
Th ere continue to be reports from many parts of the world of violence against and murder of individuals based on their perceived or actual sexual orientation (9–11). For example, the shadow report submitted under UNGASS reporting on Honduras described several murders and a climate of impunity for perpetra-tors of violations of human rights that seriously undermines the HIV response (12). Such grave situations call for concerted action and advocacy by both human rights and HIV stakeholders.
Meaningfully involving people living with and vulnerable to HIV in national HIV responses is a part of realizing human rights.

126 Chapter 5: Human rights and gender equality | 2010 GLOBAL REPORT
Th e Greater Involvement of People Living with HIV (GIPA) has been a key human rights principle within the HIV response since the Paris Declaration of 1994. In 2010, governments in 96% of countries reported that their national HIV strategy explicitly addressed the involvement of people living with HIV, up from 75% in 2006. Civil society has been leading eff orts to assess the nature and quality of this participation. Th e Global Network of People Living with HIV has implemented the GIPA Report Card in six countries and is currently implementing assessments in four others. In Kenya, 33% of respondents indi-cated that they either “somewhat agreed” or “strongly agreed” that people living with HIV were meaningfully involved in developing the country’s national AIDS plan; in Nigeria, the fi gure was 60%; and in Zambia, 66%. Fear of stigma was cited as one of the most signifi cant barriers to greater involvement in the national response in all three countries (13).
Laws, policies, and regulations that create obstacles to eff ective HIV responses are increasingly acknowledged but too oft en remainCountries increasingly acknowledge the demonstrated and potential negative eff ects of punitive legislation, policies, and regulations on access to, and uptake of, HIV prevention, treatment, care, and support services and on the rights and dignity of people living with or vulnerable to HIV (14). In 2006, nongov-ernmental sources in 41% of countries reported that the countries had laws, policies, or regulations that posed obstacles to eff ective HIV service provision for key populations at higher risk. In 2010, sources in 67% of the same coun-tries reported the existence of such obstacles. In Asia and the Pacifi c, nearly 90% of nongovernmental sources reported the existence of laws that pose obstacles to eff ective HIV responses for key populations at higher risk. In the Middle East and North Africa 56% of countries, and 55% in sub-Saharan Africa reported similar laws.
Government and civil society responses to the National Composite Policy Index (NCPI) in this area diff er notably. In 2010, the governments of 78 coun-tries (46% of those reporting) acknowledged the existence of laws, regulations, and policies that obstructed access to prevention, treatment, care, and support services for populations at higher risk; in contrast, civil society from 106 coun-tries (62%) reported the same (Figure 5.1).
Th ese reports do not capture the full reality of laws that can act as obstacles to the HIV response. For instance, 79 countries and territories criminalize same-sex sexual relations between consenting adults, with six countries retaining the possibility of applying the death penalty for such acts (15). More than 100 countries criminalize some aspect of sex work (16,17). Fift y-one countries, territories, and entities are reported to impose some form of restriction on the entry, stay, and residence of people living with HIV (Figure 5.2) (18,19).
In their narrative UNGASS reports (7), several countries recognized that crimi-nalization of same-sex practices, sex work, and/or provision of sterile needles and syringes, and of punitive law enforcement are barriers to fully eff ective HIV responses. Bangladesh, for example, reports that existing laws are oft en used to harass vulnerable people, leading to the weakening of programme
REMOVING PUNITIVE AND DISCRIMINATORY LAWS: HIV-RELATED RESTRICTIONS ON ENTRY, STAY, AND RESIDENCE
In 2010, a number of countries lifted their HIV-related restrictions on entry, stay, and residence: the United States of America (January); China (April); and Namibia (July). However, such restrictions continue in 51 countries—an indicator of the discrimination still faced by people living with HIV in today’s highly mobile world..

127Chapter 5: Human rights and gender equality | 2010 GLOBAL REPORT
5
Figure 5.3Legal protections against discrimination for people living with HIVPercentage of countries with legal protections against discrimination for people living with HIV and mechanisms for redress, as reported by nongovernmental sources.
Source: Country Progress Reports 2010.
% 20 40 60 80 100
Overall (171)
Caribbean (13)
Central and South America (19)
East, South, and South-East Asia (21)
Eastern Europe and Central Asia (11)
Middle East and North Africa (18)
Oceania (13)
sub-Saharan Africa (42)
North America and Western and Central Europe (34)
Percentage of countries reporting non-discrimination laws for people living with HIV
Percentage of countries reporting a mechanism to record, document, and address cases of discrimination experienced by people living with HIV and/or most-at-risk populations
Figure 5.2HIV-related restrictions on entry, stay, or residenceA total of 51 countries, territories, and areas impose some form of restriction on the entry, stay, or residence of people living with HIV based on their HIV status.
Source: Mapping of Restrictions on the entry, stay and residence of people living with HIV (UNAIDS, May 2009), and latest developments as of July 2010.
NoYes

128 Chapter 5: Human rights and gender equality | 2010 GLOBAL REPORT
implementation supporting people at higher risk of exposure to HIV. Malaysia’s report recognized the challenges posed by contradictory harm reduction and drug control policies. Reports from Botswana, Ghana, Malawi, Mozambique, and Zambia acknowledge that criminalizing homosexuality makes providing services to men who have sex with men more diffi cult. Reports from Lebanon, Saudi Arabia, and the Syrian Arab Republic also note that laws that prohibit adultery, homosexuality, and sex work may hinder HIV prevention eff orts (7).
Studies confi rm that punitive laws have negative eff ects on access to HIV services and on the claiming and exercise of human rights by men who have sex with men (20), sex workers (21,22), and people who use drugs (14,23,24). Among those working in the response to HIV another concern is the apparent increased trend of passing laws that criminalize HIV transmission and/or the failure to disclose one’s HIV status. Such laws contradict the commitment made by governments in the Political Declaration on HIV/AIDS in 2006 “to promote a social and legal environment that is supportive of and safe for voluntary dis-closure of HIV status” (25). Countries in North America and Western Europe have long criminalized HIV transmission, and about 20 countries in sub-Saha-ran Africa have also chosen to do so in the past six years (26).
Parallel to increased acknowledgement of laws that pose obstacles to HIV responses, more countries report the existence of laws and regulations that pro-tect people living with or vulnerable to HIV from discrimination but data are insuffi cient to indicate whether they are adequately enforced. In 2010, nongov-ernmental sources in 71% of countries reported the existence of laws protecting people living with HIV from discrimination versus 67% in 2008 and 56% in 2006 (of the same 85 countries reporting in all three years). Most worrying, however, is that the 2010 data indicate that almost one third of countries still do not have such protective legislation. In addition, only 56% of countries report having a mechanism to record, document, and address cases of discrimination experi-enced by people living with HIV or other people vulnerable to HIV (Figure 5.3).
In 2010, governments in 106 countries (62%) reported having laws or regula-tions that specify protections for key populations at higher risk such as women, young people, men who have sex with men, people who inject drugs, sex work-ers, prisoners and migrants. Nongovernmental sources in 112 countries (65%) reported the same. In 2004, when the fi rst UNGASS reports were submitted, nongovernmental sources in only 32% of countries reported the same (of the 88 countries reporting that year). Th is suggests increased understanding among policy makers that protective laws are important in eff ectively responding to HIV (Figure 5.4).
Despite reporting of an increase in protective laws, there is little evidence whether these laws are eff ectively enforced or whether people living with HIV and other people key in the response have access to justice or can seek redress for wrongs experienced. For instance, while nongovernmental sources in 61% of countries in North Africa and the Middle East report the existence of non-discrimination laws, only 17% report having mechanisms to record, document, and address cases of discrimination experienced by people living with or vulnerable to HIV.
56%Percentage of countries reporting
having a mechanism to record and address cases of discrimination.

129Chapter 5: Human rights and gender equality | 2010 GLOBAL REPORT
5
Figure 5.4Non-discrimination laws protecting key populations at higher riskCountries in which nongovernmental sources report non-discrimination laws protecting key populations at higher risk.
Source: Country Progress Reports 2010.
Figure 5.5Legal aid for HIV caseworkCountries in which nongovernmental sources report legal aid systems for HIV casework, 2010.
Source: Country Progress Reports 2010.
YesNoMissing data
YesNoMissing data

130 Chapter 5: Human rights and gender equality | 2010 GLOBAL REPORT
Access to HIV-related legal services is one eff ective means to protect the human rights of people living with HIV and other key populations as are eff orts to sensitize offi cials engaged in the administration of justice. However, nongov-ernmental sources in only 51% of countries report having legal aid systems for HIV casework. Although this represents an increase from 2006, when 33% of countries reported having such systems, the fi gure has remained the same since 2008. Legal aid systems appear to be more common in high-income countries, with 75% of countries reporting such systems (NCPI), whereas only 48% of low-income countries and 40% of lower-middle-income countries report hav-ing them (Figure 5.5).
Gender equalityAlthough gender relationships, practices and HIV epidemics diff er around the world, power imbalances, harmful social gender norms, gender-based violence and marginalization clearly increase the vulnerability of both women and men to HIV infection. Th e consequences of gender inequalities in terms of low socioeconomic and political status, unequal access to education, and fear of violence, add to the greater biological vulnerability of women and girls being infected with HIV. Too oft en they have little capacity to negotiate safer sex, access the services they need, and utilize opportunities for empowerment (27). In nearly all countries in sub-Saharan Africa and certain Caribbean countries, the majority of people living with HIV are women, especially girls and women aged 15–24 years (28,29).
In sub-Saharan Africa, women are more likely to become infected with HIV than are men (Figure 5.6). Th e most recent prevalence data show that in sub-Saharan Africa, 13 women become infected for every 10 men infected. One half of people living with HIV globally are women and 76% of all HIV-positive women live in sub-Saharan Africa.
Conversely, traditional roles and societal values related to masculinity might encourage boys and men to adopt risky behaviours, including excessive alcohol use and concurrent sexual relationships, so increasing their risk of acquiring and transmitting HIV. Many harmful norms related to masculinity and femi-ninity also stigmatize transgender people, men who have sex with men, and other sexual minorities.
Levels of new HIV infections in sub-Saharan Africa continue to remain higher among women, a pattern that applies to every subregion in sub-Saharan Africa. Female-to-male ratios of new HIV infections range from 1.22:1 in West and East Africa to 1.33:1 in southern Africa, despite the diff erent types of epidemics and predominant modes of transmission in these subregions.
In other regions, men are more likely to be infected with HIV than women, oft en in concentrated epidemics involving men who have sex with men or people who inject drugs. Men who have sex with men continue to bear a high burden of HIV infection even in regions with generalized epidemics. In sub-Saharan Africa, HIV programming has largely neglected same-sex behaviour because of homophobia and the widespread criminalization of homosexuality.
THE GLOBAL COMMISSION ON HIV AND THE LAW
On 24 June 2010, UNDP and UNAIDS launched the Global Commission on HIV and the Law composed of renowned and independent global leaders in the areas of law, public health policy and governance. The establishment of the Commission is an essential milestone in supporting countries to remove punitive laws, policies, practices, stigma and discrimination that block effective responses to HIV. The Commission is supported by a Technical Advisory Group of law, human rights and public health experts.
As an outcome of its fi rst meeting in October 2010, the Commission will focus on the following issues: criminalization of sex workers, drug users, people living with HIV, men who have sex with men, gender inequality and violence against women, and legal barriers to treatment. Through its work, the Commission will marshal the evidence on the impact of the law on the HIV response, and make actionable recommendations on how to create effective, protective and enabling legal responses to HIV.
In the course of 2011, the Commission will hold a number of regional policy dialogues that will allow submissions from regional and national stakeholders, including governments, civil society, people living with HIV and representatives of key populations. These submissions will shape the fi nal report and recommendations of the Commission, expected in December 2011.

131Chapter 5: Human rights and gender equality | 2010 GLOBAL REPORT
5
Figure 5.6People newly infected with HIV, 2009Number of people newly infected with HIV annually by sex and geographical region, 2009.
Source: UNAIDS 2010.
0 .2 .4 .6 .8 1 1.2 1.4
Global
Caribbean
Central and South America
Asia
Eastern Europe and Central Asia
sub-Saharan Africa
North America and Western and
Central Europe
MaleFemale
People (millions)
Figure 5.7HIV prevalence among young people in sub-Saharan AfricaHIV prevalence among people 15–24 years old by sex in selected countries in sub-Saharan Africa.
Source: UNAIDS 2010.
BOTSWANA
REPUBLIC OF THE CONGO
LESOTHO
SOUTH AFRICA
ZIMBABWE
20–24 years15 –19 years
1% of females
1% of males

132 Chapter 5: Human rights and gender equality | 2010 GLOBAL REPORT
Research has found signifi cantly higher levels of infection among men who have sex with men than among men in general, and has also confi rmed that many men who have sex with men also have sex with women (30). Understanding the complexities of relationships engaged in by some married and long-term partners is important in focusing the HIV response. A recent study conducted in Botswana, Malawi, and Namibia found that 34% of men who have sex with men were married to women, and a total of 54% reported sex with both men and women in the previous six months (31). Marriage thus serves as a way to protect against possible prosecution and stigma against men who have sex with men (32,33). In Asia, data obtained through the Asia Intimate Partner Transmission Study (34) indicate that women are predomi-nantly infected by their husband or intimate partner. For example, recent data on HIV infection patterns in India reveal that 90% of women in India were infected within long-term relationships.
Sociocultural practices signifi cantly contribute to the risk of HIV infection, especially among young womenTh e eff ects of gender constructs are refl ected in HIV infection rates among young women in Africa. Demographic and health surveys in selected countries in Africa show that young women are at particularly high risk of HIV infec-tion, with rates substantially increasing among women 20–24 years old versus 15–19 years old (Figure 5.7). Th is is probably because young women, who are biologically more susceptible to HIV than men, also oft en have older male sexual partners, who are more likely than younger men to be infected with HIV. As a result, while levels of HIV infection among men rise slowly and peak at a lower level than female infection rates when men are in their mid- to late thir-ties, prevalence among women rises rapidly at a young age, with higher peaks when women are in their late twenties (35).
Data from sub-Saharan Africa indicate that women also engage in multiple concurrent partnerships (36). A recent ethnographic study conducted in the United Republic of Tanzania showed that both parents and daughters widely accepted transactional sex, including sex for power, pleasure, and material gain. Th e authors conclude that programmes that encourage young women to incorporate demands for safer sex into negotiations for gift s and money may ultimately be more eff ective than those that seek only to restrict transactional sex or highlight its health risks (37). Another study found that more affl uent women are at greater risk of contracting HIV, as they are more mobile, more likely to live in an urban area, and more able to aff ord a lifestyle that includes having a higher number of sexual partners (38).
A 2009 study in Brazil (39) shows men who have sex with men have much higher levels of HIV infection than men in general (10.5% versus 0.8%). Th e study found that although men who have sex with men report more casual sexual part-ners than men in general, condom use among was only at about 50%, despite a comprehensive programme to increase condom use among men who have sex with men. Furthermore, young men who have sex with men used condoms with slightly less frequency than men in general (54% versus 57%) (39).
“THE NUMBER OF COUNTRIES WITH A
SPECIFIC BUDGET FOR HIV ACTIVITIES RELATED TO
WOMEN IS LOW: 46% OF REPORTING COUNTRIES.”

133Chapter 5: Human rights and gender equality | 2010 GLOBAL REPORT
5
Figure 5.8Multisectoral HIV strategies specifically including and budgeting for womenPercentage of countries in which governments report that multisectoral HIV strategies specifi cally include and budget for women.
Source: Country Progress Reports 2010.
Women includedBudget included
% 20 40 60 80 100
Overall (171)
Caribbean (13)
Central and South America (19)
East, South, and South-East Asia (21)
Eastern Europe and Central Asia (11)
Middle East and North Africa (18)
Oceania (13)
sub-Saharan Africa (42)
North America and Western and Central Europe (34)

134 Chapter 5: Human rights and gender equality | 2010 GLOBAL REPORT
Women are included in HIV strategies but budgetary allocations are insuffi cientGovernments in 80% of countries (137 of 171) reported that they include women as a specifi c component of a multisectoral HIV strategy, but the rate of inclusion of women diff ers by geographical regions (Figure 5.8). Th e number of countries with a specifi c budget for HIV activities related to women is considerably lower: 46% (79 of the 171) reporting countries. Among countries in sub-Saharan Africa, nearly all strategic plans include interventions benefi ting women, and three quar-ters of countries allocate budget accordingly, indicating a greater awareness of the need for and benefi ts of women-centred AIDS responses.
Th e HIV epidemic is intertwined with sexual and reproductive healthData on unmet sexual and reproductive health needs, especially among young women a population highly aff ected by HIV and violence, underline the urgen-cy to address Millennium Development Goals 3, 4, 5 and 6 simultaneously. A WHO report on women and health (40) highlights the critical role of gender inequality in increasing vulnerability to HIV infection and other conditions and limiting access to health care services and information. A review of mater-nal mortality data revealed that HIV-related causes contributed to at least 20% of maternal deaths (41).
Countries with high HIV prevalence rates among young women are equally challenged by high teenage pregnancy rates, and the consequences of unintend-ed pregnancies in terms of unsafe abortion.
According to WHO, each year about 16 million women 15–19 years old around the world give birth, with most living in sub-Saharan Africa. In addition, at least 2.5 million adolescents have unsafe abortions every year (42). Further, anecdotal reports indicate that women living with HIV are pressured, and even forced, to undergo sterilization or to have an abortion.
Recent research carried out by civil society on sexual and reproductive health policies, undertaken in 12 countries in sub-Saharan Africa, Central and South America, the Caribbean, South-East Asia, and Eastern Europe by GESTOS, Brazil (43) confi rms that countries have reproductive and sexual health policies oriented towards women in place but generally fail to translate these into com-prehensive services, leaving many sexual and reproductive health needs unmet.
Violence and HIV infections are oft en associated and require integrated responsesViolence and the threat of violence can hamper women’s ability to adequately protect themselves from HIV infection and/or assert healthy sexual decision-making. In addition, women living with HIV are more likely to experience violence due to their HIV status (44).
Th e WHO study also found that many women have a traumatic experience when engaging in sexual intercourse for the fi rst time, with the prevalence of forced fi rst sex among adolescent girls younger than 15 years ranging between 11% and 45% globally. In addition, younger women, especially those 15–19
“VIOLENCE AND THE THREAT OF VIOLENCE
CAN HAMPER WOMEN’S ABILITY TO ADEQUATELY
PROTECT THEMSELVES FROM HIV INFECTION AND/OR
ASSERT HEALTHY SEXUAL DECISION-MAKING.”

135Chapter 5: Human rights and gender equality | 2010 GLOBAL REPORT
5
Figure 5.9Violence against womenProportion of ever-married women 15–49 years old who ever experienced physi-cal or sexual violence from their most recent spouse or co-resident partner, by country, 2008 or most recent survey.
Source: Demographic Health Surveys, 2002-2008, excepting Bangladesh, Ethiopia, Japan, Kenya, Samoa, Serbia, Tanzania and Thailand (WHO Multi-Country Study on Women’s health and Domestic Violence, 2004).
Figure 5.10Governments involving men in reproductive health programmes Percentage of countries in which governments report involving men in reproductive health programmes through information, education and communication, 2010.
Source: Country Progress Reports 2010.
% 20 40 60 80 100
Overall (171)
Caribbean (13)
Central and South America (19)
East, South, and South-East Asia (21)
Eastern Europe and Central Asia (11)
Middle East and North Africa (18)
Oceania (13)
sub-Saharan Africa (42)
North America and Western and Central Europe (34)
12-20%20.1-30%30.1-40%40.1-50%50.1-60%>60%No data

136 Chapter 5: Human rights and gender equality | 2010 GLOBAL REPORT
years old, were generally at higher risk of physical and/or sexual violence by a partner. In Swaziland, which has one of the highest levels of HIV prevalence, a 2007 study (45) showed that 33% of females 13–24 years old reported experi-encing some form of sexual violence before reaching 18 years of age.
A 2010 study in South Africa (46) confi rmed the association between violence and HIV infection. Power inequity in relationships and intimate partner violence increased the incident risk of HIV infection among young South African women. Prevalence of the population-attributable risk was 14% for power inequity in relationships and 12% for intimate partner violence. Th e GESTOS research (43) found that few countries have undertaken focused actions to prevent violence or to empower women survivors of violence. Th is fi nding is confi rmed by the recent WHO/UNAIDS publication (44), indicating that eff ective programmatic models such as Stepping Stones, IMAGES, and Sasa! have so far only been incorporated to a limited extent in the HIV response. It is notable that countries might have laws in place to punish rapists, but few have legislation that penalizes domestic violence (43).
Figure 5.9 shows that the prevalence of violence against women can be as high as 50% in some countries. Th e limited availability of epidemiological data on violence underlines the urgent need for additional evidence to guide policy and programmatic action to address it.
UNGASS reports for several countries in sub-Saharan Africa (7) outline the increased HIV vulnerability of women due to violence and sexual coercion and highlight the link with armed confl ict, including sexual violence against women in refugee camps. Other countries underline that violence against sex workers aff ects their capacity to insist on the use of condoms. Reporting on gender-based violence is not even. Outside sub-Saharan Africa, UNGASS reports are silent on violence against women and girls. In sub-Saharan Africa, countries have not reported on violence against men who have non-heterosexual identities or practices and transgender people.
Men who have sex with men and transgender people also face increased vulnerability to HIV infection due to violence and stigma. Historically, community-based organizations, rather than nationally funded HIV programmes, have led in attempting to increase access for men who have sex with men and transgender people. Such “self-help” eff orts are hampered where homosexuality is criminalized, as in sub-Saharan Africa, where men who have sex with men experience violence, live under the threat of anti-sodomy laws, and are oft en excluded from HIV responses (47).
Engaging men is crucial in eff ectively responding to HIVDespite evidence of positive changes in men’s and boys’ behaviour and atti-tudes when they participate in programmes that address HIV, sexual and reproductive health, and gender-based violence (48), few such programmes are in operation (49). UNGASS reporting also confi rms that governments in only 60% of countries report having promoted greater involvement of men
“MEN WHO HAVE SEX WITH MEN AND
TRANSGENDER PEOPLE ALSO FACE INCREASED VULNERABILITY TO HIV
INFECTION DUE TO VIOLENCE AND STIGMA.”

137Chapter 5: Human rights and gender equality | 2010 GLOBAL REPORT
5
in reproductive health programmes in information, education, and commu-nication on reproductive health (Figure 5.10). Th e failure to engage men also directly aff ects their health. For example, fewer men than women access HIV-related treatment. ■
ACTION ITEMS
HUMAN RIGHTS
■ Laws, policies, and regulations that create obstacles to effective HIV responses are increasingly acknowledged by key actors in the response. Countries should now take action to decriminalize sex workers, people who use drugs, men who have sex with men and transgender people, and reform other laws that block effective responses to HIV.
■ Despite increased reporting on protective laws, countries and other stake-holders should establish effective enforcement mechanisms and provide people living with HIV and other key populations with access to justice and redress through HIV-related legal services and legal literacy programmes.
■ Although progress has been noted, HIV-related stigma and discrimina-tion are still highly prevalent globally and are not yet being suffi ciently addressed. Countries and other stakeholders should urgently scale up comprehensive programmes that build capacities of HIV-related service providers, address stigma and discrimination in laws, institutions and com-munities, and empower those affected by HIV.
■ To help to realize human rights in the context of HIV, there must be more meaningful involvement of people living with and those vulnerable to HIV in national HIV responses, as well as meaningful coverage of all affected popu-lations. The GIPA principles must be fully implemented.
GENDER EQUALITY
■ To achieve universal access goals towards HIV prevention, treatment, care and support, the AIDS response needs to be women and girls centred and include a dedicated budget to address their needs.
■ Given that violence is widespread and that there is a clear association between violence against women and the spread of HIV, national HIV responses must include specifi c interventions to address violence.
■ All countries need to ensure that women have access to integrated quality HIV and sexual and reproductive health services that enable women to exer-cise their rights.
■ Men and boys need to be engaged in innovative approaches to change harmful social and cultural practices and norms, as part of HIV prevention.
■ Countries need to address the needs of men who have sex with men through prevention interventions that go beyond health service provision.

138 Chapter 5: Human rights and gender equality | 2010 GLOBAL REPORT
Wo
men
co
mp
one
nt o
f the
nat
iona
l st
rate
gic
pla
n b
udg
eted
Law
s, re
gul
atio
ns, p
olic
ies
pro
tect
ing
sp
ecifi
c su
b-p
op
ulat
ions
Law
s, re
gul
atio
ns, p
olic
ies
ob
stru
ctin
g
acce
ss t
o p
reve
ntio
n, t
reat
men
t, c
are
and
su
pp
ort
for
vuln
erab
le s
ubp
op
ulat
ions
Mec
hani
sm t
o re
cord
, do
cum
ent
and
ad
dre
ss
case
s o
f dis
crim
inat
ion
exp
erie
nced
by
peo
ple
liv
ing
with
HIV
, vul
nera
ble
sub
po
pul
atio
ns
Wo
men
as
a sp
ecifi
c co
mp
one
nt o
f th
e na
tiona
l str
ateg
ic p
lan
IEC
act
iviti
es o
n fi g
htin
g V
iole
nce
Ag
ains
t W
om
en
Law
s &
reg
ulat
ions
pro
tect
ing
peo
ple
liv
ing
with
HIV
ag
ains
t d
iscr
imin
atio
n
B A A A B A BA B
Yes/Agree
No/Disagree
Data not available
No NCPI report
No UNGASS report
Angola
Benin
Botswana
Burkina Faso
Burundi
Cameroon
Cape Verde
Central African Republic
Chad
Comoros
Congo
Côte d’Ivoire
Democratic Republic of Congo
Equatorial Guinea
Eritrea
Ethiopia
Gabon
Gambia
Ghana
Guinea
Guinea-Bissau
Kenya
Lesotho
Liberia
Madagascar
Malawi
Mali
Mauritania
Mauritius
Mozambique
Namibia
Niger
Nigeria
Rwanda
Sao Tome and Principe
Senegal
Seychelles
Sierra Leone
SUB-SAHARAN AFRICA
SCORECARD: HUMAN RIGHTS AND GENDER EQUALITY
A NCPI Part A (government response)
B NCPI Part B (civil society response)

139Chapter 5: Human rights and gender equality | 2010 GLOBAL REPORT
5
Wo
men
co
mp
one
nt o
f the
nat
iona
l st
rate
gic
pla
n b
udg
eted
Law
s, re
gul
atio
ns, p
olic
ies
pro
tect
ing
sp
ecifi
c su
b-p
op
ulat
ions
Law
s, re
gul
atio
ns, p
olic
ies
ob
stru
ctin
g
acce
ss t
o p
reve
ntio
n, t
reat
men
t, c
are
and
su
pp
ort
for
vuln
erab
le s
ubp
op
ulat
ions
Mec
hani
sm t
o re
cord
, do
cum
ent
and
ad
dre
ss
case
s o
f dis
crim
inat
ion
exp
erie
nced
by
peo
ple
liv
ing
with
HIV
, vul
nera
ble
sub
po
pul
atio
ns
Wo
men
as
a sp
ecifi
c co
mp
one
nt o
f th
e na
tiona
l str
ateg
ic p
lan
IEC
act
iviti
es o
n fi g
htin
g V
iole
nce
Ag
ains
t W
om
en
Law
s &
reg
ulat
ions
pro
tect
ing
peo
ple
liv
ing
with
HIV
ag
ains
t d
iscr
imin
atio
n
B A A A B A BA B
South Africa
Swaziland
Togo
Uganda
United Republic of Tanzania
Zambia
Zimbabwe
China
Democratic People’s Republic of Korea
Japan
Mongolia
Republic of Korea
Australia
Fiji
Kiribati
Marshall Islands
Micronesia, Federated States of
Nauru
New Zealand
Palau
Papua New Guinea
Samoa
Solomon Islands
Tonga
Tuvalu
Vanuatu
Afghanistan
Bangladesh
Bhutan
Brunei Darussalam
Cambodia
India
Indonesia
Lao People’s Democratic Republic
Malaysia
SUB-SAHARAN AFRICA Continued
EAST ASIA
OCEANIA
SOUTH AND SOUTH-EAST ASIA

140 Chapter 5: Human rights and gender equality | 2010 GLOBAL REPORT
SCORECARD: HUMAN RIGHTS AND GENDER EQUALITY
Wo
men
co
mp
one
nt o
f the
nat
iona
l st
rate
gic
pla
n b
udg
eted
Law
s, re
gul
atio
ns, p
olic
ies
pro
tect
ing
sp
ecifi
c su
b-p
op
ulat
ions
Law
s, re
gul
atio
ns, p
olic
ies
ob
stru
ctin
g
acce
ss t
o p
reve
ntio
n, t
reat
men
t, c
are
and
su
pp
ort
for
vuln
erab
le s
ubp
op
ulat
ions
Mec
hani
sm t
o re
cord
, do
cum
ent
and
ad
dre
ss
case
s o
f dis
crim
inat
ion
exp
erie
nced
by
peo
ple
liv
ing
with
HIV
, vul
nera
ble
sub
po
pul
atio
ns
Wo
men
as
a sp
ecifi
c co
mp
one
nt o
f th
e na
tiona
l str
ateg
ic p
lan
IEC
act
iviti
es o
n fi g
htin
g V
iole
nce
Ag
ains
t W
om
en
Law
s &
reg
ulat
ions
pro
tect
ing
peo
ple
liv
ing
with
HIV
ag
ains
t d
iscr
imin
atio
n
B A A A B A BA B
Maldives
Myanmar
Nepal
Pakistan
Philippines
Singapore
Sri Lanka
Thailand
Timor-Leste
Viet Nam
Armenia
Azerbaijan
Belarus
Georgia
Kazakhstan
Kyrgyzstan
Moldova, Republic of
Russian Federation
Tajikistan
Turkmenistan
Ukraine
Uzbekistan
Albania
Andorra
Austria
Belgium
Bosnia and Herzegovina
Bulgaria
Croatia
Cyprus
Czech Republic
Denmark
Estonia
Finland
France
Germany
SOUTH AND SOUTH-EAST ASIA Continued
EASTERN EUROPE AND CENTRAL ASIA
WESTERN AND CENTRAL EUROPE
Yes/Agree
No/Disagree
Data not available
No NCPI report
No UNGASS report
A NCPI Part A (government response)
B NCPI Part B (civil society response)

141Chapter 5: Human rights and gender equality | 2010 GLOBAL REPORT
5
Wo
men
co
mp
one
nt o
f the
nat
iona
l st
rate
gic
pla
n b
udg
eted
Law
s, re
gul
atio
ns, p
olic
ies
pro
tect
ing
sp
ecifi
c su
b-p
op
ulat
ions
Law
s, re
gul
atio
ns, p
olic
ies
ob
stru
ctin
g
acce
ss t
o p
reve
ntio
n, t
reat
men
t, c
are
and
su
pp
ort
for
vuln
erab
le s
ubp
op
ulat
ions
Mec
hani
sm t
o re
cord
, do
cum
ent
and
ad
dre
ss
case
s o
f dis
crim
inat
ion
exp
erie
nced
by
peo
ple
liv
ing
with
HIV
, vul
nera
ble
sub
po
pul
atio
ns
Wo
men
as
a sp
ecifi
c co
mp
one
nt o
f th
e na
tiona
l str
ateg
ic p
lan
IEC
act
iviti
es o
n fi g
htin
g V
iole
nce
Ag
ains
t W
om
en
Law
s &
reg
ulat
ions
pro
tect
ing
peo
ple
liv
ing
with
HIV
ag
ains
t d
iscr
imin
atio
n
B A A A B A BA B
Greece
Hungary
Iceland
Ireland
Israel
Italy
Latvia
Liechtenstein
Lithuania
Luxembourg
Malta
Monaco
Montenegro
Netherlands
Norway
Poland
Portugal
Romania
San Marino
Serbia
Slovakia
Slovenia
Spain
Sweden
Switzerland
Macedonia, The Former Yugoslav Republic of
Turkey
United Kingdom of Great Britain & Northern Ireland
Canada
Mexico
United States of America
Algeria
Bahrain
Djibouti
WESTERN AND CENTRAL EUROPE Continued
NORTH AMERICA
MIDDLE EAST AND NORTH AFRICA

142 Chapter 5: Human rights and gender equality | 2010 GLOBAL REPORT
Egypt
Iran, Islamic Republic of
Iraq
Jordan
Kuwait
Lebanon
Libyan Arab Jamahiriya
Morocco
Oman
Qatar
Saudi Arabia
Somalia
Sudan
Syrian Arab Republic
Tunisia
United Arab Emirates
Yemen
Antigua & Barbuda
Bahamas
Barbados
Cuba
Dominica
Dominican Republic
Grenada
Haiti
Jamaica
Saint Kitts and Nevis
Saint Lucia
Saint Vincent and the Grenadines
Trinidad and Tobago
Argentina
Belize
Bolivia
Brazil
Chile
Colombia
Wo
men
co
mp
one
nt o
f the
nat
iona
l st
rate
gic
pla
n b
udg
eted
Law
s, re
gul
atio
ns, p
olic
ies
pro
tect
ing
sp
ecifi
c su
b-p
op
ulat
ions
Law
s, re
gul
atio
ns, p
olic
ies
ob
stru
ctin
g
acce
ss t
o p
reve
ntio
n, t
reat
men
t, c
are
and
su
pp
ort
for
vuln
erab
le s
ubp
op
ulat
ions
Mec
hani
sm t
o re
cord
, do
cum
ent
and
ad
dre
ss
case
s o
f dis
crim
inat
ion
exp
erie
nced
by
peo
ple
liv
ing
with
HIV
, vul
nera
ble
sub
po
pul
atio
ns
Wo
men
as
a sp
ecifi
c co
mp
one
nt o
f th
e na
tiona
l str
ateg
ic p
lan
IEC
act
iviti
es o
n fi g
htin
g V
iole
nce
Ag
ains
t W
om
en
Law
s &
reg
ulat
ions
pro
tect
ing
peo
ple
liv
ing
with
HIV
ag
ains
t d
iscr
imin
atio
n
B A A A B A BA B
MIDDLE EAST AND NORTH AFRICA Continued
CARIBBEAN
CENTRAL AND SOUTH AMERICA
Yes/Agree
No/Disagree
Data not available
No NCPI report
No UNGASS report
A NCPI Part A (government response)
B NCPI Part B (civil society response)
SCORECARD: HUMAN RIGHTS AND GENDER EQUALITY

143Chapter 5: Human rights and gender equality | 2010 GLOBAL REPORT
5
Wo
men
co
mp
one
nt o
f the
nat
iona
l st
rate
gic
pla
n b
udg
eted
Law
s, re
gul
atio
ns, p
olic
ies
pro
tect
ing
sp
ecifi
c su
b-p
op
ulat
ions
Law
s, re
gul
atio
ns, p
olic
ies
ob
stru
ctin
g
acce
ss t
o p
reve
ntio
n, t
reat
men
t, c
are
and
su
pp
ort
for
vuln
erab
le s
ubp
op
ulat
ions
Mec
hani
sm t
o re
cord
, do
cum
ent
and
ad
dre
ss
case
s o
f dis
crim
inat
ion
exp
erie
nced
by
peo
ple
liv
ing
with
HIV
, vul
nera
ble
sub
po
pul
atio
ns
Wo
men
as
a sp
ecifi
c co
mp
one
nt o
f th
e na
tiona
l str
ateg
ic p
lan
IEC
act
iviti
es o
n fi g
htin
g V
iole
nce
Ag
ains
t W
om
en
Law
s &
reg
ulat
ions
pro
tect
ing
peo
ple
liv
ing
with
HIV
ag
ains
t d
iscr
imin
atio
n
B A A A B A BA B
Costa Rica
Ecuador
El Salvador
Guatemala
Guyana
Honduras
Nicaragua
Panama
Paraguay
Peru
Suriname
Uruguay
Venezuela
CENTRAL AND SOUTH AMERICAContinued

144 Chapter 6: HIV investments | 2010 GLOBAL REPORT
CHAPTER 6

145Chapter 6: HIV investments | 2010 GLOBAL REPORT
6
KEY FINDINGS
■ A total of US$ 15.9 billion was available for the AIDS response in 2009, US$ 10 billion short of what is needed in 2010.
■ In low- and middle-income countries, domestic resources account for over half of all AIDS-related investments. In low-income countries, however, 88% of spending on AIDS comes from international funding.
■ The majority of international funding for AIDS comes from bilateral donors. The United States of America is the largest international donor.
■ Investment in treatment and care is increasing—but many countries depend on international assistance for their treatment and care programmes.
■ HIV prevention programmes largely rely on international funds.
■ One third of countries make the AIDS response a high budgetary priority, based on disease burden and national income.
HIV INVESTMENTS

146 Chapter 6: HIV investments | 2010 GLOBAL REPORT
CHAPTER 6 | HIV INVESTMENTS
Investing for AIDS is a shared responsibilityInvesting for AIDS is a shared global responsibility that is paying clear dividends —it saves lives now, improves the quality of life of people living with HIV, and will lessen future burdens of cost and disease. In 2009, international donors and governments together provided US$ 15.9 billion for the global AIDS response, more than half of which came from domestic sources in low- and middle-income countries.
As a result of this unprecedented health investment, HIV prevalence is falling due to programmes that reduce risk behaviour, more than 5 million people are receiving life-saving antiretroviral therapy, millions of orphans have received basic education and health care, and more tolerant and enabling social environ-ments have been established in many countries through campaigns to reduce HIV-related stigma and discrimination. None of this would have been possible without the strong mobilization of the global community and the unprecedent-ed levels of funding provided collectively by donors, governments, the private sector, philanthropic organizations and individuals to address HIV.
However, the gap between investment needs and resource availability is widen-ing at a time of fi scal constraints. In 2009, there was a US$ 10 billion gap as, for the fi rst time, international assistance did not increase from 2008 levels.
In most countries, the AIDS response is funded by a complex interplay of domestic public spending, multilateral and bilateral aid, private-sector and philanthropic support and individual out-of-pocket spending. In many low- and middle-income countries, the largest source of HIV funding—52%—is domestic expenditure. Government donors provide an additional 42% and the international philanthropic sector 5% (1).
International investment levels have largely refl ected the epidemic distribution. Donors’ HIV-related spending is higher in countries with high HIV prevalence.Th e sharing of the responsibility has largely matched the fi nancial capabilities of individual countries and the magnitude of national epidemics.
Middle-income countries contributed a far greater proportion of the resources to their national AIDS response. Low-income countries’ share of investment for the national AIDS response was much smaller.
»

147Chapter 6: HIV investments | 2010 GLOBAL REPORT
6
DOMESTIC INVESTMENT PRIORITY INDEX (DIPI)
A new UNAIDS Domestic Investment Priority Index attempts to measure the extent of investment priority given by governments to support their national AIDS response. The Index is calculated by dividing the percentage of government revenue each country directs to the AIDS response by the population HIV prevalence. A high value usually indicates a high level of priority.
Domestic investment priority
index= x
Public expenditureon AIDS response
Government revenue
National population
People living with HIV
On average, the percentage of government revenue allocated to the AIDS response was one fi ft h of the population HIV prevalence. Fift y-fi ve countries allocated more than 0.5% of total government revenue. Data from 121 coun-tries show that one third of all countries make investments at a level that is commensurate with their national income levels and share of the global epi-demic burden. Among the 104 countries reporting, the median level of priority is 0.35. Th e Priority Index of a large majority of countries (70%), however, falls below this average—suggesting that many countries need to invest more in their AIDS responses.
Eight of 14 countries in West and Central Africa and six of 16 countries in east and southern Africa appear to be spending less on the AIDS response than might be expected given their disease burden and government resources. Th e Russian Federation and Ukraine, the two countries in Eastern Europe and Central Asia with the highest HIV prevalence, are spending at relatively low levels given their disease burden and ability to pay. Th e Domestic Investment Priority Index implies that both countries could contribute more domestic resources to the AIDS response (Figure 6.1). Figure 6.2 shows the distribution of funds to diff erent elements of the epidemic response.

148 Chapter 6: HIV investments | 2010 GLOBAL REPORT
Figure 6.1Domestic Investment Priority Index for countries with the highest HIV prevalence
DIPIYear Median spending
Above median Below median
DIPI=Domestic Investment Priority Index
Botswana 2008 0.31
Brazil 2008 0.80
Cameroon 2008 0.06
China 2009 0.69
Colombia 2009 0.52
Congo 2009 0.68
Côte d’Ivoire 2008 0.05
Democratic Republic of the Congo 2008 0.28
Ghana 2008 0.10
India 2009 0.07
Indonesia 2008 0.29
Kenya 2009 0.33
Lesotho 2008 0.33
Malawi 2009 0.03
Mozambique 2008 0.03
Nigeria 2008 0.13
Russian Federation 2008 0.19
South Africa 2009 0.18
Thailand 2009 0.37
Uganda 2008 0.72
Ukraine 2008 0.09
Viet Nam 2009 0.05
Zimbabwe 2009 0.04

149Chapter 6: HIV investments | 2010 GLOBAL REPORT
6
Figure 6.2HIV spending in low- and middle-income countries HIV spending in current US dollars by programmatic area in 43 low- and middle-income countries, 2006–2008.
Source: Country Progress Reports 2010.
2006US$ 2.6 billion
2007US$ 3.3 billion
2008US$ 4.1 billion
Treatment and care
Prevention
Programme management and administration strengthening
Orphans and vulnerable children
Incentives for human resources
Social protection and social services
Enabling environment
Research
Overall size of square is proportional to the total amount spent each year.
International investments are not increasing; donor fair share is not being metDonor governments’ actual disbursements for the AIDS response in 2009 stood at US$ 7.6 billion in 2009, a slight decrease from the US$ 7.7 billion made available in 2008. Th ese disbursements include both bilateral aid (funds disbursed directly from a donor country to a recipient country) and contributions to multilateral organizations (Figure 6.3). Th e majority of these resources went to the countries most aff ected by the epidemic. Th e top 20 recipients of aid account for 71% of the people living with HIV globally. Low-income countries received 78% of international funds, with another 14% going to lower-middle-income countries.
International assistance is crucial to sustaining the AIDS response. Of the 132 countries reporting HIV spending by funding source, 70 countries (53%) rely on international funds to fi nance 50% or more of HIV spending. And for the majority of the low- and middle-income countries, increasing domestic invest-ment priority to the optimum levels is not suffi cient to meet the needs of the AIDS response. Th e United States of America was the largest international

150 Chapter 6: HIV investments | 2010 GLOBAL REPORT
4159
0100
3961
8416
8614
3268
1090
1387
4258
1684
1189
2080
7426
6634
Canada US$ 129.9 million
Figure 6.3Channels used by major donor countries for disbursing international AIDS funding in 2009
Source: Kates et al. 2010.
DenmarkUS$ 193.3 million
IrelandUS$ 81.2 million
AustraliaUS$ 99.9 million
NetherlandsUS$ 381.9 million
United KingdomUS$ 779 million
SwedenUS$ 171.8 million
NorwayUS$ 130.2 million
Other GovernmentsUS$ 73.3 million
FranceUS$ 338.4 million
European UnionUS$ 118.1 million
GermanyUS$ 397.9 million
JapanUS$ 141.8 million
SpainUS$ 163.6 million
% of aid disbursed to Global Fund/UNITAID
% of aid disbursed bilaterally
Size of the circle is proportional to total disbursements.
Italy US$ 9.5 million
Bilateral funding includes HIV-earmarked multilateral funding; multilateral funding includes Global Fund contributions adjusted to represent the estimated HIV share based on Global Fund grant distribution by disease to date (61% for HIV) and UNITAID contri-butions adjusted to represent the estimated HIV share based on distribution by disease to date (49% for HIV).
8020

151Chapter 6: HIV investments | 2010 GLOBAL REPORT
6
2377
1288
TotalUS$ 7.6 billion
United StatesUS$ 4.4 billion

152 Chapter 6: HIV investments | 2010 GLOBAL REPORT
donor, accounting for 58% of all donor-government disbursements for AIDS and for 27% of the funding available for AIDS from all sources (donor govern-ments, multilateral institutions, domestic government spending, and private and individual out-of-pocket spending). Th e United Kingdom accounted for 10% of total donor government disbursements for AIDS, and Germany and the Netherlands accounted for 5% each.
International investment funding channelsBilateral funding remains the principal source of international AIDS funds for low- and middle-income countries. Of the US$ 7.6 billion donor governments made available for AIDS in 2009, US$ 5.9 billion (77%) was provided as bilater-al aid. Th e United States of America, the largest donor, provides a vast majority (88%) of its resources directly to countries.
However, a sizeable proportion (23%) of all international assistance is avail-able through multilateral institutions such as the Global Fund to fi ght AIDS, Tuberculosis and Malaria and UNITAID. Canada, the European Union, France, Japan and Spain each provided more than two thirds of their HIV-related inter-national assistance through the Global Fund and UNITAID in 2009. Th e Global Fund, which accounts for 72% of disbursements from multilateral sources, was the main source of AIDS funding in 52 of its 92 recipient countries.
Donor fair share of international investments for AIDS response is not being metComparing donor country funding for AIDS with their national gross domestic product (GDP) is one way of determining whether the contribution represents a fair share to the HIV response (Figure 6.4). Some donors give less in absolute terms than others but dedicate a greater share of their GDP to international assistance on AIDS. Most donor countries have the potential to provide sub-stantially more resources than they are currently providing.
Improving cost-eff ectiveness can help bridge the resource gapTh e resource availability for the AIDS response has always fallen short of what is needed. National programmes have had to ensure that programme choices are eff ective and effi cient to have the maximum impact in averting new HIV infections and AIDS-related deaths. Countries have seen best results when resources are tailored to epidemic patterns and have followed evidence: for example, treatment programmes that use the most eff ective combination of drugs and male circumcision as a priority component of prevention in generalized epidemics. In many countries, programmes promoting abstinence received far more resources than eff orts to increase condom use or reduce multiple partners. Evidence from Zambia shows that, without the right mix of behavioural interventions, gains are minimal.
Th e use of antiretroviral drugs for preventing mother-to-child HIV transmis-sion has been reported with costs of US$ 34 per disability-adjusted life-year

153Chapter 6: HIV investments | 2010 GLOBAL REPORT
6
Share of World GDPShare of All Resources for AIDS
% 105 15 20 25 30
United States
Japan
Germany
France
United Kingdom
Italy
Spain
Canada
Australia
Netherlands
Sweden
Norway
Denmark
Ireland
Figure 6.4Donor share of the world GDP and all resources available for AIDS, 2009
Source: Kates J et al. 2010.
GDP = gross domestic product. Bilateral funding includes HIV-earmarked multilateral funding. Bilateral funding includes multi-lateral funding earmarked for HIV but does not include the Global Fund or UNITAID. Global Fund contributions are adjusted to represent the estimated HIV share based on Global Fund grant distribution by disease to date (61% for HIV). UNITAID contribu-tions are adjusted to represent the estimated HIV share based on distributions by disease to date (49% for HIV). The resources available are estimated and represent disbursements from all sources.

154 Chapter 6: HIV investments | 2010 GLOBAL REPORT
Figure 6.5Price trends for commonly used antiretroviral therapy regimensPrice trends for some of the most commonly used antiretroviral therapy regimens for adult patients in low-income countries, 2008-2010.
Source: World Health Organization. Transaction prices for Antiretroviral Medicines and HIV Diagnostics from 2008 to March 2010. A summary report from the Global Price Reporting. Mechanism. Geneva May, 2010.
Figure 6.6Domestic and international HIV spending per person Domestic and international HIV spending in international US dollars (purchasing power parity) per person by country, 2009 or last available year.
Source: Country Progress Reports 2010.
200820092010 (1st quarter)
0 < 1.5
1.5 < 3
3 - 5
5 - 10
> 10
Not available or not reported
US Dollars per person
EFV+FTC+TDF [600mg+200+300]mg
[FTC+ TDF]+NVP [200+300]mg+200mg
EFV+[3TC+ZDV] 600mg+[150+300]mg
3TC+NVP+d4T [150+200+30]mg
[3TC+ZDV]+[LPV+RTV] [150+300]mg+[200+50]mg
A B C D E
A.
B.
C.
D.
E.100
200
300
400
500
600
700
ME
DIA
N T
RA
NS
AC
TIO
N P
RIC
E (
US
$/P
PY
)

155Chapter 6: HIV investments | 2010 GLOBAL REPORT
6
saved; however, providing full treatment to the pregnant woman saves the life of the mother and protects an infant from HIV infection and orphanhood.Th ere is also scope for innovation in promoting cost–eff ectiveness. Malawi is considering providing all pregnant women living with HIV with full anti-retroviral therapy (for their own health and for stopping the mother-to-child transmission of HIV). Although this is potentially expensive at the beginning, the cumulative benefi ts over the long term are better mother-to-child out-comes, reduced maternal mortality, reduced orphanhood, and increased school retention rates.
Reducing the unit cost of procurement as well as delivery of services is one way to improve value for money. Antiretroviral therapy costs today are in many cases a fraction of what they used to be, due in large part to effi ciency gained in service delivery and reduction in commodities prices (Figure 6.5). Th e median price of the most commonly prescribed regimen for adults has dropped to around US$ 0.17 per day. Prevention costs have also declined. Stopping a single case of infection among infants now costs a mere US$ 5 compared with thousands of dollars a few years ago. Th e cost of condoms has also declined to as low as US$ 0.04 per unit.
Investment for the AIDS response must be predictable and sustainableAs resource availability for HIV increased over the last decade, spending on HIV prevention, treatment, care and support have increased. Overall investments for the AIDS response grew by 82% between 2006 and 2008. Treatment and care programmes received 56% and HIV prevention programmes received 20% of the total resources available. Nearly 71 countries depend on international sources for funding more than 50% of their prevention activities. In contrast, the cost of treatment and care programmes on average appears to be shared equally between domestic sources and international sources. However, 26 countries reported that nearly 77% or more of their treatment and care expenditure relies on external sources (Figure 6.6, Figure 6.7 and Figure 6.8).
At a time when demand for universal access for prevention and treatment is growing, lack of additional resources is slowing down the pace of achieving results for people. As countries strive to increase their investments for the AIDS response, attention is needed to make long-term resource availability predictable. ■

156 Chapter 6: HIV investments | 2010 GLOBAL REPORT
Figure 6.7Annual HIV domestic and international spending Annual HIV domestic public and international spending in current US dollars, total and per person living with HIV, among the 15 low- and middle-income countries with the highest spending, 2009 or last available year, international dollars (purchasing power parity).
Source: Country Progress Reports 2010
Spending per person living with HIV(International dollars)
Income Level Total spending(US$ Millions)
South Africa
Russian Federation
Kenya
Brazil
Nigeria
China
Botswana
Uganda
Argentina
Mexico
Thailand
Mozambique
India
Rwanda
Colombia
LMI=Lower Middle IncomeUMI=Upper Middle Income LI=Low Income
500 1000 1500 2000 2500$$ 1 2 3 4
M I L L I O N ST H O U S A N D S
Public International
UMI LMI LI

157Chapter 6: HIV investments | 2010 GLOBAL REPORT
6
Figure 6.8Regional HIV spending in low- and middle-income countries HIV spending in current US dollars by region and programmatic area in 106 low- and middle-income countries, 2009 or last available year.
Source: Country Progress Reports 2010.
Trea
tmen
t and
car
e
Prev
entio
n
Prog
ram
me
man
age-
men
t and
adm
inis
trat
ion
stre
ngth
enin
g
Orp
hans
and
vu
lner
able
chi
ldre
n
Ince
ntiv
es fo
r hum
an
reso
urce
s
Soci
al p
rote
ctio
n an
d
soci
al s
ervi
ces
Enab
ling
envi
ronm
ent
Rese
arch
Caribbean, North, Central, and South America
East, South, and South-East Asia
sub-Saharan Africa
Eastern Europe and Central Asia
Middle East and North Africa
Oceania
Western and Central Europe
Eastern Europe and Central Asiatotal US$ 978 million
Western and Central Europetotal US$ 171.1 million
Oceaniatotal US$ 4.7 million
Caribbean, North, Central, and South Americatotal US$ 1.7 billion
sub-Saharan Africatotal US$ 2.8 billion
Middle East and North Africatotal US$ 67.6 million
All regionstotal US$ 6.5 billion
East, South, and South-East Asiatotal US$ 712.9 million

158 Chapter 6: HIV investments | 2010 GLOBAL REPORT

159Chapter 6: HIV investments | 2010 GLOBAL REPORT
6
ACTION ITEMS
■ The AIDS response must be fully funded. This is a shared responsibility between governments, donor countries, civil society and the private sector.
■ Donor countries must continue to increase their allocations to the AIDS response.
■ Countries that have the potential to increase domestic investments must do so to accelerate progress towards universal access to HIV prevention, treatment, care, and support.
■ Resources for AIDS programmes must be predictable. National strategic plans must be realistic.
■ Each national programme should set priorities to ensure that available resources are invested appropriately in cost-effective programmes.
■ Donor investments must match country priorities.
■ Investments must be evidence informed and reach populations most in need fi rst so that the returns are maximized and meet human rights standards.
■ HIV treatment programmes should be expanded urgently and utilize optimal combinations of high-quality and less-toxic drugs that reduce mortality over the long term.
■ HIV prevention investments are cost-effective when they include combina-tion approaches that maximize synergies rather than isolated interventions.

160 Chapter 6: HIV investments | 2010 GLOBAL REPORT
SCORECARD: HIV INVESTMENTS
Angola 2009 0.29
Benin 2009 1.42
Botswana 2008 0.31
Burkina Faso 2008 1.25
Burundi 2008 3.11
Cameroon 2008 0.06
Cape Verde 2009 -
Central African Republic 2008 0.12
Chad 2008 0.34
Comoros - -
Congo, Republic of the 2009 0.68
Côte d’Ivoire 2008 0.05
Democratic Republic of Congo 2008 0.28
Equatorial Guinea 2009 0.19
Eritrea 2009 -
Ethiopia - -
Gabon 2009 0.18
Gambia 2008 0.23
Ghana 2008 0.10
Guinea 2009 0.24
Guinea-Bissau 2009 0.46
Kenya 2009 0.33
Lesotho 2008 0.33
Liberia - -
Madagascar 2008 7.03
Malawi 2009 0.03
Mali 2008 0.38
Mauritania - -
Mauritius - -
Mozambique 2008 0.03
Namibia - -
Niger 2008 0.21
Nigeria 2008 0.13
Rwanda 2008 0.61
Sao Tome and Principe 2009 -
Senegal 2008 0.38
Seychelles 2009 -
Sierra Leone 2007 0.11
South Africa 2009 0.18
Swaziland 2007 0.11
Togo 2008 0.11
Uganda 2008 0.72
United Republic of Tanzania - -
Zambia - -
Zimbabwe 2009 0.04
China 2009 0.69
Democratic People’s Republic of Korea - -
Japan 2009 0.67
Mongolia 2009 1.05
Republic of Korea - -
SUB-SAHARAN AFRICA
EAST ASIA
Year Domestic priority to HIV
25
50
75%
Total prevention
25
50
75%
Total care and treatment2
5
50
75%
Total HIV spending
% of HIV spending from public and international sources
Public
International
Data not available

161Chapter 6: HIV investments | 2010 GLOBAL REPORT
6
Australia - -
Fiji 2009 0.55
Kiribati - -
Marshall Islands 2009 -
Micronesia, Federated States of 2009 -
Nauru 2009 -
New Zealand - -
Palau 2009 -
Papua New Guinea - -
Samoa 2009 -
Solomon Islands 2009 -
Tonga 2009 -
Tuvalu 2009 -
Vanuatu 2009 -
Afghanistan 2009 -
Bangladesh 2009 0.00
Bhutan - -
Brunei Darussalam - -
Cambodia 2008 1.35
India 2009 0.07
Indonesia 2008 0.29
Lao People’s Democratic Republic 2009 0.18
Malaysia 2009 0.27
Maldives - -
Myanmar 2008 -
Nepal 2007 0.19
Pakistan 2009 1.21
Philippines 2009 0.69
Singapore 2009 0.43
Sri Lanka 2009 0.32
Thailand 2009 0.37
Timor-Leste 2009 -
Viet Nam 2009 0.05
Armenia 2009 0.30
Azerbaijan 2009 0.37
Belarus 2009 0.35
Georgia 2009 1.06
Kazakhstan 2009 1.18
Kyrgyzstan 2009 2.06
Moldova 2009 1.16
Russian Federation 2008 0.19
Tajikistan 2009 0.88
Turkmenistan - -
Ukraine 2008 0.09
Uzbekistan 2009 2.49
OCEANIA
SOUTH ANDSOUTH-EAST ASIA
EASTERN EUROPE AND CENTRAL ASIA
Year Domestic priority to HIV
25
50
75%
Total prevention
25
50
75%
Total care and treatment2
5
50
75%
Total HIV spending
% of HIV spending from public and international sources

162 Chapter 6: HIV investments | 2010 GLOBAL REPORT
SCORECARD: HIV INVESTMENTS
Albania - -
Andorra - -
Austria - -
Belgium 2008 0.37
Bosnia & Herzegovina 2009 0.38
Bulgaria 2009 -
Croatia 2009 1.90
Cyprus - -
Czech Republic 2009 6.68
Denmark - -
Estonia 2008 0.33
Finland - -
France - -
Germany - -
Greece 2008 0.65
Hungary 2009 0.16
Iceland - -
Ireland - -
Israel - -
Italy - -
Latvia 2009 0.05
Liechtenstein - -
Lithuania - -
Luxembourg 2009 0.00
Malta - -
Monaco - -
Montenegro 2009 -
Netherlands - -
Norway - -
Poland 2009 0.63
Portugal - -
Romania 2009 2.02
San Marino - -
Serbia - -
Slovakia - -
Slovenia - -
Spain 2009 0.82
Sweden 2009 0.00
Switzerland 2009 0.05
The Former Yugoslav Republic of Macedonia 2008 2.70
Turkey - -
United Kingdom of Great Britain 2009 0.06 & Northern Ireland
Canada - -
Mexico 2009 1.09
United States of America - -
Algeria 2009 0.05
Bahrain - -
Djibouti 2009 0.00
MIDDLE EAST AND NORTH AFRICA
WESTERN AND CENTRAL EUROPE
NORTH AMERICA
25
50
75%
Total prevention
25
50
75%
Total care and treatment2
5
50
75%
Total HIV spendingYear Domestic priority to HIV
% of HIV spending from public and international sources
Public
International
Data not available

163Chapter 6: HIV investments | 2010 GLOBAL REPORT
6
Egypt 2008 0.74
Iran, Islamic Republic of 2008 -
Iraq - -
Jordan 2009 1.14
Kuwait 2009 0.23
Lebanon - -
Libyan Arab Jamahiriya - -
Morocco 2008 0.26
Oman 2009 -
Qatar - -
Saudi Arabia 2009 -
Somalia 2009 -
Sudan - -
Syrian Arab Republic 2009 -
Tunisia - -
United Arab Emirates 2009 -
Yemen 2009 -
Antigua & Barbuda 2009 -
Bahamas 2009 -
Barbados 2009 0.61
Cuba 2009 -
Dominica 2009 -
Dominican Republic 2008 0.21
Grenada 2009 -
Haiti - -
Jamaica - -
Saint Kitts & Nevis 2009 -
Saint Lucia - -
Saint Vincent & the Grenadines 2009 -
Trinidad & Tobago 2009 0.20
Argentina 2008 1.06
Belize 2009 0.19
Bolivia 2009 0.31
Brazil 2008 0.80
Chile 2008 1.07
Colombia 2009 0.52
Costa Rica 2008 1.16
Ecuador 2009 0.00
El Salvador 2008 1.22
Guatemala 2008 0.00
Guyana - -
Honduras 2008 0.84
Nicaragua 2008 3.96
Panama 2008 0.83
Paraguay 2009 0.68
Peru 2009 0.35
Suriname - -
Uruguay 2007 0.36
Venezuela 2009 0.21
MIDDLE EAST AND NORTH AFRICA Continued
CARIBBEAN
CENTRAL AND SOUTH AMERICA
25
50
75%
Total prevention
25
50
75%
Total care and treatment2
5
50
75%
Total HIV spendingYear Domestic priority to HIV
% of HIV spending from public and international sources

164 References | 2010 GLOBAL REPORT
Chapter 11. Demographic and Health Surveys [web site]. Calverton, MD, MEASURE DHS, ICF Macro, 2010
(http://www.measuredhs.com, accessed 17 October 2010).2. Population Division [web site]. New York, Population Division, Department of Economic and Social
Aff airs, United Nations, 2010 (http://www.un.org/esa/population, accessed 17 October 2010).3. WHO, UNICEF and UNAIDS. Towards universal access: scaling up priority HIV/AIDS interventions
in the health sector. Progress report 2010. Geneva, World Health Organization, 2010 (http://www.who.int/hiv/pub/2010progressreport/report/en/index.html, accessed 17 October 2010).
Chapter 21. Gregson S et al. HIV decline in Zimbabwe due to reductions in risky sex? Evidence from a
comprehensive epidemiological review. International Journal of Epidemiology, 2010, doi:10.1093/ije/dyq055.
2. Gregson S et al. HIV decline associated with behavior change in eastern Zimbabwe. Science, 2006, 311:664–666.
3. Shisana O et al. South African National HIV Prevalence, Incidence, Behaviour and Communication Survey, 2008: the health of our children. Cape Town, HSRC Press, 2010.
4. Rehle T et al. Trends in HIV prevalence, incidence, and risk behaviors among children, youth, and adults in South Africa, 2002 to 2008. 17th Conference on Retroviruses and Opportunistic Infections, San Francisco, California, USA, 16–19 February 2010 (Abstract 37; http://retroconference.org/2010/Abstracts/37244.htm, accessed 17 October 2010).
5. Hallett TB et al. Estimates of HIV incidence from household-based prevalence surveys. AIDS, 2010, 24:147–152.
6. Sentinel surveillance of HIV and AIDS in Kenya 2006. Nairobi, National AIDS Control Council, National AIDS/STI Control Programme, 2007.
7. Rapport de surveillance de l’infection par le VIH et de la syphilis au Benin. Porto-Novo, Ministry of Health, Benin, 2008.
8. Every Death Counts Writing Group. Every death counts: use of mortality audit data for decision making to save the lives of mothers, babies, and children in South Africa. Lancet, 2008, 371:1294–1304.
9. WHO, UNICEF and UNAIDS. Towards universal access: scaling up priority HIV/AIDS interventions in the health sector. Progress report 2010. Geneva, World Health Organization, 2010 (http://www.who.int/hiv/pub/2010progressreport/report/en/index.html, accessed 17 October 2010).
10. Stover J et al. Estimated HIV trends and program eff ects in Botswana. PLoS ONE, 2008, 3:e3729.11. National AIDS Coordinating Agency, Botswana. Progress report of the national response to the 2001
Declaration of Commitment on HIV and AIDS: Botswana country report 2010. Gaborone, Ministry of Health, 2010.
12. Jahn A et al. Population-level eff ect of HIV on adult mortality and early evidence of reversal aft er introduction of antiretroviral therapy in Malawi. Lancet, 2008, 371:1603–1611.
13. Antiretroviral Treatment in Lower Income Countries (ART-LINC) Collaboration [web site]. Berne, ART-LINC, 2010 (http://www.art-linc.org, accessed 17 October 2010).
14. Anand A et al. Knowledge of HIV status, sexual risk behaviours and contraceptive need among people living with HIV in Kenya and Malawi. AIDS, 23:1565–1573, 2009.
15. Cleland J et al. Monitoring sexual behaviour in general populations: a synthesis of lessons of the past decade. Sexually Transmitted Infections, 2004, 80 (Suppl. 2):ii1–ii7.
REFERENCES

165References | 2010 GLOBAL REPORT
R
16. Magaret A. Regional diff erences in prevalence of HIV-1 discordance in Africa and enrolment of HIV-1 discordant couples into an HIV-1 prevention trial. PLoS ONE, 2008, 3:e1411.
17. Kristin L et al. New heterosexually transmitted HIV infections in married or cohabiting couples in urban Zambia and Rwanda: an analysis of survey and clinical data. Lancet, 2008, 371:2183–2191.
18. Mngadi S et al. Swaziland: HIV prevention response and modes of transmission analysis. Mbabane, National Emergency Response Council on HIV/AIDS, 2009.
19. Khobotlo M et al. Lesotho: HIV prevention response and modes of transmission analysis. Maseru, Lesotho National AIDS Commission, 2009.
20. Gelmon L et al. Kenya: HIV prevention response and modes of transmission analysis. Nairobi, Kenya National AIDS Control Council, 2009.
21. Wabwire-Mangen F et al. Uganda: HIV modes of transmission and prevention response analysis. Kampala, Uganda National AIDS Commission, 2009.
22. Smith AD et al. Men who have sex with men and HIV/AIDS in sub-Saharan Africa. Lancet, 2009, 374:416–422.
23. Lowndes CM et al. West Africa HIV/AIDS epidemiology and response synthesis: implications for prevention. Washington, DC, World Bank, 2008.
24. Asiimwe A, Koleros A, Chapman J. Understanding the dynamics of the HIV epidemic in Rwanda: modeling the expected distribution of new HIV infections by exposure group. Kigali, National AIDS Control Commission, MEASURE Evaluation, 2009.
25. Ndiaye HD et al. Surprisingly high prevalence of subtype C and specifi c HIV-1 subtype/CRF distribution in men having sex with men in Senegal. Journal of Acquired Immune Defi ciency Syndromes, 2009, 52:249–252.
26. Beyrer C et al. Sexual concurrency, bisexual practices, and HIV among Southern African men who have sex with men. Sexually Transmitted Infections, 2010, 86:323–327.
27. Nnaji I et al. Sexual practices of MSM in Nigeria and interest in microbicides. Microbicides: Building Bridges in HIV Prevention, Pittsburgh, Pennsylvania, 22–25 May 2010 (Abstract 156).
28. Baral S et al. HIV prevalence, risks for HIV infection, and human rights among men who have sex with men (MSM) in Malawi, Namibia, and Botswana. PLoS ONE, 2009, 4:e4997.
29. Federal Ministry of Health. HIV/STI integrated biological and behavioral surveillance survey (IBBSS) 2007. Abuja, Federal Republic of Nigeria, 2007.
30. Lane T et al. High HIV prevalence among men who have sex with men in Soweto, South Africa: results from the Soweto men’s study. AIDS and Behavior, 2009, DOI:10.1007/s10461-009-9598-y.
31. Parry C et al. Rapid assessment of drug-related HIV risk among men who have sex with men in three South African cities. Drug and Alcohol Dependence, 2008, 95:45–53.
32. Sanders EJ et al. Establishing a high risk HIV-negative cohort in Kilifi , Kenya. AIDS Vaccine 06, Amsterdam, Netherlands, 29 August – 1 September 2006 (http://www.intmedpress.com/serveFile.cfm?sUID=247babfc-305d-4a0c-94b1-e4120ca23160, accessed 17 October 2010).
33. Sanders EJ et al. HIV-1 infection in high risk men who have sex with men in Mombasa, Kenya. AIDS, 2007, 21:2513–2520.
34. Wade AS et al. HIV infection and sexually transmitted infections among men who have sex with men in Senegal. AIDS, 2005, 19:2133–2140.
35. Sulliman F, Ameerberg SAG. Mauritius Epidemiology Network on Drug Use report: January–June 2004. Port Louis, Mauritius Epidemiology Network on Drug Use, 2004.
36. Odek-Ogunde M et al. Seroprevalence of HIV, HBC and HCV in injecting drug users in Nairobi, Kenya: World Health Organization Drug Injecting Study Phase II fi ndings. XV International Conference on AIDS, Bangkok, Th ailand, 11–16 July 2004 (Abstract WePeC6001; http://gateway.nlmnih.gov/MeetingAbstracts/ma?f=102283927.html, accessed 17 October 2010.

166 References | 2010 GLOBAL REPORT
37. Dahoma MJU et al. HIV and substance abuse: the dual epidemics challenging Zanzibar. African Journal of Drug and Alcohol Studies, 2006, 5:129–138.
38. Mathers BM et al. Global epidemiology of injecting drug use and HIV among people who inject drugs: a systematic review. Lancet, 2008, 372:1733–1745.
39. Punyacharoensin N, Viwatwongkasem C. Trends in three decades of HIV/AIDS epidemic in Th ailand by nonparametric backcalculation method. AIDS, 2009, 2:1143–1152.
40. Wang L et al. Th e 2007 estimates for people at risk for and living with HIV in China: progress and challenges. Journal of Acquired Immune Defi ciency Syndromes, 2009, 50:414–418.
41. Country report on the follow-up to the Declaration of Commitment on HIV/AIDS. Jakarta, National AIDS Commission, Indonesia, 2008.
42. National AIDS Control Organisation. UNGASS country progress report 2008: India. New Delhi, Ministry of Health and Family Welfare, 2008.
43. Ramesh BM et al. Determinants of HIV prevalence among female sex workers in four south Indian states: analysis of cross-sectional surveys in twenty-three districts. AIDS, 2008, 22(Suppl. 5):S35–S44.
44. Moses S et al. Impact of an intensive HIV prevention programme for female sex workers on HIV prevalence among antenatal clinic attenders in Karnataka State, South India. AIDS, 2008, 22(Suppl. 5): S101–S108.
45. Bokhari A et al. HIV risk in Karachi and Lahore, Pakistan: an emerging epidemic in injecting and commercial sex networks. International Journal of STD and AIDS, 2007, 18:486–492.
46. National AIDS Prevention and Alleviation Committee. UNGASS country progress report – Th ailand. Nonthaburi, Th ailand, Ministry of Public Health, 2008.
47. Monitoring the impact of project community’s action for AIDS prevention and control in Dien Bien, Quang Tri, An Giang, Kien Giang and Dong Th ap Provinces. Hanoi, Viet Nam Commission for Population, 2005.
48. HIV/AIDS estimates and projections 2005–2010. Hanoi, General Department of Preventive Medicine and HIV/AIDS Control, Ministry of Health, Viet Nam, 2005.
49. Tran TN et al. HIV prevalence and factors associated with HIV infection among male injecting drug users under 30: a cross-sectional study in Long An, Vietnam. BMC Public Health, 2006, 6:248.
50. National AIDS Programme. Report of the HIV sentinel sero-surveilance survey 2008 – Myanmar. Yangon, Government of Myanmar, 2009.
51. Sheridan S et al. HIV prevalence and risk behaviour among men who have sex with men in Vientiane Capital, Lao People’s Democratic Republic, 2007. AIDS, 2009, 23:409–414.
52. Brahmam GNV et al. Sexual practices, HIV and sexually transmitted infections among self-identifi ed men who have sex with men in four high HIV prevalence states in India. AIDS, 2008, 22(Suppl. 5):S45–S57.
53. Solomon SS et al. High prevalence of HIV, STI and unprotected anal intercourse among men who have sex with men and men who have sex with men and women in Tamil Nadu, India. 16th Conference on Retroviruses and Opportunistic Infections, Montreal, Canada, 8–11 February 2009 (oral presentation 171LB; http://img.thebody.com/confs/croi2009/posters/171LB_Solomon_slides.pdf, accessed 17 October 2010).
54. van Griensven J et al. Trends in HIV prevalence, estimated HIV incidence, and risk behavior among men who have sex with men in Bangkok, Th ailand, 2003–2007. Journal of Acquired Immune Defi ciency Syndromes, 2010, 53:234–239.
55. Wimonsate W et al. Successful start of a preparatory HIV cohort study among men who have sex with men (MSM) in Bangkok, Th ailand: Preliminary baseline, follow-up and HIV incidence data. 17th International AIDS Conference, Mexico City, Mexico, 3–8 August 2008 (Abstract MOAC0105; http://www.aids2008.or/Pag/PSession.aspx?s=246, accessed 17 October 2010).
56. Ruan S et al. Rising HIV prevalence among married and unmarried men who have sex with men: Jinan, China. AIDS and Behavior, 2009, 13:671–676.

167References | 2010 GLOBAL REPORT
R
57. Guo H et al. Rapidly increasing prevalence of HIV and syphilis and HIV-1 subtype characteriza-tion among men who have sex with men in Jiangsu, China. Sexually Transmitted Diseases, 2009, 36:120–125.
58. Ma X et al. Trends in prevalence of HIV, syphilis, hepatitis C, hepatitis B, and sexual risk behavior among men who have sex with men: results of 3 consecutive respondent-driven sampling surveys in Beijing, 2004 through 2006. Journal of Acquired Immune Defi ciency Syndromes, 2007, 45:581–587.
59. Li A et al. Sexual behavior and risk factors for HIV infection among homosexual and bisexual men in Th ailand. AIDS and Behavior, 2009, 13:318–327.
60. Kruglov YV et al. Th e most severe HIV epidemic in Europe: Ukraine’s national HIV prevalence estimates for 2007. Sexually Transmitted Infections, 2008, 84(Suppl. 1):i37–i41.
61. EuroHIV. HIV/AIDS surveillance in Europe: end-year report 2006, No. 75. Saint-Maurice, Institut de Veille Sanitaire, 2007.
62. HIV infection in Ukraine in 2007. Kyiv, National AIDS Prevention Centre & Ministry of Health, 2008 (Information Bulletin No. 29).
63. Dolan K et al. HIV in prison in low-income and middle-income countries. Lancet Infectious Diseases, 2007, 7:32–41.
64. Report on the global AIDS epidemic. Geneva, UNAIDS, 2008 (http://www.unaids.org/en/KnowledgeCentre/HIVData/GlobalReport/2008, accessed 17 October 2010).
65. Des Jarlais DC et al. HIV among injecting drug users: current epidemiology, biologic markers, respondent-driven sampling, and supervised-injection facilities. Current Opinions in HIV and AIDS, 2009, 4:308–313.
66. EuroHIV. HIV/AIDS surveillance in Europe: end-year report 2005, No. 73. Saint-Maurice, Institut de Veille Sanitaire, 2006.
67. van de Laar MJ et al. HIV/AIDS surveillance in Europe: update 2007. Eurosurveillance, 2008, 13(50):pii=19066.
68. Hidden HIV epidemic amongst MSM in Eastern Europe and Central Asia. Geneva, UNAIDS, 2009 (http://www.unaids.org/en/KnowledgeCentre/Resources/FeatureStories/archive/2009/20090126_MSMUkraine.asp, accessed 17 October 2010).
69. Baral S et al. Elevated risk for HIV infection among men who have sex with men in low- and middle-income countries 2000–2006: a systematic review. PLoS Medicine, 2007, 4:e339.
70. Van Griensven F et al. Th e global epidemic of HIV infection among men who have sex with men. Current Opinions in HIV and AIDS, 2009, 4:300–307.
71. Gaillard EM, Eustache L. Estimation de la séroprevalence du VIH en Haïti en 2007 selon le milieu de residence urbain et rural pour chacun des 10 départments. Washington, DC, United States Agency for International Development, 2007.
72. República Dominicana: encuesta demográfi ca y de salud 2007 (ENDESA 2007): resultados básicos. Santo Domingo, Centro de Estudios Sociales y Demográfi cos and Macro Internacional Inc, 2008.
73. Figueroa JP. Th e HIV epidemic in the Caribbean: meeting the challenges of achieving universal access to prevention, treatment and care. West Indian Medical Journal, 2008, 57:195–203.
74. CAREC annual report 2007. Port of Spain, Caribbean Epidemiology Centre, 2007.75. Resultados Preliminares de las Estimaciones de VIH/SIDA Nacionales de la República Dominicana
2006. Santo Domingo, Secretaría de Estado de Salud Pública y Asistencia Social de República Dominicana, 2007.
76. Encuestas de vigilancia del comportamiento sobre VIH/ SIDA/ ITS en RSX y HSH del Área V de Salud. Santo Domingo, Secretaría de Estado de Salud Pública y Asistencia Social de República Dominicana, 2005.
77. National HIV Programme. Country progress report to the Secretary General of the United Nations on the United Nations General Assembly Special Session. Jamaica, Ministry of Health, 2008.

168 References | 2010 GLOBAL REPORT
78. Presidential Commission on HIV and AIDS. UNGASS country progress report: Republic of Guyana. Georgetown, Government of Guyana, 2008 (http://data.unaids.org/pub/Report/2008/guyana_2008_country_progress_report_en.pdf, accessed 17 October 2010.
79. Ottosson D. State-sponsored homophobia: a world survey of laws prohibiting same sex activity between consenting adults. Brussels, International Lesbian, Gay, Bisexual, Trans and Intersex Association, 2008.
80. de Arazoza H et al. Th e HIV/AIDS epidemic in Cuba: description and tentative explanation of its low HIV prevalence. BMC Infectious Diseases, 2007, 7:130.
81. Halperin DT et al. Understanding the HIV epidemic in the Dominican Republic: a prevention success story in the Caribbean? Journal of Acquired Immune Defi ciency Syndromes, 2009, 51(Suppl. 1):S52–S59.
82. United States Centers for Disease Control and Prevention. Incidence and diagnoses of HIV infection – Puerto Rico, 2006. MMWR – Morbidity and Mortality Weekly Report, 2009, 58:589–591.
83. Estudio de seroprevalencia del virus de immunodefi ciencia humana, sifi lis y comportamiento en hombres que tienen sexo con hombres en la gran areas metropolitana de Costa Rica. San Jose, Ministerio de Salud de Costa Rica, 2009.
84. Soto RJ et al. Sentinel surveillance of sexually transmitted infections/HIV and risk behaviors in vulnerable populations in 5 Central American countries. Journal of Acquired Immune Defi ciency Syndromes, 2007, 46:101–111.
85. Sanchez J et al. High HIV and ulcerative transmitted infection incidence estimates among men who have sex with men in Peru: awaiting an eff ective preventive intervention. Journal of Acquired Immune Defi ciency Syndromes, 2009, 51(Suppl. 1):S47–S51.
86. Barrientos JE et al. HIV prevalence, AIDS knowledge, and condom use among female sex workers in Santiago, Chile. Cadernos de Saúde Pública, 2007, 23:1777–1784.
87. Estudio TRaC de VIH/SIDA entre trabajadoras sexuales femeninas en San Salvador, Santa Ana, San Miguel, Sonsonate y San Vicente. Guatemala City, Population Services International, 2008.
88. Sabidó M et al. Th e UALE project: decline in the incidence of HIV and sexually transmitted infections and increase in the use of condoms among sex workers in Guatemala. Journal of Acquired Immune Defi ciency Syndromes, 2009, 51(Suppl. 1):S35–S41.
89. Coelho HC et al. HIV prevalence and risk factors in a Brazilian penitentiary. Cadernos de Saúde Pública, 2007, 23:2197–2204.
90. Epidemiological surveillance report. Buenos Aires, National AIDS Program, Argentina, 2005.91. Alarcón Villaverde JO. Modos de transmisión del VIH en América Latina: resultados de la aplicación
del modelo. Washington, DC, Pan American Health Organization, 2009.92. ANRS, Inserm and Ined. First results of the CSF survey – context of sexuality in France. Paris, French
National Agency for Research on AIDS and Viral Hepatitis (ANRS), 2007.93. Semaille C et al. Recently acquired HIV infection in men who have sex with men (MSM) in France,
2003–2008. Eurosurveillance, 2009, 14(48):pii=19425.94. Bezemer D et al. A resurgent HIV-1 epidemic among men who have sex with men in the era of
potent antiretroviral therapy. AIDS, 2008, 22:1071–1077.95. Likatavicius G et al. An increase in newly diagnosed HIV cases reported among men who have
sex with men in Europe, 2000–2006: implications for a European public health strategy. Sexually Transmitted Infections, 2008, 84:499–505.
96. Lattimore S et al. Situation of HIV infections and STIs in the United Kingdom in 2007. Eurosurveillance, 2008, 13(49):pii=1909.
97. Sullivan PS et al. Re-emergence of the HIV epidemic among men who have sex with men in North America, Western Europe, and Australia, 1996–2005. Annals of Epidemiology, 2009, 19:423–431.
98. Hall HI et al. Estimation of HIV incidence in the United States. Journal of the American Medical Association, 2008, 300:520–529.

169References | 2010 GLOBAL REPORT
R
99. Summary: estimate of HIV prevalence and incidence in Canada, 2008. Ottawa, Public Health Agency of Canada, 2009.
100. Folch C et al. Sexual risk behaviour and its determinants among men who have sex with men in Catalonia, Spain. Eurosurveillance, 2009, 14(47):pii=19415.
101. Cowan SA, Haff J. HIV and risk behaviour among men who have sex with men in Denmark – the 2006 Sex Life Survey. Eurosurveillance, 2008, 13(48):pii=19050.
102. Jansen I et al. Increasing trend in HIV-1 incidence among young men who have sex with men in Amsterdam: a 25-year prospective cohort study. 17th Conference on Retroviruses and Opportunistic Infections, San Francisco, California, USA, 16–19 February 2010 (Abstract 35; http://retroconference.org/2010/Abstracts/37331.htm, accessed 17 October 2010).
103. Hall HI et al. Estimating the lifetime risk of a diagnosis of the HIV infection in 33 states, 2004–2005. Journal of Acquired Immune Defi ciency Syndromes, 2008, 49:294–297.
104. Patterson TL et al. Prevalence and correlates of HIV infection among female sex workers in 2 Mexico-US border cities. Journal of Infectious Diseases, 2008, 197:728–732.
105. Strathdee SA et al. Individual, social, and environmental infl uences associated with HIV infection among injection drug users in Tijuana, Mexico. Journal of Acquired Immune Defi ciency Syndromes, 2008, 47:369–376.
106. Brouwer KC et al. Estimated numbers of men and women infected with HIV/AIDS in Tijuana, Mexico. Journal of Urban Health, 2006, 83:299–307.
107. van den Broek IVF et al. Sexually transmitted infections, including HIV, in the Netherlands in 2007. Bilthoven, Netherlands, National Institute for Public Health and the Environment, 2008.
108. On Monitoring of the United Nations General Assembly Special Session on HIV and AIDS: Islamic Republic of Iran country report. Tehran, National AIDS Committee Secretariat, Ministry of Health and Medical Education, 2010 (http://data.unaids.org/pub/Report/2010/iran_2010_country_progress_report_en.pdf, accessed 17 October 2010).
109. Kheirandish P et al. Prevalence and correlates of hepatitis C infection among male injection drug users in detention, Tehran, Iran. Journal of Urban Health, 2009, 86:902–908.
110. Parviz A. Scaling up HIV/AIDS prevention and care in Iranian prisons [slide presentation]. Meeting of the World Health Organization Strategic and Technical Advisory Committee for HIV, 20 October 2005.
111. Zamani S et al. High prevalence of HIV infection associated with incarceration among community-based drug users in Tehran, Iran. Journal of Acquired Immune Defi ciency Syndromes, 2006, 42:342–346.
112. WHO, UNICEF and UNAIDS. Towards universal access: scaling up priority HIV/AIDS interventions in the health sector. Progress report 2009. Geneva, World Health Organization, 2010 (http://www.who.int/hiv/2009progressreport/report/en/index.html, accessed 17 October 2010).
113. Shawky W et al. HIV surveillance and epidemic profi le in the Middle East and North Africa. Journal of Acquired Immune Defi ciency Syndromes, 2009, 51(Suppl. 1):S83–S95.
114. Abu-Raddad LJ et al. Characterizing the HIV/AIDS epidemic in the Middle East and North Africa: time for strategic action. Washington, DC, World Bank, 2010.
115. Coghlan B et al. HIV in the Pacifi c: 1984–2007. Melbourne, Australia, Burnet Institute, 2009.116. Guy RJ et al. HIV diagnoses in Australia: diverging epidemics within a low-prevalence country.
Australian Health Review, 2007, 187:437–440.117. HIV/AIDS, viral hepatitis and sexually transmissible infections in Australia. Annual surveillance report
2009. Sydney, Australia, National Centre in HIV Epidemiology and Clinical Research, University of New South Wales, 2009.
118. Th e 2007 estimation report on the HIV epidemic in Papua-New Guinea. Port Moresby, National AIDS Council and National Department of Health, 2008 (http://www.nacs.org.pg/resources/documents/Th e_2007_Estimation_Report_on_the_HIV_Epidemic_in_PNG.pdf, accessed 17 October 2010).

170 References | 2010 GLOBAL REPORT
Chapter 31. International Group on Analysis of Trends in HIV Prevalence. Trends in HIV prevalence and
sexual behaviour among young people aged 15–24 years in countries most aff ected by HIV. Sexually Transmitted Infections, in press.
2. UNAIDS/World Bank. New HIV infections by mode of transmission in West Africa: a multi-country analysis. Dakar, Senegal, UNAIDS Regional Support Team for West and Central Africa, 2010.
3. Kenya HIV prevention response and modes of transmission analysis. Nairobi, Kenya National AIDS Control Council, 2009.
4. Colvin M et al. Analysis of HIV prevention response and modes of HIV transmission: the UNAIDS-GAMET supported synthesis process. Sunninghill, UNAIDS Regional Support Team for Eastern and Southern Africa, 2009 (http://www.unaidsrstesa.org/fi les/MoT_0.pdf, accessed 17 October 2010).
5. Commission on AIDS in Asia. Redefi ning AIDS in Asia: craft ing an eff ective response. New Delhi, Oxford University Press, 2008.
6. Central Statistical Offi ce, Ministry of Health, Tropical Diseases Research Centre, University of Zambia, and Macro International Inc. Zambia Demographic and Health Survey 2007. Calverton, MD, CSO and Macro International Inc., 2009.
7. Central Statistical Offi ce, Ministry of Health and MEASURE Evaluation. Zambia Sexual Behaviour Survey 2000. Lusaka, Central Statistical Offi ce and MEASURE Evaluation, 2002.
8. Central Statistical Offi ce, Ministry of Health and MEASURE Evaluation. Zambia Sexual Behaviour Survey 2003. Lusaka, Central Statistical Offi ce and MEASURE Evaluation, 2004.
9. Central Statistical Offi ce, Ministry of Health and MEASURE Evaluation. Zambia Sexual Behaviour Survey 2005. Lusaka, Central Statistical Offi ce and MEASURE Evaluation, 2006.
10. Central Statistical Offi ce, Ministry of Health, University of Zambia and MEASURE Evaluation. Zambia Sexual Behaviour Survey 2009. Lusaka, Central Statistical Offi ce and MEASURE Evaluation, 2010.
11. Country Progress Reports 2010 [web site]. Geneva, UNAIDS, 2010 (http://www.unaids.org/en/KnowledgeCentre/HIVData/CountryProgress/2010CountryProgressAllCountries.asp, accessed 17 October 2010).
12. Mathers B et al. Global epidemiology of injecting drug use and HIV among people who inject drugs: a systematic review. Lancet, 2008, 372:1733–1745.
13. Secretariat to the Reference Group to the United Nations on HIV and Injecting Drug Use. Women who inject drugs: a review of their risks, experience and needs. Sydney, National Drug and Alcohol Research Centre, University of New South Wales, Australia, in press.
14. Mahy M et al. A proxy measure for HIV incidence among populations at increased risk to HIV. Journal of HIV/AIDS Surveillance and Epidemiology, 2010, 2:8.
15. Bi-weekly OST monitoring report. Kiev, Ukrainian Institute of Public Health Policy, 2009.16. WHO, UNODC and UNAIDS. Technical guide for countries to set targets for universal access to HIV
prevention, treatment and care for injecting drug users. Geneva, World Health Organization, 2009 (http://www.who.int/hiv/pub/idu/targetsetting/en/index.html, accessed 17 October 2010).
17. Mathers B et al. HIV prevention, treatment and care for people who inject drugs: a systematic review of global, regional and national coverage. Lancet, 2010, 375:1014–1028.
18. Th e Global Forum on MSM and HIV (MSMGF) Civil Society Consultation: MSM and Transgender Values and Preferences Regarding HIV- and STI-related Services. Geneva, World Health Organization, in press.
19. Avahan—the India AIDS initiative: fact sheet. Seattle, Global Health Program, Bill & Melinda Gates Foundation, 2009.
20. Moses S et al. Increased condom use and decreased HIV/STI prevalence among female sex workers following a targeted prevention program in Karnataka, South India. 18th International AIDS Conference, Vienna, Austria, 18–23 July 2010 (http://pag.aids2010.org/Session.aspz?s=439, accessed 17 October 2010).

171References | 2010 GLOBAL REPORT
R
21. Strathdee SA et al. HIV and risk environment for people who inject drugs: the past, present, and future. Lancet, 2010, 376:268–284.
22. Maticka-Tyndale E, Wildish J, Gichuru M. Th irty-month quasi-experimental evaluation follow-up of a national primary school HIV intervention in Kenya. Sex Education: Sexuality, Society and Learning, 2010, 10:113–130.
23. Leclerc-Madlala S. Intergenerational/age-disparate sex: policy and programme action brief. Technical Meeting on Young Women in HIV Hyper-endemic Countries in Southern Africa. Sunninghill, UNAIDS Regional Support Team for West and Central Africa, 2008 (http://www.unaidsrstesa.org/userfi les/fi le/womenGirls_AgeDisparate.pdf, accessed 17 October 2010).
24. Baird S et al. Th e short-term impacts of a schooling conditional cash transfer programme on the sexual behavior of young women. Washington, DC, World Bank, 2009 (Policy Research Working Paper 5089).
25. A cash transfer program reduces HIV infections among adolescent girls. Washington, DC, World Bank, 2010 (http://siteresources.worldbank.org/DEC/Resources/HIVExeSummary%28Malawi%29.pdf, accessed 17 October 2010).
26. aids2031 Social Drivers Working Group. Revolutionizing the AIDS response: building AIDS resilient communities. Worcester, MA, International Development, Community and Environment, Clark University and International Center for Research on Women, 2010.
27. Weiser SD et al. Food insuffi ciency is associated with high risk sexual behaviour among women in Botswana and Swaziland. PLoS Medicine, 2007:1576–1577.
28. Miller CL et al. Food insecurity and sexual risk in an HIV endemic community in Uganda. AIDS Behavior, 2010 (DOI:10.1007/s10461-0109693-0).
29. Oyefara JL. Food insecurity, HIV/AIDS pandemic and sexual behaviour of female commercial sex workers in Lagos metropolis, Nigeria. SAHARA J: Journal of Social Aspects of HIV/AIDS Research Alliance, 2007, 4:626–635.
30. Frega R et al. Food insecurity in the context of HIV and AIDS 2031. International Development, Community and Environment (IDCE), Clark University and International Center for Research on Women (ICRW). 2010,
31. WHO, UNICEF and UNAIDS. Towards universal access: scaling up priority HIV/AIDS interventions in the health sector. Progress report 2010. Geneva, World Health Organization, 2010 (http://www.who.int/hiv/pub/2010progressreport/report/en/index.html, accessed 17 October 2010).
32. Millennium Development Goals indicators [database]. New York, United Nations Statistics Division, 2010 (http://unstats.un.org/unsd/mdg, accessed 17 October 2010).
33. Meeting reports and presentations [web site]. Durham, NC, Clearinghouse on Male Circumcision for HIV Prevention, 2010 (http://www.malecircumcision.org/publications/meeting_reports.html, accessed 17 October 2010).
34. Abdool Karim Q. Eff ectiveness and safety of tenofovir gel, an antiretroviral microbicide, for the prevention of HIV infection in women. Science, 2010, 329:1168–1174.
35. Cohen M. HIV treatment as prevention: to be or not to be? Journal of Acquired Immune Defi ciency Syndromes, 2010, 55:137–138.
Chapter 41. World Health Organization, United Nations Children’s Fund and UNAIDS. Towards universal access:
scaling up priority HIV/AIDS interventions in the health sector. Progress report 2010. Geneva, World Health Organization, 2010 (http://www.who.int/hiv/pub/2010progressreport/report/en/index.html, accessed 17 October 2010).
2. Antiretroviral therapy for HIV infection in adults and adolescents: recommendations for a public health approach. 2010 revision. Geneva, World Health Organization, 2010 (http://www.who.int/hiv/pub/arv/adult2010/en/index.html, accessed 17 October 2010).

172 References | 2010 GLOBAL REPORT
3. Global tuberculosis control: epidemiology, strategy fi nancing: WHO report 2010. Geneva, World Health Organization, 2010 (http://www.who.int/tb/en, accessed 17 October 2010).
4. De Wit JBF, Ellard J. Qualitative analysis of 2010 UNGASS country progress reports. Sydney, National Centre in HIV Social Research, University of New South Wales, 2010.
5. Migrant health: access to HIV prevention, treatment and care for migrant populations in EU/EEA countries. Stockholm, European Centre for Disease Prevention and Control, 2009 (http://ecdc.europa.eu/en/publications/Publications/0907_TER_Migrant_health_HIV_Access_to_treatment.pdf, accessed 17 October 2010).
6. Country Progress Reports 2010 [web site]. Geneva, UNAIDS, 2010 (http://www.unaids.org/en/KnowledgeCentre/HIVData/CountryProgress/2010CountryProgressAllCountries.asp, accessed 17 October 2010).
7. Mathers B et al. HIV prevention, treatment and care for people who inject drugs: a systematic review of global, regional and national coverage. Lancet, 2010, 375:1014–1028.
8. Th e world health report 2006—Working together for health. Geneva, World Health Organization, 2006 (http://www.who.int/whr2006/en, accessed 17 October 2010).
9. Callaghan M, Ford N, Schneider H. A systematic review of task-shift ing for HIV treatment and care in Africa. Human Resources for Health, 2010, 8:8.
10. Wood R et al. Nurse management is not inferior to doctor management of ARV patients: the CIPRA South Africa randomized trial. 5th IAS Conference on HIV Pathogenesis, Treatment and Prevention, Cape Town, South Africa, 19–22 July 2009 (Abstract LBPED03; http://www.ias2009.org/pag/Abstracts.aspx?AID=3822, accessed 17 October 2010).
11. Shumbusho F et al. Task shift ing for scale-up of HIV care: evaluation of nurse-centered antiretroviral treatment at rural health centers in Rwanda. PLoS Medicine, 2009, 6:e1000163.
12. Gimbel-Sherr K et al. Task shift ing to mid-level clinical health providers: an evaluation of quality of ART provided by tecnicos de medicina and physicians in Mozambique. XVII International AIDS Conference, Mexico City, Mexico, 3–8 August 2008 (Abstract WEAX0105; http://www.aids2008.org/pag/Abstracts.aspx?SID=321&AID=12944, accessed 17 October 2010).
13. Shulman D et al. Task-shift ing in the pharmacy: a framework for expanding and strengthening services in rural Malawi. 5th IAS Conference on HIV Pathogenesis, Treatment and Prevention, Cape Town, South Africa, 19–22 July 2009 (Abstract CDD094; http://www.ias2009.org/pag/Abstracts.aspx?AID=3370, accessed 17 October 2010).
14. Van Rie A et al. A nurse-centered primary health care model for HIV care of patients with active tuberculosis: antiretroviral treatment initiation decision making. 5th IAS Conference on HIV Pathogenesis, Treatment and Prevention, Cape Town, South Africa, 19–22 July 2009 (Abstract TUPED133; http://www.ias2009.org/pag/Abstracts.aspx?AID=3253, accessed 17 October 2010).
15. Badri M, Wilson D, Wood R. Eff ect of highly active antiretroviral therapy on incidence of tuberculosis in South Africa: a cohort study. Lancet, 2002, 359:2059–2064.
16. Golub J et al. Th e impact of antiretroviral therapy and isoniazid preventive therapy on tuberculosis incidence in HIV-infected patients in Rio de Janeiro, Brazil. AIDS, 2007, 21:1441–1448.
17. Girardi E et al. Incidence of tuberculosis among HIV-infected patients receiving highly active antiretroviral therapy in Europe and North America. Clinical and Infectious Diseases, 2005, 41:1772–1782.
18. Lugada E et al. Rapid implementation of an integrated large scale HIV testing and counseling malaria and diarrhea prevention campaign in rural Kenya. PLoS One, 2010, 5(8).
Chapter 51. UNDP, UNAIDS and the Global Fund to Fight AIDS, Tuberculosis and Malaria. Human rights
programmes in Global Fund–supported HIV responses in Rounds 6 and 7. New York, United Nations Development Programme, in press.

173References | 2010 GLOBAL REPORT
R
2. People living with HIV Stigma Index study China. Beijing, Institute of Social Development Research, China Central Party School.
3. Índice de Estigma de personas que viven con VIG e SIDA en Paraguay. Asunción, Fundación Vencer and New York, United Nations Population Fund, 2009.
4. People living with HIV Stigma Index study Rwanda. Kigali, AVVAIS, CNLS, RRP+ and UNAIDS, 2009.
5. Give Stigma the Index Finger! People living with HIV Stigma Index study Scotland. London, International Planned Parenthood Federation, 2009.
6. PCB NGO Representatives. 26th Meeting of the UNAIDS Programme Coordinating Board, Geneva, Switzerland, 22–24 June 2010: report by the PCB NGO representative. Geneva, UNAIDS, 2010 (http://data.unaids.org/pub/Agenda/2010/20100504_ngo_report_fi nal_en.pdf, accessed 17 October 2010).
7. Country Progress Reports 2010 [web site]. Geneva, UNAIDS, 2010 (http://www.unaids.org/en/KnowledgeCentre/HIVData/CountryProgress/2010CountryProgressAllCountries.asp, accessed 17 October 2010).
8. Qualitative analysis of UNGASS 2010 country progress reports. Sydney, University of New South Wales, 2010.
9. Reding A. Sexual orientation and human rights in the Americas. New York, World Policy Institute, 2003.
10. Johnson CA. Off the map: how HIV/AIDS programming is failing same-sex practicing people in Africa. New York, International Gay and Lesbian Human Rights Commission, 2007.
11. Violence on the basis of sexual orientation, gender identity and gender expression against non-heteronormative women in Asia. New York, International Gay and Lesbian Human Rights Commission, 2010.
12. Observatorio Ciudadano desde la Sociedad Civil para el Monitoreo sobre los progresos realizados en la aplicación del UNGASS Honduras 2010. Toronto, International Council of AIDS Service Organizations, 2010 (http://www.icaso.org/resources/shadow2010_Honduras_2010_UNGASS_ShadowReport.pdf, accessed 17 October 2010).
13. GIPA Report Card: pilot phase report, Kenya, India, Lesotho, Trinidad and Tobago. Amsterdam, Global Network of People Living with HIV/AIDS, 2008.
14. Grover A. Report of the Special Rapporteur on the right of everyone to the enjoyment of the highest attainable standard of physical and mental health, Anand Grover. Geneva, Offi ce of the United Nations High Commissioner for Human Rights, 2010 (http://www2.ohchr.org/english/bodies/hrcouncil/docs/14session/A.HRC.14.20.pdf, accessed 17 October 2010).
15. Ottosson D. State-sponsored homophobia—a world survey of laws prohibiting same sex activities between consenting adults. Brussels, International Lesbian, Gay, Bisexual, Trans and Intersex Association, 2010.
16. 2009 country reports on human rights practices [web site]. Washington, DC, United States Separtment of State, 2010 (http://www.state.gov/g/drl/rls/hrrpt/2009/index.htm, accessed 17 October 2010).
17. Making the law work for the HIV response: a snapshot of selected laws that support or block universal access to HIV prevention, treatment, care and support. Geneva, UNAIDS, 2010 (http://data.unaids.org/pub/BaseDocument/2010/20100728_hr_poster_en.pdf, accessed 17 October 2010).
18. Mapping of restrictions on entry, stay and residence of people living with HIV. Geneva, UNAIDS, 2009.19. Global Database on HIV-specifi c Travel and Residence Restrictions [online database]. Brussels,
German AIDS Federation, European AIDS Treatment Group and International AIDS Society, 2010 (http://www.hivtravel.org, accessed 17 October 2010).
20. Senior K. HIV, human rights, and men who have sex with men. Lancet Infectious Diseases, 2010, 10:448–449.

174 References | 2010 GLOBAL REPORT
21. Blankenship KM, Koester S. Criminal law, policing policy, and HIV risk in female street sex workers and injection drug users. Journal of Law and Medical Ethics, 2002, 30:548–559.
22. Sex work, HIV/AIDS, and human rights in central and eastern Europe and central Asia. Vilnius, Eurasian Harm Reduction Network, 2005.
23. Drugs, punitive laws, policies, and policing practices, and HIV/AIDS: a briefi ng paper. New York, Human Rights Watch and the International Harm Reduction Association, 2009 (http://www.hrw.org/en/news/2009/11/30/drugs-punitive-laws-policies-and-policing-practices-and-hivaids, accessed 17 October 2010).
24. Jürgens R et al. People who use drugs, HIV, and human rights. Lancet, 2010, 376:475–485.25. Political Declaration on HIV/AIDS. Geneva, UNAIDS, 2001 (http://www.unaids.org/en/
AboutUNAIDS/Goals/2006Declaration, accessed 17 October 2010).26. Th e global criminalization scan report 2010: documenting trends, presenting evidence. Amsterdam,
Global Network of People Living with HIV, 2010 (http://www.gnpplus.net/images/stories/Rights_and_stigma/2010_Global_Criminalisation_Scan.pdf, accessed 17 October 2010).
27. Greig A et al. Gender and AIDS: time to act. AIDS, 2008, 22(Suppl. 2):S35–S43.28. Gay J et al. What works for women and girls: evidence for HIV/AIDS interventions. New York, Open
Society Institute, 2010.29. Agenda for accelerated country action for women, girls, gender equality and HIV—operational plan for
the UNAIDS action framework: addressing women, girls, gender equality and HIV. Geneva, UNAIDS, 2010 (http://data.unaids.org/pub/Agenda/2010/20100226_jc1794_agenda_for_accelerated_country_action_en.pdf, accessed 17 October 2010).
30. Smith AD et al. Men who have sex with men and HIV/AIDS in sub-Saharan Africa. Lancet, 2009, 374:416–422.
31. Beyer C et al. Bisexual concurrency, bisexual partnerships, and HIV among southern African men who have sex with men. Sexually Transmitted Infections, 2010, 86:323–327.
32. White R, Carr R. Homosexuality and HIV/AIDS stigma in Jamaica. Culture, Health and Society, 2005, 7:347–359.
33. da Silva D et al. Study about vulnerability and risk to HIV infection among men who have sex with men in Maputo city. Maputo, Lambda—Mozambican Association for Sexual Minority Rights, Population Services Mozambique, Pathfi nder International, United Nations Population Fund, 2010 (http://www.lambda.org.mz/attachments/589_StudyHSH2.pdf, accessed 17 October 2010).
34. HIV transmission in intimate partner relationships in Asia. Geneva, UNAIDS, 2009 (http://data.unaids.org/pub/report/2009/intimate_partners_report_en.pdf, accessed 17 October 2010).
35. Gouws E et al. Th e epidemiology of HIV infection among young people aged 15–24 years in southern Africa. AIDS, 2008, 22(Suppl. 4):S5–S16.
36. De Walque D. Sero-discordant couples in fi ve African countries: implications for prevention strategies. Population and Development Review, 2007, 33:501–523.
37. Wamoyi J et al. “Women’s bodies are shops”: beliefs about transactional sex and implications for understanding gender power and HIV prevention in Tanzania. Archives of Sexual Behavior, 2010 (DOI:10.1007/s10508-010-9646-8).
38. Hanson H, Hanson C. HIV control in low-income countries in sub-Saharan Africa: are the right things done? Global Health Action, 2008 (DOI:10.3402/gha.v.1i0.1837, http://journals.sfu.ca/coaction/index.php/gha/article/viewArticle/1837, accessed 17 October 2010).
39. National STD and AIDS Commission. Targets and commitments made by Member States at the United Nations General Assembly Special Session on HIV/AIDS: Brazilian responses 2008–2009—country progress report. Brasilia, Ministry of Health, Federative Republic of Brazil, 2010.
40. Women and health: today’s evidence, tomorrow’s agenda. Geneva, World Health Organization, 2009 (http://www.who.int/gender/women_health_report/en/index.html, accessed 17 October 2010).

175References | 2010 GLOBAL REPORT
R
41. Hogan MC et al. Maternal mortality for 181 countries, 1980–2008: a systematic analysis of progress towards Millennium Development Goal 5. Lancet, 2010, 375:1609–1623.
42. Adolescent pregnancy: the facts. Geneva, World Health Organization, 2010 (http://www.who.int/making_pregnancy_safer/topics/adolescent_pregnancy/en/index.html, accessed 17 October 2010).
43. UNGASS-AIDS and sexual and reproductive health of women: civil society report 2010. Recife, Brazil, GESTOS, 2010.
44. WHO/UNAIDS. Addressing violence against women and HIV/AIDS: what works? Geneva, World Health Organization, 2010 (http://www.who.int/reproductivehealth/publications/violence/9789241599863/en/index.html, accessed 17 October 2010).
45. Violence against children in Swaziland—fi ndings from a national survey on violence against children in Swaziland. New York, UNICEF, Atlanta, United States Centers for Disease Control and Prevention, 2007.
46. Jewkes R et al. Intimate partner violence, relationship power inequity, and incidence of HIV infection in young women in South Africa: a cohort study. Lancet, 2010, 376:41–48.
47. Baral S et al. A systematic review of HIV epidemiology and risk factors among MSM in sub-Saharan Africa. AIDS 2008—XVII International AIDS Conference, Mexico City, Mexico, 3–8 August 2008 (Abstract MOPE0393; http://www.aids2008-abstract.org/aids2008_book_vol1_web.pdf, accessed 17 October 2010).
48. Barker G et al. Question gender norms with men to improve health outcomes: evidence of impact. Global Public Health, 2010, 5:539–553.
49. Men-streaming in sexual and reproductive health and HIV: a toolkit for policy development and advocacy. London, IPPF and MenEngage, 2010.
Chapter 61. Kates J et al. Financing the response to AIDS in low- and middle-income countries: international
assistance from the G8, European Commission and other donor governments in 2009. Geneva, UNAIDS and Menlo Park, CA, Kaiser Family Foundation, 2010 (http://www.kff .org/hivaids/upload/7347-06.pdf, accessed 17 October 2010).
2. Country Progress Reports 2010 [web site]. Geneva, UNAIDS, 2010 (http://www.unaids.org/en/KnowledgeCentre/HIVData/CountryProgress/2010CountryProgressAllCountries.asp, accessed 17 October 2010).
3. UNAIDS 2009 data for United Nations General Assembly Special Session on HIV/AIDS indicators; Development Indicators Databases [online database]. Washington, DC, World Bank, 2010 (http://data.worldbank.org/data-catalog, accessed 17 October 2010).
4. Heritage Foundation [web site]. Washington, DC, Heritage Foundation, 2010 (http://www.heritage.org, accessed 17 October 2010).
5. WHO, UNICEF and UNAIDS. Towards universal access: scaling up priority HIV/AIDS interventions in the health sector. Progress report 2010. Geneva, World Health Organization, 2010 (http://www.who.int/hiv/pub/2010progressreport/report/en/index.html, accessed 17 October 2010).

176 Annexes | 2010 GLOBAL REPORT
ANNEXES

177
A1
Annexes | 2010 GLOBAL REPORT
178 ANNEX 1 HIV AND AIDS ESTIMATES AND DATA, 2009 AND 2001
208 ANNEX 2 COUNTRY PROGRESS INDICATORS AND DATA, 2004 TO 2010
ANNEXES

178 Annex 1: HIV and AIDS estimates and data, 2009 and 2001 | 2010 GLOBAL REPORT
and improved coordination with countries have resulted in improved estimates of HIV and AIDS for 2009. To allow readers to assess recent trends in the epidemic, we also present 2001 estimates developed using the same methodology and data as for the 2009 estimates.
Th e new estimates in this report are presented together with ranges, called ‘plausible bounds’. Th ese bounds refl ect the certainty associated with each of the estimates. Th e wider the bounds are, the greater the uncertainty surrounding an estimate. Th e extent of uncertainty depends mainly on the type of epidemic, the quality, coverage and consistency of a country’s surveillance system and, in generalized epidemics, whether or not a population-based survey with HIV testing was conducted.
Adults in this report are defi ned as men and women aged 15+ years, per the recommendations of the UNAIDS Reference Group on Estimates, Modelling and Projections. Th e group also recognizes the burden of infection and disease beyond the age of 49. However, the HIV prevalence percent (%) continues to be for adults aged 15–49 years to allow comparisons across countries.
Notes on specifi c indicators are listed in the following tables
1. ESTIMATED NUMBER OF PEOPLE LIVING WITH HIV, 2009 AND 2001
Th ese estimates include all people with HIV infection, whether or not they have developed symptoms of AIDS, in 2009 and 2001.
ADULTS AND CHILDREN Estimated number of adults and children living with HIV in 2009 and 2001.
Adults are 15 years and over. Children are defi ned as those aged 0–14 years.
ADULTS (15+ YEARS) Estimated number of adults living with HIV, 2009 and 2001.
Epidemiology data tables
Th e estimates and data provided in these tables relate to 2009 and 2001, unless stated otherwise. Th ese estimates have been produced and compiled by UNAIDS/WHO. Th ey have been shared with national AIDS programmes for review and comments but are not necessarily the offi cial estimates used by national governments. For countries where no recent data were available or where the analysis could not be completed, country-specifi c estimates have not been listed in the table. In order to calculate regional totals, older data were used to produce estimates for these countries.
Th e estimates are given in rounded numbers. However, unrounded numbers were used in the calculation of rates and regional totals, so there may be minor discrepancies between the regional and global totals and the sum of the country fi gures.
Th e general methodology and tools used to produce the country-specifi c estimates in the table have been described in a series of papers in Sexually Transmitted Infections 2010: “Methods and tools for the 2009 HIV and AIDS estimates and projections, and related analyses 86 (Suppl 2)”. Th e estimates produced by UNAIDS/WHO are based on methods and parameters that are informed by the UNAIDS Reference Group on HIV/AIDS Estimates, Modelling and Projections, described in reports available at www.epidem.org/. Th is group is made up of leading researchers in HIV and AIDS, epidemiology, demography and related areas. Th e Reference Group assesses the most recent published and unpublished work drawn from research studies in diff erent countries. It also reviews advances in the understanding of HIV epidemics and suggests methods to improve the quality and accuracy of the estimates.
According to suggestions from the Reference Group, soft ware has been developed to model the course of HIV epidemics and their impact. Country analysts were trained in the use of these tools during a series of workshops in 2009. Th ese changes in procedures and assumptions
ANNEX 1 HIV AND AIDS ESTIMATES AND DATA 2009 AND 2001

179Annex 1: HIV and AIDS estimates and data, 2009 and 2001 | 2010 GLOBAL REPORT
A1
ADULT (15–49 YEARS) PREVALENCE (%) To calculate adult HIV prevalence the estimated number of adults (15–49 years) living with HIV in 2009 was divided by the 2009 adult population (15–49 years) and similarly for 2001.
WOMEN (15+ YEARS) Estimated number of women (15+ years) living with HIV in 2009 and 2001.
CHILDREN (0–14 YEARS) Estimated number of children under age 15 living with HIV in 2009 and 2001.
YOUNG WOMEN (15–24 YEARS) PREVALENCE (%) 2009Estimated percent of young women aged 15–24 who are living with HIV in 2009.
YOUNG MEN (15–24 YEARS) PREVALENCE (%) 2009Estimated percent of young men (15–24 years) who are living with HIV in 2009.
2. NEW HIV INFECTIONS
ADULT (15–49 YEARS) INCIDENCE To calculate the adult HIV incidence, the estimated number of adults (15–49 years) newly infected with HIV in 2009 was divided by the 2009 adult population (15–49 years) not infected at the start of 2009 and similarly for 2001.
ADULTS AND CHILDREN NEWLY INFECTED 2009Estimated number of people newly infected with HIV in 2009.
ADULTS NEWLY INFECTED 2009Estimated number of adults (15+ years) newly infected with HIV in 2009.
3. HIV-RELATED DEATHS: ADULTS AND CHILDREN
Estimated number of adults and children who died of HIV-related causes during 2009 and 2001.
4. ORPHANS DUE TO AIDS
ORPHANS (0–17 YEARS) CURRENTLY LIVING.
Estimated number of children (0–17 years) in 2009 and 2001 who have lost one or both parents to AIDS.
5. TRENDS OF HIV PREVALENCE IN KEY POPULATIONS AT HIGHER RISK OF HIV
Th ese indicators are recommended for reporting against the goals of the 2001 United Nations General Assembly Special Session on HIV/AIDS in countries with low-level epidemics or concentrated HIV epidemics. In theory, assessing progress in reducing the occurrence of new infections is best done through monitoring changes in incidence over time. However, in practice, prevalence data, rather than incidence data, are what are actually available. In analysing prevalence data of key populations at higher risk of HIV, it is desirable to report on those persons who are newly initiated to behaviours that put them at risk for infection. In this round of UNGASS reporting, guidance was provided to encourage this type of reporting, though whether or not this restricted analysis was used for reporting is not represented in this table.
Th e specifi c populations at higher risk of HIV in the tables include:
• injecting drug users • female sex workers • men who have sex with men

180 Annex 1: HIV and AIDS estimates and data, 2009 and 2001 | 2010 GLOBAL REPORT
estimate estimate estimate[low – high estimate] [low – high estimate] [low – high estimate]
Adults (15+)Adults + ChildrenAdults + Children
200920012009
GLOBAL 33 300 000 [31 400 000 – 35 300 000] 28 600 000 [27 100 000 – 30 300 000] 30 800 000 [29 200 000 – 32 600 000]
SUB-SAHARAN AFRICA 22 500 000 [20 900 000 – 24 200 000] 20 300 000 [18 900 000 – 21 700 000] 20 300 000 [19 000 000 – 21 600 000]
Angola 200 000 [160 000 – 250 000] 140 000 [110 000 – 190 000] 180 000 [140 000 – 220 000]
Benin 60 000 [52 000 – 69 000] 50 000 [42 000 – 62 000] 55 000 [48 000 – 63 000]
Botswana 320 000 [300 000 – 350 000] 270 000 [250 000 – 290 000] 300 000 [280 000 – 330 000]
Burkina Faso 110 000 [91 000 – 140 000] 140 000 [120 000 – 180 000] 93 000 [77 000 – 120 000]
Burundi 180 000 [160 000 – 190 000] 170 000 [160 000 – 190 000] 150 000 [130 000 – 160 000]
Cameroon 610 000 [540 000 – 670 000] 480 000 [430 000 – 530 000] 550 000 [500 000 – 610 000]
Central African Republic 130 000 [110 000 – 140 000] 180 000 [160 000 – 220 000] 110 000 [98 000 – 120 000]
Chad 210 000 [170 000 – 300 000] 140 000 [99 000 – 180 000] 180 000 [150 000 – 280 000]
Comoros <500 [<200 – <500] <100 [<100 – <200] <500 [<200 – <500]
Congo 77 000 [68 000 – 87 000] 69 000 [61 000 – 80 000] 69 000 [61 000 – 78 000]
Côte d’Ivoire 450 000 [390 000 – 510 000] 630 000 [560 000 – 710 000] 380 000 [340 000 – 440 000]
Democratic Republic of the Congo … [430 000 – 560 000] … [310 000 – 420 000] … [380 000 – 490 000]
Equatorial Guinea 20 000 [14 000 – 26 000] 5700 [3900 – 9100] 18 000 [13 000 – 23 000]
Eritrea 25 000 [18 000 – 33 000] 26 000 [19 000 – 34 000] 22 000 [16 000 – 29 000]
Ethiopia … … … … … …
Gabon 46 000 [37 000 – 55 000] 36 000 [29 000 – 46 000] 43 000 [35 000 – 51 000]
Gambia 18 000 [12 000 – 26 000] 4300 [2400 – 8400] 17 000 [11 000 – 24 000]
Ghana 260 000 [230 000 – 300 000] 250 000 [220 000 – 280 000] 240 000 [210 000 – 260 000]
Guinea 79 000 [65 000 – 95 000] 78 000 [57 000 – 120 000] 70 000 [58 000 – 84 000]
Guinea-Bissau 22 000 [18 000 – 26 000] 14 000 [12 000 – 17 000] 20 000 [16 000 – 24 000]
Kenya 1 500 000 [1 300 000 – 1 600 000] 1 500 000 [1 400 000 – 1 600 000] 1 300 000 [1 200 000 – 1 400 000]
Lesotho 290 000 [260 000 – 310 000] 240 000 [220 000 – 270 000] 260 000 [240 000 – 280 000]
Liberia 37 000 [32 000 – 43 000] 51 000 [36 000 – 70 000] 31 000 [27 000 – 37 000]
Madagascar 24 000 [19 000 – 30 000] 18 000 [15 000 – 22 000] 23 000 [18 000 – 28 000]
Malawi 920 000 [830 000 – 1 000 000] 860 000 [770 000 – 960 000] 800 000 [730 000 – 890 000]
Mali 76 000 [61 000 – 96 000] 89 000 [72 000 – 110 000] 66 000 [52 000 – 84 000]
Mauritania 14 000 [11 000 – 17 000] 8900 [7300 – 11 000] 13 000 [11 000 – 16 000]
Mauritius 8800 [6400 – 12 000] 3100 [2 100 – 4 200] 8700 [6300 – 12 000]
Mozambique 1 400 000 [1 200 000 – 1 500 000] 850 000 [760 000 – 940 000] 1 200 000 [1 100 000 – 1 400 000]
Namibia 180 000 [150 000 – 210 000] 160 000 [140 000 – 200 000] 160 000 [140 000 – 190 000]
Niger 61 000 [50 000 – 77 000] 53 000 [43 000 – 67 000] 53 000 [43 000 – 67 000]
Nigeria 3 300 000 [2 900 000 – 3 600 000] 2 700 000 [2 300 000 – 3 100 000] 2 900 000 [2 600 000 – 3 200 000]
Rwanda 170 000 [140 000 – 190 000] 170 000 [150 000 – 210 000] 140 000 [120 000 – 160 000]
Senegal 59 000 [50 000 – 69 000] 33 000 [29 000 – 38 000] 54 000 [46 000 – 63 000]
Sierra Leone 49 000 [40 000 – 63 000] 25 000 [13 000 – 39 000] 46 000 [38 000 – 59 000]
South Africa 5 600 000 [5 400 000 – 5 900 000] 4 600 000 [4 500 000 – 4 700 000] 5 300 000 [5 100 000 – 5 500 000]
Swaziland 180 000 [170 000 – 200 000] 130 000 [120 000 – 150 000] 170 000 [160 000 – 180 000]
Togo 120 000 [99 000 – 150 000] 100 000 [82 000 – 130 000] 110 000 [91 000 – 140 000]
Uganda 1 200 000 [1 100 000 – 1 300 000] 980 000 [870 000 – 1 100 000] 1 000 000 [940 000 – 1 100 000]
United Republic of Tanzania 1 400 000 [1 300 000 – 1 500 000] 1 400 000 [1 200 000 – 1 500 000] 1 200 000 [1 100 000 – 1 400 000]
Zambia 980 000 [890 000 – 1 100 000] 830 000 [750 000 – 900 000] 860 000 [800 000 – 940 000]
Zimbabwe 1 200 000 [1 100 000 – 1 300 000] 1 700 000 [1 600 000 – 1 800 000] 1 000 000 [950 000 – 1 200 000]
ESTIMATED PEOPLE LIVING WITH HIV

181Annex 1: HIV and AIDS estimates and data, 2009 and 2001 | 2010 GLOBAL REPORT
A1
estimate estimate estimate[low – high estimate] [low – high estimate] [low – high estimate]
Adult (15–49) prevalence percentAdult (15–49) prevalence percentAdults (15+)
200120092001
26 700 000 [25 400 000 – 28 000 000] 0.8 [0.7 – 0.8] 0.8 [0.7 – 0.8]
18 500 000 [17 500 000 – 19 700 000] 5.0 [4.7 – 5.2] 5.9 [5.6 – 6.1]
130 000 [100 000 – 170 000] 2.0 [1.6 – 2.4] 1.9 [1.4 – 2.4]
47 000 [40 000 – 56 000] 1.2 [1.0 – 1.3] 1.4 [1.2 – 1.7]
260 000 [240 000 – 280 000] 24.8 [23.8 – 25.8] 26.3 [25.5 – 27.4]
120 000 [99 000 – 150 000] 1.2 [1.0 – 1.5] 2.1 [1.7 – 2.5]
150 000 [140 000 – 160 000] 3.3 [2.9 – 3.5] 5.0 [4.8 – 5.1]
440 000 [400 000 – 490 000] 5.3 [4.9 – 5.8] 5.5 [5.1 – 6.0]
170 000 [150 000 – 200 000] 4.7 [4.2 – 5.2] 8.9 [8.1 – 10.6]
130 000 [91 000 – 170 000] 3.4 [2.8 – 5.1] 3.2 [2.3 – 4.0]
<100 [<100 – <100] 0.1 [<0.1 – 0.1] <0.1 [<0.1 – <0.1]
61 000 [54 000 – 71 000] 3.4 [3.1 – 3.8] 3.8 [3.4 – 4.4]
570 000 [510 000 – 640 000] 3.4 [3.1 – 3.9] 6.5 [5.9 – 7.1]
… [270 000 – 360 000] … [1.2 – 1.6] … [1.1 – 1.5]
5400 [3700 – 8700] 5.0 [3.5 – 6.6] 1.9 [1.3 – 3.1]
23 000 [18 000 – 31 000] 0.8 [0.6 – 1.0] 1.2 [0.9 – 1.5]
… … … … … …
34 000 [27 000 – 43 000] 5.2 [4.2 – 6.2] 5.3 [4.3 – 6.8]
3900 [2200 – 7500] 2.0 [1.3 – 2.9] 0.6 [0.3 – 1.1]
230 000 [200 000 – 260 000] 1.8 [1.6 – 2.0] 2.3 [2.0 – 2.5]
70 000 [52 000 – 100 000] 1.3 [1.1 – 1.6] 1.7 [1.2 – 2.4]
13 000 [11 000 – 16 000] 2.5 [2.0 – 3.0] 2.0 [1.7 – 2.4]
1 300 000 [1 200 000 – 1 400 000] 6.3 [5.8 – 6.5] 8.4 [8.1 – 9.0]
230 000 [210 000 – 250 000] 23.6 [22.3 – 25.2] 24.5 [23.1 – 26.1]
46 000 [33 000 – 63 000] 1.5 [1.3 – 1.8] 3.1 [2.2 – 4.1]
17 000 [14 000 – 20 000] 0.2 [0.2 – 0.3] 0.2 [0.2 – 0.3]
760 000 [690 000 – 840 000] 11.0 [10.0 – 12.1] 13.8 [12.7 – 15.1]
80 000 [66 000 – 98 000] 1.0 [0.8 – 1.3] 1.6 [1.3 – 1.9]
8600 [7100 – 11 000] 0.7 [0.6 – 0.9] 0.6 [0.5 – 0.7]
3100 [2100 – 4200] 1.0 [0.7 – 1.3] 0.4 [0.3 – 0.5]
800 000 [720 000 – 870 000] 11.5 [10.6 – 12.2] 9.4 [8.7 – 10.3]
150 000 [130 000 – 180 000] 13.1 [11.1 – 15.5] 16.1 [13.6 – 19.0]
49 000 [40 000 – 61 000] 0.8 [0.7 – 1.0] 1.0 [0.8 – 1.3]
2 400 000 [2 100 000 – 2 700 000] 3.6 [3.3 – 4.0] 3.8 [3.4 – 4.2]
150 000 [140 000 – 170 000] 2.9 [2.5 – 3.3] 3.7 [3.4 – 4.4]
31 000 [26 000 – 35 000] 0.9 [0.7 – 1.0] 0.6 [0.6 – 0.7]
24 000 [13 000 – 38 000] 1.6 [1.4 – 2.1] 1.1 [0.6 – 1.7]
4 400 000 [4 300 000 – 4 500 000] 17.8 [17.2 – 18.3] 17.1 [16.7 – 17.5]
130 000 [120 000 – 140 000] 25.9 [24.9 – 27.0] 23.6 [22.4 – 24.8]
98 000 [76 000 – 120 000] 3.2 [2.5 – 3.8] 3.6 [2.8 – 4.3]
840 000 [760 000 – 920 000] 6.5 [5.9 – 6.9] 7.0 [6.4 – 7.4]
1 200 000 [1 100 000 – 1 300 000] 5.6 [5.3 – 6.1] 7.1 [6.7 – 7.7]
730 000 [670 000 – 790 000] 13.5 [12.8 – 14.1] 14.3 [13.7 – 15.0]
1 500 000 [1 400 000 – 1 700 000] 14.3 [13.4 – 15.4] 23.7 [22.8 – 24.9]
GLOBAL
SUB-SAHARAN AFRICA
Angola
Benin
Botswana
Burkina Faso
Burundi
Cameroon
Central African Republic
Chad
Comoros
Congo
Côte d’Ivoire
Democratic Republic of the Congo
Equatorial Guinea
Eritrea
Ethiopia
Gabon
Gambia
Ghana
Guinea
Guinea-Bissau
Kenya
Lesotho
Liberia
Madagascar
Malawi
Mali
Mauritania
Mauritius
Mozambique
Namibia
Niger
Nigeria
Rwanda
Senegal
Sierra Leone
South Africa
Swaziland
Togo
Uganda
United Republic of Tanzania
Zambia
Zimbabwe

182 Annex 1: HIV and AIDS estimates and data, 2009 and 2001 | 2010 GLOBAL REPORT
estimate estimate estimate[low – high estimate] [low – high estimate] [low – high estimate]
Children (0–14)Women (15+)Women (15+)
200920012009
15 900 000 [14 800 000 – 17 200 000] 13 600 000 [12 900 000 – 14 700 000] 2 500 000 [1 600 000 – 3 400 000]
12 100 000 [11 100 000 – 13 200 000] 10 900 000 [10 100 000 – 11 700 000] 2 300 000 [1 400 000 – 3 100 000]
110 000 [85 000 – 130 000] 77 000 [59 000 – 100 000] 22 000 [12 000 – 35 000]
32 000 [27 000 – 37 000] 27 000 [23 000 – 33 000] 5400 [2900 – 7800]
170 000 [160 000 – 190 000] 150 000 [140 000 – 160 000] 16 000 [9900 – 20 000]
56 000 [44 000 – 70 000] 73 000 [60 000 – 92 000] 17 000 [8100 – 25 000]
90 000 [78 000 – 100 000] 90 000 [81 000 – 99 000] 28 000 [17 000 – 40 000]
320 000 [290 000 – 370 000] 260 000 [230 000 – 290 000] 54 000 [29 000 – 78 000]
67 000 [57 000 – 78 000] 99 000 [86 000 – 120 000] 17 000 [8200 – 25 000]
110 000 [88 000 – 160 000] 76 000 [54 000 – 98 000] 23 000 [12 000 – 35 000]
<100 [<100 – <100] <100 [<100 – <100] … …
40 000 [35 000 – 47 000] 36 000 [31 000 – 42 000] 7900 [4000 – 12 000]
220 000 [190 000 – 260 000] 320 000 [280 000 – 370 000] 63 000 [32 000 – 91 000]
… [220 000 – 300 000] … [160 000 – 220 000] … [33 000 – 86 000]
11 000 [7600 – 14 000] 3100 [2100 – 5100] 1600 [<1000 – 2600]
13 000 [9800 – 18 000] 14 000 [11 000 – 19 000] 3100 [1500 – 5000]
… … … … … …
25 000 [20 000 – 30 000] 20 000 [16 000 – 25 000] 3200 [1700 – 4800]
9700 [6200 – 14 000] 2300 [1300 – 4400] … …
140 000 [120 000 – 160 000] 130 000 [120 000 – 150 000] 27 000 [14 000 – 41 000]
41 000 [34 000 – 50 000] 41 000 [30 000 – 61 000] 9000 [4300 – 14 000]
12 000 [9300 – 14 000] 7800 [6400 – 9300] 2100 [1100 – 3200]
760 000 [650 000 – 860 000] 780 000 [700 000 – 870 000] 180 000 [98 000 – 260 000]
160 000 [140 000 – 180 000] 140 000 [130 000 – 160 000] 28 000 [17 000 – 37 000]
19 000 [16 000 – 22 000] 27 000 [19 000 – 37 000] 6100 [3000 – 9900]
7300 [5800 – 9000] 5400 [4500 – 6400] … …
470 000 [410 000 – 530 000] 440 000 [390 000 – 500 000] 120 000 [68 000 – 170 000]
40 000 [31 000 – 52 000] 48 000 [40 000 – 59 000] … …
4000 [3200 – 4900] 2600 [2100 – 3200] … …
2500 [1800 – 3400] <1000 [<1000 – 1200] … …
760 000 [680 000 – 840 000] 470 000 [430 000 – 530 000] 130 000 [70 000 – 180 000]
95 000 [79 000 – 110 000] 90 000 [76 000 – 110 000] 16 000 [9100 – 23 000]
28 000 [23 000 – 36 000] 25 000 [20 000 – 32 000] … …
1 700 000 [1 500 000 – 1 900 000] 1 400 000 [1 200 000 – 1 600 000] 360 000 [180 000 – 520 000]
88 000 [76 000 – 98 000] 91 000 [83 000 – 110 000] 22 000 [11 000 – 34 000]
32 000 [27 000 – 38 000] 18 000 [16 000 – 21 000] … …
28 000 [22 000 – 35 000] 14 000 [7500 – 23 000] 2900 [1500 – 4500]
3 300 000 [3 000 000 – 3 500 000] 2 600 000 [2 500 000 – 2 700 000] 330 000 [190 000 – 440 000]
100 000 [91 000 – 110 000] 74 000 [69 000 – 82 000] 14 000 [8300 – 18 000]
67 000 [54 000 – 83 000] 57 000 [45 000 – 72 000] 11 000 [3700 – 18 000]
610 000 [540 000 – 680 000] 490 000 [430 000 – 560 000] 150 000 [80 000 – 210 000]
730 000 [650 000 – 830 000] 720 000 [640 000 – 800 000] 160 000 [83 000 – 240 000]
490 000 [440 000 – 550 000] 420 000 [380 000 – 470 000] 120 000 [64 000 – 160 000]
620 000 [530 000 – 710 000] 890 000 [800 000 – 990 000] 150 000 [92 000 – 200 000]
GLOBAL
SUB-SAHARAN AFRICA
Angola
Benin
Botswana
Burkina Faso
Burundi
Cameroon
Central African Republic
Chad
Comoros
Congo
Côte d’Ivoire
Democratic Republic of the Congo
Equatorial Guinea
Eritrea
Ethiopia
Gabon
Gambia
Ghana
Guinea
Guinea-Bissau
Kenya
Lesotho
Liberia
Madagascar
Malawi
Mali
Mauritania
Mauritius
Mozambique
Namibia
Niger
Nigeria
Rwanda
Senegal
Sierra Leone
South Africa
Swaziland
Togo
Uganda
United Republic of Tanzania
Zambia
Zimbabwe
ESTIMATED PEOPLE LIVING WITH HIV

183Annex 1: HIV and AIDS estimates and data, 2009 and 2001 | 2010 GLOBAL REPORT
A1
estimate estimate estimate[low – high estimate] [low – high estimate] [low – high estimate]
Young men (15–24) prevalence (%)Young women (15–24) prevalence (%)Children (0–14)
200920092001
2 000 000 [1 200 000 – 2 700 000] 0.6 [0.5 – 0.7] 0.3 [0.2 – 0.3]
1 800 000 [1 100 000 – 2 500 000] 3.4 [3.0 – 4.2] 1.4 [1.2 – 1.7]
14 000 [6900 – 24 000] 1.6 [1.1 – 2.2] 0.6 [0.4 – 0.9]
3100 [1600 – 6600] 0.7 [0.5 – 1.1] 0.3 [0.2 – 0.4]
14 000 [7800 – 19 000] 11.8 [9.0 – 15.9] 5.2 [3.7 – 7.3]
24 000 [12 000 – 37 000] 0.8 [0.6 – 1.2] 0.5 [0.3 – 0.6]
26 000 [16 000 – 36 000] 2.1 [1.6 – 2.7] 1.0 [0.8 – 1.2]
33 000 [18 000 – 50 000] 3.9 [3.1 – 5.4] 1.6 [1.2 – 2.1]
17 000 [8600 – 25 000] 2.2 [1.4 – 3.1] 1.0 [0.6 – 1.4]
13 000 [6400 – 22 000] 2.5 [1.7 – 5.2] 1.0 [0.7 – 2.0]
… … <0.1 [<0.1 – <0.1] <0.1 [<0.1 – 0.1]
8300 [4200 – 12 000] 2.6 [2.1 – 3.6] 1.2 [0.9 – 1.6]
59 000 [31 000 – 95 000] 1.5 [1.1 – 2.3] 0.7 [0.5 – 1.1]
… [26 000 – 70 000] … [0.9 – 1.5] … [0.4 – 0.6]
<500 [<200 – <1000] 5.0 [2.7 – 7.9] 1.9 [1.0 – 3.2]
2300 [1200 – 4100] 0.4 [0.2 – 0.7] 0.2 [0.1 – 0.3]
… … … … … …
2000 [1200 – 3100] 3.5 [2.1 – 5.2] 1.4 [0.8 – 2.0]
… … 2.4 [1.4 – 4.0] 0.9 [0.5 – 1.6]
18 000 [9900 – 29 000] 1.3 [0.9 – 1.8] 0.5 [0.4 – 0.7]
8400 [3500 – 18 000] 0.9 [0.6 – 1.3] 0.4 [0.3 – 0.6]
<1000 [<1000 – 1400] 2.0 [1.5 – 2.9] 0.8 [0.5 – 1.1]
170 000 [98 000 – 230 000] 4.1 [3.0 – 5.4] 1.8 [1.3 – 2.4]
18 000 [11 000 – 23 000] 14.2 [11.2 – 19.2] 5.4 [4.1 – 7.4]
4600 [2100 – 8400] 0.7 [0.2 – 1.2] 0.3 [0.1 – 0.5]
… … 0.1 [<0.1 – 0.1] 0.1 [0.1 – 0.4]
100 000 [57 000 – 140 000] 6.8 [5.3 – 9.2] 3.1 [2.3 – 4.2]
… … 0.5 [0.2 – 0.9] 0.2 [0.1 – 0.4]
… … 0.3 [0.1 – 0.5] 0.4 [0.2 – 1.4]
… … 0.2 [0.1 – 0.3] 0.3 [0.2 – 0.4]
53 000 [30 000 – 77 000] 8.6 [7.0 – 12.1] 3.1 [2.4 – 4.4]
7900 [4400 – 11 000] 5.8 [3.7 – 8.6] 2.3 [1.3 – 3.6]
… … 0.5 [0.4 – 0.6] 0.2 [0.2 – 0.3]
270 000 [130 000 – 410 000] 2.9 [2.3 – 3.9] 1.2 [0.9 – 1.6]
23 000 [11 000 – 38 000] 1.9 [1.3 – 2.3] 1.3 [0.9 – 1.6]
… … 0.7 [0.5 – 1.0] 0.3 [0.2 – 0.4]
<1000 [<500 – 2100] 1.5 [0.9 – 2.5] 0.6 [0.3 – 1.0]
170 000 [97 000 – 220 000] 13.6 [12.3 – 15.0] 4.5 [4.1 – 5.0]
7600 [4700 – 10 000] 15.6 [12.6 – 21.3] 6.5 [4.8 – 8.8]
6700 [2700 – 11 000] 2.2 [1.5 – 3.1] 0.9 [0.6 – 1.2]
150 000 [84 000 – 210 000] 4.8 [4.0 – 6.4] 2.3 [1.8 – 2.8]
150 000 [83 000 – 210 000] 3.9 [3.1 – 5.3] 1.7 [1.3 – 2.3]
100 000 [57 000 – 140 000] 8.9 [7.3 – 12.0] 4.2 [3.2 – 5.5]
160 000 [100 000 – 210 000] 6.9 [5.3 – 9.3] 3.3 [2.5 – 4.4]
GLOBAL
SUB-SAHARAN AFRICA
Angola
Benin
Botswana
Burkina Faso
Burundi
Cameroon
Central African Republic
Chad
Comoros
Congo
Côte d’Ivoire
Democratic Republic of the Congo
Equatorial Guinea
Eritrea
Ethiopia
Gabon
Gambia
Ghana
Guinea
Guinea-Bissau
Kenya
Lesotho
Liberia
Madagascar
Malawi
Mali
Mauritania
Mauritius
Mozambique
Namibia
Niger
Nigeria
Rwanda
Senegal
Sierra Leone
South Africa
Swaziland
Togo
Uganda
United Republic of Tanzania
Zambia
Zimbabwe

184 Annex 1: HIV and AIDS estimates and data, 2009 and 2001 | 2010 GLOBAL REPORT
ESTIMATED NEW HIV INFECTIONS
estimate estimate estimate[low – high estimate] [low – high estimate] [low – high estimate]
Adults + children newly infectedAdult (15–49) incidence rateAdult (15–49) incidence rate
200920012009
<0.10 [<0.10 – <0.10] <0.10 [<0.10 – <0.10] 2 600 000 [2 300 000 – 2 800 000]
0.41 [0.36 – 0.46] 0.61 [0.54 – 0.65] 1 800 000 [1 600 000 – 2 000 000]
0.21 [0.14 – 0.28] 0.22 [0.17 – 0.28] 22 000 [16 000 – 29 000]
0.10 [<0.10 – 0.13] 0.11 [<0.10 – 0.15] 4900 [3400 – 6500]
1.56 [1.11 – 2.27] 3.03 [2.64 – 3.48] 14 000 [10 000 – 20 000]
<0.10 [<0.10 – 0.11] 0.11 [<0.10 – 0.16] 6800 [4300 – 11 000]
… [0.17 – 0.28] … [0.34 – 0.47] … [11 000 – 17 000]
0.53 [0.43 – 0.61] 0.59 [0.50 – 0.69] 58 000 [48 000 – 67 000]
0.17 [<0.10 – 0.25] 0.56 [0.43 – 0.69] 5200 [3100 – 7100]
… [0.15 – 0.87] … [0.39 – 0.55] … [12 000 – 47 000]
… [<0.10 – <0.10] … [<0.10 – <0.10] … [<100 – <100]
0.28 [0.23 – 0.35] 0.43 [0.36 – 0.51] 6500 [5200 – 7900]
0.11 [<0.10 – 0.20] 0.39 [0.30 – 0.51] 17 000 [11 000 – 27 000]
… [0.13 – 0.18] … [0.13 – 0.18] … [49 000 – 67 000]
… [0.23 – 1.20] … [0.38 – 0.83] … [1200 – 4500]
<0.10 [<0.10 – <0.10] <0.10 [<0.10 – 0.14] 1300 [<1000 – 2300]
… … … … … …
0.43 [0.10 – 0.61] 0.63 [0.46 – 0.85] 3600 [1300 – 5000]
… [0.21 – 0.83] … [<0.10 – 0.22] … [1900 – 6400]
0.15 [0.12 – 0.19] 0.18 [0.15 – 0.22] 22 000 [17 000 – 27 000]
0.10 [<0.10 – 0.13] 0.15 [0.11 – 0.21] 6200 [3800 – 8400]
0.21 [0.14 – 0.32] 0.32 [0.24 – 0.40] 2100 [1400 – 2900]
0.53 [0.34 – 0.70] 0.55 [0.38 – 0.76] 110 000 [81 000 – 150 000]
2.58 [2.18 – 3.04] 2.88 [2.53 – 3.40] 23 000 [20 000 – 27 000]
… [<0.10 – 0.17] … [<0.10 – 0.22] … [<1000 – 3800]
… [<0.10 – <0.10] … [<0.10 – <0.10] … [1800 – 3700]
0.95 [0.67 – 1.23] 1.35 [1.15 – 1.61] 73 000 [57 000 – 91 000]
<0.10 [<0.10 – 0.12] <0.10 [<0.10 – 0.14] 4600 [1300 – 8300]
… [<0.10 – 0.11] … [<0.10 – 0.11] … [<1000 – 1900]
… [<0.10 – 0.22] … [<0.10 – 0.12] … [<1000 – 1800]
1.19 [0.99 – 1.35] 1.77 [1.56 – 1.96] 130 000 [110 000 – 150 000]
0.43 [<0.10 – 0.93] 2.29 [1.77 – 2.90] 5800 [2100 – 11 000]
<0.10 [<0.10 – <0.10] <0.10 [<0.10 – <0.12] 6100 [4300 – 8400]
0.38 [0.33 – 0.44] 0.39 [0.33 – 0.47] 340 000 [280 000 – 390 000]
0.18 [<0.10 – 0.32] 0.34 [0.26 – 0.41] 8800 [3800 – 15 000]
<0.10 [<0.10 – 0.11] 0.10 [<0.10 – 0.12] 6000 [4100 – 7900]
0.14 [<0.10 – 0.35] 0.22 [0.16 – 0.29] 4700 [3000 – 9900]
1.49 [1.27 – 1.76] 2.35 [2.14 – 2.60] 390 000 [340 000 – 440 000]
2.66 [2.19 – 3.14] 4.07 [3.72 – 4.46] 14 000 [12 000 – 16 000]
0.27 [0.15 – 0.39] 0.37 [0.28 – 0.48] 10 000 [6200 – 14 000]
0.74 [0.62 – 0.85] 0.71 [0.61 – 0.82] 120 000 [100 000 – 140 000]
0.45 [0.34 – 0.57] 0.64 [0.55 – 0.76] 100 000 [82 000 – 130 000]
1.17 [0.96 – 1.40] 1.72 [1.52 – 1.95] 76 000 [62 000 – 89 000]
0.84 [0.54 – 1.19] 1.94 [1.62 – 2.36] 62 000 [45 000 – 80 000]
GLOBAL
SUB-SAHARAN AFRICA
Angola
Benin
Botswana
Burkina Faso
Burundi
Cameroon
Central African Republic
Chad
Comoros
Congo
Côte d’Ivoire
Democratic Republic of the Congo
Equatorial Guinea
Eritrea
Ethiopia
Gabon
Gambia
Ghana
Guinea
Guinea-Bissau
Kenya
Lesotho
Liberia
Madagascar
Malawi
Mali
Mauritania
Mauritius
Mozambique
Namibia
Niger
Nigeria
Rwanda
Senegal
Sierra Leone
South Africa
Swaziland
Togo
Uganda
United Republic of Tanzania
Zambia
Zimbabwe

185Annex 1: HIV and AIDS estimates and data, 2009 and 2001 | 2010 GLOBAL REPORT
A1
ESTIMATED AIDS-RELATED DEATHS
estimate estimate estimate[low – high estimate] [low – high estimate] [low – high estimate]
AIDS-related deaths in adults + childrenAIDS-related deaths in adults + childrenAdults newly infected
200120092009
2 200 000 [2 000 000 – 2 400 000] 1 800 000 [1 600 000 – 2 100 000] 1 800 000 [1 600 000 – 2 100 000]
1 500 000 [1 300 000 – 1 600 000] 1 300 000 [1 100 000 – 1 500 000] 1 400 000 [1 200 000 – 1 600 000]
17 000 [12 000 – 23 000] 11 000 [7700 – 16 000] 10 000 [6500 – 14 000]
4000 [2700 – 5400] 2700 [1800 – 3700] 3100 [1900 – 5200]
13 000 [9400 – 19 000] 5800 [2300 – 14 000] 15 000 [12 000 – 18 000]
5000 [2800 – 7900] 7100 [4800 – 9700] 15 000 [11 000 – 19 000]
… [7000 – 11 000] 15 000 [12 000 – 17 000] 14 000 [12 000 – 17 000]
48 000 [39 000 – 56 000] 37 000 [29 000 – 46 000] 31 000 [25 000 – 37 000]
3600 [1800 – 5200] 11 000 [8800 – 13 000] 15 000 [12 000 – 20 000]
… [8000 – 39 000] 11 000 [8100 – 15 000] 8900 [5400 – 13 000]
… [<100 – <100] <100 [<100 – <100] <100 [<100 – <100]
5100 [4100 – 6300] 5100 [4100 – 6400] 5800 [4800 – 7100]
11 000 [5700 – 19 000] 36 000 [29 000 – 44 000] 51 000 [37 000 – 66 000]
… [38 000 – 52 000] … [26 000 – 40 000] … [24 000 – 34 000]
… [<1000 – 3800] <1000 [<1000 – 1400] <500 [<200 – <500]
<1000 [<500 – 1700] 1700 [1000 – 2500] 1800 [1200 – 2600]
… … … … … …
3100 [<1000 – 4300] 2400 [1600 – 3400] 2000 [1500 – 2800]
… [1600 – 5800] <1000 [<500 – 1200] <500 [<200 – <1000]
18 000 [14 000 – 23 000] 18 000 [14 000 – 22 000] 16 000 [13 000 – 21 000]
4800 [2600 – 6600] 4700 [3100 – 6900] 6300 [3000 – 14 000]
1600 [1100 – 2300] 1200 [<1000 – 1600] <1000 [<1000 – <1000]
92 000 [61 000 – 120 000] 80 000 [61 000 – 99 000] 120 000 [100 000 – 150 000]
20 000 [17 000 – 24 000] 14 000 [10 000 – 18 000] 14 000 [12 000 – 18 000]
… [<200 – 3100] 3600 [2800 – 4600] 3900 [2300 – 6200]
… [1600 – 3400] 1700 [1400 – 2000] 1300 [1100 – 1600]
56 000 [40 000 – 72 000] 51 000 [38 000 – 67 000] 68 000 [57 000 – 81 000]
3400 [<500 – 6800] 4400 [3000 – 6100] 7200 [4200 – 11 000]
… [<1000 – 1700] <1000 [<1000 – 1000] <500 [<500 – <1000]
… [<1000 – 1800] <500 [<500 – <1000] <200 [<100 – <200]
110 000 [91 000 – 120 000] 74 000 [57 000 – 92 000] 43 000 [34 000 – 53 000]
4400 [<1000 – 9300] 6700 [2500 – 11 000] 8100 [6200 – 11 000]
4600 [3200 – 6100] 4300 [3300 – 5600] 3300 [2500 – 4500]
270 000 [230 000 – 310 000] 220 000 [170 000 – 260 000] 210 000 [130 000 – 260 000]
6000 [1100 – 12 000] 4100 [<1000 – 9700] 15 000 [12 000 – 21 000]
4800 [3100 – 6300] 2600 [1900 – 3500] 1800 [1500 – 2300]
3900 [2300 – 8900] 2800 [2100 – 3700] <1000 [<500 – 2200]
340 000 [300 000 – 400 000] 310 000 [260 000 – 390 000] 220 000 [180 000 – 260 000]
12 000 [10 000 – 14 000] 7000 [4600 – 10 000] 6800 [5700 – 8400]
8700 [5100 – 12 000] 7700 [5300 – 10 000] 6400 [4600 – 8400]
100 000 [84 000 – 120 000] 64 000 [49 000 – 80 000] 89 000 [75 000 – 100 000]
88 000 [66 000 – 110 000] 86 000 [69 000 – 110 000] 110 000 [94 000 – 130 000]
59 000 [48 000 – 71 000] 45 000 [30 000 – 60 000] 68 000 [57 000 – 78 000]
48 000 [31 000 – 66 000] 83 000 [70 000 – 97 000] 130 000 [110 000 – 160 000]
GLOBAL
SUB-SAHARAN AFRICA
Angola
Benin
Botswana
Burkina Faso
Burundi
Cameroon
Central African Republic
Chad
Comoros
Congo
Côte d’Ivoire
Democratic Republic of the Congo
Equatorial Guinea
Eritrea
Ethiopia
Gabon
Gambia
Ghana
Guinea
Guinea-Bissau
Kenya
Lesotho
Liberia
Madagascar
Malawi
Mali
Mauritania
Mauritius
Mozambique
Namibia
Niger
Nigeria
Rwanda
Senegal
Sierra Leone
South Africa
Swaziland
Togo
Uganda
United Republic of Tanzania
Zambia
Zimbabwe

186 Annex 1: HIV and AIDS estimates and data, 2009 and 2001 | 2010 GLOBAL REPORT
ESTIMATED ORPHANS DUE TO AIDS
HIV PREVALENCE (%) IN MOST-AT-RISK GROUPS IN CAPITAL CITY
estimate estimate[low – high estimate] [low – high estimate]
Orphans (0–17)
Year Year YearHIV (%) HIV (%) HIV (%)
Injecting drug users
Female sex workers
Men who have sex with menOrphans (0–17) currently living
20012009
16 600 000 [14 400 000 – 18 800 000] 10 000 000 [7 900 000 – 12 500 000] … … … … … …
14 800 000 [12 800 000 – 17 000 000] 8 900 000 [6 900 000 – 11 200 000] … … … … … …
140 000 [95 000 – 200 000] 65 000 [30 000 – 110 000] … … … … … …
30 000 [18 000 – 53 000] 13 000 [5100 – 100 000] 2009 4.2 2009 24.7 … …
93 000 [71 000 – 120 000] 56 000 [45 000 – 72 000] … … … … … …
140 000 [100 000 – 170 000] 140 000 [100 000 – 190 000] … … 2005 16.3 … …
200 000 [170 000 – 230 000] 130 000 [110 000 – 160 000] … … 2007 39.8 … …
330 000 [270 000 – 420 000] 140 000 [91 000 – 230 000] … … 2009 35.5 … …
140 000 [110 000 – 180 000] 82 000 [54 000 – 120 000] … … … … … …
120 000 [79 000 – 170 000] 50 000 [26 000 – 91 000] … … 2009 20.0 … …
<100 [<100 – <100] <100 [<100 – <100] … … … … … …
51 000 [41 000 – 66 000] 51 000 [34 000 – 73 000] … … … … … …
440 000 [330 000 – 550 000] 270 000 [170 000 – 440 000] … … … … … …
… [350 000 – 510 000] … [290 000 – 450 000] … … … … … …
4100 [2500 – 6400] <1000 [<500 – <1000] … … … … … …
19 000 [12 000 – 28 000] 8 700 [4100 – 18 000] … … 2008 7.8 … …
… … … … … … … … … …
18 000 [12 000 – 25 000] 7 600 [5200 – 11 000] … … 2010 23.6 … …
2800 [1400 – 6500] <1000 [<500 – 6400] … … … … … …
160 000 [120 000 – 210 000] 60 000 [42 000 – 120 000] … … 2009 25.0 … …
59 000 [34 000 – 120 000] 40 000 [12 000 – 100 000] … … 2008 32.7 … …
9700 [7700 – 12 000] 2800 [1800 – 3900] … … 2009 39.6 … …
1 200 000 [980 000 – 1 400 000] 820 000 [640 000 – 1 100 000] … … … … … …
130 000 [110 000 – 160 000] 52 000 [41 000 – 68 000] … … … … … …
52 000 [34 000 – 76 000] 19 000 [9900 – 33 000] … … … … … …
11 000 [9 300 – 14 000] 9500 [7600 – 12 000] … … 2007 0.5 … …
650 000 [540 000 – 780 000] 430 000 [330 000 – 550 000] … … 2006 70.7 … …
59 000 [36 000 – 93 000] 35 000 [15 000 – 89 000] … … 2006 35.3 … …
3600 [2700 – 4800] 1500 [<1000 – 2200] … … 2007 7.6 … …
<1000 [<500 – <1000] <200 [<100 – <500] 2009 47.1 … … … …
670 000 … 220 000 … … … … … … …
70 000 [50 000 – 96 000] 30 000 [22 000 – 42 000] … … … … … …
57 000 [44 000 – 73 000] 17 000 [12 000 – 24 000] … … 2009 35.6 … …
2 500 000 [1 800 000 – 3 100 000] 1 300 000 [420 000 – 1 900 000] 2007 5.6 2007 32.7 2007 13.5
130 000 [98 000 – 180 000] 170 000 [140 000 – 250 000] … … … … … …
19 000 [15 000 – 25 000] 8700 [6600 – 11 000] … … 2006 19.8 2007 21.8
15 000 [9 200 – 26 000] 2100 [1000 – 7000] … … 2005 8.5 … …
1 900 000 [1 600 000 – 2 400 000] 580 000 [460 000 – 750 000] … … … … 2008 13.2
69 000 [55 000 – 86 000] 29 000 [23 000 – 37 000] … … … … … …
66 000 [47 000 – 89 000] 25 000 [12 000 – 45 000] … … 2005 44.5 … …
1 200 000 [1 000 000 – 1 400 000] 1 100 000 [860 000 – 1 400 000] … … … … … …
1 300 000 [1 100 000 – 1 500 000] 840 000 [690 000 – 1 000 000] … … … … … …
690 000 [570 000 – 810 000] 580 000 [410 000 – 770 000] … … … … … …
1 000 000 [910 000 – 1 200 000] 760 000 [630 000 – 940 000] … … … … … …
GLOBAL
SUB-SAHARAN AFRICA
Angola
Benin
Botswana
Burkina Faso
Burundi
Cameroon
Central African Republic
Chad
Comoros
Congo
Côte d’Ivoire
Democratic Republic of the Congo
Equatorial Guinea
Eritrea
Ethiopia
Gabon
Gambia
Ghana
Guinea
Guinea-Bissau
Kenya
Lesotho
Liberia
Madagascar
Malawi
Mali
Mauritania
Mauritius
Mozambique
Namibia
Niger
Nigeria
Rwanda
Senegal
Sierra Leone
South Africa
Swaziland
Togo
Uganda
United Republic of Tanzania
Zambia
Zimbabwe

187Annex 1: HIV and AIDS estimates and data, 2009 and 2001 | 2010 GLOBAL REPORT
A1
ESTIMATED PEOPLE LIVING WITH HIV
estimate estimate estimate[low – high estimate] [low – high estimate] [low – high estimate]
Adults (15+)Adults + ChildrenAdults + Children
200920012009
EAST ASIA 770 000 [560 000 – 1 000 000] 350 000 [250 000 – 480 000] 760 000 [560 000 – 1 000 000]
China 740 000 [540 000 – 1 000 000] … [240 000 – 470 000] 730 000 [540 000 – 1 000 000]
Democratic People’s Republic of Korea … … … … … …
Japan 8100 [6300 – 10 000] 6500 [5200 – 8100] 8100 [6300 – 10 000]
Mongolia <500 [<500 – <1000] <100 [<100 – <200] <500 [<500 – <1000]
Republic of Korea 9500 [7000 – 13 000] 5200 [4100 – 6700] 9500 [7000 – 13 000]
OCEANIA 57 000 [50 000 – 64 000] 29 000 [23 000 – 35 000] 54 000 [47 000 – 61 000]
Australia 20 000 [15 000 – 25 000] 13 000 [10 000 – 16 000] 20 000 [15 000 – 25 000]
Fiji <1000 [<500 – <1000] <200 [<100 – <500] <1000 [<500 – <1000]
New Zealand 2500 [2000 – 3200] 1600 [1400 – 2100] 2400 [2000 – 3200]
Papua New Guinea 34 000 [30 000 – 39 000] 14 000 [9400 – 21 000] 31 000 [27 000 – 35 000]
SOUTH AND SOUTH-EAST ASIA 4 100 000 [3 700 000 – 4 600 000] 3 800 000 [3 500 000 – 4 200 000] 4 000 000 [3 600 000 – 4 400 000]
Bangladesh 6300 [5200 – 8300] 1100 [<100 – 2400] 6200 [5100 – 8100]
Bhutan <1000 [<1000 – 1500] <200 [<100 – <500] <1000 [<1000 – 1500]
Cambodia 63 000 [42 000 – 90 000] 92 000 [63 000 – 130 000] 56 000 [38 000 – 82 000]
India 2 400 000 [2 100 000 – 2 800 000] 2 500 000 [2 300 000 – 2 900 000] 2 300 000 [2 000 000 – 2 600 000]
Indonesia 310 000 [200 000 – 460 000] 11 000 [<100 – 34 000] 300 000 [200 000 – 460 000]
Lao People’s Democratic Republic 8500 [6000 – 13 000] <1000 [<100 – 1700] 8300 [5800 – 12 000]
Malaysia 100 000 [83 000 – 120 000] 67 000 [57 000 – 80 000] 100 000 [83 000 – 120 000]
Maldives <100 [<100 – <100] <100 [<100 – <100] <100 [<100 – <100]
Myanmar 240 000 [200 000 – 290 000] 250 000 [190 000 – 310 000] 230 000 [190 000 – 280 000]
Nepal 64 000 [51 000 – 80 000] 60 000 [49 000 – 72 000] 60 000 [48 000 – 75 000]
Pakistan 98 000 [79 000 – 120 000] 39 000 [32 000 – 48 000] 95 000 [76 000 – 120 000]
Philippines 8700 [6100 – 13 000] 1700 [<100 – 4000] 8600 [6000 – 13 000]
Singapore 3400 [2500 – 4400] 2800 [2200 – 3800] 3300 [2400 – 4300]
Sri Lanka 2800 [2100 – 3800] 1300 [<1000 – 1900] 2800 [2100 – 3700]
Thailand 530 000 [420 000 – 660 000] 640 000 [480 000 – 820 000] 520 000 [410 000 – 640 000]
Viet Nam 280 000 [220 000 – 350 000] 140 000 [110 000 – 180 000] 270 000 [220 000 – 350 000]
EASTERN EUROPE AND CENTRAL ASIA 1 400 000 [1 300 000 – 1 600 000] 760 000 [670 000 – 890 000] 1 400 000 [1 200 000 – 1 600 000]
Armenia 1900 [1500 – 2400] 1400 [1100 – 1700] 1900 [1500 – 2300]
Azerbaijan 3600 [2600 – 5200] 1300 [<500 – 1700] 3500 [2500 – 5100]
Belarus 17 000 [13 000 – 20 000] 6300 [5100 – 7800] 16 000 [13 000 – 20 000]
Georgia 3500 [2600 – 4900] 1200 [<100 – 1700] 3400 [2500 – 4800]
Kazakhstan 13 000 [9000 – 19 000] 1800 [<1000 – 3400] 13 000 [8900 – 19 000]
Kyrgyzstan 9800 [6500 – 16 000] <1000 [<100 – 11 000] 9700 [6400 – 16 000]
Republic of Moldova 12 000 [9900 – 16 000] 12 000 [9900 – 16 000] 12 000 [9800 – 15 000]
Russian Federation 980 000 [840 000 – 1 200 000] 430 000 [350 000 – 550 000] 960 000 [830 000 – 1 100 000]
Tajikistan 9100 [6400 – 13 000] 4100 [3100 – 5300] 8900 [6300 – 12 000]
Ukraine 350 000 [300 000 – 410 000] 290 000 [250 000 – 330 000] 350 000 [300 000 – 410 000]
Uzbekistan 28 000 [18 000 – 46 000] <1000 [<100 – <100] 28 000 [18 000 – 45 000]
WESTERN AND CENTRAL EUROPE 820 000 [720 000 – 910 000] 630 000 [570 000 – 700 000] 820 000 [720 000 – 910 000]
Austria 15 000 [12 000 – 20 000] 5300 [3900 – 7000] 15 000 [12 000 – 20 000]
Belgium 14 000 [11 000 – 18 000] 12 000 [9500 – 16 000] 14 000 [11 000 – 18 000]
Bulgaria 3800 [2800 – 5200] 1 800 [1300 – 2300] 3800 [2700 – 5200]

188 Annex 1: HIV and AIDS estimates and data, 2009 and 2001 | 2010 GLOBAL REPORT
estimate estimate estimate[low – high estimate] [low – high estimate] [low – high estimate]
Adult (15–49) prevalence percentAdult (15–49) prevalence percentAdults (15+)
200120092001
350 000 [250 000 – 480 000] 0.1 [0.1 – 0.1] <0.1 [<0.1 – <0.1]
… [240 000 – 470 000] 0.1 [0.1 – 0.1] … [<0.1 – 0.1]
… … … … … …
6400 [5200 – 8100] <0.1 [<0.1 – <0.1] <0.1 [<0.1 – <0.1]
<100 [<100 – <200] <0.1 [<0.1 – <0.1] <0.1 [<0.1 – <0.1]
5200 [4100 – 6700] <0.1 [<0.1 – <0.1] <0.1 [<0.1 – <0.1]
28 000 [22 000 – 34 000] 0.3 [0.2 – 0.3] 0.2 [0.1 – 0.2]
13 000 [9900 – 16 000] 0.1 [0.1 – 0.2] 0.1 [0.1 – 0.1]
<200 [<100 – <500] 0.1 [0.1 – 0.2] <0.1 [<0.1 – 0.1]
1600 [1400 – 2100] 0.1 [0.1 – 0.1] 0.1 [0.1 – 0.1]
13 000 [9100 – 19 000] 0.9 [0.8 – 1.0] 0.5 [0.3 – 0.7]
3 700 000 [3 400 000 – 4 100 000] 0.3 [0.3 – 0.3] 0.4 [0.3 – 0.4]
1100 [<100 – 2300] <0.1 [<0.1 – <0.1] <0.1 [<0.1 – <0.1]
<100 [<100 – <500] 0.2 [0.1 – 0.3] <0.1 [<0.1 – 0.1]
83 000 [58 000 – 110 000] 0.5 [0.4 – 0.8] 1.2 [0.8 – 1.6]
2 500 000 [2 200 000 – 2 800 000] 0.3 [0.3 – 0.4] 0.4 [0.4 – 0.5]
11 000 [<100 – 34 000] 0.2 [0.1 – 0.3] <0.1 [<0.1 – <0.1]
<1000 [<100 – 1700] 0.2 [0.2 – 0.4] <0.1 [<0.1 – 0.1]
67 000 [56 000 – 80 000] 0.5 [0.4 – 0.6] 0.4 [0.3 – 0.5]
<100 [<100 – <100] <0.1 [<0.1 – <0.1] <0.1 [<0.1 – <0.1]
250 000 [190 000 – 310 000] 0.6 [0.5 – 0.7] 0.8 [0.6 – 0.9]
57 000 [47 000 – 69 000] 0.4 [0.3 – 0.5] 0.5 [0.4 – 0.6]
39 000 [32 000 – 47 000] 0.1 [0.1 – 0.1] 0.1 [<0.1 – 0.1]
1600 [<100 – 3900] <0.1 [<0.1 – <0.1] <0.1 [<0.1 – <0.1]
2700 [2100 – 3700] 0.1 [0.1 – 0.1] 0.1 [0.1 – 0.1]
1300 [<1000 – 1900] <0.1 [<0.1 – <0.1] <0.1 [<0.1 – <0.1]
610 000 [470 000 – 790 000] 1.3 [1.0 – 1.6] 1.7 [1.3 – 2.1]
140 000 [110 000 – 170 000] 0.4 [0.3 – 0.5] 0.3 [0.2 – 0.3]
750 000 [660 000 – 880 000] 0.8 [0.7 – 0.9] 0.4 [0.4 – 0.5]
1400 [1100 – 1700] 0.1 [0.1 – 0.1] 0.1 [0.1 – 0.1]
1200 [<500 – 1600] 0.1 [<0.1 – 0.1] <0.1 [<0.1 – <0.1]
6300 [5000 – 7800] 0.3 [0.2 – 0.3] 0.1 [0.1 – 0.1]
1200 [<100 – 1700] 0.1 [0.1 – 0.2] <0.1 [<0.1 – 0.1]
1800 [<1000 – 3400] 0.1 [0.1 – 0.2] <0.1 [<0.1 – <0.1]
<1000 [<100 – 11 000] 0.3 [0.2 – 0.5] <0.1 [<0.1 – 0.3]
12 000 [9800 – 16 000] 0.4 [0.4 – 0.6] 0.4 [0.3 – 0.6]
430 000 [350 000 – 550 000] 1.0 [0.9 – 1.2] 0.5 [0.4 – 0.6]
4000 [3000 – 5200] 0.2 [0.1 – 0.3] 0.1 [0.1 – 0.1]
290 000 [250 000 – 330 000] 1.1 [1.0 – 1.3] 0.9 [0.8 – 1.1]
<1000 [<100 – <100] 0.1 [0.1 – 0.2] <0.1 [<0.1 – <0.1]
620 000 [570 000 – 700 000] 0.2 [0.2 – 0.2] 0.2 [0.2 – 0.2]
5300 [3900 – 7000] 0.3 [0.2 – 0.4] 0.1 [0.1 – 0.2]
12 000 [9500 – 16 000] 0.2 [0.2 – 0.3] 0.2 [0.2 – 0.3]
1800 [1300 – 2300] 0.1 [0.1 – 0.1] <0.1 [<0.1 – <0.1]
EAST ASIA
China
Democratic People’s Republic of Korea
Japan
Mongolia
Republic of Korea
OCEANIA
Australia
Fiji
New Zealand
Papua New Guinea
SOUTH AND SOUTH-EAST ASIA
Bangladesh
Bhutan
Cambodia
India
Indonesia
Lao People’s Democratic Republic
Malaysia
Maldives
Myanmar
Nepal
Pakistan
Philippines
Singapore
Sri Lanka
Thailand
Viet Nam
EASTERN EUROPE AND CENTRAL ASIA
Armenia
Azerbaijan
Belarus
Georgia
Kazakhstan
Kyrgyzstan
Republic of Moldova
Russian Federation
Tajikistan
Ukraine
Uzbekistan
WESTERN AND CENTRAL EUROPE
Austria
Belgium
Bulgaria
ESTIMATED PEOPLE LIVING WITH HIV

189Annex 1: HIV and AIDS estimates and data, 2009 and 2001 | 2010 GLOBAL REPORT
A1
estimate estimate estimate[low – high estimate] [low – high estimate] [low – high estimate]
Children (0–14)Women (15+)Women (15+)
200920012009
220 000 [160 000 – 300 000] 98 000 [71 000 – 140 000] 8000 [3600 – 13 000]
230 000 [160 000 – 300 000] … [67 000 – 130 000] … …
… … … … … …
2700 [2100 – 3400] 2200 [1700 – 2700] … …
<200 [<100 – <200] <100 [<100 – <100] … …
2900 [2200 – 4000] 1600 [1200 – 2000] … …
25 000 [22 000 – 28 000] 12 000 [9400 – 16 000] 3100 [1500 – 4800]
6200 [4800 – 7800] 3900 [3100 – 4900] … …
<200 [<200 – <500] <100 [<100 – <100] … …
<1000 [<1000 – 1000] <1000 [<500 – <1000] … …
18 000 [16 000 – 21 000] 7600 [5100 – 11 000] 3100 [1600 – 4800]
1 400 000 [1 400 000 – 1 700 000] 1 300 000 [1 300 000 – 1 600 000] 150 000 [97 000 – 200 000]
1900 [1500 – 2400] <500 [<100 – <1000] … …
<500 [<200 – <500] <100 [<100 – <100] … …
35 000 [23 000 – 52 000] 51 000 [34 000 – 71 000] … …
880 000 [730 000 – 1 000 000] 880 000 [780 000 – 1 000 000] … …
88 000 [58 000 – 130 000] 3200 [<100 – 9600] … …
3500 [2400 – 5500] <500 [<100 – <500] … …
11 000 [8600 – 15 000] 6100 [4100 – 8100] … …
<100 [<100 – <100] <100 [<100 – <100] … …
81 000 [67 000 – 96 000] 67 000 [53 000 – 83 000] … …
20 000 [16 000 – 25 000] 19 000 [15 000 – 22 000] … …
28 000 [23 000 – 35 000] 11 000 [9000 – 13 000] … …
2600 [1800 – 3900] <500 [<100 – 1100] … …
1000 [<1000 – 1300] <1000 [<1000 – 1100] … …
<1000 [<500 – <1000] <500 [<200 – <500] … …
210 000 [160 000 – 260 000] 220 000 [160 000 – 300 000] … …
81 000 [63 000 – 100 000] 39 000 [31 000 – 50 000] … …
690 000 [600 000 – 790 000] 330 000 [290 000 – 390 000] 18 000 [8600 – 29 000]
<1000 [<500 – <1000] <500 [<500 – <1000] … …
2100 [1500 – 3000] <1000 [<500 – <1000] … …
8300 [6700 – 10 000] 2300 [1900 – 2900] … …
1500 [1100 – 2100] <500 [<100 – <1000] … …
7700 [5300 – 11 000] 1100 [<1000 – 2000] … …
2800 [1900 – 4700] <500 [<100 – 3200] … …
5100 [4100 – 6600] 3700 [2900 – 4800] … …
480 000 [400 000 – 570 000] 190 000 [160 000 – 250 000] … …
2700 [1900 – 3700] 1100 [<1000 – 1500] … …
170 000 [140 000 – 200 000] 130 000 [110 000 – 150 000] … …
8000 [4900 – 13 000] <500 [<100 – <100] … …
240 000 [210 000 – 270 000] 180 000 [160 000 – 200 000] 1400 [<1000 – 1800]
4600 [3500 – 5900] 1600 [1100 – 2100] … …
4400 [3400 – 5500] 3700 [2900 – 4800] … …
1100 [<1000 – 1500] <500 [<500 – <1000] … …
EAST ASIA
China
Democratic People’s Republic of Korea
Japan
Mongolia
Republic of Korea
OCEANIA
Australia
Fiji
New Zealand
Papua New Guinea
SOUTH AND SOUTH-EAST ASIA
Bangladesh
Bhutan
Cambodia
India
Indonesia
Lao People’s Democratic Republic
Malaysia
Maldives
Myanmar
Nepal
Pakistan
Philippines
Singapore
Sri Lanka
Thailand
Viet Nam
EASTERN EUROPE AND CENTRAL ASIA
Armenia
Azerbaijan
Belarus
Georgia
Kazakhstan
Kyrgyzstan
Republic of Moldova
Russian Federation
Tajikistan
Ukraine
Uzbekistan
WESTERN AND CENTRAL EUROPE
Austria
Belgium
Bulgaria

190 Annex 1: HIV and AIDS estimates and data, 2009 and 2001 | 2010 GLOBAL REPORT
estimate estimate estimate[low – high estimate] [low – high estimate] [low – high estimate]
Young men (15–24) prevalence (%)Young women (15–24) prevalence (%)Children (0–14)
200920092001
2800 [1200 – 5400] <0.1 [<0.1 – <0.1] <0.1 [<0.1 – <0.1]
… … … [<0.1 – <0.1] … [<0.1 – <0.1]
… … … … … …
… … <0.1 [<0.1 – <0.1] <0.1 [<0.1 – <0.1]
… … <0.1 [<0.1 – <0.1] <0.1 [<0.1 – 0.1]
… … <0.1 [<0.1 – <0.1] <0.1 [<0.1 – 0.1]
<1000 [<500 – 1600] 0.2 [0.2 – 0.3] 0.1 [0.1 – 0.3]
… … 0.1 [<0.1 – 0.1] 0.1 [<0.1 – 0.3]
… … 0.1 [<0.1 – 0.1] 0.1 [<0.1 – 0.3]
… … <0.1 [<0.1 – 0.1] <0.1 [<0.1 – 0.1]
<1000 [<500 – 1500] 0.8 [0.6 – 1.2] 0.3 [0.2 – 0.5]
100 000 [67 000 – 140 000] 0.1 [0.1 – 0.1] 0.1 [0.1 – 0.1]
… … <0.1 [<0.1 – <0.1] <0.1 [<0.1 – <0.1]
… … <0.1 [<0.1 – 0.1] 0.1 [<0.1 – 0.1]
… … 0.1 [0.1 – 0.3] 0.1 [<0.1 – 0.2]
… … 0.1 [0.1 – 0.2] 0.1 [0.1 – 0.2]
… … <0.1 [<0.1 – 0.1] 0.1 [<0.1 – 0.1]
… … 0.2 [0.1 – 0.3] 0.1 [0.1 – 0.2]
… … <0.1 [<0.1 – <0.1] 0.1 [0.1 – 0.2]
… … <0.1 [<0.1 – <0.1] <0.1 [<0.1 – <0.1]
… … 0.3 [0.2 – 0.3] 0.3 [0.3 – 0.4]
… … 0.1 [0.1 – 0.2] 0.2 [0.1 – 0.6]
… … <0.1 [<0.1 – 0.1] 0.1 [<0.1 – 0.2]
… … <0.1 [<0.1 – <0.1] <0.1 [<0.1 – <0.1]
… … <0.1 [<0.1 – 0.1] <0.1 [<0.1 – 0.2]
… … <0.1 [<0.1 – <0.1] <0.1 [<0.1 – <0.1]
… … … [0.4 – 0.7] … [0.4 – 0.5]
… … 0.1 [<0.1 – 0.1] 0.1 [0.1 – 0.1]
4000 [2000 – 6100] 0.2 [0.2 – 0.3] 0.1 [0.1 – 0.1]
… … <0.1 [<0.1 – <0.1] <0.1 [<0.1 – <0.1]
… … 0.1 [0.1 – 0.1] <0.1 [<0.1 – 0.1]
… … 0.1 [0.1 – 0.1] <0.1 [<0.1 – 0.1]
… … <0.1 [<0.1 – 0.1] <0.1 [<0.1 – <0.1]
… … 0.2 [0.1 – 0.3] 0.1 [<0.1 – 0.1]
… … 0.1 [<0.1 – 0.1] 0.1 [<0.1 – 0.2]
… … 0.1 [0.1 – 0.1] 0.1 [<0.1 – 0.1]
… … 0.3 [0.3 – 0.4] 0.2 [0.1 – 0.2]
… … <0.1 [<0.1 – 0.1] <0.1 [<0.1 – 0.1]
… … 0.3 [0.2 – 0.4] 0.2 [0.1 – 0.2]
… … <0.1 [<0.1 – 0.1] <0.1 [<0.1 – 0.1]
2200 [1300 – 3100] 0.1 [<0.1 – 0.1] 0.1 [0.1 – 0.2]
… … 0.2 [0.1 – 0.3] 0.3 [0.1 – 0.9]
… … <0.1 [<0.1 – 0.1] <0.1 [<0.1 – 0.1]
… … <0.1 [<0.1 – <0.1] <0.1 [<0.1 – <0.1]
EAST ASIA
China
Democratic People’s Republic of Korea
Japan
Mongolia
Republic of Korea
OCEANIA
Australia
Fiji
New Zealand
Papua New Guinea
SOUTH AND SOUTH-EAST ASIA
Bangladesh
Bhutan
Cambodia
India
Indonesia
Lao People’s Democratic Republic
Malaysia
Maldives
Myanmar
Nepal
Pakistan
Philippines
Singapore
Sri Lanka
Thailand
Viet Nam
EASTERN EUROPE AND CENTRAL ASIA
Armenia
Azerbaijan
Belarus
Georgia
Kazakhstan
Kyrgyzstan
Republic of Moldova
Russian Federation
Tajikistan
Ukraine
Uzbekistan
WESTERN AND CENTRAL EUROPE
Austria
Belgium
Bulgaria
ESTIMATED PEOPLE LIVING WITH HIV

191Annex 1: HIV and AIDS estimates and data, 2009 and 2001 | 2010 GLOBAL REPORT
A1
estimate estimate estimate[low – high estimate] [low – high estimate] [low – high estimate]
Adults + children newly infectedAdult (15–49) incidence rateAdult (15–49) incidence rate
200920012009
<0.10 [<0.10 – <0.10] <0.10 [<0.10 – <0.10] 82 000 [48 000 – 140 000]
… [<0.10 – <0.10] … [<0.10 – <0.10] … [47 000 – 140 000]
… … … … … …
<0.10 [<0.10 – <0.10] <0.10 [<0.10 – <0.10] <500 [<200 – <500]
<0.10 [<0.10 – <0.10] <0.10 [<0.10 – <0.10] <100 [<100 – <200]
<0.10 [<0.10 – <0.10] <0.10 [<0.10 – <0.10] <1000 [<500 – 1000]
<0.10 [<0.10 – <0.10] <0.10 [<0.10 – <0.10] 4500 [3400 – 6000]
… [<0.10 – <0.10] … [<0.10 – <0.10] … [<1000 – 1500]
… [<0.10 – <0.10] … [<0.10 – <0.10] … [<100 – <200]
… [<0.10 – <0.10] … [<0.10 – <0.10] … [<100 – <200]
<0.10 [<0.10 – 0.13] 0.13 [0.11 – 0.16] 3200 [2100 – 4800]
<0.10 [<0.10 – <0.10] <0.10 [<0.10 – <0.10] 270 000 [240 000 – 320 000]
<0.10 [<0.10 – <0.10] <0.10 [<0.10 – <0.10] 1400 [1000 – 2400]
… [<0.10 – 0.13] … [<0.10 – <0.10] … [<200 – <1000]
<0.10 [<0.10 – <0.10] <0.10 [<0.10 – 0.11] 1700 [<1000 – 4200]
<0.10 [<0.10 – <0.10] <0.10 [<0.10 – <0.10] 140 000 [110 000 – 160 000]
… [<0.10 – <0.10] … [<0.10 – <0.10] … [29 000 – 87 000]
… [<0.10 – <0.10] … [<0.10 – <0.10] … [<1000 – 3400]
<0.10 [<0.10 – <0.10] <0.10 [<0.10 – <0.10] 10 000 [8400 – 13 000]
… [<0.10 – <0.10] … [<0.10 – <0.10] … [<100 – <100]
<0.10 [<0.10 – <0.10] <0.10 [<0.10 – <0.10] 17 000 [14 000 – 20 000]
<0.10 [<0.10 – <0.10] <0.10 [<0.10 – <0.10] 4800 [2700 – 7800]
… [<0.10 – <0.10] … [<0.10 – <0.10] … [7300 – 15 000]
<0.10 [<0.10 – <0.10] <0.10 [<0.10 – <0.10] 2100 [1200 – 4900]
… [<0.10 – <0.10] … [<0.10 – <0.10] … [<100 – <500]
<0.10 [<0.10 – <0.10] <0.10 [<0.10 – <0.10] <500 [<200 – <1000]
<0.10 [<0.10 – <0.10] <0.10 [<0.10 – <0.10] 12 000 [9800 – 15 000]
… [<0.10 – <0.10] … [<0.10 – <0.10] … [16 000 – 38 000]
<0.10 [<0.10 – <0.10] 0.14 [0.11 – 0.16] 130 000 [110 000 – 160 000]
<0.10 [<0.10 – <0.10] <0.10 [<0.10 – <0.10] <500 [<200 – <500]
… [<0.10 – <0.10] … [<0.10 – <0.10] … [<500 – 1100]
<0.10 [<0.10 – <0.10] <0.10 [<0.10 – <0.10] 1500 [1100 – 2200]
<0.10 [<0.10 – <0.10] <0.10 [<0.10 – <0.10] <1000 [<500 – 1200]
<0.10 [<0.10 – <0.10] <0.10 [<0.10 – <0.10] 1900 [1200 – 3600]
<0.10 [<0.10 – 0.22] <0.10 [<0.10 – <0.10] 2600 [1400 – 6500]
<0.10 [<0.10 – <0.10] <0.10 [<0.10 – <0.10] <1000 [<1000 – 1200]
… [<0.10 – 0.14] … [0.17 – 0.25] … [67 000 – 120 000]
<0.10 [<0.10 – <0.10] <0.10 [<0.10 – <0.10] 1400 [<1000 – 2300]
… [<0.10 – 0.12] … [0.10 – 0.16] … [16 000 – 32 000]
… [<0.10 – <0.10] … [<0.10 – <0.10] … [3100 – 11 000]
<0.10 [<0.10 – <0.10] <0.10 [<0.10 – <0.10] 31 000 [23 000 – 40 000]
… [<0.10 – <0.10] … [<0.10 – <0.10] … [<1000 – 2100]
… [<0.10 – <0.10] … [<0.10 – <0.10] … [<100 – <500]
… [<0.10 – <0.10] … [<0.10 – <0.10] … [<500 – <1000]
EAST ASIA
China
Democratic People’s Republic of Korea
Japan
Mongolia
Republic of Korea
OCEANIA
Australia
Fiji
New Zealand
Papua New Guinea
SOUTH AND SOUTH-EAST ASIA
Bangladesh
Bhutan
Cambodia
India
Indonesia
Lao People’s Democratic Republic
Malaysia
Maldives
Myanmar
Nepal
Pakistan
Philippines
Singapore
Sri Lanka
Thailand
Viet Nam
EASTERN EUROPE AND CENTRAL ASIA
Armenia
Azerbaijan
Belarus
Georgia
Kazakhstan
Kyrgyzstan
Republic of Moldova
Russian Federation
Tajikistan
Ukraine
Uzbekistan
WESTERN AND CENTRAL EUROPE
Austria
Belgium
Bulgaria
ESTIMATED NEW HIV INFECTIONS

192 Annex 1: HIV and AIDS estimates and data, 2009 and 2001 | 2010 GLOBAL REPORT
ESTIMATED AIDS-RELATED DEATHS
estimate estimate estimate[low – high estimate] [low – high estimate] [low – high estimate]
AIDS-related deaths in adults + childrenAIDS-related deaths in adults + childrenAdults newly infected
200120092009
81 000 [47 000 – 140 000] 36 000 [25 000 – 50 000] 15 000 [9400 – 28 000]
… [46 000 – 140 000] 26 000 [24 000 – 49 000] … [9100 – 28 000]
… … … … … …
<500 [<200 – <500] <100 [<100 – <500] <100 [<100 – <200]
<100 [<100 – <100] <100 [<100 – <100] <100 [<100 – <100]
<1000 [<500 – 1000] <500 [<500 – <1000] <500 [<100 – <500]
3700 [2600 – 5300] 1400 [<1000 – 2400] <1000 [<500 – 1100]
… [<1000 – 1500] <100 [<100 – <1000] <100 [<100 – <200]
… [<100 – <200] <100 [<100 – <100] <100 [<100 – <100]
… [<100 – <200] <100 [<100 – <100] <100 [<100 – <100]
2400 [1400 – 4100] 1300 [<1000 – 1900] <1000 [<500 – <1000]
250 000 [220 000 – 300 000] 260 000 [230 000 – 300 000] 230 000 [210 000 – 280 000]
1400 [<1000 – 2400] <200 [<100 – <500] <100 [<100 – <200]
… [<200 – <1000] <100 [<100 – <100] <100 [<100 – <100]
1200 [<200 – 3500] 3100 [<1000 – 5600] 7400 [5000 – 11 000]
120 000 [100 000 – 150 000] 170 000 [150 000 – 200 000] 140 000 [120 000 – 170 000]
… [29 000 – 86 000] 8300 [3800 – 15 000] <200 [<100 – 1900]
… [<1000 – 3100] <200 [<100 – <500] <100 [<100 – <100]
10 000 [8400 – 13 000] 5800 [4500 – 7200] 3900 [3000 – 5200]
… [<100 – <100] <100 [<100 – <100] <100 [<100 – <100]
16 000 [14 000 – 19 000] 18 000 [13 000 – 23 000] 16 000 [12 000 – 20 000]
4300 [2300 – 7200] 4700 [3800 – 5700] 4000 [3200 – 4900]
… [6700 – 14 000] 5800 [4500 – 7400] 1400 [<1000 – 1900]
2100 [1200 – 4800] <200 [<100 – <500] <100 [<100 – <500]
… [<100 – <500] <100 [<100 – <200] <100 [<100 – <500]
<500 [<200 – <1000] <200 [<100 – <500] <100 [<100 – <100]
12 000 [9500 – 14 000] 28 000 [21 000 – 37 000] 52 000 [39 000 – 68 000]
… [15 000 – 37 000] 14 000 [9500 – 20 000] 5500 [3900 – 7500]
130 000 [100 000 – 150 000] 76 000 [60 000 – 96 000] 18 000 [14 000 – 23 000]
<500 [<200 – <500] <100 [<100 – <200] <100 [<100 – <100]
… [<500 – 1100] <200 [<200 – <500] <100 [<100 – <100]
1500 [1100 – 2200] <1000 [<500 – <1000] <200 [<100 – <500]
<1000 [<500 – 1200] <100 [<100 – <200] <100 [<100 – <200]
1900 [1200 – 3600] <500 [<200 – <1000] <100 [<100 – <100]
2600 [1400 – 6500] <500 [<100 – <500] <100 [<100 – 3300]
<1000 [<1000 – 1200] <1000 [<1000 – 1100] <1000 [<500 – <1000]
… [64 000 – 110 000] … [35 000 – 65 000] … [3000 – 6000]
1300 [<1000 – 2200] <500 [<500 – <1000] <200 [<200 – <500]
… [16 000 – 32 000] 24 000 [20 000 – 29 000] 13 000 [9400 – 16 000]
… [3100 – 11 000] <500 [<200 – 1000] <100 [<100 – <100]
31 000 [23 000 – 39 000] 8500 [6800 – 19 000] 7300 [5700 – 11 000]
… [<1000 – 2100] <100 [<100 – <100] <100 [<100 – <100]
… [<100 – <500] <100 [<100 – <500] <100 [<100 – <100]
… [<500 – <1000] <200 [<200 – <500] <100 [<100 – <200]
EAST ASIA
China
Democratic People’s Republic of Korea
Japan
Mongolia
Republic of Korea
OCEANIA
Australia
Fiji
New Zealand
Papua New Guinea
SOUTH AND SOUTH-EAST ASIA
Bangladesh
Bhutan
Cambodia
India
Indonesia
Lao People’s Democratic Republic
Malaysia
Maldives
Myanmar
Nepal
Pakistan
Philippines
Singapore
Sri Lanka
Thailand
Viet Nam
EASTERN EUROPE AND CENTRAL ASIA
Armenia
Azerbaijan
Belarus
Georgia
Kazakhstan
Kyrgyzstan
Republic of Moldova
Russian Federation
Tajikistan
Ukraine
Uzbekistan
WESTERN AND CENTRAL EUROPE
Austria
Belgium
Bulgaria
ESTIMATED NEW HIV INFECTIONS

193Annex 1: HIV and AIDS estimates and data, 2009 and 2001 | 2010 GLOBAL REPORT
A1
HIV PREVALENCE (%) IN MOST-AT-RISK GROUPS IN CAPITAL CITY
estimate estimate[low – high estimate] [low – high estimate]
Orphans (0–17)
Year Year YearHIV (%) HIV (%) HIV (%)
Injecting drug users
Female sex workers
Men who have sex with menOrphans (0–17) currently living
20012009
ESTIMATED ORPHANS DUE TO AIDS
52 000 [35 000 – 78 000] 18 000 [10 000 – 37 000] … … … … … …
… … … … 2009 9.3 2009 0.6 2009 5.0
… … … … … … … … … …
… … … … … … … … 2009 4.0
… … … … … … … … 2009 1.8
… … … … … … … … … …
6300 [4000 – 10 000] 2700 [1900 – 4400] … … … … … …
… … … … 2008 1.5 2008 0.1 … …
… … … … … … … … … …
… … … … 2004 0.3 … … … …
… … … … … … 2009 7.4 2009 4.4
1 000 000 [820 000 – 1 100 000] 500 000 [420 000 – 620 000] … … … … … …
… … … … 2007 1.6 2007 0.3 … …
… … … … … … … … … …
… … … … 2007 24.4 … … 2005 4.5
… … … … 2009 9.2 2009 4.9 2009 7.3
… … … … 2007 52.4 2007 7.8 2007 5.2
… … … … … … … … … …
… … … … … 22.1 … … 2009 3.9
… … … … … … … … … …
… … … … 2008 36.3 2008 18.1 2008 28.8
… … … … 2009 20.7 2008 2.2 2009 3.8
… … … … 2008 20.8 2009 1.0 … …
… … … … 2009 0.2 2009 0.2 2009 1.0
… … … … … … … … 2009 2.6
… … … … … … … … 2009 0.5
… … … … 2009 38.7 2009 2.8 2009 13.5
… … … … 2009 18.4 2009 3.2 2010 16.7
73 000 [59 000 – 91 000] 15 000 [9000 – 22 000] … … … … … …
… … … … … … … … … …
… … … … 2008 10.3 2008 1.7 2008 1.0
… … … … 2009 13.7 2009 6.4 2009 2.7
… … … … 2008 2.2 2009 2.0 2007 3.6
… … … … 2009 2.9 2009 1.3 2009 0.3
… … … … 2009 14.3 2009 1.6 … …
… … … … … … … … … …
… … … … 2009 15.6 2009 4.5 2009 8.3
… … … … 2008 17.6 2008 2.8 … …
… … … … 2009 22.9 … … 2009 8.6
… … … … 2009 11.0 2009 2.2 2009 6.8
26 000 [22 000 – 42 000] 50 000 [41 000 – 60 000] … … … … … …
… … … … 2009 4.0 … … … …
… … … … 2008 8.7 2009 0.4 2010 5.6
… … … … 2008 6.8 2008 0.7 2008 3.3
EAST ASIA
China
Democratic People’s Republic of Korea
Japan
Mongolia
Republic of Korea
OCEANIA
Australia
Fiji
New Zealand
Papua New Guinea
SOUTH AND SOUTH-EAST ASIA
Bangladesh
Bhutan
Cambodia
India
Indonesia
Lao People’s Democratic Republic
Malaysia
Maldives
Myanmar
Nepal
Pakistan
Philippines
Singapore
Sri Lanka
Thailand
Viet Nam
EASTERN EUROPE AND CENTRAL ASIA
Armenia
Azerbaijan
Belarus
Georgia
Kazakhstan
Kyrgyzstan
Republic of Moldova
Russian Federation
Tajikistan
Ukraine
Uzbekistan
WESTERN AND CENTRAL EUROPE
Austria
Belgium
Bulgaria

194 Annex 1: HIV and AIDS estimates and data, 2009 and 2001 | 2010 GLOBAL REPORT
estimate estimate estimate[low – high estimate] [low – high estimate] [low – high estimate]
Adults (15+)Adults + ChildrenAdults + Children
200920012009
Croatia <1000 [<1000 – 1 100] <1000 [<500 – <1000] <1000 [<1000 – 1100]
Czech Republic 2000 [1700 – 2300] 1300 [1200 – 1600] 2000 [1700 – 2300]
Denmark 5300 [4000 – 6300] 3300 [2800 – 3800] 5300 [4000 – 6300]
Estonia 9900 [8000 – 12 000] 4700 [3800 – 5700] 9800 [8000 – 12 000]
Finland 2 600 [2200 – 3100] 1600 [1300 – 1900] 2600 [2200 – 3100]
France 150 000 [120 000 – 190 000] 120 000 [100 000 – 140 000] 150 000 [120 000 – 190 000]
Germany 67 000 [56 000 – 75 000] 49 000 [42 000 – 56 000] 67 000 [56 000 – 75 000]
Greece 8800 [7300 – 11 000] 8100 [6800 – 9500] 8800 [7300 – 11 000]
Hungary 3000 [2200 – 3900] 2800 [2100 – 3700] 3000 [2200 – 3900]
Iceland <1000 [<500 – <1000] <500 [<500 – <500] <1000 [<500 – <1000]
Ireland 6900 [5200 – 8700] 4500 [3400 – 5900] 6900 [5200 – 8700]
Israel 7500 [5600 – 9900] 5200 [3900 – 6800] 7500 [5600 – 9900]
Italy 140 000 [110 000 – 180 000] 130 000 [99 000 – 170 000] 140 000 [110 000 – 180 000]
Latvia 8600 [6300 – 12 000] 4700 [3500 – 6 200] 8600 [6300 – 11 000]
Lithuania 1200 [<1000 – 1600] <1000 [<1000 – <1000] 1200 [<1000 – 1600]
Luxembourg <1000 [<1000 – 1200] <1000 [<500 – <1000] <1000 [<1000 – 1200]
Malta <500 [<500 – <500] <500 [<200 – <500] <500 [<500 – <500]
Netherlands 22 000 [17 000 – 32 000] 18 000 [14 000 – 24 000] 22 000 [17 000 – 32 000]
Norway 4000 [3000 – 5400] 3000 [2300 – 4100] 4000 [3000 – 5400]
Poland 27 000 [20 000 – 34 000] 21 000 [16 000 – 28 000] 27 000 [20 000 – 34 000]
Portugal 42 000 [32 000 – 53 000] 31 000 [24 000 – 41 000] 42 000 [32 000 – 53 000]
Romania 16 000 [12 000 – 20 000] 16 000 [12 000 – 20 000] 15 000 [11 000 – 20 000]
Serbia 4900 [3500 – 7100] 1900 [<500 – 2800] 4900 [3400 – 7100]
Slovakia <500 [<500 – <500] <200 [<200 – <500] <500 [<500 – <500]
Slovenia <1000 [<500 – <1000] <500 [<200 – <500] <1000 [<500 – <1000]
Spain 130 000 [120 000 – 150 000] 120 000 [100 000 – 130 000] 130 000 [120 000 – 150 000]
Sweden 8100 [6100 – 11 000] 6300 [4900 – 8700] 8100 [6100 – 11 000]
Switzerland 18 000 [13 000 – 24 000] 13 000 [9500 – 17 000] 18 000 [13 000 – 24 000]
Turkey 4600 [3400 – 6100] 1700 [1300 – 2300] 4500 [3300 – 6100]
United Kingdom of Great Britain and Northern Ireland 85 000 [66 000 – 110 000] 43 000 [35 000 – 54 000] 85 000 [66 000 – 110 000]
MIDDLE EAST AND NORTH AFRICA 460 000 [400 000 – 530 000] 180 000 [150 000 – 210 000] 440 000 [380 000 – 510 000]
Algeria 18 000 [13 000 – 24 000] 6800 [4900 – 9000] 17 000 [12 000 – 24 000]
Djibouti 14 000 [10 000 – 18 000] 12 000 [9000 – 16 000] 13 000 [9400 – 16 000]
Egypt 11 000 [8400 – 17 000] 3300 [2900 – 5300] 10 000 [8100 – 16 000]
Iran (Islamic Republic of) 92 000 [74 000 – 120 000] 54 000 [45 000 – 65 000] 91 000 [72 000 – 110 000]
Lebanon 3600 [2700 – 4800] 3800 [2900 – 5100] 3400 [2600 – 4600]
Morocco 26 000 [19 000 – 34 000] 14 000 [11 000 – 18 000] 25 000 [19 000 – 33 000]
Oman 1100 [<1000 – 1400] <500 [<500 – <1000] 1100 [<1000 – 1400]
Qatar <200 [<100 – <200] <100 [<100 – <100] <200 [<100 – <200]
Somalia 34 000 [25 000 – 48 000] 11 000 [<500 – 14 000] 32 000 [23 000 – 46 000]
Sudan 260 000 [210 000 – 330 000] 72 000 [35 000 – 98 000] 250 000 [200 000 – 310 000]
Tunisia 2400 [1800 – 3300] <1000 [<500 – 1000] 2400 [1700 – 3300]
ESTIMATED PEOPLE LIVING WITH HIV

195Annex 1: HIV and AIDS estimates and data, 2009 and 2001 | 2010 GLOBAL REPORT
A1
estimate estimate estimate[low – high estimate] [low – high estimate] [low – high estimate]
Adult (15–49) prevalence percentAdult (15–49) prevalence percentAdults (15+)
200120092001
<1000 [<500 – <1000] <0.1 [<0.1 – <0.1] <0.1 [<0.1 – <0.1]
1300 [1200 – 1600] <0.1 [<0.1 – <0.1] <0.1 [<0.1 – <0.1]
3300 [2800 – 3800] 0.2 [0.1 – 0.2] 0.1 [0.1 – 0.1]
4700 [3800 – 5700] 1.2 [1.0 – 1.5] 0.6 [0.5 – 0.8]
1600 [1300 – 1900] 0.1 [0.1 – 0.1] 0.1 [<0.1 – 0.1]
120 000 [100 000 – 140 000] 0.4 [0.3 – 0.5] 0.3 [0.3 – 0.4]
49 000 [42 000 – 56 000] 0.1 [0.1 – 0.2] 0.1 [0.1 – 0.1]
8000 [6800 – 9500] 0.1 [0.1 – 0.2] 0.1 [0.1 – 0.1]
2800 [2100 – 3700] <0.1 [<0.1 – 0.1] <0.1 [<0.1 – 0.1]
<500 [<500 – <500] 0.3 [0.2 – 0.4] 0.2 [0.2 – 0.3]
4500 [3400 – 5900] 0.2 [0.2 – 0.3] 0.2 [0.1 – 0.2]
5100 [3900 – 6800] 0.2 [0.1 – 0.2] 0.1 [0.1 – 0.2]
130 000 [99 000 – 170 000] 0.3 [0.2 – 0.3] 0.3 [0.2 – 0.4]
4700 [3500 – 6200] 0.7 [0.5 – 0.9] 0.4 [0.3 – 0.5]
<1000 [<1000 – <1000] 0.1 [<0.1 – 0.1] <0.1 [<0.1 – <0.1]
<1000 [<500 – <1000] 0.3 [0.2 – 0.4] 0.3 [0.2 – 0.3]
<500 [<200 – <500] 0.1 [0.1 – 0.1] 0.1 [0.1 – 0.1]
18 000 [14 000 – 24 000] 0.2 [0.1 – 0.3] 0.2 [0.1 – 0.3]
3000 [2300 – 4100] 0.1 [0.1 – 0.2] 0.1 [0.1 – 0.2]
21 000 [16 000 – 28 000] 0.1 [0.1 – 0.1] 0.1 [0.1 – 0.1]
31 000 [24 000 – 41 000] 0.6 [0.4 – 0.7] 0.5 [0.4 – 0.6]
16 000 [12 000 – 20 000] 0.1 [0.1 – 0.1] 0.1 [0.1 – 0.2]
1900 [<500 – 2700] 0.1 [0.1 – 0.2] <0.1 [<0.1 – 0.1]
<200 [<200 – <500] <0.1 [<0.1 – <0.1] <0.1 [<0.1 – <0.1]
<500 [<200 – <500] <0.1 [<0.1 – 0.1] <0.1 [<0.1 – <0.1]
110 000 [100 000 – 130 000] 0.4 [0.3 – 0.4] 0.4 [0.4 – 0.5]
6300 [4900 – 8700] 0.1 [0.1 – 0.2] 0.1 [0.1 – 0.2]
13 000 [9500 – 17 000] 0.4 [0.3 – 0.5] 0.3 [0.2 – 0.4]
1700 [1300 – 2300] <0.1 [<0.1 – <0.1] <0.1 [<0.1 – <0.1]
43 000 [35 000 – 53 000] 0.2 [0.2 – 0.3] 0.1 [0.1 – 0.2]
170 000 [150 000 – 200 000] 0.2 [0.2 – 0.3] 0.1 [0.1 – 0.1]
6700 [4800 – 9000] 0.1 [0.1 – 0.1] <0.1 [<0.1 – <0.1]
11 000 [8600 – 15 000] 2.5 [1.9 – 3.2] 2.9 [2.2 – 3.9]
3200 [2900 – 5300] <0.1 [<0.1 – <0.1] <0.1 [<0.1 – <0.1]
54 000 [44 000 – 64 000] 0.2 [0.1 – 0.2] 0.1 [0.1 – 0.1]
3700 [2800 – 5000] 0.1 [0.1 – 0.2] 0.2 [0.1 – 0.2]
14 000 [10 000 – 18 000] 0.1 [0.1 – 0.2] 0.1 [0.1 – 0.1]
<500 [<500 – <500] 0.1 [<0.1 – 0.1] <0.1 [<0.1 – <0.1]
<100 [<100 – <100] <0.1 [<0.1 – <0.1] <0.1 [<0.1 – <0.1]
10 000 [<500 – 13 000] 0.7 [0.5 – 1.0] 0.3 [<0.1 – 0.3]
68 000 [34 000 – 89 000] 1.1 [0.9 – 1.4] 0.4 [0.2 – 0.5]
<1000 [<500 – 1000] <0.1 [<0.1 – 0.1] <0.1 [<0.1 – <0.1]
Croatia
Czech Republic
Denmark
Estonia
Finland
France
Germany
Greece
Hungary
Iceland
Ireland
Israel
Italy
Latvia
Lithuania
Luxembourg
Malta
Netherlands
Norway
Poland
Portugal
Romania
Serbia
Slovakia
Slovenia
Spain
Sweden
Switzerland
Turkey
United Kingdom of Great Britain and Northern Ireland
MIDDLE EAST AND NORTH AFRICA
Algeria
Djibouti
Egypt
Iran (Islamic Republic of)
Lebanon
Morocco
Oman
Qatar
Somalia
Sudan
Tunisia

196 Annex 1: HIV and AIDS estimates and data, 2009 and 2001 | 2010 GLOBAL REPORT
estimate estimate estimate[low – high estimate] [low – high estimate] [low – high estimate]
Children (0–14)Women (15+)Women (15+)
200920012009
<500 [<500 – <500] <200 [<200 – <500] … …
<1000 [<1000 – <1000] <500 [<500 – <500] … …
1400 [1100 – 1700] <1000 [<1000 – 1000] … …
3000 [2400 – 3800] 1400 [1100 – 1700] … …
<1000 [<1000 – <1000] <500 [<500 – <1000] … …
48 000 [38 000 – 59 000] 37 000 [31 000 – 44 000] … …
12 000 [11 000 – 14 000] 9000 [7700 – 10 000] … …
2700 [2200 – 3200] 2500 [2100 – 2900] … …
<1000 [<1000 – 1300] <1000 [<1000 – 1200] … …
<200 [<200 – <500] <100 [<100 – <200] … …
2000 [1500 – 2600] 1300 [1000 – 1800] … …
2200 [1700 – 2900] 1500 [1200 – 2100] … …
48 000 [36 000 – 61 000] 42 000 [32 000 – 56 000] … …
2600 [1900 – 3500] 1400 [1000 – 1800] … …
<500 [<500 – <500] <500 [<200 – <500] … …
<500 [<500 – <500] <200 [<200 – <500] … …
<100 [<100 – <200] <100 [<100 – <100] … …
6900 [5200 – 9700] 5400 [4200 – 7400] … …
1200 [<1000 – 1600] <1000 [<1000 – 1200] … …
8200 [6200 – 11 000] 6400 [4800 – 8500] … …
13 000 [9900 – 16 000] 9400 [7300 – 12 000] … …
4700 [3500 – 5900] 4600 [3600 – 5900] … …
1200 [<1000 – 1600] <500 [<100 – <1000] … …
<100 [<100 – <200] <100 [<100 – <100] … …
<200 [<200 – <500] <100 [<100 – <100] … …
32 000 [27 000 – 36 000] 28 000 [23 000 – 32 000] … …
2500 [1900 – 3400] 1900 [1500 – 2700] … …
5700 [4100 – 7500] 4000 [3000 – 5200] … …
1400 [1000 – 1800] <1000 [<500 – <1000] … …
26 000 [20 000 – 32 000] 13 000 [10 000 – 16 000] … …
210 000 [180 000 – 240 000] 74 000 [61 000 – 87 000] 21 000 [13 000 – 28 000]
5200 [3700 – 7200] 2000 [1500 – 2600] … …
7400 [5300 – 9500] 6600 [5000 – 9000] … …
2400 [2500 – 4900] <1000 [<1000 – 1600] … …
26 000 [20 000 – 33 000] 15 000 [12 000 – 18 000] … …
1100 [<1000 – 1400] 1100 [<1000 – 1500] … …
8100 [6000 – 11 000] 4300 [3300 – 5600] … …
<500 [<500 – <500] <200 [<200 – <200] … …
<100 [<100 – <100] <100 [<100 – <100] … …
15 000 [11 000 – 21 000] 4700 [<200 – 6300] … …
140 000 [110 000 – 180 000] 39 000 [20 000 – 53 000] … …
<1000 [<1000 – 1000] <500 [<100 – <500] … …
Croatia
Czech Republic
Denmark
Estonia
Finland
France
Germany
Greece
Hungary
Iceland
Ireland
Israel
Italy
Latvia
Lithuania
Luxembourg
Malta
Netherlands
Norway
Poland
Portugal
Romania
Serbia
Slovakia
Slovenia
Spain
Sweden
Switzerland
Turkey
United Kingdom of Great Britain and Northern Ireland
MIDDLE EAST AND NORTH AFRICA
Algeria
Djibouti
Egypt
Iran (Islamic Republic of)
Lebanon
Morocco
Oman
Qatar
Somalia
Sudan
Tunisia
ESTIMATED PEOPLE LIVING WITH HIV

197Annex 1: HIV and AIDS estimates and data, 2009 and 2001 | 2010 GLOBAL REPORT
A1
estimate estimate estimate[low – high estimate] [low – high estimate] [low – high estimate]
Young men (15–24) prevalence (%)Young women (15–24) prevalence (%)Children (0–14)
200920092001
… … <0.1 [<0.1 – <0.1] <0.1 [<0.1 – 0.1]
… … <0.1 [<0.1 – <0.1] <0.1 [<0.1 – 0.1]
… … 0.1 [<0.1 – 0.1] 0.1 [0.1 – 0.1]
… … 0.2 [0.2 – 0.3] 0.3 [0.2 – 0.4]
… … <0.1 [<0.1 – 0.1] 0.1 [<0.1 – 0.2]
… … 0.1 [0.1 – 0.2] 0.2 [0.1 – 0.6]
… … <0.1 [<0.1 – <0.1] 0.1 [0.1 – 0.1]
… … 0.1 [<0.1 – 0.1] 0.1 [<0.1 – 0.2]
… … <0.1 [<0.1 – <0.1] <0.1 [<0.1 – 0.1]
… … 0.1 [<0.1 – 0.1] 0.1 [<0.1 – 0.4]
… … 0.1 [<0.1 – 0.1] 0.1 [<0.1 – 0.3]
… … <0.1 [<0.1 – 0.1] 0.1 [<0.1 – 0.2]
… … <0.1 [<0.1 – <0.1] <0.1 [<0.1 – 0.1]
… … 0.1 [0.1 – 0.2] 0.2 [0.1 – 0.2]
… … <0.1 [<0.1 – <0.1] <0.1 [<0.1 – <0.1]
… … 0.1 [<0.1 – 0.2] 0.1 [<0.1 – 0.4]
… … <0.1 [<0.1 – <0.1] <0.1 [<0.1 – 0.1]
… … <0.1 [<0.1 – 0.1] 0.1 [<0.1 – 0.3]
… … <0.1 [<0.1 – 0.1] <0.1 [<0.1 – 0.2]
… … <0.1 [<0.1 – <0.1] <0.1 [<0.1 – 0.1]
… … 0.2 [0.1 – 0.4] 0.3 [0.1 – 0.9]
… … <0.1 [<0.1 – 0.1] 0.1 [<0.1 – 0.2]
… … 0.1 [<0.1 – 0.1] 0.1 [0.1 – 0.2]
… … <0.1 [<0.1 – <0.1] <0.1 [<0.1 – <0.1]
… … <0.1 [<0.1 – 0.1] <0.1 [<0.1 – 0.1]
… … 0.1 [0.1 – 0.1] 0.2 [0.1 – 0.2]
… … <0.1 [<0.1 – 0.1] <0.1 [<0.1 – 0.2]
… … 0.1 [0.1 – 0.2] 0.2 [0.1 – 0.6]
… … <0.1 [<0.1 – <0.1] <0.1 [<0.1 – <0.1]
… … 0.1 [<0.1 – 0.2] 0.2 [0.1 – 0.6]
7100 [3800 – 13 000] 0.2 [0.2 – 0.3] 0.1 [0.1 – 0.1]
… … <0.1 [<0.1 – 0.1] 0.1 [<0.1 – 0.2]
… … 1.9 [1.0 – 2.9] 0.8 [0.4 – 1.3]
… … <0.1 [<0.1 – <0.1] <0.1 [<0.1 – <0.1]
… … <0.1 [<0.1 – <0.1] <0.1 [<0.1 – <0.1]
… … <0.1 [<0.1 – 0.1] 0.1 [<0.1 – 0.1]
… … 0.1 [<0.1 – 0.1] 0.1 [<0.1 – 0.3]
… … <0.1 [<0.1 – <0.1] <0.1 [<0.1 – <0.1]
… … <0.1 [<0.1 – <0.1] <0.1 [<0.1 – <0.1]
… … 0.6 [0.4 – 1.1] 0.4 [0.3 – 0.7]
… … 1.3 [0.9 – 1.8] 0.5 [0.4 – 0.7]
… … <0.1 [<0.1 – <0.1] <0.1 [<0.1 – 0.1]
Croatia
Czech Republic
Denmark
Estonia
Finland
France
Germany
Greece
Hungary
Iceland
Ireland
Israel
Italy
Latvia
Lithuania
Luxembourg
Malta
Netherlands
Norway
Poland
Portugal
Romania
Serbia
Slovakia
Slovenia
Spain
Sweden
Switzerland
Turkey
United Kingdom of Great Britain and Northern Ireland
MIDDLE EAST AND NORTH AFRICA
Algeria
Djibouti
Egypt
Iran (Islamic Republic of)
Lebanon
Morocco
Oman
Qatar
Somalia
Sudan
Tunisia

198 Annex 1: HIV and AIDS estimates and data, 2009 and 2001 | 2010 GLOBAL REPORT
estimate estimate estimate[low – high estimate] [low – high estimate] [low – high estimate]
Adults + children newly infectedAdult (15–49) incidence rateAdult (15–49) incidence rate
200920012009
ESTIMATED NEW HIV INFECTIONS
… [<0.10 – <0.10] … [<0.10 – <0.10] … [<100 – <100]
… [<0.10 – <0.10] … [<0.10 – <0.10] … [<100 – <100]
… [<0.10 – <0.10] … [<0.10 – <0.10] … [<200 – <500]
… [<0.10 – 0.14] … [0.13 – 0.21] … [<1000 – 1000]
… [<0.10 – <0.10] … [<0.10 – <0.10] … [<100 – <200]
<0.10 [<0.10 – <0.10] <0.10 [<0.10 – <0.10] 6900 [3900 – 10 000]
<0.10 [<0.10 – <0.10] <0.10 [<0.10 – <0.10] 3300 [2500 – 4200]
… [<0.10 – <0.10] … [<0.10 – <0.10] … [<200 – <500]
… [<0.10 – <0.10] … [<0.10 – <0.10] … [<100 – <1000]
… [<0.10 – <0.10] … [<0.10 – <0.10] … [<100 – <100]
… [<0.10 – <0.10] … [<0.10 – <0.10] … [<100 – <500]
… [<0.10 – <0.10] … [<0.10 – <0.10] … [<200 – <500]
… [<0.10 – <0.10] … … … [1700 – 6200]
<0.10 [<0.10 – 0.10] <0.10 [<0.10 – 0.11] <1000 [<500 – 1200]
<0.10 [<0.10 – <0.10] <0.10 [<0.10 – <0.10] <100 [<100 – <200]
… [<0.10 – <0.10] … [<0.10 – <0.10] … [<100 – <100]
… [<0.10 – <0.10] … [<0.10 – <0.10] … [<100 – <100]
… [<0.10 – <0.10] … [<0.10 – <0.10] … [<500 – 1100]
… [<0.10 – <0.10] … [<0.10 – <0.10] … [<100 – <500]
… [<0.10 – <0.10] … [<0.10 – <0.10] … [<500 – 1300]
… [<0.10 – <0.10] … [<0.10 – <0.10] … [<1000 – 2300]
… [<0.10 – <0.10] … [<0.10 – <0.10] … [<500 – 1000]
… [<0.10 – <0.10] … [<0.10 – <0.10] … [<500 – <1000]
… [<0.10 – <0.10] … [<0.10 – <0.10] … [<100 – <100]
… [<0.10 – <0.10] … [<0.10 – <0.10] … [<100 – <200]
… [<0.10 – <0.10] … [<0.10 – <0.10] … [2200 – 4100]
… [<0.10 – <0.10] … [<0.10 – <0.10] … [<100 – <500]
… [<0.10 – <0.10] … [<0.10 – <0.10] … [<500 – 1000]
… [<0.10 – <0.10] … [<0.10 – <0.10] … [<500 – <1000]
… [<0.10 – <0.10] … [<0.10 – <0.10] … [1500 – 6000]
<0.10 [<0.10 – <0.10] <0.10 [<0.10 – <0.10] 75 000 [61 000 – 92 000]
… [<0.10 – <0.10] … [<0.10 – <0.10] … [1100 – 3700]
0.25 [0.10 – 0.34] 0.29 [0.18 – 0.51] 1300 [<1000 – 1800]
… [<0.10 – <0.10] … [<0.10 – <0.10] … [<1000 – 2900]
… [<0.10 – <0.10] … [<0.10 – <0.10] … [5600 – 11 000]
… [<0.10 – <0.10] … [<0.10 – <0.10] … [<100 – <500]
… [<0.10 – <0.10] … [<0.10 – <0.10] … [1200 – 5800]
… [<0.10 – <0.10] … [<0.10 – <0.10] … [<200 – <500]
… [<0.10 – <0.10] … [<0.10 – <0.10] … [<100 – <100]
… [<0.10 – 0.29] … [<0.10 – <0.10] … [4200 – 13 000]
… [0.17 – 0.35] … [<0.10 – 0.10] … [38 000 – 74 000]
… [<0.10 – <0.10] … [<0.10 – <0.10] … [<500 – <1000]
Croatia
Czech Republic
Denmark
Estonia
Finland
France
Germany
Greece
Hungary
Iceland
Ireland
Israel
Italy
Latvia
Lithuania
Luxembourg
Malta
Netherlands
Norway
Poland
Portugal
Romania
Serbia
Slovakia
Slovenia
Spain
Sweden
Switzerland
Turkey
United Kingdom of Great Britain and Northern Ireland
MIDDLE EAST AND NORTH AFRICA
Algeria
Djibouti
Egypt
Iran (Islamic Republic of)
Lebanon
Morocco
Oman
Qatar
Somalia
Sudan
Tunisia

199Annex 1: HIV and AIDS estimates and data, 2009 and 2001 | 2010 GLOBAL REPORT
A1
ESTIMATED AIDS-RELATED DEATHS
estimate estimate estimate[low – high estimate] [low – high estimate] [low – high estimate]
AIDS-related deaths in adults + childrenAIDS-related deaths in adults + childrenAdults newly infected
200120092009
… [<100 – <100] <100 [<100 – <100] <100 [<100 – <100]
… [<100 – <100] <100 [<100 – <100] <100 [<100 – <100]
… [<200 – <500] <100 [<100 – <200] <100 [<100 – <100]
… [<1000 – 1000] <500 [<500 – <1000] <200 [<100 – <200]
… [<100 – <200] <100 [<100 – <100] <100 [<100 – <100]
6800 [3900 – 10 000] 1700 [1400 – 3900] 1200 [<1000 – 3000]
3300 [2500 – 4200] <1000 [<1000 – 1900] <1000 [<500 – <1000]
… [<200 – <500] <500 [<200 – <500] <500 [<500 – <500]
… [<100 – <100] <200 [<100 – <200] <500 [<200 – <500]
… [<100 – <100] <100 [<100 – <100] <100 [<100 – <100]
… [<100 – <500] <100 [<100 – <200] <100 [<100 – <100]
… [<200 – <500] <100 [<100 – <200] <100 [<100 – <100]
… [1700 – 6200] <1000 [<1000 – 4100] 1300 [<1000 – 2400]
<1000 [<500 – 1200] <1000 [<500 – <1000] <200 [<100 – <500]
<100 [<100 – <200] <100 [<100 – <100] <100 [<100 – <100]
… [<100 – <100] <100 [<100 – <100] <100 [<100 – <100]
… [<100 – <100] <100 [<100 – <100] <100 [<100 – <100]
… [<500 – 1100] <100 [<100 – <500] <100 [<100 – <100]
… [<100 – <500] <100 [<100 – <200] <100 [<100 – <100]
… [<500 – 1300] <200 [<100 – <1000] <100 [<100 – <200]
… [<1000 – 2300] <500 [<100 – 1300] <500 [<500 – <500]
… [<500 – 1000] <1000 [<500 – 1200] <500 [<200 – <1000]
… [<500 – <1000] <200 [<100 – <500] <500 [<100 – <500]
… [<100 – <100] <100 [<100 – <100] <100 [<100 – <100]
… [<100 – <200] <100 [<100 – <100] <100 [<100 – <100]
… [2200 – 4100] 1600 [1200 – 2000] 1800 [1500 – 2100]
… [<100 – <500] <100 [<100 – <500] <100 [<100 – <100]
… [<500 – 1000] <100 [<100 – <500] <200 [<100 – <500]
… [<500 – <1000] <200 [<100 – <500] <100 [<100 – <200]
… [<100 – <100] <1000 [<500 – 1600] <500 [<200 – <500]
68 000 [55 000 – 84 000] 24 000 [20 000 – 27 000] 8300 [6300 – 11 000]
… [1000 – 3600] <1000 [<1000 – 1100] <500 [<200 – <500]
1100 [<500 – 1500] 1000 [<1000 – 1400] <1000 [<500 – 1400]
… [<1000 – 2700] <500 [<500 – <1000] <200 [<100 – <500]
… [5400 – 11 000] 6400 [5200 – 8000] 2000 [1600 – 2600]
… [<100 – <500] <500 [<500 – <500] <500 [<200 – <500]
… [<100 – <100] 1200 [<1000 – 1600] <1000 [<1000 – 1000]
… [<200 – <500] <100 [<100 – <100] <100 [<100 – <100]
… [<100 – <100] <100 [<100 – <100] <100 [<100 – <100]
… [3700 – 11 000] 1600 [1200 – 2300] <1000 [<100 – <1000]
… [34 000 – 67 000] 12 000 [9200 – 15 000] 3500 [<1000 – 6700]
… [<500 – <1000] <100 [<100 – <200] <100 [<100 – <100]
Croatia
Czech Republic
Denmark
Estonia
Finland
France
Germany
Greece
Hungary
Iceland
Ireland
Israel
Italy
Latvia
Lithuania
Luxembourg
Malta
Netherlands
Norway
Poland
Portugal
Romania
Serbia
Slovakia
Slovenia
Spain
Sweden
Switzerland
Turkey
United Kingdom of Great Britain and Northern Ireland
MIDDLE EAST AND NORTH AFRICA
Algeria
Djibouti
Egypt
Iran (Islamic Republic of)
Lebanon
Morocco
Oman
Qatar
Somalia
Sudan
Tunisia

200 Annex 1: HIV and AIDS estimates and data, 2009 and 2001 | 2010 GLOBAL REPORT
ESTIMATED ORPHANS DUE TO AIDS
… … … … … … … … … …
… … … … 2009 0.1 … … 2009 2.6
… … … … … … … … 2009 11.8
… … … … 2007 62.5 2006 7.7 2007 1.7
… … … … 2009 0.7 … … … …
… … … … … … … … … …
… … … … … … … … … …
… … … … … … … … … …
… … … … … … … … 2009 2.6
… … … … … … … … … …
… … … … … … … … … …
… … … … … … … … … …
… … … … … … … … … …
… … … … 2007 22.6 … … 2008 4.0
… … … … 2008 8.0 … … … …
… … … … 2008 1.8 … … … …
… … … … … … … … … …
… … … … … … … … … …
… … … … … … … … … …
… … … … … … … … … …
… … … … 2008 14.0 … … … …
… … … … 2009 1.1 2009 1.0 2009 4.4
… … … … 2008 4.8 … … 2008 6.1
… … … … … … … … … …
… … … … … … … … 2009 1.6
… … … … 2008 19.5 2008 0.9 2008 10.2
… … … … … … … … … …
… … … … 2006 10.9 … … 2007 8.1
… … … … … … … … … …
… … … … … … … … … …
96 000 [73 000 – 120 000] 36 000 [22 000 – 63 000] … … … … … …
… … … … … … … … … …
… … … … … … 2008 20.3 … …
… … … … … … 2006 0.9 2006 5.6
… … … … … … … … … …
… … … … … … … … 2008 1.0
… … … … 2009 2.1 2009 2.4 … …
… … … … … … … … … …
… … … … … … … … … …
… … … … … … 2008 5.5 … …
… … … … … … 2008 0.9 … …
… … … … 2009 3.1 2009 0.4 2009 4.8
Croatia
Czech Republic
Denmark
Estonia
Finland
France
Germany
Greece
Hungary
Iceland
Ireland
Israel
Italy
Latvia
Lithuania
Luxembourg
Malta
Netherlands
Norway
Poland
Portugal
Romania
Serbia
Slovakia
Slovenia
Spain
Sweden
Switzerland
Turkey
United Kingdom of Great Britain and Northern Ireland
MIDDLE EAST AND NORTH AFRICA
Algeria
Djibouti
Egypt
Iran (Islamic Republic of)
Lebanon
Morocco
Oman
Qatar
Somalia
Sudan
Tunisia
HIV PREVALENCE (%) IN MOST-AT-RISK GROUPS IN CAPITAL CITY
estimate estimate[low – high estimate] [low – high estimate]
Orphans (0–17)
Year Year YearHIV (%) HIV (%) HIV (%)
Injecting drug users
Female sex workers
Men who have sex with menOrphans (0–17) currently living
20012009

201Annex 1: HIV and AIDS estimates and data, 2009 and 2001 | 2010 GLOBAL REPORT
A1
ESTIMATED PEOPLE LIVING WITH HIV
NORTH AMERICA 1 500 000 [1 200 000 – 2 000 000] 1 200 000 [960 000 – 1 400 000] 1 500 000 [1 200 000 – 2 000 000]
Canada 68 000 [53 000 – 83 000] 49 000 [40 000 – 62 000] 68 000 [53 000 – 83 000]
Mexico 220 000 [180 000 – 280 000] 180 000 [150 000 – 210 000] 220 000 [180 000 – 270 000]
United States of America 1 200 000 [930 000 – 1 700 000] 940 000 [730 000 – 1 200 000] 1 200 000 [930 000 – 1 700 000]
CARIBBEAN 240 000 [220 000 – 270 000] 240 000 [210 000 – 270 000] 220 000 [200 000 – 250 000]
Bahamas 6600 [2600 – 11 000] 5900 [3900 – 8500] 6100 [2400 – 11 000]
Barbados 2100 [1800 – 2500] <1000 [<1000 – 1 000] 2100 [1800 – 2500]
Cuba 7100 [5700 – 8900] 2600 [1900 – 3400] 7000 [5600 – 8800]
Dominican Republic 57 000 [49 000 – 66 000] 54 000 [45 000 – 65 000] 54 000 [45 000 – 62 000]
Haiti 120 000 [110 000 – 140 000] 130 000 [110 000 – 160 000] 110 000 [95 000 – 130 000]
Jamaica 32 000 [21 000 – 45 000] 32 000 [23 000 – 41 000] 31 000 [20 000 – 43 000]
Trinidad and Tobago 15 000 [11 000 – 19 000] 10 000 [7900 – 14 000] 14 000 [11 000 – 19 000]
CENTRAL AND SOUTH AMERICA 1 400 000 [1 200 000 – 1 600 000] 1 100 000 [1 000 000 – 1 300 000] 1 400 000 [1 200 000 – 1 600 000]
Argentina 110 000 [88 000 – 140 000] 80 000 [66 000 – 99 000] 110 000 [87 000 – 140 000]
Belize 4800 [4000 – 5700] 3600 [3000 – 4200] 4400 [3600 – 5300]
Bolivia 12 000 [9000 – 16 000] 12 000 [9100 – 16 000] 11 000 [8400 – 15 000]
Brazil … [460 000 – 810 000] … [380 000 – 560 000] … [450 000 – 800 000]
Chile 40 000 [32 000 – 51 000] 24 000 [19 000 – 31 000] 39 000 [31 000 – 50 000]
Colombia 160 000 [120 000 – 210 000] 210 000 [170 000 – 260 000] 150 000 [120 000 – 200 000]
Costa Rica 9800 [7500 – 13 000] 4400 [3400 – 5900] 9600 [7300 – 12 000]
Ecuador 37 000 [28 000 – 50 000] 36 000 [27 000 – 47 000] 36 000 [27 000 – 49 000]
El Salvador 34 000 [25 000 – 44 000] 25 000 [19 000 – 33 000] 32 000 [24 000 – 42 000]
Guatemala 62 000 [47 000 – 82 000] 31 000 [23 000 – 41 000] 60 000 [45 000 – 79 000]
Guyana 5900 [2700 – 8800] 7800 [5300 – 12 000] 5500 [2400 – 8200]
Honduras 39 000 [26 000 – 51 000] 44 000 [33 000 – 61 000] 37 000 [24 000 – 49 000]
Nicaragua 6900 [5200 – 9100] 3700 [2900 – 4800] 6700 [5000 – 8900]
Panama 20 000 [14 000 – 36 000] 26 000 [17 000 – 50 000] 20 000 [13 000 – 36 000]
Paraguay 13 000 [9800 – 16 000] 9200 [7200 – 13 000] 12 000 [9600 – 16 000]
Peru 75 000 [58 000 – 100 000] 82 000 [65 000 – 100 000] 73 000 [56 000 – 98 000]
Suriname 3700 [2700 – 5300] 3300 [2300 – 4500] 3600 [2700 – 5100]
Uruguay 9900 [8400 – 12 000] 7000 [5900 – 8200] 9600 [8100 – 11 000]
Venezuela … … … … … …
estimate estimate estimate[low – high estimate] [low – high estimate] [low – high estimate]
Adults (15+)Adults + ChildrenAdults + Children
200920012009

202 Annex 1: HIV and AIDS estimates and data, 2009 and 2001 | 2010 GLOBAL REPORT
estimate estimate estimate[low – high estimate] [low – high estimate] [low – high estimate]
Adult (15–49) prevalence percentAdult (15–49) prevalence percentAdults (15+)
200120092001
1 200 000 [950 000 – 1 400 000] 0.5 [0.4 – 0.7] 0.4 [0.4 – 0.5]
49 000 [40 000 – 62 000] 0.3 [0.2 – 0.4] 0.3 [0.2 – 0.3]
180 000 [150 000 – 210 000] 0.3 [0.3 – 0.4] 0.3 [0.2 – 0.4]
930 000 [730 000 – 1 200 000] 0.6 [0.4 – 0.8] 0.5 [0.4 – 0.7]
220 000 [200 000 – 250 000] 1.0 [0.9 – 1.1] 1.1 [1.0 – 1.2]
5400 [3400 – 7600] 3.1 [1.2 – 5.4] 3.1 [1.9 – 4.4]
<1000 [<1000 – 1000] 1.4 [1.2 – 1.6] 0.5 [0.4 – 0.6]
2600 [1900 – 3400] 0.1 [0.1 – 0.1] <0.1 [<0.1 – 0.1]
50 000 [43 000 – 60 000] 0.9 [0.7 – 1.0] 0.9 [0.8 – 1.1]
120 000 [100 000 – 140 000] 1.9 [1.7 – 2.2] 2.6 [2.3 – 3.0]
31 000 [22 000 – 39 000] 1.7 [1.1 – 2.5] 1.9 [1.3 – 2.4]
10 000 [7800 – 14 000] 1.5 [1.1 – 2.0] 1.2 [0.9 – 1.6]
1 100 000 [1 000 000 – 1 200 000] 0.5 [0.4 – 0.6] 0.5 [0.4 – 0.5]
79 000 [65 000 – 97 000] 0.5 [0.3 – 0.6] 0.4 [0.3 – 0.5]
3300 [2800 – 3800] 2.3 [2.0 – 2.8] 2.2 [1.9 – 2.6]
11 000 [8600 – 15 000] 0.2 [0.1 – 0.3] 0.2 [0.2 – 0.3]
… [360 000 – 550 000] … [0.3 – 0.6] … [0.3 – 0.5]
24 000 [18 000 – 30 000] 0.4 [0.3 – 0.5] 0.3 [0.2 – 0.3]
210 000 [160 000 – 260 000] 0.5 [0.4 – 0.7] 0.8 [0.7 – 1.1]
4400 [3300 – 5800] 0.3 [0.2 – 0.4] 0.2 [0.1 – 0.2]
35 000 [26 000 – 46 000] 0.4 [0.3 – 0.6] 0.5 [0.4 – 0.6]
24 000 [18 000 – 32 000] 0.8 [0.6 – 1.1] 0.8 [0.6 – 1.0]
30 000 [22 000 – 40 000] 0.8 [0.6 – 1.0] 0.5 [0.4 – 0.7]
7000 [4600 – 11 000] 1.2 [0.5 – 1.9] 1.4 [0.9 – 2.2]
42 000 [31 000 – 57 000] 0.8 [0.5 – 1.0] 1.2 [0.9 – 1.6]
3600 [2800 – 4700] 0.2 [0.1 – 0.3] 0.1 [0.1 – 0.2]
25 000 [16 000 – 49 000] 0.9 [0.6 – 1.5] 1.4 [0.9 – 2.7]
9000 [7000 – 12 000] 0.3 [0.2 – 0.4] 0.3 [0.2 – 0.4]
81 000 [64 000 – 99 000] 0.4 [0.3 – 0.5] 0.5 [0.4 – 0.6]
3200 [2300 – 4400] 1.0 [0.7 – 1.4] 1.0 [0.7 – 1.4]
6800 [5800 – 8000] 0.5 [0.4 – 0.6] 0.4 [0.3 – 0.4]
… … … … … …
NORTH AMERICA
Canada
Mexico
United States of America
CARIBBEAN
Bahamas
Barbados
Cuba
Dominican Republic
Haiti
Jamaica
Trinidad and Tobago
CENTRAL AND SOUTH AMERICA
Argentina
Belize
Bolivia
Brazil
Chile
Colombia
Costa Rica
Ecuador
El Salvador
Guatemala
Guyana
Honduras
Nicaragua
Panama
Paraguay
Peru
Suriname
Uruguay
Venezuela
ESTIMATED PEOPLE LIVING WITH HIV

203Annex 1: HIV and AIDS estimates and data, 2009 and 2001 | 2010 GLOBAL REPORT
A1
estimate estimate estimate[low – high estimate] [low – high estimate] [low – high estimate]
Children (0–14)Women (15+)Women (15+)
200920012009
390 000 [310 000 – 510 000] 270 000 [220 000 – 320 000] 4500 [4000 – 5800]
21 000 [16 000 – 25 000] 15 000 [12 000 – 18 000] … …
59 000 [47 000 – 75 000] 41 000 [33 000 – 49 000] … …
310 000 [220 000 – 430 000] 210 000 [160 000 – 270 000] … …
120 000 [100 000 – 140 000] 120 000 [100 000 – 140 000] 17 000 [8500 – 26 000]
3700 [1500 – 6400] 3300 [2100 – 4600] … …
<1000 [<1000 – <1000] <500 [<500 – <500] … …
2200 [1700 – 2700] <1000 [<1000 – 1000] … …
32 000 [26 000 – 37 000] 29 000 [24 000 – 35 000] … …
67 000 [56 000 – 78 000] 73 000 [61 000 – 87 000] 12 000 [5700 – 18 000]
10 000 [6700 – 14 000] 9900 [7300 – 13 000] … …
4700 [3500 – 6100] 3300 [2600 – 4300] … …
490 000 [420 000 – 590 000] 370 000 [330 000 – 420 000] 36 000 [25 000 – 50 000]
36 000 [28 000 – 45 000] 25 000 [20 000 – 30 000] … …
2600 [2100 – 3100] 1900 [1600 – 2200] … …
3600 [2700 – 4800] 3500 [2700 – 4600] … …
… [180 000 – 330 000] … [140 000 – 210 000] … …
12 000 [9700 – 15 000] 7200 [5500 – 9300] … …
50 000 [38 000 – 65 000] 65 000 [51 000 – 80 000] … …
2800 [2100 – 3600] 1300 [<1000 – 1700] … …
11 000 [8400 – 15 000] 11 000 [8200 – 14 000] … …
11 000 [8500 – 14 000] 8000 [6000 – 11 000] … …
20 000 [15 000 – 26 000] 9600 [7200 – 13 000] … …
2800 [1100 – 4200] 3800 [2400 – 5700] … …
12 000 [7900 – 16 000] 13 000 [9700 – 18 000] … …
2100 [1600 – 2800] 1100 [<1000 – 1400] … …
6300 [4200 – 11 000] 7600 [4900 – 15 000] … …
3800 [2900 – 4800] 2700 [2100 – 3700] … …
18 000 [14 000 – 25 000] 15 000 [12 000 – 19 000] … …
1100 [<1000 – 1600] <1000 [<1000 – 1300] … …
3100 [2600 – 3600] 2100 [1800 – 2500] … …
… … … … … …
NORTH AMERICA
Canada
Mexico
United States of America
CARIBBEAN
Bahamas
Barbados
Cuba
Dominican Republic
Haiti
Jamaica
Trinidad and Tobago
CENTRAL AND SOUTH AMERICA
Argentina
Belize
Bolivia
Brazil
Chile
Colombia
Costa Rica
Ecuador
El Salvador
Guatemala
Guyana
Honduras
Nicaragua
Panama
Paraguay
Peru
Suriname
Uruguay
Venezuela

204 Annex 1: HIV and AIDS estimates and data, 2009 and 2001 | 2010 GLOBAL REPORT
estimate estimate estimate[low – high estimate] [low – high estimate] [low – high estimate]
Young men (15–24) prevalence (%)Young women (15–24) prevalence (%)Children (0–14)
200920092001
5200 [2900 – 7700] 0.2 [0.1 – 0.3] 0.2 [0.2 – 0.4]
… … 0.1 [<0.1 – 0.2] 0.1 [<0.1 – 0.5]
… … 0.1 [0.1 – 0.2] 0.2 [0.1 – 0.2]
… … 0.2 [0.1 – 0.3] 0.3 [0.2 – 0.5]
18 000 [9100 – 27 000] 0.8 [0.6 – 1.0] 0.4 [0.3 – 0.7]
… … 3.1 [0.8 – 6.6] 1.4 [0.5 – 2.8]
… … 1.1 [0.8 – 1.4] 0.9 [0.7 – 1.1]
… … 0.1 [<0.1 – 0.1] 0.1 [<0.1 – 0.3]
… … 0.7 [0.4 – 0.9] 0.3 [0.1 – 0.4]
12 000 [6300 – 19 000] 1.3 [1.0 – 1.8] 0.6 [0.4 – 0.8]
… … 0.7 [0.3 – 1.4] 1.0 [0.4 – 3.1]
… … 0.7 [0.3 – 1.2] 1.0 [0.4 – 3.3]
30 000 [20 000 – 42 000] 0.2 [0.1 – 0.3] 0.2 [0.2 – 0.5]
… … 0.2 [0.1 – 0.3] 0.3 [0.1 – 0.8]
… … 1.8 [1.4 – 2.7] 0.7 [0.5 – 1.1]
… … 0.1 [<0.1 – 0.1] 0.1 [<0.1 – 0.3]
… … … [0.1 – 0.4] … [0.1 – 0.3]
… … 0.1 [0.1 – 0.3] 0.2 [0.1 – 0.7]
… … 0.1 [0.1 – 0.3] 0.2 [0.1 – 0.7]
… … 0.1 [0.1 – 0.2] 0.2 [0.1 – 0.3]
… … 0.2 [0.1 – 0.3] 0.2 [0.1 – 0.8]
… … 0.3 [0.1 – 0.5] 0.4 [0.2 – 1.3]
… … 0.3 [0.2 – 0.6] 0.5 [0.2 – 1.4]
… … 0.8 [0.2 – 1.5] 0.6 [0.2 – 1.0]
… … 0.2 [0.1 – 0.4] 0.3 [0.1 – 1.1]
… … 0.1 [0.1 – 0.1] 0.1 [0.1 – 0.2]
… … 0.3 [0.1 – 0.5] 0.4 [0.2 – 1.3]
… … 0.1 [0.1 – 0.2] 0.2 [0.1 – 0.6]
… … 0.1 [0.1 – 0.2] 0.2 [0.1 – 0.3]
… … 0.4 [0.2 – 0.7] 0.6 [0.2 – 2.0]
… … 0.2 [0.1 – 0.3] 0.3 [0.1 – 1.0]
… … … … … …
NORTH AMERICA
Canada
Mexico
United States of America
CARIBBEAN
Bahamas
Barbados
Cuba
Dominican Republic
Haiti
Jamaica
Trinidad and Tobago
CENTRAL AND SOUTH AMERICA
Argentina
Belize
Bolivia
Brazil
Chile
Colombia
Costa Rica
Ecuador
El Salvador
Guatemala
Guyana
Honduras
Nicaragua
Panama
Paraguay
Peru
Suriname
Uruguay
Venezuela
ESTIMATED PEOPLE LIVING WITH HIV

205Annex 1: HIV and AIDS estimates and data, 2009 and 2001 | 2010 GLOBAL REPORT
A1
estimate estimate estimate[low – high estimate] [low – high estimate] [low – high estimate]
Adults + children newly infectedAdult (15–49) incidence rateAdult (15–49) incidence rate
200920012009
<0.10 [<0.10 – <0.10] <0.10 [<0.10 – <0.10] 70 000 [44 000 – 130 000]
… [<0.10 – <0.10] … [<0.10 – <0.10] … [<1000 – 3800]
… [<0.10 – <0.10] … [<0.10 – <0.10] … [8800 – 21 000]
<0.10 [<0.10 – <0.10] <0.10 [<0.10 – <0.10] 54 000 [24 000 – 110 000]
<0.10 [<0.10 – <0.10] <0.10 [<0.10 – 0.11] 17 000 [13 000 – 21 000]
… [<0.10 – 0.62] … [<0.10 – 0.43] … [<200 – 1200]
… [<0.10 – 0.16] … [<0.10 – 0.13] … [<200 – <500]
… [<0.10 – <0.10] … [<0.10 – <0.10] … [<500 – <1000]
<0.10 [<0.10 – <0.10] <0.10 [<0.10 – 0.10] 3600 [1600 – 5000]
0.15 [0.10 – 0.19] 0.19 [0.15 – 0.23] 8800 [6500 – 11 000]
0.13 [<0.10 – 0.27] 0.19 [0.10 – 0.25] 2100 [<1000 – 4200]
… [<0.10 – 0.21] … [0.10 – 0.19] … [<1000 – 1800]
<0.10 [<0.10 – <0.10] <0.10 [<0.10 – <0.10] 92 000 [70 000 – 120 000]
<0.10 [<0.10 – <0.10] <0.10 [<0.10 – <0.10] 7500 [4100 – 11 000]
0.20 [0.13 – 0.32] 0.30 [0.23 – 0.35] <500 [<500 – <1000]
… [<0.10 – <0.10] … [<0.10 – <0.10] … [<1000 – 1600]
… [<0.10 – <0.10] … [<0.10 – <0.10] … [18 000 – 70 000]
… [<0.10 – <0.10] … [<0.10 – <0.10] … [1400 – 4300]
… [<0.10 – <0.10] … [<0.10 – <0.10] … [2800 – 16 000]
… [<0.10 – <0.10] … [<0.10 – <0.10] … [<500 – 1100]
… [<0.10 – <0.10] … [<0.10 – <0.10] … [1100 – 6200]
… [<0.10 – 0.11] … [<0.10 – 0.14] … [1200 – 4000]
… [<0.10 – 0.15] … [<0.10 – 0.12] … [3600 – 11 000]
… [<0.10 – 0.17] … [<0.10 – <0.10] … [<100 – <1000]
… [<0.10 – <0.10] … [<0.10 – 0.13] … [<1000 – 3700]
… [<0.10 – <0.10] … [<0.10 – <0.10] … [<500 – 1300]
… [<0.10 – 0.11] … [<0.10 – 0.14] … [<1000 – 2200]
… [<0.10 – <0.10] … [<0.10 – <0.10] … [<1000 – 1600]
… [<0.10 – <0.10] … [<0.10 – <0.10] … [2300 – 6700]
<0.10 [<0.10 – <0.10] 0.11 [<0.10 – 0.16] <500 [<100 – <500]
… [<0.10 – <0.10] … [<0.10 – <0.10] … [<500 – <1000]
… … … … … …
NORTH AMERICA
Canada
Mexico
United States of America
CARIBBEAN
Bahamas
Barbados
Cuba
Dominican Republic
Haiti
Jamaica
Trinidad and Tobago
CENTRAL AND SOUTH AMERICA
Argentina
Belize
Bolivia
Brazil
Chile
Colombia
Costa Rica
Ecuador
El Salvador
Guatemala
Guyana
Honduras
Nicaragua
Panama
Paraguay
Peru
Suriname
Uruguay
Venezuela
ESTIMATED NEW HIV INFECTIONS

206 Annex 1: HIV and AIDS estimates and data, 2009 and 2001 | 2010 GLOBAL REPORT
ESTIMATED AIDS-RELATED DEATHS
estimate estimate estimate[low – high estimate] [low – high estimate] [low – high estimate]
AIDS-related deaths in adults + childrenAIDS-related deaths in adults + childrenAdults newly infected
200120092009
69 000 [43 000 – 120 000] 26 000 [22 000 – 44 000] 30 000 [26 000 – 35 000]
… [<1000 – 3800] <1000 [<500 – <1000] <1000 [<500 – <1000]
… [8300 – 20 000] … [6400 – 12 000] … [9800 – 15 000]
54 000 [24 000 – 110 000] 17 000 [13 000 – 36 000] 17 000 [14 000 – 23 000]
15 000 [12 000 – 19 000] 12 000 [8500 – 15 000] 19 000 [16 000 – 23 000]
… [<100 – 1100] <500 [<200 – <1000] <1000 [<500 – <1000]
… [<200 – <500] <100 [<100 – <100] <100 [<100 – <100]
… [<500 – <1000] <100 [<100 – <500] <200 [<100 – <200]
3200 [1300 – 4400] 2300 [1300 – 3400] 3900 [2900 – 5500]
7600 [5400 – 10 000] 7100 [5200 – 9400] 12 000 [9200 – 14 000]
2000 [<1000 – 4000] 1200 [<500 – 2100] 2700 [2100 – 3500]
… [<1000 – 1700] <1000 [<500 – <1000] <1000 [<500 – <1000]
87 000 [66 000 – 120 000] 58 000 [43 000 – 70 000] 53 000 [44 000 – 65 000]
7400 [4100 – 11 000] 2900 [1600 – 4500] 2800 [1600 – 4100]
<500 [<500 – <1000] <500 [<500 – <500] <500 [<200 – <500]
… [<500 – 1500] <1000 [<1000 – 1200] <1000 [<1000 – 1100]
… [17 000 – 69 000] … [2000 – 25 000] … [7200 – 24 000]
… [1200 – 4000] … [<1000 – 2200] … [<500 – 1200]
… [2300 – 16 000] 14 000 [11 000 – 18 000] 13 000 [9800 – 17 000]
… [<500 – 1000] <500 [<100 – <1000] <100 [<100 – <200]
… [<100 – <100] 2200 [1300 – 3300] 2800 [2100 – 3700]
… [1000 – 3800] 1400 [<1000 – 2100] <1000 [<200 – 1100]
… [3200 – 10 000] 2600 [1600 – 3700] 1500 [1000 – 2100]
… [<100 – <1000] <500 [<100 – <1000] <1000 [<1000 – 1300]
… [<1000 – 3400] 2500 [1700 – 3400] 3700 [2800 – 5000]
… [<500 – 1300] <500 [<200 – <500] <200 [<200 – <500]
… [<1000 – 2100] 1500 [<1000 – 3600] 1600 [<1000 – 3200]
… [<1000 – 1600] <500 [<500 – <1000] <500 [<500 – <1000]
… [2100 – 6300] 5000 [3800 – 6600] 6300 [5200 – 7900]
<200 [<100 – <500] <200 [<200 – <500] <500 [<200 – <500]
… [<500 – <1000] … … … …
… … … … … …
NORTH AMERICA
Canada
Mexico
United States of America
CARIBBEAN
Bahamas
Barbados
Cuba
Dominican Republic
Haiti
Jamaica
Trinidad and Tobago
CENTRAL AND SOUTH AMERICA
Argentina
Belize
Bolivia
Brazil
Chile
Colombia
Costa Rica
Ecuador
El Salvador
Guatemala
Guyana
Honduras
Nicaragua
Panama
Paraguay
Peru
Suriname
Uruguay
Venezuela
ESTIMATED NEW HIV INFECTIONS

207Annex 1: HIV and AIDS estimates and data, 2009 and 2001 | 2010 GLOBAL REPORT
A1
HIV PREVALENCE (%) IN MOST-AT-RISK GROUPS IN CAPITAL CITY
estimate estimate[low – high estimate] [low – high estimate]
Orphans (0–17)
Year Year YearHIV (%) HIV (%) HIV (%)
Injecting drug users
Female sex workers
Men who have sex with menOrphans (0–17) currently living
20012009
ESTIMATED ORPHANS DUE TO AIDS
140 000 [110 000 – 180 000] 210 000 [160 000 – 260 000] … … … … … …
… … … … 2008 12.7 … … 2008 14.7
… … … … 2009 5.0 2009 0.9 2009 10.2
… … … … … … … … … …
140 000 [110 000 – 170 000] 100 000 [63 000 – 170 000] … … … … … …
… … … … … … … … 2009 25.6
… … … … … … … … … …
… … … … … … 2009 0.1 2009 0.7
… … … … … … 2008 4.8 2004 10.7
… … … … … … 2009 5.3 … …
… … … … … … 2009 4.9 2007 31.8
… … … … … … … … … …
240 000 [200 000 – 280 000] 190 000 [150 000 – 240 000] … … … … … …
… … … … 2008 11.9 2008 1.9 2008 11.8
… … … … … … … … … …
… … … … … … … … 2008 11.6
… … … … 2009 5.9 … … 2009 12.6
… … … … … … … … 2009 20.3
… … … … … … 2008 1.6 … …
… … … … … … … … 2009 12.7
… … … … … … … … … …
… … … … … … 2009 4.1 2009 9.8
… … … … … … 2006 1.0 2006 18.3
… … … … … … 2009 16.6 2009 19.4
… … … … … … 2006 2.3 2006 6.6
… … … … … … … … 2009 4.2
… … … … … … … … … …
… … … … … … 2008 1.8 2008 9.6
… … … … … … … … 2009 10.1
… … … … … … … … … …
… … … … … … … … 2008 9.1
… … … … … … … … … …
NORTH AMERICA
Canada
Mexico
United States of America
CARIBBEAN
Bahamas
Barbados
Cuba
Dominican Republic
Haiti
Jamaica
Trinidad and Tobago
CENTRAL AND SOUTH AMERICA
Argentina
Belize
Bolivia
Brazil
Chile
Colombia
Costa Rica
Ecuador
El Salvador
Guatemala
Guyana
Honduras
Nicaragua
Panama
Paraguay
Peru
Suriname
Uruguay
Venezuela

208 Annex 2: Country progress indicators and data, 2004 to 2010 | 2010 GLOBAL REPORT
All countries, regardless of their economic or epidemiological status, were requested to report on all indicators, where appropriate. Countries were expected to consider each indicator in light of the individual dynamics of their epidemic. When countries chose not to report on a particular indicator, they were asked to provide an explanation as to why they chose not to report. Th is allowed for an analysis that diff erentiates between an absence of data, the inapplicability of particular indicators to particular country situations, or the non-relevance of the particular issue, such as orphans and vulnerable children in low-prevalence settings.
RESPONSE RATES
In 2010, 182 countries (94% of UN Member States) submitted Country Progress Reports to UNAIDS. Th e proportion of Member States submitting such reports has increased consistently over each of the four rounds of reporting, as seen in fi gures 1 and 2. In the fi rst round of reporting slightly more than half (54%) of Member States reported, increasing to 64% in 2006 and 77% in 2008.
All but two regions have response rates above 90%. Th ere was a substantial increase in the numbers of reports received from Western and Central Europe, which resulted in an increase in the response rate for this region from 67% in 2008 to 88% in 2010. No change in response rate was observed in East Asia with three of the fi ve countries in the region submitting reports, as was the case in 2008.
Th e most remarkable increase in response rates was seen in North Africa and the Middle East, where the percentage of Member States submitting Country Progress Reports jumped from 45% in 2008 to 95% in 2010.
Monitoring progress in national responses to HIVIn adopting the 2001 Declaration of Commitment on HIV/AIDS, Member States of the United Nations agreed to systematically review and regularly report on their progress in realizing universal access to HIV prevention, treatment care and support by 2010. As part of that review process and on behalf of the United Nations Secretary-General, the United Nations Joint Programme on HIV/AIDS (UNAIDS) requests Member States to submit biennial reports to UNAIDS—the Country Progress Reports—against a set of standardized core indicators.
Th e information provided by Country Progress Reports represents the most comprehensive and readily accessible data on the status of the epidemic and progress being made by countries in the response. Th e primary purpose of this annex is to compile that data in one place, thus providing a transparent monitoring of progress towards the targets set in the Declaration of Commitment and the Millennium Development Goals. Th e data compiled allow a deeper understanding of the global, as well as regional and national responses to the epidemic.
INDICATORS
Core indicators for reporting have been consolidated and refi ned in each round of reporting since 2003, when the fi rst UNGASS Progress Report, Follow-up to the 2001 UNGASS: Progress Report on the Global Response to HIV/AIDS, was published. Th is ongoing work is done in collaboration with global partners and the UNAIDS Monitoring and Evaluation Reference Group (MERG), which sets the international standards for monitoring and evaluation. Details on how the indicators were constructed are available on the UNAIDS Web site in the document UNGASS Monitoring the Declaration of Commitment on HIV/AIDS: Guidelines on the Construction of Core Indicators (March 2009).
ANNEX 2 COUNTRY PROGRESS INDICATORS 2004 TO 2010

209
A2
Annex 2: Country progress indicators and data, 2004 to 2010 | 2010 GLOBAL REPORT
Figure A2.1
Response rates by region and reporting round*UNGASS Submissions by region (UN Member States reporting/total number of UN Member States)
* Includes all country progress reports submitted to UNAIDS, including late or incomplete submissions
% 10 20 30 40 50 60 70 80 90 100
Caribbean (13)
Central and South America (19)
Eastern Europe and Central Asia (12)
Sub- Saharan Africa (45)
South and South-East Asia (19)
East Asia (5)
Oceania (14)
Western and Central Europe (42)
North America (3)
North Africa and Middle East (20)
Global
2008 (153/192) 2010 (182/192)2004 (102/191) 2006 (143/192)

210 Annex 2: Country progress indicators and data, 2004 to 2010 | 2010 GLOBAL REPORT
Table A2.1 Countries that did not provide reports on the implementation of the Declaration of Commitment in 2010 (n=10)
Andorra Iceland San Marino
Democratic People’s Republic of Korea Iraq Turkmenistan
Republic of Korea Kiribati
France Liechtenstein

211
A2
Annex 2: Country progress indicators and data, 2004 to 2010 | 2010 GLOBAL REPORT
Table A2.2 Countries that provided reports on the implementation of the Declaration of Commitment in 2010 (n=182)
Afghanistan Djibouti Luxembourg Samoa
Albania Dominica Madagascar Sao Tome and Principe
Algeria Dominican Republic Malawi Saudi Arabia
Angola Ecuador Malaysia Senegal
Antigua and Barbuda Egypt Maldives Serbia
Argentina El Salvador Mali Seychelles
Armenia Equatorial Guinea Malta Sierra Leone
Australia Eritrea Marshall Islands Singapore
Austria Estonia Mauritania Slovakia
Azerbaijan Ethiopia Mauritius Slovenia
Bahamas Fiji Mexico Solomon Islands
Bahrain Finland Micronesia, Federated States of Somalia
Bangladesh Gabon Moldova South Africa
Barbados Gambia Monaco Spain
Belarus Georgia Mongolia Sri Lanka
Belgium Germany Montenegro Sudan
Belize Ghana Morocco Suriname
Benin Greece Mozambique Swaziland
Bhutan Grenada Myanmar Sweden
Bolivia Guatemala Namibia Switzerland
Bosnia and Herzegovina Guinea Nauru Syrian Arab Republic
Botswana Guinea-Bissau Nepal Tajikistan
Brazil Guyana Netherlands Thailand
Brunei Darussalam Haiti New Zealand The Former Yugoslav Republic of Macedonia
Bulgaria Honduras Nicaragua Timor-Leste
Burkina Faso Hungary Niger Togo
Burundi India Nigeria Tonga
Cambodia Indonesia Norway Trinidad and Tobago
Cameroon Iran, Islamic Republic of Oman Tunisia
Canada Ireland Pakistan Turkey
Cape Verde Israel Palau Tuvalu
Central African Republic Italy Panama Uganda
Chad Jamaica Papua New Guinea Ukraine
Chile Japan Paraguay United Arab Emirates
China Jordan Peru United Kingdom of Great Britain and Northern Ireland
Colombia Kazakhstan Philippines United Republic of Tanzania
Comoros Kenya Poland United States of America
Congo, Republic of the Kuwait Portugal Uruguay
Costa Rica Kyrgyzstan Qatar Uzbekistan
Côte d’Ivoire Lao People’s Democratic Republic Romania Vanuatu
Croatia Latvia Russian Federation Venezuela
Cuba Lebanon Rwanda Viet Nam
Cyprus Lesotho Saint Kitts and Nevis Yemen
Czech Republic Liberia Saint Lucia Zambia
Democratic Republic of the Congo Libyan Arab Jamahiriya Saint Vincent and the Grenadines Zimbabwe
Denmark Lithuania

212 Annex 2: Country progress indicators and data, 2004 to 2010 | 2010 GLOBAL REPORT
www.AIDSInfoOnline.org
To facilitate the use of AIDS-related data in countries and globally, UNAIDS has developed AIDSInfoOnline. AIDSInfoOnline is a data visualization and dissemination tool, based on the DevInfo project. It contains data from multiple agencies, including WHO, Measure DHS, UNAIDS and UNICEF. AIDSInfoOnline is populated with multisectoral HIV data, including AIDS spending, epidemiological estimates, country-reported programmatic data and National Composite Policy Index responses from government and civil society.
AIDSInfoOnline’s data visualization capabilities allow for rapid production of charts, maps and tables, along with export of data and graphics to numerous formats for presentation and analysis. AIDSInfoOnline allows comparison of similar indicators from multiple sources. It is provided free of charge and installable on a PC or as a web-based service.
Under development for AIDSInfoOnline are e-learning materials to familiarize users with the tool and its advanced features, continued sourcing of relevant and complementary data into the database and assistance and guidance to regional and national entities that want to establish HIV/AIDS data hubs.
AIDSInfoOnline aims to be the leading source of HIV/AIDS data globally and provide its users with the most innovative, interactive exploration of that data.

213
A2
Annex 2: Country progress indicators and data, 2004 to 2010 | 2010 GLOBAL REPORT
DATA VALIDATION
A comprehensive review of the national Reports was conducted by evaluation specialists at UNAIDS to ensure the completeness, accuracy and harmonization of data in relation to the core indicators. UNAIDS contacted 150 countries with follow-up data questions. Th e majority of issues regarding reported data were resolved through these communications. Data issues that were not resolved as of the publication date were not included in the data analyses summarized in this report.
In addition, a reconciliation process took place for data reported to UNAIDS, the Global Fund to Fight AIDS, Tuberculosis and Malaria, UNICEF, the US President’s Emergency Plan for AIDS Relief, WHO and Measure DHS (data collected through the Demographic and Health Survey programme). As a result of discrepancies identifi ed in this reconciliation, direct communications were undertaken with national focal points for UNGASS reporting in 113 countries to obtain clarifi cation and resolution of outstanding questions. Over 85% of these 113 countries responded with clarifying information.
Due to their complex nature, separate validation processes were undertaken for the National AIDS Spending Matrix and the National Composite Policy Index, a questionnaire that assesses progress in the development of national HIV policies and strategies. A comprehensive data review was undertaken at UNAIDS to check the completeness and accuracy of the funding matrices submitted. One hundred and eleven countries were contacted with follow-up data questions, the majority of which were resolved through these communications. Th e Policy Index reports were checked for internal consistency and completeness of the response. Confusing or illogical values were corrected; countries were contacted in cases of substantial missing data and multiple, non-consolidated Policy Index submissions. To resolve data issues relating to the Policy Index, 67 countries were contacted, the majority of countries responded.
NATIONAL COMPOSITE POLICY INDEX (NCPI)
Th e National Composite Policy Index, (NCPI), is a questionnaire completed through a review of relevant
documents and interviewing people most knowledgeable about the topics covered. One part1 of the NCPI is completed by government offi cials, while another part2 is completed by representatives from civil society and bilateral or multilateral organizations. Th e recommended consultative process for completing the NCPI aims to foster an environment conducive to including both government and nongovernment perspectives in the consolidated NCPI response that is eventually submitted by the government as part of its UNGASS report. It is strongly recommended that a fi nal workshop is organized with key stakeholders, including representatives from networks of people living with HIV and from populations at higher risk of HIV and other vulnerable populations, to present, discuss and validate the NCPI responses and write-up before the fi nal submission. In general, NCPI responses provided by the government are oft en more optimistic than those provided by nongovernment respondents.
As there are over 200 data points for each country NCPI, not all data are included in the data tables presented in this report, but are available alongside individual country reports on the UNAIDS website and on AIDSInfoOnline.org. Validated data from 171 UN member states were included in the analyses summarized in this report.
CHALLENGES IN MONITORING KEY POPULATIONS AT RISK
Ensuring country-level representative samples and establishing a global information system regarding programme coverage and risk behaviours for key populations at higher risk for HIV3 present signifi cant technical and ethical challenges. Methods are being developed to improve sampling of these oft en hard-to-reach populations, such as respondent-driven sampling. While new methods may lead to samples that are more representative, it is recognized that obtaining a truly representative national sample may never be feasible. However, even though countries may not be able to attest to the national representativeness of samples used for surveys of key populations at higher risk for HIV, repeated measures using the same sampling frame and methodology can produce reliable data on trends in behaviours and service coverage.
1 Government offi cials complete questions on the national strategic plan, political support, and key policies and strategies of HIV programmes.2 Nongovernment representatives complete questions on the country’s human rights context in relation to HIV; civil society involvement in the HIV
response; and key policies and strategies of HIV programmes.3 These groups were previously referred to as most-at-risk populations.

214 Annex 2: Country progress indicators and data, 2004 to 2010 | 2010 GLOBAL REPORT
Th e data from behavioural surveillance surveys (BSS), which are oft en obtained from urban convenience samples in programme catchment areas, are likely to produce a bias when measuring service coverage and risk behaviours. In order to enable the monitoring of trends countries were advised to keep theses biases constant by using a consistent methodology and sampling frame. In order to better understand potential biases and accurately interpret the data obtained in these surveys countries were encouraged to report data for these indicators that had been reviewed and endorsed by technical experts within the country, such as monitoring and evaluation technical working groups or national research councils.
During the global data analysis, a number of methodological diff erences among countries were observed in the approach for data collection on key populations at risk. Th ese diff erences mostly relate to group defi nitions, measurement tools and time periods applied for the data collection. All recognized diff erences are systematically presented in the footnotes provided in the tables.
On a country level, it is important to interpret these indicator data alongside the country-reported NCPI, which provides an overview of the policy environment and programmatic response regarding key populations at risk in a given country, from the perspective of both the government and nongovernmental groups and civil society.
NATIONAL CONSULTATION
While they are perhaps most pronounced in monitoring the behaviours and service coverage of key populations at risk of HIV, methodological challenges aff ect any eff orts to obtain national estimates of behaviours and services. It is therefore important to assess potential biases and other weaknesses of all available data in order to obtain the most robust assessment possible of the status of the national response.
Countries are strongly encouraged to undertake a consultation process with all relevant stakeholders to review and consolidate national-level data. Th e purpose of this consultation is to collectively assess the strengths and weaknesses of these data, and to obtain consensus on the interpretation of these data. Such discussions allow for a better understanding of national responses, and contribute to a strengthening of multisectoral responses.
Th e vast majority of Country Progress Reports received provided information about the consultation process that was used for the validation and interpretation of the data reported. Th ese reports are available in full and unaltered on the UNAIDS website at www.unaids.org.
COUNTRY DATA TABLES
Th e following tables present data submitted to UNAIDS in Country Progress Reports, as a part of the monitoring of progress towards the Declaration of Commitment. Where indicators and methods were consistent across reporting years, all available data from previous years are provided in order to allow the reader to examine changes over time. Where possible the year that the data were collected was diff erentiated from the year of reporting. Th e percentages and numbers in the tables are rounded to the nearest whole number. Some of the Country Progress Report data were still under review with countries at the time of production of this reference report. Where this is the case, it has been explicitly footnoted in the Indicator Data Tables.
Countries may not have submitted data for a given indicator because either (1) no data were available with which to construct the indicator according to the UNGASS defi nition, (2) the country uses an alternate methodology or indicator for tracking this particular issue, or (3) the country chose not to report on the indicator because it was considered not relevant to the county’s epidemic. In some instances an alternative source was used to provide values when a country submission was not received for that indicator. An example of this is the blood safety indicator, where supplementary values were provided by the World Health Organization (Department of Blood Transfusion Safety). Where no data were reported for a given indicator, and no data for that country are available from another comparable source, that country has been excluded from the relevant data table.
Values printed in the tables are those endorsed by countries. In some instances these values diff er from those originally submitted as a result of the reconciliation process. As such, some values in these data tables may diff er from those published in individual Country Progress Reports.
In addition to data reported by countries, values for these countries from the most recent Demographic and Health Survey or Multiple Indicator Cluster survey are provided. In the absence of confi dence intervals and detailed

215
A2
Annex 2: Country progress indicators and data, 2004 to 2010 | 2010 GLOBAL REPORT
methodological notes with which to interpret original country submissions, these values allow for some very simple data triangulation. However, in many instances the DHS or Multiple Indicator Cluster Survey was used as the source of country reporting, which should not be misinterpreted as a convergence of values from diff erent sources rather than a repetition of the same data.
MONITORING PROGRESS TOWARDS MILLENNIUM DEVELOPMENT GOAL 6
Progress towards Millennium Development Goal (MDG) 6, “to halt and begin to reverse the HIV epidemic”, is monitored using data contained in Country Progress Report submissions received from Member States of the United Nations. Th ese reports include data on 25 standardized core indicators for use in monitoring progress towards the Declaration of Commitment made in the 2001 United Nations General Assembly Special Session on HIV/AIDS (UNGASS).
Th is report describes and presents individual country data for the 25 UNGASS indicators. fi ve of which are also explicitly included in the core set of indicators used for monitoring progress towards MDG 6 and are available in the MDG database at www.mdgs.un.org. Data for these fi ve indicators are sourced from Country Progress Reports and provided to the United Nations Statistics Division by UNAIDS, UNICEF and WHO. Table A2.3 shows the response rates for these indicators over the four rounds of UNGASS reporting.
Table A2.3 Response rates for the indicators for monitoring progress towards Millennium Development Goal 6: to halt and begin to reverse the HIV epidemic
2004 2006 2008 2010
ANTIRETROVIRAL THERAPY
Number of responding
countries
113 118 117 154
Response rate 60% 61% 61% 80%
ORPHANS’ SCHOOL
ATTENDANCE
Number of responding
countries
N/A N/A 50 46
Response rate N/A N/A 26% 24%
YOUNG PEOPLES’
KNOWLEDGE
Number of responding
countries
38 16 110 119
Response rate 20% 8% 57% 62%
CONDOM USE Number of responding
countries
34 20 91 106
Response rate 18% 10% 47% 55%
PREVALENCE Number of responding
countries
N/A N/A 91 106
Response rate N/A N/A 47% 55%

216 Annex 2: Country progress indicators and data, 2004 to 2010 | 2010 GLOBAL REPORT
National commitment indicators
AIDS SPENDING
As the national and international response to AIDS continues to scale up, it is increasingly important to accurately track in detail both where the funds originate and how they are spent at the national level. Th e data are used to measure national commitment and action, which is an important component of the UNGASS Declaration of Commitment on HIV/AIDS. When aggregated across multiple countries, the data help to evaluate the status of the response globally. In addition, the data help national-level decision-makers monitor the scope and eff ectiveness of their programmes, and provide the basis for resource allocation and improved strategic planning processes.
Since diff erent countries can choose from among diff erent methodologies and tools to monitor the fl ow of AIDS funding (e.g. National AIDS Spending Assessments (NASA), AIDS sub-account of the National Health Accounts (NHA) and ad hoc Resource Flows Surveys), the National AIDS Spending Matrix includes a spreadsheet that allows fi nancial data from any of these three methodologies to be easily entered, reviewed and reported. While NASA provide information on expenditures on activities performed outside the health system, methods have been developed to allow comparison between NASA and NHA for AIDS health expenditures. Both tools can therefore track AIDS-health expenditures. A similar alignment process was undertaken for the UNFPA/UNAIDS/Netherlands Interdisciplinary Demographic Institute Resource Flows Project.
Defi nitionDomestic and international AIDS spending by categories and fi nancing sources
MethodologyTh is indicator is measured using a National AIDS Spending Assessment, which documents actual expenditures classifi ed by eight AIDS spending categories and by three main sources of fi nancing, including public expenditure from its own sources (i.e. such government revenues as taxes) and from international sources.
Spending categories 1. Prevention.2. Care and treatment. 3. Orphans and vulnerable children.
4. Programme management and administration strengthening.
5. Incentives for human resources. 6. Social protection and social services (excluding orphans
and vulnerable children). 7. Enabling environment and community development.8. Research (excluding operations research included under
programme management).
Financing sources 1. Domestic public. 2. International. 3. Domestic private (optional for UNGASS reporting).
Table A2.4Response rates for AIDS spending
2004 2006 2008 2010
AIDS SPENDING Number of responding
countries
N/A 95 106 137
Response rate N/A 50% 55% 71%
In 2010, 137 countries (71% of UN Member States) reported on domestic and international AIDS spending. Response rates for this indicator increased consistently over each round of reporting: 95 countries reported in 2006, 106 in 2008 and 137 in 2010. Eastern Europe and Central Asia, Central and South America, South and South East Asia and sub-Saharan Africa are the regions with the highest response rate, with more than 80% of the countries on these regions reporting on HIV spending. Not all countries reported a complete spending matrix. Some countries reported only total spending (11%) hence spending fi gures were not disaggregated among the eight AIDS spending categories (Prevention, Treatment and care, OVC, etc.). Out of the 122 countries that did report on spending using the AIDS Spending Categories, 112 countries reported spending on some or all of the sub categories of the eight AIDS Spending Categories such as: Antiretroviral therapy, Home-based care, Prevention of mother-to-child transmission or Blood safety among others.

217
A2
Annex 2: Country progress indicators and data, 2004 to 2010 | 2010 GLOBAL REPORT
GOVERNMENT HIV AND AIDS POLICIES—NATIONAL COMPOSITE POLICY INDEX
Purpose To assess progress in the development and implementation of national-level HIV policies, strategies and laws.
Th e NCPI is an extensive questionnaire with close to 200 questions. It is the most comprehensive standardized questionnaire available to asses the following broad areas of policy, strategy and programme implementation for the HIV response:
Part A—completed by government respondents1. Strategic plan2. Political support 3. Prevention4. Treatment, care and support5. Monitoring and evaluation
Part B—completed by civil society respondents1. Human rights2. Civil society involvement3. Prevention4. Care and support
Although the NCPI is oft en referred to as an ‘indicator’ or index, it is not used in that sense. Th e NCPI provides a unique opportunity for the variety of stakeholders to take stock of progress made and to discuss what still needs to be done to support an eff ective and effi cient HIV response. Many of the Country Progress reports received in 2010 describe the role the NCPI has had in strengthening in-country collaboration and increasing shared ownership of the HIV response.
Th e NCPI is an integral part of the UNGASS set of indicators and has been so since the fi rst reporting round. Some of the questions have been the same since 2004 and the majority of the questions are similar in this reporting round to what they were in 2006 and 2008. Th is makes it possible to do trend analyses.
Many of the standardized responses are complemented with open text boxes. Th ese text boxes facilitate a better understanding of the current country situation, provide examples of good practice for others to learn from and can pinpoint issues for further improvement.
Out of the 182 countries that submitted UNGASS reports, 171 countries (94%) also submitted the NCPI. Th is is an inspiring increase (in 2004 only 88 countries submitted NCPI reports). All countries except one submitted both part A and part B in this year’s round of reporting. Representatives from around 2000 organizations, the majority being civil society organizations, took part in the preparation of the reports.
Table A2.5Response rates for the National Composite Policy Index
2004 2006 2008 2010
NATIONAL COMPOSITE
POLICY INDEX
Number of responding
countries
88 95 137 171
Response rate 47% 50% 71% 89%
Full NCPI reports including the answers from both the standardized responses and the text boxes are found next to the individual country reports on the UNAIDS web site. A small subset of the information available is presented in the following tables. Full access to NCPI data is available through www.AIDSInfoOnline.org.
Indicators for health sector interventions
BLOOD SAFETY
HIV is effi ciently transmitted via transfusion of unsafe blood and blood products. Th e establishment of systems to ensure that all donated blood is screened for transfusion-transmissible infections, including HIV (and also hepatitis B and C) is a core component of every national blood programme. Globally, however, there are signifi cant variations in the extent to which donated blood is screened, the screening strategies adopted and the overall quality and eff ectiveness of the blood screening process. As a result, in many countries the recipients of blood and blood products remain at unacceptable risk of acquiring life-threatening infections that could easily be prevented.
PurposeTo assess progress in ensuring a safe blood supply. Th e indicator applies to all countries and it is measured

218 Annex 2: Country progress indicators and data, 2004 to 2010 | 2010 GLOBAL REPORT
annually using the WHO Global Database on Blood Safety protocol.
Defi nitionTh e percentage of donated blood units screened for HIV in a quality-assured manner.
Numerator: number of donated blood units screened for HIV in blood centres/blood screening laboratories that have both: (1) followed documented standard operating procedures and (2) participated in an external quality assurance scheme.
Denominator: total number of blood units donated.
Table A2.6Response rates for blood safety
2004 2006 2008 2010
BLOOD SAFETY Number of responding
countries
N/A N/A 130 165
Response rate N/A N/A 68% 86%
ANTIRETROVIRAL THERAPY
PurposeTo assess the progress of countries in providing antiretroviral combination therapy to adults and children with advanced HIV infection. Th e indicator is applicable to all countries and data for the numerator is collected continuously (monthly or quarterly) with the denominator estimated.
Defi nitionPercentage of adults and children with advanced HIV infection receiving antiretroviral therapy.
Numerator: number of adults and children with advanced HIV infection who are currently receiving antiretroviral therapy in accordance with the nationally approved treatment protocol (or WHO/UNAIDS standards) at the end of the reporting period.
Denominator: estimated number of adults and children with advanced HIV infection.
All analyses of this indicator refl ect numerators which were reconciled between UNAIDS, WHO and UNICEF. To ensure comparability between countries, denominators estimated using the UNAIDS/WHO Reference group on Estimates, Modelling and Projections methodology were used for all analyses. Th e country-reported denominators are also presented in the data table.
Table A2.7Response rates for HIV treatment
2004 2006 2008 2010
HIV TREATMENT Number of responding
countries
113 118 117 154
Response rate 60% 61% 61% 80%
RETENTION ON ANTIRETROVIRAL THERAPY AFTER 12 MONTHS
Th e goals of any programme of antiretroviral therapy (ART) are to increase survival and quality of life among infected individuals. As ART is scaled up in countries around the world, it is also important to understand why and how many people drop out of treatment programmes. Th ese data can be used to demonstrate the eff ectiveness of those programmes and highlight obstacles to expanding and improving them.
Purpose To assess progress in retaining infected adults and children on ART.
Defi nitionPercentage of adults and children with HIV known to be on treatment 12 months aft er initiation of antiretroviral therapy.
Numerator: number of adults and children who are on ART at 12 months aft er initiating treatment.
Denominator: total number of adults and children who initiated ART who were expected to achieve 12-month outcomes within the reporting period, including those who have died since starting ART, those who have stopped ART and those recorded as lost to follow-up at month 12.

219
A2
Annex 2: Country progress indicators and data, 2004 to 2010 | 2010 GLOBAL REPORT
Th is indicator refl ects retention rates on ART, rather than survival rates. To determine survival rates individuals who stopped ART or were lost to follow-up would need to be excluded. In cases where it is known that a reported data value is not consistent with this defi nition, this has been footnoted in the data tables.
Table A2.8Response rates for survival (retention) on antiretroviral therapy
2004 2006 2008 2010
SURVIVAL ON ANTIRETROVIRAL
THERAPY
Number of responding
countries
N/A 11 106 143
Response rate N/A 6% 55% 74%
PREVENTION OF MOTHER-TO-CHILD TRANSMISSION
In the absence of any preventive interventions, infants born to and breastfed by HIV-infected women have roughly a one-in-three chance of acquiring infection themselves. Th is can happen during pregnancy, during labour and delivery or aft er delivery through breastfeeding. Comprehensive programmes to reduce the number of children who become infected with HIV utilize four strategies, known as the “four prongs” for the prevention of mother-to-child transmission. Th ese are: primary prevention of HIV for women of child bearing age; prevention of unwanted pregnancies for women living with HIV; antiretroviral prophylaxis for the mother; and antiretroviral prophylaxis for the child. Th e risk of mother-to-child transmission can be further reduced through the implementation of safe delivery practices and safe breastfeeding. Th is indicator measures one of the four prongs—the provision of prophylactic antiretroviral therapy to the mother.
Purpose To assess progress in preventing vertical transmission of HIV.
Defi nitionPercentage of HIV-infected pregnant women who received antiretrovirals to reduce the risk of mother-to-child transmission.
Numerator: number of HIV-infected pregnant women who received antiretrovirals during the last 12 months to reduce mother-to-child transmission.
Denominator: estimated number of HIV-infected pregnant women in the last 12 months.
All analyses of this indicator refl ect numerators which were reconciled between UNAIDS, WHO and UNICEF. To ensure comparability between countries, denominators estimated using the UNAIDS/WHO Reference group on Estimates, Modelling and Projections methodology were used for all analyses. Th e country-reported denominators are also presented in the data table.
For data representing 2007, some countries did not report data refl ecting 12 months and in these instances the data were projected in order to refl ect a consistent time period.4
Table A2.9Response rates for prevention of mother to child transmission
2004 2006 2008 2010
PREVENTION OF MOTHER
TO CHILD TRANSMISSION
Number of responding
countries
52 45 100 135
Response rate 28% 24% 52% 70%
Th e data tables include additional data on the prevention of mother-to-child transmission provided by the World Health Organization. Th ese data were gathered through the joint WHO/UNICEF/UNAIDS monitoring of progress towards Universal Access in the Health Sector.
CO-MANAGEMENT OF TUBERCULOSIS AND HIV
Tuberculosis (TB) is one of the most common causes of morbidity and mortality in people living with HIV, including those on antiretroviral therapy. Intensifi ed TB case-fi nding and access to quality diagnosis and treatment of TB in accordance with international/national guidelines are essential for improving the quality and quantity of life for people living with HIV.
4 Method for projection – all values reported that represent less than 12 month period are projected taking the number of HIV positive pregnant women on antiretrovirals per month and dividing by the number of months the data represents and multiplying by 12 months.

220 Annex 2: Country progress indicators and data, 2004 to 2010 | 2010 GLOBAL REPORT
Purpose To assess progress in detecting and treating TB in people living with HIV.
Defi nitionPercentage of estimated HIV-positive incident TB cases that received treatment for TB and HIV.
Numerator: number of adults with advanced HIV infection who are currently receiving antiretroviral combination therapy in accordance with the nationally approved treatment protocol (or WHO/UNAIDS standards) and who were started on TB treatment (in accordance with national TB programme guidelines) within the reporting year.
Denominator: estimated number of incident TB cases in people living with HIV.
Table A2.10Response rates for co-management of tuberculosis and HIV
2004 2006 2008 2010
CO-MANAGE-MENT OF
TUBERCULOSIS AND HIV
Number of responding
countries
N/A N/A 88 119
Response rate N/A N/A 46% 62%
General population indicatorsSUPPORT FOR CHILDREN AFFECTED BY HIV AND AIDS
Care and support for orphaned children comes from families and communities. As the number of orphaned and vulnerable children continues to grow, those supporting families and communities themselves require support.
Purpose To assess progress in providing support to households that are caring for orphaned and vulnerable children aged 0–17.
Defi nitionPercentage of orphaned and vulnerable children aged 0–17 whose households received free basic external support in caring for the child.
Numerator: number of orphaned and vulnerable children who live in households that received at least one of four types of support for each child.
Denominator: total number of orphaned and vulnerable children aged 0–17.
For the purposes of this indicator an orphan is defi ned as a child below the age of 18 who has lost one or both parents.
A child made vulnerable by HIV is below the age of 18, and:
(i), has lost one or both parents; or(ii), has a chronically ill parent (regardless of whether the
parent lives in the same household as the child); or(iii), lives in a household where, in the last 12 months, at
least one adult died and was sick for three of the four months before he or she died; or
(iv), lives in a household where at least one adult was seriously ill for at least three of the past 12 months.
A number of countries chose to report on this indicator using data obtained through HIV testing programmes. Th ese data are not comparable to data obtained through general population-based surveys.
Table A2.11Response rates for support for children affected by HIV and AIDS
2004 2006 2008 2010
SUPPORT FOR CHILDREN
AFFECTED BY HIV AND AIDS
Number of responding
countries
N/A 8 36 42
Response rate N/A 4% 19% 22%
ORPHANS SCHOOL ATTENDANCE
AIDS claims young adults just at the time in their lives when they are forming families and bringing up children. As a result, orphan prevalence is rising steadily in many countries, while fewer relatives within the prime adult ages mean that orphaned children face an increasingly uncertain future. Orphanhood is frequently accompanied by prejudice and increased poverty, factors that can further jeopardize children’s chances of completing school education and may lead to the adoption of

221
A2
Annex 2: Country progress indicators and data, 2004 to 2010 | 2010 GLOBAL REPORT
survival strategies that increase vulnerability to HIV. It is important therefore to monitor the extent to which AIDS support programmes succeed in securing the educational opportunities of orphaned children.
Purpose To assess progress towards preventing relative disadvantage in school attendance among orphans compared to non-orphans.
Defi nitionCurrent school attendance among orphans and non-orphans aged 10–14.
Part A: Current school attendance of orphans aged 10–14 Numerator: number of children who have lost
both parents and who attend school. Denominator: number of children who have lost
both parents.
Part B: Current school attendance of children aged 10–14 both of whose parents are alive and who live with at least one parent.
Numerator: number of children whose two parents are alive who are living with at least one parent and who attend school.
Denominator: number of children whose two parents are alive who are living with at least one parent.
Table A2.12Response rates for orphans’ school attendance
2004 2006 2008 2010
ORPHANS’ SCHOOL
ATTENDANCE
Number of responding
countries
N/A N/A 50 46
Response rate N/A N/A 26% 24%
LIFE SKILLS-BASED HIV EDUCATION IN SCHOOLS
Life skills-based education uses participatory exercises to teach behaviours to young people that help them deal with the challenges and demands of everyday life. Such education can include decision-making and problem-solving skills, creative and critical thinking, self-awareness,
communication and interpersonal relations. It can also teach young people how to cope with their emotions and causes of stress. When adapted specifi cally for HIV education in schools, a life skills-based approach helps young people understand and assess the individual, social and environmental factors that raise and lower the risk of HIV transmission. When properly implemented, it can have a positive eff ect on behaviours, including delay in sexual debut and reduction in number of sexual partners.
Purpose To assess progress towards implementation of life skills-based HIV education in all schools.
Defi nition Percentage of schools that provided life skills-based HIV education in the last academic year.
Numerator: number of schools that provided life skills-based HIV education in the last academic year.
Denominator: number of schools surveyed.
Table A2.13Response rates for life skills-based HIV education in schools
2004 2006 2008 2010
LIFE SKILLS-BASED HIV
EDUCATION IN SCHOOLS
Number of responding
countries
N/A N/A 74 99
Response rate N/A N/A 39% 52%
YOUNG PEOPLE’S KNOWLEDGE ABOUT HIV PREVENTION
HIV epidemics are sustained primarily through sexual transmission of infection to successive generations of young people. Sound knowledge about HIV and AIDS is an essential prerequisite—albeit insuffi cient in itself—for adoption of behaviours that reduce the risk of HIV transmission.
Purpose To assess progress towards comprehensive knowledge of the essential facts about HIV transmission.

222 Annex 2: Country progress indicators and data, 2004 to 2010 | 2010 GLOBAL REPORT
Defi nitionPercentage of young people aged 15–24 who both correctly identify ways of preventing the sexual transmission of HIV and reject major misconceptions about HIV transmission.
Numerator: number of respondents aged 15–24 years who gave the correct answer to all fi ve of the following questions: 1. Can the risk of HIV transmission be reduced by having
sex with only one uninfected partner who has no other partners?
2. Can a person reduce the risk of getting HIV by using a condom every time they have sex?
3. Can a healthy-looking person have HIV? 4. Can a person get HIV from mosquito bites?5. Can a person get HIV by sharing food with someone
who is infected?
Denominator: number of all respondents aged 15–24.
Table A2.14Response rates for young peoples’ knowledge
2004 2006 2008 2010
YOUNG PEOPLES’
KNOWLEDGE
Number of responding
countries
38 16 110 119
Response rate 20% 8% 57% 62%
HIV TESTING IN THE GENERAL POPULATION
HI V testing and counselling is a critical element in the HIV response, as it facilitates HIV treatment and care and other prevention. In addition, testing increases the awareness of people living with HIV of their own status and encourages them to take protective measures. Finally, HIV testing increases social awareness of HIV and can reduce stigma and discrimination towards people living with HIV. Trends in the uptake of HIV testing and counselling can be assessed based on the results of successive surveys conducted in the same country over time. It should be noted that while this indicator measures the proportion of the general population who have been tested in a 12 month period, this should not be taken to imply that all people should be tested annually. Th e frequency with which people should be tested should be
determined based on their individual behaviour patterns and the nature of the HIV epidemic in their country.
Purpose To assess progress in implementing HIV testing and counselling.
Defi nitionPercentage of women and men aged 15–49 who received an HIV test in the last 12 months and who know their results.
Numerator: number of respondents aged 15–49 who have been tested for HIV during the last 12 months and who know their results.
Denominator: number of all respondents aged 15–49.
A number of countries chose to report on this indicator using data obtained through HIV testing programmes. Th ese data are not comparable to data obtained through general population-based surveys and are footnoted in the data table.
Table A2.15Response rates for HIV testing in the general population
2004 2006 2008 2010
HIV TESTING IN THE GENERAL POPULATION
Number of responding
countries
N/A N/A 102 116
Response rate N/A N/A 53% 60%
SEX BEFORE THE AGE OF 15
A HIV prevention strategy adopted by many countries is to delay the age at which young people fi rst have sex and discourage premarital sexual activity because it reduces their potential exposure to HIV. Th ere is also evidence to suggest that fi rst having sex at a later age reduces susceptibility to infection per act of sex, at least for women.
Purpose To assess progress in increasing the age at which young women and men aged 15–24 fi rst have sex.
Defi nitionPercentage of young women and men aged 15–24 who have had sexual intercourse before the age of 15.

223
A2
Annex 2: Country progress indicators and data, 2004 to 2010 | 2010 GLOBAL REPORT
Numerator: number of respondents aged 15–24 who report the age at which they fi rst had sexual intercourse as under 15 years.
Denominator: number of all respondents aged 15–24.
Table A2.16Response rates for sex before the age of 15
2004 2006 2008 2010
SEX BEFORE THE AGE OF 15
Number of responding
countries
N/A 23 108 117
Response rate N/A 12% 56% 61%
HIGHER-RISK SEX
Th e spread of HIV is, for the most part, a function of unprotected sex. Individuals who have multiple partners (concurrently or sequentially) have a higher risk of HIV transmission than individuals that do not link into a wider sexual network.
Purpose To assess progress in reducing the percentage of people who have higher-risk sex.
Defi nitionPercentage of women and men aged 15–49 who have had sexual intercourse with more than one partner in the last 12 months.
Numerator: number of respondents aged 15–49 who have had sexual intercourse with more than one partner in the last 12 months .
Denominator: number of all respondents aged 15–49.
Table A2.17Response rates for higher-risk sex
2004 2006 2008 2010
HIGHER-RISK SEX Number of responding
countries
12 19 97 108
Response rate 6% 10% 51% 56%
CONDOM USE DURING HIGHER-RISK SEX
Condom use is eff ective in protecting against HIV and other infections transmitted through sexual intercourse. Condom use rates are an important measure of protection against HIV, especially among people with multiple sexual partners.
Purpose To assess progress towards preventing exposure to HIV through unprotected sex with non-regular partners.
Defi nitionPercentage of women and men aged 15–49 who had more than one partner in the past 12 months who used a condom during their last sexual intercourse.
Numerator: number of respondents aged 15–49 who reported having had more than one sexual partner in the last 12 months who also reported that a condom was used the last time they had sex.
Denominator: number of respondents aged 15–49 who reported having had more than one sexual partner in the last 12 months.
Table A2.18Response rates for condom use during higher-risk sex
2004 2006 2008 2010
CONDOM USE DURING HIGHER-
RISK SEX
Number of responding
countries
34 20 91 106
Response rate 18% 10% 47% 55%

224 Annex 2: Country progress indicators and data, 2004 to 2010 | 2010 GLOBAL REPORT
Indicators for key populations at higher risk of HIV
KNOWLEDGE ABOUT HIV PREVENTION AMONG KEY POPULATIONS AT RISK
Concentrated epidemics are sustained by sexual transmission of HIV in paid sex and between men who have sex with men or transmission through the use of contaminated injecting equipment. Accurate information about HIV and AIDS is an essential prerequisite if people are going to adopt behaviours that reduce their risk of infection. Th is indicator should be calculated separately for each population that is considered to be at higher risk of HIV: sex workers, injecting drug users and men who have sex with men.
Purpose To assess progress in building knowledge of the essential facts about HIV transmission among key populations at risk.
Defi nitionPercentage of key populations at risk who both correctly identify ways of preventing the sexual transmission of HIV and reject major misconceptions about HIV transmission.
Numerator: number of respondents from populations at higher risk of HIV who gave the correct answer to all fi ve of the following questions.
1. Can the risk of HIV transmission be reduced by having sex with only one uninfected partner who has no other partners?
2. Can a person reduce the risk of getting HIV by using a condom every time they have sex?
3. Can a healthy-looking person have HIV? 4. Can a person get HIV from mosquito bites?5. Can a person get HIV by sharing food with someone
who is infected?
Denominator: number of respondents from populations at higher risk of HIV who gave answers, including “don’t know”, to all fi ve questions.
Table A2.19Response rates for knowledge of key populations at risk
2004 2006 2008 2010
SEX WORKERS Number of responding
countries
N/A 21 67 84
Response rate N/A 11% 35% 44%
MEN WHO HAVE SEX WITH MEN
Number of responding
countries
N/A 16 47 54
Response rate N/A 8% 24% 28%
INJECTING DRUG USERS
Number of responding
countries
N/A 16 33 43
Response rate N/A 8% 17% 22%
HIV TESTING IN KEY POPULATIONS AT HIGHER RISK OF HIV
HIV testing and counselling is a critical element in the HIV response, as it facilitates HIV treatment and care and prevention activities. In addition, testing increases the awareness of people living with HIV of their own status and encourages them to take protective measures. Finally, HIV testing increases social awareness of HIV and can reduce stigma and discrimination towards people living with HIV. Trends in the uptake of HIV testing and counselling can be assessed based on the results of successive surveys conducted in the same country over time. Th e frequency with which people should be tested should be determined based on their individual behaviour patterns and the nature of the HIV epidemic in their country. In some epidemiological contexts it may be appropriate for members of key populations at higher risk of HIV to be tested annually. It should be noted that HIV testing should be voluntary and confi dential, and that due care should be taken to protect the rights of those tested. Th is is particularly important in contexts where the behaviours of key populations at risk of HIV are illegal or heavily stigmatized and where any breeches of confi dentiality can have serious legal and social ramifi cations.
Purpose To assess progress in implementing HIV testing and counselling among key populations at risk.

225
A2
Annex 2: Country progress indicators and data, 2004 to 2010 | 2010 GLOBAL REPORT
Defi nitionPercentage of respondents from key populations at risk who received an HIV test in the last 12 months and who know their results.
Numerator: number of respondents from key populations at risk who have been tested for HIV during the last 12 months and who know the results.
Denominator: number of respondents from key populations at risk included in the sample.
Table A2.20Response rates for HIV testing in key populations at risk
2004 2006 2008 2010
SEX WORKERS Number of responding
countries
N/A 21 87 96
Response rate N/A 11% 45% 50%
MEN WHO HAVE SEX WITH MEN
Number of responding
countries
N/A 22 70 83
Response rate N/A 12% 36% 43%
INJECTING DRUG USERS
Number of responding
countries
N/A 18 44 59
Response rate N/A 9% 23% 31%
PREVENTION PROGRAMME COVERAGE FOR KEY POPULATIONS AT HIGHER RISK OF HIV
Key populations at risk are oft en diffi cult to reach with HIV prevention programmes. However, in order to prevent the spread of HIV among these populations as well as into the general population, it is important that they access these services. Th is indicator should be calculated separately for each population that is considered to be at higher risk of HIV: sex workers, injecting drug users and men who have sex with men.
PurposeTo assess progress in implementing HIV prevention programmes for key populations at risk.
Defi nitionPercentage of key populations at risk reached with HIV prevention programmes.
Numerator: number of respondents from key populations at risk who replied “yes” to both (all three for injecting drug users) of the following questions:
Do you know where you can go if you wish to receive an HIV test?
In the last twelve months, have you been given condoms?
(for injecting drug users) In the last twelve months, have you been given sterile needles and syringes?
Denominator: total number of respondents from key populations at risk surveyed.
Table A2.21Response rates for HIV prevention programmes for key populations at risk
2004 2006 2008 2010
SEX WORKERS Number of responding
countries
N/A 27 63 74
Response rate N/A 14% 33% 39%
MEN WHO HAVE SEX WITH MEN
Number of responding
countries
N/A 18 43 53
Response rate N/A 9% 22% 28%
INJECTING DRUG USERS
Number of responding
countries
N/A 22 30 39
Response rate N/A 12% 16% 20%
CONDOM USE BY SEX WORKERS
Various factors increase the risk of exposure to HIV among sex workers, including multiple, non-regular partners and more frequent sexual intercourse. However, sex workers can substantially reduce the risk of HIV transmission, both from clients and to clients, as well as to regular partners, through consistent and correct condom use.
Purpose To assess progress in preventing exposure to HIV among sex workers through unprotected sex with clients.

226 Annex 2: Country progress indicators and data, 2004 to 2010 | 2010 GLOBAL REPORT
Defi nitionPercentage of female and male sex workers reporting the use of a condom with their most recent client.
Numerator: number of respondents who reported that a condom was used with their last client in the last 12 months.
Denominator: number of respondents who reported having commercial sex in the last 12 months.
Table A2.22Response rates for condom use by sex workers
2004 2006 2008 2010
CONDOM USE BY SEX WORKERS
Number of responding
countries
N/A 32 91 101
Response rate N/A 17% 47% 53%
CONDOM USE BY MEN WHO HAVE SEX WITH MEN
Condoms can substantially reduce the risk of sexual transmission of HIV. Consequently, consistent and correct condom use is important for men who have sex with men because of the high risk of HIV transmission during unprotected anal sex. In addition, men who have anal sex with men may also have female partners. Hence condom use during male-to-male sex may be an important determinant of spousal transmission.
Purpose To assess progress in preventing exposure to HIV among men who have unprotected anal sex with a male partner.
Defi nitionPercentage of men reporting the use of a condom the last time they had anal sex with a male partner.
Numerator: number of respondents who reported that a condom was used the last time they had anal sex.
Denominator: number of respondents who reported having had anal sex with a male partner in the last six months.
Table A2.23Response rates for condom use by men who have sex with men
2004 2006 2008 2010
CONDOM USE BY MEN WHO HAVE
SEX WITH MEN
Number of responding
countries
N/A 29 68 82
Response rate N/A 15% 35% 43%
CONDOM USE BY INJECTING DRUG USERS
Safer sexual practices among injecting drug users are essential, even in countries where other modes of HIV transmission predominate. Th e high risk of HIV transmission from contaminated injecting equipment places the sexual partners of injecting drug users at higher risk of HIV. Condom use by injecting drug users is therefore an important aspect of the prevention of HIV sexual transmission.
Purpose To assess progress in preventing sexual transmission of HIV.
Defi nitionPercentage of injecting drug users reporting the use of a condom the last time they had sexual intercourse.
Numerator: number of respondents who reported that a condom was used the last time they had sex.
Denominator: number of respondents who report having had sexual intercourse in the last month.
Table A2.24Response rates for condom use by injecting drug users
2004 2006 2008 2010
CONDOM USE BY INJECTING
DRUG USERS
Number of responding
countries
N/A N/A 43 51
Response rate N/A N/A 22% 27%

227
A2
Annex 2: Country progress indicators and data, 2004 to 2010 | 2010 GLOBAL REPORT
SAFE INJECTING PRACTICES BY INJECTING DRUG USERS
Safer injecting practices among injecting drug users are essential, even in countries where other modes of HIV transmission predominate, due to the high risk of HIV transmission from contaminated injecting equipment. Harm-reduction programmes aim to prevent HIV transmission among injecting drug users through a range of services which seek to reduce illicit drug use, reduce injecting frequency and reduce the re-use of used injecting equipment. While this indicator is designed to measure the behavioural outcome of services aimed at reducing the use of contaminated injecting equipment, any behaviour changes that are observed may not necessarily be attributable to such services.
Purpose To assess progress in preventing injecting drug use-associated HIV transmission.
Defi nitionPercentage of injecting drug users reporting the use of sterile injecting equipment the last time they injected.
Numerator: number of respondents who report using sterile injecting equipment the last time they injected drugs.
Denominator: number of respondents who report injecting drugs in the last month.
Table A2.25Response rates for safe injecting practices
2004 2006 2008 2010
SAFE INJECTING PRACTICES
Number of responding
countries
N/A N/A 44 55
Response rate N/A N/A 23% 29%

228 Annex 2: Country progress indicators and data, 2004 to 2010 | 2010 GLOBAL REPORT
Total reported domestic public and international expenditure million USD
Public InternationalSurvey Year
Domestic public (%)
Bilaterals (%) Global Fund (%)
UN (%) All other multilaterals
(%)
All other international sources (%)
SHARE BY FINANCING SOURCECOUNTRY REPORTS OF DOMESTIC AND INTERNATIONAL AIDS SPENDING BY SERVICE CATEGORIES AND FINANCING SOURCES
Caribbean
Antigua and Barbuda1 2008 0.329 78.9% 0.0% 21.1% 0.0% 0.0% 0.0%
Antigua and Barbuda1 2009 0.391 66.3% 0.0% 33.7% 0.0% 0.0% 0.0%
Bahamas 2008 4.442 89.7% 2.8% 0.0% 3.4% 0.0% 4.0%
Bahamas 2009 4.889 90.0% 0.0% 0.0% 3.8% 0.0% 6.2%
Barbados 2009 11.903 67.3% NA/NR NA/NR NA/NR NA/NR NA/NR
Cuba 2007 44.509 80.3% 0.0% 19.7% 0.0% 0.0% 0.0%
Cuba 2008 46.616 79.7% 0.0% 20.3% 0.0% 0.0% 0.0%
Cuba 2009 76.893 81.5% 0.0% 18.0% 0.0% 0.0% 0.5%
Dominica5 2008 0.178 17.3% 42.2% 31.7% 8.5% 0.0% 0.3%
Dominica5 2009 0.178 17.3% 42.2% 31.7% 8.5% 0.0% 0.3%
Dominican Republic8 2008 23.416 34.8% 6.8% 53.9% 2.9% 0.2% 1.3%
Grenada 2008 0.484 100.0% 0.0% 0.0% 0.0% 0.0% 0.0%
Grenada 2009 0.194 100.0% 0.0% 0.0% 0.0% 0.0% 0.0%
Saint Kitts and Nevis 2007 1.343 100.0% 0.0% 0.0% 0.0% 0.0% 0.0%
Saint Kitts and Nevis 2008 1.487 92.3% 0.0% 7.7% 0.0% 0.0% 0.0%
Saint Kitts and Nevis 2009 1.210 89.4% 0.0% 10.6% 0.0% 0.0% 0.0%
Saint Vincent and the Grenadines 2008 1.625 11.4% 0.0% 3.3% 0.0% 85.3% 0.0%
Saint Vincent and the Grenadines 2009 2.629 8.4% 0.0% 5.3% 1.1% 85.1% 0.0%
Trinidad and Tobago 2007 9.716 96.8% 0.0% 0.0% 0.0% 1.6% 1.6%
Trinidad and Tobago 2008 15.033 90.6% 0.0% 0.2% 3.8% 0.0% 5.3%
Trinidad and Tobago 2009 13.533 84.4% 0.0% 0.0% 5.2% 10.3% 0.1%
Central and South America
Argentina 2007 209.455 97.4% 0.0% 2.4% 0.3% 0.0% 0.0%
Argentina 2008 248.773 97.4% 0.0% 2.3% 0.2% 0.0% 0.0%
Belize 2009 2.024 32.2% 0.0% 10.2% 8.6% 42.9% 6.1%
Bolivia 2008 5.394 17.5% 8.2% 46.8% 14.8% 1.2% 11.5%
Bolivia 2009 7.418 12.6% 4.9% 58.6% 14.0% 0.0% 9.9%
Brazil2 2007 575.139 99.5% 0.1% 0.0% 0.4% 0.0% 0.0%
Brazil2 2008 623.134 99.0% 0.1% 0.0% 0.5% 0.0% 0.4%
Chile4 2008 88.012 99.0% 0.1% 0.8% 0.1% 0.0% 0.0%
Colombia 2007 69.262 99.1% 0.0% 0.0% 0.9% 0.0% 0.0%
Colombia 2008 103.557 99.5% 0.0% 0.0% 0.5% 0.0% 0.0%
Colombia 2009 108.792 99.5% 0.0% 0.0% 0.5% 0.0% 0.0%
Costa Rica 2008 19.885 93.1% NA/NR NA/NR NA/NR NA/NR NA/NR
Ecuador 2008 25.972 NA/NR NA/NR NA/NR NA/NR NA/NR NA/NR
Ecuador 2009 31.900 NA/NR NA/NR NA/NR NA/NR NA/NR NA/NR
El Salvador 2007 38.261 90.8% 1.3% 4.5% 0.3% 2.2% 0.9%
El Salvador 2008 39.227 79.7% 4.7% 7.1% 1.9% 0.0% 6.5%
Guatemala 2007 43.648 NA/NR NA/NR NA/NR NA/NR NA/NR NA/NR
Guatemala 2008 51.350 NA/NR NA/NR NA/NR NA/NR NA/NR NA/NR
Honduras 2007 18.420 43.2% 13.6% 28.4% 6.7% 0.2% 7.8%
Honduras 2008 24.320 38.3% 14.3% 36.1% 4.7% 0.0% 6.6%
Nicaragua 2007 12.665 45.4% 54.6% 0.0% 0.0% 0.0% 0.0%
Nicaragua 2008 14.909 42.3% 57.7% 0.0% 0.0% 0.0% 0.0%
Panama 2008 13.628 86.6% NA/NR NA/NR NA/NR NA/NR NA/NR
Paraguay 2008 9.298 65.3% 14.9% 12.4% 5.8% 0.4% 1.2% UNGASS Indicator 1

229
A2
Annex 2: Country progress indicators and data, 2004 to 2010 | 2010 GLOBAL REPORT
Orphans and vulnerable children
Other HIV expenditures
Prevention Care and Treatment Programme Support
Monitoring and
evaluation
Planning, coordination
and programme
management
Total for programme
management and admin-
istration strengthen-
ing
Total for prevention
Male and female
condom social marketing and
public and commercial
sector provision
Communica-tion for social and behav-ioral change
Prevention of mother to child
transmission
Voluntary counseling and testing
Total for care and treatment
Programmes for sex workers
and their clients for
MSM and for harm reduction
for IDUs
Antiretroviral therapy
TOTAL HIV EXPENDITURES ON SELECTED SERVICES (MILLION CURRENT USD DOLLARS)
NA/NR NA/NR NA/NR NA/NR NA/NR NA/NR NA/NR NA/NR NA/NR NA/NR NA/NR NA/NR NA/NR
NA/NR NA/NR NA/NR NA/NR NA/NR NA/NR NA/NR NA/NR NA/NR NA/NR NA/NR NA/NR NA/NR
0.708 0.007 0.241 NA/NR 0.035 0.182 3.492 0.693 NA/NR 0.033 NA/NR NA/NR 0.208
0.399 NA/NR 0.245 NA/NR NA/NR 0.102 3.093 0.292 NA/NR 1.114 NA/NR NA/NR 0.281
NA/NR NA/NR NA/NR NA/NR NA/NR NA/NR NA/NR NA/NR NA/NR NA/NR NA/NR NA/NR NA/NR
8.967 5.584 0.801 NA/NR 2.582 NA/NR 32.604 11.314 NA/NR 0.176 0.176 NA/NR 2.762
5.543 0.313 0.088 0.102 4.167 0.003 15.420 13.163 0.014 21.148 2.758 NA/NR 4.491
16.422 2.124 0.061 0.106 10.537 0.044 26.035 15.184 0.044 31.945 12.072 NA/NR 2.447
NA/NR NA/NR NA/NR NA/NR NA/NR NA/NR NA/NR NA/NR NA/NR NA/NR NA/NR NA/NR NA/NR
NA/NR NA/NR NA/NR NA/NR NA/NR NA/NR NA/NR NA/NR NA/NR NA/NR NA/NR NA/NR NA/NR
5.450 0.481 0.497 0.283 0.561 0.721 7.220 2.657 0.024 9.036 4.650 0.329 1.686
NA/NR NA/NR NA/NR NA/NR NA/NR NA/NR NA/NR NA/NR NA/NR NA/NR NA/NR NA/NR NA/NR
NA/NR NA/NR NA/NR NA/NR NA/NR NA/NR NA/NR NA/NR NA/NR NA/NR NA/NR NA/NR NA/NR
0.033 NA/NR NA/NR NA/NR NA/NR NA/NR 0.012 NA/NR NA/NR 1.290 0.015 0.019 0.008
0.035 0.017 0.007 NA/NR 0.003 NA/NR 0.184 0.090 NA/NR 1.228 0.050 NA/NR 0.040
0.106 0.013 0.012 NA/NR 0.013 NA/NR 0.065 0.028 NA/NR 1.010 0.025 NA/NR 0.029
NA/NR NA/NR NA/NR NA/NR NA/NR NA/NR NA/NR NA/NR NA/NR NA/NR NA/NR NA/NR NA/NR
NA/NR NA/NR NA/NR NA/NR NA/NR NA/NR NA/NR NA/NR NA/NR NA/NR NA/NR NA/NR NA/NR
4.535 2.329 0.033 0.350 0.001 0.194 3.481 2.535 NA/NR 1.310 0.111 NA/NR 0.390
6.864 3.335 0.132 0.211 NA/NR 0.340 5.016 3.350 NA/NR 2.870 0.455 0.004 0.283
5.739 3.290 0.005 0.051 NA/NR 0.471 6.538 4.221 0.048 0.774 0.618 NA/NR 0.434
28.705 3.065 NA/NR 0.017 2.867 5.826 156.449 46.787 0.269 10.302 8.418 0.044 13.730
35.216 4.665 NA/NR 0.010 2.813 5.795 186.732 50.532 0.353 5.823 3.667 0.016 20.649
0.541 0.246 0.011 NA/NR 0.031 0.035 0.402 0.198 0.043 0.800 0.618 0.080 0.238
2.178 0.193 NA/NR 0.004 0.096 0.369 1.384 0.164 0.010 0.566 0.158 0.174 1.256
2.775 0.727 NA/NR 0.072 NA/NR 0.126 2.303 0.404 0.008 0.753 0.187 0.170 1.580
82.027 15.222 8.896 0.022 37.915 3.694 438.853 362.674 0.036 19.692 6.561 2.274 34.531
41.759 16.241 7.967 0.100 0.092 3.799 522.611 427.759 NA/NR 23.447 6.063 2.324 35.316
20.321 0.550 1.952 2.349 0.348 1.332 57.672 53.450 0.005 0.784 0.681 0.033 9.230
9.193 0.821 1.731 0.122 0.388 1.043 56.118 24.853 0.077 1.664 0.272 0.164 2.210
20.788 1.066 3.583 0.107 0.232 2.713 77.010 33.783 0.075 3.594 1.675 0.185 2.092
21.464 2.426 2.577 0.127 0.644 1.996 83.036 37.316 0.073 2.037 0.565 0.214 2.182
6.480 NA/NR NA/NR NA/NR NA/NR NA/NR 11.987 NA/NR NA/NR 0.576 NA/NR NA/NR 0.842
13.596 NA/NR NA/NR NA/NR NA/NR NA/NR 9.093 NA/NR 0.043 1.534 NA/NR NA/NR 1.706
16.195 NA/NR NA/NR NA/NR NA/NR NA/NR 12.250 NA/NR 0.052 1.643 NA/NR NA/NR 1.759
11.209 0.962 1.355 0.286 1.037 0.534 21.090 7.103 0.347 3.409 1.230 0.390 2.206
8.338 0.845 0.682 0.441 0.071 0.435 25.957 8.163 0.130 3.588 2.025 0.061 1.214
10.447 NA/NR NA/NR NA/NR NA/NR NA/NR 28.613 NA/NR 0.035 3.998 NA/NR NA/NR 0.555
14.000 NA/NR NA/NR NA/NR NA/NR NA/NR 30.927 NA/NR 0.039 5.835 NA/NR NA/NR 0.548
9.844 1.060 2.483 0.358 0.493 0.968 4.727 1.482 0.582 2.388 0.852 0.195 0.878
14.420 1.408 0.881 0.764 0.591 1.286 5.749 3.139 0.609 1.883 0.490 0.448 1.660
3.703 NA/NR NA/NR NA/NR NA/NR NA/NR 2.234 NA/NR NA/NR 1.519 NA/NR NA/NR 5.209
4.669 NA/NR NA/NR NA/NR NA/NR NA/NR 2.261 NA/NR 0.029 2.428 NA/NR NA/NR 5.522
0.922 NA/NR NA/NR NA/NR NA/NR NA/NR 11.302 NA/NR 0.093 0.658 NA/NR NA/NR 0.652
1.164 0.164 0.427 NA/NR 0.078 0.053 6.990 1.902 0.024 0.623 0.417 0.097 0.497

230 Annex 2: Country progress indicators and data, 2004 to 2010 | 2010 GLOBAL REPORT
Total reported domestic public and international expenditure million USD
Public InternationalSurvey Year
Domestic public (%)
Bilaterals (%) Global Fund (%)
UN (%) All other multilaterals
(%)
All other international sources (%)
SHARE BY FINANCING SOURCECOUNTRY REPORTS OF DOMESTIC AND INTERNATIONAL AIDS SPENDING BY SERVICE CATEGORIES AND FINANCING SOURCES
Paraguay 2009 11.418 67.6% 10.4% 14.5% 5.1% 2.1% 0.3%
Peru 2007 34.892 37.6% 7.2% 13.1% 4.1% 0.0% 37.9%
Peru 2008 41.056 45.3% 1.1% 36.8% 2.7% 0.0% 14.1%
Peru 2009 43.639 54.8% 0.0% 36.4% 1.1% 0.0% 7.8%
Uruguay 2007 7.534 90.9% 0.0% 0.0% 5.2% 3.8% 0.1%
Venezuela 2007 79.818 99.9% 0.0% 0.0% 0.1% 0.0% 0.0%
Venezuela 2008 71.723 99.8% 0.0% 0.0% 0.2% 0.0% 0.0%
Venezuela 2009 78.801 99.9% 0.0% 0.0% 0.1% 0.0% 0.0%
East Asia
China 2008 323.834 72.9% 4.0% 13.6% 2.4% 0.0% 7.1%
China 2009 353.535 76.0% 3.1% 13.0% 2.0% 0.0% 5.8%
Japan 2009 73.197 100.0% 0.0% 0.0% 0.0% 0.0% 0.0%
Mongolia 2008 5.044 31.2% 1.8% 46.1% 14.2% 2.8% 3.9%
Mongolia 2009 4.664 24.8% 4.8% 57.5% 4.2% 5.7% 2.9%
Eastern Europe and Central Asia
Armenia 2008 2.605 21.4% 0.5% 56.9% 9.2% 0.0% 12.0%
Armenia 2009 2.301 27.5% 1.1% 51.6% 10.7% 0.0% 9.1%
Azerbaijan 2008 5.002 63.7% 2.1% 25.4% 5.9% 0.0% 2.9%
Azerbaijan 2009 6.062 68.4% 0.4% 19.1% 4.6% 0.0% 7.6%
Belarus 2008 18.616 72.7% 0.0% 19.3% 2.3% 2.1% 3.5%
Belarus 2009 16.660 68.1% 0.0% 24.8% 3.6% 0.0% 3.5%
Georgia 2008 8.043 15.8% 13.1% 58.1% 6.9% 0.0% 6.1%
Georgia 2009 8.387 26.6% 7.5% 59.4% 3.1% 0.0% 3.3%
Kazakstan 2009 22.778 71.4% 4.7% 22.7% 1.2% 0.0% 0.0%
Kyrgyzstan 2008 8.796 16.5% 5.5% 58.5% 3.0% 10.8% 5.7%
Kyrgyzstan 2009 9.987 18.1% 20.0% 45.3% 6.4% 6.5% 3.6%
Republic of Moldova 2008 12.871 38.6% 0.4% 23.2% 10.1% 27.7% 0.0%
Republic of Moldova 2009 11.482 48.3% 0.9% 32.8% 11.1% 6.9% 0.0%
Russian Federation11 2008 777.021 90.2% 0.1% 8.4% 1.3% 0.0% 0.0%
Tajikistan 2008 6.178 16.5% 0.0% 59.2% 7.2% 6.8% 10.3%
Tajikistan 2009 7.479 15.4% 0.0% 61.6% 4.5% 8.6% 9.9%
Ukraine 2007 77.575 60.3% 8.7% 23.6% 2.7% 3.6% 1.1%
Ukraine 2008 100.004 59.5% 8.7% 26.8% 1.7% 1.7% 1.6%
Uzbekistan 2009 15.940 51.7% 0.0% 40.6% 3.0% 4.7% 0.0%
Middle East and North Africa
Algeria 2008 3.802 69.8% 0.4% 27.5% 2.4% 0.0% 0.0%
Algeria 2009 2.721 93.7% 4.2% 0.0% 2.0% 0.0% 0.0%
Djibouti 2007 3.691 0.0% 0.0% 7.1% 27.1% 65.8% 0.0%
Djibouti 2008 3.221 0.0% 0.0% 57.3% 11.8% 30.9% 0.0%
Djibouti 2009 2.007 0.0% 0.0% 30.5% 69.5% 0.0% 0.0%
Egypt 2007 5.737 59.7% 16.3% 0.0% 10.7% 0.6% 12.7%
Egypt 2008 7.538 50.3% 3.7% 17.8% 12.9% 1.2% 14.0%
Iran (Islamic Republic of) 2008 36.011 87.6% 0.0% 8.7% 3.7% 0.0% 0.0%
Jordan 2009 3.099 40.2% NA/NR NA/NR NA/NR NA/NR NA/NR
Kuwait 2007 4.219 100.0% 0.0% 0.0% 0.0% 0.0% 0.0%
Kuwait 2008 4.696 100.0% 0.0% 0.0% 0.0% 0.0% 0.0%
Kuwait 2009 4.578 100.0% 0.0% 0.0% 0.0% 0.0% 0.0%
Lebanon 2007 4.400 72.7% 0.0% 0.0% 10.2% 0.0% 17.0%

231
A2
Annex 2: Country progress indicators and data, 2004 to 2010 | 2010 GLOBAL REPORT
Orphans and vulnerable children
Other HIV expenditures
Prevention Care and Treatment Programme Support
Monitoring and
evaluation
Planning, coordination
and programme
management
Total for programme
management and admin-
istration strengthen-
ing
Total for prevention
Male and female
condom social marketing and
public and commercial
sector provision
Communica-tion for social and behav-ioral change
Prevention of mother to child
transmission
Voluntary counseling and testing
Total for care and treatment
Programmes for sex workers
and their clients for
MSM and for harm reduction
for IDUs
Antiretroviral therapy
TOTAL HIV EXPENDITURES ON SELECTED SERVICES (MILLION CURRENT USD DOLLARS)
1.342 0.187 0.171 0.031 0.091 0.147 8.698 1.899 0.021 0.940 0.667 0.106 0.416
7.393 1.012 NA/NR 2.196 0.033 1.044 10.689 4.841 0.171 1.562 0.727 0.359 15.075
14.135 0.860 NA/NR 2.493 0.022 4.355 16.864 10.541 1.120 1.992 1.130 0.756 6.944
13.550 0.410 NA/NR 4.870 0.000 3.521 22.307 18.359 0.679 2.230 1.181 0.794 4.873
1.607 0.163 0.299 0.014 0.152 0.064 4.823 4.187 NA/NR 0.076 0.021 NA/NR 1.028
3.471 0.138 NA/NR 0.159 0.437 0.960 75.245 73.636 NA/NR 0.172 NA/NR NA/NR 0.930
5.662 0.133 NA/NR 0.116 0.385 0.835 64.145 59.561 NA/NR 0.263 NA/NR NA/NR 1.653
6.013 0.095 NA/NR 0.309 NA/NR 0.697 69.644 65.588 NA/NR 0.325 NA/NR NA/NR 2.819
NA/NR NA/NR NA/NR NA/NR NA/NR NA/NR NA/NR NA/NR NA/NR NA/NR NA/NR NA/NR NA/NR
NA/NR NA/NR NA/NR NA/NR NA/NR NA/NR NA/NR NA/NR NA/NR NA/NR NA/NR NA/NR NA/NR
NA/NR NA/NR NA/NR NA/NR NA/NR NA/NR NA/NR NA/NR NA/NR NA/NR NA/NR NA/NR NA/NR
2.756 0.149 0.145 0.015 0.099 NA/NR 0.600 0.004 0.005 1.371 0.564 0.046 0.311
2.589 0.085 0.101 0.006 0.022 NA/NR 0.104 0.005 0.005 1.649 0.407 0.024 0.315
1.100 0.104 0.197 0.253 0.023 0.089 0.705 0.142 NA/NR 0.425 0.257 0.080 0.375
0.894 0.051 0.153 0.172 0.024 0.082 0.690 0.156 NA/NR 0.305 0.163 0.071 0.413
3.512 0.152 0.003 0.422 0.089 0.393 0.621 0.065 0.000 0.241 0.084 0.005 0.629
3.940 0.101 0.002 0.248 0.050 0.468 0.917 0.114 NA/NR 0.343 0.081 0.024 0.861
12.365 0.323 0.890 0.995 0.000 0.213 2.578 1.060 0.094 2.010 0.291 0.142 1.569
10.057 0.101 0.833 1.341 0.000 0.461 2.856 1.028 0.100 2.370 0.269 0.201 1.278
3.218 0.260 0.424 1.380 0.259 0.090 2.408 1.352 NA/NR 0.591 0.081 0.011 1.826
2.995 0.132 0.500 1.534 0.024 0.098 2.794 0.954 NA/NR 1.278 0.060 0.018 1.320
15.923 0.373 0.662 2.996 NA/NR 0.291 2.463 0.689 NA/NR 4.042 0.595 0.423 0.351
5.547 0.257 0.188 2.921 0.020 0.035 0.351 0.086 0.067 1.883 0.022 0.061 0.949
6.422 0.261 1.863 2.265 0.020 0.157 0.781 0.031 0.065 1.683 0.005 0.154 1.037
8.966 0.070 0.452 0.402 0.048 0.088 2.060 0.673 0.138 1.259 0.221 0.106 0.448
6.565 0.049 0.443 0.667 NA/NR 0.058 2.634 1.299 0.078 1.081 0.096 0.117 1.125
181.902 7.859 10.100 8.083 2.002 9.398 447.312 228.410 64.972 45.272 5.244 0.763 37.563
2.930 0.094 0.104 0.485 NA/NR 0.168 0.407 0.055 NA/NR 2.397 0.791 0.137 0.444
2.878 0.112 0.181 0.794 NA/NR 0.208 0.722 0.068 NA/NR 3.065 0.738 0.185 0.814
28.679 0.592 7.377 8.779 0.955 1.964 37.445 7.669 0.504 5.406 1.131 0.706 5.541
22.808 0.936 3.806 9.687 1.481 1.867 48.799 21.632 2.562 21.256 2.978 2.176 4.578
3.153 0.031 0.141 0.014 NA/NR 0.228 4.250 0.134 1.029 4.556 0.227 0.154 2.951
0.432 0.361 0.003 0.034 0.013 NA/NR 2.788 2.430 NA/NR 0.107 0.069 0.003 0.475
0.736 0.071 0.002 0.006 0.004 NA/NR 1.819 1.681 NA/NR 0.078 0.060 NA/NR 0.087
NA/NR NA/NR NA/NR NA/NR NA/NR NA/NR NA/NR NA/NR NA/NR NA/NR NA/NR NA/NR NA/NR
NA/NR NA/NR NA/NR NA/NR NA/NR NA/NR NA/NR NA/NR NA/NR NA/NR NA/NR NA/NR NA/NR
NA/NR NA/NR NA/NR NA/NR NA/NR NA/NR NA/NR NA/NR NA/NR NA/NR NA/NR NA/NR NA/NR
2.420 0.345 0.350 0.194 NA/NR 0.002 1.325 0.824 0.005 0.747 0.027 0.007 1.239
2.601 0.295 0.301 0.307 NA/NR 0.010 1.492 0.464 0.007 1.324 0.147 0.093 2.115
20.402 NA/NR NA/NR NA/NR NA/NR NA/NR 4.302 NA/NR NA/NR 4.639 NA/NR NA/NR 6.667
NA/NR NA/NR NA/NR NA/NR NA/NR NA/NR NA/NR NA/NR NA/NR NA/NR NA/NR NA/NR NA/NR
NA/NR NA/NR NA/NR NA/NR NA/NR NA/NR 1.508 1.508 NA/NR 2.711 0.273 NA/NR 0.000
NA/NR NA/NR NA/NR NA/NR NA/NR NA/NR 1.785 1.785 NA/NR 2.910 0.293 NA/NR NA/NR
NA/NR NA/NR NA/NR NA/NR NA/NR NA/NR 1.860 1.860 NA/NR 2.718 0.276 NA/NR NA/NR
NA/NR NA/NR NA/NR NA/NR NA/NR NA/NR NA/NR NA/NR NA/NR NA/NR NA/NR NA/NR NA/NR

232 Annex 2: Country progress indicators and data, 2004 to 2010 | 2010 GLOBAL REPORT
Total reported domestic public and international expenditure million USD
Public InternationalSurvey Year
Domestic public (%)
Bilaterals (%) Global Fund (%)
UN (%) All other multilaterals
(%)
All other international sources (%)
SHARE BY FINANCING SOURCECOUNTRY REPORTS OF DOMESTIC AND INTERNATIONAL AIDS SPENDING BY SERVICE CATEGORIES AND FINANCING SOURCES
Lebanon 2008 7.300 43.8% 0.0% 0.0% 44.5% 0.0% 11.6%
Lebanon 2009 4.450 71.9% 0.0% 0.0% 5.6% 0.0% 22.5%
Morocco 2007 10.313 50.3% 5.8% 29.3% 7.8% 2.9% 3.9%
Morocco 2008 12.566 44.4% 3.7% 36.7% 7.9% 0.0% 7.3%
Oman 2009 0.812 76.5% 0.0% 0.0% 23.5% 0.0% 0.0%
Saudi Arabia 2009 19.389 99.7% 0.0% 0.0% 0.3% 0.0% 0.0%
Somalia5 2008 5.995 0.2% 0.0% 83.5% 13.0% 2.9% 0.4%
Somalia5 2009 5.982 0.0% 0.0% 83.7% 13.0% 2.9% 0.4%
Syrian Arab Republic 2007 1.638 91.5% 0.0% 0.0% 7.3% 0.0% 1.2%
Syrian Arab Republic 2008 1.986 88.1% 1.3% 0.0% 9.9% 0.0% 0.8%
Syrian Arab Republic 2009 1.977 91.1% 1.1% 0.0% 6.4% 0.0% 1.3%
United Arab Emirates 2009 17.584 99.8% 0.0% 0.0% 0.2% 0.0% 0.0%
Yemen 2009 4.956 2.5% 0.0% 83.5% 14.0% 0.0% 0.0%
North America
Mexico 2008 266.037 99.4% 0.1% 0.0% 0.2% 0.0% 0.3%
Mexico 2009 218.421 99.4% 0.1% 0.0% 0.4% 0.0% 0.2%
Oceania
Fiji 2007 1.849 20.1% 49.6% 0.1% 25.9% 1.0% 3.3%
Fiji 2008 2.506 15.9% 44.1% 3.6% 24.6% 11.4% 0.4%
Fiji 2009 2.100 11.8% 35.7% 15.9% 27.6% 8.0% 1.0%
Marshall Islands 2008 0.578 NA/NR NA/NR NA/NR NA/NR NA/NR NA/NR
Marshall Islands 2009 0.539 NA/NR NA/NR NA/NR NA/NR NA/NR NA/NR
Micronesia, Federated States of 2008 0.355 0.0% 68.2% 8.1% 0.0% 12.5% 11.3%
Micronesia, Federated States of 2009 0.540 0.0% 45.9% 14.3% 0.0% 31.4% 8.3%
Nauru 2008 0.081 43.7% 0.0% 54.2% 2.1% 0.0% 0.0%
Nauru 2009 0.097 53.8% 0.0% 46.2% 0.0% 0.0% 0.0%
Palau 2007 0.057 0.0% 100.0% 0.0% 0.0% 0.0% 0.0%
Palau 2008 0.057 0.0% 100.0% 0.0% 0.0% 0.0% 0.0%
Palau 2009 0.067 0.0% 100.0% 0.0% 0.0% 0.0% 0.0%
Samoa 2009 0.792 78.1% 0.0% 21.9% 0.0% 0.0% 0.0%
Solomon Islands 2008 0.598 16.4% NA/NR NA/NR NA/NR NA/NR NA/NR
Solomon Islands 2009 0.575 18.8% NA/NR NA/NR NA/NR NA/NR NA/NR
Tonga 2008 0.210 0.0% 0.0% 47.2% 16.0% 36.8% 0.0%
Tonga 2009 0.279 26.5% 1.0% 42.2% 5.5% 24.8% 0.0%
Tuvalu 2008 0.054 11.8% 0.0% 88.2% 0.0% 0.0% 0.0%
Tuvalu 2009 0.038 16.6% 0.0% 83.4% 0.0% 0.0% 0.0%
Vanuatu 2008 1.092 6.6% NA/NR NA/NR NA/NR NA/NR NA/NR
Vanuatu 2009 1.115 6.5% NA/NR NA/NR NA/NR NA/NR NA/NR
South and South-East Asia
Afghanistan 2008 3.241 4.0% 7.8% 0.0% 5.8% 82.3% 0.0%
Afghanistan 2009 5.159 2.6% 5.5% 21.1% 8.4% 62.4% 0.0%
Bangladesh 2008 37.265 0.0% 13.1% 38.6% 43.0% 5.4% 0.0%
Bangladesh 2009 26.938 0.0% 17.4% 38.4% 36.9% 7.4% 0.0%
Cambodia 2007 53.259 11.4% 45.8% 31.1% 10.5% 0.0% 1.2%
Cambodia 2008 51.847 10.1% 39.9% 36.8% 9.1% 4.1% 0.0%
India6 2008 145.590 16.5% 19.1% 41.1% 0.7% 22.6% 0.0%
India6 2009 140.002 16.5% 19.1% 41.1% 0.7% 22.6% 0.0%
Indonesia 2007 58.671 26.3% 57.2% 6.2% 9.2% 1.1% 0.0%

233
A2
Annex 2: Country progress indicators and data, 2004 to 2010 | 2010 GLOBAL REPORT
Orphans and vulnerable children
Other HIV expenditures
Prevention Care and Treatment Programme Support
Monitoring and
evaluation
Planning, coordination
and programme
management
Total for programme
management and admin-
istration strengthen-
ing
Total for prevention
Male and female
condom social marketing and
public and commercial
sector provision
Communica-tion for social and behav-ioral change
Prevention of mother to child
transmission
Voluntary counseling and testing
Total for care and treatment
Programmes for sex workers
and their clients for
MSM and for harm reduction
for IDUs
Antiretroviral therapy
TOTAL HIV EXPENDITURES ON SELECTED SERVICES (MILLION CURRENT USD DOLLARS)
NA/NR NA/NR NA/NR NA/NR NA/NR NA/NR NA/NR NA/NR NA/NR NA/NR NA/NR NA/NR NA/NR
NA/NR NA/NR NA/NR NA/NR NA/NR NA/NR NA/NR NA/NR NA/NR NA/NR NA/NR NA/NR NA/NR
3.911 0.812 0.502 0.491 0.171 0.012 4.457 1.666 NA/NR 1.680 1.006 0.374 0.264
4.685 0.797 0.475 0.962 0.325 0.106 4.848 1.429 NA/NR 1.612 1.210 0.300 1.421
0.217 0.044 NA/NR NA/NR NA/NR 0.039 0.297 0.134 0.045 0.162 NA/NR NA/NR 0.091
5.968 NA/NR 5.146 NA/NR NA/NR NA/NR 10.094 9.209 NA/NR 3.264 NA/NR NA/NR 0.063
1.088 0.264 0.023 NA/NR 0.004 NA/NR 1.040 0.048 0.016 2.400 0.697 0.263 1.451
1.088 0.264 0.023 NA/NR 0.004 NA/NR 1.040 0.048 0.016 2.400 0.697 0.263 1.438
NA/NR NA/NR NA/NR NA/NR NA/NR NA/NR 1.027 0.424 NA/NR 0.506 0.486 NA/NR 0.104
0.007 NA/NR 0.007 NA/NR NA/NR NA/NR 1.211 0.502 NA/NR 0.596 0.576 NA/NR 0.172
0.050 NA/NR 0.050 NA/NR NA/NR NA/NR 1.381 0.548 NA/NR 0.461 0.461 NA/NR 0.085
0.018 NA/NR NA/NR NA/NR NA/NR NA/NR 2.826 2.390 NA/NR 14.638 NA/NR NA/NR 0.102
NA/NR NA/NR NA/NR NA/NR NA/NR NA/NR NA/NR NA/NR NA/NR NA/NR NA/NR NA/NR NA/NR
50.606 6.496 3.569 1.765 0.440 13.897 200.711 156.923 0.014 8.617 4.178 0.121 6.089
48.242 3.252 3.751 1.680 0.507 15.805 163.405 122.275 0.012 5.537 3.738 0.124 1.226
0.800 0.382 0.051 0.019 0.002 0.044 0.091 NA/NR NA/NR 0.486 0.348 0.083 0.472
0.917 0.141 0.027 0.015 0.022 0.056 0.095 NA/NR NA/NR 0.713 0.569 0.025 0.782
0.635 0.264 0.002 0.017 0.050 0.001 0.079 NA/NR NA/NR 0.704 0.582 0.041 0.681
0.302 NA/NR NA/NR NA/NR NA/NR NA/NR 0.000 NA/NR NA/NR 0.275 NA/NR NA/NR 0.000
0.158 NA/NR NA/NR NA/NR NA/NR NA/NR 0.084 NA/NR NA/NR 0.289 NA/NR NA/NR 0.008
0.184 0.015 0.009 NA/NR 0.000 NA/NR 0.040 NA/NR NA/NR 0.033 0.016 0.012 0.098
0.170 0.004 0.012 NA/NR 0.005 NA/NR 0.041 NA/NR NA/NR 0.110 0.043 0.010 0.219
0.040 0.007 0.002 NA/NR 0.002 NA/NR NA/NR NA/NR NA/NR 0.041 0.032 NA/NR 0.000
0.030 0.006 0.001 NA/NR 0.001 NA/NR NA/NR NA/NR NA/NR 0.058 0.038 0.005 0.009
NA/NR NA/NR NA/NR NA/NR NA/NR NA/NR NA/NR NA/NR NA/NR 0.031 0.013 NA/NR 0.027
NA/NR NA/NR NA/NR NA/NR NA/NR NA/NR 0.014 0.014 NA/NR 0.038 0.034 NA/NR 0.005
NA/NR NA/NR NA/NR NA/NR NA/NR NA/NR 0.018 0.018 NA/NR 0.036 0.028 NA/NR 0.013
0.765 NA/NR NA/NR NA/NR NA/NR NA/NR 0.027 0.027 NA/NR NA/NR NA/NR NA/NR NA/NR
0.204 0.018 0.000 0.005 0.022 0.009 0.038 NA/NR NA/NR 0.158 0.061 0.015 0.198
0.122 0.028 NA/NR NA/NR NA/NR NA/NR 0.014 NA/NR NA/NR 0.134 0.015 0.008 0.305
0.013 NA/NR NA/NR NA/NR 0.001 NA/NR 0.103 NA/NR NA/NR 0.015 0.015 NA/NR 0.078
0.021 0.005 NA/NR NA/NR 0.001 NA/NR 0.104 NA/NR NA/NR 0.032 0.027 0.004 0.123
NA/NR NA/NR NA/NR NA/NR NA/NR NA/NR 0.054 NA/NR NA/NR NA/NR NA/NR NA/NR 0.000
NA/NR NA/NR NA/NR NA/NR NA/NR NA/NR 0.038 NA/NR NA/NR NA/NR NA/NR NA/NR NA/NR
NA/NR NA/NR NA/NR NA/NR NA/NR NA/NR NA/NR NA/NR NA/NR NA/NR NA/NR NA/NR NA/NR
NA/NR NA/NR NA/NR NA/NR NA/NR NA/NR NA/NR NA/NR NA/NR NA/NR NA/NR NA/NR NA/NR
1.472 0.069 0.003 0.725 NA/NR 0.009 0.019 NA/NR NA/NR 0.615 0.365 0.013 1.135
2.456 0.154 0.275 0.950 0.001 0.016 0.107 NA/NR 0.001 1.162 0.435 0.063 1.433
25.566 NA/NR NA/NR NA/NR NA/NR NA/NR 2.408 NA/NR NA/NR 7.175 NA/NR NA/NR 2.117
17.334 NA/NR NA/NR NA/NR NA/NR NA/NR 2.403 NA/NR NA/NR 6.378 NA/NR NA/NR 0.823
23.273 2.269 1.537 4.078 2.912 1.524 13.482 7.052 2.788 9.494 7.134 0.919 4.222
19.929 2.538 0.821 2.477 4.077 0.742 14.809 4.467 2.225 10.280 6.836 0.901 4.605
98.974 18.647 21.843 NA/NR 3.178 0.071 24.171 23.636 NA/NR 21.535 NA/NR 4.314 0.910
71.989 9.524 14.110 NA/NR 0.316 0.002 52.245 52.152 NA/NR 15.468 NA/NR 1.500 0.299
24.369 0.532 0.008 1.961 0.136 0.017 9.270 0.083 NA/NR 20.191 0.030 0.056 4.841

234 Annex 2: Country progress indicators and data, 2004 to 2010 | 2010 GLOBAL REPORT
Total reported domestic public and international expenditure million USD
Public InternationalSurvey Year
Domestic public (%)
Bilaterals (%) Global Fund (%)
UN (%) All other multilaterals
(%)
All other international sources (%)
SHARE BY FINANCING SOURCECOUNTRY REPORTS OF DOMESTIC AND INTERNATIONAL AIDS SPENDING BY SERVICE CATEGORIES AND FINANCING SOURCES
Indonesia 2008 49.563 40.0% 39.5% 11.7% 4.5% 3.0% 1.1%
Lao People’s Democratic Republic 2007 5.147 1.3% 19.4% 36.0% 20.3% 7.9% 15.0%
Lao People’s Democratic Republic 2008 5.017 2.0% 13.5% 39.6% 29.9% 6.9% 8.1%
Lao People’s Democratic Republic 2009 5.997 1.9% 19.4% 42.0% 22.2% 3.5% 11.0%
Malaysia 2008 24.289 98.8% 0.0% 0.0% 1.2% 0.0% 0.0%
Malaysia 2009 27.700 98.4% 0.0% 0.0% 1.1% 0.0% 0.5%
Myanmar 2007 32.763 3.6% 0.0% 0.0% 0.0% 0.0% 96.4%
Myanmar 2008 32.802 4.7% 0.0% 0.0% 0.0% 0.0% 95.3%
Nepal 2007 17.662 3.5% 67.8% 14.9% 7.5% 0.0% 6.3%
Pakistan 2008 14.195 68.5% 2.8% 7.7% 18.5% 2.5% 0.0%
Pakistan 2009 19.999 78.4% 0.5% 5.5% 13.3% 1.8% 0.6%
Philippines 2007 4.827 33.5% 47.3% 0.6% 16.5% 1.7% 0.3%
Philippines 2008 6.577 25.5% 9.0% 44.0% 16.7% 4.0% 0.9%
Philippines 2009 10.466 16.2% 7.3% 63.9% 11.7% 0.7% 0.2%
Singapore 2007 11.350 100.0% 0.0% 0.0% 0.0% 0.0% 0.0%
Singapore 2008 15.338 100.0% 0.0% 0.0% 0.0% 0.0% 0.0%
Singapore 2009 16.088 100.0% 0.0% 0.0% 0.0% 0.0% 0.0%
Sri Lanka 2008 1.568 29.5% 0.0% 17.3% 13.9% 39.2% 0.0%
Sri Lanka 2009 1.555 33.2% 0.0% 28.4% 18.6% 19.8% 0.0%
Thailand 2007 199.645 82.7% 0.5% 16.0% 0.8% 0.0% 0.0%
Thailand 2008 209.123 85.4% 1.2% 12.9% 0.5% 0.0% 0.0%
Thailand 2009 213.775 93.3% 0.9% 5.1% 0.6% 0.0% 0.0%
Timor Leste 2008 1.827 0.0% 0.0% 87.9% 12.1% 0.0% 0.0%
Timor Leste 2009 1.803 1.2% 0.0% 96.7% 0.0% 0.0% 2.1%
Viet Nam 2007 66.281 12.0% 67.5% 3.5% 4.6% 11.8% 0.6%
Viet Nam 2008 108.814 8.0% 74.0% 3.5% 4.2% 9.8% 0.5%
Viet Nam 2009 102.988 2.1% 87.1% 0.1% 1.8% 8.1% 0.8%
Sub-Saharan Africa
Angola 2008 31.766 75.8% 0.0% 21.2% 0.4% 2.5% 0.0%
Angola 2009 24.839 64.6% 0.0% 32.5% 1.7% 1.2% 0.0%
Benin 2007 16.836 27.1% 28.0% 17.8% 17.9% 6.2% 3.0%
Benin 2008 20.770 19.9% 21.7% 28.7% 18.2% 5.5% 6.0%
Benin 2009 28.789 45.2% 9.4% 25.8% 11.7% 3.5% 4.3%
Botswana 2008 339.868 67.3% 21.3% 0.0% 0.4% 0.0% 10.9%
Burkina Faso 2007 36.336 25.0% 36.3% 15.2% 13.3% 5.1% 5.1%
Burkina Faso 2008 48.011 25.3% 21.3% 25.0% 14.4% 4.0% 10.1%
Burundi 2007 25.964 29.5% 21.3% 27.1% 12.5% 0.2% 9.3%
Burundi 2008 26.060 22.5% 25.2% 22.1% 12.4% 1.0% 16.9%
Cameroon 2007 36.559 18.7% 9.7% 54.1% 8.8% 0.0% 8.7%
Cameroon 2008 39.972 17.6% 18.7% 47.7% 10.5% 0.0% 5.4%
Cape Verde 2008 2.570 1.2% 92.9% 0.0% 3.4% 2.1% 0.3%
Cape Verde 2009 1.111 1.7% 85.9% 0.0% 3.5% 1.4% 7.6%
Central African Republic 2007 10.332 4.6% 18.8% 37.6% 36.2% 0.0% 2.7%
Central African Republic 2008 20.282 3.5% 13.3% 47.3% 33.7% 0.0% 2.2%
Chad 2007 8.617 34.1% 37.5% 7.8% 14.5% 3.1% 3.0%
Chad 2008 13.895 16.1% 41.2% 15.8% 17.6% 6.7% 2.6%

235
A2
Annex 2: Country progress indicators and data, 2004 to 2010 | 2010 GLOBAL REPORT
Orphans and vulnerable children
Other HIV expenditures
Prevention Care and Treatment Programme Support
Monitoring and
evaluation
Planning, coordination
and programme
management
Total for programme
management and admin-
istration strengthen-
ing
Total for prevention
Male and female
condom social marketing and
public and commercial
sector provision
Communica-tion for social and behav-ioral change
Prevention of mother to child
transmission
Voluntary counseling and testing
Total for care and treatment
Programmes for sex workers
and their clients for
MSM and for harm reduction
for IDUs
Antiretroviral therapy
TOTAL HIV EXPENDITURES ON SELECTED SERVICES (MILLION CURRENT USD DOLLARS)
24.703 0.649 3.021 5.641 0.183 0.003 7.325 5.504 0.032 10.307 3.528 1.353 7.197
2.582 0.393 0.026 0.443 0.561 0.189 0.339 0.182 0.015 1.065 0.608 0.119 1.145
1.571 0.211 0.079 0.107 0.029 0.049 0.791 0.643 0.016 1.330 0.722 0.123 1.309
2.160 0.406 0.083 0.343 0.085 0.101 0.962 0.503 0.099 1.466 0.679 0.158 1.310
11.000 NA/NR NA/NR NA/NR NA/NR NA/NR 9.861 9.286 0.000 3.429 3.429 NA/NR 0.000
13.459 NA/NR NA/NR NA/NR NA/NR NA/NR 10.447 9.559 0.000 3.529 3.529 NA/NR 0.265
16.844 1.310 0.031 8.032 NA/NR 1.132 11.758 5.556 0.419 2.191 0.195 0.142 1.552
15.546 NA/NR 0.041 8.301 NA/NR 1.672 12.680 10.629 0.674 1.578 0.608 0.245 2.324
8.187 0.638 0.487 2.186 NA/NR 0.126 2.936 0.667 0.159 5.110 1.553 0.253 1.269
9.709 2.317 NA/NR 3.739 NA/NR NA/NR 1.443 1.443 NA/NR 2.360 2.360 NA/NR 0.683
15.522 3.483 NA/NR 8.288 NA/NR NA/NR 1.521 1.521 NA/NR 2.521 2.521 NA/NR 0.436
3.845 0.017 0.025 0.090 2.763 0.009 0.151 0.005 NA/NR 0.473 0.023 0.018 0.358
3.462 0.109 0.096 0.522 0.082 0.004 0.679 0.081 0.123 1.334 0.282 0.012 0.979
5.860 0.077 0.278 0.607 0.000 0.037 0.911 0.184 0.036 2.703 0.481 0.122 0.956
2.721 NA/NR NA/NR NA/NR NA/NR NA/NR 7.965 NA/NR NA/NR 0.664 NA/NR NA/NR 0.000
4.241 NA/NR NA/NR NA/NR NA/NR NA/NR 9.330 NA/NR NA/NR 1.767 NA/NR NA/NR 0.000
4.125 NA/NR NA/NR NA/NR NA/NR NA/NR 9.075 NA/NR NA/NR 2.888 NA/NR NA/NR 0.000
1.030 NA/NR NA/NR 0.064 NA/NR NA/NR 0.071 0.047 NA/NR 0.088 0.087 NA/NR 0.379
0.917 NA/NR NA/NR 0.130 NA/NR NA/NR 0.076 0.054 NA/NR 0.102 0.099 NA/NR 0.459
28.186 0.188 5.497 1.029 2.529 3.542 143.334 93.625 3.006 19.449 10.948 1.511 5.669
45.287 0.920 0.694 0.566 1.529 4.110 137.646 61.295 1.507 11.984 6.425 0.143 12.699
29.259 1.424 1.096 1.418 0.708 3.893 162.604 92.680 1.535 7.421 0.575 0.274 12.956
0.570 0.211 0.060 NA/NR NA/NR 0.016 0.019 0.019 NA/NR 1.003 0.728 NA/NR 0.236
0.358 0.053 0.008 NA/NR 0.003 0.002 0.061 0.061 NA/NR 1.166 0.694 NA/NR 0.218
24.553 4.874 3.459 0.051 0.007 2.226 25.900 12.670 0.578 9.326 2.607 2.540 5.924
39.344 7.050 4.911 0.117 0.051 4.226 42.324 21.245 1.818 16.312 3.714 7.628 9.016
35.872 3.736 5.634 0.012 NA/NR 4.573 47.383 21.868 3.231 10.278 1.755 6.781 6.223
12.215 1.733 0.897 0.244 1.418 5.430 13.105 4.615 NA/NR 5.562 1.793 NA/NR 0.884
7.263 1.292 1.418 0.453 0.604 2.030 8.636 3.714 NA/NR 7.135 2.544 0.531 1.806
4.667 0.472 1.134 NA/NR 0.785 0.937 6.776 2.664 0.231 4.228 3.718 0.091 0.935
5.745 1.017 0.937 NA/NR 1.349 0.431 5.902 4.408 0.500 7.295 5.003 1.029 1.328
9.530 0.359 1.078 NA/NR 1.335 1.197 6.578 3.645 0.727 9.721 6.763 0.518 2.233
29.766 2.160 8.566 NA/NR 3.127 5.621 165.330 48.827 80.607 49.952 40.913 2.617 14.213
7.064 2.132 0.544 NA/NR 0.948 1.010 13.060 9.248 2.930 9.130 4.185 0.765 4.153
12.956 1.945 1.993 0.362 1.630 0.918 15.661 6.495 2.632 10.487 6.528 1.780 6.275
5.899 1.015 0.766 0.073 0.941 0.861 7.420 3.210 2.616 7.175 5.783 1.195 2.852
5.736 0.783 0.865 0.069 0.846 0.857 8.684 2.501 2.664 6.134 4.719 0.792 2.842
10.000 1.646 0.946 0.004 0.931 1.376 15.297 11.474 2.251 5.920 2.907 0.369 3.092
11.435 2.313 1.561 NA/NR 2.780 0.565 16.036 11.055 3.148 6.089 5.260 0.486 3.263
0.749 0.253 0.012 NA/NR NA/NR NA/NR 1.233 0.624 0.074 0.366 NA/NR NA/NR 0.147
0.153 NA/NR NA/NR NA/NR NA/NR NA/NR 0.415 0.214 0.133 0.381 0.212 0.137 0.029
2.387 0.224 NA/NR NA/NR 0.878 0.176 4.207 1.008 0.113 2.915 1.890 0.151 0.710
3.031 0.493 0.195 0.000 1.208 0.178 8.230 NA/NR 0.979 5.665 3.672 0.454 2.377
3.324 0.704 0.158 0.039 0.970 0.116 3.210 3.035 0.025 1.417 1.235 0.077 0.640
5.323 1.821 0.033 NA/NR 1.903 0.300 4.088 3.036 0.188 3.402 2.252 0.133 0.894

236 Annex 2: Country progress indicators and data, 2004 to 2010 | 2010 GLOBAL REPORT
Total reported domestic public and international expenditure million USD
Public InternationalSurvey Year
Domestic public (%)
Bilaterals (%) Global Fund (%)
UN (%) All other multilaterals
(%)
All other international sources (%)
SHARE BY FINANCING SOURCECOUNTRY REPORTS OF DOMESTIC AND INTERNATIONAL AIDS SPENDING BY SERVICE CATEGORIES AND FINANCING SOURCES
Congo 2007 9.442 10.2% 1.9% 51.3% 14.7% 21.8% 0.0%
Congo 2008 11.629 11.0% 5.8% 34.9% 2.8% 45.5% 0.0%
Congo 2009 17.395 52.5% 4.1% 25.0% 2.1% 16.4% 0.0%
Cote d’Ivoire 2007 67.012 9.1% 72.6% 13.4% 4.5% 0.0% 0.4%
Cote d’Ivoire 2008 62.011 8.4% 76.8% 11.4% 2.4% 0.0% 0.9%
Democratic Republic of the Congo 2008 85.964 3.6% 13.9% 40.0% 18.5% 16.8% 7.3%
Equatorial Guinea 2007 1.310 74.0% 6.7% 0.0% 19.3% 0.0% 0.0%
Equatorial Guinea 2008 2.827 33.5% 7.1% 41.9% 17.4% 0.0% 0.0%
Equatorial Guinea 2009 2.797 32.8% 4.2% 55.3% 7.6% 0.0% 0.0%
Eritrea 2008 14.457 5.9% 2.7% 46.7% 18.7% 26.0% 0.0%
Eritrea 2009 13.661 8.9% 4.7% 30.1% 23.8% 32.5% 0.0%
Gabon 2007 10.471 58.2% 2.6% 24.0% 10.9% 4.4% 0.0%
Gabon 2008 11.852 87.4% 4.6% 3.5% 4.4% 0.0% 0.0%
Gabon 2009 12.263 77.1% 2.1% 15.3% 5.5% 0.0% 0.0%
Gambia 2007 4.893 4.5% 0.8% 51.4% 17.3% 4.3% 21.6%
Gambia 2008 4.985 3.6% 1.9% 63.2% 14.6% 0.1% 16.7%
Ghana 2007 52.308 21.5% 12.9% 46.2% 1.0% 16.1% 2.3%
Ghana 2008 37.928 14.1% 11.9% 29.2% 7.2% 18.7% 19.0%
Guinea 2007 7.402 0.6% 35.5% 7.1% 21.9% 18.1% 16.9%
Guinea 2008 13.184 2.0% 19.9% 14.0% 15.8% 33.1% 15.3%
Guinea 2009 10.231 6.5% 25.7% 21.7% 23.6% 0.0% 22.5%
Guinea-Bissau 2008 3.648 7.3% 24.1% 11.0% 42.8% 3.3% 11.5%
Guinea-Bissau 2009 5.256 4.5% 28.1% 45.9% 19.0% 0.1% 2.3%
Kenya 2007 418.582 13.7% 68.3% 6.3% 1.5% 0.0% 10.2%
Kenya 2008 659.866 11.2% 79.3% 1.5% 2.4% 0.1% 5.6%
Kenya 2009 687.258 14.2% 75.2% 2.8% 2.2% 0.0% 5.5%
Lesotho 2007 53.737 37.2% 16.0% 16.1% 16.3% 3.9% 10.5%
Lesotho 2008 81.315 56.9% 18.5% 8.9% 5.0% 0.1% 10.6%
Madagascar 2008 11.954 45.3% 36.2% 0.5% 18.1% 0.0% 0.0%
Malawi 2008 106.722 1.8% 19.9% 65.1% 3.2% 1.6% 8.4%
Malawi 2009 103.907 1.4% 26.4% 54.7% 2.5% 6.0% 8.9%
Mali 2007 40.800 12.5% 19.2% 30.6% 31.3% 6.1% 0.3%
Mali 2008 40.390 10.9% 16.3% 25.9% 37.6% 8.8% 0.5%
Mozambique 2007 104.542 5.7% 68.0% 5.0% 8.5% 1.0% 11.8%
Mozambique 2008 144.946 3.5% 70.0% 2.8% 8.0% 5.9% 9.8%
Niger 2007 14.522 4.4% 10.0% 24.2% 37.5% 23.2% 0.7%
Niger 2008 12.457 4.5% 12.6% 25.5% 40.1% 5.6% 11.8%
Nigeria 2007 299.242 14.7% 65.9% 6.6% 3.1% 9.8% 0.0%
Nigeria 2008 394.664 7.6% 80.8% 6.9% 1.5% 3.1% 0.0%
Rwanda 2007 74.565 8.2% 62.7% 15.1% 4.3% 3.8% 5.9%
Rwanda 2008 110.812 5.5% 58.1% 24.3% 2.5% 2.9% 6.7%
Sao Tome and Principe 2007 0.098 47.5% 0.0% 0.0% 0.0% 23.0% 29.5%
Sao Tome and Principe 2008 0.093 45.8% 0.0% 0.0% 0.0% 19.5% 34.7%
Sao Tome and Principe 2009 1.065 3.6% 0.0% 60.5% 31.9% 0.4% 3.5%
Senegal 2008 25.570 25.0% 40.7% 30.4% 3.9% 0.0% 0.0%
Seychelles 2007 0.479 96.1% 0.0% 0.0% 3.9% 0.0% 0.0%
Seychelles 2008 0.573 83.9% 0.0% 0.0% 12.1% 2.0% 1.9%
Seychelles 2009 0.575 80.4% 4.3% 0.0% 15.3% 0.0% 0.0%
Sierra Leone 2007 9.173 2.2% 15.0% 24.6% 20.1% 34.7% 3.3%

237
A2
Annex 2: Country progress indicators and data, 2004 to 2010 | 2010 GLOBAL REPORT
Orphans and vulnerable children
Other HIV expenditures
Prevention Care and Treatment Programme Support
Monitoring and
evaluation
Planning, coordination
and programme
management
Total for programme
management and admin-
istration strengthen-
ing
Total for prevention
Male and female
condom social marketing and
public and commercial
sector provision
Communica-tion for social and behav-ioral change
Prevention of mother to child
transmission
Voluntary counseling and testing
Total for care and treatment
Programmes for sex workers
and their clients for
MSM and for harm reduction
for IDUs
Antiretroviral therapy
TOTAL HIV EXPENDITURES ON SELECTED SERVICES (MILLION CURRENT USD DOLLARS)
3.787 0.091 0.455 0.009 1.015 0.287 1.145 0.422 0.956 2.586 1.764 0.083 0.968
4.118 0.008 0.243 0.080 0.961 0.217 0.332 NA/NR 2.044 3.694 2.119 0.280 1.440
2.826 0.078 0.441 0.032 0.374 0.412 8.557 6.038 0.874 3.953 1.422 0.371 1.184
18.448 0.925 1.118 1.698 5.043 1.005 28.610 NA/NR 1.962 15.310 8.249 1.007 2.681
19.417 1.726 1.477 2.011 4.966 0.239 17.631 NA/NR 1.631 18.411 9.406 0.675 4.922
18.115 0.801 1.730 0.291 2.978 1.727 25.521 NA/NR 4.703 28.544 21.112 1.600 9.082
0.013 0.006 NA/NR NA/NR NA/NR 0.003 0.007 NA/NR NA/NR 1.169 0.197 0.003 0.120
0.329 0.117 0.001 NA/NR 0.017 0.084 0.228 0.178 0.046 2.029 0.683 0.078 0.195
0.258 0.060 NA/NR NA/NR 0.022 0.078 0.231 0.213 NA/NR 2.190 1.165 NA/NR 0.117
3.574 0.340 0.459 NA/NR 0.200 0.061 3.943 0.408 1.384 3.200 0.257 0.588 2.356
3.641 0.680 NA/NR NA/NR 0.273 0.118 4.130 NA/NR 1.155 2.464 NA/NR 0.136 2.270
3.728 0.055 0.198 0.042 0.235 0.006 3.333 2.214 0.344 2.494 0.784 0.301 0.573
4.542 NA/NR NA/NR 0.032 0.065 NA/NR 2.524 1.819 0.117 4.358 0.290 0.165 0.310
4.488 0.045 NA/NR 0.022 0.080 0.010 3.898 3.196 0.110 3.478 0.173 0.065 0.289
0.700 0.209 0.085 NA/NR NA/NR 0.106 0.651 0.163 0.265 2.046 0.227 0.434 1.231
0.563 0.067 0.124 NA/NR NA/NR 0.183 1.019 0.225 0.227 2.048 0.170 0.374 1.129
6.336 1.742 0.339 0.577 1.190 NA/NR 21.026 6.119 0.153 18.466 2.292 0.482 6.327
8.307 2.596 2.303 0.080 0.043 0.514 9.554 NA/NR 0.422 11.562 2.823 1.091 8.083
3.675 NA/NR NA/NR NA/NR NA/NR NA/NR 1.820 NA/NR 0.020 1.322 NA/NR NA/NR 0.565
4.087 NA/NR NA/NR NA/NR NA/NR NA/NR 2.875 NA/NR 0.001 4.965 NA/NR NA/NR 1.256
2.650 NA/NR NA/NR NA/NR NA/NR NA/NR 5.626 NA/NR 0.192 1.063 NA/NR NA/NR 0.700
1.238 0.577 0.274 0.000 0.041 0.196 1.009 0.801 0.052 0.944 0.712 0.004 0.406
1.001 0.389 0.042 0.176 0.017 0.224 1.495 1.140 0.109 1.949 1.753 0.019 0.701
87.310 13.472 30.670 0.581 4.075 15.043 257.239 147.934 31.067 36.432 23.880 0.000 6.533
158.619 45.742 32.005 0.500 4.758 29.333 379.551 226.436 50.887 67.159 39.811 0.061 3.650
181.152 39.484 41.119 0.500 6.246 29.847 376.273 207.071 55.427 68.239 39.060 0.061 6.167
4.802 0.246 1.848 NA/NR 0.473 1.377 25.393 17.211 4.699 7.918 5.007 0.612 10.924
9.869 0.409 1.694 NA/NR 0.531 4.125 41.210 9.995 10.839 14.968 3.979 0.868 4.429
5.003 1.179 0.151 0.247 1.328 0.008 0.112 NA/NR NA/NR 4.959 3.421 0.478 1.881
20.598 2.398 7.043 0.243 NA/NR 4.132 33.459 6.379 7.623 24.246 6.450 3.627 20.796
17.704 0.868 3.058 0.335 NA/NR 3.602 39.925 0.781 4.448 23.127 8.409 2.940 18.702
10.857 2.324 1.334 0.216 1.498 0.597 9.413 6.352 1.341 12.292 8.676 0.438 6.897
11.987 0.895 3.169 0.525 1.001 0.665 7.787 4.805 1.544 12.397 8.003 0.728 6.675
25.779 4.774 2.440 0.000 0.029 5.166 28.690 14.308 8.983 32.587 25.987 2.160 8.503
38.543 4.581 4.481 0.462 0.003 8.681 41.850 21.237 13.022 35.818 28.114 2.501 15.714
5.168 0.091 1.335 0.207 0.850 0.062 3.700 2.752 0.586 3.910 3.671 0.124 1.158
2.822 0.035 0.358 0.008 0.749 0.025 2.615 1.288 0.639 4.837 4.485 0.325 1.545
37.654 4.606 3.741 0.228 2.336 7.501 135.088 67.342 5.715 102.825 33.919 11.476 17.959
57.949 8.043 7.852 0.527 2.025 12.599 185.912 79.196 9.972 117.521 38.549 13.137 23.310
17.115 2.176 2.069 NA/NR 0.628 2.710 27.794 1.671 9.359 10.791 5.809 1.879 9.506
29.308 1.895 1.981 NA/NR 1.425 3.131 44.670 14.411 12.850 13.273 6.588 3.415 10.711
0.052 0.009 0.010 0.001 0.014 NA/NR NA/NR NA/NR NA/NR 0.028 0.028 NA/NR 0.019
0.044 0.004 0.014 0.003 0.015 0.001 NA/NR NA/NR NA/NR 0.026 0.026 NA/NR 0.023
0.453 0.123 0.112 0.004 0.052 0.005 0.069 0.015 0.035 0.119 0.045 NA/NR 0.389
7.148 1.028 1.766 0.645 1.773 1.100 4.373 3.699 1.478 10.460 6.733 1.304 2.112
0.029 NA/NR NA/NR NA/NR NA/NR 0.014 0.327 0.171 NA/NR 0.119 0.119 NA/NR 0.005
0.098 0.027 NA/NR 0.012 NA/NR 0.008 0.271 0.141 0.123 0.020 0.020 NA/NR 0.062
0.133 0.025 NA/NR NA/NR NA/NR 0.008 0.212 0.102 0.091 0.073 0.018 NA/NR 0.066
5.611 1.554 0.113 0.215 0.312 0.224 1.043 0.663 0.193 1.545 1.075 0.196 0.779

238 Annex 2: Country progress indicators and data, 2004 to 2010 | 2010 GLOBAL REPORT
Total reported domestic public and international expenditure million USD
Public InternationalSurvey Year
Domestic public (%)
Bilaterals (%) Global Fund (%)
UN (%) All other multilaterals
(%)
All other international sources (%)
SHARE BY FINANCING SOURCECOUNTRY REPORTS OF DOMESTIC AND INTERNATIONAL AIDS SPENDING BY SERVICE CATEGORIES AND FINANCING SOURCES
1 Antigua and Barbuda 2008 and 2009 expenditures for HIV patients’ hospitalization, ARV, and out-patient clinic visits for care and treatment are not reported.
2 Brazil sub-national spending at state, federal district and municipal level is not reported, except for acquisition of opportunistic infection drugs.
3 Bulgaria opportunistic infection treatment expenditures not reported.
4 Chilean armed forces HIV-related expenditures were not reported.
5 The country reported biannual fi gures for HIV spending. The expenditures were therefore divided in two and distributed equally over the two years.
6 India: The values reported refl ect only NACO’s (public) spending from the budgetary funds. The extra budgetary expenditures by donors and others is not refl ected in the table provided and is still under compilation and analysis in a separate study.
7 Montenegro spending includes only the budgeted activities of the GFATM project proposal.
8 Dominican Republic: Blood safety expenditures were not reported.
9 Switzerland: Only central government funding is reported.
10 Timor Leste: Original submission for 2008 was for a one and a half year period (Aug. 2007 – Dec. 2008). The current fi gure for 2008 was derived by adjusting all fi gures by 2/3.
11 Blood safety spending reported by Russia included expenditures such as equipment upgrades; some of which were not HIV related.
South Africa 2008 1,694.000 77.0% 21.3% 0.7% 0.2% 0.4% 0.4%
South Africa 2009 2,088.000 72.7% 26.3% 0.2% 0.3% 0.2% 0.3%
Swaziland 2007 49.447 39.6% NA/NR NA/NR NA/NR NA/NR NA/NR
Togo 2007 10.203 9.5% 4.1% 56.5% 10.8% 1.3% 17.7%
Togo 2008 15.368 7.0% 15.3% 47.4% 6.5% 23.7% 0.1%
Uganda 2007 270.011 2.5% 92.7% 0.0% 4.9% 0.0% 0.0%
Uganda 2008 296.650 13.0% 83.0% 0.8% 3.2% 0.0% 0.0%
Zimbabwe 2008 27.344 1.3% 34.7% 0.0% 2.4% 0.0% 61.7%
Zimbabwe 2009 39.548 19.5% 21.4% 17.1% 1.1% 0.0% 40.9%
Western and Central Europe
Belgium 2008 111.777 100.0% 0.0% 0.0% 0.0% 0.0% 0.0%
Bosnia and Herzegovina 2008 2.760 10.9% 0.0% 70.8% 12.5% 5.9% 0.0%
Bosnia and Herzegovina 2009 3.584 8.4% 0.0% 76.4% 10.8% 4.4% 0.0%
Bulgaria3 2007 6.666 50.8% 0.0% 43.4% 5.9% 0.0% 0.0%
Bulgaria3 2008 9.212 66.0% 0.6% 30.6% 2.8% 0.0% 0.0%
Bulgaria3 2009 10.702 52.7% 0.2% 44.4% 2.7% 0.0% 0.0%
Croatia 2007 8.908 99.1% 0.0% 0.0% 0.9% 0.0% 0.0%
Croatia 2008 9.957 98.3% 0.0% 0.0% 1.7% 0.0% 0.0%
Croatia 2009 10.367 98.2% 0.0% 0.0% 1.8% 0.0% 0.0%
Czech Republic 2007 56.998 97.6% 0.0% 0.0% 0.0% 0.0% 2.4%
Czech Republic 2008 64.279 98.0% 0.0% 0.0% 0.0% 0.0% 2.0%
Czech Republic 2009 69.311 96.6% 0.0% 0.0% 0.0% 0.0% 3.4%
Estonia 2008 18.373 100.0% 0.0% 0.0% 0.0% 0.0% 0.0%
Greece 2008 96.058 100.0% 0.0% 0.0% 0.0% 0.0% 0.0%
Hungary5 2007 2.275 100.0% 0.0% 0.0% 0.0% 0.0% 0.0%
Hungary 2008 3.673 100.0% 0.0% 0.0% 0.0% 0.0% 0.0%
Hungary 2009 3.496 100.0% 0.0% 0.0% 0.0% 0.0% 0.0%
Latvia 2009 2.264 94.4% 0.0% 0.0% 5.6% 0.0% 0.0%
Luxembourg 2009 7.356 NA/NR NA/NR NA/NR NA/NR NA/NR NA/NR
Montenegro7 2007 1.471 0.0% 0.0% 100.0% 0.0% 0.0% 0.0%
Montenegro7 2008 0.597 0.0% 0.0% 100.0% 0.0% 0.0% 0.0%
Montenegro7 2009 0.830 0.0% 0.0% 100.0% 0.0% 0.0% 0.0%
Poland 2007 41.202 100.0% 0.0% 0.0% 0.0% 0.0% 0.0%
Poland 2008 62.586 100.0% 0.0% 0.0% 0.0% 0.0% 0.0%
Poland 2009 55.520 100.0% 0.0% 0.0% 0.0% 0.0% 0.0%
Romania 2008 87.241 92.7% 0.0% 6.0% 0.9% 0.0% 0.5%
Romania 2009 84.256 95.1% 0.0% 3.9% 0.5% 0.0% 0.4%
Spain 2007 551.413 100.0% 0.0% 0.0% 0.0% 0.0% 0.0%
Spain 2008 916.739 100.0% 0.0% 0.0% 0.0% 0.0% 0.0%
Spain 2009 1,031.381 100.0% 0.0% 0.0% 0.0% 0.0% 0.0%
Sweden 2007 21.598 NA/NR NA/NR NA/NR NA/NR NA/NR NA/NR
Sweden 2008 22.155 NA/NR NA/NR NA/NR NA/NR NA/NR NA/NR
Sweden 2009 19.085 NA/NR NA/NR NA/NR NA/NR NA/NR NA/NR
Switzerland9 2008 14.898 100.0% 0.0% 0.0% 0.0% 0.0% 0.0%
Switzerland9 2009 14.843 100.0% 0.0% 0.0% 0.0% 0.0% 0.0%
The former Yugoslav Republic of Macedonia 2008 3.659 56.5% 0.7% 31.4% 10.8% 0.0% 0.7%
United Kingdom 2007 1,204.082 100.0% 0.0% 0.0% 0.0% 0.0% 0.0%
United Kingdom 2008 925.714 100.0% 0.0% 0.0% 0.0% 0.0% 0.0%

239
A2
Annex 2: Country progress indicators and data, 2004 to 2010 | 2010 GLOBAL REPORT
Orphans and vulnerable children
Other HIV expenditures
Prevention Care and Treatment Programme Support
Monitoring and
evaluation
Planning, coordination
and programme
management
Total for programme
management and admin-
istration strengthen-
ing
Total for prevention
Male and female
condom social marketing and
public and commercial
sector provision
Communica-tion for social and behav-ioral change
Prevention of mother to child
transmission
Voluntary counseling and testing
Total for care and treatment
Programmes for sex workers
and their clients for
MSM and for harm reduction
for IDUs
Antiretroviral therapy
TOTAL HIV EXPENDITURES ON SELECTED SERVICES (MILLION CURRENT USD DOLLARS)
NA/NR NA/NR NA/NR NA/NR NA/NR NA/NR NA/NR NA/NR NA/NR NA/NR NA/NR NA/NR NA/NR
NA/NR NA/NR NA/NR NA/NR NA/NR NA/NR NA/NR NA/NR NA/NR NA/NR NA/NR NA/NR NA/NR
8.567 3.167 2.243 NA/NR 0.713 0.344 9.384 6.244 15.027 6.933 3.136 0.879 9.535
4.245 0.483 0.114 0.146 0.671 0.216 2.074 1.480 0.189 2.727 2.131 0.197 0.969
5.887 2.005 0.614 0.139 0.378 0.246 2.496 1.011 0.805 5.130 3.289 0.566 1.049
70.370 NA/NR NA/NR NA/NR NA/NR NA/NR 114.934 NA/NR 25.749 55.450 NA/NR NA/NR 3.508
64.185 NA/NR NA/NR NA/NR NA/NR NA/NR 147.367 NA/NR 15.246 65.502 NA/NR NA/NR 4.349
NA/NR NA/NR NA/NR NA/NR NA/NR NA/NR NA/NR NA/NR NA/NR NA/NR NA/NR NA/NR NA/NR
NA/NR NA/NR NA/NR NA/NR NA/NR NA/NR NA/NR NA/NR NA/NR NA/NR NA/NR NA/NR NA/NR
6.576 0.206 NA/NR 2.426 NA/NR NA/NR 102.713 79.482 NA/NR 2.488 NA/NR 0.358 0.000
NA/NR NA/NR NA/NR NA/NR NA/NR NA/NR NA/NR NA/NR NA/NR NA/NR NA/NR NA/NR NA/NR
NA/NR NA/NR NA/NR NA/NR NA/NR NA/NR NA/NR NA/NR NA/NR NA/NR NA/NR NA/NR NA/NR
2.880 0.418 0.553 0.598 NA/NR NA/NR 2.935 2.027 NA/NR 0.349 0.122 0.139 0.501
4.711 0.214 1.265 0.832 NA/NR NA/NR 3.502 2.831 NA/NR 0.321 0.108 0.136 0.677
5.710 0.198 1.645 1.084 0.122 NA/NR 3.421 2.713 0.200 0.881 0.514 0.350 0.489
2.219 NA/NR 0.284 0.580 NA/NR NA/NR 6.531 NA/NR NA/NR 0.159 0.111 NA/NR 0.000
2.128 NA/NR 0.272 0.615 NA/NR NA/NR 7.677 NA/NR NA/NR 0.153 0.107 NA/NR 0.000
2.287 NA/NR 0.307 0.869 NA/NR NA/NR 7.562 NA/NR NA/NR 0.152 NA/NR 0.100 0.366
32.921 0.103 0.456 8.289 0.003 2.446 15.687 10.779 NA/NR 0.147 0.030 0.010 8.243
34.591 0.088 0.415 8.565 NA/NR 2.442 19.867 12.204 NA/NR 0.617 0.031 0.009 9.204
36.831 0.022 0.326 8.309 0.003 2.629 21.537 13.746 0.026 0.477 0.024 0.016 10.440
5.989 NA/NR 0.523 2.671 NA/NR 0.024 12.010 NA/NR NA/NR 0.375 NA/NR 0.212 0.000
13.969 NA/NR 0.897 NA/NR NA/NR NA/NR 81.231 79.063 NA/NR 0.781 NA/NR NA/NR 0.077
1.733 0.029 0.052 0.124 0.003 NA/NR 0.449 0.051 NA/NR 0.075 NA/NR NA/NR 0.017
2.546 0.295 0.055 0.016 0.027 0.109 0.448 0.045 NA/NR 0.531 NA/NR NA/NR 0.148
2.492 0.293 0.052 0.068 0.026 NA/NR 0.423 0.042 NA/NR 0.493 NA/NR NA/NR 0.089
0.736 NA/NR NA/NR NA/NR NA/NR NA/NR 1.494 NA/NR NA/NR 0.034 NA/NR 0.012 0.000
1.661 NA/NR NA/NR NA/NR NA/NR NA/NR 4.942 4.517 NA/NR 0.023 0.003 0.021 0.730
0.812 NA/NR 0.065 0.322 NA/NR NA/NR 0.185 NA/NR NA/NR 0.277 0.277 NA/NR 0.197
0.313 NA/NR 0.025 0.126 NA/NR NA/NR NA/NR NA/NR NA/NR 0.168 0.168 NA/NR 0.116
0.480 NA/NR 0.027 0.197 NA/NR NA/NR 0.048 NA/NR NA/NR 0.154 0.154 NA/NR 0.147
4.237 0.261 0.149 2.774 NA/NR 0.682 36.614 35.292 0.013 0.018 NA/NR 0.017 0.319
5.420 0.430 0.784 0.148 NA/NR 0.881 56.035 56.035 NA/NR 0.023 0.013 0.003 1.107
2.661 0.211 0.409 0.145 NA/NR 0.960 51.726 51.726 NA/NR 0.025 0.013 0.003 1.108
4.726 NA/NR 0.003 0.411 0.037 NA/NR 54.667 54.040 0.003 0.748 0.030 0.054 27.097
3.372 0.066 0.066 0.459 0.070 NA/NR 54.767 54.067 0.001 0.388 0.017 NA/NR 25.727
36.532 NA/NR NA/NR NA/NR NA/NR NA/NR 500.918 500.918 NA/NR NA/NR NA/NR NA/NR 13.963
40.374 NA/NR NA/NR NA/NR NA/NR NA/NR 859.361 859.361 NA/NR NA/NR NA/NR NA/NR 17.004
21.649 NA/NR NA/NR NA/NR NA/NR NA/NR 997.670 997.670 NA/NR NA/NR NA/NR NA/NR 12.063
NA/NR NA/NR NA/NR NA/NR NA/NR NA/NR NA/NR NA/NR NA/NR NA/NR NA/NR NA/NR NA/NR
NA/NR NA/NR NA/NR NA/NR NA/NR NA/NR NA/NR NA/NR NA/NR NA/NR NA/NR NA/NR NA/NR
NA/NR NA/NR NA/NR NA/NR NA/NR NA/NR NA/NR NA/NR NA/NR NA/NR NA/NR NA/NR NA/NR
4.611 2.456 NA/NR 0.996 NA/NR NA/NR NA/NR NA/NR NA/NR 1.019 0.649 0.371 9.268
4.594 2.447 NA/NR 0.993 NA/NR NA/NR NA/NR NA/NR NA/NR 1.016 0.646 0.369 9.234
2.833 0.207 0.301 1.858 0.005 NA/NR 0.172 0.154 NA/NR 0.478 0.282 0.070 0.176
46.939 NA/NR NA/NR 4.082 NA/NR NA/NR 1,106.122 NA/NR NA/NR NA/NR NA/NR NA/NR 51.020
35.714 NA/NR NA/NR 2.857 NA/NR NA/NR 857.143 NA/NR NA/NR NA/NR NA/NR NA/NR 32.857

240 Annex 2: Country progress indicators and data, 2004 to 2010 | 2010 GLOBAL REPORT
Yes/Agree No/Disagree Data not available In progress Not applicable Number SCALE: 0= low; 5 = High
National Composite Policy Index (NCPI)2010
Afghanistan
Albania
Algeria
Andorra
Angola
Antigua and Barbuda
Argentina
Armenia
Australia
Austria
Azerbaijan
Bahamas
Bahrain
Bangladesh
Barbados
Belarus
Belgium
Belize
Benin
Bhutan
Bolivia
Bosnia and Herzegovina
Botswana
Brazil
Brunei Darussalam
Bulgaria
Burkina Faso
Burundi
Cambodia
Cameroon
Canada
Cape Verde
Central African Republic
Chad
Chile
China
Colombia
Comoros
Congo, Republic of the
Costa Rica
HIV Prevention Services Implementation
Treatment Implementation
A &/ B A | B A B A A A | B A | B A | B A | B A | B A | B A | B A | B A | B A | B A | B
45332440423241443443445453335021435
2004
NC
PI S
ubm
issi
on
2006
NC
PI S
ubm
issi
on
2008
NC
PI S
ubm
issi
on
2010
NC
PI S
ubm
issi
on
Stra
teg
ic P
lan
Civ
il so
ciet
y in
volv
emnt
in p
lann
ing
NA
C
M &
E P
lan
Law
s th
at p
rote
ct M
AR
Ps/
vuln
erab
le p
op
ulat
ion
Law
s th
at p
ose
ob
stac
les
PMTC
T
Co
ndo
m p
rom
otio
n
HIV
tes
ting
and
co
unse
ling
Har
m re
duc
iton
for
IDU
Ris
k re
duc
tion
for
men
who
hav
e se
x w
ith m
en
Ris
k re
duc
tion
for
sex
wo
rker
s
Ant
iretr
ovi
ral t
hera
py
Paed
iatr
ic A
IDS
trea
tmen
t
HIV
tes
ting
and
co
unse
lling
for
TB
pat
ient
s
UNGASS Indicator 2

241
A2
Annex 2: Country progress indicators and data, 2004 to 2010 | 2010 GLOBAL REPORT
Yes/Agree No/Disagree Data not available In progress Not applicable Number SCALE: 0= low; 5 = High
National Composite Policy Index (NCPI)2010
Croatia
Cuba
Cyprus
Czech Republic
Côte d’Ivoire
Democratic People’s Republic of Korea
Democratic Republic of Congo
Denmark
Djibouti
Dominica
Dominican Republic
Ecuador
Egypt
El Salvador
Equatorial Guinea
Eritrea
Estonia
Ethiopia
Fiji
Finland
France
Gabon
Gambia
Georgia
Germany
Ghana
Greece
Grenada
Guatemala
Guinea
Guinea-Bissau
Guyana
Haiti
Honduras
Hungary
Iceland
India
Indonesia
Iran, Islamic Republic of
HIV Prevention Services Implementation
Treatment Implementation
A &/ B A | B A B A A A | B A | B A | B A | B A | B A | B A | B A | B A | B A | B A | B
4454
3
144353355244344354233443432214
2004
NC
PI S
ubm
issi
on
2006
NC
PI S
ubm
issi
on
2008
NC
PI S
ubm
issi
on
2010
NC
PI S
ubm
issi
on
Stra
teg
ic P
lan
Civ
il so
ciet
y in
volv
emnt
in p
lann
ing
NA
C
M &
E P
lan
Law
s th
at p
rote
ct M
AR
Ps/
vuln
erab
le p
op
ulat
ion
Law
s th
at p
ose
ob
stac
les
PMTC
T
Co
ndo
m p
rom
otio
n
HIV
tes
ting
and
co
unse
ling
Har
m re
duc
iton
for
IDU
Ris
k re
duc
tion
for
men
who
hav
e se
x w
ith m
en
Ris
k re
duc
tion
for
sex
wo
rker
s
Ant
iretr
ovi
ral t
hera
py
Paed
iatr
ic A
IDS
trea
tmen
t
HIV
tes
ting
and
co
unse
lling
for
TB
pat
ient
s

242 Annex 2: Country progress indicators and data, 2004 to 2010 | 2010 GLOBAL REPORT
Yes/Agree No/Disagree Data not available In progress Not applicable Number SCALE: 0= low; 5 = High
National Composite Policy Index (NCPI)2010
Iraq
Ireland
Israel
Italy
Jamaica
Japan
Jordan
Kazakhstan
Kenya
Kiribati
Kuwait
Kyrgyzstan
Lao People’s Democratic Republic
Latvia
Lebanon
Lesotho
Liberia
Libyan Arab Jamahiriya
Liechtenstein
Lithuania
Luxembourg
Macedonia, FYR
Madagascar
Malawi
Malaysia
Maldives
Mali
Malta
Marshall Islands
Mauritania
Mauritius
Mexico
Micronesia, Federated States of
Moldova
Monaco
Mongolia
Montenegro
Morocco
Mozambique
HIV Prevention Services Implementation
Treatment Implementation
A &/ B A | B A B A A A | B A | B A | B A | B A | B A | B A | B A | B A | B A | B A | B
43323334
354245544435421
44453
2004
NC
PI S
ubm
issi
on
2006
NC
PI S
ubm
issi
on
2008
NC
PI S
ubm
issi
on
2010
NC
PI S
ubm
issi
on
Stra
teg
ic P
lan
Civ
il so
ciet
y in
volv
emnt
in p
lann
ing
NA
C
M &
E P
lan
Law
s th
at p
rote
ct M
AR
Ps/
vuln
erab
le p
op
ulat
ion
Law
s th
at p
ose
ob
stac
les
PMTC
T
Co
ndo
m p
rom
otio
n
HIV
tes
ting
and
co
unse
ling
Har
m re
duc
iton
for
IDU
Ris
k re
duc
tion
for
men
who
hav
e se
x w
ith m
en
Ris
k re
duc
tion
for
sex
wo
rker
s
Ant
iretr
ovi
ral t
hera
py
Paed
iatr
ic A
IDS
trea
tmen
t
HIV
tes
ting
and
co
unse
lling
for
TB
pat
ient
s

243
A2
Annex 2: Country progress indicators and data, 2004 to 2010 | 2010 GLOBAL REPORT
Yes/Agree No/Disagree Data not available In progress Not applicable Number SCALE: 0= low; 5 = High
National Composite Policy Index (NCPI)2010
Myanmar
Namibia
Nauru
Nepal
Netherlands
New Zealand
Nicaragua
Niger
Nigeria
Paraguay
Peru
Philippines
Poland
Portugal
Qatar
Republic of Korea
Romania
Russian Federation
Rwanda
Saint Kitts and Nevis
Saint Lucia
Saint Vincent and Grenadines
Samoa
San Marino
Sao Tome and Principe
Saudi Arabia
Senegal
Serbia
Seychelles
Sierra Leone
Singapore
Slovakia
Slovenia
Solomon Islands
Somalia
South Africa
Spain
Sri Lanka
Sudan
Suriname
HIV Prevention Services Implementation
Treatment Implementation
A &/ B A | B A B A A A | B A | B A | B A | B A | B A | B A | B A | B A | B A | B A | B
34534443352333533
3
54542333423222
2004
NC
PI S
ubm
issi
on
2006
NC
PI S
ubm
issi
on
2008
NC
PI S
ubm
issi
on
2010
NC
PI S
ubm
issi
on
Stra
teg
ic P
lan
Civ
il so
ciet
y in
volv
emnt
in p
lann
ing
NA
C
M &
E P
lan
Law
s th
at p
rote
ct M
AR
Ps/
vuln
erab
le p
op
ulat
ion
Law
s th
at p
ose
ob
stac
les
PMTC
T
Co
ndo
m p
rom
otio
n
HIV
tes
ting
and
co
unse
ling
Har
m re
duc
iton
for
IDU
Ris
k re
duc
tion
for
men
who
hav
e se
x w
ith m
en
Ris
k re
duc
tion
for
sex
wo
rker
s
Ant
iretr
ovi
ral t
hera
py
Paed
iatr
ic A
IDS
trea
tmen
t
HIV
tes
ting
and
co
unse
lling
for
TB
pat
ient
s

244 Annex 2: Country progress indicators and data, 2004 to 2010 | 2010 GLOBAL REPORT
Yes/Agree No/Disagree Data not available In progress Not applicable Number SCALE: 0= low; 5 = High
National Composite Policy Index (NCPI)2010
Swaziland
Sweden
Switzerland
Syrian Arab Republic
Tajikistan
Thailand
Timor-Leste
Norway
Oman
Pakistan
Palau
Panama
Papua New Guinea
Togo
Tonga
Trinidad and Tobago
Tunisia
Turkey
Turkmenistan
Tuvalu
Uganda
Ukraine
United Arab Emirates
United Kingdom of Great Britain and Northern Ireland
United Republic of Tanzania
United States of America
Uruguay
Uzbekistan
Vanuatu
Venezuela
Viet Nam
Yemen
Zambia
Zimbabwe
HIV Prevention Services Implementation
Treatment Implementation
A &/ B A | B A B A A A | B A | B A | B A | B A | B A | B A | B A | B A | B A | B A | B
444433213354423255342
34522344
2004
NC
PI S
ubm
issi
on
2006
NC
PI S
ubm
issi
on
2008
NC
PI S
ubm
issi
on
2010
NC
PI S
ubm
issi
on
Stra
teg
ic P
lan
Civ
il so
ciet
y in
volv
emnt
in p
lann
ing
NA
C
M &
E P
lan
Law
s th
at p
rote
ct M
AR
Ps/
vuln
erab
le p
op
ulat
ion
Law
s th
at p
ose
ob
stac
les
PMTC
T
Co
ndo
m p
rom
otio
n
HIV
tes
ting
and
co
unse
ling
Har
m re
duc
iton
for
IDU
Ris
k re
duc
tion
for
men
who
hav
e se
x w
ith m
en
Ris
k re
duc
tion
for
sex
wo
rker
s
Ant
iretr
ovi
ral t
hera
py
Paed
iatr
ic A
IDS
trea
tmen
t
HIV
tes
ting
and
co
unse
lling
for
TB
pat
ient
s

245
A2
Annex 2: Country progress indicators and data, 2004 to 2010 | 2010 GLOBAL REPORT
PERCENTAGE OF DONATED BLOOD UNITS SCREENED FOR HIV IN A QUALITY-ASSURED MANNER
Afghanistan 39 52
Albania 100
Algeria 100 100
Angola 26
Antigua and Barbuda 33 100
Argentina 100 100
Armenia 100 100
Australia 100 100
Austria 100 2 100
Azerbaijan 100
Bahamas 100 100
Bahrain 100 2 100
Bangladesh 100
Barbados 100 100
Belarus 100 100
Belgium 100 100
Belize 100 100
Benin 99 99
Bhutan 50 2
Bolivia 88 69
Bosnia and Herzegovina 0 0
Botswana 100 100
Brazil 100
Brunei Darussalam 100 3
Bulgaria 100 100
Burkina Faso 66 75
Burundi 100 100
Côte d’Ivoire 100 100
Cambodia 97 100
Cameroon 100
Canada 100 100
Cape Verde 61 100
Central African Republic 76 84
Chad 100 100
China 100 100
Colombia 100 100
Comoros 100 62
Congo, Republic of the 100 100
Costa Rica 100 100
Croatia 86 100
Cuba 100 100
Cyprus 100 100
Czech Republic 100 2 100
Democratic Republic of the Congo 47 55
Denmark 100
Djibouti 100
Dominica 100 100
Dominican Republic 100 86
Ecuador 100 100
Egypt 100
El Salvador 100 100
Indicator Value Indicator Value
20071 2009
UNGASS Indicator 3

246 Annex 2: Country progress indicators and data, 2004 to 2010 | 2010 GLOBAL REPORT
Indicator Value Indicator Value
20071 2009
Equatorial Guinea 0
Eritrea 100 100
Estonia 100 100
Ethiopia 100 100
Fiji 100 100
Finland 100 100
Gabon 100 100
Georgia 0 0
Germany 100 100
Ghana 100 100
Greece 100
Grenada 91 100
Guatemala 100 75
Guinea 53 100
Guinea-Bissau 100 0
Guyana 100 100
Haiti 100 100
Honduras 46 48
Hungary 100 100
India 100 100
Indonesia 100
Iran, Islamic Republic of 100 100
Ireland 100 100
Israel 100
Jamaica 100 100
Japan 100 100
Jordan 100 100
Kazakhstan 95 100
Kenya 100 100
Kuwait 100 2 100
Kyrgyzstan 88 52
Lao People’s Democratic Republic 100 100
Latvia 100 100
Lebanon 100 100
Lesotho 100 100
Lithuania 100 100
Luxembourg 100 2 100
Madagascar 99 100
Malawi 99 100
Malaysia 100 100
Maldives 0 2 100
Mali 94 100
Malta 100 2
Marshall Islands 100 97
Mauritania 100 100
Mauritius 100 100
Mexico 100 100
Micronesia, Federated States of 100
Moldova 74 100
Monaco 94
Mongolia 72 70
Montenegro 100 0
PERCENTAGE OF DONATED BLOOD UNITS SCREENED FOR HIV IN A QUALITY-ASSURED MANNER

247
A2
Annex 2: Country progress indicators and data, 2004 to 2010 | 2010 GLOBAL REPORT
Indicator Value Indicator ValueIndicator Value Indicator Value
20071 200712009 2009
Morocco 100 100
Mozambique 36 70
Myanmar 76
Namibia 100 2 100
Nauru 100
Nepal 100 39
Netherlands 100 2 100
New Zealand 100 100
Nicaragua 90 100
Niger 100 26
Nigeria 100 100
Norway 100 2 100
Oman 0
Pakistan 87
Palau 100 100
Panama 100 100
Papua New Guinea 100 100
Paraguay 95 100
Peru 99 88
Philippines 96
Poland 100 2
Portugal 100
Qatar 100
Republic of Korea 100 2
Romania 100 100
Russian Federation 79
Rwanda 100 100
Saint Kitts and Nevis 100 100
Saint Lucia 100 100
Saint Vincent and the Grenadines 100 100
Samoa 100 2
Sao Tome and Principe 0 100
Saudi Arabia 100
Senegal 78 86
Serbia 100 49
Seychelles 100 100
Sierra Leone 100 100
Singapore 100 100
Slovakia 100
Slovenia 100 100
Solomon Islands 79
Somalia 0
South Africa 100 100
Spain 100 100
Sri Lanka 42 100
Sudan 0
Suriname 100 100
Swaziland 100 100
Sweden 100 100
Switzerland 100 100
Syrian Arab Republic 0
Tajikistan 97 100
Thailand 99 100
Timor-Leste 58 2 100
Togo 85 92
Tonga 100
Trinidad and Tobago 100 100
Tunisia 100 100
Turkey 100 100
Uganda 100 100
Ukraine 0
United Arab Emirates 100
United Kingdom of Great Britain and Northern Ireland 100 100
United Republic of Tanzania 100 36
Uruguay 100 100
Uzbekistan 82
Vanuatu 91
Venezuela 100
Zambia 100 100
Zimbabwe 100 100
1 Report date 2007, but data collection can vary from 2005-2007.2 Data provided by WHO Department of Blood Transfusion Safety.3 Data collection started before 2008.

248 Annex 2: Country progress indicators and data, 2004 to 2010 | 2010 GLOBAL REPORT
REPORTED NUMBER OF PEOPLE RECEIVING ANTIRETRO-VIRAL THERAPY, 2008b,c
MONTH AND YEAR OF REPORT
REPORTED NUMBER OF PEOPLE RECEIVING ANTIRETRO-VIRAL THERAPY, 2009b,c
MONTH AND YEAR OF REPORT
REPORTED NUMBER OF PEOPLE RECEIVING AND NEEDING ANTIRETROVIRAL THERAPY AND COVERAGE, 2008-2009. LOW- AND MIDDLE-INCOME COUNTRIESa
Afghanistan 0 Dec 08 12 Dec 09
Albania 110 Dec 08 114 Dec 09
Algeria 1 111 Dec 08 1 526 Dec 09
Angola 14 139 f Dec 08 20 640 Dec 09
Argentina 40 240 f Dec 08 42 815 Dec 09
Armenia 100 Dec 08 179 Dec 09
Azerbaijan 159 Dec 08 238 Dec 09
Bangladesh 283 Dec 08 353 Dec 09
Belarus 1 249 Dec 08 1 776 Dec 09
Belize 630 Dec 08 855 Dec 09
Benin 12 078 Dec 08 15 401 Dec 09
Bhutan 30 Dec 08 …
Bolivia (Plurinational State of) 758 f Dec 08 1 115 Dec 09
Bosnia and Herzegovina 33 Dec 08 38 Dec 09
Botswana 117 045 Dec 08 145 190 Dec 09
Brazil 194 984 f Dec 08 …
Bulgaria 251 Dec 08 327 Dec 09
Burkina Faso 21 103 Dec 08 26 448 Dec 09
Burundi 14 343 Dec 08 17 661 Dec 09
Cambodia 31 999 Dec 08 37 315 Dec 09
Cameroon 59 960 Dec 08 76 228 Dec 09
Cape Verde 360 Dec 08 611 Dec 09
Central African Republic 10 551 f Dec 08 14 474 Dec 09
Chad 17 900 f Oct 08 32 288 Dec 09
Chile 10 904 f Dec 08 12 762 Dec 09
China 48 254 Dec 08 65 481 Dec 09
Colombia 17 551 f Dec 08 16 302 Dec 09
Comoros 8 Dec 08 12 Dec 09
Congo 9 400 Dec 08 7 998 Dec 09
Cook Islands 1 Dec 08 …
Costa Rica 2 886 f Dec 08 3 064 Dec 09
Côte d’Ivoire 51 820 f Dec 08 72 011 Dec 09
Croatia 398 Dec 08 441 Dec 09
Cuba 3 999 Dec 08 5 034 Dec 09
Democratic People’s Republic of Korea 0 Dec 06 …
Democratic Republic of the Congo 24 645 f Dec 08 34 967 Dec 09
Djibouti 816 Dec 08 913 Dec 09
Dominica 36 f Dec 08 38 Dec 09
Dominican Republic 11 072 f Dec 08 13 785 Dec 09
Ecuador 3 728 Dec 08 5 538 Dec 09
Egypt 291 Dec 08 359 Dec 09
El Salvador 7 104 Dec 08 8 348 Dec 09
Equatorial Guinea 839 Dec 08 1 645 Dec 09
Eritrea 4 299 f Dec 08 4 955 Dec 09
Ethiopia 132 379 Dec 08 176 632 Dec 09
Fiji 39 Dec 08 52 Nov 09
Gabon 7 773 Dec 08 9 976 Dec 09
Gambia 770 Dec 08 921 Sep 09
Georgia 498 Dec 08 655 Dec 09
Ghana 21 548 f Dec 08 30 265 Dec 09 UNGASS Indicator 4MDG 6b indicator

249
A2
Annex 2: Country progress indicators and data, 2004 to 2010 | 2010 GLOBAL REPORT
Estimate Estimate Estimate EstimateLow estimate
Low estimate
Low estimate
Low estimate
High estimate
High estimate
High estimate
High estimate
ESTIMATED NUMBER OF PEOPLE NEEDING ANTIRETROVIRAL THERAPY BASED ON COUNTRY REPORT, 2009d
ESTIMATED NUMBER OF PEOPLE NEEDING ANTIRETROVIRAL THERAPY BASED ON WHO 2010 GUIDELINES, 2009b,d
ESTIMATED ANTIRETROVIRAL THERAPY COVERAGE BASED ON WHO 2010 GUIDELINES, 2009b
ESTIMATED NUMBER OF PEOPLE NEEDING ANTIRETROVIRAL THERAPY BASED ON WHO 2006 GUIDELINES, 2009b,d
ESTIMATED ANTIRETROVIRAL THERAPY COVERAGE BASED ON WHO 2006 GUIDELINES, 2009b,e
… … … … …
… … … … …
6 000 4 500 8 000 25% 19% 34% 3 700 2 700 4 900 42% 31% 56% …
86 000 65 000 110 000 24% 19% 32% 59 000 43 000 79 000 35% 26% 48% 84 250
61 000 42 000 74 000 70% 58% >95% 50 000 37 000 58 000 86% 74% >95% …
<1 000 <1 000 <1 000 24% 20% 29% <500 <500 <1 000 39% 32% 47% 352
1 100 <1 000 1 400 21% 16% 29% <1 000 <500 <1 000 36% 26% 51% 418
1 500 <1 000 2 000 23% 17% 39% <1 000 <500 1 200 40% 28% 71% 740
6 000 4 700 7 800 29% 23% 37% 3 700 3 000 4 500 48% 40% 59% 2 852
2 100 1 800 2 500 40% 34% 47% 1 500 1 200 1 800 57% 49% 69% 1 394
29 000 24 000 34 000 53% 45% 64% 21 000 17 000 26 000 72% 59% 88% 20 396
<500 <200 <500 14% 10% 29% <200 <100 <200 26% 16% 53% …
6 000 4 700 7 600 19% 15% 24% 3 900 3 100 5 000 28% 22% 36% 5 050
… … … … 50
170 000 150 000 190 000 83% 77% >95% 140 000 120 000 150 000 >95% 94% >95% 161 706
…g 220 000 390 000 … 50% 89% …g 190 000 300 000 … 65% 101% …
1 400 1 100 1 800 23% 18% 30% <1 000 <1 000 1 100 38% 29% 50% …
58 000 46 000 71 000 46% 37% 58% 44 000 34 000 55 000 60% 48% 77% 56 241
91 000 79 000 100 000 19% 17% 22% 65 000 53 000 78 000 27% 23% 33% 57 438
40 000 28 000 55 000 94% 68% >95% 33 000 24 000 44 000 >95% 86% >95% 40 483
270 000 230 000 310 000 28% 25% 33% 190 000 150 000 220 000 41% 34% 51% 164 070
… … … … …
74 000 64 000 85 000 19% 17% 23% 51 000 41 000 61 000 28% 24% 35% 40 334
90 000 73 000 110 000 36% 30% 44% 61 000 47 000 79 000 53% 41% 68% 66 000
20 000 17 000 24 000 63% 53% 76% 16 000 12 000 19 000 81% 68% >95% 15 520
…h 170 000 350 000 … 19% 38% …h 97 000 210 000 … 31% 67% 190 000
95 000 79 000 120 000 17% 14% 21% 63 000 53 000 75 000 26% 22% 31% 22 924
<100 <100 <100 18% 13% 24% <100 <100 <100 29% 21% 40% 12
35 000 30 000 41 000 23% 19% 27% 25 000 20 000 30 000 33% 26% 41% …
… … … … …
4 500 3 100 6 100 68% 50% >95% 3 500 2 500 4 800 86% 64% >95% …
260 000 220 000 300 000 28% 24% 32% 180 000 150 000 220 000 39% 33% 47% 164 000
<1 000 <500 <1 000 80% 62% >95% <500 <500 <1 000 >95% 75% >95% …
3 500 2 900 4 100 >95% >95% >95% 2 900 2 400 3 400 >95% >95% >95% 5 034
<1 000 <1 000 <1 000 0% <500 <500 <1 000 0% …
…h 170 000 240 000 … 14% 21% …h 110 000 180 000 … 20% 32% 283 055
6 400 4 700 8 200 14% 11% 20% 4 300 3 100 5 700 21% 16% 29% 4 235
… … … … 13
29 000 25 000 34 000 47% 41% 55% 22 000 18 000 25 000 64% 55% 77% 19 410
19 000 14 000 26 000 30% 21% 40% 16 000 10 000 22 000 36% 25% 54% 13 128
3 300 1 600 3 000 11% 12% 22% 1 900 1 600 3 000 19% 12% 22% 1 500
16 000 10 000 22 000 53% 38% 84% 13 000 8 100 16 000 66% 51% >95% …
6 600 4 700 8 800 25% 19% 35% 4 300 2 800 6 000 39% 27% 58% 3 108
14 000 10 000 18 000 37% 28% 49% 9 700 7 300 13 000 51% 39% 68% 7 182
…h 280 000 390 000 … 45% 62% …h 200 000 310 000 … 58% 86% 336 160
<200 <200 <500 30% 23% 40% <200 <100 <200 52% 38% 73% …
21 000 16 000 26 000 47% 38% 61% 15 000 12 000 19 000 66% 53% 86% 14 258
5 000 3 100 7 300 18% 13% 30% 3 300 2 000 5 000 28% 18% 45% 1 500
1 000 <1 000 1 300 65% 51% 91% <1 000 <500 <1 000 >95% 77% >95% 686
130 000 110 000 150 000 24% 21% 28% 85 000 69 000 100 000 36% 29% 44% 70 988

250 Annex 2: Country progress indicators and data, 2004 to 2010 | 2010 GLOBAL REPORT
REPORTED NUMBER OF PEOPLE RECEIVING ANTIRETRO-VIRAL THERAPY, 2008b,c
MONTH AND YEAR OF REPORT
REPORTED NUMBER OF PEOPLE RECEIVING ANTIRETRO-VIRAL THERAPY, 2009b,c
MONTH AND YEAR OF REPORT
REPORTED NUMBER OF PEOPLE RECEIVING AND NEEDING ANTIRETROVIRAL THERAPY AND COVERAGE, 2008-2009. LOW- AND MIDDLE-INCOME COUNTRIESa
Grenada 46 f Dec 08 54 Dec 09
Guatemala 9 694 Dec 08 10 362 Dec 09
Guinea 9 212 Dec 08 14 999 Dec 09
Guinea-Bissau 1 832 f Dec 08 2 764 Dec 09
Guyana 2 473 Dec 08 2 832 Dec 09
Haiti 19 990 f Dec 08 26 007 Dec 09
Honduras 6 288 Dec 08 7 075 Dec 09
Hungary 559 f Dec 08 547 Dec 09
India 234 581 i Dec 08 320 074 i Dec 09
Indonesia 10 606 f Dec 08 15 442 Nov 09
Iran (Islamic Republic of) 878 Sep 08 1 486 Jan 10
Iraq 4 Dec 08 …
Jamaica 4 444 f Dec 08 7 244 Dec 09
Jordan 58 Dec 08 63 Dec 09
Kazakhstan 707 Dec 08 1 035 Jan 10
Kenya 250 576 f Dec 08 336 980 Dec 09
Kiribati 6 Dec 08 …
Kyrgyzstan 89 Dec 08 231 Jan 10
Lao People’s Democratic Republic 1 009 Dec 08 1 345 Dec 09
Latvia 334 Dec 08 439 Dec 09
Lebanon 285 f Dec 08 354 Dec 09
Lesotho 45 262 Dec 08 61 736 Dec 09
Liberia 2 017 f Dec 08 2 970 Dec 09
Libyan Arab Jamahiriya 1 000 Dec 07 …
Lithuania 127 Dec 08 145 Dec 09
Madagascar 162 Dec 08 214 Dec 09
Malawi 147 497 f Dec 08 198 846 Dec 09
Malaysia 8 197 Dec 08 9 962 Mar 10
Maldives 2 Dec 08 3 Dec 09
Mali 16 475 f Dec 08 21 100 Dec 09
Marshall Islands 4 Dec 08 4 Dec 09
Mauritania 1 072 f Dec 08 1 401 Dec 09
Mauritius 491 f Jan 08 652 Dec 09
Mexico 55 599 f Dec 08 60 911 Dec 09
Micronesia (Federated States of) 2 f Dec 08 5 Dec 09
Mongolia 5 Dec 08 9 Dec 09
Montenegro 25 Dec 08 31 Mar 10
Morocco 2 207 Dec 08 2 647 Dec 09
Mozambique 128 330 Dec 08 170 198 Dec 09
Myanmar 15 191 Dec 08 21 138 Dec 09
Namibia 59 376 Dec 08 70 498 Sep 09
Nauru 0 Dec 08 …
Nepal 1 992 f Jul 08 3 226 Jul 09
Nicaragua 744 f Dec 08 1 063 Dec 09
Niger 2 846 Dec 08 6 445 Dec 09
Nigeria 238 659 Dec 08 302 973 Dec 09
Niue 0 Dec 08 …
Oman 412 Dec 08 486 Dec 09
Pakistan 875 f Dec 08 1 320 Dec 09
Palau 3 Dec 08 3 Dec 09

251
A2
Annex 2: Country progress indicators and data, 2004 to 2010 | 2010 GLOBAL REPORT
Estimate Estimate Estimate EstimateLow estimate
Low estimate
Low estimate
Low estimate
High estimate
High estimate
High estimate
High estimate
ESTIMATED NUMBER OF PEOPLE NEEDING ANTIRETROVIRAL THERAPY BASED ON COUNTRY REPORT, 2009d
ESTIMATED NUMBER OF PEOPLE NEEDING ANTIRETROVIRAL THERAPY BASED ON WHO 2010 GUIDELINES, 2009b,d
ESTIMATED ANTIRETROVIRAL THERAPY COVERAGE BASED ON WHO 2010 GUIDELINES, 2009b
ESTIMATED NUMBER OF PEOPLE NEEDING ANTIRETROVIRAL THERAPY BASED ON WHO 2006 GUIDELINES, 2009b,d
ESTIMATED ANTIRETROVIRAL THERAPY COVERAGE BASED ON WHO 2006 GUIDELINES, 2009b,e
… … … … 59
24 000 18 000 31 000 44% 33% 59% 16 000 12 000 21 000 63% 48% 84% 14 966
38 000 30 000 46 000 40% 32% 50% 27 000 20 000 35 000 56% 43% 74% 22 500
9 100 7 300 11 000 30% 25% 38% 6 000 4 700 7 600 46% 36% 59% 5 885
2 900 1 700 4 200 >95% 68% >95% 2 700 1 700 3 700 >95% 76% >95% 3 390
60 000 49 000 71 000 43% 37% 53% 43 000 34 000 52 000 61% 50% 76% 38 491
21 000 16 000 27 000 33% 26% 44% 15 000 12 000 18 000 47% 38% 61% 13 356
2 100 1 600 2 600 27% 21% 34% 1 600 1 200 2 000 35% 28% 44% …
1 200 000 1 100 000 1 400 000 26% 23% 28% 790 000 700 000 890 000 41% 36% 46% 580 000
73 000 50 000 110 000 21% 14% 31% 45 000 26 000 64 000 34% 24% 58% 40 200
40 000 33 000 48 000 4% 3% 4% 23 000 18 000 29 000 6% 5% 8% 16 540
… … … … …
16 000 12 000 20 000 46% 36% 62% 11 000 8 500 13 000 67% 55% 85% 14 000
… … … … …
3 800 2 600 5 400 27% 19% 40% 2 300 1 600 3 300 45% 31% 66% 1 900
710 000 610 000 800 000 48% 42% 55% 520 000 430 000 610 000 65% 55% 79% 555 000
… … … … …
1 900 <1 000 2 700 12% 9% 24% 1 000 <1 000 1 600 22% 15% 46% 450
2 000 1 200 2 800 67% 48% >95% 1 300 <1 000 1 900 >95% 71% >95% 1 461
3 600 2 700 4 600 12% 9% 16% 2 100 1 600 2 800 21% 16% 28% …
1 900 1 500 2 500 18% 14% 24% 1 200 <1 000 1 600 29% 22% 37% 1 171
130 000 110 000 140 000 48% 43% 54% 90 000 75 000 110 000 68% 58% 83% 122 818
22 000 17 000 27 000 14% 11% 17% 15 000 11 000 19 000 20% 15% 27% 10 023
… … … … …
<1 000 <500 <1 000 27% 21% 34% <500 <500 <500 42% 32% 52% 274
10 000 8 300 12 000 2% 2% 3% 6 000 4 900 7 600 4% 3% 4% 5 000
440 000 370 000 500 000 46% 40% 53% 310 000 260 000 370 000 63% 53% 77% 305 805
43 000 34 000 55 000 23% 18% 29% 26 000 22 000 31 000 38% 32% 44% 20 977
<100 <100 <100 17% 14% 23% <100 <100 <100 28% 22% 36% 71
42 000 34 000 51 000 50% 41% 61% 32 000 26 000 40 000 65% 53% 81% 31 410
… … … … 8
5 700 4 700 6 900 25% 20% 30% 3 500 2 800 4 300 41% 33% 51% 2 790
2 900 2 200 3 800 22% 17% 30% 1 700 1 300 2 300 38% 28% 51% 1 587
110 000 89 000 130 000 54% m 46% 68% 86 000 69 000 98 000 71% 62% 88% 74 000
… … … … 5
<200 <100 <200 8% 6% 15% <100 <100 <100 15% 10% 31% 53
… … … … 388
9 800 7 500 13 000 27% 21% 35% 6 300 4 900 8 100 42% 33% 54% 5 266
570 000 500 000 650 000 30% 26% 34% 380 000 310 000 470 000 45% 36% 55% 445 672
120 000 98 000 140 000 18% 15% 22% 75 000 60 000 89 000 28% 24% 35% 74 058
93 000 77 000 110 000 76% 62% 92% 70 000 56 000 86 000 >95% 82% >95% 76 727
… … … … …
31 000 26 000 36 000 11% 9% 13% 19 000 16 000 23 000 17% 14% 21% 16 950
2 600 2 100 3 300 40% 32% 51% 1 700 1 400 2 200 62% 49% 79% 1 580
29 000 26 000 31 000 22% 21% 25% 19 000 15 000 23 000 33% 28% 42% 16 738
1 400 000 1 200 000 1 700 000 21% 18% 25% 990 000 790 000 1 200 000 31% 25% 38% 882 139
… … … … …
<500 <500 <1 000 >95% 83% >95% <500 <200 <500 >95% >95% >95% 513
36 000 27 000 48 000 4% 3% 5% 21 000 16 000 27 000 6% 5% 8% 13 422
… … … … …

252 Annex 2: Country progress indicators and data, 2004 to 2010 | 2010 GLOBAL REPORT
REPORTED NUMBER OF PEOPLE RECEIVING ANTIRETRO-VIRAL THERAPY, 2008b,c
MONTH AND YEAR OF REPORT
REPORTED NUMBER OF PEOPLE RECEIVING ANTIRETRO-VIRAL THERAPY, 2009b,c
MONTH AND YEAR OF REPORT
REPORTED NUMBER OF PEOPLE RECEIVING AND NEEDING ANTIRETROVIRAL THERAPY AND COVERAGE, 2008-2009. LOW- AND MIDDLE-INCOME COUNTRIESa
Panama 3 972 f Dec 08 4 463 Dec 09
Papua New Guinea 5 195 Dec 08 6 751 Dec 09
Paraguay 1 613 Dec 08 2 073 Dec 09
Peru 10 232 f Dec 08 14 780 Dec 09
Philippines 532 Dec 08 750 Dec 09
Poland 3 822 Dec 08 4 329 Dec 09
Republic of Moldova 682 Dec 08 984 Dec 09
Romania 7 434 Dec 08 7 244 Dec 09
Russian Federation 54 900 Dec 08 75 900 Dec 09
Rwanda 63 149 Dec 08 76 726 Dec 09
Saint Kitts and Nevis … …
Saint Lucia 85 f Dec 08 124 Dec 09
Saint Vincent and the Grenadines 120 f Dec 08 162 Dec 09
Samoa 8 Dec 08 …
Sao Tome and Principe 109 Dec 08 169 Dec 09
Senegal 9 252 f Dec 08 12 249 Dec 09
Serbia 842 Dec 08 790 Dec 09
Seychelles 113 Dec 08 139 Dec 09
Sierra Leone 1 950 f Feb 09 3 660 Dec 09
Slovakia 97 Dec 08 …
Solomon Islands 3 f Dec 08 4 Dec 09
Somalia 413 Dec 08 578 Dec 09
South Africa 730 183 Dec 08 971 556 j Oct 09
Sri Lanka 142 f Dec 08 207 Dec 09
Sudan 1 151 k Dec 08 3 825 k Dec 09
Suriname 858 f Dec 08 996 Jul 09
Swaziland 32 701 Dec 08 47 241 Dec 09
Syrian Arab Republic 73 f Dec 08 99 Dec 09
Tajikistan 138 f Dec 08 322 Dec 09
Thailand 185 086 f Sep 08 216 118 Sep 09
The former Yugoslav Republic of Macedonia 23 Dec 08 24 Dec 09
Timor-Leste 29 Dec 08 31 Dec 09
Togo 11 211 Dec 08 16 710 Dec 09
Tonga 2 Dec 08 …
Tunisia 326 f Dec 08 412 Dec 09
Turkey 900 Dec 08 1 000 Dec 09
Turkmenistan 0 Dec 08 …
Tuvalu 1 Dec 08 1 Dec 09
Uganda 153 718 Sep 08 200 413 Sep 09
Ukraine 10 629 f Dec 08 15 871 Dec 09
United Republic of Tanzania 154 468 Dec 08 199 413 Dec 09
Uruguay … 2 510 Dec 09
Uzbekistan 1 200 Dec 08 1 753 Dec 09
Vanuatu 2 Dec 08 2 Dec 09
Venezuela (Bolivarian Republic of) 27 240 f Dec 08 32 302 Dec 09
Viet Nam 25 597 Dec 08 37 995 Dec 09
Yemen 189 Dec 08 274 Dec 09
Zambia 219 576 f Dec 08 283 863 Dec 09
Zimbabwe 148 144 f Dec 08 218 589 Feb 10

253
A2
Annex 2: Country progress indicators and data, 2004 to 2010 | 2010 GLOBAL REPORT
Estimate Estimate Estimate EstimateLow estimate
Low estimate
Low estimate
Low estimate
High estimate
High estimate
High estimate
High estimate
ESTIMATED NUMBER OF PEOPLE NEEDING ANTIRETROVIRAL THERAPY BASED ON COUNTRY REPORT, 2009d
ESTIMATED NUMBER OF PEOPLE NEEDING ANTIRETROVIRAL THERAPY BASED ON WHO 2010 GUIDELINES, 2009b,d
ESTIMATED ANTIRETROVIRAL THERAPY COVERAGE BASED ON WHO 2010 GUIDELINES, 2009b
ESTIMATED NUMBER OF PEOPLE NEEDING ANTIRETROVIRAL THERAPY BASED ON WHO 2006 GUIDELINES, 2009b,d
ESTIMATED ANTIRETROVIRAL THERAPY COVERAGE BASED ON WHO 2006 GUIDELINES, 2009b,e
12 000 8 200 22 000 37% 21% 54% 8 400 6 100 14 000 53% 32% 73% 20 836
13 000 10 000 16 000 52% 42% 65% 8 800 6 500 11 000 77% 59% >95% 9 061
5 600 4 200 7 400 37% 28% 49% 3 600 2 900 4 500 57% 46% 70% 3 066
40 000 33 000 48 000 37% 31% 44% 26 000 22 000 31 000 57% 47% 67% 20 201
2 000 1 000 2 800 37% 27% 75% 1 300 <1 000 1 800 60% 42% >95% 919
20 000 14 000 27 000 22% 16% 31% 17 000 12 000 22 000 26% 19% 35% 5 000
5 800 4 800 7 200 17% 14% 20% 3 500 2 900 4 400 28% 22% 34% 2 780
9 000 5 300 13 000 81% 55% >95% 7 700 4 700 10 000 95% 71% >95% 7 244
…h 320 000 460 000 … 16% 24% …h 180 000 280 000 … 27% 42% 79 116
88 000 71 000 100 000 88% 74% >95% 72 000 55 000 88 000 >95% 87% >95% 104 900
… … … … …
… … … … 134
… … … … 182
… … … … …
… … … … 1 096
24 000 20 000 28 000 51% 43% 62% 17 000 13 000 21 000 72% 58% 92% 16 198
2 100 1 600 2 700 38% 30% 51% 1 400 1 100 1 800 55% 44% 75% 950
… … … … 146
20 000 16 000 24 000 18% 15% 23% 13 000 9 400 16 000 29% 22% 39% 7 277
<200 <200 <500 62% 46% 86% <200 <100 <200 78% 56% >95% …
… … … … 4
10 000 7 300 13 000 6% 4% 8% 6 300 4 200 8 700 9% 7% 14% 5 213
2 600 000 2 500 000 2 800 000 37% 35% 39% 1 700 000 1 500 000 2 000 000 56% 48% 65% 1 630 000
1 100 <1 000 1 400 20% 15% 26% <1 000 <500 <1 000 33% 24% 45% 510
74 000 60 000 90 000 5% 4% 6% 46 000 34 000 61 000 8% 6% 11% 45 466
1 900 1 400 2 600 53% 39% 72% 1 300 1 000 1 700 76% 57% >95% …
80 000 71 000 88 000 59% 53% 66% 56 000 47 000 65 000 85% 72% >95% 52 965
… … … … …
3 000 2 300 3 900 11% 8% 14% 1 700 1 300 2 300 19% 14% 25% 579
350 000 280 000 440 000 61% 50% 78% 290 000 230 000 350 000 76% 62% 95% 285 271
… … … … 442
… … … … 151
58 000 44 000 73 000 29% 23% 38% 40 000 29 000 51 000 42% 33% 57% 33 030
… … … … …
<1 000 <1 000 1 000 53% 41% 72% <1 000 <500 <1 000 79% 60% >95% 470
1 600 1 200 2 100 62% 48% 84% 1 100 <1 000 1 500 90% 67% >95% 1 400
… … … … …
… … … … 1
520 000 430 000 600 000 39% 33% 46% 380 000 300 000 450 000 53% 44% 67% 373 383
160 000 140 000 190 000 10% 9% 11% 99 000 85 000 110 000 16% 14% 19% 33 016
660 000 580 000 750 000 30% 27% 34% 450 000 380 000 550 000 44% 36% 53% 361 295
5 100 4 300 6 100 49% 41% 59% 3 700 3 100 4 400 67% 57% 81% 3 018
…g … …g … 2 850
… … … … 2
…g … …g … 161 510
110 000 84 000 150 000 34% 26% 45% 85 000 67 000 110 000 45% 35% 56% 67 047
… … … … 3 150
440 000 380 000 510 000 64% 56% 75% 330 000 270 000 390 000 85% 72% >95% 416 533
640 000 580 000 720 000 34% 30% 38% 450 000 390 000 520 000 49% 42% 57% 389 895

254 Annex 2: Country progress indicators and data, 2004 to 2010 | 2010 GLOBAL REPORT
REPORTED NUMBER OF PEOPLE RECEIVING ANTIRETRO-VIRAL THERAPY, 2005-2008
MONTH AND YEAR OF REPORT
REPORTED NUMBER OF PEOPLE RECEIVING ANTIRETRO-VIRAL THERAPY, 2009
MONTH AND YEAR OF REPORT
REPORTED NUMBER OF PEOPLE RECEIVING AND NEEDING ANTIRETROVIRAL THERAPY AND COVERAGE, 2008-2009. HIGH INCOME COUNTRIESa Andorra 25 Dec 07 …
Antigua and Barbuda 148 Sep 07 98 Dec 09
Australia 9 933 Dec 07 …
Austria 2 250 Dec 08 1 800 Sep 09
Bahamas 1 244 Sep 07 1 506 Dec 09
Bahrain … …
Barbados 719 Dec 08 804 Dec 09
Belgium 6 928 Dec 07 …
Brunei Darussalam 10 Dec 08 15 Jan 10
Canada 27 000 Dec 08 …
Cyprus 151 Dec 07 187 Dec 09
Czech Republic 570 Jun 07 706 Oct 09
Denmark 3 000 Dec 08 3 000 Oct 09
Estonia 772 Dec 07 1 263 Dec 09
Finland 450 Aug 06 …
France 79 680 Dec 08 …
Germany 36 500 Dec 08 37 000 Jun 09
Greece 3 746 Dec 07 …
Iceland 100 l <05 …
Ireland 1 600 Dec 05 …
Israel 2 876 Dec 08 …
Italy 95 000 Dec 08 …
Japan 48 Dec 06 94 Mar 09
Kuwait … 131 Dec 09
Luxembourg 344 Dec 08 434 Dec 09
Malta 65 Jun 07 100 Dec 09
Monaco 45 Dec 05 …
Netherlands 7 919 Apr 07 …
New Zealand … 1 204 Jun 09
Norway 900 Dec 05 …
Portugal 12 366 Dec 08 18 107 Dec 09
Qatar … 70 Jan 09
Republic of Korea … …
San Marino … …
Saudi Arabia 865 Dec 08 …
Singapore … …
Slovenia 157 Jul 07 …
Spain 82 710 Dec 08 79 500 Dec 09
Sweden 2 800 Dec 06 4 185 Dec 09
Switzerland … …
Trinidad and Tobago 3 172 Dec 08 2 639 Dec 09
United Arab Emirates 59 Sep 07 …
United Kingdom 39 556 Dec 07 39 704 Dec 09
United States of America 268 000 l <05 …

255
A2
Annex 2: Country progress indicators and data, 2004 to 2010 | 2010 GLOBAL REPORT
… Data not available or not applicable.a Countries classifi ed by World Bank income status.b Antiretroviral therapy data by age and available.c Private sector data have been included in the total number of people on treatment, when available, but only South Africa and India have specifi ed how
many of the total number number of people on treatment received it through private facilities.d The needs estimates are based on the methods described in the explanatory notes.e The coverage estimates are based on the estimated unrounded numbers of people receiving antiretroviral therapy and the estimated unrounded need
for antiretroviral therapy (based on UNAIDS/WHO methodology). The ranges in coverage estimates are based on plausibility bounds in the denominator: that is, low and high estimates of need.
f Updated 2008 value. See last year’s annex (http://www.who.int/entity/hiv/data/tuapr2009_annex1.xls).g Estimates of the number of people needing antitretroviral therapy are currently being reviewed and will be adjusted, as appropriate, based on ongoing
data collection and analysis.h At the request of the country, only ranges in the estimates are being presented.i By December 2009, the government reported that 285 074 people were receiving antiretroviral therapy through the public sector sites. A further
estimated 35 000 people were treated in the unorganized private sector – the same fi gure as in 2008. Overall, an estimated 320 074 people were receiving antiretroviral therapy by the end of 2009, including those enrolled through private facilities.
j The number collected from public sector health facilities only is 919 923 and was provided by the Department of Health based on routine monitoring data. The majority of these facilities report people currently on treatment. The main AIDS Disease Management organisation, Aid for AIDS, reported that they had 51 633 patients on treatment in 2009, and the government estimated that this represents the majority of people on treatment in the private sector.
k Two separate reports were received for 2009 from Sudan: northern Sudan, 1996; southern Sudan, 1829. The fi gure of 1151 for 2008 applies to northern Sudan only.
l ‘<05’ indicates that data exist but no update has been received since December 2004. These data should be interpreted cautiously, as they may refl ect the situation in early 2004 or even 2003.
m The estimate of ART coverage using the denominator reported in Mexico’s 2010 UNGASS report is 82%.

256 Annex 2: Country progress indicators and data, 2004 to 2010 | 2010 GLOBAL REPORT
Month and year of report
Males % of total Females % of total
REPORTED NUMBER OF MALES AND FEMALES RECEIVING ANTIRETROVIRAL THERAPY
PEOPLE RECEIVING ANTIRETROVIRAL THERAPY IN LOW- AND MIDDLE-INCOME COUNTRIES, AND ESTIMATED CHILDREN RECEIVING AND NEEDING ANTIRETROVIRAL THERAPY, AND COVERAGE, 2009. LOW- AND MIDDLE-INCOME COUNTRIESa
Afghanistan … …
Albania … …
Algeria Dec 09 d 762 51% 739 49%
Angola Dec 08 d 2 444 31% 5 440 69%
Argentina Dec 08 d 26 791 64% 15 250 36%
Armenia Dec 09 114 64% 65 36%
Azerbaijan Dec 09 178 75% 60 25%
Bangladesh … …
Belarus Dec 09 1 032 58% 744 42%
Belize Dec 09 444 52% 411 48%
Benin Dec 09 6 468 42% 8 933 58%
Bhutan Dec 08 14 47% 16 53%
Bolivia (Plurinational State of) Dec 09 721 65% 394 35%
Bosnia and Herzegovina Dec 09 d 26 70% 11 30%
Botswana Dec 09 56 566 39% 88 624 61%
Brazil Dec 08 d 106 769 57% 79 867 43%
Bulgaria Dec 09 223 68% 104 32%
Burkina Faso Dec 09 8 609 33% 17 839 67%
Burundi Dec 09 5 869 33% 11 792 67%
Cambodia Dec 09 17 873 48% 19 442 52%
Cameroon Dec 09 25 196 33% 51 032 67%
Cape Verde Dec 09 272 45% 339 55%
Central African Republic Dec 08 e 4 321 45% 5 229 55%
Chad Dec 09 11 888 37% 20 400 63%
Chile Dec 09 10 376 81% 2 386 19%
China Dec 09 d 38 350 59% 26 659 41%
Colombia Dec 09 12 254 75% 4 043 25%
Comoros Dec 09 6 50% 6 50%
Congo Dec 08 d,e 3 565 40% 5 347 60%
Cook Islands … …
Costa Rica … …
Côte d’Ivoire Dec 09 21 603 30% 50 408 70%
Croatia Dec 09 366 83% 75 17%
Cuba Dec 09 4 027 80% 1 007 20%
Democratic People’s Republic of Korea … …
Democratic Republic of the Congo … …
Djibouti Dec 09 451 49% 462 51%
Dominica Dec 09 d 10 91% 1 9%
Dominican Republic … …
Ecuador … …
Egypt … …
El Salvador Dec 08 e 4 262 60% 2 842 40%
Equatorial Guinea Dec 08 e 235 28% 604 72%
Eritrea Dec 09 2 153 43% 2 802 57%
Ethiopia Dec 09 d 90 527 45% 111 693 55%
Fiji Nov 09 25 48% 27 52%
Gabon Dec 09 3 492 35% 6 484 65%
Gambia … …
Georgia Dec 09 468 71% 187 29%
Ghana Dec 09 d 10 477 33% 20 954 67% UNGASS Indicator 4MDG 6b indicator

257
A2
Annex 2: Country progress indicators and data, 2004 to 2010 | 2010 GLOBAL REPORT
Month and year of report
Estimate EstimateAdults (15+)
Low estimate
Low estimate
% of total High estimate
High estimate
Children (<15)
% of total
REPORTED NUMBER OF ADULTS AND CHILDREN RECEIVING ANTIRETROVIRAL THERAPY
ESTIMATED NUMBER OF CHILDREN NEED-ING ANTIRETROVIRAL THERAPY BASED ON UNAIDS/WHO METHODS, 2009b
ESTIMATED ANTIRETROVIRAL THERAPY COVERAGE AMONG CHILDREN, DECEMBER 2009c
Dec 09 12 100% 0 0% … …
Dec 09 99 87% 15 13% … …
Dec 09 1 429 94% 97 6% … <100 <500 … 36% >95%
Dec 09 19 092 93% 1 548 8% 12 000 6 300 18 000 13% 8% 25%
Dec 08 e 40 041 95% 2 000 5% … <500 <1 000 … >95% >95%
Dec 09 172 96% 7 4% … <100 <100 … 54% >95%
Dec 09 235 99% 3 1% … <100 <200 … 3% 9%
Dec 08 e 277 98% 6 2% … <100 <200 … 6% 16%
Dec 09 1 681 95% 95 5% … <100 <200 … 77% >95%
Dec 09 775 91% 80 9% … <200 <500 … 28% 66%
Dec 09 14 266 93% 1 135 7% 2 700 1 500 4 100 41% 28% 77%
Dec 08 29 97% 1 3% … <100 <100 … 8% 33%
Dec 09 1 065 96% 50 4% … <200 <1 000 … 8% 28%
Dec 09 37 97% 1 3% … …
Jan 09 136 700 94% 8 490 6% 9 400 8 200 11 000 90% 76% >95%
Dec 08 d 178 697 96% 7 939 4% … f 8 200 12 000 … 65% >95%
Dec 09 324 99% 3 1% … <100 <100 … 10% 33%
Dec 09 25 094 95% 1 354 5% 8 000 3 900 12 000 17% 11% 35%
Dec 09 16 065 91% 1 596 9% 14 000 8 500 20 000 11% 8% 19%
Dec 09 33 677 90% 3 638 10% … 2 800 6 100 … 60% >95%
Dec 09 e 73 114 96% 3 114 4% 28 000 15 000 41 000 11% 8% 20%
Dec 09 574 94% 37 6% … …
Dec 09 13 750 95% 724 5% 7 600 3 600 11 000 9% 6% 20%
Dec 09 d 31 514 98% 774 2% 12 000 6 600 19 000 6% 4% 12%
Dec 08 e 10 865 98% 186 2% … <500 <1 000 … 21% 59%
Dec 09 63 887 98% 1 594 2% … 2 100 7 600 … 21% 74%
… … … 1 000 3 400 … <1% <1%
Jan 09 11 92% 1 8% … <100 <100 … 14% 50%
Dec 08 e 8 912 95% 488 5% 4 000 2 000 5 900 12% 8% 24%
Dec 08 1 100% 0 0% … …
Dec 09 3 003 98% 61 2% … <100 <200 … 33% >95%
Dec 09 67 662 94% 4 349 6% 29 000 14 000 42 000 15% 10% 30%
Dec 09 438 99% 3 1% … <100 <100 … 30% >95%
Dec 09 5 014 100% 20 0% … <100 <100 … 22% 59%
… … … <100 <100 …
Dec 08 e 20 470 83% 4 053 17% … g 17 000 46 000 … 9% 23%
Dec 09 889 97% 24 3% <1 000 <500 <1 000 4% 2% 8%
Dec 09 37 97% 1 3% … …
Dec 08 e 10 266 93% 782 7% … <1 000 2 900 … 27% 84%
Dec 09 5 131 93% 407 7% … <500 1 000 … 39% >95%
Dec 09 332 92% 27 8% … <100 <500 … 12% 36%
Dec 09 8 048 96% 300 4% … 1 100 1 500 … 20% 28%
Dec 09 1 618 98% 27 2% <1 000 <500 1 500 3% 2% 7%
Dec 09 4 631 93% 324 7% 1 500 <1 000 2 400 21% 14% 45%
Dec 09 166 640 94% 9 992 6% … g 27 000 74 000 … 14% 38%
Nov 09 51 98% 1 2% … <100 <100 … 20% >95%
Dec 09 9 701 97% 275 3% 1 600 <1 000 2 500 17% 11% 34%
Dec 08 e 461 60% 309 40% … <500 1 300 … 25% 88%
Dec 09 627 96% 28 4% … <100 <100 … 62% >95%
Dec 09 28 648 95% 1 617 5% 13 000 6 700 20 000 12% 8% 24%

258 Annex 2: Country progress indicators and data, 2004 to 2010 | 2010 GLOBAL REPORT
Month and year of report
Males % of total Females % of total
REPORTED NUMBER OF MALES AND FEMALES RECEIVING ANTIRETROVIRAL THERAPY
PEOPLE RECEIVING ANTIRETROVIRAL THERAPY IN LOW- AND MIDDLE-INCOME COUNTRIES, AND ESTIMATED CHILDREN RECEIVING AND NEEDING ANTIRETROVIRAL THERAPY, AND COVERAGE, 2009. LOW- AND MIDDLE-INCOME COUNTRIESa
Grenada Dec 09 27 53% 24 47%
Guatemala Dec 09 5 904 57% 4 458 43%
Guinea Dec 09 5 850 39% 9 149 61%
Guinea-Bissau Dec 09 840 30% 1 924 70%
Guyana Dec 08 e 1 113 45% 1 360 55%
Haiti Dec 09 10 871 42% 15 136 58%
Honduras Dec 09 3 323 47% 3 752 53%
Hungary Dec 08 d,e 467 84% 86 16%
India Dec 09 d 168 598 59% 115 036 41%
Indonesia Dec 08 e 7 934 75% 2 682 25%
Iran (Islamic Republic of) Jan 10 1 198 81% 288 19%
Iraq Dec 08 4 100% 0 0%
Jamaica … …
Jordan Dec 08 e 44 76% 14 24%
Kazakhstan Jan 10 691 67% 344 33%
Kenya Sep 09 d,e 107 401 36% 190 429 64%
Kiribati … …
Kyrgyzstan Jan 10 158 68% 73 32%
Lao People’s Democratic Republic Dec 09 722 54% 623 46%
Latvia Dec 08 e 240 72% 94 28%
Lebanon … …
Lesotho Dec 09 22 471 36% 39 265 64%
Liberia Dec 09 1 079 1 891
Libyan Arab Jamahiriya … …
Lithuania Dec 09 113 78% 32 22%
Madagascar Dec 09 106 108
Malawi … …
Malaysia … …
Maldives Dec 09 3 100% 0 0%
Mali Dec 09 7 596 36% 13 504 64%
Marshall Islands Dec 09 1 25% 3 75%
Mauritania Dec 09 723 52% 678 48%
Mauritius … …
Mexico Dec 09 47 384 78% 13 527 22%
Micronesia (Federated States of) Dec 09 2 40% 3 60%
Mongolia Dec 09 1 11% 8 89%
Montenegro Mar 10 26 84% 5 16%
Morocco Dec 09 1 372 52% 1 275 48%
Mozambique Sep 09 d,e 43 159 37% 72 854 63%
Myanmar Dec 09 11 987 57% 9 151 43%
Namibia Sep 09 d 26 212 37% 44 365 63%
Nauru Dec 08 0 0
Nepal Jul 09 1 928 60% 1 298 40%
Nicaragua Dec 09 679 64% 384 36%
Niger Dec 09 2 836 44% 3 609 56%
Nigeria Dec 09 105 122 35% 197 851 65%
Niue Dec 08 0 0
Oman Dec 08 e 262 64% 150 36%
Pakistan Dec 09 944 72% 376 28%
Palau Dec 09 1 33% 2 67%
Panama … …

259
A2
Annex 2: Country progress indicators and data, 2004 to 2010 | 2010 GLOBAL REPORT
Month and year of report
Estimate EstimateAdults (15+)
Low estimate
Low estimate
% of total High estimate
High estimate
Children (<15)
% of total
REPORTED NUMBER OF ADULTS AND CHILDREN RECEIVING ANTIRETROVIRAL THERAPY
ESTIMATED NUMBER OF CHILDREN NEED-ING ANTIRETROVIRAL THERAPY BASED ON UNAIDS/WHO METHODS, 2009b
ESTIMATED ANTIRETROVIRAL THERAPY COVERAGE AMONG CHILDREN, DECEMBER 2009c
Dec 09 51 94% 3 6% … …
Dec 09 9 594 93% 768 7% … <1 000 2 500 … 31% 77%
Dec 09 14 325 96% 674 4% 4 400 2 100 6 900 15% 10% 32%
Dec 09 2 646 96% 118 4% 1 100 <1 000 1 700 10% 7% 21%
Dec 08 e 2 308 93% 165 7% … <200 <500 … 73% 92%
Dec 09 24 909 96% 1 098 4% 5 700 2 700 8 600 19% 13% 41%
Dec 09 6 356 90% 719 10% … <1 000 1 800 … 40% 81%
Dec 08 e 553 99% 6 1% … <100 <100 … 29% >95%
Dec 09 e 302 122 94% 17 952 6% … 30 000 76 000 … 24% 59%
Dec 08 e 10 260 97% 356 3% … <1 000 2 600 … 14% 48%
Jan 10 1 432 96% 54 4% … <500 1 300 … 4% 14%
Dec 08 4 100% 0 0% … …
Dec 09 6 808 94% 436 6% … <500 <1 000 … 52% >95%
Dec 08 e 56 97% 2 3% … …
Jan 10 844 82% 191 18% … <100 <200 … >95% >95%
Dec 09 308 610 92% 28 370 8% 89 000 48 000 130 000 32% 22% 59%
Dec 08 6 100% 0 0% … …
Jan 10 130 56% 101 44% … <100 <100 … >95% >95%
Dec 09 1 250 93% 95 7% … <100 <500 … 36% >95%
Dec 09 413 94% 26 6% … <100 <100 … 34% >95%
Dec 07 d,e … 9 … <100 <200 … 9% 28%
Dec 08 e 42 224 93% 3 038 7% 13 000 7 800 18 000 23% 17% 39%
Dec 09 e 2 704 91% 266 9% 2 900 1 400 4 500 9% 6% 19%
… … … …
Dec 09 143 99% 2 1% … <100 <100 … 20% 67%
Dec 09 209 98% 5 2% … <500 <1 000 … 1% 2%
Dec 09 181 482 91% 17 364 9% 61 000 34 000 84 000 29% 21% 51%
Dec 08 e 7 696 94% 501 6% … <1 000 <1 000 … 88% 94%
Dec 09 3 100% 0 0% … <100 <100 … 0% 0%
Dec 09 19 834 94% 1 266 6% … 2 300 7 200 … 18% 55%
Dec 09 4 100% 0 0% … …
Dec 09 1 359 97% 42 3% … <200 <500 … 9% 28%
… … … <100 <100 …
Dec 09 59 317 97% 1 594 3% … 1 300 3 200 … 50% >95%
Dec 09 5 100% 0 0% … …
Dec 09 9 100% 0 0% … <100 <100 … 0% 0%
Mar 10 30 97% 1 3% … …
Dec 09 2 502 95% 145 5% … <200 <500 … 29% >95%
Dec 09 160 805 94% 9 393 6% 66 000 36 000 93 000 14% 10% 26%
Dec 09 19 603 93% 1 535 7% … 1 900 4 900 … 32% 83%
Sep 09 62 310 88% 8 188 12% 9 200 7 300 13 000 89% 65% >95%
Dec 08 0 0 … …
Jul 09 3 048 94% 178 6% … <1 000 2 600 … 7% 23%
Dec 09 1 007 95% 56 5% … <100 <200 … 34% 79%
Dec 09 6 187 96% 258 4% … 1 800 5 900 … 4% 15%
Dec 09 284 881 94% 18 092 6% 180 000 94 000 270 000 10% 7% 19%
Dec 08 0 0 … …
Dec 09 460 95% 26 5% … <100 <100 … >95% >95%
Dec 09 1 263 96% 57 4% … <1 000 2 300 … 2% 8%
Dec 09 3 100% 0 0% … …
Dec 09 4 207 94% 256 6% … <500 <500 … 79% >95%

260 Annex 2: Country progress indicators and data, 2004 to 2010 | 2010 GLOBAL REPORT
Month and year of report
Males % of total Females % of total
REPORTED NUMBER OF MALES AND FEMALES RECEIVING ANTIRETROVIRAL THERAPY
PEOPLE RECEIVING ANTIRETROVIRAL THERAPY IN LOW- AND MIDDLE-INCOME COUNTRIES, AND ESTIMATED CHILDREN RECEIVING AND NEEDING ANTIRETROVIRAL THERAPY, AND COVERAGE, 2009 LOW- AND MIDDLE-INCOME COUNTRIESa
Papua New Guinea Dec 09 2 936 43% 3 815 57%
Paraguay Dec 08 d 1 022 69% 461 31%
Peru Dec 09 10 346 70% 4 434 30%
Philippines Dec 09 726 97% 24 3%
Poland Dec 09 3 130 72% 1 199 28%
Republic of Moldova Dec 09 571 58% 413 42%
Romania Dec 09 3 538 49% 3 706 51%
Russian Federation … …
Rwanda Dec 09 29 795 39% 46 931 61%
Saint Kitts and Nevis … …
Saint Lucia Dec 09 59 48% 65 52%
Saint Vincent and the Grenadines Dec 09 87 54% 75 46%
Samoa … …
Sao Tome and Principe Dec 09 62 37% 107 63%
Senegal Dec 09 4 427 36% 7 822 64%
Serbia Dec 09 598 76% 192 24%
Seychelles Dec 09 78 56% 61 44%
Sierra Leone Nov 08 d,e 1 542 37% 2 680 63%
Slovakia Dec 08 70 72% 27 28%
Solomon Islands Dec 09 1 25% 3 75%
Somalia … …
South Africa Oct 09 d 349 967 35% 649 939 65%
Sri Lanka Dec 09 120 58% 87 42%
Sudan Dec 09 d,h 1 141 57% 855 43%
Suriname … …
Swaziland Dec 09 17 300 37% 29 941 63%
Syrian Arab Republic Dec 09 66 67% 33 33%
Tajikistan Dec 09 218 68% 104 32%
Thailand … …
The former Yugoslav Republic of Macedonia Dec 09 18 75% 6 25%
Timor-Leste Dec 09 15 48% 16 52%
Togo Dec 09 5 307 32% 11 403 68%
Tonga … …
Tunisia Dec 09 262 64% 150 36%
Turkey … …
Turkmenistan … …
Tuvalu Dec 09 1 100% 0 0%
Uganda Sep 09 d 64 604 37% 110 763 63%
Ukraine Dec 09 8 356 53% 7 515 47%
United Republic of Tanzania Sep 09 d 70 558 36% 126 854 64%
Uruguay … …
Uzbekistan … …
Vanuatu Dec 09 0 0% 2 100%
Venezuela (Bolivarian Republic of) Dec 09 23 338 72% 8 964 28%
Viet Nam Sep 09 d,e 16 854 72% 6 558 28%
Yemen Dec 08 e 123 65% 66 35%
Zambia Dec 09 124 189 44% 159 674 56%
Zimbabwe Dec 08 d 49 701 37% 85 625 63%
… Data not available or not applicable.a Countries classifi ed by World Bank income
status.b The needs estimates are based on the
methods described in the explanatory notes to the annexes. The estimates for individual countries may differ according to the local methods used.
c The coverage estimates are based on the estimated unrounded numbers of children receiving antiretroviral therapy and the estimated unrounded need for antiretroviral therapy (based on UNAIDS/WHO methodology). The ranges in coverage estimates are based on plausibility bounds in the denominator: that is, low and high estimates of need.
d Point estimates and ranges are given for countries with a generalized epidemic, whereas only ranges are given for countries with a low or concentrated epidemic.
e The latest available breakdowns refer to partial or cumulative data sets and do not refl ect national-level data.
f The latest available breakdowns are not as recent as the latest reported national-level data.
g Estimates of the number of children needing antitretroviral therapy are currently being reviewed and will be adjusted, as appropriate, based on ongoing data collection and analysis.
h At the request of the country, only ranges in the estimates are being presented.
i Breakdowns by sex and age groups were only received for northern Sudan, therefore data should be interpreted cautiously.

261
A2
Annex 2: Country progress indicators and data, 2004 to 2010 | 2010 GLOBAL REPORT
Month and year of report
Estimate EstimateAdults (15+)
Low estimate
Low estimate
% of total High estimate
High estimate
Children (<15)
% of total
REPORTED NUMBER OF ADULTS AND CHILDREN RECEIVING ANTIRETROVIRAL THERAPY
ESTIMATED NUMBER OF CHILDREN NEED-ING ANTIRETROVIRAL THERAPY BASED ON UNAIDS/WHO METHODS, 2009b
ESTIMATED ANTIRETROVIRAL THERAPY COVERAGE AMONG CHILDREN, DECEMBER 2009c
Dec 09 6 324 94% 427 6% 1 700 <1 000 2 600 26% 17% 49%
Dec 08 e 1 483 92% 130 8% … <200 <500 … 49% >95%
Dec 09 14 263 97% 517 3% … <500 1 400 … 36% >95%
Dec 08 e 521 98% 11 2% … <100 <200 … 8% 30%
Dec 09 4 192 97% 137 3% … <100 <100 … >95% >95%
Dec 09 950 97% 34 3% … <100 <100 … 45% >95%
Dec 09 7 052 97% 192 3% … <500 <500 … 52% 71%
Dec 08 e 52 902 96% 1 998 4% … 3 400 12 000 … 17% 60%
Dec 09 70 047 91% 6 679 9% 11 000 7 000 17 000 60% 40% >95%
… … … …
Dec 09 121 98% 3 2% … …
Dec 09 159 98% 3 2% … …
… … … …
Dec 08 e 104 95% 5 5% … …
Dec 09 11 455 94% 794 6% … 1 600 4 300 … 18% 51%
Dec 09 779 99% 11 1% … <100 <100 … 55% >95%
Dec 09 130 94% 9 6% … …
Dec 09 3 423 94% 237 6% 1 700 <1 000 2 600 14% 9% 25%
Dec 08 97 100% 0 0% … <100 <100 … 0% 0%
Dec 09 4 100% 0 0% … …
Dec 08 e 404 98% 9 2% … <1 000 1 900 … 0% 1%
Oct 09 885 286 91% 86 270 9% 160 000 92 000 210 000 54% 41% 94%
Dec 09 196 95% 11 5% … <100 <100 … 34% 92%
Dec 09 d,h … 188 8 700 4 400 13 000 2% h 1% 4%
Dec 08 e 778 91% 80 9% … <100 <200 … 74% >95%
Dec 09 42 469 90% 4 772 10% 6 800 4 400 9 000 70% 53% >95%
Dec 09 91 92% 8 8% … …
Dec 09 313 97% 9 3% … <100 <200 … 5% 21%
Sep 09 208 042 96% 8 076 4% … 7 900 11 000 … 73% >95%
Dec 09 23 96% 1 4% … …
Dec 09 28 90% 3 10% … …
Dec 09 15 682 94% 1 028 6% 5 200 1 800 8 800 20% 12% 58%
Dec 08 2 100% 0 0% … …
Dec 09 400 97% 12 3% … <100 <100 … 35% 86%
Dec 07 d,e … 9 … <100 <100 … 10% 21%
… … … …
Dec 09 1 100% 0 0% … …
Sep 08 187 000 93% 13 413 7% 76 000 41 000 110 000 18% 12% 33%
Dec 09 14 151 89% 1 720 11% … 1 500 2 500 … 69% >95%
Dec 08 186 591 94% 12 822 6% 75 000 38 000 110 000 17% 11% 34%
Dec 06 2 350 94% 160 6% … <100 <200 … 81% >95%
Dec 07 d,e … 225 … f …
Dec 09 1 50% 1 50% … …
Dec 09 31 518 98% 784 2% … f …
Dec 09 36 008 95% 1 987 5% … 1 700 3 700 … 54% >95%
Dec 08 e 265 97% 9 3% … …
Dec 09 262 743 93% 21 120 7% 59 000 32 000 82 000 36% 26% 65%
Feb 10 197 068 90% 21 521 10% 71 000 43 000 95 000 30% 23% 50%

262 Annex 2: Country progress indicators and data, 2004 to 2010 | 2010 GLOBAL REPORT
Females TotalBoth sexesMales
<15 15+
2005PERCENTAGE OF ADULTS AND CHILDREN WITH HIV KNOWN TO BE ON TREATMENT 12 MONTHS AFTER INITIATION OF ANTIRETROVIRAL THERAPY1
Albania
Algeria
Angola
Antigua and Barbuda
Argentina
Armenia
Austria
Azerbaijan
Bahamas
Bangladesh
Barbados 93 94 93
Belarus
Belize
Benin
Bolivia
Bosnia and Herzegovina
Botswana 92
Brazil
Brunei Darussalam
Bulgaria
Burkina Faso
Burundi
Cambodia
Cameroon
Cape Verde
Central African Republic
Chad
Chile
China
Colombia
Comoros
Costa Rica
Côte d’Ivoire
Croatia
Cuba
Cyprus
Democratic Republic of the Congo
Djibouti
Dominica
Dominican Republic
Ecuador
Egypt
El Salvador
Equatorial Guinea
Eritrea
Ethiopia 90 86 89
Fiji
Finland
Gabon
Gambia
Georgia 85 100 88
Germany
Ghana
Greece UNGASS Indicator 24

263
A2
Annex 2: Country progress indicators and data, 2004 to 2010 | 2010 GLOBAL REPORT
Females FemalesTotal TotalBoth sexes Both sexesMales Males
<15 <1515+ 15+
2007 2009
89
98
59 62 73 61 61
53 57 55 2 78
90
80 100 84 84 77 75 77 77
90 90 90
57 43 86 86 3 72 94 77 77
68 71 90 68 70 83 98 30 97 91
90
93 96 95 95 89 89 100 88 89
74 77 97 74 75 78 79 100 77 78
76
73 87 88 98 87 88
97 96 100 97 97 81 75 75 79 79
100 3 72
82 86 85 4 91
98 99 99 99 99
67 67 67
89 93 33 97 91 91 86 90 90
77 71 77 73 73 87 80 86 82 83
77 82 77 81 80 88 91 88 90 90
94 87 88 94 87 87
96 96 97 96 96 90 93 97 92 92
93 86 100 88 89 92 88 88
85 85 89 85 85 81
38 54 14 50 47
89 94
84 91 96 85 85 81 86 86 82 82
76
40 60 0 100 100 3 100 100 100 100 100
91 94
86 91 82 90 89 67
100 88 0 97 97 89 100 89 89
96 96 100 96 96 93 98 100 94 94
11
66 72 62 70 70 77
82 78 77 77 77
100 100 100 100
89 90 90 83
95
95 74 75
85 87 95 90
70
93
70 72 8
100 78 79 96 93 83 83
90 95
50 62 63 58 58 83 88 50 87 86
92
71 86 75 71 75 5 79 87 82 81 81
77 80 78 79
90
95 96 100 95 96 97 98 100 97 97

264 Annex 2: Country progress indicators and data, 2004 to 2010 | 2010 GLOBAL REPORT
Females TotalBoth sexesMales
<15 15+
2005PERCENTAGE OF ADULTS AND CHILDREN WITH HIV KNOWN TO BE ON TREATMENT 12 MONTHS AFTER INITIATION OF ANTIRETROVIRAL THERAPY1
Grenada
Guatemala
Guinea
GuineaBissau
Guyana
Haiti
Honduras
Hungary
India
Indonesia
Iran, Islamic Republic of
Jamaica
Japan
Jordan
Kazakhstan
Kenya
Kuwait
Kyrgyzstan
Lao People’s Democratic Republic
Lebanon
Lesotho 82
Lithuania
Luxembourg
Madagascar 100
Malawi 83
Malaysia
Maldives
Mali
Marshall Islands
Mauritania
Mauritius
Mexico
Micronesia, Federated States of
Moldova
Mongolia
Montenegro
Morocco
Mozambique
Myanmar
Namibia 91 2
Nepal
New Zealand
Nicaragua
Niger
Nigeria 98 6
Oman
Pakistan
Palau
Panama
Papua New Guinea
Paraguay
Peru
Philippines

265
A2
Annex 2: Country progress indicators and data, 2004 to 2010 | 2010 GLOBAL REPORT
Females FemalesTotal TotalBoth sexes Both sexesMales Males
<15 <1515+ 15+
2007 2009
83 100 100 83 88 56 67 100 50 60
91 82 83 90 82 83
75 79 19 81 78 7
62 81 85 65 84 84
70 78 97 73 75 70 75 65 73 72
84
91 76 81 95 78 79
99 98 83 99 99 99 99 100 99 99
80 89
65 8
78 79 75 78 78 69 72 68 70 70
88 88 92
100 99 8
98 95 100 100 95 96
72 61 8 73 68 73 80 100 69 75
87 80 7
100 100 0 100 100
70 57 100 66 68 67 85 82 66 73
90 90 93 90 90 93 97 100 95 95
100 100
74 75 79 73 74 81
54 71 58 58 83 100 88 88
87 89 89 89
94 91 97 100 95 95
69 79 79 79 8
87 87
100 100 100
72 72 72 72 72 72
100 100 100 3 50 50 50 50
92 92 97 93 95 95
84 90 85 85 94 85 93 93
88 89 35 96 88
100 100 100 100
82 93 88 87 87 90 85 100 88 88
67 67 67 3 100 100 100
75 20 60 60 3 83 50 75 75 8
93 89 93 100 91 91
97
90 85 94 87 88
82 69 71 80 80 80
85 88 94 98 90 91
98 98 8
100 67
36 47 47 95 95 67 96 95
92 95 95 67 72 70 70 70
84 79 100 83 83
87
100 100 100 100 3 38
96 94 76 77
67 56 10 67 61 91 91 67 91 82
30 14 6 44 49 85
85 87 95 85 85 82 87 86
96 96 96 96 90

266 Annex 2: Country progress indicators and data, 2004 to 2010 | 2010 GLOBAL REPORT
Females TotalBoth sexesMales
<15 15+
2005PERCENTAGE OF ADULTS AND CHILDREN WITH HIV KNOWN TO BE ON TREATMENT 12 MONTHS AFTER INITIATION OF ANTIRETROVIRAL THERAPY1
Portugal
Qatar
Romania
Russian Federation
Rwanda
Saint Kitts and Nevis
Saint Lucia 80
Saint Vincent and the Grenadines
Sao Tome and Principe
Senegal
Seychelles
Sierra Leone
Slovakia
Solomon Islands
Somalia
South Africa
Sri Lanka
Sudan
Suriname
Swaziland
Sweden
Switzerland
Syrian Arab Republic
Tajikistan
Thailand
The former Yugoslav Republic of Macedonia
TimorLeste
Togo
Trinidad and Tobago
Tunisia
Turkey
Tuvalu
Uganda
Ukraine 69 75 70 100 72
United Arab Emirates
United Kingdom of Great Britain and Northern Ireland
United Republic of Tanzania
Uruguay
Uzbekistan
Venezuela
Viet Nam
Zambia
Zimbabwe
1 Data values represent 1 cohort with 12 month minimum survival, with patients lost to followup and death included in the denominator, unless otherwise noted.
2 Represents cumulative survival.3 Represents <10 persons alive and still on ART in last 12 months.5 Represents 2006.6 Represents 8 month survival.7 Represents 2007.8 Refl ects greater than 12 months survival.

267
A2
Annex 2: Country progress indicators and data, 2004 to 2010 | 2010 GLOBAL REPORT
Females FemalesTotal TotalBoth sexes Both sexesMales Males
<15 <1515+ 15+
2007 2009
84
100 100 0 100 100
93
79
91 95 8
100 100 100 100
100 97 100 98 98 100 100 100 100 100
43 80 50 63 62 90 82 100 86 86
65 82 100 74 75 100 83 88 88
79 94 89 85
62 43 100 53 55 94 94 100 93 94
81 84 84 84
89 93 90 90
100 100 100 100
72
53
64 96 86 93 93
57
80 57 63 62
63 65 65 64 64 78 77 77
99 98 100 99 99
92 84 89 89
100 100 100 100
55 61 57 57 54 71 58 58
85 85 88 85 85 78 93 90 85 85 8
43 50 44 44 3 71 100 78 78
78
90 90 90 90 90 95
9 77 86
93 90 92 100 96 96 8
26 16 3 24 23
100 100 100
88 86
73 83 91 76 78 85
99
92 84 79 89 89
65
74 87 87
84 80 81
86 80 87 84 84
93 81 82 81 84 84
87 90 92 88 88
93 72 77 75

268 Annex 2: Country progress indicators and data, 2004 to 2010 | 2010 GLOBAL REPORT
NUMBER OF PREGNANT WOMEN LIVING WITH HIV WHO RECEIVED ANTIRETROVIRALS FOR PREVENTING MOTHER-TO-CHILD TRANSMISSION
PERIODPREVENTING MOTHER-TO-CHILD TRANSMISSION OF HIV IN LOW- AND MIDDLE-INCOME COUNTRIES, 2009a
Afghanistan …
Albania …
Algeria 65 Jan 09–Dec 09
Angola 3 053 Jan 09–Dec 09
Argentina 2 039 Jan 08–Dec 08
Armenia 13 Jan 09–Dec 09
Azerbaijan 11 Jan 09–Dec 09
Bangladesh 7 Jan 08–Dec 08
Belarus 194 Jan 09–Dec 09
Belize 63 Jan 09–Dec 09
Benin 1 703 Jan 09–Dec 09
Bhutan 19 Jan 08–Dec 08
Bolivia (Plurinational State of) 105 Jan 09–Dec 09
Bosnia and Herzegovina 1 Jan 08–Dec 08
Botswana 12 406 Jan 09–Dec 09
Brazil 5 988 Jan 09–Dec 09
Bulgaria 9 Jan 09–Dec 09
Burkina Faso 2 084 Jan 09–Dec 09
Burundi 1 837 Jan 09–Dec 09
Cambodia 798 Jan 09–Dec 09
Cameroon 9 092 Jan 09–Dec 09
Cape Verde 61 Jan 09–Dec 09
Central African Republic 2 157 Jan 09–Dec 09
Chad 989 Jan 09–Dec 09
Chile 121 Jan 09–Dec 09
China 1 554 Jan 09–Dec 09
Colombia 519 Jan 09–Dec 09
Comoros 1 Jan 09–Dec 09
Congo 441 Jan 09–Dec 09
Cook Islands …
Costa Rica 31 Jan 08–Dec 08
Côte d’Ivoire 11 064 Jan 09–Dec 09
Croatia 2 Jan 09–Dec 09
Cuba 50 Jan 09–Dec 09
Democratic People’s Republic of Korea …
Democratic Republic of the Congo 2 232 Jan 09–Dec 09
Djibouti 63 Jan 09–Dec 09
Dominica 2 Jan 09–Dec 09
Dominican Republic 949 Jan 09–Dec 09
Ecuador 477 Jan 09–Dec 09
Egypt 11 Jan 09–Dec 09
El Salvador 170 Jan 08–Dec 08
Equatorial Guinea 365 Jan 09–Dec 09
Eritrea 464 Jan 09–Dec 09
Ethiopia 6 721 Jan 09–Dec 09
Fiji 5 Jan 09–Nov 09
Gabon 577 Jan 09–Dec 09
Gambia 885 Jan 09–Sep 09
Georgia 12 Jan 09–Dec 09
Ghana 3 643 Jan 09–Dec 09 UNGASS Indicator 5

269
A2
Annex 2: Country progress indicators and data, 2004 to 2010 | 2010 GLOBAL REPORT
Estimate EstimateLow estimate
Low estimate
High estimate
High estimate
ESTIMATED NUMBER OF PREGNANT WOMEN LIVING WITH HIV NEEDING ANTIRETROVIRALS FOR PREVENTING MOTHER-TO-CHILD TRANSMISSION BASED ON UNAIDS/WHO METHODSb
ESTIMATED PERCENTAGE OF PREGNANT WOMEN LIVING WITH HIV WHO RECEIVED ANTIRETROVIRALS FOR PREVENTING MOTHER-TO-CHILD TRANSMISSIONc
… …
… …
… <200 <500 … 14% 59%
16 000 8 400 25 000 19% 12% 36%
… <1 000 2 400 … 86% >95%
… <100 <100 … 65% >95%
… <100 <500 … 5% 17%
… <100 <200 … 4% 13%
… <100 <500 … >95% >95%
… <200 <500 … 22% 61%
3 700 1 900 5 800 46% 29% 92%
… <100 <100 … 95% >95%
… <200 <500 … 22% 83%
… …
13 000 6 900 17 000 >95% 74% >95%
… 3 700 12 000 … 49% >95%
… <100 <100 … 23% 82%
6 500 3 500 11 000 32% 19% 60%
15 000 8 400 21 000 12% 9% 22%
… <1 000 3 000 … 26% >95%
34 000 18 000 50 000 27% 18% 50%
… …
6 300 3 200 9 500 34% 23% 67%
16 000 8 300 29 000 6% 3% 12%
… <500 <1 000 … 15% 55%
… 2 600 11 000 … 14% 59%
… <1 000 3 900 … 13% 55%
… <100 <100 … 10% 33%
3 800 1 900 5 600 12% 8% 23%
… …
… <100 <200 … 17% 53%
20 000 10 000 31 000 54% 36% >95%
… <100 <100 … 15% 67%
… <100 <200 … 39% >95%
… <100 <100 …
…d 20 000 54 000 … 4% 11%
<1 000 <500 1 000 10% 6% 21%
… …
… <1 000 3 000 … 32% 95%
… <500 <1 000 … 48% >95%
… <200 <500 … 3% 10%
… <500 <1 000 … 19% 71%
1 400 <1 000 2 300 26% 16% 50%
1 400 <1 000 2 200 34% 21% 71%
…d 17 000 51 000 … 13% 40%
… <100 <100 … 28% >95%
1 900 <1 000 2 900 30% 20% 60%
… <1 000 2 000 … 43% >95%
… <100 <100 … 19% 86%
13 000 6 900 20 000 27% 18% 53%

270 Annex 2: Country progress indicators and data, 2004 to 2010 | 2010 GLOBAL REPORT
NUMBER OF PREGNANT WOMEN LIVING WITH HIV WHO RECEIVED ANTIRETROVIRALS FOR PREVENTING MOTHER-TO-CHILD TRANSMISSION
PERIODPREVENTING MOTHER-TO-CHILD TRANSMISSION OF HIV IN LOW- AND MIDDLE-INCOME COUNTRIES, 2009a
Grenada 2 Jan 09–Dec 09
Guatemala 440 Jan 09–Dec 09
Guinea 783 Jan 09–Dec 09
Guinea-Bissau 383 Jan 09–Dec 09
Guyana 183 Jan 09–Dec 09
Haiti 2 960 Jan 09–Dec 09
Honduras 255 Jan 09–Dec 09
Hungary 5 Jan 09–Dec 09
India 11 319 Jan 09–Dec 09
Indonesia 196 Jan 08–Dec 08
Iran (Islamic Republic of) 25 Mar 08–Feb 09
Iraq 0 Jan 08–Dec 08
Jamaica 379 Jan 09–Dec 09
Jordan 0 Jan 09–Dec 09
Kazakhstan 193 Jan 09–Dec 09
Kenya 58 591 Jan 09–Dec 09
Kiribati 0 Jan 08–Dec 08
Kyrgyzstan 58 Jan 09–Dec 09
Lao People’s Democratic Republic 24 Jan 09–Dec 09
Latvia 56 Jan 09–Dec 09
Lebanon …
Lesotho 8 846 Jan 09–Dec 09
Liberia 377 Jan 09–Dec 09
Libyan Arab Jamahiriya …
Lithuania 12 Jan 09–Dec 09
Madagascar 17 Jan 09–Dec 09
Malawi 33 156 Jan 09–Dec 09
Malaysia 300 Jan 09–Dec 09
Maldives 0 Jan 09–Dec 09
Mali 1 710 Jan 09–Dec 09
Marshall Islands 1 Oct 08–Sep 09
Mauritania 68 Jan 09–Dec 09
Mauritius 41 Jan 09–Dec 09
Mexico 124 Jan 09–Dec 09
Micronesia (Federated States of) …
Mongolia 1 Jan 09–Dec 09
Montenegro 0 Jan 09–Dec 09
Morocco 90 Jan 09–Dec 09
Mozambique 68 248 Jan 09–Dec 09
Myanmar 2 398 Jan 09–Dec 09
Namibia 6 744 Apr 08–Mar 09
Nauru …
Nepal 56 Jul 08–Jun 09
Nicaragua 91 Jan 09–Dec 09
Niger 1 737 Jan 09–Dec 09
Nigeria 44 723 Jan 09–Dec 09
Niue …
Oman 9 Jan 09–Dec 09
Pakistan 25 Jan 09–Dec 09
Palau …

271
A2
Annex 2: Country progress indicators and data, 2004 to 2010 | 2010 GLOBAL REPORT
Estimate EstimateLow estimate
Low estimate
High estimate
High estimate
ESTIMATED NUMBER OF PREGNANT WOMEN LIVING WITH HIV NEEDING ANTIRETROVIRALS FOR PREVENTING MOTHER-TO-CHILD TRANSMISSION BASED ON UNAIDS/WHO METHODSb
ESTIMATED PERCENTAGE OF PREGNANT WOMEN LIVING WITH HIV WHO RECEIVED ANTIRETROVIRALS FOR PREVENTING MOTHER-TO-CHILD TRANSMISSIONc
… …
… <1 000 2 900 … 15% 56%
4 600 2 300 7 200 17% 11% 34%
1 600 <1 000 2 400 24% 16% 49%
… <100 <500 … 88% >95%
5 000 2 600 7 500 60% 39% >95%
… <500 1 300 … 20% 82%
… <100 <100 … 14% 63%
… 23 000 65 000 … 17% 48%
… 1 100 4 600 … 4% 17%
… <500 1 300 … 2% 7%
… …
… <200 <1 000 … 46% >95%
… …
… <200 <1 000 … 38% >95%
81 000 41 000 120 000 73% 50% >95%
… …
… <100 <500 … 23% >95%
… <200 <500 … 5% 20%
… <100 <200 … 52% >95%
… <100 <100 …
14 000 8 400 18 000 64% 48% >95%
2 400 1 100 3 700 16% 10% 33%
… …
… <100 <100 … 92% >95%
… <500 1 100 … 1% 5%
57 000 31 000 83 000 58% 40% >95%
… <100 <1 000 … 55% >95%
… <100 <100 … 0% 0%
… 2 100 6 700 … 26% 82%
… …
… <200 <1 000 … 12% 37%
… <100 <200 … 33% >95%
… 1 500 4 500 … 3% e 9%
…
… <100 <100 … 10% 33%
… …
… <200 <1 000 … 13% 49%
97 000 53 000 130 000 70% 51% >95%
… 1 800 5 600 … 43% >95%
7 700 4 100 11 000 88% 61% >95%
… …
… <1 000 2 100 … 3% 10%
… <100 <500 … 45% >95%
… 2 300 7 000 … 25% 74%
210 000 110 000 300 000 22% 15% 42%
… …
… <100 <100 … 29% >95%
… 1 000 3 700 … 1% 2%
… …
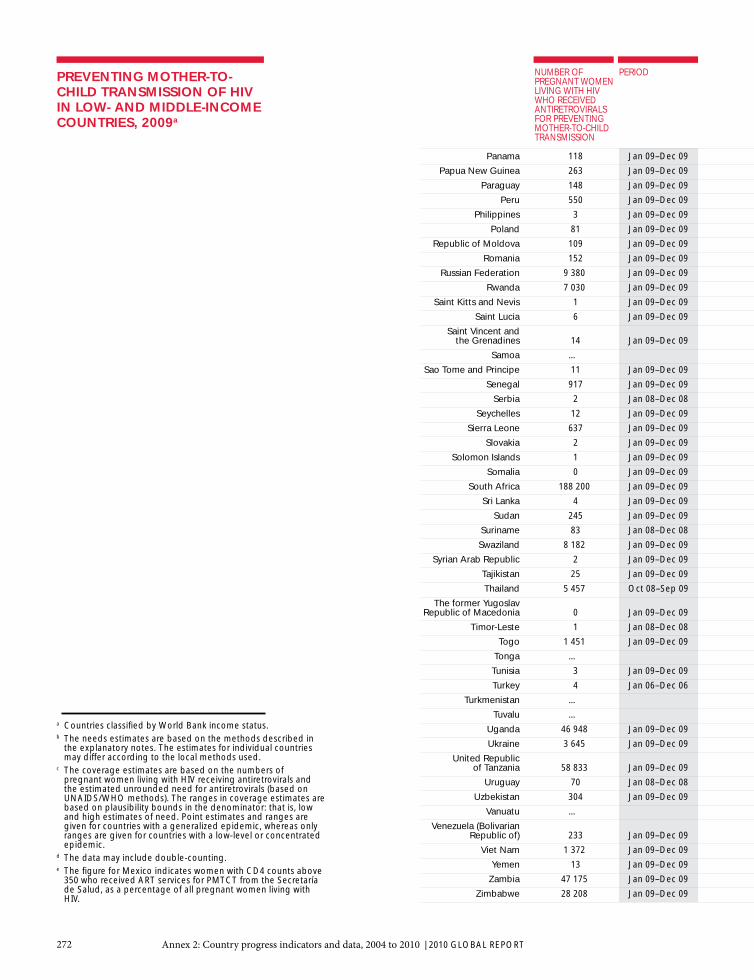
272 Annex 2: Country progress indicators and data, 2004 to 2010 | 2010 GLOBAL REPORT
NUMBER OF PREGNANT WOMEN LIVING WITH HIV WHO RECEIVED ANTIRETROVIRALS FOR PREVENTING MOTHER-TO-CHILD TRANSMISSION
PERIODPREVENTING MOTHER-TO-CHILD TRANSMISSION OF HIV IN LOW- AND MIDDLE-INCOME COUNTRIES, 2009a
Panama 118 Jan 09–Dec 09
Papua New Guinea 263 Jan 09–Dec 09
Paraguay 148 Jan 09–Dec 09
Peru 550 Jan 09–Dec 09
Philippines 3 Jan 09–Dec 09
Poland 81 Jan 09–Dec 09
Republic of Moldova 109 Jan 09–Dec 09
Romania 152 Jan 09–Dec 09
Russian Federation 9 380 Jan 09–Dec 09
Rwanda 7 030 Jan 09–Dec 09
Saint Kitts and Nevis 1 Jan 09–Dec 09
Saint Lucia 6 Jan 09–Dec 09
Saint Vincent and the Grenadines 14 Jan 09–Dec 09
Samoa …
Sao Tome and Principe 11 Jan 09–Dec 09
Senegal 917 Jan 09–Dec 09
Serbia 2 Jan 08–Dec 08
Seychelles 12 Jan 09–Dec 09
Sierra Leone 637 Jan 09–Dec 09
Slovakia 2 Jan 09–Dec 09
Solomon Islands 1 Jan 09–Dec 09
Somalia 0 Jan 09–Dec 09
South Africa 188 200 Jan 09–Dec 09
Sri Lanka 4 Jan 09–Dec 09
Sudan 245 Jan 09–Dec 09
Suriname 83 Jan 08–Dec 08
Swaziland 8 182 Jan 09–Dec 09
Syrian Arab Republic 2 Jan 09–Dec 09
Tajikistan 25 Jan 09–Dec 09
Thailand 5 457 Oct 08–Sep 09
The former Yugoslav Republic of Macedonia 0 Jan 09–Dec 09
Timor-Leste 1 Jan 08–Dec 08
Togo 1 451 Jan 09–Dec 09
Tonga …
Tunisia 3 Jan 09–Dec 09
Turkey 4 Jan 06–Dec 06
Turkmenistan …
Tuvalu …
Uganda 46 948 Jan 09–Dec 09
Ukraine 3 645 Jan 09–Dec 09
United Republic of Tanzania 58 833 Jan 09–Dec 09
Uruguay 70 Jan 08–Dec 08
Uzbekistan 304 Jan 09–Dec 09
Vanuatu …
Venezuela (Bolivarian Republic of) 233 Jan 09–Dec 09
Viet Nam 1 372 Jan 09–Dec 09
Yemen 13 Jan 09–Dec 09
Zambia 47 175 Jan 09–Dec 09
Zimbabwe 28 208 Jan 09–Dec 09
a Countries classifi ed by World Bank income status.b The needs estimates are based on the methods described in
the explanatory notes. The estimates for individual countries may differ according to the local methods used.
c The coverage estimates are based on the numbers of pregnant women living with HIV receiving antiretrovirals and the estimated unrounded need for antiretrovirals (based on UNAIDS/WHO methods). The ranges in coverage estimates are based on plausibility bounds in the denominator: that is, low and high estimates of need. Point estimates and ranges are given for countries with a generalized epidemic, whereas only ranges are given for countries with a low-level or concentrated epidemic.
d The data may include double-counting.e The fi gure for Mexico indicates women with CD4 counts above
350 who received ART services for PMTCT from the Secretaría de Salud, as a percentage of all pregnant women living with HIV.

273
A2
Annex 2: Country progress indicators and data, 2004 to 2010 | 2010 GLOBAL REPORT
Estimate EstimateLow estimate
Low estimate
High estimate
High estimate
ESTIMATED NUMBER OF PREGNANT WOMEN LIVING WITH HIV NEEDING ANTIRETROVIRALS FOR PREVENTING MOTHER-TO-CHILD TRANSMISSION BASED ON UNAIDS/WHO METHODSb
ESTIMATED PERCENTAGE OF PREGNANT WOMEN LIVING WITH HIV WHO RECEIVED ANTIRETROVIRALS FOR PREVENTING MOTHER-TO-CHILD TRANSMISSIONc
… <200 <1 000 … 19% >95%
2 000 <1 000 3 000 13% 9% 27%
… <200 <500 … 38% >95%
… <500 1 700 … 33% >95%
… <100 <500 … 1% 4%
… <100 <500 … 27% >95%
… <100 <200 … 71% >95%
… <100 <500 … 76% >95%
… 5 100 16 000 … 57% >95%
11 000 5 400 16 000 65% 43% >95%
… …
… …
… …
… …
… …
… 2 000 5 900 … 16% 45%
… <100 <100 … 3% 10%
… …
3 300 1 800 5 100 19% 12% 36%
… <100 <100 … 50% >95%
… …
… 1 000 3 700 … 0% 0%
210 000 120 000 290 000 88% 66% >95%
… <100 <100 … 9% 31%
14 000 7 300 22 000 2% 1% 3%
… <100 <200 … 82% >95%
9 300 5 700 12 000 88% 68% >95%
… …
… <100 <500 9% 36%
… 4 900 8 300 … 66% >95%
…
… …
5 600 2 200 9 400 26% 15% 67%
… …
… <100 <100 … 6% 25%
… <100 <200 … 3% 13%
… …
… …
88 000 48 000 130 000 53% 37% >95%
… 1 200 4 800 … 76% >95%
84 000 45 000 120 000 70% 48% >95%
… <100 <500 … 31% >95%
…d …
… …
…d …
… 1 700 4 700 … 29% 79%
… …
68 000 37 000 94 000 69% 50% >95%
50 000 28 000 69 000 56% 41% >95%

274 Annex 2: Country progress indicators and data, 2004 to 2010 | 2010 GLOBAL REPORT
Reported number
Estimated coverage
PREGNANT WOMEN TESTED FOR HIVMATERNAL AND INFANT HIV TESTING AND INFANT PROPHYLAXIS IN LOW- AND MIDDLE-INCOME COUNTRIESa
Afghanistan …
Albania …
Algeria …
Angola 203 463 26%
Argentina 598 123d 87%
Armenia 40 679 86%
Azerbaijan 172 153d >95%
Bangladesh 91 <1%
Belarus 150 186e >95%
Belize 6 310 85%
Benin 171 532f 49%
Bhutan …
Bolivia (Plurinational State of) 73 369 28%
Bosnia and Herzegovina 1 012 3%
Botswana 44 386h 93%
Brazil 2 381 280d 79%
Bulgaria …
Burkina Faso 310 583 42%
Burundi 113 053 40%
Cambodia 153 884 42%
Cameroon 291 473 41%
Cape Verde 8 500 71%
Central African Republic 43 775 28%
Chad 32 119 6%
Chile 144 772 57%
China 3 741 337k 20%
Colombia 353 764 39%
Comoros 1 034 5%
Congo 28 699 23%
Cook Islands …
Costa Rica …
Côte d’Ivoire 342 698 47%
Croatia …
Cuba 122 611e >95%
Democratic People’s Republic of Korea …
Democratic Republic of the Congo 253 297 9%
Djibouti 9 371 39%
Dominica 947 …
Dominican Republic 114 046 51%
Ecuador 286 211e >95%
Egypt 1 750g <1%
El Salvador 65 712 53%
Equatorial Guinea 16 228 63%
Eritrea 46 544d 25%
Ethiopia 488 554 16%
Fiji 9 041d 52%
Gabon 9 321 23%
Gambia 31 071 50%
Georgia 58 769d >95%
Ghana 388 254 51%
Supplemental data received obtained by World Health Organization through the monitoring of progress towards Universal Access in the Health Sector

275
A2
Annex 2: Country progress indicators and data, 2004 to 2010 | 2010 GLOBAL REPORT
Reported number
Reported number
Reported number
Estimated coverage
Estimated coverage
Estimated coverage
INFANTS BORN TO WOMEN LIVING WITH HIV RECEIVING ANTIRETROVI-RALS FOR PREVENTING MOTHER-TO-CHILD TRANSMISSION
INFANTS BORN TO WOMEN LIVING WITH HIV RECEIVING CO-TRIMOX-AZOLE PROPHYLAXIS WITHIN TWO MONTHS OF BIRTH
INFANTS BORN TO WOMEN LIVING WITH HIV RECEIVING A VIROLOGICAL TEST BY TWO MONTHS OF AGE
... ... …
… … …
… … …
2 435 15% 2 435 15% …
2 280d >95% 2 160d >95% …
9 75% 2 17% 0 0%
14d 11% 13d 10% 15d 12%
12 12% 16 16% …
195 >95% 148 >95% 192 >95%
51 26% … 53 27%
1 473 39% 1 473 39% …
13d >95% 7d 58% …
28g 10% 27d 10% 23d 8%
0 … 0 … 0 …
14 073i >95% 8 232j 65% …
7 511d >95% … 2 306d 32%
… … …
2 140 33% 1 815 28% 199 3%
1 332 9% 1 332 9% …
730 45% 203g 12% …
8 378 25% 8 378 25% 8 940 26%
67 … 67 … 67 …
1 380 22% 887 14% 40 1%
676 4% 676 4% …
... … …
1 701 28% … …
248 12% … 83 4%
1 17% 1 17% 0 0%
615 16% 548 15% 444 12%
... … …
38 33% 44 38% 44 38%
6 696 33% … …
… … …
0 0% 1g 1% 50 67%
... … …
2 232 6% 396 1% …
36d 6% 22 4% …
1 … 1 … 1 …
1 133 59% … 391d 20%
315 56% … 5 1%
2g 1% … 5g 3%
216 42% 176 34% …
164 11% … …
424d 31% 225d 17% …
5 025 15% 1 076 3% 1 375 4%
1d 10% 2d 20% 1d 10%
312 16% 219d 12% …
230 20% 99 8% …
19d 58% 19d 58% 19d 58%
1 730m 13% … …

276 Annex 2: Country progress indicators and data, 2004 to 2010 | 2010 GLOBAL REPORT
Reported number
Estimated coverage
PREGNANT WOMEN TESTED FOR HIV
Grenada 1 229 60%
Guatemala 102 957 23%
Guinea 39 893 10%
Guinea-Bissau 13 864o 21%
Guyana 14 283e >95%
Haiti 154 835 57%
Honduras 103 562 51%
Hungary 8 357d 8%
India 5 717 819 21%
Indonesia 10 026 <1%
Iran (Islamic Republic of) 158q <1%
Iraq 1 550d <1%
Jamaica 28 659d 55%
Jordan 0 0%
Kazakhstan 434 548e >95%
Kenya 961 990 63%
Kiribati 1 159 …
Kyrgyzstan 171 480e >95%
Lao People’s Democratic Republic 3 094 2%
Latvia 20 608 88%
Lebanon …
Lesotho 29 626 50%
Liberia 32 659 22%
Libyan Arab Jamahiriya …
Lithuania 30 057 95%
Madagascar 140 261 20%
Malawi 316 000 52%
Malaysia 403 287s 73%
Maldives 3 911 67%
Mali 86 814 16%
Marshall Islands …
Mauritania 6 371d 6%
Mauritius 15 026 83%
Mexico 757 863d 37%
Micronesia (Federated States of) …
Mongolia …
Montenegro …
Morocco 2 723d <1%
Mozambique 672 020 77%
Myanmar 182 760 18%
Namibia 51 970 88%
Nauru …
Nepal 65 791 9%
Nicaragua 81 686 58%
Niger 158 695 19%
Nigeria 820 865 13%
Niue …
Oman 30 875 50%
Pakistan 10 277 <1%
Palau …
Panama 59 334 85%
MATERNAL AND INFANT HIV TESTING AND INFANT PROPHYLAXIS IN LOW- AND MIDDLE-INCOME COUNTRIESa

277
A2
Annex 2: Country progress indicators and data, 2004 to 2010 | 2010 GLOBAL REPORT
Reported number
Reported number
Reported number
Estimated coverage
Estimated coverage
Estimated coverage
INFANTS BORN TO WOMEN LIVING WITH HIV RECEIVING ANTIRETROVI-RALS FOR PREVENTING MOTHER-TO-CHILD TRANSMISSION
INFANTS BORN TO WOMEN LIVING WITH HIV RECEIVING CO-TRIMOX-AZOLE PROPHYLAXIS WITHIN TWO MONTHS OF BIRTH
INFANTS BORN TO WOMEN LIVING WITH HIV RECEIVING A VIROLOGICAL TEST BY TWO MONTHS OF AGE
2 … 2 … 0 …
159d 9% 222d 13% …
231n 5% 801n 17% …
143d 9% … 0 0%
206 >95% 97p >95% …
… 448d 9% …
255 35% … 309 42%
5 26% 5 26% …
11 593 27% … …
165d 6% 25g 1% …
24d 3% 20d 3% 7d 1%
0d … 0d … …
605d >95% … …
0 … 0 … 0 …
198 68% 204 70% 188 64%
39 482 49% 4 043 5% …
0 … 0 … 0 …
60 51% 70 59% 0 0%
18d 7% 17d 7% …
… 52 84% …
0 0% … …
4 240 31% 1 542d 11% 4 621 33%
194 8% 45r 2% 109r 5%
... … …
12 >95% … 10 >95%
8 1% … …
23 773 41% 28 079 49% …
163 54% 163 54% 163 54%
0 0% 0 0% 0 0%
810 19% 722 17% 531 13%
... … …
15d 4% 18g 5% …
53 73% 48 66% …
58d 2% … …
... … …
1 17% 1 17% 1 17%
1g … … …
20d 5% 19d 5% 4d 1%
41 266 43% … …
1 697 46% 858 23% …
7 120 93% … …
... … …
89 7% 75 6% 10 1%
81 63% 81 63% 81 63%
708 15% 309 6% …
15 905 8% 3 927t 2% 6 101r 3%
... … …
4 21% 4 21% 4 21%
16 1% 0 0% 15 1%
... … …
154d,u 56% 62d,u 23% …

278 Annex 2: Country progress indicators and data, 2004 to 2010 | 2010 GLOBAL REPORT
Reported number
Estimated coverage
PREGNANT WOMEN TESTED FOR HIV
Papua New Guinea 43 942 21%
Paraguay 73 123 47%
Peru 599 012e >95%
Philippines …v
Poland …
Republic of Moldova 45 557e >95%
Romania 100 589 47%
Russian Federation 1 468 091d,w 95%
Rwanda 294 457 71%
Saint Kitts and Nevis …
Saint Lucia …
Saint Vincent and the Grenadines 2 635e >95%
Samoa …
Sao Tome and Principe 6 475e >95%
Senegal 166 830 35%
Serbia 5 665d 5%
Seychelles 1 650 …
Sierra Leone 99 256 44%
Slovakia …
Solomon Islands 41d <1%
Somalia 1 131 <1%
South Africa 1 099 712e >95%
Sri Lanka 13 475 4%
Sudan 33 127x 3%
Suriname 8 885d 91%
Swaziland 25 769 73%
Syrian Arab Republic 4g <1%
Tajikistan 76 297 39%
Thailand 797 047 82%
The former Yugoslav Republic of Macedonia …
Timor-Leste 71d <1%
Togo 42 101 20%
Tonga …
Tunisia …
Turkey …
Turkmenistan …
Tuvalu …
Uganda 968 157* 64%
Ukraine 555 535e >95%
United Republic of Tanzania 1 194 172 66%
Uruguay 47 428d 95%
Uzbekistan 414 346*** 74%
Vanuatu 1 499d,† 21%
Venezuela (Bolivarian Republic of) …
Viet Nam 480 814‡ 32%
Yemen 4 211 <1%
Zambia 532 484e >95%
Zimbabwe 175 223 46%
MATERNAL AND INFANT HIV TESTING AND INFANT PROPHYLAXIS IN LOW- AND MIDDLE-INCOME COUNTRIESa

279
A2
Annex 2: Country progress indicators and data, 2004 to 2010 | 2010 GLOBAL REPORT
Reported number
Reported number
Reported number
Estimated coverage
Estimated coverage
Estimated coverage
INFANTS BORN TO WOMEN LIVING WITH HIV RECEIVING ANTIRETROVI-RALS FOR PREVENTING MOTHER-TO-CHILD TRANSMISSION
INFANTS BORN TO WOMEN LIVING WITH HIV RECEIVING CO-TRIMOX-AZOLE PROPHYLAXIS WITHIN TWO MONTHS OF BIRTH
INFANTS BORN TO WOMEN LIVING WITH HIV RECEIVING A VIROLOGICAL TEST BY TWO MONTHS OF AGE
251 13% 19 1% …
148 62% 85 36% …
426 43% … …
2 1% 3 2% 2 1%
69 41% 69 41% 69 41%
118 >95% 33 37% 112 >95%
192 >95% 7 6% 192 >95%
8 744d >95% … …
6 684 62% 7 222 67% 5 646 52%
... … …
... … …
15 … 14 … 14 …
... … …
17 … 17 … …
433 11% … 339 9%
1 2% 0 0% 1 2%
7 … 7 … 0 …
518d 16% 363d 11% 0d 0%
… … …
1d … 0d …
6 0% 0 0% …
119 395d 56% 43 394 20% …
4 15% 4 15% 0 0%
56y <1% 34z <1% …
91d >95% … 9 16%
7 655 82% 9 189 >95% …
... … …
19 12% 23 15% 1g 1%
5 722 88% 2 074 32% …
… … …
1d … … …
1 508 27% 945 17% 614 11%
... … …
1 4% 0 0% 0 0%
… … …
… … …
... … …
24 554 28% … 5 607 6%
3 840 >95% 3 021 >95% 2 033 69%
43 119 51% 8 348** 10% 11 345 13%
… … …
399 … … 2 …
0d … … …
274 … … …
1 511 48% 944 30% …
10 … 8 … 0 …
26 743 39% 25 139 37% 35 824 53%
17 331 35% 13 852 28% …

280 Annex 2: Country progress indicators and data, 2004 to 2010 | 2010 GLOBAL REPORT
a Countries classifi ed by World Bank income status.b No reference b.c No reference c. d The latest reported data are to December 2008.e The reported number of pregnant women tested for HIV was higher than the estimated number of pregnant women, implying a coverage of >100%.
Last year, coverage was already >95% in these countries, thus in the regional and global analysis, data are adjusted.f Data are from 323 out of 364 maternity hospitals with PMTCT services.g The latest reported data are to December 2007.h Number of tests were reported, as tests for women who tested more than once at ANC, labour/delivery and postpartum cannot be deduplicated.i The data may include double-counting.j The data cannot specify whether data reported were for infants within two months of birth, but the policy is for all infants to start co-trimoxazole at 6
weeks of age. Data suggest that around two-thirds of infants who started cotrimoxazole, started within two months of birth.k Data are collected from 453 priority counties out of a total of 2860.l No reference l.m Data reported in 2009 is lower than reported value of 2 450 in 2008. This is due to the transition from the old regimen of single-dose nevirapine to the
new regimen of single-dose nevirapine at birth and Zidovudine and Lamivudine for 1 or 6 weeks as relevant, which were both still used in 2008. Now only the new regimen is used and is still being scaled up.
n Only partial data were collected.o Data are based on the number of pregnant women having access to antenatal clinics/maternity hospitals who know their HIV status.p Data are collected on a monthly data reporting form at 6 weeks, not at 2 months. Therefore, some infants may be lost to follow up.q The latest data reported are to August 2007.r Data may be under-reported.s Only public data were reported, which represent about 70% of total ANC cases.t Four out of ten Implementing partners reported for this indicator.u The data are from three of four paediatric care clinics.v A data value of 26 was reported. The data value was from one site only and for the period September-November 2009.w Russian Federation reported 4 827 215 pregnant women being tested for HIV. As the number of pregnant women tested likely refl ects double or triple
counting, 95% of the estimated number of births in Russia (1 545 359) was used as a proxy and most likely represents the total number of tests conducted among pregnant women.
x Two separate reports were received from Sudan: Northern Sudan reported 19 986 for the period between January-December 2009; southern Sudan reported 13 141 to November 2009, giving a total of 33 127.
y Two separate reports were received from Sudan: Northern Sudan reported 34 for the period between January-December 2009; southern Sudan reported 22 to November 2009, giving a total of 56.
z Two separate reports were received from Sudan: Northern Sudan reported 34 for the period between January-December 2009; southern Sudan reported “no data” stating that services have just been initiated and co-trimoxazole was initially not part of the supplies for PMTCT. Data for southern Sudan are expected to be ready in next reporting period.
* The data are reported for the period July 2008-July 2009.** Data are under-reported.*** In 2009, there was a substantial increase in the number of pregnant women tested for HIV, up from the last reported value of 58 063 in 2007. Previously,
only those pregnant women with risky behaviour or those who had sexual partners with risky behaviour were recommended for VCT. Now all pregnant women are now recommended for VCT; however, only 77% of pregnant women were reached through VCT by the end of 2009.
† Data were collected from Northern District Hospital, Vila Central Hospital, Leneakel Hospital, Lolowai Hospital and Norsup Hospital.‡ Data are based on total number tested and received results.
MATERNAL AND INFANT HIV TESTING AND INFANT PROPHYLAXIS IN LOW- AND MIDDLE-INCOME COUNTRIESa

281
A2
Annex 2: Country progress indicators and data, 2004 to 2010 | 2010 GLOBAL REPORT
2007 2009
% of patients treated
Adults treated
Adults treated
% of patients treated
TREATMENT FOR TB AND HIVPERCENTAGE OF ESTIMATED HIV-POSITIVE INCIDENT TB CASES THAT RECEIVED TREATMENT FOR TB AND HIV
Afghanistan 2 <1 4 1
Albania 4
Algeria 82 87 1 111 99
Angola 359 20
Argentina 415 55 250 83
Armenia 15 59 1 6
Austria 12 100
Azerbaijan 3 4 62 53
Bahamas 26 81 15 100
Barbados 2 100
Belarus 136 72 138 73
Belize 9 69
Benin 157 31 629 16
Bolivia 60 41 94 51
Bosnia and Herzegovina 25 25
Brazil 3333 26 5
Brunei Darussalam 1 50
Bulgaria 32 2 23
Burkina Faso 199 1 503 4
Burundi 594 3
Cote d’Ivoire 994 10 1633 31
Cambodia 526 5
Cameroon 117 3
Cape Verde 3 3 61 61
Central African Republic 3671 15 414 36
Chad 7560 70
China 901 13
Colombia 343 45
Comoros 0 0
Costa Rica 13 100 36 100
Croatia 3 100
Cuba 46 90 31 97
Czech Republic 3 60
Democratic Republic of the Congo 162 <1 724 5
Djibouti 170 23
Dominica 1 100 2 67
Dominican Republic 322 115 1 260 42
Ecuador 150 40
Egypt 3 2
El Salvador 63 100 37 50
Equatorial Guinea 205 11 5
Ethiopia 2658 13 4515 41
Fiji 2 40 0
Finland 0 90
Gabon 521 13 366 33
Georgia 34 71 76 67
Ghana 531
Grenada 0 2 1 100
Guatemala 109 33 342 11
Guinea 245 61 335 6
Guinea-Bissau 171 10 UNGASS Indicator 6

282 Annex 2: Country progress indicators and data, 2004 to 2010 | 2010 GLOBAL REPORT
2007 2009
% of patients treated
Adults treated
Adults treated
% of patients treated
TREATMENT FOR TB AND HIVPERCENTAGE OF ESTIMATED HIV-POSITIVE INCIDENT TB CASES THAT RECEIVED TREATMENT FOR TB AND HIV
Guyana 75 94
Haiti 61 5 2409 24
Honduras 383 71 203 33
Hungary 7 <1 3 1 100
India 19 400 23 2693 4
Indonesia 2976 3
Iran, Islamic Republic of 52 20 120 32
Jamaica 18 72
Japan 10 83 16 94
Jordan 0 0
Kazakhstan 76 33 103 43
Kenya 14116 23
Kuwait 0 0
Kyrgyzstan 177 52
Lao People’s Democratic Republic 85
Latvia 27 57 8 13
Lebanon 3 148 1
Lesotho 2235 27
Liberia 926
Lithuania 5 38 5 38
Malawi 18 910 70 4929 16
Malaysia 72 33 390 30
Malta 6 100
Marshall Islands 2 100
Mauritania 95 86 1, 4 55 6
Mauritius 3 16 7 100
Mexico 806 78 216 77
Moldova 23 10 63 39
Morocco 88 73 103 22
Mozambique 1008 4 1 5622 10
Myanmar 959 11 5
Nepal 321 46 1
New Zealand 8 100
Nicaragua 13 14 40 77
Niger 197 1 271 3
Nigeria 28 625 56 18 788 69
Oman 3 100
Panama 270 5 171 35
Papua New Guinea 320 35 127 20
Paraguay 20 14 72
Peru 93 11 529 71
Philippines 99 49 80
Poland 70 176 1
Portugal 309 100
Qatar 0
Russian Federation 463 39 1, 4 6679 40
Rwanda 1148 9
Saint Kitts and Nevis 2 100
Saint Lucia 2 50 1 100
Saint Vincent and the Grenadines 4 100 3 27
Sao Tome and Principe 0 2 10 77

283
A2
Annex 2: Country progress indicators and data, 2004 to 2010 | 2010 GLOBAL REPORT
2007 2009
% of patients treated
Adults treated
Adults treated
% of patients treated
TREATMENT FOR TB AND HIVPERCENTAGE OF ESTIMATED HIV-POSITIVE INCIDENT TB CASES THAT RECEIVED TREATMENT FOR TB AND HIV
Senegal 319 15 259 6
Seychelles 11 100 2 100
Slovakia 0 0
Slovenia 0 2
Somalia 14 2 59 3
South Africa 159 382 50 3 42 576 42
Sri Lanka 3 10
Sudan 823 8
Suriname 15 60
Sweden 57 100
Syrian Arab Republic 0
Tajikistan 6 8 52 14
Thailand 2260 23 1 4151 26
The former Yugoslav Republic of Macedonia 2 2
Togo 44 2 1 94 4
Trinidad and Tobago 6 6
Tunisia 11 55
Turkey 47 2
Uganda 18 062 60
Ukraine 411 15 740 21
United Kingdom of Great Britain and Northern Ireland 310 100
United Republic of Tanzania 188 12 5918 30
Uruguay 20 25 18 18
Venezuela 81 22
Viet Nam 390 15 1818 28
Yemen 25
Zambia 21103 35 6951 41
1 Estimate of denominator provided by WHO (Global Tuberculosis Control Report 2008).
2 No denominator is available.3 Denominator is the total number of TB cases reported in 2007.4 For Mauritania, data available for 2 year period only, thus indicator for
2007 assumes cases evenly spread over each year. For Russian Federation, data reported from 4 geographical regions only – Ulyanovskaya oblast, Saratovskaya oblast, Tverskaya oblast, and Altayskiy kray
5 Data collection started before 2008.

284 Annex 2: Country progress indicators and data, 2004 to 2010 | 2010 GLOBAL REPORT
TB patients (new and re-treatment) with an HIV test result recorded in the TB register
TB patients (new and re-treatment) recorded as HIV-positive
HIV-positive TB patients started or continued on co-trimoxazole preventive therapy (CPT)
HIV-positive TB patients started or continued on antiretroviral therapy (ART)
People registered as HIV-positive screened for TB at least once during year
People registered as HIV-positive given isoniazid prophylaxis (treatment of latent TB infection)
Survey YearTREATMENT AND HIV
TESTING OF TB PATIENTS
Afghanistan 2009 1175 5 5 93
Albania 2009 211 6 4 6 51 3
American Samoa 2009 4 0 0 0 0 0
Andorra 2009 0 0 0 0 0 0
Angola 2009 2023 306 42 29
Antigua and Barbuda 2009 4 0 0 0 1 0
Argentina 2009 131 115
Armenia 2009 521 17 8 6 167 0
Australia 2009 297 15
Bahamas 2009 46 15 6 9
Bahrain 2009 256 9 0 1
Bangladesh 2009 662 36 35 36 57
Barbados 2009 2 0 0 0 0
Belarus 2009 190
Belize 2009 89 17 17 17
Benin 2009 3845 629
Bolivia (Plurinational State of) 2009 1105 38 8 29
Bosnia and Herzegovina 2009
Botswana 2009 6128 4036 1467 1467 159 112 11 732
Brazil 2009 39 744 8668 7935 8668
Burkina Faso 2009 4817 981 959 503
Burundi 2009 2857 1305 617 423 768 617
Cambodia 2009 28 246 3597 1081 526 66
Cameroon 2009 18 677 7494 0 0 18 677 0
Cape Verde 2009 282 57 0
Central African Republic 2009 3749 1230 808 427 0
Chad 2009 0 0 0 0 0 0
China 2009 63 227 2511 2176 1072
China, Hong Kong SAR 2009 3993 40 9 11 606 78
China, Macao SAR 2009 336 1 0 0 17 1
Colombia 2009 5031 1018 237
Comoros 2009 117 0 0 0 1 0
Congo 2009 205 99 99 99
Cook Islands 2009 0 0 0 0 0 0
Costa Rica 2009 476 41 41
Côte d’Ivoire 2009 17 253 5207 3674 1633 88 0
Cuba 2009 687 3 0 3 1249 1561
Democratic People’s Republic of Korea 2009 0 0 0 0 0 0
Democratic Republic of the Congo 2009 20 630 4173 1435 656 5161 0
Djibouti 2009 1819 197 0 152
Dominica 2009 4 1 0 1 12 2
Ecuador 2009 2262 443 443
Egypt 2009 3204 11 11 11 89 1
El Salvador 2009 1650 204 58 71 67 97
Equatorial Guinea 2009 720 121 0 0
Estonia 2009 380 39 0 21 0
Supplemental data obtained by the World Health Organization through annual reporting of national tuberculosis programmes

285
A2
Annex 2: Country progress indicators and data, 2004 to 2010 | 2010 GLOBAL REPORT
TB patients (new and re-treatment) with an HIV test result recorded in the TB register
TB patients (new and re-treatment) recorded as HIV-positive
HIV-positive TB patients started or continued on co-trimoxazole preventive therapy (CPT)
HIV-positive TB patients started or continued on antiretroviral therapy (ART)
People registered as HIV-positive screened for TB at least once during year
People registered as HIV-positive given isoniazid prophylaxis (treatment of latent TB infection)
Survey YearTREATMENT AND HIV
TESTING OF TB PATIENTS
Ethiopia 2009 56 040 11 098 7516 4515 24 112 2403
Fiji 2009 144 0 0 0 30 0
French Polynesia 2009 12 0 0 0 0
Gabon 2009 1130 667 348 348
Gambia 2009 2045 326 35 1238
Ghana 2009 9870 2218 1601 531 10 730 0
Grenada 2009 5 1 1 1 1 0
Guam 2009 63 0 0 0 7 0
Guatemala 2009 1920 342 342 342 525 250
Guinea 2009 5444 1288 520 84
Guyana 2009 562 156 116 87 893 162
Honduras 2009 1619 192 192 170 764 96
India 2009 258 037 31 058 280 903
Indonesia 2009 2782 479 201 2812 0
Iran (Islamic Republic of) 2009 700 223 28 47 11 400 418
Iraq 2009 6121 1 1 0 7 0
Israel 2009 20 20 8 20
Jamaica 2009 96 29
Jordan 2009 387 0 0 0 15 2
Kenya 2009 96 676 42 294 38 989 14 250 14 116
Kiribati 2009 152 0 0 0
Kuwait 2009 933 4 4 4 11 0
Kyrgyzstan 2009 6615 88 12 58
Lao People’s Democratic Republic 2009 686 179 159
Latvia 2009 830 73 44 0
Lebanon 2009 298 25 25 25 97 19
Lesotho 2009 10 563 8084 7636 2235
Liberia 2009 5964 72 30 35 0 0
Libyan Arab Jamahiriya 2009 950 144 148
Lithuania 2009 14
Malawi 2009 19 289 13329 12748 6185 0 0
Malaysia 2009 15 192 1644 164 164 2156 0
Mali 2009 3760 585 263 61 0
Malta 2009 30 4
Marshall Islands 2009 98 2 0 2 4 0
Mauritania 2009 199 23
Mauritius 2009 110 7 7 5 210 0
Mexico 2009 4196 945 945 216 2368 676
Micronesia (Federated States of) 2009 49 0 0 0 0 0
Monaco 2009
Mongolia 2009 3993 0 0 0 53 0
Montenegro 2009 91 0 0 0 1 0
Montserrat 2009
Morocco 2009 77 0 0 0 4972 0
Mozambique 2009 38 087 25 056 22 183 5622 24 330 2429
Myanmar 2009 4174 1015 981 681 489 333
Namibia 2009 9849 5676 5192 1995 87 529 17 737
Nauru 2009 0 0

286 Annex 2: Country progress indicators and data, 2004 to 2010 | 2010 GLOBAL REPORT
TB patients (new and re-treatment) with an HIV test result recorded in the TB register
TB patients (new and re-treatment) recorded as HIV-positive
HIV-positive TB patients started or continued on co-trimoxazole preventive therapy (CPT)
HIV-positive TB patients started or continued on antiretroviral therapy (ART)
People registered as HIV-positive screened for TB at least once during year
People registered as HIV-positive given isoniazid prophylaxis (treatment of latent TB infection)
Survey YearTREATMENT AND HIV
TESTING OF TB PATIENTS
New Zealand 2009 137 4
Nicaragua 2009 1081 30 30 30 60 60
Niger 2009 2424 300
Nigeria 2009 64 246 16 813 7730 5486 195 112 1853
Niue 2009 0 0 0 0 0 0
Northern Mariana Islands 2009 32 0 0 0 1 0
Oman 2009 334 3 3 3 116 0
Pakistan 2009 4714 7 7 7 2917 0
Palau 2009 19 0 0 0 0
Panama 2009 1494 107 107 196
Papua New Guinea 2009 1305 196
Paraguay 2009 239 133 0 72 273 0
Peru 2009 11 893 697 121 1361
Philippines 2009 1136 1 0 0 1
Puerto Rico 2009 59 8 3 3 4 0
Qatar 2009 619 0 0 0 5 0
Romania 2009 5755 209 169 188
Russian Federation 2009 204 624 7442 1448 235 753 10 451
Rwanda 2009 7448 2529 2329 1239 12 152 0
Saint Kitts and Nevis 2009 4 0 0 0
Saint Lucia 2009 11 4 4
Saint Vincent and the Grenadines 2009 13 7 1 1
Samoa 2009 0 0 0 0
San Marino 2009
Sao Tome and Principe 2009 79 10 10 3 10 2
Saudi Arabia 2009 1929 49
Senegal 2009 6906 455 386 123 0
Seychelles 2009 15 3 3 2 52 0
Sierra Leone 2009 8625 987
Singapore 2009 1121 52
Solomon Islands 2009 0 0 0 0 8 0
Somalia 2009 698 96 89 7 0
South Africa 2009 197 448 114 523 80 954 48 314 433 662 23 583
Sudan 2009 16 168 692 296 375 1482
Suriname 2009 154 49 6 25
Swaziland 2009 8272 6895
Tajikistan 2009 3714 49 0 22 435 0
Thailand 2009 49 955 8202 5930 4151 25 172 127
The Former Yugoslav Republic of Macedonia 2009 43 0 0 0 12 0
Timor-Leste 2009 108 0 0 0 12 2
Togo 2009 1429 357 94 0
Tonga 2009 8 0 0 0 1 0
Trinidad and Tobago 2009 306 95 22 17 335 4
Tunisia 2009 130 2 0 2 35 24
Tuvalu 2009 0 0 0 0 0 0
Uganda 2009 31 695 17 131 14 731 3766 57 679
Ukraine 2009 3380 915

287
A2
Annex 2: Country progress indicators and data, 2004 to 2010 | 2010 GLOBAL REPORT
TREATMENT AND HIV TESTING OF TB PATIENTS
TB patients (new and re-treatment) with an HIV test result recorded in the TB register
TB patients (new and re-treatment) recorded as HIV-positive
HIV-positive TB patients started or continued on co-trimoxazole preventive therapy (CPT)
HIV-positive TB patients started or continued on antiretroviral therapy (ART)
People registered as HIV-positive screened for TB at least once during year
People registered as HIV-positive given isoniazid prophylaxis (treatment of latent TB infection)
Survey Year
United Republic of Tanzania 2009 56 162 21 031 19 007 6639 5526 153
United States of America 2009 7032 703
Uruguay 2009 666 109 0 18
Uzbekistan 2009 21 453 357 89 37 3022 1056
Vanuatu 2009 11 0 0 0 3 0
Venezuela (Bolivarian Republic of) 2009 4856 487 0 102 30 158 102
Viet Nam 2009 34 907 5934 5265 354 7092 1500
Wallis and Futuna Islands 2009 9 0 0 0 0 0
West Bank and Gaza Strip 2009 35 0 0 0 0 0
Yemen 2009
Zambia 2009 34 992 23 584 15 041 10 009
Zimbabwe 2009 28 006 21 967

288 Annex 2: Country progress indicators and data, 2004 to 2010 | 2010 GLOBAL REPORT
2005 2007PERCENTAGE OF ORPHANED AND VULNERABLE CHILDREN AGED 0-17 WHOSE HOUSE-HOLDS RECEIVED FREE BASIC EXTERNAL SUPPORT IN CARING FOR THE CHILD
Survey year Survey yearCoverage Coverage
Angola
Barbados
Benin 2006 69 1
Botswana 2004 34
Burkina Faso 2007 5 1
Burundi 2006 50 1
Côte d’Ivoire 2006 9 1
Cameroon 2006 9
Central African Republic 2006 20 2
Chad
Congo, Republic of the
Costa Rica 2006 100 1
Croatia 2007 100 1
Cuba
Democratic Republic of the Congo
Djibouti
Dominican Republic 2007 4 1
Eritrea 2007
Ethiopia 2004 4 2004 4
Finland 99
Gabon 2007 10
Ghana 2006 2 1
Guinea 2007 17 1
Guinea-Bissau 2006 8
Haiti 2006 5
Honduras
Indonesia
Kenya 10
Lesotho 2004 25
Madagascar 2003 7
Malawi 2006 53 2
Mali 2005 39 2007 45 1
Mozambique
Namibia 2007 17
Nigeria 2007 10 1
Rwanda 2005 13
Saint Lucia 2007 69 1
Saint Vincent and the Grenadines
Senegal 2007 44 1
Seychelles 2006 100 1
Sierra Leone 2005 1
South Africa 2007 67 1
Swaziland 2007 41
Togo 10 2006 60 2
Turkey 2006 100 1
Uganda 2006 11
United Republic of Tanzania 2006 51 1
Zambia 2005 13 2007 16
Zimbabwe 2006 31 UNGASS Indicator 10MDG 6a indicator

289
A2
Annex 2: Country progress indicators and data, 2004 to 2010 | 2010 GLOBAL REPORT
2009 MOST RECENT DHS (OR MICS)3
Survey year Survey yearCoverage Coverage
2009 17
2009 100
2009 7
2008 31
2008 5
2009 7
2009 27 2005 9
2009 16
2006 7 2006 7
2009 35
2009
2009 100
2007 9 2007 9
2009 14
2008 37
2004 3
2009 100
2010 20
2008 7
2009 17
2005 5 2005 5
2009 0
2007 13
2007 21
2010
2006 19
2009 17
2008 22
2006 17 2006 17
2008 6 2008 6
2005 13 2005 13
2009 83
2008
2007 43
2005 1
2009 75
2006 41 2007 41
2007 60
2010 2006 11
2008 16
2006 16 2007 16
2009 21 2005-06 28
1 Methodology not harmonized with UNGASS 2008 guidelines.
2 Differs from value provided by UNICEF.3 Demographic Health Survey (or Multiple Indicator
Cluster Survey).

290 Annex 2: Country progress indicators and data, 2004 to 2010 | 2010 GLOBAL REPORT
2005 2007 20092003
Survey year
Ratio Ratio Survey year
Ratio Survey year
Ratio
ORPHANS SCHOOL ATTENDENCERATIO OF ORPHANS TO NON-ORPHANS AGED 10-14 ATTENDING SCHOOL
Angola 0.90 2001 0.90 2009 0.87
Argentina 2005 1.03
Bahamas 2009 1.00
Belize 2006 0.66
Benin 2006 0.85 2009 0.00
Bolivia 2003 0.741
Botswana 0.99
Burkina Faso 2007 0.87 2007 1.15
Burundi 0.70 2005 0.85
Côte d’Ivoire 0.83 2005 1.213 2009 0.69
Cambodia 2006 0.83 2005 0.83
Cameroon 0.94 2006 0.89 2006 0.91
Central African Republic 0.91 2006 0.96 2006 0.97
Chad 0.96 2004 1.03 2004 1.17
Colombia 2005 0.851
Comoros 0.59
Congo, Republic of the 2005 1.12 2009 0.88
Croatia 2007 1.00
Cuba 2005 1.00 2009 1.00
Democratic Republic of the Congo 0.72 2007 0.771 2007 0.77
Dominican Republic 2006 0.71
Equatorial Guinea 0.95
Eritrea 2002 0.831
Ethiopia 0.60 2004 2004 0.90
Finland >0.99
Gabon 0.98 2007 1.14 2010 0.84
Gambia 0.85 2006 0.87
Ghana 0.93 2006 1.044 2008 0.76
Guinea 1.13 2005 0.731
Guinea-Bissau 1.03 2006 0.97
Guyana 2005 0.951
Haiti 2000 0.871 2005 0.86
Honduras 2005 1.08
India 2006 0.721
Indonesia 2002 0.841 2007 0.94
Iran, Islamic Republic of 2008 0.81
Japan 2008 1.00
Kenya 0.74 2005 0.97 2003 0.951 2007 1.05
Lesotho 0.87 2007 0.95
Madagascar 0.65 2003 0.80 2004 0.83 2009 1.00
Malawi 0.93 2004 0.97 2006 0.97
Mali 0.72 2006 0.87
Mauritania 2007 0.72
Moldova 2010 0.52
Mozambique 0.47 2004 0.80 2008 0.91
Namibia 0.92 2005 0.97 2007 1.00 2006 1.01
Nicaragua 2007 0.88
Niger 1.07 2006 0.67 2006 0.66
Nigeria 0.87 2007 0.86 2008 1.17UNGASS Indicator 12MDG 6a indicator

291
A2
Annex 2: Country progress indicators and data, 2004 to 2010 | 2010 GLOBAL REPORT
2005 2007 20092003
Survey year
Ratio Ratio Survey year
Ratio Survey year
Ratio
ORPHANS SCHOOL ATTENDENCERATIO OF ORPHANS TO NON-ORPHANS AGED 10-14 ATTENDING SCHOOL
Papua New Guinea 2007 0.86 2006 0.86
Rwanda 0.80 2005 0.82 2005 0.82
Saint Lucia 2007 1.76 2 2009 1.38
Saint Vincent and the Grenadines 2008 1.00
Senegal 0.74 2007 1.25 2
Sierra Leone 0.71 2005 0.83 2008 0.62
Somalia 0.65 2006 0.78
South Africa 0.95 2007 0.812 2008 0.99
Spain 2007 0.00
Sudan 0.96 2006 0.80
Swaziland 0.91 2007 0.97 2006 0.97
Thailand 2006 0.93 2005 0.99
Togo 0.96 2007 0.94 2007 0.96
Turkey 2007 0.70 2
Uganda 0.95 2000 0.95 2010 0.00
United Republic of Tanzania 0.74 2007 0.64 2008
Zambia 0.87 2005 0.17 2005 1.02 2 2006 0.92
Zimbabwe 0.85 2006 0.95
1 Demographic and Health Survey value provided by MEASURE DHS (www.measuredhs.com).2 Data collection method differs from the UNGASS recommended methodology.3 Differs from value provided by UNICEF.4 Multiple Indicator Cluster Survey based on small denominators, typically 25-49 unweighted cases.

292 Annex 2: Country progress indicators and data, 2004 to 2010 | 2010 GLOBAL REPORT
2007 2009PERCENTAGE OF SCHOOLS THAT PROVIDED LIFE SKILLS-BASED HIV EDUCATION IN THE LAST ACADEMIC YEAR
Afghanistan 1
Angola 1
Antigua and Barbuda 13 100
Argentina 3
Azerbaijan 19 100
Bahamas 72 78
Bangladesh 0
Barbados 41 85
Belarus 79 13
Belize 38
Bosnia and Herzegovina 24
Botswana 100 100
Brazil 63 1
Bulgaria 6 17
Burkina Faso 1 10
Burundi 64 66
Côte d’Ivoire 1 2
Cambodia 26 34
Cameroon 6 1
Cape Verde 100 100
Central African Republic 15 27
Chad 4 75
Comoros 15 27
Congo, Republic of the 82 63
Costa Rica 100 100
Croatia 5 5
Cuba 71 94
Czech Republic 59
Democratic Republic of the Congo 0 68
Djibouti 38
Dominica 100 100
Dominican Republic 1 8
Ecuador 63
El Salvador 4 100
Eritrea 26 31
Ethiopia 70 38
Finland 95 100
Gabon 35 35 1
Gambia 33
Germany 50 1
Ghana 58 79
Grenada 0 94
Guatemala 2
Guinea 82
Guyana 62
Haiti 13 UNGASS Indicator 11

293
A2
Annex 2: Country progress indicators and data, 2004 to 2010 | 2010 GLOBAL REPORT
2007 20072009 2009
Honduras 39 11
India 31
Indonesia 10
Iran, Islamic Republic of 0
Jamaica 24 44
Japan 72 100
Kazakhstan 81
Kenya 100
Kyrgyzstan 84
Lao People’s Democratic Republic 32 74
Lesotho 88
Liberia 2
Luxembourg 100
Malaysia 0 1
Mali 49
Mexico 27
Moldova 93 0
Montenegro 27
Namibia 79
Nepal 6 8
Nicaragua 8 88
Niger 8 82
Nigeria 34 23
Oman 100
Pakistan 6
Papua New Guinea 25 100
Portugal 100 1
Romania 64 67
Russian Federation 82 92
Saint Kitts and Nevis 45
Saint Lucia 91 59
Saint Vincent and the Grenadines 87 100
Sao Tome and Principe 100
Serbia 1
Seychelles 100 100
Singapore 100
South Africa 96 100
Sudan 13
Suriname 0
Swaziland 51 85
Sweden 100
Tajikistan 5
Timor-Leste 0
Togo 0 0
Turkey 100
Tuvalu 100
Ukraine 57 59
Uruguay 90
Uzbekistan 100
Vanuatu 8
Venezuela 100
Viet Nam 34
Yemen 4
Zambia 60
Zimbabwe 100 100
1 Data collection started before 2008.

294 Annex 2: Country progress indicators and data, 2004 to 2010 | 2010 GLOBAL REPORT
Females Survey year
Males Females
15-24 15-2415-24
2003 2005YOUNG WOMEN AND MEN AGED 15-24 WHO CORRECTLY IDENTIFY WAYS OF PREVENTING THE SEXUAL TRANSMISSION OF HIV AND WHO REJECT MAJOR MISCONCEPTIONS
Albania <1
Algeria
Angola 43 35
Antigua and Barbuda
Argentina
Armenia
Azerbaijan 2
Bangladesh
Barbados
Belarus
Belize
Benin 11 8
Bolivia 22
Bosnia and Herzegovina
Botswana 28
Brazil
Bulgaria
Burkina Faso
Burundi 24 2004 4 4
Côte d’Ivoire 16
Cambodia 37
Cameroon 16 2004 34 27
Cape Verde
Central African Republic 5
Chad 5
Chile
China
Colombia
Comoros 10
Congo, Republic of the
Costa Rica
Croatia
Cuba 52
Cyprus
Democratic Republic of the Congo
Djibouti
Dominican Republic 33
Ecuador
Egypt
El Salvador
Equatorial Guinea 4
Eritrea
Estonia
Ethiopia
Gabon
Gambia 15
Georgia
Germany
Ghana 2003 40 36
Greece UNGASS Indicator 13MDG 6a indicator

295
A2
Annex 2: Country progress indicators and data, 2004 to 2010 | 2010 GLOBAL REPORT
Survey year
Survey year
Survey year
Males Males MalesFemales Females FemalesBoth sexes Both sexes
15-24 15-2415-24 15-2415-24 15-24
2007 2009 MOST RECENT DHS (OR MICS)1
2008 22 36
2006 16 16 2006 16
2006 25 21 23 2009 32 25 28
2005 48
2005 83 89 86 2008 93
2007 42 34 36 2005 15% 23%
2006 5 5 5 2006 5% 5%
2005 24 21 22 2008 22 13 18
2009 52 49 50
2007 70 65 68 2009 68 72 70
2006 26 26 26 2009 47 53 50
2006 35 16 20 2008 34 34 34 2006 35% 16%
2008 28 30 24 2008 28% 25%
2006 44
2008 39 45 42
2008 53 50 52
2006 18 21 19 2009 21 25 23
2007 45 46 45 2008 29 21 25 2003 23% 15%
2005 31 2007 45 39 35
2005 28 18 22 2009 17 13 15 2005 28% 18%
2006 45 49 47 2005 45 50 48 2005 45% 50%
2006 32 32 2004 35 27 30 2004 35% 27%
2005 37 38 38 2009 65 68 67 2005 36% 36%
2006 31 22 24 2006 26 17 20 2006 27% 17%
2004 20 8 11 2004 20 8 11 2004 20% 8%
2007 2009 78 85 82
2007 50 55 42 2008 85
2005
2005 22 10 13 2009 22 8 14 2009 22% 8%
2006 43 42 42
2006 16 25 20
2006 55 61 58 2008
2007 10 11 10
2006 29 22 26 2007 21 15 17 2007 21% 15%
2008 23 18 21
2007 34 41 37 2007 34 41 37 2007 34% 41%
2006 31 27 29
2007 18 5 11
2008 27
2006 2
2008 77 78 77 2002 37%
2007 28 37 32 2007 28 37 32
2005 33 21 24 2005 33 21 2005 33% 21%
2007 58 60 59 2010 58 53 55
2005 34 25 29
2005 4
2007 2009
2008 34 28 2008 34% 28%
2007 27 23 25 2009 27 50 38

296 Annex 2: Country progress indicators and data, 2004 to 2010 | 2010 GLOBAL REPORT
Females Survey year
Males Females
15-24 15-2415-24
2003 2005YOUNG WOMEN AND MEN AGED 15-24 WHO CORRECTLY IDENTIFY WAYS OF PREVENTING THE SEXUAL TRANSMISSION OF HIV AND WHO REJECT MAJOR MISCONCEPTIONS
Grenada
Guatemala
Guinea
Guinea-Bissau 8
Guyana 36
Haiti 14
Honduras
India
Indonesia 7
Iran, Islamic Republic of
Jamaica
Japan
Kazakhstan
Kenya 26 2005 80 58
Kyrgyzstan
Latvia
Lesotho 18
Liberia
Lithuania
Madagascar 2003 16 19
Malawi 34 2005 36 24
Malaysia
Mali
Marshall Islands
Mauritania
Mauritius
Mexico
Micronesia
Moldova 19
Mongolia 32 2005 3 5
Montenegro
Morocco
Mozambique
Myanmar
Namibia
Nepal
Nicaragua
Niger 5
Nigeria
Norway
Oman
Palau
Panama
Papua New Guinea
Peru
Philippines
Russian Federation
Rwanda 23
Saint Kitts and Nevis
Saint Lucia
Saint Vincent and the Grenadines
Samoa

297
A2
Annex 2: Country progress indicators and data, 2004 to 2010 | 2010 GLOBAL REPORT
Survey year
Survey year
Survey year
Males Males MalesFemales Females FemalesBoth sexes Both sexes
15-24 15-2415-24 15-2415-24 15-24
2007 2009 MOST RECENT DHS (OR MICS)1
2006 43 40 41
2002 10 9 9 2008 24 22 23
2007 20 12 16 2009 23 20 22 2005 23% 17%
2006 18 2008 13 13 13
2005 34 44 39 2008 46 2005 47% 53%
2006 40 32 35 2005 40 34 35 2005 40% 34%
2005 39 89 77 2005 30 2005-06 30%
2006 33 24 28 2009 44 35 40 2005-06 36% 20%
2007 14 15 14
2008 15 17 16
2004 23 47 35 2008 38 43 40
2004 2008
2007 18 20 19 2008 29 32 30
2008 55 48 2003 47% 34%
2006 30 33 32 2009 33 37 35
2007 3 3 3
2009 2004 19% 27%
2006 67 57 62 2007 27% 21%
2009 50 34 41
2006 46 45 45 2008 57 54 2003-04 16% 19%
2006 42 42 42 2004 36% 24%
2008 23
2006 22 18 20 2006 59 54 55 2006 22% 18%
2006 8 4 6 2007 39 27 32 2007 39% 27%
2007 14 5 7
2004 22
2002 18 18
0 2006-07
2006 26 27 26 2008 39 42 41 2005 na na
2005 17 15 16 2009 19 16 18
2006 2007
2007 2007 2003 na 12%
2004 39 25 28 2009 34% 36%
2007 47 48 48
2007 62 65 63 2006 62 65 2006 62% 65%
2006 44 28 32 2006 44 28 32 2006 44% 28%
2007 81 81 2001 22%
2006 16 13 14 2006 16 13 14 2006 16% 13%
2005 25 20 23 2007 27 21 24 2008 33% 22%
2008 66 67 65
2007 4 4 4
2006 27 2008 0 27 27
2009 12 15 14
2007 26 17 22
2006 55 2008 28 20 23 2007 19%
2008 21%
2007 33 35 34 2009 35 39 37
2005 54 51 52 2005 54 51 52 2005 54% 51%
2006 52 2005 52
2006 61 57 59 2005 61 57 60
2006 59 40 49 2008 59 40 49
2008

298 Annex 2: Country progress indicators and data, 2004 to 2010 | 2010 GLOBAL REPORT
Females Survey year
Males Females
15-24 15-2415-24
2003 2005YOUNG WOMEN AND MEN AGED 15-24 WHO CORRECTLY IDENTIFY WAYS OF PREVENTING THE SEXUAL TRANSMISSION OF HIV AND WHO REJECT MAJOR MISCONCEPTIONS
Sao Tome and Principe 11
Senegal
Serbia
Seychelles
Sierra Leone 16
Singapore
Solomon Islands
Somalia 2004 13 8
South Africa 20
Spain
Sri Lanka
Sudan
Suriname 27
Swaziland 27
Sweden
Tajikistan
Thailand
The former Yugoslav Republic of Macedonia
Timor-Leste
Togo 20
Tonga
Trinidad and Tobago 33
Tunisia
Turkey
Turkmenistan
Tuvalu
Uganda 28
Ukraine
United Kingdom of Great Britain and Northern Ireland
United Republic of Tanzania 26
Uruguay
Uzbekistan 3
Vanuatu
Viet Nam 25
Zambia 26 2005 46 41
Zimbabwe 2003 56 54
1 Demographic Health Survey (or Multiple Indicator Cluster Survey).

299
A2
Annex 2: Country progress indicators and data, 2004 to 2010 | 2010 GLOBAL REPORT
Survey year
Survey year
Survey year
Males Males MalesFemales Females FemalesBoth sexes Both sexes
15-24 15-2415-24 15-2415-24 15-24
2007 2009 MOST RECENT DHS (OR MICS)1
2006 2008 2008-09 43% 43%
2005 24 19 22 2005 24 19 23 2005 24% 19%
2006 20 21 20 2006 20 21 20
2003 59 67 63
2007 2008 28 17 2008 28% 17%
2007 15 20 17
2008
2006 4 4 2006 4
2008 30 27 29
2008
2007 10 7 8 2006 17
2006 7 7
2006 41 41 2006 41
2007 52 52 52 2006 52 52 52 2007 52% 52%
2009 59 61 60
2007 11 11 11 2008 11 9 10
2006 47 33 40 2006 44 30 37
2007 19 26 22 2007 18 25 22
2008 21 36
2007 59 44 51 2007 59 44 51
2008
2007 56
26 29 27 2009 5 11 8
2007 35 39 37
2000 3%
2005 2007 61 39 48
2006 38 32 33 2010 2006 38% 32%
2007 39 42 40 2009 40 41 40 2007 43% 45%
2007 65
2008 42 39 40 2007-08 42% 39%
2007 52 48 50 2008 23 44 34
2009 14 11 13
2008
2005 50 42 46 2009 44 41 42 2005 50% 42%
2007 37 34 35 2007 37 34 35 2007 37% 34%
2006 46 44 45 2009 53 2005-06 46% 44%

300 Annex 2: Country progress indicators and data, 2004 to 2010 | 2010 GLOBAL REPORT
Survey year
Males Females
15-24 15-24
20051
PERCENTAGE OF YOUNG WOMEN AND MEN AGED 15-24 WHO HAVE HAD SEXUAL INTERCOURSE BEFORE THE AGE OF 15
Albania
Angola 47 24
Antigua and Barbuda
Argentina
Armenia
Azerbaijan
Bahamas
Bangladesh
Barbados 36 26
Belarus
Belize
Benin 16 9
Bolivia
Bosnia and Herzegovina
Botswana
Brazil
Bulgaria
Burkina Faso
Burundi 14 6
Côte d’Ivoire 2004 13 15
Cambodia <1 <1
Cameroon 2004 23 35
Cape Verde
Central African Republic 2004 10 10
Chad
Chile
Colombia
Comoros
Congo, Republic of the 2003 10 10
Costa Rica
Cuba
Cyprus
Czech Republic
Democratic Republic of the Congo
Djibouti
Dominican Republic
Ecuador
El Salvador
Eritrea
Estonia
Ethiopia 40 42
Fiji
Finland
Gabon
Gambia
Georgia
Germany
Ghana
Greece
Grenada
Guatemala UNGASS Indicator 15

301
A2
Annex 2: Country progress indicators and data, 2004 to 2010 | 2010 GLOBAL REPORT
Survey year
Survey year
Survey year
Males Males MalesFemales Females FemalesBoth sexes Both sexes
15-24 15-2415-24 15-2415-24 15-24
20071 20091 MOST RECENT DHS (OR MICS)2
2008 1 1
2006 36 28 32 2009 37 23 30
2006 25
2005 27 19 23 2008 19
2007 11 <1 3 2005 3 0
2006 1 1 2006 1 1
2009 70 41 58
2005 4 1 2 2008 12 31 24 2007 1
2009 22 16 20
2007 8 4 5 2009 7 2 4
2006 11 6 9 2009 11 5 8
2006 13 12 12 22 13 17 2006 13 12
2008 13 7 8 2008 13 7
2006 1 2009 17 18
2008 5 3 4
2008 41 29 35
2006 13 7 10 2009 11 5 8
2007 3 7 6 2008 9 7 8 2003 4 7
2005 3 2007 5 3 4
2005 15 19 18 2009 21 2005 15 19
2006 <1 1 1 2005 0 1 1 2005 0 1
2006 14 2004 23 35 31 2004 11 20
2005 41 24 30 2009 26 13 26 2005 41 24
2006 20 33 30 2006 36 52 48 2006 13 25
2004 19 39 35 2004 10 26 2004 10 26
2006 12 6 9 2009 13 8 11
2007 37 2005 13
1996 16 8 10
2005 27 24 24 25 20 22 2009 25 20
2006 15 7 11
2006 33 15 24 2008 32 15 24
2007 15 1 8
2008 3 4 3
2006 31 23 28 2007 18 18 18 2007 18 18
2008 11 2 7
2007 24 33 29 2007 24 15 19 2007 24 15
2004 10
2003 54 21 27 2008 11
2002 13
2007 10 11 10 2007 11 11 11
2005 2 16 12 2005 2 16 2005 2 16
2007 50
2009 27 30 28
2007 38 14 25 2010 28 8 15 2000 42 24
2006 5
2005 2 2
2006 10 12 11 2005 12 14 13
2008 4 8 2008 4 8
2007 35 7 24 2009 22 10 16
2006 32 20 25
2002 20 9 11 2008 16 8 11 1999 10

302 Annex 2: Country progress indicators and data, 2004 to 2010 | 2010 GLOBAL REPORT
Survey year
Males Females
15-24 15-24
20051
PERCENTAGE OF YOUNG WOMEN AND MEN AGED 15-24 WHO HAVE HAD SEXUAL INTERCOURSE BEFORE THE AGE OF 15
Guinea 2005 16 18
Guinea-Bissau
Guyana
Haiti
Honduras
India
Indonesia
Iran, Islamic Republic of
Jamaica
Japan
Kazakhstan
Kenya 2005 20 17
Kyrgyzstan
Latvia
Lebanon
Lesotho 2004 27 14
Liberia
Lithuania
Luxembourg
Madagascar 2003 22 31
Malawi
Malaysia
Mali
Malta
Marshall Islands
Mauritania
Mauritius
Mexico
Micronesia, Federated States of
Moldova 2005 34 24
Mongolia 2005 3 <1
Montenegro
Morocco
Mozambique
Myanmar
Namibia
Nepal
Nicaragua
Niger
Nigeria 2005 5 15
Norway
Pakistan
Palau
Panama
Papua New Guinea
Paraguay
Peru
Philippines
Portugal
Romania
Russian Federation 2004 17 8
Rwanda
Saint Kitts and Nevis

303
A2
Annex 2: Country progress indicators and data, 2004 to 2010 | 2010 GLOBAL REPORT
Survey year
Survey year
Survey year
Males Males MalesFemales Females FemalesBoth sexes Both sexes
15-24 15-2415-24 15-2415-24 15-24
2007 20 31 25 2009 25 29 26 2005 17 22
2006 22 2008 26 16 21
2005 30 12 21 2009 19 10 14 2009
2006 43 15 23 2005 43 15 23 2005 43 15
2005 19 11 13 2006 19 11 13 2005-06 11
2006 2 4 3 2009 2 10 0 2005-06 2 10
2007 0 0 0 2007
2005 2007 7 1 4
2004 2008 57 16 36
2004 8 9 9
2007 20 3 9 2008 7 0 4
2003 29 14 21 2008 22 11 2003 29 14
2007 9 <1 5 2009 6 0 3
2007 16 9 12
2004 4 2004 4
2005 12 6 8 2004 13 6
2006 8 17 13 2007 9 17
2006 22 10 16 2008 18 7 13
2006 18 15 16
2006 33 39 36 2009 9 18 2003-04 9 15
2006 2004 14 15 15 2004 14 15
2001 5
2006 5 25 6 2006 5 25 21 2006 5 25
2009 7 6 7
2006 17 10 14 2007 27 14 19 2007 27 14
2007 14 14 2007 14 14
2004 3 1 2 2008 10 5 7
2005 4 4 4 2005 4 4 4
2006 22
2006 8 1 4 2008 13 1 7 2005 9 1
2005 3 <1 1 2009 2 0 1
2007 4 2 3 2007
2007 8 1 5 2007 8 1 5 1992 0
2004 26 28 28 2009 25 25 25 2009 25 25
2007 1 1 1
2007 18 7 12 2006 18 7 2006 18 7
2006 4 8
2007 14 14 2001 12
2006 8 39 25 2006 5 30 2006 5 30
2005 5 15 10 2007 7 17 12 2008 6 16
2009 8 10 9
2006 1 <1
2006 5 2008 17 15 10
2009 30 21 24
2007 4 4 4 2007 8 7 8
2008 64
2007 6 2008 12 7 8 2007 6
2008 2
2008 11 6 8
2006 17 3 10
2007 12 3 7 2009 10 3 6
2005 13 4 7 2005 13 4 7 2005 13 4
2006 36 10 22 2005 36 10 22
20071 20091 MOST RECENT DHS (OR MICS)2

304 Annex 2: Country progress indicators and data, 2004 to 2010 | 2010 GLOBAL REPORT
Survey year
Males Females
15-24 15-24
20051
PERCENTAGE OF YOUNG WOMEN AND MEN AGED 15-24 WHO HAVE HAD SEXUAL INTERCOURSE BEFORE THE AGE OF 15
Saint Lucia
Saint Vincent and the Grenadines 2005 63 37
Samoa
Sao Tome and Principe
Senegal
Serbia
Sierra Leone
Singapore
Solomon Islands
South Africa
Spain
Sri Lanka
Sudan
Suriname
Swaziland
Sweden
Switzerland
Tajikistan
Thailand 11 7
The former Yugoslav Republic of Macedonia
Togo
Trinidad and Tobago
Tunisia
Turkmenistan
Tuvalu
Uganda
Ukraine
United Kingdom of Great Britain and Northern Ireland
United Republic of Tanzania
Uruguay
Uzbekistan
Viet Nam
Zambia
Zimbabwe 9 8
1 Methodology may vary for individual countries.2 Demographic Health Survey (or Multiple Indicator Cluster Survey).

305
A2
Annex 2: Country progress indicators and data, 2004 to 2010 | 2010 GLOBAL REPORT
Survey year
Survey year
Survey year
Males Males MalesFemales Females FemalesBoth sexes Both sexes
15-24 15-2415-24 15-2415-24 15-24
2006 32 20 26 2005 32 20 26
2006 31 14 22 2008 31 14 22
2008 11 5 9
2006 2008-09 12 9
2005 12 9 10 2005 12 9 10 2005 12 9
2006 4 1 2
2005 25 25 2008 11 25 2008 11 25
2007 3 2 2
2008 44 22 29
2005 5 12 8 2008 11 6 9
2003 18 11 15 2008 30 18
2007 3 2006 1
2009 41
2006 8 2006 9
2007 5 7 6 2006 5 7 6 2007 5 7
2007 15 21 19 2009 19 24 22
2007 10 7 8 2007 9 7 8
2006 1 <1 1 2008 1 0 0
2006 21 5 13 2006 8 1 5
2007 8 1 5 2007 9 1 5
2007 13 10 11 2007 13 10 11 1998 0 19
2007 12
7 <1 4 2009 52 14 36
2000 0
2007 15 2 7
2006 12 16 15 2010 2006 12 16
2007 7 3 5 2009 4 0 2 2007 2 1
2001 14 12 13 2001 14 12 13
2005 10 13 11 2008 10 11 10 2007-08 10 11
2007 25 10 18 2008 44 30 37
2009 1 0 1 1996 1
2005 1 <1 <1 2009 0 0 0 2005 0 1
2007 16 14 15 2006 16 13 14 2007 16 14
2006 5 5 5 2007 4 5 5 2005-06 5 5
20071 20091 MOST RECENT DHS (OR MICS)2

306 Annex 2: Country progress indicators and data, 2004 to 2010 | 2010 GLOBAL REPORT
Males Females Both sexesSurvey Year
15-49 15-49 15-24 25-49
20031
PERCENTAGE OF WOMEN AND MEN AGED 15-49 WHO HAVE HAD SEXUAL INTERCOURSE WITH MORE THAN ONE PARTNER IN THE LAST 12 MONTHS
Albania
Angola
Antigua and Barbuda
Armenia 2000 9 <1 4 4
Azerbaijan
Bangladesh
Belarus
Belize
Benin 1996 2
Bolivia
Bosnia and Herzegovina
Botswana
Brazil
Bulgaria
Burkina Faso 1999 13 1 9 6
Burundi
Côte d’Ivoire 1998 33 5 19 19
Cambodia 2000 <1
Cameroon 1998 41 10 25 25
Canada
Cape Verde
Central African Republic
Chad 1997 19 1 11 8
Chile
Colombia 2000 3
Comoros
Congo, Republic of the
Costa Rica
Cuba
Cyprus
Czech Republic
Democratic Republic of the Congo
Djibouti
Dominican Republic 1996 16 2 4 6
Eritrea
Estonia
Ethiopia 2000 7 1 3 5
Gabon 2000 24 14 20 18
Gambia
Germany
Ghana
Greece
Grenada
Guatemala
Guinea 1999 26 4 15 15
Guinea-Bissau
Guyana
Haiti 2000 24 1 11 13
Honduras
Hungary
India
Indonesia UNGASS Indicator 16

307
A2
Annex 2: Country progress indicators and data, 2004 to 2010 | 2010 GLOBAL REPORT
Males MalesFemales FemalesBoth sexes Both sexesSurvey Year
Survey Year
15-49 15-4915-49 15-4915-24 15-4925-49 15-19 20-24 25-49
20051 20074
2006 51 25 38 54 46 26
2006 55
2005 9 <1 6 3
2005 18 18 25 25 14
2007 33 14 21 27 32 15
2006 13 2 4 2 8 2
2001 22 1 7 8 2006 12 35 17 62 30 8
2003 15 1 10 7
2006 8 4 11
2003 15 1 5 9 2007 14 1 7 2 6 9
2005 24 4 12 15 2005 31 4 16 15 18 16
2005 6 <1 2 4 2006 6 <1 3 1 4 3
2004 31 6 15 22 2004 40 8 18 17 20 17
2006 13
2005 36 3 19 19 2005 69 43 52 86 71 36
2006 24 2 6 2 11 2 6 14
2004 17 1 6 10 2004 17 1 8 4 9 10
2006 12 2 7 6 14 6
2005 3 2007 4 3 35 3
2003 24 4 11 9
2005 24 7 15 16 2005 28 8 14 19 16 13
2006 37 35 39
2006 35 10 23 22 29 22
2007 25 6 15
2007 22 4 9 10 11 9
2002 23 2 13 13 2007 30 4 17 22 25 16
2007 23 19 21 17 26
2005 2 <1 1 2 2005 3 <1 2 1 2 2
2007 51 38 43 53 36 43
2006 1 2
2007 35 22 29
2003 10 1 4 7 2006 22 2 40 2 26 2
2007 33 8 20 22 48 18
2006 30 13 21 19 30 16
2002 13 13 34 19 8
2005 25 2 11 14 2005 25 2 8 6 10 8
2006 5 7
2005 7 1 6 3 2005 9 1 5
2005 23 1 11 13 2006 23 1 12 7 16 13
2006 1 2005 16 1 4
2006 1 <1 1 1 2006 8 2 5 6 9 4

308 Annex 2: Country progress indicators and data, 2004 to 2010 | 2010 GLOBAL REPORT
Males Females Both sexesSurvey Year
15-49 15-49 15-24 25-49
20031
PERCENTAGE OF WOMEN AND MEN AGED 15-49 WHO HAVE HAD SEXUAL INTERCOURSE WITH MORE THAN ONE PARTNER IN THE LAST 12 MONTHS
Iran, Islamic Republic of
Jamaica
Japan
Kazakhstan
Kenya 1998 24 3 16 11
Kyrgyzstan
Lebanon
Lesotho
Liberia
Lithuania
Madagascar
Malawi 2000 15 1 6 9
Mali 1996 13
Malta
Marshall Islands
Mauritius
Mexico
Micronesia, Federated States of
Moldova
Mongolia
Morocco
Mozambique
Myanmar
Namibia 2000 16 2 9 10
Nepal 2001 3
Nicaragua 2001 1
Niger 1998 10 1 7 5
Nigeria
Palau
Panama
Papua New Guinea
Paraguay
Peru 1996 23 <1 4 9
Philippines
Poland
Portugal
Russian Federation
Rwanda 2000 2 <1 1 2
Saint Kitts and Nevis
Saint Lucia
Saint Vincent and the Grenadines
Sao Tome and Principe
Senegal
Serbia
Seychelles
Sierra Leone
Singapore
Solomon Islands
South Africa
Spain
Sri Lanka
Sudan

309
A2
Annex 2: Country progress indicators and data, 2004 to 2010 | 2010 GLOBAL REPORT
Males MalesFemales FemalesBoth sexes Both sexesSurvey Year
Survey Year
15-49 15-4915-49 15-4915-24 15-4925-49 15-19 20-24 25-49
20051 20074
2004 48 11 29
2007 25 5 15 9 23 15
2003 12 2 7 7 2003 12 2 5 3 6 5
2007 28 2 15 10 21
2004 24 4 17
2004 21 8 11 16 2005 30 11 16
2007 43 26 41 <1 <1 41
2004 17 3 11 9 2004 20 3 7
2004 9 1 4 6 2005 1 1 1 2 1 1
2001 17 1 5 11 2006 23 2 5 5 4 1
2006 23 18 21 19 30
2004 9 1 5 4 5 6
2003 8 6 9
2005 11 1 9 4 2007 16 2 8 11 19 5
2005 54 54
2007 37 2 19 14 27
2003 30 5 18 17 2004 52 24 29 60 34 19
2007 16 3 9 10 15 7
2007 2 2 1 2 2
2006 9 1 2 5 4 2
2003 15 2 5 10 2005 19 2 10 3 10 14
2006 9 36 13 5
2007 13 2 8 6 11 7
2000 <1 2006 33 12
2003 6
2005 8 5 7
2006 20 9 15 16 26 13
2005 3 <1 1 2 2005 3 <1 2 <1 1 2
2006 53 19 36
2007 42 25 35
2006 25 10 17 13 32 9
2005 13 1 4 10 2005 25 4 8 7 11 7
2006 42 11 26 32 24 <1
2003 23 11 17
2005 9 36 21
2007 7 2 4 2 10 4
2005 3 18 10 18 15 8
2003 27 13 20
2007 3 <1 2 1 1 3

310 Annex 2: Country progress indicators and data, 2004 to 2010 | 2010 GLOBAL REPORT
Males Females Both sexesSurvey Year
15-49 15-49 15-24 25-49
20031
PERCENTAGE OF WOMEN AND MEN AGED 15-49 WHO HAVE HAD SEXUAL INTERCOURSE WITH MORE THAN ONE PARTNER IN THE LAST 12 MONTHS
Suriname
Swaziland
Sweden
Switzerland
Tajikistan
Thailand
Timor-Leste
Togo 1998 21 3 13 13
Tonga
Trinidad and Tobago
Tunisia
Turkey
Turkmenistan 2000 <1
Tuvalu
Uganda 1995 8 1 5 4
Ukraine
United Arab Emirates
United Kingdom of Great Britain and Northern Ireland
United Republic of Tanzania 1999 29 9 17 20
United States of America
Uruguay
Vanuatu
Viet Nam
Zambia 1996 27 4 18 12
Zimbabwe 1999 13 2 6 8
1 Data provided by MEASURE DHS.2 15-24 years.3 25-64 years only.4 Methodology may vary for individual countries.5 Demographic Health Survey (or Multiple Indicator Cluster Survey).

311
A2
Annex 2: Country progress indicators and data, 2004 to 2010 | 2010 GLOBAL REPORT
Males MalesFemales FemalesBoth sexes Both sexesSurvey Year
Survey Year
15-49 15-4915-49 15-4915-24 15-4925-49 15-19 20-24 25-49
20051 20074
2006 3
2007 14 2 13 15 17 15
2007 23 23 23 33 34 11
2007 18 10 14 25 26 10
2006 6 3 9
2006 18 1 9 24 18 7
2007 26 6 16 10 22 17
2007 94 79 85
2007 15 15 19 20 11
2001 18 2 6 12 2006 21 2 12 3 9 16
2007 21 7 14 18 23 11
2001 25 15 20 30 35 16
2004 23 3 10 15 2006 20 5 13 46
2007 23 11 17 28 35 11
2005 14 2 6 9 2005 1 <1 <1 <1 1 <1
2002 21 2 10 13 2007 14 1 7 3 7 9
2006 9 1 4 6 2006 14 1 7 7 9 6

312 Annex 2: Country progress indicators and data, 2004 to 2010 | 2010 GLOBAL REPORT
PERCENTAGE OF WOMEN AND MEN AGED 15-49 WHO HAVE HAD SEXUAL INTERCOURSE WITH MORE THAN ONE PARTNER IN THE LAST 12 MONTHS
Males Females MalesSurvey Year
15-49 15-49 15-19 20-24 25-49
20094
Albania 2008 5 0 2 15
Angola 2009 25 3 10 31 27
Antigua and Barbuda
Armenia
Azerbaijan 2006 6 3 16 5
Bangladesh 2005 12 39 28 9
Belarus 2009 22 10 28 17 18
Belize 2009 15 5 11 27 14
Benin 2006 21 1 5 18 27
Bolivia 2008 12 10 21 11
Bosnia and Herzegovina 2009 64
Botswana 2008 16 7 5 26 16
Brazil 2008 76 57 66 74 78
Bulgaria 2009 29 12 27 43
Burkina Faso 2008 27 2 24 26 27
Burundi 2007
Côte d’Ivoire 2005 31 5 32 33 30
Cambodia 2005 6 0 2 9 7
Cameroon 2004 40 9 35 45 40
Canada
Cape Verde 2009 54 42 93 80 36
Central African Republic 2006 21 6 12 29
Chad 2004 17 1 7 20 21
Chile 2009 21 7 16 29 21
Colombia 2005 3
Comoros 2003 24 4
Congo, Republic of the 2009 29 7 9 34 33
Costa Rica
Cuba 2008 34 12
Cyprus
Czech Republic 2008 29 21 47 36 26
Democratic People’s Republic of Korea
Democratic Republic of the Congo 2007 17 3 10 19 18
Djibouti 2008 70 90
Dominican Republic 2007 30 4 33 43 27
Equatorial Guinea 2006
Eritrea
Estonia 2007 23 21 14 31
Ethiopia 2005 3 0 0 2 4
Gabon 2010 57 33 54 63 55
Gambia
Germany 2009 13 7 23 30 10
Ghana 2008 11 1 3 10 15
Greece 2009 32 22 50 35 28
Grenada
Guatemala 2008 12 1 13 18 10
Guinea 2008
Guinea-Bissau 2008 37 10 31 41 41
Guyana 2009 10 1 8 18 9
Haiti 2005 23 1 13 29 26 UNGASS Indicator 16

313
A2
Annex 2: Country progress indicators and data, 2004 to 2010 | 2010 GLOBAL REPORT
Survey year
Males Females
MOST RECENT DHS (OR MICS)5
Females
15-19 20-24 25-49 15-49 15-49
0 0
4 4 2
2005 9 0
2006 6 0
2007
9 26 5
4 6 5
1 1 0 2006 21 1
2008 12
4 13 7
56 63 55
10 14
6 3 2 2003 15 1
7 6 3 2005 24 4
0 0 0 2005 6 0
20 11 6 2004 31 6
71 62 27 2005 36 3
5 7 2006
1 1 1 2004 17 1
5 10 6
4 6 2 2005 3
9 10 5 2009 29 7
43 28 18
3 4 3 2007 17 3
56 85
10 7 2 2007 24 3
1995 6
19 22
0 0 0 2005 2 0
34 44 28 2000 46 14
14 17 5
1 2 1 2008 11 1
28 27 17
1 1 1
2005 25 2
9 13 9
1 2 1 2009 1
1 2 1 2005 23 1
20094

314 Annex 2: Country progress indicators and data, 2004 to 2010 | 2010 GLOBAL REPORT
PERCENTAGE OF WOMEN AND MEN AGED 15-49 WHO HAVE HAD SEXUAL INTERCOURSE WITH MORE THAN ONE PARTNER IN THE LAST 12 MONTHS
Males Females MalesSurvey Year
15-49 15-49 15-19 20-24 25-49
20094
Honduras 2006 19 1 32 29 14
Hungary 2009 85 25
India 2009 9 3 1 5 1
Indonesia 2007 0 0 0 0
Iran, Islamic Republic of 2008 12 1 11 14
Jamaica 2008 62 17 50 81 61
Japan 1999 22 7
Kazakhstan 2008 22 4 16 31 21
Kenya 2008 9 1 4 12 11
Kyrgyzstan 2009 22 1 16 32
Lebanon 2004
Lesotho
Liberia 2006 22 7 16 27 21
Lithuania 2008 26 8
Madagascar 2009 14 24 15
Malawi 2004 9 1 5 9 11
Mali 2006 25 6 93 64 20
Malta 2009 7 3 11 23 8
Marshall Islands 2007 32 15 59 47 16
Mauritius 2008 23 3 41 26
Mexico
Micronesia, Federated States of 2006 45 18
Moldova 2009 18 2 17 29 15
Mongolia
Morocco 2007 37 2
Mozambique 2009 20 3 10 24 22
Myanmar 2006 13 0 1 11 17
Namibia 2006 11 2 6 17
Nepal
Nicaragua 2007 2
Niger 2006 9 1 76 27 5
Nigeria 2007 19 4 6 18 26
Palau 2008 9
Panama 2009 45 41 31 54 48
Papua New Guinea 2007 37 1 62 38 34
Paraguay 2008 6
Peru 2008 14 1 18 25 9
Philippines
Poland
Portugal 2007 27 9 45 43 23
Russian Federation 2008 21 9 32 36 16
Rwanda 2005 3 0 0 1 4
Saint Kitts and Nevis 2005
Saint Lucia 2007 42 25
Saint Vincent and the Grenadines 2008 24 10 16 52 13
Sao Tome and Principe 2008 22 1 21 23
Senegal 2005 13 1 4 9 19
Serbia 2006 11 1 11 25 8
Seychelles
Sierra Leone 2008 21 5 12 23 34
Singapore

315
A2
Annex 2: Country progress indicators and data, 2004 to 2010 | 2010 GLOBAL REPORT
Survey year
Males Females
MOST RECENT DHS (OR MICS)5
Females
15-19 20-24 25-49 15-49 15-49
1 1 0 2005-06 1
0 0 0 2005-06 1 0
1 1
17 23 14
2 8 4
1 2 1 2003 12
0 2
2004 21 8
12 8 6 2007 18 6
3 2 2 2003-04 17 3
1 1 1 2004 9 1
21 9 2 2006 15 1
3 4 2
31 22 7 2007 7 3
2 3
3 5 1 2005 11 1
4 4 2 2009 3
0 0 0
1 4 2006 11 2
2006 2 0
1 2 2001 1
1 1 1 2006 12 1
3 5 4 2008 10 1
36 13 5
23 41 46
0 0 1
7 8 4
1 3 1 2004-08 1
2003 6
26 22 7
14 13 8
0 0 0 2000 2 0
10 15 5
3 2 18 2
1 1 2 2005 13 1
1 4 1
7 6 12 2008 16 4
20094

316 Annex 2: Country progress indicators and data, 2004 to 2010 | 2010 GLOBAL REPORT
PERCENTAGE OF WOMEN AND MEN AGED 15-49 WHO HAVE HAD SEXUAL INTERCOURSE WITH MORE THAN ONE PARTNER IN THE LAST 12 MONTHS
Males Females MalesSurvey Year
15-49 15-49 15-19 20-24 25-49
20094
Solomon Islands 2008 91 24 71 82
South Africa 2008 19 4
Spain 2008
South Africa 2008 19 4
Sri Lanka
Suriname 2006 1
Swaziland 2006 14 1 26 30 20
Sweden 2009 42 51 37 47
Switzerland 2007 18 10
Tajikistan 2008 15 5 8 20 16
Thailand 2006 18 1
Timor-Leste 2008 92
Togo 2007 26 6 15 31 27
Tonga 2008 19
Trinidad and Tobago
Tunisia 2009 37 14
Turkey
Turkmenistan
Tuvalu 2007 5 1 13 18 1
Uganda 2010 29 4
Ukraine 2009 23 7 18 41 20
United Arab Emirates
United Kingdom of Great Britain and Northern Ireland 2008 15 8 25 13
United Republic of Tanzania 2008 18 3 4 18 24
United States of America
Uruguay 2007 23 11 40 52 14
Vanuatu 2008 53 27
Viet Nam 2009 2 0 1 5
Zambia 2007 14 1 5 14 18
Zimbabwe 2007 28 9 18 34 29
1 Data provided by MEASURE DHS.2 15-24 years.3 25-64 years only.4 Methodology may vary for individual countries.5 Demographic Health Survey (or Multiple Indicator Cluster Survey).

317
A2
Annex 2: Country progress indicators and data, 2004 to 2010 | 2010 GLOBAL REPORT
Survey year
Males Females
MOST RECENT DHS (OR MICS)5
Females
15-19 20-24 25-49 15-49 15-49
20094
45 32 6
4 4 2 2007 14 2
49 53
1 3 7
24 18 7
7 11 4 1998 21 3
10
2000 0
0 1 1
2006 21 2
3 10 7 2007 13 2
24 5
2 3 3 2007-08 18 3
16 16 9
0 0 2005 1 0
2 1 1 2007 14 1
8 12 8 2005-06 9 1

318 Annex 2: Country progress indicators and data, 2004 to 2010 | 2010 GLOBAL REPORT
Males Females Both sexesSurvey Year
15-49 15-49 15-24 25-49
20031
PERCENTAGE OF WOMEN AND MEN AGED 15-49 WHO HAD MORE THAN ONE SEXUAL PARTNER IN THE PAST 12 MONTHS REPORTING THE USE OF A CONDOM DURING THEIR LAST SEXUAL INTERCOURSE
Albania
Angola
Antigua and Barbuda
Argentina
Armenia 2000 32
Azerbaijan
Bangladesh
Belarus
Belize
Benin
Bolivia
Bosnia and Herzegovina
Botswana
Brazil
Bulgaria
Burkina Faso 1999 55 36 56
Burundi
Côte d’Ivoire 1998 45 23 53 34
Cambodia
Cameroon 1998 23 13 27 17
Canada
Cape Verde
Central African Republic
Chad 1997 20 10 22 17
Chile
Colombia 2000 22
Congo, Republic of the
Costa Rica
Cuba
Cyprus
Democratic Republic of the Congo 1996 9 19 7 10
Djibouti
Dominican Republic
El Salvador
Equatorial Guinea
Eritrea
Estonia
Ethiopia 2000 20 11 43 10
Gabon 2000 40 26 41 29
Germany
Ghana
Greece
Grenada
Guatemala
Guinea 1999 24 9 31 17
Guinea-Bissau
Guyana
Haiti 2000 21 30 30 16
Honduras
Hungary
India
Indonesia
Iran, Islamic Republic of UNGASS Indicator 17

319
A2
Annex 2: Country progress indicators and data, 2004 to 2010 | 2010 GLOBAL REPORT
Males MalesFemales FemalesBoth sexes Both sexesSurvey Year
Survey Year
15-49 15-4915-49 15-4915-24 15-4925-49 15-19 20-24 25-49
20051 20076
2005
2006 46 18 32 26 40 31
2006 87
2005 48 44 46 48 44
2005 58
2006
2005 35 35 42 31 36
2007 62 60 61 76 68 49
2006 72 73 71
2003 43 44 68 33 2007 36 51 38 69 61 30
2004 55 45 49
2005 38 41 59 26 2005 52 34 44 47 45 42
2005 41 2006 40 12 39 83 73 23
2004 38 35 53 28 2006 55 41 48 61 62 43
23 16 19
2005 69 57 78 59 2005 72 46 58 70 61 47
2006
2004 20 7 2004 20 7
2006 30 18 28 32 34 25
2005 31
2005 30 23 2005 43 21 30 24 29 35
2006 15 11 13 12
2006 41 33 39 72 53 30
2007 63 53 61
2002 35 33 45 27 2007 42 33 37 54 44 34
2007 64 55 61 61 64
2005 9 2005 52 24 43 38 47 34
2007 72 2 70 2 71 2 65 2 73 2 71 2
2007 58
2003 22 33 39 2006 33 54
2007 71 55 67 61 58 75
2006 68 52 61 63
2002 47 58 50
2005 24 20 38 17 2005 32 26 31 35 43 27
2005 53 56 2005 53 56 53
2005 34 21 49 23 2006 34 21 33 41 53 23
2006 27 2006 38 32 37
2006 23 12 2006 67 62 66 61 68 66

320 Annex 2: Country progress indicators and data, 2004 to 2010 | 2010 GLOBAL REPORT
Males Females Both sexesSurvey Year
15-49 15-49 15-24 25-49
20031
Jamaica
Japan
Kazakhstan
Kenya 1998 36 18 38 30
Kyrgyzstan
Lebanon
Lesotho
Liberia
Lithuania
Madagascar
Malawi 2000 14 15 26 7
Mali 1996 34
Malta
Marshall Islands
Mauritania
Mauritius
Mexico
Micronesia, Federated States of
Moldova
Mongolia
Morocco
Mozambique
Myanmar
Namibia 2000 65 45 72 56
Nepal
Nicaragua 2001 19
Niger 1998 26 28
Nigeria
Palau
Panama
Papua New Guinea
Paraguay
Peru 2000 15
Philippines
Portugal
Russian Federation
Rwanda 2000 28 30
Saint Kitts and Nevis
Saint Lucia
Saint Vincent and the Grenadines
Samoa
Sao Tome and Principe
Senegal
Serbia
Sierra Leone
Singapore
South Africa
Spain
Suriname
Swaziland
Sweden
Switzerland
PERCENTAGE OF WOMEN AND MEN AGED 15-49 WHO HAD MORE THAN ONE SEXUAL PARTNER IN THE PAST 12 MONTHS REPORTING THE USE OF A CONDOM DURING THEIR LAST SEXUAL INTERCOURSE

321
A2
Annex 2: Country progress indicators and data, 2004 to 2010 | 2010 GLOBAL REPORT
Males MalesFemales FemalesBoth sexes Both sexesSurvey Year
Survey Year
15-49 15-4915-49 15-4915-24 15-4925-49 15-19 20-24 25-49
20051 20076
2004 67 53 64
2007 82 82 82 88 93 77
2003 33 12 47 17 2003 33 12 30 48 47 17
2007 81 75 80 85 78
2004 72 67 72
2004 41 19 47 26 2004 41 19 34 49 40 26
2007 46 20 44 44
2004 9 2 12 6 2004 13 5 8 8 8 8
2004 20 16 32 13 2004 47 30 38 35 47 33
2001 16 14 27 13 2006 38 17 20 19 29 34
2006 19 15 18 17 19
2007 10 10
2004 44 46 44 50 43 43
2003 20 78 14
2005 45 22 56 28 2007 48 60 49 45 50 52
2005 34 34
2007 61 75 62 63 61
2003 19 14 38 10 2003 19 14 18 28 28 10
2007 74 66 68 79 76 60
2006 54
2001 19
2006 7 8
2003 22 13 34 17 2005 62 44 56 44 56 62
2006 23 60
2007 45 26 43 50 49 38
2006 48 59 43
2003 22 2003 22
2005 8 14 2005 8 14 8
2006 67
2007 48 39 45
2006 62 52 59 59 59
2006 57 3 60 59
2005 31 21 61 22 2005 62 37 52 39 51 59
2006 73 78
2007 11 26 37
2007 51 0 42 50 14 51
2005 67 47 64 80 72 56
2003 50 42 46
2006 49
2007 56 57 56 62 51
2007 62 52 58 83 61 48

322 Annex 2: Country progress indicators and data, 2004 to 2010 | 2010 GLOBAL REPORT
Males Females Both sexesSurvey Year
15-49 15-49 15-24 25-49
20031
Tajikistan
Thailand
Timor-Leste
Togo 1998 33 21 42 25
Tonga
Tunisia
Turkey
Tuvalu
Uganda 1995 18 8 24 9
Ukraine
United Kingdom of Great Britain and Northern Ireland
United Republic of Tanzania 1999 22 16 25 17
Uruguay
Viet Nam
Zambia 1996 31 18 36 23
Zimbabwe 1999 40 46 56 30
1 Data provided by MEASURE DHS.2 data from two cities only.3 female is 15-24 years only.4 No reference 4.5 No reference 5.6 Methodology may vary for individual countries.7 Demographic Health Survey (or Multiple Indicator Cluster Survey).
PERCENTAGE OF WOMEN AND MEN AGED 15-49 WHO HAD MORE THAN ONE SEXUAL PARTNER IN THE PAST 12 MONTHS REPORTING THE USE OF A CONDOM DURING THEIR LAST SEXUAL INTERCOURSE

323
A2
Annex 2: Country progress indicators and data, 2004 to 2010 | 2010 GLOBAL REPORT
Males MalesFemales FemalesBoth sexes Both sexesSurvey Year
Survey Year
15-49 15-4915-49 15-4915-24 15-4925-49 15-19 20-24 25-49
20051 20076
2006 65 53 69
2006 53 14 51 63 49 50
2007 73 69 73 72 76 71
2007 58 53 52 71 45
2001 24 25 2006 42 41 42 30 41
2007 75 61 72 77 64 72
2001 10 5 7 15 15 5
2004 29 21 37 23 2005 50 38 44 38 41
2007 69 65 68 76 81 56
2005 58 1 0 0 0 1 0
2001 27 21 40 20 2007 50 37 46 39 49 48
2006 36 41 57 24 2006 71 47 64 50 67 68

324 Annex 2: Country progress indicators and data, 2004 to 2010 | 2010 GLOBAL REPORT
Males Females MalesSurvey Year
15-49 15-49 15-19 20-24 25-49
20096
Albania 2008 40 50
Angola 2009 42 45 48 56 35
Antigua and Barbuda
Argentina 2008
Armenia
Azerbaijan 2006 26 26 24
Bangladesh 2005 33
Belarus 2009 70 68 80 71 54
Belize 2009 66 56 81 70 61
Benin 2006 17 21 49 43 11
Bolivia 2008 35 44 39 31
Bosnia and Herzegovina 2009
Botswana 2008 82 80 83 88 79
Brazil 2008 43 34 76 58 33
Bulgaria 2009 71 64 71 70
Burkina Faso 2008 69 78 93 94 60
Burundi 2007
Côte d’Ivoire 2005 38 41 64 61 25
Cambodia 2005 41 9 86 72 24
Cameroon 2004 38 35 57 56 28
Canada
Cape Verde 2009 75 59 83 75 66
Central African Republic 2006 60 41
Chad 2004 16 7 30 18 14
Chile 2009 55 38 57 55 48
Colombia 2005 31
Congo, Republic of the 2009 28 29 49 37 24
Costa Rica
Cuba 2008 48 38
Cyprus
Democratic People’s Republic of Korea
Democratic Republic of the Congo 2007 16 7 28 19 12
Djibouti 2008 33 70
Dominican Republic 2007 45 35 72 57 35
El Salvador 2008 81
Equatorial Guinea 2006
Eritrea
Estonia 2007 61 42 66 59
Ethiopia 2005 9 24 5
Gabon 2010 35 22 30 40 34
Germany 2009 64 49 74 65 61
Ghana 2008 26 24 49 22
Greece 2009 23 17 33 25 20
Grenada
Guatemala 2008 62 24 79 68 47
Guinea 2008
Guinea-Bissau 2009 64 55 65 62 65
Guyana 2009 65 48 86 70 58
Haiti 2005 34 21 42 56 23
Honduras 2006 27
Hungary 2009 100 5 18 77
PERCENTAGE OF WOMEN AND MEN AGED 15-49 WHO HAD MORE THAN ONE SEXUAL PARTNER IN THE PAST 12 MONTHS REPORTING THE USE OF A CONDOM DURING THEIR LAST SEXUAL INTERCOURSE
UNGASS Indicator 17

325
A2
Annex 2: Country progress indicators and data, 2004 to 2010 | 2010 GLOBAL REPORT
Survey year
Males Females
MOST RECENT DHS (OR MICS)7
Females
15-19 20-24 25-49 15-49 15-49
47 51 42
2005 58
2006 26 0
69 77 46
58 77 50
20 35 10 2006 17 21
2008 35
85 83 78
52 37 30
60 65
76 86 75 2003 43 44
45 45 35 2005 38 41
0 100 2 2005 41 8
47 37 27 2004 38 35
78 60 41 2005 69 57
2006
2004 16 7
49 34 31
35 36 27 2005 31
24 26 33 2009 28 29
7 10 7 2007 16 8
47 90
37 31 36 2007 45 35
83 79 81
1995 54
56 33
2005 9
24 30 18 2000 40 26
58 51 45
2008 26 18
23 24 11
13 43 23
2005 24 20
57 46 66
48 2009 65 48
31 18 19 2005 34 21
34 17 26 2005-06 27
20096

326 Annex 2: Country progress indicators and data, 2004 to 2010 | 2010 GLOBAL REPORT
Males Females MalesSurvey Year
15-49 15-49 15-19 20-24 25-49
20096
India 2009 79 100 70 100
Indonesia 2007 60 100 58
Iran, Islamic Republic of 2008 55 63 52 59
Jamaica 2008 65 52 90 65 52
Japan 2008 77
Kazakhstan 2008 72 64 83 84 65
Kenya 2008 37 32 69 67 20
Kyrgyzstan 2009 81 62 87 77
Lebanon 2004
Lesotho 2009 60 60
Liberia 2006 23 12 29 28 21
Lithuania 2008 65 60
Madagascar 2008 3 5 3
Malawi 2004 20 16 31 36 14
Mali 2006 39 17 31 40 43
Malta 2009 80 72 85 85 76
Marshall Islands 2007 20 10 21 25 14
Mauritania
Mauritius 2008 37 15 47 26
Mexico
Micronesia, Federated States of 2006
Moldova 2009 52 38 81 59 40
Mongolia
Morocco 2007 61 75
Mozambique 2009 22 23 41 35 15
Myanmar 2006 45 0 67 71 40
Namibia 2006 74 66 84 81
Nepal
Nicaragua 2007 19
Niger 2006 7 8 4
Nigeria 2007 66 39 94 81 49
Palau 2008 0 23 0 0 0
Panama 2009 25 9 47 32 18
Papua New Guinea 2008 40 0 38 43 39
Paraguay 2008 5
Peru 2008 72 25 73 80 65
Philippines
Portugal 2007 55 46 74 71 47
Russian Federation 2008 52 45 62 64 43
Rwanda 2005 25 19 25
Saint Kitts and Nevis 2005
Saint Lucia 2007 48 39
Saint Vincent and the Grenadines 2008 62 62
Samoa 2008
Sao Tome and Principe 2008 60 48 65 63
Senegal 2005 62 37
Serbia 2006 71 61 83 77 64
Sierra Leone 2008 15 7 14 34
Singapore
South Africa 2008 77 68
Spain 2008
PERCENTAGE OF WOMEN AND MEN AGED 15-49 WHO HAD MORE THAN ONE SEXUAL PARTNER IN THE PAST 12 MONTHS REPORTING THE USE OF A CONDOM DURING THEIR LAST SEXUAL INTERCOURSE

327
A2
Annex 2: Country progress indicators and data, 2004 to 2010 | 2010 GLOBAL REPORT
Survey year
Males Females
MOST RECENT DHS (OR MICS)7
Females
15-19 20-24 25-49 15-49 15-49
2005-06 23 12
60 67
45 64 48
76
71 70 59
36 2003 33 12
100 56
39 48 2004 41 19
11 22 9 2007 22 14
4 2 8 2003-04 9 2
16 23 9 2004 20 16
14 21 17 2006 12 8
80 50 75
9 7 14
17 14
60 14 50 2005 45 22
31 32 15 2009 22 24
0 0
77 46 2006 74 66
2006 30
12 30 16 2001 19
8 2006 7 8
69 37 28 2008 33 23
0 0 60
17 14 7
0
5 8 4
82 32 8 2007 31
2008
65 55 39
56 50 41
2005 8 14
55 50
59
53 54 2008-09 33 28
2005 32 21
67 71 53
11 14 4 2008 15 7
20096

328 Annex 2: Country progress indicators and data, 2004 to 2010 | 2010 GLOBAL REPORT
Males Females MalesSurvey Year
15-49 15-49 15-19 20-24 25-49
20096
Suriname 2006 80
Swaziland 2006 56 55 74 64 50
Sweden 2009 36 27 33 38
Switzerland 2007 99 87
Tajikistan 2008 60 19 74 61 55
Thailand 2006 53 14
Timor-Leste 2008 25
Togo 2007 73 69 73 77 72
Tonga 2008 22
Tunisia 2009
Turkey
Tuvalu 2007 45
Uganda 2010 16 9
Ukraine 2009 60 61 84 73 51
United Kingdom of Great Britain and Northern Ireland 2008 82 75
United Republic of Tanzania 2008 16 7 10 27 15
Uruguay 2007 69 65 78 80 56
Viet Nam
Zambia 2006 27 33 50 40 23
Zimbabwe 2005 36 41 71 56 22
1 Data provided by MEASURE DHS.2 data from two cities only.3 female is 15-24 years only.4 No reference 4.5 No reference 5.6 Methodology may vary for individual countries.7 Demographic Health Survey (or Multiple Indicator Cluster Survey).
PERCENTAGE OF WOMEN AND MEN AGED 15-49 WHO HAD MORE THAN ONE SEXUAL PARTNER IN THE PAST 12 MONTHS REPORTING THE USE OF A CONDOM DURING THEIR LAST SEXUAL INTERCOURSE

329
A2
Annex 2: Country progress indicators and data, 2004 to 2010 | 2010 GLOBAL REPORT
Survey year
Males Females
MOST RECENT DHS (OR MICS)7
Females
15-19 20-24 25-49 15-49 15-49
52 56 55 2007 56 55
26 29
20 42 15
63 49 50
69 72 64 1998 33 21
19
2006 20 24
100 75 54 2007 46 48
10 8 6 2007-08 22 21
71 86 56
2005 58
2007 28 33
43 2005-06 36 41
20096

330 Annex 2: Country progress indicators and data, 2004 to 2010 | 2010 GLOBAL REPORT
Males FemalesTime Period
15-24 15-24PERCENTAGE OF YOUNG PEOPLE AGED 15-24 YEARS WHO SAY THEY USED A CONDOM THE LAST TIME THEY HAD SEX WITH A NON-MARITAL, NON-COHABITING PARTNER, OF THOSE WHO HAVE HAD SEX WITH SUCH A PARTNER IN THE LAST 12 MONTHS.
Albania 2008-2009 55 25
Armenia 2005 86
Armenia 2000 44
Azerbaijan 2006 31
Belize 2006 50
Benin 2006 45 28
Benin 2001 35 19
Benin 1996 9
Bolivia 2008 49
Bolivia 2003 37 20
Bosnia and Herzegovina 2006 – 71
Botswana 2001 88 75
Botswana 1996 85
Brazil 2004
Brazil 1996 59 32
Bulgaria 2005 70 57
Burkina Faso 1998–1999 56 41
Burkina Faso 2006 64
Burkina Faso 2003 67 54
Burundi 2005 25
Cambodia 2005 84
Cameroon 2006 62
Cameroon 2004 57 47
Cameroon 1998 31 16
Cape Verde 2005 79 56
Central African Republic 2006 60 41
Chad 2004 25 17
Colombia 2005 36
Colombia 2000 30
Congo 2005 38 20
Congo, Democratic Republic of the 2007 27 17
Côte d’Ivoire 1998–1999 56 25
Côte d’Ivoire 2005 53 39
Djibouti 2005 51 26
Dominican Republic 2007 70 44
Dominican Republic 2002 52 29
Dominican Republic 1996 48 12
Eritrea 1995 81
Ethiopia 2005 50 28
Ethiopia 2000 31 17
Gabon 2000 48 33
Gambia 2006 54
Gambia 2000
Ghana 2008 46 28
Ghana 2006 56 42
Ghana 2003 52 33
Guinea 2005 37 26
Guinea 1999 32 17
Guinea-Bissau 2006 39
Guyana 2005 68 62
Haiti 2005–2006 43 29
Haiti 2000 30 19
Honduras 2005-2006 24
Supplemental data obtained by UNICEF through the Multiple Indicator Cluster Survey and Demographics Health Survey programmes. MDG 6a indicator

331
A2
Annex 2: Country progress indicators and data, 2004 to 2010 | 2010 GLOBAL REPORT
Males MalesFemales FemalesTime Period
Time Period
15-24 15-2415-24 15-24
India 2005–2006 37 22
India 2001 59 51
Kazakhstan 1999 65 32
Kenya 2008-2009 64 40
Kenya 2003 47 25
Kenya 1998 43 14
Kyrgyzstan 2006 56
Lesotho 2004 48 50
Liberia 2007 22 14
Madagascar 2003-2004 12 5
Malawi 2006 58 40
Malawi 2004 47 35
Malawi 2000 38 32
Mali 1995–1996 31
Mali 2006 36 17
Mali 2001 30 14
Marshall Islands 2007 22 9
Moldova 2008 76 60
Moldova 2005 63 44
Montenegro 2006 66
Mozambique 2008 44
Mozambique 2003 33 29
Namibia 2006-2007 81 64
Namibia 2000 69 48
Nauru – 17 10
Nepal 2006 78
Nepal 2001 52
Nicaragua 2001 17
Niger 2006 37 18
Niger 1998 30 7
Nigeria 2008 49 36
Nigeria 2007 39
Nigeria 2003 46 24
Peru 2004-2006 34
Peru 2004–2005 32
Peru 2000 19
Philippines 2008 13
Philippines 2003 25 11
Rwanda 2005 40 26
Rwanda 2000 55 23
Sao Tome and Principe 2008-2009 63 54
Sao Tome and Principe 2006 56
Senegal 2005 52 36
Serbia 2006 74
Sierra Leone 2008 22 10
Sierra Leone 2005 20
Solomon Islands 2007 26 17
South Africa 2003 72 52
South Africa 1998 20
Suriname 2006 49
Swaziland 2006–2007 70 54
Tanzania, United Republic of 2007-2008 49 46
Tanzania, United Republic of 2004–2005 46 34
Tanzania, United Republic of 2003–2004 47 42
Tanzania, United Republic of 1999 31 21
Tanzania, United Republic of 1996 31 18
The former Yugoslav Republic of Macedonia 2005 70
Togo 2006 50
Togo 1998 41 22
Trinidad and Tobago 2006 51
Tuvalu 2007 44 –
Uganda 2004–2005 55 53
Uganda 2006 55 38
Uganda 2001 62 44
Uganda 1995 42 25
Ukraine 2007 71 68
Uzbekistan 2006 61
Uzbekistan 2002 50
Viet Nam 2005 68
Zambia 2001–2002 42 33
Zambia 2007 48 38
Zambia 2005 38 26
Zambia 2003 40 35
Zambia 2000 41 38
Zambia 1996 39 20
Zimbabwe 2005–2006 68 42
Zimbabwe 1999 69 42
Zimbabwe 1994 61 42

332 Annex 2: Country progress indicators and data, 2004 to 2010 | 2010 GLOBAL REPORT
Males Females Both sexesSurvey Year
15-49 15-49 15-19 20-24 25-49 15-49
2007PERCENTAGE OF WOMEN AND MEN AGED 15-49 WHO RECEIVED AN HIV TEST IN THE LAST 12 MONTHS AND WHO KNOW THEIR RESULTS
Afghanistan 2007 27
Albania
Algeria 2006 0 1 0 1 1 1 1
Angola 2006 7 4 5
Antigua and Barbuda 2006 25
Argentina 2005 8 4 12
Armenia
Austria
Azerbaijan
Bahamas
Barbados 2006 97 1 99 1 99 1
Belarus 2007 26 33 26 35 31 31
Belgium 8 9 5 10 9
Belize 2006 10 20 15
Benin 2006 12 15 7 17 15 14
Bhutan
Bolivia 2007 87 1 87 1 86 1 88 1 87 1 87 1
Bosnia and Herzegovina 2006 0 0 0 0
Botswana
Brazil
Bulgaria
Burkina Faso 2007 18 23 15 28 27 21
Burundi 2007 91 1 93 1 91 1 92 1 93 1 92 1
Côte d’Ivoire 2005 3 4 2 3 4 3
Cambodia 2006 5 3 2 6 4 4
Cameroon 2004 7 5 3 6 6 5
Canada 2006 32
Cape Verde 2005 10 10 3 13 13 10
Central African Republic 2006 15 17 10 19 17 16
Chad 2004 2 1 0 1 1 1
Chile 2007 22 35 8 33 48 28
China 2006 2 2 2
Colombia 2007 11 2 27 2 19 2
Congo, Republic of the 2005 3 3 1 4 4 3
Costa Rica 2007 8 1 7 1 80 1 12 1
Cuba 2006 28 32 17 32 32 30
Cyprus
Democratic Republic of the Congo 2007 4 4 2 5 5 4
Djibouti
Dominican Republic 2007 19 21 8 22 23 20
Ecuador 2007 11 7 13 12
El Salvador
Equatorial Guinea
Eritrea 2007 6
Estonia
Ethiopia 2005 2 2 2
Gabon 2007 50 1 64 1 33 1 54 1 62 1 59 1
Gambia 2005 8 12 10
Germany 2007 14 11 13
Ghana 2006 UNGASS Indicator 7

333
A2
Annex 2: Country progress indicators and data, 2004 to 2010 | 2010 GLOBAL REPORT
Males Females Survey Year
Males FemalesSurvey Year
15-49 15-49 15-49 15-19 20-24 25-49 15-19 20-24 25-49 15-49 15-49
2009 MOST RECENT DHS (OR MICS)
Both sexes Males Females
2008 1 0 0 1 0 0
2009
2009 6 12 9 2 5 10 7 15 13
2009 35 65 80
2008 23
2005
2009 100
2006
2009 1 4 2 1 4
2009 16 17 16 10 15 22 11 19 23
2009 30 42 37 12 32 35 15 52 46
2009 92 98 95 85 90 94 90 86 100 2006 5% 7%
2008 2 2 2 1 3 2 1 3 2 2008 2%
2009 91 62 93
2008 38 62 41 29 36 39 71 65 61
2008 10 16 13
2009 8 7 8
2007 23 18 21 2003 2%
2008 16 16 16
2005 3 4 3 2 2 4 2 3 5 2005 3% 4%
2005 5 3 4 1 8 6 2 5 3 2005 5% 3%
2004 14 10 11 3 11 20 5 10 12 2004 7% 5%
2009 19 32 26 3 23 25 13 50 38 2005 10% 10%
2006 15 17 16 2006 6%
2004 2 0 1 1 2 2 1 1 0 2004 2% 1%
2009 19 40 30 7 26 39 17 53 66
2007 22 36 30 2005
2009 7 8 8 2 6 9 5 11 9 2009 9% 9%
2008 26 32 29
2009
2007 4 4 4 1 4 5 2 4 4 2007 4% 4%
2008 14 55 14 48
2007 19 21 20 5 17 24 12 12 22 2007 19% 21%
2008 10 8 14 10
2006 33
2008 10 15 13 7 11 11 6 29 14
2005 2 2 2 4 2 4 1 2005 2% 2%
2010 44 66 57 12 26 64 36 51 79
2009 14 12 13 7 17 14 6 16 12
2009 4 7 2 6 5 3 8 7 2008 4% 7%

334 Annex 2: Country progress indicators and data, 2004 to 2010 | 2010 GLOBAL REPORT
Males Females Both sexesSurvey Year
15-49 15-49 15-19 20-24 25-49 15-49
2007PERCENTAGE OF WOMEN AND MEN AGED 15-49 WHO RECEIVED AN HIV TEST IN THE LAST 12 MONTHS AND WHO KNOW THEIR RESULTS
Greece 2007 13 11 5 9 16 12
Grenada 2006 6 13 3 19 10 10
Guatemala
Guinea 2005 3 1 1 2 2 2
Guinea-Bissau 2006 5
Guyana 2005 10 11 7 17 11 11
Haiti 2006 5 8 3 8 8 7
Honduras 2006 21 1 23 1 23 1
Hungary 2007 0 0 0
India 2006 1 1 0 2 2 1
Israel 16 14 14 15
Jamaica 2004 12 19 17 16
Japan 2006 98 1
Kazakhstan 2007 4 5 2 4 5 7
Kenya 2003 8 7 4 9 7 14
Lesotho 2005 5 6 2 7 8 6
Liberia
Lithuania 2007 24 1 20 1 24 1 24 1
Madagascar 2004 1 3 0 3
Malawi 2007 11 1
Malaysia 2007 75 1
Mali 2006 3 7 2 4 3 5
Marshall Islands 2006 56 1 67 1 67 1 50 1 60 1
Mauritania 2007 10 3 5
Mauritius 2004 3 1 2 1 2 1
Mexico 2006 1 1
Moldova 2007 6 11 3 10 10 8
Mongolia
Montenegro 2006 3 1 4 3
Morocco 2007 6 1 4 1 3 1 6 1 5 1
Mozambique 2004 2 2 3 3 2 2
Myanmar
Namibia 2007 18 29 9 26 27 23
Nauru
Nicaragua 2007 5 2 4 7 5
Niger 2006 4 2 2 2 3 2
Nigeria 2005 9 8 3 8 11 9
Oman
Palau 2006 16 1 27 1 20 1 14 1
Panama
Papua New Guinea
Peru
Philippines 2003 2
Poland 2007 1 1
Portugal
Russian Federation 2007 30 1 38 1 20 1 35 1 37 1 34 1
Rwanda 2005 11 12 4 16 13 11
Saint Kitts and Nevis 2006 10 1 10 1
Saint Lucia 2007 34 1 39 1 36 1
Saint Vincent and the Grenadines 2006 8 12 6 12 12 10
Sao Tome and Principe
Senegal 2005 2 1 1 1 1 1

335
A2
Annex 2: Country progress indicators and data, 2004 to 2010 | 2010 GLOBAL REPORT
Males Females Survey Year
Males FemalesSurvey Year
15-49 15-49 15-49 15-19 20-24 25-49 15-19 20-24 25-49 15-49 15-49
Both sexes Males Females
2009 22 11 18 8 23 23 5 14 12
2009 96 87 88 98 27 96 85 100 88
2008 3 4 4 2 3 4 3 6 4
2008 4 2005 3% 1%
2008 12 11 11 9 14 14 7 14 12
2009 22 27 25 2005 10% 11%
2005 5 8 7 2 6 10 4 10 8 2005 5% 8%
2006 21 23 23 4 19 27 10 27 27
2009 3 3 3 2 3 4 1 3 5 2005-06 1% 1%
2008 20 35 28 8 22 27 26 49 35
2008 20 24 22 12 21 22 15 29 25
2008 23 29 13 25 26 18 39 30 2003 8% 7%
2009 2004 5% 6%
2006 2 2 2 0 3 3 2 2 1 2007 2% 2%
2009 16 20 18
2008 16 22 18 29 2004 1% 0%
2004 8 7 4 10 5 10 2004 8% 7%
2009 98
2006 3 3 3 1 3 3 3 4 3 2006 3% 3%
2007 22 22 22 17 23 24 18 27 21
2007 10 3 5
2008 6 6 6 4 8 3 9
2009 10 16 13 5 9 11 8 19 18 2005 10% 12%
2008 32 32 9 42 33
2009 1
2007 6 4 5
2009 9 14 12 6 12 9 13 19 13 2009 9% 15%
2006 12 11 11 5 11 13 7 12 12
2006 18 29 6 16 13 36 2006 18% 29%
2009 100 100 100 100 100 100 100 100 100
2007 5
2006 4 2 2 1 2 5 2 2 2 2006 2% 1%
2007 12 11 12 5 9 16 5 13 14 2008 7% 7%
2009 100
2008 18 18 8 47 45
2009 10 12 12 3 11 12 9 17 12
2008 6 4 5 0 8 7 0 8 3
2008 5 30 22 1 6 7 10 26 36 2007
2008 1 0 1 2008 1%
2009
2009 18 17 18 8 21 18 8 30 15
2009 32 34 33 32 43 30 23 31 36
2005 11 12 11 4 14 13 5 17 13 2005 11% 12%
2005 10 17 15
2007 34 39 36
2008 8 12 12 4 12 9 8 12 16
2009 100 100 100 100 100 100 100 100 100 2008-09 23% 31%
2005 2 1 1 1 1 2 1 1 1 2005 2% 1%
2009 MOST RECENT DHS (OR MICS)

336 Annex 2: Country progress indicators and data, 2004 to 2010 | 2010 GLOBAL REPORT
Males Females Both sexesSurvey Year
15-49 15-49 15-19 20-24 25-49 15-49
2007PERCENTAGE OF WOMEN AND MEN AGED 15-49 WHO RECEIVED AN HIV TEST IN THE LAST 12 MONTHS AND WHO KNOW THEIR RESULTS
Seychelles 2006 100 1 100 1 100 1 100 1 100 1 100 1
Sierra Leone 2007 8 1 9 1 9 1
Singapore 2007 9 7 0 13 8 8
Slovakia
Solomon Islands
Somalia 2004 5 1 3 1 4 1
South Africa 2006 90 1 90 1 90 1 90 1 90 1 90 1
Spain 2003 25
Sri Lanka 2007 0 1 0 1 0 1 0 1 0 1 0 1
Sudan
Suriname 2006 30
Swaziland 2007 9 22 6 18 21 16
Sweden
Switzerland 2007 7 7 5 7 7 7
Tajikistan 2007 4 1 2 1 2 1 5 1 3 1
Thailand 2006 16 22 16 22 19 19
The former Yugoslav Republic of Macedonia 2006 3 2 3 3
Togo 2007 16 15 10 17 17 16
Tonga
Trinidad and Tobago 2006 8 1
Tunisia
Turkey 2006 100 1 100 1 100 1 100 1 100 1 100 1
Tuvalu
Uganda 2006 10 12 12
Ukraine 2007 11 1 20 1 12 1 19 1 16 1 16 1
United Kingdom of Great Britain and Northern Ireland 2006 1 1 3 1 2 1
United Republic of Tanzania 2007 36
Uruguay 2007 20 19 15 20 20 20
Vanuatu
Viet Nam 2005 3 2 1 3 3 2
Zambia 2007 12 19 10 19 17 15
Zimbabwe 2006 7 7 4 9 7 7
1 Methodology not harmonized with UNGASS 2008 guidelines.2 14-26 years.3 15-24 years.

337
A2
Annex 2: Country progress indicators and data, 2004 to 2010 | 2010 GLOBAL REPORT
Males Females Survey Year
Males FemalesSurvey Year
15-49 15-49 15-49 15-19 20-24 25-49 15-19 20-24 25-49 15-49 15-49
Both sexes Males Females
2008 3 4 0 2 5 3 6 4 2008 3% 4%
2009 2
2008 3 7 5 2 5 4 5 33
2003 5 3 4
2008 25
2008
2009 29
2006 30
2006 9 22 16 2 7 15 10 28 25 2007 9% 22%
2007 12 22 18 4 20 20 9 25 31
2009
2008 9 5 7 2 9 11 0 6 7
2006 16 22 19 16 22 19
2005 3 2 3 3
2007 16 15 16 13 16 18 9 19 17
2008 73 2
2009 3 1 2
2009 14
2007 13 3 6 3 15 16 3 4 3
2010 20 2006 10% 12%
2009 12 15 13 9 12 12 9 18 15 2007 7% 12%
2008 3 6 4 2 5 2 5 11 6
2008 19 19 19 11 21 22 15 23 20 2007-08 19% 19%
2007 19 17 18 4 27 22 9 20 18
2008 12 11 11
2005 3 2 2 2005 3% 2%
2006 12 19 15 7 14 13 13 22 20 2007 12% 19%
2005-06 7% 7%
2009 MOST RECENT DHS (OR MICS)

338 Annex 2: Country progress indicators and data, 2004 to 2010 | 2010 GLOBAL REPORT
20071 20092005
AllAll Male Female All Male Female
SEX WORKERSPERCENTAGE OF SEX WORKERS, INJECTING DRUG USERS AND MEN WHO HAVE SEX WITH MEN WHO BOTH CORRECTLY IDENTIFY WAYS OF PREVENTING THE SEXUAL TRANSMISSION OF HIV AND WHO REJECT MAJOR MISCONCEPTIONS ABOUT HIV TRANSMISSION
Afghanistan 2 2
Albania
Angola 69 69
Argentina 69 67 6 96
Armenia 49 54 4 54
Azerbaijan 43 43
Bahamas
Bangladesh 23 31 30 31 31 7 30 31
Barbados 37 3, 4 37 3
Belarus 24 50 4 50 67 67
Belize
Benin 60 60
Bolivia 48 48
Bosnia and Herzegovina
Brazil 42
Bulgaria 35 4 35 37 38 37
Burundi 4 44 2, 4 44 2 52 7 52
Côte d’Ivoire 32 4 32 32 7 32
Cameroon 40 2, 4 40 2 81 7 81
Chad 5 5
Chile
China 24 4 41 54 54
Colombia 24
Congo, Republic of the 67
Costa Rica
Croatia 40
Cuba 52 49 61 60 62 56
Czech Republic
Democratic Republic of the Congo 30 2, 4 30 2 31 31
Dominican Republic 73 73
Ecuador 47 3
El Salvador 6
Eritrea 60 60
Estonia 83 3, 4 83 3 7
Ethiopia 36 4 36 36 7 36
Gabon 24 13 25 27 39 26
Georgia 1 4 4 4 8 8
Greece 3 3
Guatemala 3 4 3 3 7 3
Guinea 4 4 4
Guinea-Bissau 31 31
Guyana 63 , 35 35
Haiti 6 4 6 6 7 6
Honduras 21 4 21 30 7 30
Hungary
India 38 24 24
Indonesia 24 28 37 26 27 7 37 25
Iran, Islamic Republic of 8 4 8 8 8
Jamaica 26 26 4 26
Kazakhstan 63 4 63 69 69
Kenya 59 UNGASS Indicator 14

339
A2
Annex 2: Country progress indicators and data, 2004 to 2010 | 2010 GLOBAL REPORT
20071 2009200720092005 2005
All AllAll AllAll MaleMale FemaleFemale All
INJECTING DRUG USERS MEN WHO HAVE SEX WITH MEN
29 29
18
56 96 7
60 68 69 56 54 74
33 7 33 38 36
45 36
14 20 5 20 19 7 19 14 27 28 7
61 58 51 68 58 59 53 63 56 72
20 20 0 42
55
22 5 22 36 31
32 62
29 28 34 37 37 39 32 38
65
36 49 48 52 57 56 63 37 55 51
3
49 85 88
54 59
71
73
59 3
25 52
75 3 75 3 74 3 7 60 3 60 7
36 41 5 41 38 38 0 2 25 7
74 10
33 33 7
67 47
36 37 7
21 8 7
100
27 24 30 30
7 58 58 68 59 7 58 69 43 42 44 7
24 24 15 24 24 15 7
63 63 63 77 76 80 66 68

340 Annex 2: Country progress indicators and data, 2004 to 2010 | 2010 GLOBAL REPORT
20071 20092005
AllAll Male Female All Male Female
SEX WORKERSPERCENTAGE OF SEX WORKERS, INJECTING DRUG USERS AND MEN WHO HAVE SEX WITH MEN WHO BOTH CORRECTLY IDENTIFY WAYS OF PREVENTING THE SEXUAL TRANSMISSION OF HIV AND WHO REJECT MAJOR MISCONCEPTIONS ABOUT HIV TRANSMISSION
Kyrgyzstan 1 36 4 36 89 89
Lao People’s Democratic Republic 21 45 45
Latvia
Lithuania 24 4 24 41 41
Madagascar 30
Malawi 38
Malaysia 78 2 38
Mali 90
Mauritania 22 7 22
Mauritius 2 2, 4
Mexico 49 54 47
Moldova 35 58 4 58 29 29
Mongolia 29 4 29 47 47
Montenegro
Morocco 72
Myanmar 71 71
Nepal 17 32 41 30 81 36
Niger 11 11
Nigeria 33 4 33 33 7 33
Pakistan 10 3 21 3 <1 3 13 23 1
Panama 91 91 92 91 7 91 92
Papua New Guinea 35 4 35 35 7 35
Paraguay 20 28 17
Peru 5
Philippines 2 2 30 30
Romania 14 14 4 14 11 11
Russian Federation 36 4 36 45 45
Rwanda 36 4 36 36 7 36
Saint Lucia
Sao Tome and Principe 72
Senegal 41 4 41 41 7 41
Serbia 14 17 13
Somalia 6
South Africa
Sri Lanka 10 4 10
Sudan 25 25
Suriname 78 75 79 21
Swaziland 46 4 46 4 32 32
Sweden 46 100 45 71 60 100
Tajikistan 41 4 41 31 31
Thailand 28 23 29 38 29 41
The former Yugoslav Republic of Macedonia 10 47 67 43 47 7 67 43
Timor-Leste 24
Togo 45 46 42 52 50 52
Tunisia 13 13
Turkey 22
Ukraine 8 48 4 48 51 51
Uzbekistan 36 36
Viet Nam 24 35 4 35 51 51
Zambia 41 41 42
1 Report date 2007, but data collection can vary from 2005-2007.
2 Data collection started before 2005.3 Methodology not harmonized with UNGASS
2008 guidelines.4 Females only.5 Males only.6 Transgender.7 Data collection started before 2008.

341
A2
Annex 2: Country progress indicators and data, 2004 to 2010 | 2010 GLOBAL REPORT
20071 2009200720092005 2005
All AllAll AllAll MaleMale FemaleFemale All
INJECTING DRUG USERS MEN WHO HAVE SEX WITH MEN
64 62 69 51 49 61 7 89
31 3
45 44 50 48
39 39
98 2 50
62 2 14 48 2
66
37 64 64 66 65 65 67 38 47
23 54
7
76 76 68
50 66 5 66 68 68 27 45 64
34 34 36 34 7 34 35 44 44 7
20 23 26
78 78 7
71 71 7
30 49
73 40 22
26 27 23 45 44 57 10 34
18 30 24 63 10 10 8 45
46 47 43 40 40 42 26 66
13 3 10 3 33 3 15 15 19
64 61 75 65
24
20
65 63 78
46 45 51 55 55 59
49 25 26
27 34 32 47 34 7 32 47 34 41 41 7
27
54
24 24 20 23
21 47 47 45 55 55 53 49 47 71
46 46 50 47
34 38 3, 5 38 3 49 49 55 3 60

342 Annex 2: Country progress indicators and data, 2004 to 2010 | 2010 GLOBAL REPORT
20071 2009
All Male Female All Male Female
SEX WORKERSPERCENTAGE OF SEX WORKERS, INJECTING DRUG USERS, AND MEN WHO HAVE SEX WITH MEN REACHED WITH HIV PREVENTION PROGRAMMES1
Afghanistan 113 9 3 11 3 1 1
Angola 17 23 23
Argentina 82 90
Armenia 41 4 41
Azerbaijan 6 6
Bahamas
Bangladesh 54 47 57 10 7 18 7
Belarus 86 4 86 86 86
Benin 60 4 60 56 56
Bolivia
Bosnia and Herzegovina
Brazil 47
Bulgaria 77 4 77 59 72 57
Burkina Faso 37 15 59 37 7 15 59
Burundi 72 2, 4 72 2 77 7 77
Côte d’Ivoire 7
Cameroon 70 2, 4 70 2
Chad 17 17
Chile 7 43
China 46 4 46 74 74
Colombia 21
Comoros 59 4 59 74 7 0 74
Costa Rica
Cuba 60 59 65 97 96 98
Czech Republic
Democratic Republic of the Congo 26 7 26
Djibouti 89 89
Dominican Republic 44
Ecuador 76
El Salvador 73 77
Eritrea 88 3, 4 88 3
Estonia
Gabon 29 27 29 35 48 34
Georgia 67 67
Ghana 48
Greece 14 14
Guatemala 93 4 93 93 7 93
Guinea 92 4 92 89 89
Guyana 28 4 28
Honduras 23 4 23 33 33
Hungary
India 31 31
Indonesia 40 60 34 29 7 55 24
Jamaica 60
Kazakhstan 71 3 88 88
Kyrgyzstan 89 3, 4 89 3 61 61
Lao People’s Democratic Republic 70 70
Latvia
Lebanon <1 3 11 3 22 3
Lithuania 43 4 43 74 74
Malawi 69 69
Malaysia 86 4 12 UNGASS Indicator 9

343
A2
Annex 2: Country progress indicators and data, 2004 to 2010 | 2010 GLOBAL REPORT
2007 20092009 2007
AllAllAll MaleMale FemaleFemale All
INJECTING DRUG USERS MEN WHO HAVE SEX WITH MEN
17 17
98
54 55 44 10
2 2 0 22
48 71
82 82 90 2 7 2 13 8 7
56 54 61 64 64 64 90 85
0 0 0
51
32 39
40 37
47 45 60 52 52 52 30 38
100 3 100 7
57
25 25 25 39 38 45 38 75
26 64
56 92
65
49
62 58
56 56 7
17 5 17 11 11 66 7
19 74
75 75 7
17 7
24 31 7
55
15 9 22 18
45 44 55 43 7 43 52 40 44 7
44 3 60 60 61 48 3 68
78 3 78 3 78 3 38 36 48 77 3
47 45 53 7
15 3
40 43
7 100 3

344 Annex 2: Country progress indicators and data, 2004 to 2010 | 2010 GLOBAL REPORT
20071 2009
All Male Female All Male Female
SEX WORKERS
Mexico 36 55 28 60 61 59
Moldova 96 96 15 15
Mongolia 64 74 74
Montenegro 44 43 45
Morocco 49 4 49 49 7 49
Myanmar 76 76
Nepal 42 56 39 93 41
Nigeria 49 7 49
Norway
Pakistan 3 3 3 3 2 3 10 13 6
Panama 76 73 78 76 7 73 78
Papua New Guinea 31 4 31 31 7 31
Paraguay 18
Peru 80
Philippines 14 4 14 55 55
Romania 33 33
Russian Federation 39 22 22
Saint Lucia
Sao Tome and Principe 80 3, 4 80 3
Senegal
Serbia 30 19 38
Sierra Leone 73 4 73
Singapore 100 3
Slovenia
Sudan 2 2
Swaziland 77 3, 4 77 3 100 100
Sweden 50 3 100 3 55 3 43 41 50
Tajikistan 60 4 60 51 51
Togo 76 75 81 82 63 84
Tunisia 38 38
Turkey 42 4 42
Ukraine 69 4 69 58
United Republic of Tanzania 68
Uzbekistan 71 71
Viet Nam 65 3, 4 65 3 47 47
Zambia 63 2, 4 63 2,3
1 Report date 2007, but data collection can vary from 2005-2007.2 Data collection started before 2005.3 Methodology not harmonized with UNGASS 2008 guidelines.4 Females only.5 Males only.7 Data collection started before 2008.
PERCENTAGE OF SEX WORKERS, INJECTING DRUG USERS, AND MEN WHO HAVE SEX WITH MEN REACHED WITH HIV PREVENTION PROGRAMMES1

345
A2
Annex 2: Country progress indicators and data, 2004 to 2010 | 2010 GLOBAL REPORT
2007 20092009 2007
AllAllAll MaleMale FemaleFemale All
INJECTING DRUG USERS MEN WHO HAVE SEX WITH MEN
5 5 4 20 22 13 18 38
89 89 89 7 7 8 86
67 77
53 53 69
78 5 78 57 57 47 77
59 7 60 54 60 7
56 7
16 3 51 51
89 89 7
10 10
44
14 13 28 11 11 17 19 29
59
24 33 21 14 11 21 17
100
85 7
21 19 25 14
85
27 26 30 8 8 12 54
25 21 41 64 63 69
46
53
22 30 19
46 45 50 32 31 33 50 63
34 32 49 42
43 3 43 3 15 15 26 24

346 Annex 2: Country progress indicators and data, 2004 to 2010 | 2010 GLOBAL REPORT
Males MalesFemales FemalesAll All
20057 20077
PERCENTAGE OF FEMALE AND MALE SEX WORKERS REPORTING THE USE OF A CONDOM WITH THEIR MOST RECENT CLIENT
Afghanistan 50 3, 5 50 3
Angola 78 5 78
Argentina
Armenia 89 100 89 91 5 91
Azerbaijan
Bangladesh 40 44 32 63 44 67
Barbados 80 5 80
Belarus 77 100 77 76 5 76
Benin 83 5 83
Bolivia 88 4 57 4 88 4
Bosnia and Herzegovina
Brazil
Bulgaria 95 5 95
Burkina Faso 96 99 98 99
Burundi 74 74 74 2, 5 74 2
Côte d’Ivoire 96 5 96
Cambodia 96 96 99 5 99
Cameroon 74 2,4, 5 74 2, 4
Canada 61 4 80 4
Cape Verde 74 5 74
Chad
Chile
China 69 82 5 82
Colombia 89 82 97
Comoros 59 5 59
Costa Rica 92 5 92
Croatia 86 2
Cuba 61 63 56
Democratic Republic of the Congo 61 2, 5 61 2
Djibouti
Dominican Republic 96 2
Ecuador 95
Egypt
El Salvador 96 89 97
Eritrea 76 5
Estonia 94 5 94
Ethiopia 87 5 84
Gabon 67 53 67
Georgia 95 94 5 94
Germany
Ghana 98
Greece
Guatemala 96 91 97
Guinea 100 5 100
Guinea-Bissau 60
Guyana 89 5 89
Haiti 90 5 90
Honduras 68 71 66
India 88
Indonesia 55 48 56 69 72 68
Iran, Islamic Republic of 55 5 55
Jamaica 84 84
Japan
Jordan
Kazakhstan 97 5 97
Kenya UNGASS Indicator 18

347
A2
Annex 2: Country progress indicators and data, 2004 to 2010 | 2010 GLOBAL REPORT
Males FemalesAll
20097
58 58
81 5 81
99 1, 5 99
75 1, 5 75
63 1 44 67
70 70
25 5 25
87 5 87
76 5 76
90
93 90 94
99 1 98 99
82 1, 5 82
97 97 97
99 1, 5 99
73 5 73
38 5 38 1
73 1
85 5 85
96
59 1, 5 59
89
98
56 53 63
62 1, 5 62
94 94
81 81
97
21 1 9 31
90
45 5 45
94 1, 5 94
98 1, 5 98
76 57 77
99 5 99
64 62 64
5 5 5
96 1 91 97
65 5 65
93 5 93
61 5 61
90
80 87 79
83 5 83
68 1 79 66
55 1, 5 55
97 5 97
65 1, 5 65
51 5 51
96 5 96
88

348 Annex 2: Country progress indicators and data, 2004 to 2010 | 2010 GLOBAL REPORT
Males MalesFemales FemalesAll All
20057 20077
PERCENTAGE OF FEMALE AND MALE SEX WORKERS REPORTING THE USE OF A CONDOM WITH THEIR MOST RECENT CLIENT
Kyrgyzstan 81 84 5 84
Lao People’s Democratic Republic 83 59 89
Lebanon 34 4 47 4 34 4
Lithuania 77 5 77
Madagascar 79
Malawi 69 5 69
Malaysia 35 2
Mali 99 5 99
Mauritania
Mauritius 100 2, 5 100 2
Mexico 96 96 96
Moldova 98 93 5 93
Mongolia 94 50 96 92 5 92
Montenegro
Morocco 38 38 54 5 54
Myanmar
Nepal 67 81 93 77
Nicaragua
Niger 96 5 96
Nigeria 98 5 98
Pakistan 23 7 37 34 21 45
Panama 92 91 92 76 64 84
Papua New Guinea 94 5 94
Paraguay 76 71 78
Peru 42 96
Philippines 65 50 65
Poland 46 2
Romania 85 85 5 85
Russian Federation 77 92 5 92
Rwanda 87 5 87
Sao Tome and Principe 60
Senegal 86 87 99 5 99
Serbia
Sierra Leone 68 5 68
Singapore 99
Somalia
Sri Lanka 65 89 5 89
Sudan
Suriname 70 79 68
Swaziland 98 5 98
Sweden 22 100 20
Switzerland 72
Tajikistan 75 5 75
Thailand 96 4, 5
The former Yugoslav Republic of Macedonia 86 88 84 78 93 75
Timor-Leste
Togo 78 76 84
Tunisia
Turkey 33 5 33
Ukraine 80 80 86 5 86
Uruguay
Uzbekistan 65 5 65
Vanuatu
Viet Nam 90 90 97 4, 5 97 4
Zambia 81 72 82
Zimbabwe 4 4, 6 4 4
1 Data collection started before 2008.2 Data collection started before 2005.3 Data collection period not defi ned.4 Methodology not harmonized with UNGASS
2008 guidelines.5 Females only.6 Males only.7 Methodology may vary for individual countries.

349
A2
Annex 2: Country progress indicators and data, 2004 to 2010 | 2010 GLOBAL REPORT
Males FemalesAll
20097
94 5 94
94 5 94
92 5 92
92
61
99 1, 5 99
88 1, 5 88
62 45 66
91 5 91
90 5 90
72 1 64 73
54 1, 5 54
96 5 96
38 75
74
85 5 85
98 1, 5 98
38 33 43
76 1 64 84
50 42 53
65 5 65
98 5 98
71 5 71
87 1, 5 87
97 1, 5 97
91 93 89
68 1
99
25
89 1, 5 89
45 5 45
87
87 5 87
19 20 14
72 1, 6
84 5 84
92 5 92
78 1 93 75
65
88 67 89
52 5 52
42
88 5 88
76 6 76
81 5 81
67 1, 5 67
78 5 78

350 Annex 2: Country progress indicators and data, 2004 to 2010 | 2010 GLOBAL REPORT
20055 20075 20095
PERCENTAGE OF MEN REPORTING THE USE OF A CONDOM THE LAST TIME THEY HAD ANAL SEX WITH A MALE PARTNER
Argentina 91
Armenia 30 84
Australia 58 3, 4 47
Azerbaijan 57
Bahamas 69 69
Bangladesh 49 24 31 1
Barbados
Belarus 62 67 61
Bolivia 69
Bosnia and Herzegovina 56
Brazil 48
Bulgaria 46 70
Burkina Faso 52
Côte d’Ivoire 47 42
Cambodia 86 86
Cameroon 43
Canada 62 1
Chile 29 56
China 41 64 73
Costa Rica 71 65
Cuba 55 52
Czech Republic 30
Denmark 73
Dominican Republic 79 2 66
Egypt 13 1
El Salvador 83 55
Estonia 47 47
Fiji 20
Georgia 54 62
Germany 58 59
Ghana 48
Greece 89 11
Guatemala 78 78
Guyana 81 84
Haiti 73 73 1
Honduras 47 47 1
Hungary 25
India 58
Indonesia 48 39 57
Iran, Islamic Republic of 38 1
Jamaica 73
Japan 55 65
Kazakhstan 66 76
Kenya 75
Kyrgyzstan 68 81
Lao People’s Democratic Republic 24 4
Latvia 50
Lebanon 39 4
Lithuania 58 47
Malaysia 21
Mali 54 54
Mauritius 52 2
Mexico 79 64
Moldova 63 48 UNGASS Indicator 19

351
A2
Annex 2: Country progress indicators and data, 2004 to 2010 | 2010 GLOBAL REPORT
20055 20075 20095
Mongolia 13 67 78
Myanmar 82
Nepal 74 75
Nicaragua 36
Nigeria 53 53
Norway 53
Pakistan 8 24
Panama 84 86 86
Papua New Guinea 88 4 51
Paraguay 63
Peru 46 47
Philippines 32 32
Poland 32 2, 4
Portugal 43
Romania 73 43
Russian Federation 39 60 56
Rwanda 50
Saint Lucia 74 63
Senegal 45 55 2 76
Serbia 67
Singapore 17
Slovenia 75 4 43
South Africa 35
Spain 66
Sri Lanka 61 61
Suriname 89 89 1
Sweden 42 4 51
Switzerland 80 4 80
Thailand 88
The former Yugoslav Republic of Macedonia 29 56 56
Timor-Leste 38
Togo 60 72
Trinidad and Tobago 47 2
Tunisia 40
Turkey 37
Tuvalu 63
Ukraine 72 39 64
United Kingdom of Great Britain and Northern Ireland 63 1
Uruguay 47
Uzbekistan 61 87
Vanuatu 63
Viet Nam 61 66
1 Data collection started before 2008.2 Data collection started before 2005.3 Data collection period not defi ned.4 Methodology not harmonized with UNGASS 2008 guidelines.5 Methodology may vary for individual countries.

352 Annex 2: Country progress indicators and data, 2004 to 2010 | 2010 GLOBAL REPORT
Males MalesFemales FemalesAll All
20071,6 20096
PERCENTAGE OF INJECTING DRUG USERS REPORTING THE USE A CONDOM THE LAST TIME THEY HAD SEXUAL INTERCOURSE
Afghanistan 35 35
Argentina 64 63 65 5
Armenia 56 56 55
Australia 20 3 20 3 20 3 27 27 25
Azerbaijan 18 2 15 16 8
Bangladesh 44 44 55 43 5 43
Belarus 59 57 65 59 56 68
Benin 30 29 33
Bosnia and Herzegovina 23 4 23 30
Brazil 70
Bulgaria 19 18 28 38 37 43
Canada 43 39 5 42 35
China 34 3 32 3 43 3 36 35 42
Croatia 50
Egypt 5 5
Estonia 68 66 74 66 66 113
Georgia 48 4 48 78 78
Greece 48
India 16 16
Indonesia 34 34 30 36 36 35
Iran, Islamic Republic of 33 33 30 33 33 30
Japan 65 4 65
Jordan
Kazakhstan 37 37 36 46 46 47
Kyrgyzstan 11 11 9 53 55 48
Latvia 38 40 34
Lebanon 15 3 15 3 43
Luxembourg 49
Malaysia 5 2 28
Mauritius 13 2 15 2 0 2 31
Mexico 29 27 38 28 29 25
Moldova 68 73 52 36 41 12
Montenegro
Morocco 13 12 21 13 12 21
Myanmar 78 78
Nepal 38 4 38 51 51
Nigeria 66 66 68 66 66 68
Pakistan 21 31 31
Paraguay 33 33 36 22
Philippines 22 23 0
Portugal 38 39 31
Romania 17 18 12
Russian Federation 37 39 31 45 46 40
Serbia 29 29 29
Spain 55
Sweden 25 28 19 7 8 0
Switzerland 50 3 53 3 42 3 50 5 53 42
Tajikistan 36 33 47 28 26 40
Thailand 35 42 45 29
The former Yugoslav Republic of Macedonia 51 51 51 51 51 51
Tunisia 35
Turkey 10 9 13
Ukraine 55 55 56 48 50 45
United Kingdom of Great Britain and Northern Ireland 44 43 46
Uzbekistan 39 37 50 26 25 32
Viet Nam 36 3, 4 36 3 52 52
1 Report date 2007, but data collection can vary from 2005 to 2007.
2 Data Collection period started before 2005.3 Methodology not harmonized with
UNGASS 2008 guidelines.4 Males only.5 Data collection period started before 2008.6 Methodology may vary for individual
countries.
UNGASS Indicator 20

353
A2
Annex 2: Country progress indicators and data, 2004 to 2010 | 2010 GLOBAL REPORT
Males MalesFemales FemalesAll All
20076 20096
PERCENTAGE OF INJECTING DRUG USERS REPORTING THE USE OF STERILE INJECTING EQUIPMENT THE LAST TIME THEY INJECTED
Afghanistan 46 94 94 Albania 82 Argentina 65 64 67 91 Armenia 95 95 93 Australia 71 4 80 Azerbaijan 77 62 62 65 Bangladesh 34 34 74 32 1 32 Belarus 71 71 70 87 87 88 Belgium 53 Benin 31 31 33 Bosnia and Herzegovina 25 5 25 87 90 Brazil 54 Bulgaria 25 26 23 86 87 84 Canada 68 3, 4 China 41 42 32 72 72 68 Egypt 401 Georgia 93 5 93 48 48 Greece 67 Hungary 74 India 87 83 90 Indonesia 82 2 82 2 89 2 88 1 88 94 Iran, Islamic Republic of 75 75 62 74 75 62 Japan 47 5 47 Kazakhstan 59 59 58 63 65 55 Kyrgyzstan 77 76 81 Latvia 90 87 96 82 85 80 Lebanon 60 4 63 4 0 4 Lithuania 98 98 97 Luxembourg 71 Malaysia 28 2 83 Maldives 72 74 29 Mauritius 32 2 32 2 33 2 72 Mexico 14 15 9 40 39 43 Moldova 96 96 95 99 99 100 Montenegro 24 Morocco 7 7 12 7 1 7 12 Myanmar 81 81 Nepal 96 5 96 99 99 Nigeria 89 89 86 89 89 86 Pakistan 28 77 77 Paraguay 80 80 79 71 Philippines 48 47 63 85 84 94 Portugal 69 71 59 Romania 28 2 30 2 17 2 85 86 83 Russian Federation 82 83 81 83 85 76 Serbia 80 81 73 Spain 81 Sweden 38 38 35 58 58 58 Switzerland 94 4 95 4 92 4 94 1 95 92 Tajikistan 32 35 21 63 61 84 Thailand 63 63 64 The former Yugoslav Republic of Macedonia 73 73 69 73 73 69 Timor-Leste 3 11 Tunisia 78 Turkey 10 9 13 Ukraine 84 85 81 87 89 84 United Kingdom of Great Britain and Northern Ireland 81 82 77 Uzbekistan 23 23 25 82 81 81 Viet Nam 89 5 89 95 95
1 Data collection period started before 2008.2 Data Collection period started before 2005.3 Data collection period undefi ned.4 Methodology not harmonized with UNGASS
guidelines.5 Males only.6 Methodology may vary for individual
countries.
UNGASS Indicator 21

354 Annex 2: Country progress indicators and data, 2004 to 2010 | 2010 GLOBAL REPORT
AllAll Male Female All Male Female
PERCENTAGE OF SEX WORKERS, INJECTING DRUG USERS, AND MEN WHO HAVE SEX WITH MEN THAT HAVE RECEIVED AN HIV TEST IN THE LAST 12 MONTHS AND WHO KNOW THEIR RESULTS
Afghanistan 11 5 11 4 4
Albania
Algeria
Angola 42 5 42 35 35
Argentina 36 38 65 62
Armenia 33 18 5 18
Australia 63 5 63 82 44
Azerbaijan 6 7 6
Bahamas
Bangladesh 2 5 6 8 5 4 7 4 4
Barbados 73 4, 5 73 4 73 7 73
Belarus 49 63 5 63 85 85
Belgium
Benin 30 5 30 87 87
Bolivia 78 4 85 4 78 4 45 45
Bosnia and Herzegovina 96 2, 4 14 14
Brazil 18
Bulgaria 53 5 53 58 60 58
Burkina Faso 94 4, 5 94 4 100 100
Burundi 38 38 2, 5 38 2 65 7 65
Côte d’Ivoire 51 5 51 51 7 51
Cambodia 68 5 68 68 7 68
Cameroon 32 2, 5 32 2
Canada
Chad 38 38
Chile 7 85
China 29 5 29 37 37
Colombia 82 71 85 42
Comoros 100 7 0 100
Congo, Republic of the 3
Costa Rica 49
Cuba 36 38 32 35 35 35
Czech Republic
Democratic Republic of the Congo 37 2, 5 37 2 36 7 36
Denmark
Djibouti 85 85
Dominican Republic 64 2, 5 64 2 67 67
Ecuador 87 4
El Salvador 96 5 96 89
Eritrea 78 93 93
Estonia 52 5 56 52 7 52
Ethiopia 97 5 97 97 7
Finland
Gabon 54 33 55 64 52 65
Georgia 24 33 5 33 28 28
Germany
Ghana 39
Greece 66 66
Guatemala 93 5 93 93 7 93
Guinea 58 5 58
Guinea-Bissau 43 43
20071 20092005
SEX WORKERS
UNGASS Indicator 8

355
A2
Annex 2: Country progress indicators and data, 2004 to 2010 | 2010 GLOBAL REPORT
20071 20092007120092005 2005
All AllAll AllAll MaleMale FemaleFemale All
INJECTING DRUG USERS MEN WHO HAVE SEX WITH MEN
6 22 22
17 45
15
47 43 62 96 98 85 7
21 23 23 13 42 5
57 4 50 61
5 5 15 13 7
61 50
3 3 6 3 4 7 4 6 3 7
39 49 49 49 57 56 58 55 53 80
36 7 35 40 62 3 86
25 25 33
100 4 35
53 6 53 31 28 10 2, 4 26
13 19
38 36 52 48 47 49 29 42
100
57 4 57 7
35 7 58 58 7
59 47 7 44 52 43 4 34
37 25
41 40 45 37 36 46 33 45
61
8
43 61
33 32
34 7 43
55
33
50 4
55 85
62 63 60 47 7 45 62 27 4 27 7
63
6 9 6 9 6 6 27 30 2 24 7
18 23 7
25
39 78
64 64 7

356 Annex 2: Country progress indicators and data, 2004 to 2010 | 2010 GLOBAL REPORT
20071 20092005
AllAll Male Female All Male Female
SEX WORKERSPERCENTAGE OF SEX WORKERS, INJECTING DRUG USERS, AND MEN WHO HAVE SEX WITH MEN THAT HAVE RECEIVED AN HIV TEST IN THE LAST 12 MONTHS AND WHO KNOW THEIR RESULTS
Guyana 64 64 88 88
Haiti 71 71 7
Honduras 71 5 71 76 76
Hungary
India 34 32 32
Indonesia 15 31 52 25 33 7 57 28
Iran, Islamic Republic of 20 5 20 20 7 20
Jamaica 43 43 5 43 73 73
Japan
Kazakhstan 70 5 70 81 81
Kenya 12 2 92
Kyrgyzstan 53 5 53 42 42
Lao People’s Democratic Republic 9 14 14
Latvia
Lebanon 24 4 11 4 25 4 7 69
Lithuania 50 5 50 53 53
Luxembourg
Madagascar 49 5 49
Malawi 69 5 69
Malaysia 100 3, 4 20
Maldives 14 14
Mali 7 91 7 91
Mauritania 100 4, 5 100 4 69 7 69
Mauritius 30 2
Mexico 72 63 76
Moldova 31 5 31 23 23
Mongolia 67 53 5 53 52 52
Montenegro 73 4, 5 73 4 83 7
Morocco 51 5 51 51 7 51
Myanmar 71 71
Nepal 40 52 37 65 32
Nicaragua 91
Niger 38 5 38 45 45
Nigeria 38 5 38 38 7 38
Norway
Pakistan 4 4 5 14 13 15
Panama 77 55 59 52 55 7 59 52
Papua New Guinea 47 5 47 56 47 60
Paraguay 100 5 100 100 100 100
Peru 54 4 20 6 55
Philippines 12 5 12 19 19
Poland
Portugal
Romania 36 35 5 35 29 29
Russian Federation 61 5 61 39 39
Rwanda 65 5 65 7 65
Saint Lucia
Sao Tome and Principe 72 4, 5 72 4 31 7 31
Senegal 70 5 70 70 70
Serbia 45 35 52
Sierra Leone 79 75 48 7 48
Singapore 100 100 100

357
A2
Annex 2: Country progress indicators and data, 2004 to 2010 | 2010 GLOBAL REPORT
20071 20092007120092005 2005
All AllAll AllAll MaleMale FemaleFemale All
INJECTING DRUG USERS MEN WHO HAVE SEX WITH MEN
44 87
48 71 7
40 29 7
8 100 100 100 100
21 9 36 17
18 36 36 42 44 7 43 61 15 32 34 7
9 23 23 16 23 7 23 16 11 7
53 7
38 32
42 41 49 56 56 56 38 60
40
34 32 43 40 39 45 70
5 14
61 62 60 63 7 60 70 26
4 4 2 4 50 4 14 4 30
64 60 81 73 7 73 72 28 41
65 7
100 4 33 100
17 15 67 10
15 4
20 2 24 2 0 2 75 16 2
31 2 28 2 48 2 32 29 49 54 50
34 33 38 48 49 41 38
23 60 78
81 4
13 13 13 11 13 7 13 10
27 27 48
21 6 21 22 22 30 42
23 23 33 23 7 23 32 30 30 7
56 7
4 4 12 12
45 76 76 7
42 67
100 100 100 100 100
21 6
4 4 15 1 2 0 16 7
<1 <1
36 7 35 41 27 7
36 16 4 17 4 10 4 19 18 20 47 75
46 44 50 26 23 33 32 61
47
100 4 100 4 100 4 17 16 23 100
11 34 7
32 30 39 53 31
47 43

358 Annex 2: Country progress indicators and data, 2004 to 2010 | 2010 GLOBAL REPORT
AllAll Male Female All Male Female
PERCENTAGE OF SEX WORKERS, INJECTING DRUG USERS, AND MEN WHO HAVE SEX WITH MEN THAT HAVE RECEIVED AN HIV TEST IN THE LAST 12 MONTHS AND WHO KNOW THEIR RESULTS
1 Report date 2007, but data collection can vary from 2005-2007.2 Data collection started before 2005.3 Data collection period not defi ned.4 Methodology not harmonized with UNGASS 2008 guidelines.5 Females only.6 Males only.7 Data collection started before 2008.
Slovenia
Somalia 5
South Africa
Spain 67 2, 4, 5 67 7
Sri Lanka 43 5 43 43 7 43
Sudan 7 7
Suriname 62 75 59 64
Swaziland 94 4, 5 94 4
Sweden 34 4 100 4 33 4 78 70 100
Switzerland 38 7 38
Tajikistan 29 5 29 42 42
Thailand 53 54 52 36 35 36
The former Yugoslav Republic of Macedonia 67 47 87 39 47 7 87 39
Timor-Leste 53
Togo 40 22 89 58 43 59
Tonga
Tunisia 100 4 14 14
Turkey 26 97 100 97
Ukraine 32 46 5 46 59
United Kingdom of Great Britain and Northern Ireland
Uruguay 26 26
Uzbekistan 19 5 19 35 35
Vanuatu 12 7 12
Viet Nam 15 5 15 35 35
Zambia 17 14 23
20071 20092005
SEX WORKERS

359
A2
Annex 2: Country progress indicators and data, 2004 to 2010 | 2010 GLOBAL REPORT
20071 20092007120092005 2005
All AllAll AllAll MaleMale FemaleFemale All
INJECTING DRUG USERS MEN WHO HAVE SEX WITH MEN
33
27
68 2, 4 67 2, 4 72 2, 4 76 7 49 3 87 7
14 14 7
59
84 4 83 4 86 4 82 82 81 41 39
60 59 61 60 7 59 61 31 31 7
24 23 30 36 37 30
62 61 71 35 21
32 44 42 53 44 7 42 53 7 56 56 7
26
53
21 22 13 35 3 18
8 11 0 31
27 29 29 30 26 25 29 25 27 43
70 17 2 31 7
26
18 18 18 34 33 37 25 44
11 6 11 18 18 16 19


Related Documents