Microrheology of the liquid-solid transition during gelation
Travis. H. Larsen and Eric M. Furst, PRL, 100(14), 2008
Caroline E. Wagner
McKinley Gels Summer Reading GroupAugust 24 2017
(Also: T. H. Larsen, Schultz, K. and Furst, E. M. KARJ, 20(3), 2008)
Motivation: Characterizing gelation at smaller length scales
2
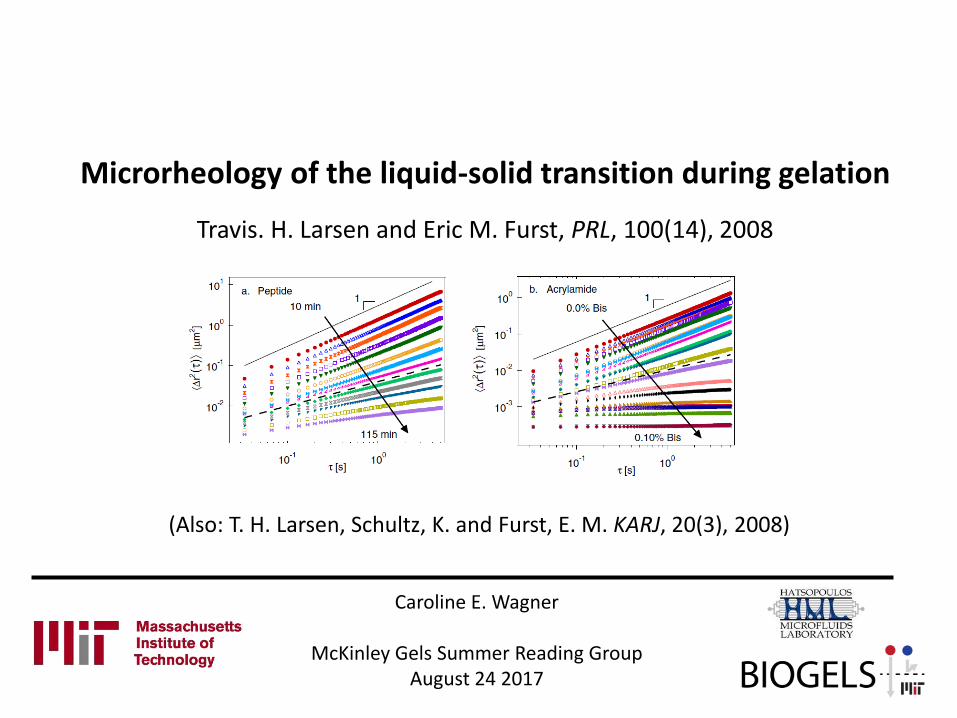
So far we have discussed several macrorheological experimental techniques for determining the physical characteristics of the liquid/gel transition
Chambon, F. and Winter, H. H. JoR (1987)
Winter, H. H. and Mours, M. Adv Polym Sci (1999)
~'~ nG G / 1tan G G
Winter, H. H. and Mours, M. Adv Polym Sci (1999)
Relaxation modulus ( )G tLong time residual stress
plateau of solid-like material
Rapid relaxation of stresses of liquid-like material
Sample-spanning network
Larsen and Furst argue that similar methods should be developed for microrheology, as macrorheological measurement may not always be possible / sufficient. For instance:
• Micrheology is more suitable when sample volumes are very limited (e.g. biological samples)
• Microstructural changes may be sufficiently small to not be reflected in the measured macrorheology
• Macrorheological measurements may not be suitable for studying very rapid gelation kinetics
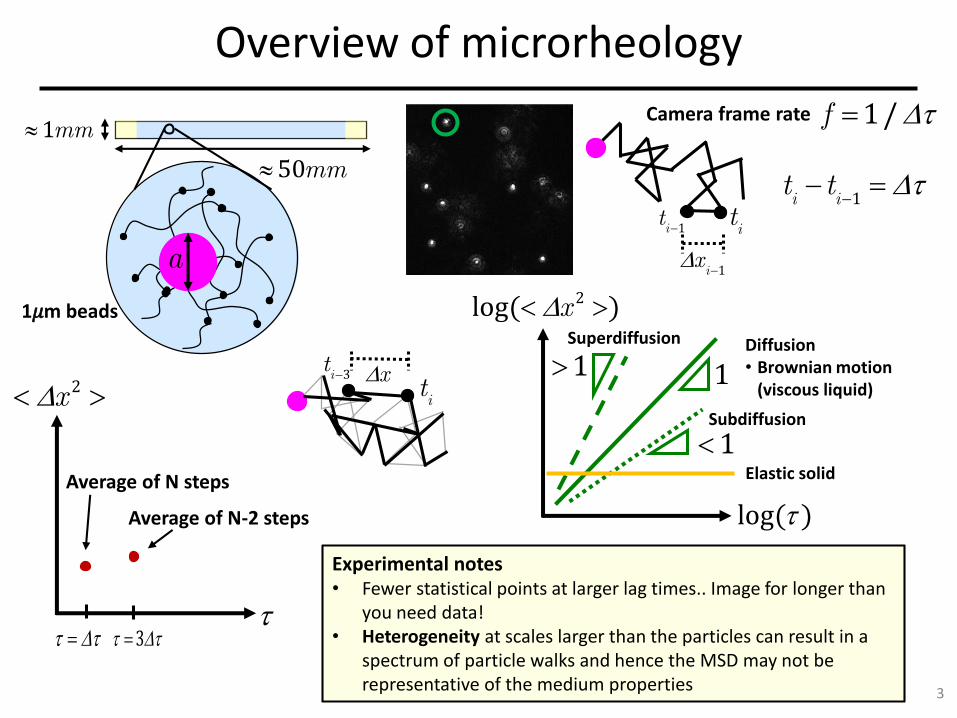
Overview of microrheology
3
1𝜇m beads
1mm
50mm
a1i
x
1it i
t1i i
t t
Camera frame rate 1/f
2x
3
Average of N steps
Average of N-2 steps
Experimental notes• Fewer statistical points at larger lag times.. Image for longer than
you need data!• Heterogeneity at scales larger than the particles can result in a
spectrum of particle walks and hence the MSD may not be representative of the medium properties
log( )
2og( )l x
1
1
1Superdiffusion Diffusion
• Brownian motion (viscous liquid)
Subdiffusion
Elastic solid
x3it
it
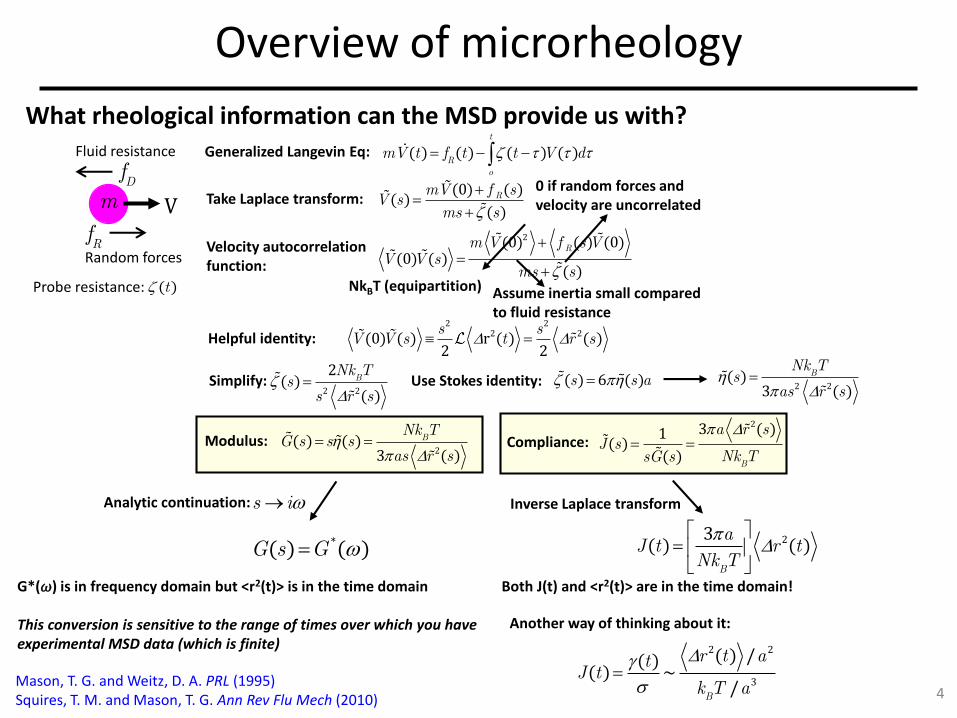
Overview of microrheology
4
What rheological information can the MSD provide us with?
Mason, T. G. and Weitz, D. A. PRL (1995)Squires, T. M. and Mason, T. G. Ann Rev Flu Mech (2010)
m VDf
Fluid resistance
RfRandom forces
Generalized Langevin Eq: ( ) ( ) ( ) ( )t
Ro
V t f t t dm V
( )tProbe resistance:
Take Laplace transform:( )
( )
(0)( ) RV fms
ms
sV
s
Velocity autocorrelationfunction:
2(0) (0)(0)
)(
()
( )RV fms
ms
s VV V
s
Helpful identity:
0 if random forces and velocity are uncorrelated
NkBT (equipartition) Assume inertia small compared to fluid resistance
2 22 2r ((0) ( )
2) (
2)V V t rs s
s s
Simplify:2 2
2( )
( )
BNk T
ss r s
Use Stokes identity: ( ) 6 ( )s s a 2 2( )
3 ( )
BNk T
sas r s
Modulus: 2
( ) ( )3 ( )
BNk T
G s s sas r s
Compliance:
23 ( )1( )
( )B
a r sJ s
Nk TsG s
Analytic continuation:s i
*( ) ( )G s G
Inverse Laplace transform
23( ) ( )
B
aJ t r t
Nk T
2 2
3
( ) /( )( ) ~
/B
r t atJ t
k T a
Both J(t) and <r2(t)> are in the time domain!
Another way of thinking about it:
G*(𝜔) is in frequency domain but <r2(t)> is in the time domain
This conversion is sensitive to the range of times over which you have experimental MSD data (which is finite)
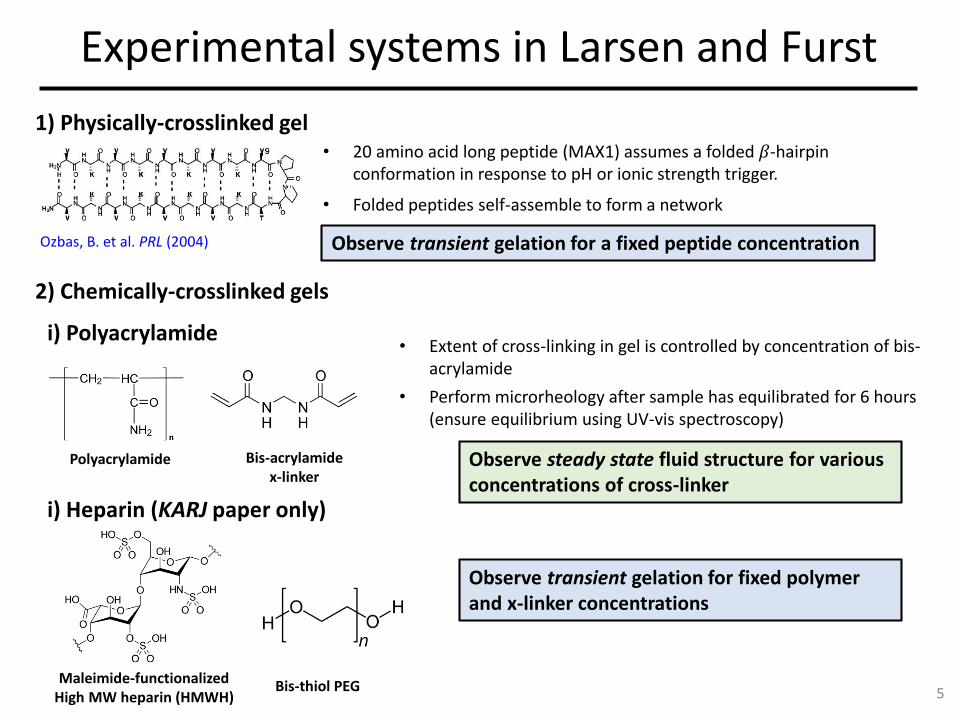
Experimental systems in Larsen and Furst
5
1) Physically-crosslinked gel
2) Chemically-crosslinked gels
Observe transient gelation for a fixed peptide concentrationOzbas, B. et al. PRL (2004)
• 20 amino acid long peptide (MAX1) assumes a folded 𝛽-hairpin conformation in response to pH or ionic strength trigger.
• Folded peptides self-assemble to form a network
Polyacrylamide Bis-acrylamide x-linker
• Extent of cross-linking in gel is controlled by concentration of bis-acrylamide
Observe steady state fluid structure for various concentrations of cross-linker
i) Polyacrylamide
i) Heparin (KARJ paper only)
Maleimide-functionalizedHigh MW heparin (HMWH)
Bis-thiol PEG
Observe transient gelation for fixed polymer and x-linker concentrations
• Perform microrheology after sample has equilibrated for 6 hours (ensure equilibrium using UV-vis spectroscopy)
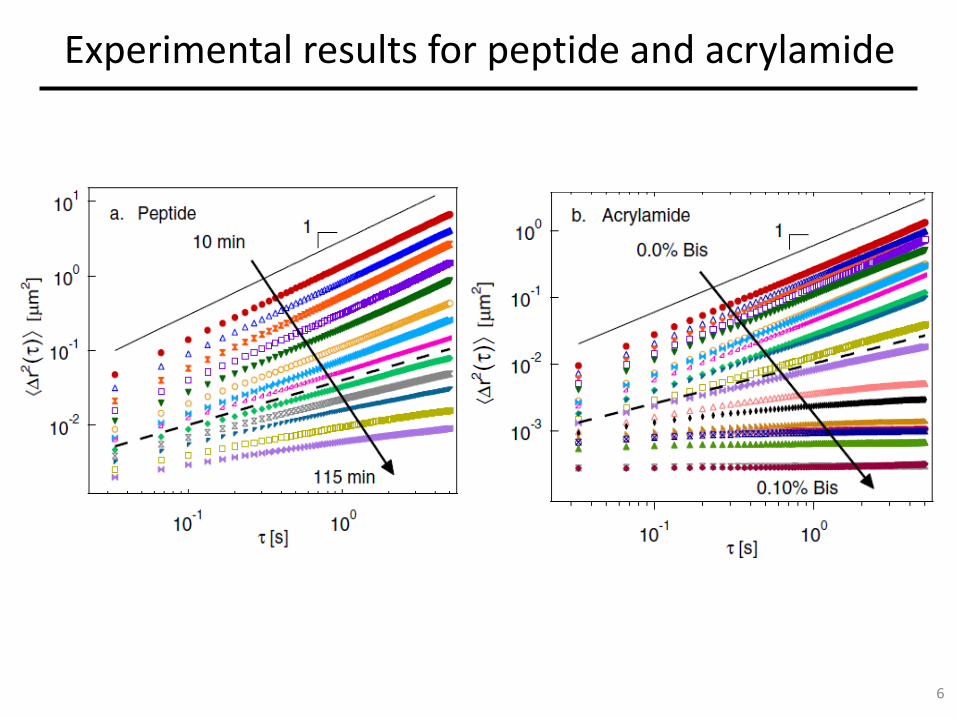
Experimental results for peptide and acrylamide
6
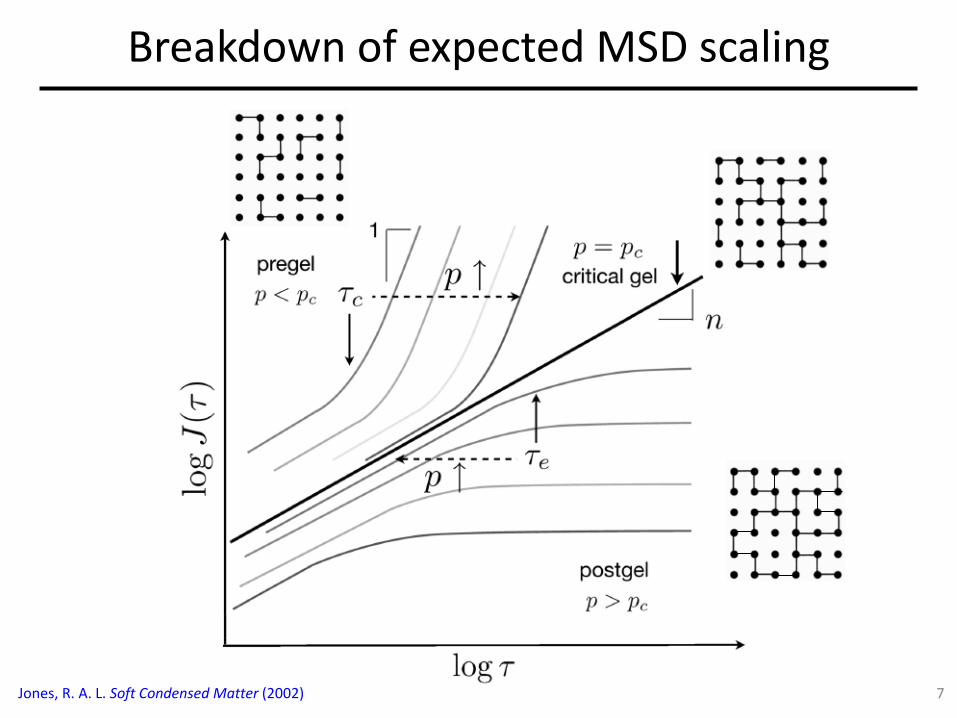
Breakdown of expected MSD scaling
7Jones, R. A. L. Soft Condensed Matter (2002)
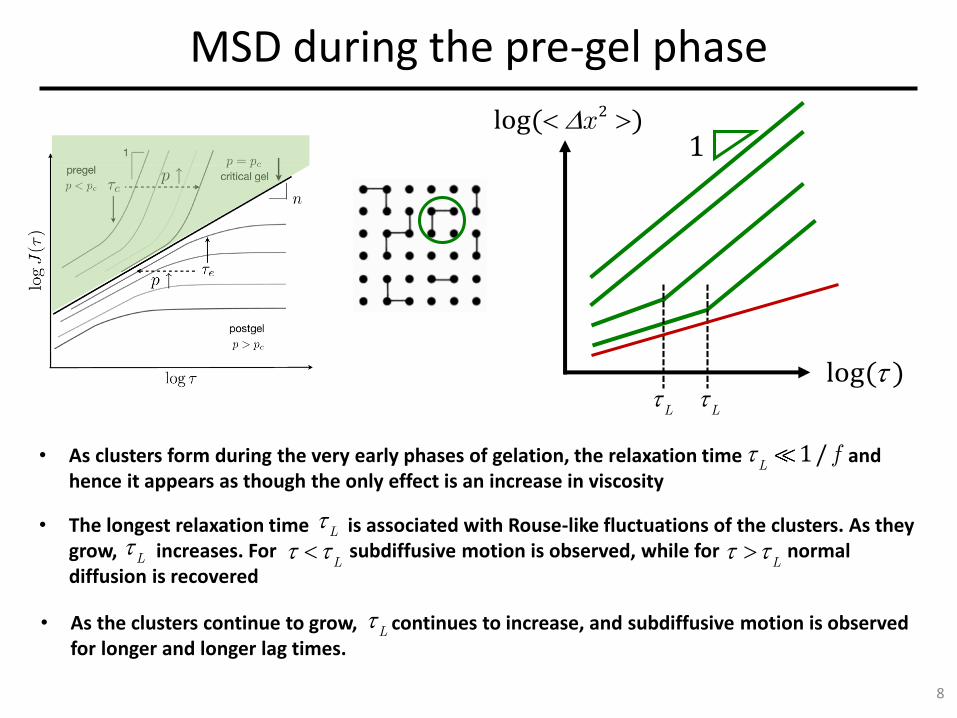
MSD during the pre-gel phase
8
• As clusters form during the very early phases of gelation, the relaxation time and hence it appears as though the only effect is an increase in viscosity
log( )
2og( )l x 1
• The longest relaxation time is associated with Rouse-like fluctuations of the clusters. As they grow, increases. For subdiffusive motion is observed, while for normal diffusion is recovered
• As the clusters continue to grow, continues to increase, and subdiffusive motion is observed for longer and longer lag times.
L
L
1/L
f
L
L
L
L
L
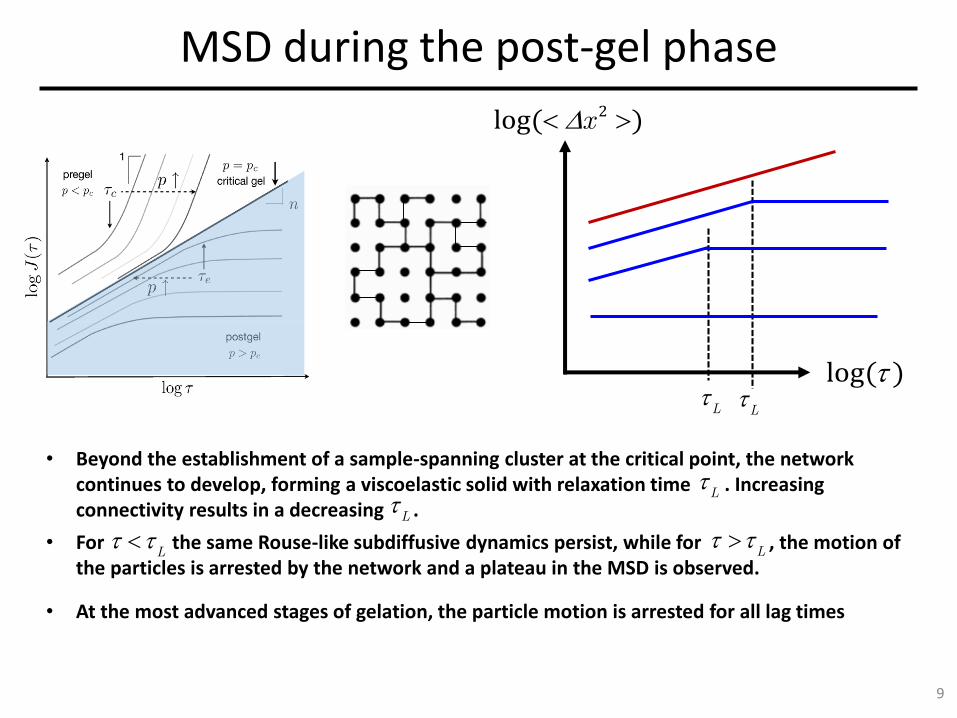
MSD during the post-gel phase
9
log( )
2og( )l x
L
L
• Beyond the establishment of a sample-spanning cluster at the critical point, the network continues to develop, forming a viscoelastic solid with relaxation time . Increasing connectivity results in a decreasing .
• For the same Rouse-like subdiffusive dynamics persist, while for , the motion of the particles is arrested by the network and a plateau in the MSD is observed.
• At the most advanced stages of gelation, the particle motion is arrested for all lag times
L L
L
L
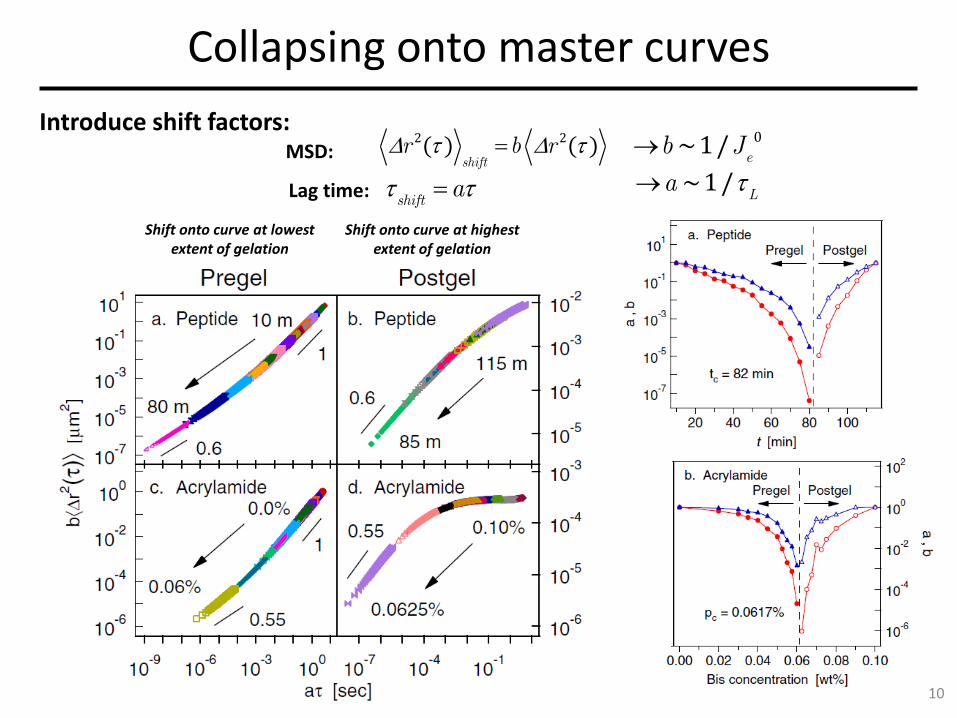
Collapsing onto master curves
10
Introduce shift factors:2 2( ) ( )
shiftr b r
shifta
MSD:
Lag time:
0~1/e
b J
~1/L
a
Shift onto curve at lowest extent of gelation
Shift onto curve at highest extent of gelation
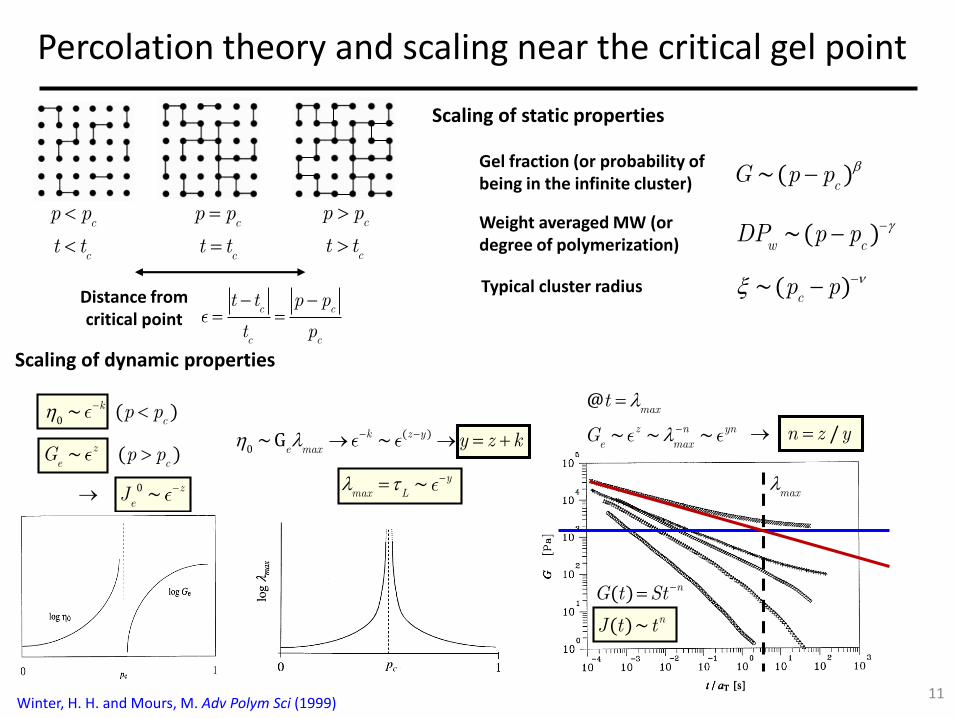
Percolation theory and scaling near the critical gel point
11
cp p
cp p
cp p
ct t
ct t
ct t
c c
c c
t t p p
t p
Distance fromcritical point
Winter, H. H. and Mours, M. Adv Polym Sci (1999)
Scaling of static properties
Scaling of dynamic properties
max
0~ ( )k
cp p
~ ( )c
zeG p p
~max
yL
( )
0~G ~k z y
e maxy z k
0 ~ zeJ
( ) nG t St
@max
t
~ ~ ~z n yne maxG /n z y
Gel fraction (or probability of being in the infinite cluster)
Weight averaged MW (or degree of polymerization)
~ )(c
G p p
(~ )w c
DP p p
Typical cluster radius ~ )(cp p
~( ) nJ t t
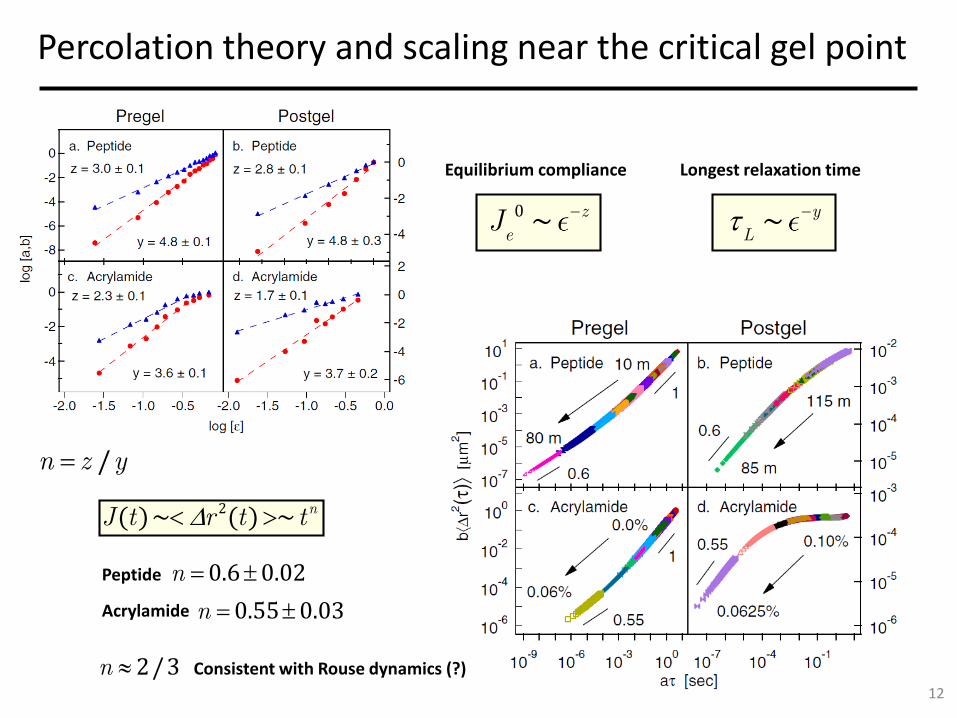
Percolation theory and scaling near the critical gel point
12
0 ~ zeJ
Equilibrium compliance
~ yL
Longest relaxation time
/n z y
Acrylamide
Peptide 0.6 0.02n
0.55 0.03n
2( ()~ ) ~ nJ r t tt
Consistent with Rouse dynamics (?)2/3n
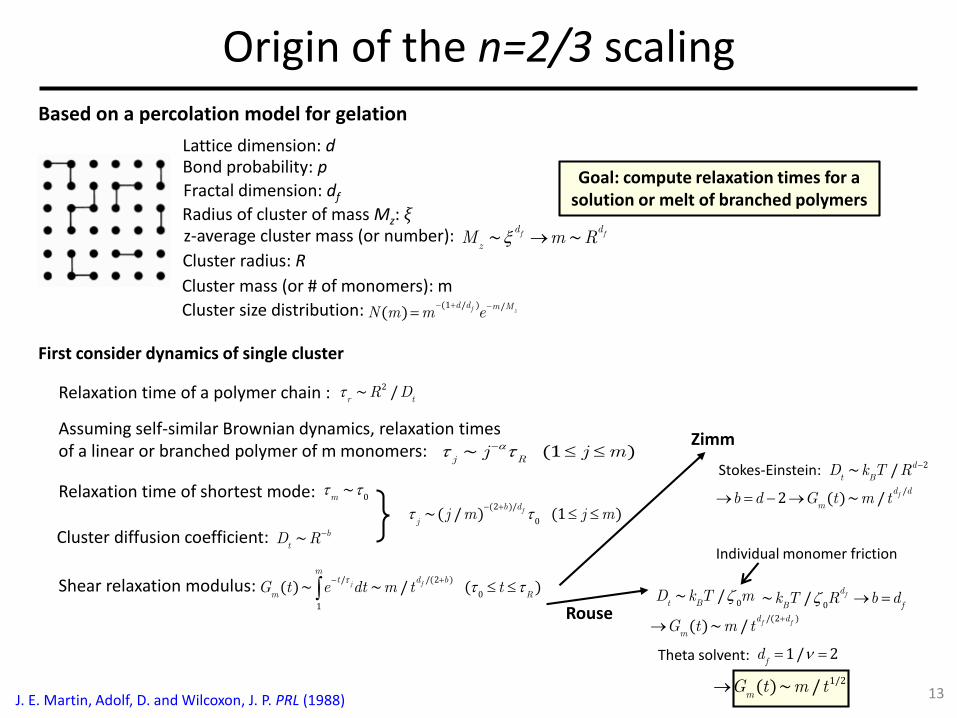
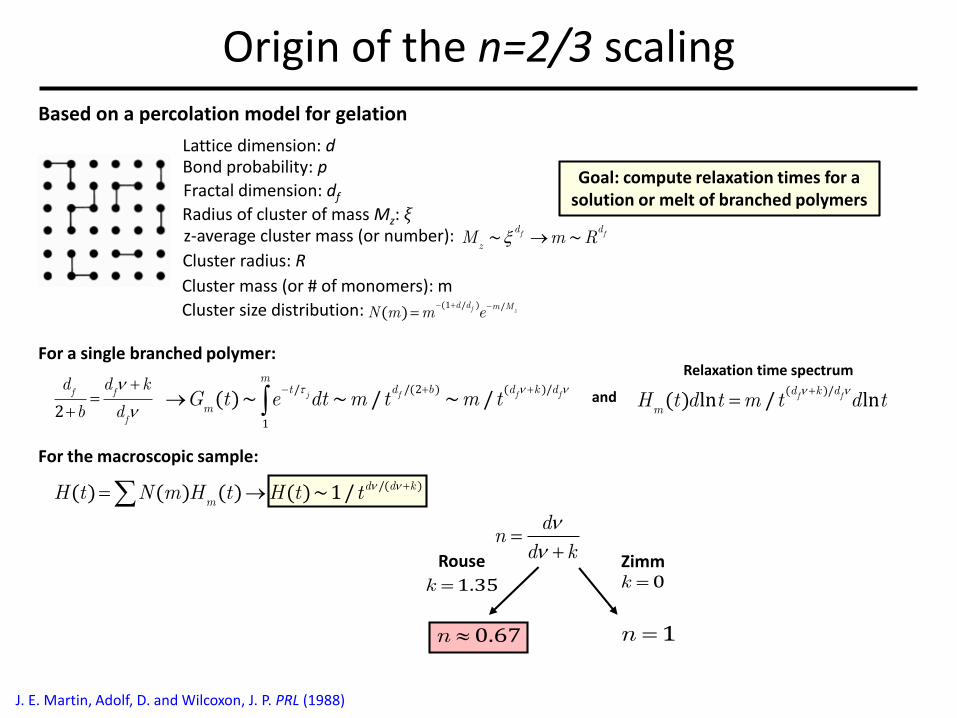
Origin of the n=2/3 scaling
13J. E. Martin, Adolf, D. and Wilcoxon, J. P. PRL (1988)
Based on a percolation model for gelation
Lattice dimension: dBond probability: p
Cluster size distribution: (1 / ) /( ) f z
d d m MeN m m
z-average cluster mass (or number):
Fractal dimension: df
Cluster radius: R
Cluster mass (or # of monomers): m
Radius of cluster of mass Mz: 𝜉
Goal: compute relaxation times for a solution or melt of branched polymers
First consider dynamics of single cluster
Relaxation time of a polymer chain : 2~ /r tR D
Assuming self-similar Brownian dynamics, relaxation timesof a linear or branched polymer of m monomers: ~ (1 )
Rjj j m
Cluster diffusion coefficient: ~ btD R
Relaxation time of shortest mode: 0~
m
(2 )/
0~( / ) (1 )fb d
jj m j m
Shear relaxation modulus: )
1
/ /(2
0~ ~ / (( ) )j f
mt d b
m RG dt m t tt e
Zimm
Rouse
Stokes-Einstein: 2~ / dt BD k T R
/2 ( )~ / fd d
mb d G t m t
0~ /t BD k T m
Individual monomer friction
~ ~f fd d
zM m R
0~ / fd
B fRk T b d
/(2 )( )~ / f fd d
mG t m t
Theta solvent:
1/2( )~ /mG t m t
1/ 2fd
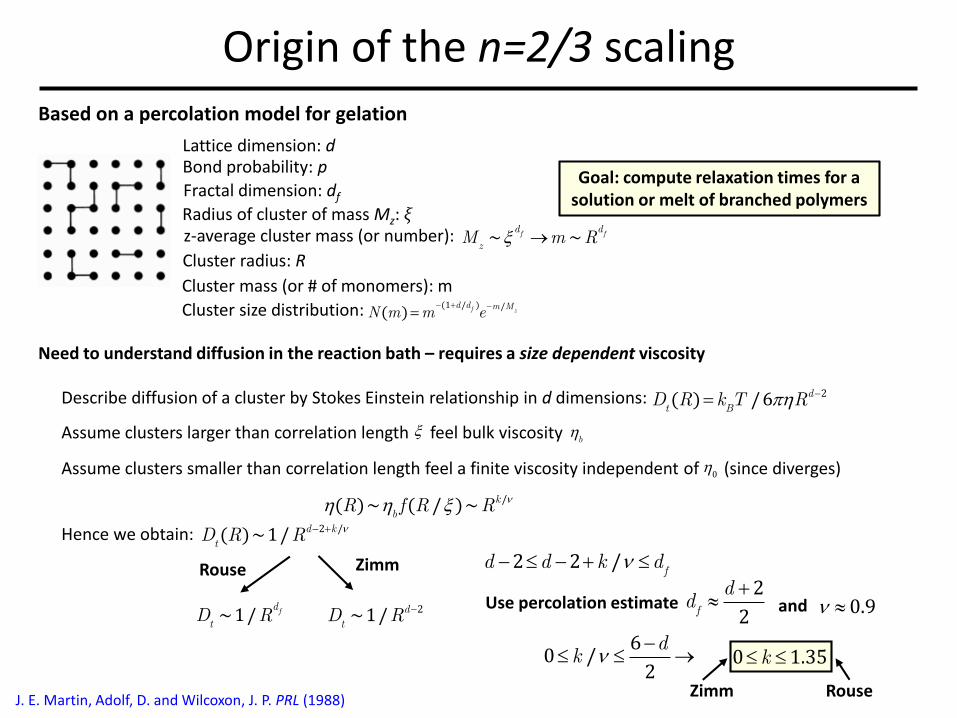
Origin of the n=2/3 scaling
J. E. Martin, Adolf, D. and Wilcoxon, J. P. PRL (1988)
Based on a percolation model for gelation
Lattice dimension: dBond probability: p
Cluster size distribution: (1 / ) /( ) f z
d d m MeN m m
z-average cluster mass (or number):
Fractal dimension: df
Cluster radius: R
Cluster mass (or # of monomers): m
Radius of cluster of mass Mz: 𝜉
Goal: compute relaxation times for a solution or melt of branched polymers
Need to understand diffusion in the reaction bath – requires a size dependent viscosity
~ ~f fd d
zM m R
Assume clusters larger than correlation length feel bulk viscosity
Assume clusters smaller than correlation length feel a finite viscosity independent of (since diverges)
b
0
/( )~ ( / )~ kb
R f R R
Describe diffusion of a cluster by Stokes Einstein relationship in d dimensions: 2( ) /6 dt BR k T RD
Hence we obtain: 2 /( )~1/ d ktR RD
ZimmRouse
~1/ fd
tD R 2~1/ d
tD R
2 /2f
d k dd
Use percolation estimate 2
2f
dd
0 1.35k
RouseZimm
and 0.9
6
20 /
dk
Origin of the n=2/3 scaling
J. E. Martin, Adolf, D. and Wilcoxon, J. P. PRL (1988)
Based on a percolation model for gelation
Lattice dimension: dBond probability: p
Cluster size distribution: (1 / ) /( ) f z
d d m MeN m m
z-average cluster mass (or number):
Fractal dimension: df
Cluster radius: R
Cluster mass (or # of monomers): m
Radius of cluster of mass Mz: 𝜉
Goal: compute relaxation times for a solution or melt of branched polymers
For a single branched polymer:
~ ~f fd d
zM m R
/ /(2 ) (
1
)/~ ~ / ~ /( ) j f f f
mdt d b k d
mde tG t m t mt
2
f f
f
kd d
b d
For the macroscopic sample:
( )/( ) ln / lnf fd k d
mH t d t m t d t
and
Relaxation time spectrum
/( )( ) ( ) ( ) ( )~1/ d d km
H t N m H t H t t
nd
d k
ZimmRouse
1n
0k 1.35k
0.67n
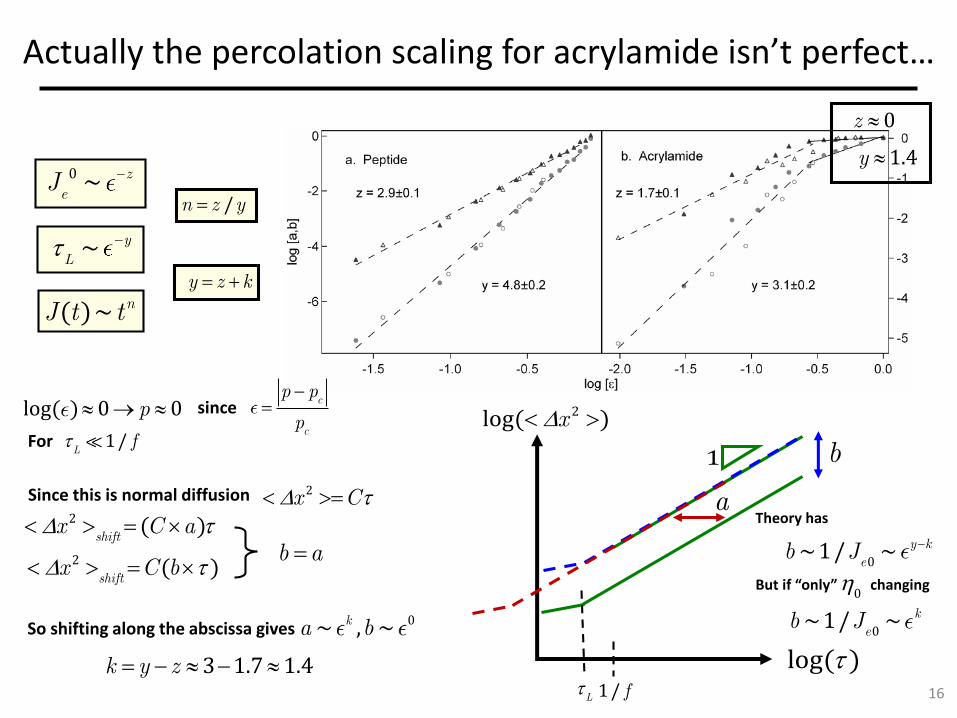
Actually the percolation scaling for acrylamide isn’t perfect…
16
0z
1.4y
og( 0 0l ) p c
c
p p
p
since
For 1/L
f
log( )
2og( )l x
1/ f
1
L
a
bSince this is normal diffusion 2x C
2 ( )shift
x C a
2 ( )shift
x C b b a 0
~1/ ~ y ke
b J
Theory has
But if “only” changing0
0~1/ ~ k
eb JSo shifting along the abscissa gives
0,~ ~ka b
3 1.7 1.4k y z
0 ~ zeJ
~ yL
~( ) nJ t ty z k
/n z y
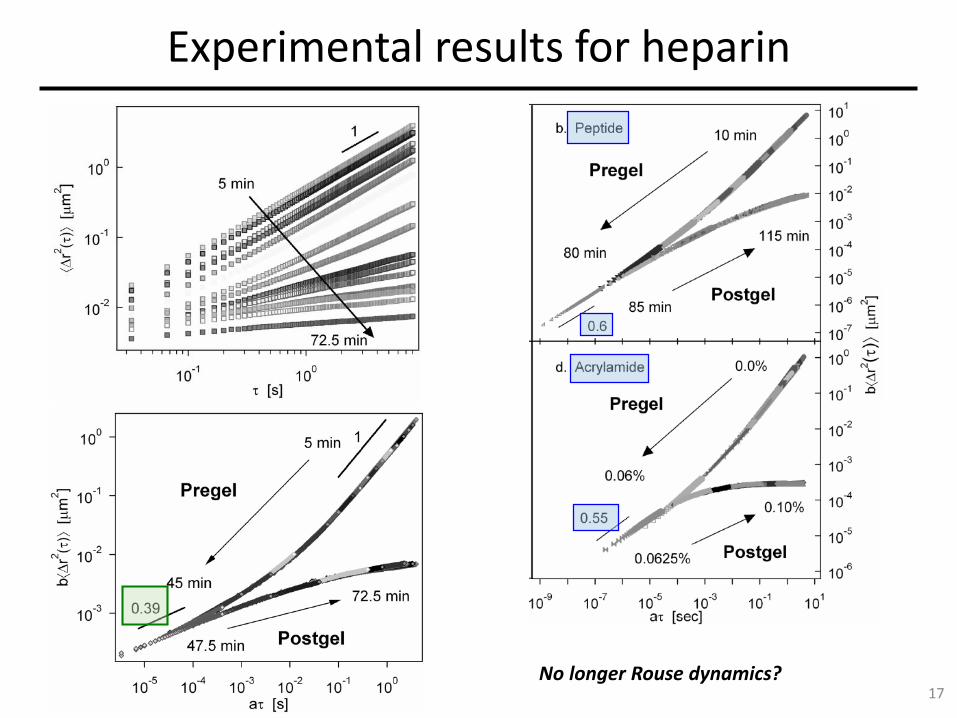
Experimental results for heparin
17No longer Rouse dynamics?
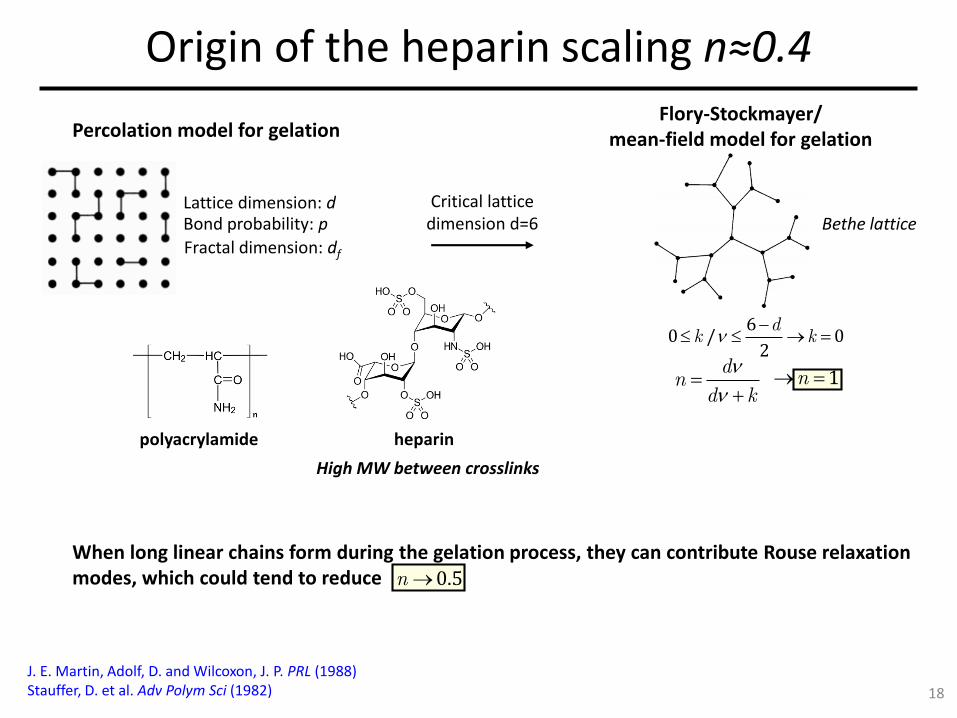
Origin of the heparin scaling n≈0.4
18
J. E. Martin, Adolf, D. and Wilcoxon, J. P. PRL (1988)Stauffer, D. et al. Adv Polym Sci (1982)
Percolation model for gelation
Lattice dimension: dBond probability: p
Fractal dimension: df
Critical lattice dimension d=6
Flory-Stockmayer/ mean-field model for gelation
Bethe lattice
nd
d k
06
/ 02
dk k
1n
polyacrylamide heparin
High MW between crosslinks
When long linear chains form during the gelation process, they can contribute Rouse relaxation modes, which could tend to reduce 0.5n