TRAINING AND ESTABLISHMENT SURVIVAL
William Collier, Francis Green and Young-Bae Kim
RESEARCH REPORT 20MARCH 2007
TRAIN
ING
AN
D ESTA
BLISHM
ENT SU
RVIVAL
RESEA
RC
H R
EPORT
20 – MA
RC
H 2007
This report is a summary of a research report carried out bythe University of Kent on behalf of the Sector Skills Development Agency.
To obtain copies of this document contactSector Skills Development AgencyCallflex Business ParkGolden Smithies LaneWath-upon-DearneSouth Yorkshire S63 7ER
Tel: 01709 765 444Email: [email protected]: www.skillsforbusiness.org.uk
ISBN: 978-0-9552029-6-4
J17473_Cover 20 8/3/07 08:39 Page 1

Training and Establishment Survival
William Collier, Francis Green and Young-Bae Kim
March 2007
Department of Economics University of Kent
J17473_Skills Report 20 8/3/07 08:28 Page 1

Training and Establishment Survival
____________________________________________________________________________________ 2
Sector Skills Development Agency: Research Series Foreword
In October 2002 the Department for Education and Skills formally launched Skills for Business (SfB), a new UK-wide network of employer-led Sector Skills Councils (SSCs), supported and directed by the Sector Skills Development Agency (SSDA). The purpose of SfB is to bring employers more centre stage in articulating their skill needs and delivering skills-based productivity improvements that can enhance UK competitiveness and the effectiveness of public services. The remit of the SSDA includes establishing and progressing the network of SSCs, supporting the SSCs in the development of their own capacity and providing a range of core services. Additionally the SSDA has responsibility for representing sectors not covered by an SSC and co-ordinating action on generic issues.
Research, and developing a sound evidence base, is central to the SSDA and to Skills for Business as a whole. It is crucial in: analysing productivity and skill needs; identifying priorities for action; and improving the evolving policy and skills agenda. It is vital that the SSDA research team works closely with partners already involved in skills and related research to generally drive up the quality of sectoral labour market analysis in the UK and to develop a more shared understanding of UK-wide sector priorities.
The SSDA is undertaking a variety of activities to develop the analytical capacity of the Network and enhance its evidence base. This involves: developing a substantial programme of new research and evaluation, including international research; synthesizing existing research; developing a common skills and labour market intelligence framework; taking part in partnership research projects across the UK; and setting up an expert panel drawing on the knowledge of leading academics, consultants and researchers in the field of labour market studies. Members of this panel will feed into specific research projects and peer review the outputs; be invited to participate in seminars and consultation events on specific research and policy issues; and will be asked to contribute to an annual research conference.
The SSDA takes the dissemination of research findings seriously. As such it has developed this dedicated research series to publish all research sponsored by the SSDA.
Lesley Giles Acting Director of Strategy and Research at the SSDA
J17473_Skills Report 20 8/3/07 08:28 Page 2
Training and Establishment Survival
____________________________________________________________________________________ 3
Contents
Executive Summary 6
Chapter 1 Introduction 10
1.1 Overview 101.2 Research Objectives 111.3 The Report Structure 13
Chapter 2 Training and Business Performance 15
2.1 Previous Evidence on Training and Business Performance 152.2 Training Beliefs, Business Performance and Establishment Survival 19
Chapter 3 The Workplace Employment Relations Survey (WERS) 22
3.1 WERS 98 Cross-section Survey 223.1.1 Survey of Managers (MQ) 233.1.2 Survey of Employees (SEQ) 24
3.2 WERS 2004 Panel Survey 25
Chapter 4 Sample Characteristics 274.1 Establishment Employment 27
4.1.1 Distribution of Employment by Gender and Employment Status 274.1.2 Distribution of Employment by Establishment Size 284.1.3 Distribution of Employment by Industry 294.1.4 Distribution of Employment by Occupation 30
4.2 Establishment Closure 324.2.1 Establishment Closure and Establishment Status 324.2.2 Establishment Closure by Largest Occupational Group & Industry 334.2.3 Establishment Closure by Average Educational Attainment of Employees 34
4.3 Employer Training 354.3.1 Training, Establishment Status and Industry (MQ) 364.3.2 Training and Training Intensity by Largest Occupational Group (MQ) 374.3.3 Training and Training Intensity by Occupation (SEQ) 39
4.4 Summary of Chapter 4 40
J17473_Skills Report 20 8/3/07 08:28 Page 3

Training and Establishment Survival
____________________________________________________________________________________ 4
Chapter 5 Training and Establishment Closure 415.1 Training and Establishment Closure 41
5.1.1 Training and Establishment Closure (MQ) 41
5.1.2 Training and Establishment Closure (SEQ) 45
5.2 Training and Closure by Occupation 46
5.2.1 Training and Closure by Largest Occupational Group (MQ) 46
5.2.2 Training and Closure by Occupation (SEQ) 50
5.3 Training and Closure by Industry (MQ) 52
5.4 Multivariate Analysis of Training and Establishment Closure 58
5.4.1 The Effects of Training on Establishment Closure (MQ) 59
5.4.2 The Effects of Training on Establishment Closure (SEQ) 63
5.5 The Effects of Training on Closure by Occupation 65
5.5.1 The Effects of Training on Closure by Largest Occupational Group (MQ) 66
5.5.2 The Effects of Training on Closure by Occupation (SEQ) 68
5.6 The Effects of Training on Closure by Industry (MQ) 70
5.7 Summary of Chapter 5 72
Chapter 6 Determinants of Establishment Training 756.1 Introduction and Motivation 75
6.2 Previous Studies on the Determinants of Training 76
6.3 Data Overview 78
6.4 Multivariate Analysis of the Determinants of Establishment Training 80
6.4.1 The Determinants of Establishment Training 81
6.5 Summary of Chapter 6 84
Chapter 7 Summary & Conclusions 867.1 Key Findings 86
7.1.1 The Link Between Training and Establishment Closure 86
7.1.2 The Determinants of Training in a Panel of Establishment 89
7.2 Policy Implications 90
7.3 Research Implications 92
J17473_Skills Report 20 8/3/07 08:28 Page 4

Training and Establishment Survival
____________________________________________________________________________________ 5
Annex I References 95 Annex II The Analysis for Sector Skills Councils 100
A1 Sector Skills Councils (SSC) 100
A2 Distribution of Employment by SSC 100
A3 Establishment Closure by SSC 102
A4 Employer Training by SSC (MQ) 103
A5 Training and Closure by SSC (MQ) 104
A6 The Effects of Training on Establishment Closure by SSC (MQ) 106
A7 Summary 108
Annex III UK Standard Industrial Classification 1992 (SIC 92) Codes 110
J17473_Skills Report 20 8/3/07 08:28 Page 5
Training and Establishment Survival
____________________________________________________________________________________ 6
Executive SummaryIntroduction
This study reports on a research project “Training and Establishment Survival” which has been funded
by the Sector Skills Development Agency (SSDA) to help inform one of the 3 key research themes of the
SSDA - “Understanding the demand for skills, the links between skills and performance”. The study
builds upon an array of emerging evidence which posits a positive link between employer training and
business performance. In particular, the research seeks to throw light on the relationship between off-
the-job training and business performance as captured by the commercial survival of establishments in
Great Britain over recent years. It also seeks to generate new estimates of the determinants of job
training at the establishment level. As such, the study aims to develop our understanding of the links
between skills and performance, and to provide insight into the drivers behind skills demand and
employers’ skills requirements. The respective consequences for policy formation are also considered
This report investigates whether training in British workplaces is associated with the chances of
establishment closure over a recent 6-year period. Its premise is that the survival of an establishment
provides an indicator of its long-term profitability. It has proved difficult, hitherto, to examine links
between training expenditures and profitability directly, so this study aimed to contribute to the
information set upon which decisions to train are made by businesses and to provide some evidence of
value to policy-makers whose aim may be to foster training through the dissemination of best practice,
and the promotion of training as good for employers without the need for costly public subsidies or
unpopular levies.
The Approach
The study used statistical methods to examine a sample of 2,191 establishments with at least 10
workers, whose managers and employees were interviewed in 1998 for the Workplace Employment
Relations Survey. In each establishment information was obtained from a senior manager and
separately from a sample of up to 25 employees. All establishments were traced again in 2004 to see if
they were still operating or had closed down, and re-interviews were sought in a randomly drawn sub-
sample of 1,479 establishments. Since survival is presumed to depend on profitability, the conjecture
here was that, if investment in training has an above-normal rate of return for the establishment, then a
marginal increase in training will enable the establishment to increase its chance of commercial survival.
J17473_Skills Report 20 8/3/07 08:28 Page 6
Training and Establishment Survival
____________________________________________________________________________________ 7
The results
Overall, 15% of establishments closed down between 1998 and 2004 with variations by a number of
workplace characteristics, such as industry sector (33% of establishments in Manufacturing closed down
compared to 2.5% in Public Administration).
The report distinguishes “non-training establishments”, who are the establishments that provided no off-
the-job training to the largest group of non-managerial employees in the workplace, from “training
establishments” which provided at least some such training. Overall, 24% of the establishments were
non-training in this sense.
There was a substantial association found between training and the chances of establishment closure.
More than one in four non-training establishments (27%) closed for business over the 1998-2004 period,
while only about one in nine training establishments (11%) closed down. This difference is also evident
when analysing specific populations, for example, for each size of category, those establishments which
had provided training had lower closure rates than those which did not. Confirmation of this link is
provided by the separate reports of training provided by the employees from all occupations in the
establishments.
The study also controlled for the effects of other variables on establishment closure, including among
other factors the average education level of employees, the size of the establishment, its age, sector and
industry. After applying these controls to the manager-provided data, the estimated effect of providing
training remains substantial and serves to reduce the probability of closure by 9 percentage points. With
a slightly differing definition of training, the employee-provided data implied a downward impact of a
similar size, but these estimates were less precisely determined and hence statistically insignificant.
A one-level increase in the average education of employees (say from GCSE to A Level) was found to
be robustly associated with a 4 to 6 percentage point reduction in the chances of establishment closure,
depending on the statistical specification used. This impact of human capital on establishment closure is
independent of the negative impact identified for employer training and supports evidence from a
number of recent studies which demonstrate a significant and positive impact of human capital
accumulation on business performance.
The study also examined the intensity of training, as indicated either by the proportion of workers
receiving training or by the average duration of training. Amongst training establishments, there was no
association between the intensity of training and establishment closure.
J17473_Skills Report 20 8/3/07 08:28 Page 7
Training and Establishment Survival
____________________________________________________________________________________ 8
Each factor was explored by occupation and industry (as the data allowed) and showed some
particularly strong effects for some groups. For example, taking other factors, such as establishment
size and age into account, establishments which provided training to the largest occupational group of
Craft occupations were 44 percentage points less likely to close down after 6 years than those which did
not provide training for this largest occupational group. Similar results were observed for Personal
Service staff (23 percentage points less likely to close) and Routine Unskilled (21%). Again, these
patterns were reflected in industry sector, where, for example, establishments which trained their largest
occupational group in Construction were 67 percentage points less likely to close and those in Hotels
and Restaurants 58 percentage points less likely to close than those which had not provided such
training. An exception is Other Business Services where training establishments are more likely to close,
but, those with higher levels of education are less likely to close. This emphasises the importance of
considering training need and the relevance of training across different circumstances.
The report notes some limitations to the study. First, while the data covers off-the-job training it does not
cover informal training, and the management-provided data does not cover all types of employees in the
workforce. Second, while many observed factors are controlled for, some unobservable factors might
have been generating some of the association between training and closure. Our findings are thus
subject to the usual caveats about inferences drawn from cross-section data.
The study also investigated the determinants of training using longitudinal data drawn from WERS,
allowing the study to take into consideration the impact of unobserved establishment characteristics
which may be important determinants of training but which are not otherwise observed in cross-section
analysis. The study finds that the characteristics identified as important in earlier studies are also
identified in this longitudinal analysis, this organisation size has a positive effect on the proportion of
employees trained in the largest occupational group, but a high proportion of female employees has a
negative effect.
Implications
The conclusion that training participation affects the chances of establishment closure implies that those
establishments that do not train at all have under-invested in training. The conclusion that training
intensity makes little or no difference to the risk of closure suggests that, among training establishments,
the amount of training may be close to the optimal amount. This arises if managers of training
establishments are better attuned than their non-training counterparts in recognising the efficacy of
training on productivity and business performance and hence in making reasonably well-informed
J17473_Skills Report 20 8/3/07 08:28 Page 8

Training and Establishment Survival
____________________________________________________________________________________ 9
judgements regarding appropriate levels of training investment. In contrast, it may be that managers that
do not train at all have given insufficient thought to the benefits of training and hence their survival
chances are diminished. Given these findings, the report argues that the general policy implication is
that attempts to influence businesses through persuasion and advice should be concentrated as far as
possible on non-training establishments i.e. where under-investment is sub-optimal and inhibiting
performance and indeed long-term prospects. Among training establishments, interventions and advice
could still be focussed on providing services and improving training quality. The case for dissemination
and training market interventions to promote the wider benefits (social returns) of training arising through
labour mobility are not affected by the findings of this report. It serves to highlight an important role for
SSCs in making the case to employers to invest in skills.
J17473_Skills Report 20 8/3/07 08:28 Page 9
Training and Establishment Survival
____________________________________________________________________________________ 10
Chapter 1 - Introduction
1.1 Overview
This study reports the empirical findings of the research project “Training and Establishment Survival”
which has been funded by the Sector Skills Development Agency (SSDA) to help inform one of the 3 key
research themes of the SSDA - “Understanding the demand for skills, the links between skills and
performance”. The study builds upon an array of emerging evidence which posits a positive link
between employer training and business performance. In particular, the research seeks to throw light on
the relationship between off-the-job training and business performance as captured by the commercial
survival of establishments in Great Britain over recent years. It also seeks to generate new estimates of
the determinants of job training at the establishment level. As such, the study aims to develop our
understanding of the links between skills and performance, and to provide insight into the drivers behind
skills demand and employers’ skills requirements. The respective consequences for policy formation are
also considered.
Many studies have sought to explore the relationship between skills and economic performance,
whether at the level of the individual, the firm or of the country as a whole. However, remarkably little is
known about the relationship between employer training and the financial performance of companies.
There are several studies which provide evidence that employer training benefits employees (examples
are Bartel, 1995; Blundell et al, 1996; Green et al, 1996; Booth et al, 2003; Vignoles et al, 2004). A
number of other studies provide evidence to support the view that employer training may have positive
effects on organisational productivity (e.g. Holzer, 1993; Alba-Ramirez, 1994; Zwick, 2002). Nonetheless,
few existing studies directly examine the longer term impacts of training on business performance.
Knowledge of the link between training and business performance is a useful input for business
development and policy making. If, for example, the returns to training are found to be high for a
particular group of workers, this supports policies and practices that make use of this information to
encourage increased training. By contrast, where the returns to training are less than normal, one could
infer that firms may be spending too much on training though the training could still be too low from
society's point of view (Stevens, 1994 & 1999). In this light, the dissemination of information about the
effectiveness or otherwise of different types of training can thus be viewed as a public good. This has
often been the (normally unstated) rationale of a number of UK government policy initiatives in recent
J17473_Skills Report 20 8/3/07 08:28 Page 10
Training and Establishment Survival
____________________________________________________________________________________ 11
decades, which have sought to foster training through the dissemination of best practice, and the
promotion of training as good for employers.
Although many firms evaluate their own training expenditures, the benefits of training in terms of
productivity gains, revenue streams or profit rises are difficult (and sometimes impossible) to measure,
even ex post.1 Uncertainty may surround any of several inputs that combine to generate the return to
training, including the quality of the training process, the effectiveness of the generated skills in raising
productivity (which may depend also on physical investments), and the extent to which the benefits may
be depreciated through random or induced labour turnover. Such uncertainty makes it hard for a firm to
assess the impact of its training expenditures on profits. As a consequence, there is an increased
likelihood that firms may either over-invest or under-invest in training. Many commentators expect the
latter outcome, arguing that “short-termist” firms will accord disproportionate weight to known current
training expenditures, and less weight to unknown future benefits (Finegold, 1991; and Vickerstaff, 1992).
If short-termism prevails the policy implication is that, if government agencies could influence firms’
perceptions about the effect of training on their profitability, firms would increase their investment in
employees’ skills.
Lacking data on training costs and profits, an alternative approach to considering the impact of training
on establishment performance is to examine the closely-related question as to the impact of training on
medium-term commercial survival. Since survival is presumed to depend on profitability, the conjecture
here is that, if investment in training has an above-normal rate of return for the establishment, then a
marginal increase in training will enable the establishment to increase its chance of commercial survival.
The converse also applies: If training expenditures are too high, then a reduction in training would be
associated with a greater chance of survival.
1.2 Research Objectives
This study utilises the link between profitability and establishment survival to investigate the impact of
training on business performance as measured by commercial survival utilising two substantial and
nationally-representative data sets drawn from the Workplace Employee Relations Surveys Series,
namely WERS 98 and WERS 2004. These data provide large-scale, statistically reliable evidence
1 Within a firm, the human resource department would typically carry out such evaluations; there is sometimes an incentive for that department to justify training expenditures as having benefits in bidding for further resources. The decision to spend money on training is sometimes described by employers as an "act of faith".
J17473_Skills Report 20 8/3/07 08:28 Page 11

Training and Establishment Survival
____________________________________________________________________________________ 12
concerning a broad range of industrial relations and employment related issues across almost every
sector of the economy in Great Britain. The WERS 98 and WERS 2004 data provide establishment level
evidence concerning the incidence of off-the-job training and the degree of such training undertaken by
the largest occupational group. The WERS 2004 data also provide objective evidence of establishment
performance as measured by the commercial survival (or closure) of those establishments surveyed in
WERS 98. The ability to observe establishment level off-the-job training alongside the medium-term
commercial survival of each establishment permits a quantitative analysis of the association between off-
the-job training and the commercial survival of establishments in Britain over recent years. It also permits
a longitudinal investigation into the determinants of training at the establishment level. The latter is
important in helping to identify causal determinants of training whilst avoiding any biases associated with
unobserved characteristics of establishments that remain fixed between periods.
Identifying the key drivers which underpin the demand for training is essential to further our
understanding of employers’ skills requirements and the constraints they face therein. Likewise,
evidence on the association between training and business performance, gleaned from a nationally
representative sample of establishments, can contribute to the information set upon which the private
judgements of firms are made, and assist policy-makers in the Sector Skills Councils and elsewhere
whose aim may be to affect the amount of employer training through the engagement with employers
and the dissemination of information, without the need for costly public subsidies or unpopular levies.
The objectives of the report are therefore:
1) to discuss the theoretical and empirical background to the impact of training on establishment
survival
2) to identify the key research questions for investigation
3) to outline the methodology used in the empirical analyses
4) to present evidence on the relationship between training and the economic survival of
establishments, and
5) to present evidence on the determinants of training in a longitudinal panel of establishments
6) to consider at a general level the implications of the findings for policy-makers.
J17473_Skills Report 20 8/3/07 08:28 Page 12

Training and Establishment Survival
____________________________________________________________________________________ 13
1.3 The Report Structure
The report proceeds as follows.
Chapter 2 provides a précis of the existing empirical literature on the effects of training on business
performance and is used to motivate and contextualise the research questions of the current study within
the existing literature. The Chapter provides an overview of the evidence on the relationship between
training, profitability and other agreed measures of economic performance. Since this body of research
is small, this part of the study is relatively brief and does not seek to re-visit in detail areas covered
adequately by other recent overviews of this field (e.g. Tamkin, 2005). The Chapter also provides a
simple exposition of the relation between training, profits and establishment survival by considering how
the training decision of establishments depends upon beliefs about the efficacy of training on productivity
and future profits.
Chapter 3 presents an overview of the Workplace Employee Relations Surveys (WERS). The chapter
describes the survey design of the WERS 98 Cross-section and WERS 2004 Panel Survey and
considers the information contained therein that can be utilised to undertake a quantitative analysis of
the link between training and commercial survival. The chapter explains how the (discrete) commercial
survival outcome of establishments over the period 1998-2004 can be identified using these two data
sources. It then proceeds to provide a discussion of alternative measures of training that can be derived
from the Survey of Managers (MQ) and the Survey of Employees (SEQ) using the WERS 98 Cross-
section.
Chapter 4 provides a descriptive statistical analysis of establishment closure and the incidence and
degree of training undertaken across establishments using the WERS 98 and WERS 2004 data. The
Chapter examines the distribution of employment by gender and employment status, and then proceeds
to examine the distribution of employees and establishments by occupation, industry and establishment
size. The Chapter also considers the distribution of establishment closure and training at both the
sectoral level and across occupational groups. As stated previously, the discrete variable of commercial
closure is an indirect indicator of the medium to longer-term profitability of an establishment.
Chapter 5 contains the main analysis of the study and discusses the empirical findings of the report. The
Chapter first reports the results of a bivariate analysis of establishment closure according to both the
incidence and intensity of training. At this stage, it also examines the links between training and closure
within occupations, industries and establishment-size groups to investigate whether observed impacts of
J17473_Skills Report 20 8/3/07 08:28 Page 13
Training and Establishment Survival
____________________________________________________________________________________ 14
training on closure are due to differences between those disaggregated groups. The Chapter then
proceeds to report multi-variate probit analyses of the impact of training on establishment closure having
controlled for additional determinants of commercial closure as identified in previous studies.
Disaggregate analyses which investigate whether there are differential effects of training on closure
across occupational and industrial groups are also reported.
Chapter 6 investigates the determinants of employer provided off-the-job training using the 1998-2004
longitudinal component of the WERS 2004 data. Unlike most previous studies which utilise cross-section
data, the Chapter utilises a panel fixed-effects specification that is able to control for important time
varying processes and establishment specific effects. The Chapter provides a brief literature review on
the determinants of training and an overview of the 1998-2004 panel data focusing on the distribution of
training. It then presents first estimates of the determinants of training using both Ordinary Least
Squares (OLS) and panel fixed-effects (FE), and draws relevant conclusions regarding the perceived
wisdom of existing studies using conventional cross-section data.
Chapter 7 summarises the main empirical conclusions from the above analyses and provides an
interpretation of the empirical findings. The Chapter draws relevant policy implications of the study and
considers important avenues for future research which may help to shed further light on the relationship
between training and business performance.
J17473_Skills Report 20 8/3/07 08:28 Page 14
Training and Establishment Survival
____________________________________________________________________________________ 15
Chapter 2 – Training and Business Performance
2.1 Previous Evidence on Training and Business Performance
There is now an established body of evidence that employer training benefits employees through
increased wages (e.g. Bartel, 1995; Blundell et al, 1996; Green et al, 1996; Booth et al, 2003; Vignoles
et al, 2004).2 The magnitude of estimates differs, reflecting differences in the training measures and in
training quality across data sets. There is also evidence that the returns to training are greater for those
chosen to receive it than for those not chosen (e.g. Vignoles et al, 2004), suggesting that firms are at
least to some extent rational in allocating their training budgets between workers. There is also growing
evidence to support the view that training has positive effects on individual or organisational productivity
(e.g. Holzer et al, 1993, for the US; Zwick , 2002, for Germany; Alba-Ramirez, 1994, for Spain).3 An
exception, notable because of the high quality of its data, is the finding reported by Lynch and Black
(1995 & 2001) that the numbers of employees in training in US manufacturing establishments has no
significant impact on contemporaneous productivity.4
Barron et al (1989), Bishop (1994), and Dearden et al (2000) agree with each other in finding that
productivity gains are greater than employees' wage gains. We should expect the value of the
organisational productivity gains to exceed employees' wage gains for two reasons. First, if employers
are to obtain a positive return to training, unit labour costs need to fall – the more so, the greater are the
up-front training costs borne by the employer. Second, we expect there to be benefits to training that are
external to the individual trainee but internal to the organisation. This happens because others in the
organisation also benefit from working with newly skilled workers, and because training can act as a
gateway through which knowledge and expertise enter the organisation, improving the work-based
learning of other employees (Eraut et al, 1998). Kitching and Blackburn (2002) investigate the impact of
training (including informal training) on business performance among small firms with 2-49 employees
utilizing quantitative and qualitative data, the latter being drawn from face-to-face interviews with 50
employers. They report that training gives rise to better business performance: those employers who
measure the benefits of training have greater chances to improve business performance; likewise, those
employers who have a strategic orientation to training are more likely to experience growth in both
employment and real sales.
2 Overviews are provided by Barrett et al (1998), Bishop (1997) and Green (1997). 3 Bartel (2000) gives an overview.4 Lynch and Black do find that IT use by non-managerial staff raises productivity and link this to human capital investment by the firm.
J17473_Skills Report 20 8/3/07 08:28 Page 15
Training and Establishment Survival
____________________________________________________________________________________ 16
There are other benefits too. Dearden et al (1996) and Green et al (2000) report that company training
has modest effects on indirect indicators of performance such as labour turnover and mobility. Finally,
Booth and Zoega (2000) suggest that training helps to attract good quality workers.
Yet, lacking information on training costs, the above studies do not generate estimates of any impact of
training on financial performance. This objective is achieved by two "econometric case studies", where
findings are based on individual performance data drawn from a company's internal records, including
cost data. Bartel (1995) computes rates of return ranging from 7 to 50 per cent for a large manufacturing
company; while estimates from Krueger and Rouse (1998) imply a return of 7 to 9 per cent (Bartel, 2000).
In both studies, training's effect is derived from the impact on individuals' performance in the first year
after training. Cosh et al (2003), using the survey data set of Dun & Bradstreet, consider whether training
has an impact on profitability and labour-market conditions. They report that training expenditure per
establishment yields a significant and positive impact on employment and/or turnover growth. They also
report that the change in the profit margin is in general positively correlated with training expenditure per
establishment. This latter effect appears stronger among smaller establishments. However, the impact of
training on the profit margin is less significant once training is measured by training expenditure per
employee. Furthermore, the authors are unable to identify a significant relationship between training
intensity and productivity growth for either training measure.
Also relevant are studies that find an impact of human resource management policies on performance.
Although there is as yet no consensus as to how bundles of the human resource practices are
constructed or indeed suitably measured, influential studies by Huselid (1995), Huselid and Becker
(1996) and by Ichniowski et al (1997) point to the conclusion that introducing modern human resource
management systems that include high training levels tend to raise profits. Michie and Sheehan-Quinn
(2001) also report a positive correlation between Human Resource Management (HRM) systems that
include training and a subjective measure of financial performance.
Ichniowski et al find the impact of the choice of HRM systems to be large and argue that it is only the
switching costs of moving to a high performance system that prevents firms exploiting the profit gains.
An alternative argument is that firms may be unaware of the potential gains. In these studies, the impact
of training is likely to be greater if accompanied by other elements of a human resource policy bundle,
such as consultative committees or appraisal schemes. Nevertheless, the precise impact of training
within systems of HRM is unclear, since the studies typically do not present estimates of the effects of
training both separately and interacted with other policies. We are thus unable to draw from this literature
substantial conclusions about employer returns to training. Tamkin (2005) provides an insightful review
J17473_Skills Report 20 8/3/07 08:28 Page 16

Training and Establishment Survival
____________________________________________________________________________________ 17
of the impact of these High Performance Work Practices (HPWPs) on business performance and
considers the implications of the wider evidence on skills, training and HR for employers. Godard (2004)
also provides a critique of this high-performance paradigm.
Hitherto, studies of workplace closure have (to our knowledge) not considered any potential role for
employer training. The emphasis of these studies has been on whether unionism is detrimental to
establishment survival (Machin, 1995; Bryson, 2001), or, relatedly, whether plant closure is linked to
conflict in industrial relations (Kirkham et al, 1999). Such studies also focus on the role of greater market
power and/or better financial performance in reducing the chances of plant closure. Other researchers
have emphasised the importance of entry size and of early entry in the product life cycle (Klepper and
Simons, 2000), the stock of professional and technical workers at the establishment together with
investments in research and development (Hage et al, 1993), and the role of higher technology and
ownership in reducing the chances of closure (Agarwal, 1996; Colombo and Delmastro, 2001).
This brief overview of existing studies has revealed that remarkably little is known about the impact of
employer training, or of human capital generally, on the financial performance of companies. Moreover,
few existing studies directly examine the longer term impacts of training. In view of the importance of this
empirical issue, this knowledge gap in the research and policy-making community might seem surprising,
leading one to ask why more is not done to investigate the issue more comprehensively. An obvious but
significant reason is the lack of appropriate data sets with adequate information on profitability, and
accurate data on the sums invested in training.5 Clearly, both data are required for computing the rates
of return to training.
As stated previously, an indirect approach around this problem is to consider the longer-term impact of
training on establishment survival. This is the approach taken by Collier et al (2005). Using data taken
from the longitudinal element of the Workplace Industrial Relations Survey (WIRS3) 1990-1998 and the
1991 Employers’ Manpower and Skills Practices Survey (EMSPS), they derive the commercial survival
or failure of an establishment. The impact of training investment is then evaluated against this objective
indicator of establishment performance. Since the EMSPS data affords detailed measures of the annual
training given to each occupational group in the organisation, the authors are also able to distinguish
between the effects of training different sections of the workforce. Accordingly, they find that increased
training of non-manual workers in large establishments (defined as establishments with 200 or more
employees) is associated with a greater chance of establishment survival: a 10 percentage point
5 Wall and Wood (2005) make the case for more resources to be donated to “big science”, which would enable these sorts of questions to be answered more thoroughly with respect to the public benefit.
J17473_Skills Report 20 8/3/07 08:28 Page 17

Training and Establishment Survival
____________________________________________________________________________________ 18
increase in the average establishment’s training of non-manual workers is associated with a 0.8
percentage point reduction in the risk of closure. This is a notable efficiency gain when set against an
average closure rate of 14 per cent over the entire period. Notably, finer disaggregation of the data
reveals that the association differs across occupational groups. In smaller establishments which employ
less than 200 employees, increased training for Craft and Technical workers is associated with better
chances of survival, while for Professional workers the opposite effect is found.
The study by Collier et al is important because it provides a useful first step in approaching a better
understanding of the link between training and firm performance. Since the study uses survey data
drawn from all (private) sectors of the British economy (subject to a minimum of 25 employees in the
establishment), the findings can be regarded as applicable in a wide range of contexts. Nonetheless, the
data utilized is now relatively dated and as such raises questions as to whether further insight can be
gleaned on the relationship between training and business performance. Not least, both the quantity and
quality of employer provided training have increased since the beginning of the 1990s perhaps reflecting
greater awareness among employers of the need for training in order to meet skill requirements and the
increased policy emphasis on skills in recent years.
It is in this regard that the current study seeks to build upon the existing literature. Utilising the
methodology of Collier et al, the study investigates the impact of training on business performance
utilising more recent data drawn from the 1998 cross-section and 2004 longitudinal component of the
Workplace Employment Relations Survey (WERS). The WERS 98 data provide detailed indicators of
whether each of eight largest occupational groups within establishments are given training and, if so,
what proportions of employees are trained. By contrast, the longitudinal component of WERS 2004
provides objective evidence of business performance as measured by the commercial survival (or
closure) of those establishments surveyed in WERS 98. As such, the combined WERS data facilitate
further enquiry of the relationship between training and establishment performance over a period of time
when training and education have been at the forefront of the government’s policy agenda to promote
UK economic competitiveness, flexible labour markets, and high wage and employment growth.
J17473_Skills Report 20 8/3/07 08:28 Page 18
Training and Establishment Survival
____________________________________________________________________________________ 19
2.2 Training Beliefs, Business Performance and Establishment Survival
Identifying a link between business performance and establishment survival is relatively straightforward.
It is commonly assumed that the objective of a firm is to maximise profits. In the case of a firm with
multiple establishments, the central management will wish to expand those parts of the firm that are
profitable and close down unprofitable parts. Thus, the manager of a specific establishment will wish to
be as profitable as possible to avoid closure by the central management or through take-over/merger.
Similarly, for the case of a single plant firm, the management will wish to maximise profits so as to avoid
closure through bankruptcy or take-over. Of course, a firm might close down for personal rather than
financial reasons (e.g. retirement or ill health of the owner, where the owner does not want to sell up),
but closures of this type are very much the exception and are more relevant in the case of very small
enterprises with only a few employees. This study is restricted to establishments that have at least 10
employees. Amongst these establishments, closure is directly linked to profitability. In this regard, the
medium-term commercial survival or closure of a company can be considered a good indicator of
business performance.
However, identifying the potential effects of employer-provided training on profitability (and hence
commercial survival) requires greater consideration. Firstly, one must consider why employers seek to
provide training for employees. Secondly, one must also recognise that employer-provided training is an
outcome of two decisions – those of the employer and the employee. For employees, the decision to
undertake such training will be dependent upon their expectations regarding the future benefits of
training either in higher wages (reflecting higher productivity) and/or increased knowledge/job security
within the workplace.6 For employers, the decision is normally assumed to depend on expectations
regarding post-training productivity gains and the reduced costs associated with lower labour turnover.
Yet in deciding how much resource to devote to training, and where best to allocate it, the employer
generally lacks any precise metric. How a firm benefits from training its employees can sometimes be
captured through measures of improved job performance. However, the impact on organisational
productivity and a fortiori on profits has typically to be a matter of judgement in the face of uncertainty.
A general presumption of economic theory is that in a competitive market investments would receive a
normal risk-adjusted return on capital. If there is too little investment, the returns would be high and more
investments would be made; but beyond some optimal point there would be diminishing returns, so that
any further investment would become excessive. Investments in human capital, however, are subject to
6 Where training costs are not borne solely by the employer, the individual’s training decision must also consider the net present cost of undertaking such training.
J17473_Skills Report 20 8/3/07 08:28 Page 19

Training and Establishment Survival
____________________________________________________________________________________ 20
great uncertainty, so the returns can deviate from a normal rate without there being a market-
equilibrating reaction. It is thus quite possible for a firm's marginal returns to training investments to be
substantively above or below a normal rate of return without stimulating an adjustment in the size and
distribution of its training budget. The effect of such uncertainty in the economic returns to training is that
the amount of training can be influenced by the “culture” of a firm, and more particularly by the beliefs of
managers about training’s effectiveness. Moreover, differences in those beliefs which result in more or
less training could then be reflected in market returns that deviate from the normal return, with
consequent implications for the chances of commercial survival.
If one assumes that some part of employer-provided training is in effect firm-specific, then there is no
difficulty in rationalising why firms have an incentive to invest in training. How much training firms should
provide can then be shown in a formal logical model to depend on their beliefs about the efficacy of
training.7 If one abstracts from thinking about the impact of training on profits to the impact of training
upon commercial survival, the decision about how much training to provide is concerned with maximising
the probability of survival with respect to the proportion of the labour force trained. The probability of
survival across several periods of time depends on the profits obtained in each period. The impact of
training on combined profits over time is, however, uncertain. Training expenditures incur costs which
reduce profitability (and hence the probability of survival). These expenditures raise subsequent
profitability (assuming the training raises productivity) but the true economic returns to such training are
unknown. Management has a perception about the efficacy of training. However, perceptions about the
efficacy of training differ across establishments. Accordingly, differences in perceptions about the
efficacy of training will give rise to differences in the levels of training investment.
One can think of this link between perceptions about the efficacy of training and levels of training
investment in simple terms by comparing “pessimistic” and “optimistic” managers/establishments. 8
Relative to establishments with a pessimistic view on the efficacy of training, optimistic establishments
will believe that any given positive level of training generates greater expected second period profits.
They will also believe that an increase in training gives rise to a greater increase in second period profits.
Hence, relative to establishments with pessimistic beliefs, establishments with more optimistic beliefs will
choose to invest more in training. This theoretical finding is important because it demonstrates logically
that beliefs are important. For each firm, there is an unknown optimal amount of training which would
maximise the probability of survival in an uncertain commercial world. However, unduly pessimistic
7 For a full exposition of our theoretical model, see Collier et al (2005) 8 Note that this characterisation refers to optimism about training and not optimistic beliefs about profitability in general.
J17473_Skills Report 20 8/3/07 08:28 Page 20

Training and Establishment Survival
____________________________________________________________________________________ 21
managers choose training levels below that optimal level, while unduly optimistic managers would over-
invest in training. Among a group of pessimistic establishments one would find a positive relation
between training and subsequent survival, while the opposite would be true for a group of optimistic
managers.9
This conclusion is important for our research because it gives us a way of indirectly determining the
beliefs of managers/establishments about training, and about whether their chosen training levels are
above or below the optimum. If one observes in reality a positive relation between training and survival
probability (after allowing for other causal factors), one could infer that on the whole their views are
pessimistic relative to the optimal amount of training. The opposite inference could be made if training
and survival are found to be negatively related, while if there is no demonstrated relationship (and the
data is well-measured) one could conclude that managers are choosing the right amount of training. 10
The policy significance of this modelling approach is that, if there is empirical evidence of mainly
pessimistic beliefs, there is a rationale for government intervention with demonstration projects to show
the profitability of investment in training. As noted in the introduction, it has frequently been the objective
of successive governments to raise firms’ expectations about the profitability of training through the
dissemination of best practices and without the need for costly public subsidies or unpopular levies. This
view fits with the widely held belief that British companies have under-invested in training activities
typically because they underestimate their true economic value. Evidence to support this view would
vindicate this past approach to policy and would reinforce the need for greater engagement with
employers to ensure that the full economic benefits of training are recognised both in the workplace and
across the economy as a whole. On the other hand, if it is found that there is no relationship between
establishment survival and training expenditures, and provided one can be confident that there are no
major measurement errors leading to downward bias in the estimated effects, it could then be argued
that there is no need for the government to try to persuade employers to invest more in training than they
are already doing. The findings from the research can therefore be thought of as a public good,
generating information from which employers can benefit through improving their decision-making in this
uncertain field.
9 The above arguments apply with different and varying force in the public sector, where in any case closure rates are normally lower than in the private sector. However, it remains true that many public sector establishments do operate in a competitive environment, where the delivery of good service can be an aide to survival, and the contribution of training is still a matter for managers’ judgement. 10 Note that in this instance, the presence of positive spillovers arising from investment in training will ensure that the level of training remains sub-optimal from society’s point of view.
J17473_Skills Report 20 8/3/07 08:28 Page 21

Training and Establishment Survival
____________________________________________________________________________________ 22
Chapter 3 – The Workplace Employment Relations Surveys (WERS)
The study utilises data drawn from the 1998 Cross-section and 2004 Panel component of the Workplace
Employment Relations Survey (WERS). WERS 98 and WERS 2004 are the fourth and fifth in a series of
surveys carried out at British workplaces for central government and other funders.11 Both surveys are
based on a stratified random sample of establishments and a sample of employees at those
establishments. The WERS 98 Cross-section Survey consists of a sample of just under 2,200
establishments drawn from both the private and public sectors of the British economy subject to a
minimum of 10 employees in the establishment. The WERS 2004 Cross-section Survey was widened in
scope to include establishments with 5-9 employees, and incorporates an increased sample size of just
under 2,300 establishments. The Panel Survey of WERS 2004 retraces those establishments that took
part in the WERS 98 Cross-section and provides objective evidence of whether they are still in existence
or have subsequently closed down.
In addition to the richness of the information contained in these surveys, an advantage of using this data
is the high quality of data collection, resulting in largely reliable evidence. After proper allowance through
weighting for the stratified sampling methods, the findings presented in this report can be expected to
apply without bias to the national population of establishments. In this context, the current chapter
provides a short overview of the WERS data and of the WERS survey design. A descriptive overview of
the WERS establishments and their characteristics is provided in Chapter 4.
3.1 WERS 98 Cross-section Survey
The WERS 98 cross-section is a nationally representative survey of 2,191 British establishments with 10
or more employees in all sectors excluding agriculture, forestry and fishing, and coal mining. The survey
collected information from a wide range of establishment representatives including managers with
responsibilities for employment relations or personnel, trade union or non-union representatives, and a
random sample of 25 employees.12 For the purposes of this study, we utilised data from both the Survey
of Managers (MQ) and the Survey of Employees (SEQ) and at best 2,062 establishments for the sample.
11 The funders for WERS 2004 and WERS 98 were The Department of Trade & Industry, The Economic and Social Research Council, the Policy Studies Institute and the Advisory, Conciliation and Arbitration Service. 12 For establishments with fewer than 25 employees, all employees are included in the scope of the survey.
J17473_Skills Report 20 8/3/07 08:28 Page 22

Training and Establishment Survival
____________________________________________________________________________________ 23
3.1.1 Survey of Managers (MQ)
The Management Questionnaire consists of two parts: a self-completion Employee Profile Questionnaire
(EPQ) and the Main Management Interview itself. The EPQ was sent to the workplace in advance of
each interview, to be used for the recording of workforce data that may require the respondent to consult
workplace records. As such, the EPQ provides a detailed breakdown of each workforce by employment
status, gender, race, age and occupation. The EPQ is utilised throughout the Main Management
Questionnaire and assists in routing questions that relate to the largest occupational group within an
establishment.
The Main Management Questionnaire was conducted on-site by a trained interviewer, using Computer
Assisted Personal Interview (CAPI) technology. The main objective of the Management Questionnaire is
to examine the characteristics of establishments and employers. Such characteristics include the size,
type of business and ownership of establishments, employers’ skill needs, recruitment practices and
training, trade union representation and fair treatment at work, along with payment systems and pay
determination. In particular, the MQ provides a breakdown of employment across establishments
according to nine major occupational groups using the 1-digit Standard Occupational Classification
(SOC) 1990 and twelve industrial groups using the Standard Industrial Classification (SIC) 1992 (see
Annex III for the SIC coding frame).
The MQ also enables us to analyse the distribution of establishments at the more disaggregate level of
Sector Skills Councils (SSC) sectors. The SSC sectors are not available using the main release of the
WERS 98 data. However, more detailed information concerning industrial classification is available using
restricted files held by the Department of Trade and Industry (the official depositor of the data). We
utilise this more detailed information to code establishment across 28 SSC sectors. This yields a final
working sample of 2,036 establishments from the WERS Surveys which may be used for statistical
analyses. The analysis for the SSC sectors is reported separately in Annex II.
The Management Questionnaire contains information on a variety of training measures for the largest
occupational group in each establishment. Three major types of training are identified in the data
including an induction programme for new employees, formal off-the-job training to experienced
employees in the largest occupational group, and formal training to enable employees to do jobs other
than their own. When considering the impact of employer-provided training on business performance, we
are interested in training investments that add to the stock of human capital and which thereby raise
worker productivity. In this regard, we focus on formal off-the-job training to experienced employees
J17473_Skills Report 20 8/3/07 08:28 Page 23
Training and Establishment Survival
____________________________________________________________________________________ 24
where off-the-job training is defined in the survey as “training away from the normal place of work, but
either on or off the premises.” The data records this information in the survey both as the proportion of
experienced employees having received training in the past 12 months and the average duration of such
training. We utilise this information to consider two distinct measures. The first measure is a simple
dichotomous measure of whether or not the establishment is a provider of formal off-the training to any
experienced employees in the largest occupational group within the establishment. The second measure
identifies the average number of days experienced employees spent in formal off-the-job training (i.e.
training intensity) in the preceding 12 months.
A cautionary note must be added concerning the distribution of the above training measures across
occupations. Whilst the EPQ provides a detailed breakdown of the workforce by 1-digit SOC, the survey
design of the MQ does not permit the identification of Managers and Administrators to be the largest
occupational group within the establishment. Accordingly, where the EPQ identifies this occupational
group as being the largest within the establishment, survey respondents of the Management
Questionnaire have been asked to discuss the second largest occupational group within the
establishment. For a very small sample of establishments, this procedure did not appear to be adopted
correctly at the time of interview. As such, 15 establishments in the 1998 cross-section data report
Managers and Administrators as being the largest occupational group. These observations are
erroneous and are accordingly excluded from the sample for statistical purposes.
3.1.2 Survey of Employees (SEQ)
Whilst the Survey of Managers provides an important insight into the incidence and degree of formal off-
the-job training undertaken by the largest occupational group within each establishment, additional
information can be gleaned from the WERS 98 Survey of Employees (SEQ). The SEQ was drawn from a
random sample of 25 employees at each establishment employing 25 or more persons. For
establishments with fewer than 25 employees, all employees were included in the scope of the survey.
The Survey of Employees contains information concerning employees’ views about themselves, their
jobs and their workplaces. Accordingly, the survey provides information on a wide range of issues
including the number of years of company experience (i.e. job tenure), employment status, union or non-
union representation at work, gender, age, educational attainment, occupation and salary. Importantly,
the Survey also provides information about training for which employees had been given time off from
J17473_Skills Report 20 8/3/07 08:28 Page 24

Training and Establishment Survival
____________________________________________________________________________________ 25
their normal duties to undertake it.
As in the Management Questionnaire, we consider two distinct measures of training. Once again, the
first measure is a dichotomous variable identifying whether or not the employee has received any
training from his/her employer. The second measure identifies the extent of such training as measured
by the average number of days spent training during the past 12 months. Although the training measures
here do not relate directly to formal-off-the-job training, employee responses are available across the full
1-digit spectrum of occupations. Hence, we are able to glimpse some insight into the extent of such
training for Managers and Administrators and other occupations alike.
An overview of the training measures derived from the Survey of Managers and the Survey of
Employees is outlined further in Chapter 4.
3.2 WERS 2004 Panel Survey
The Panel (longitudinal) component of WERS 2004 was selected from the WERS 98 achieved sample of
2,191 Cross-section interviews using a stratified random sample defined by establishment size at the
time of the 1998 interview. Of the 2,191 establishments interviewed in the WERS 98 Cross-section
Survey, 1,479 establishments were issued for the longitudinal component of WERS 2004. The remaining
712 establishments were also contacted to establish their continuing existence as an establishment with
10 or more employees. Hence, the longitudinal component of WERS 2004 provides an objective
measure of the commercial survival of all 2,191 establishments interviewed in the WERS 98 Cross-
section Survey.
Of the 2,191 establishments interviewed in WERS 98, 1,916 establishments were found to still be in
existence whilst 273 establishments were identified as having closed down. The ongoing existence of
establishments could not be determined in 12 cases. This results in a within sample establishment
closure rate of 12.6% between the 1998 and 2004 WERS cross-sections and equivalently, using survey
weights, 14.8% of establishments in the economy. More disaggregated analysis of establishment
survival (closure) is provided in Section 4.2 of Chapter 4.
Linking the establishment survival outcomes derived from the WERS 2004 Panel Survey to the WERS
98 Cross-section Survey data discussed in Section 3.1 enables a descriptive analysis of the link
between training and business performance. Preliminary investigation of this linked data reveals 117
J17473_Skills Report 20 8/3/07 08:28 Page 25

Training and Establishment Survival
____________________________________________________________________________________ 26
establishment observations from the WERS 98 cross-section data for which the occupational distribution
of employment and/or indicators of formal off-the-job training are either incomplete or missing. 13
Combined with the 12 establishments whose ongoing existence could not be traced in the Panel
component of the WERS 2004 data, this yields a final working sample of 2,062 establishments from the
WERS Surveys which may be used for statistical analyses. The next chapter provides a descriptive
overview of these 2,062 establishments across a range of socioeconomic variables including
employment status, occupational, industrial and sectoral classification, and the incidence of both formal
off-the-job training and commercial closure.
13 This includes the 15 establishments that erroneously report information for Mangers and Administrative occupations as the largest occupational group.
J17473_Skills Report 20 8/3/07 08:28 Page 26
Training and Establishment Survival
____________________________________________________________________________________ 27
Chapter 4 – Sample Characteristics
This chapter reports the results of the descriptive statistical analysis of the Workplace Employment
Relations Survey (WERS) data which are used to construct measures of employer training and business
performance. The descriptive analysis is disaggregated across a range of socioeconomic variables
including occupation, industry and establishment size. Some of this descriptive analysis will be included
in a more comprehensive review of the data in the next chapter. The statistical evidence that is
presented in tables utilises both weighted and unweighted data. Accordingly, inferences concerning the
relationship between training and establishment survival are in general drawn for the UK population of
establishments when using the survey weights.
4.1 Establishment Employment
This section examines the distribution of employment across establishments using the WERS 98 cross-
section data. Tables 4.1.1 to 4.1.4.1 utilise employment information drawn from the WERS 98 Survey of
Managers (MQ) to analyse the distribution of employment across establishments across three principal
themes: gender, industry and largest occupational group. Table 4.1.4.2 provides further information on
the distribution of employment by occupation drawing upon information contained in the WERS 98
Survey of Employees (SEQ).
4.1.1 Distribution of Employment by Gender and Employment Status
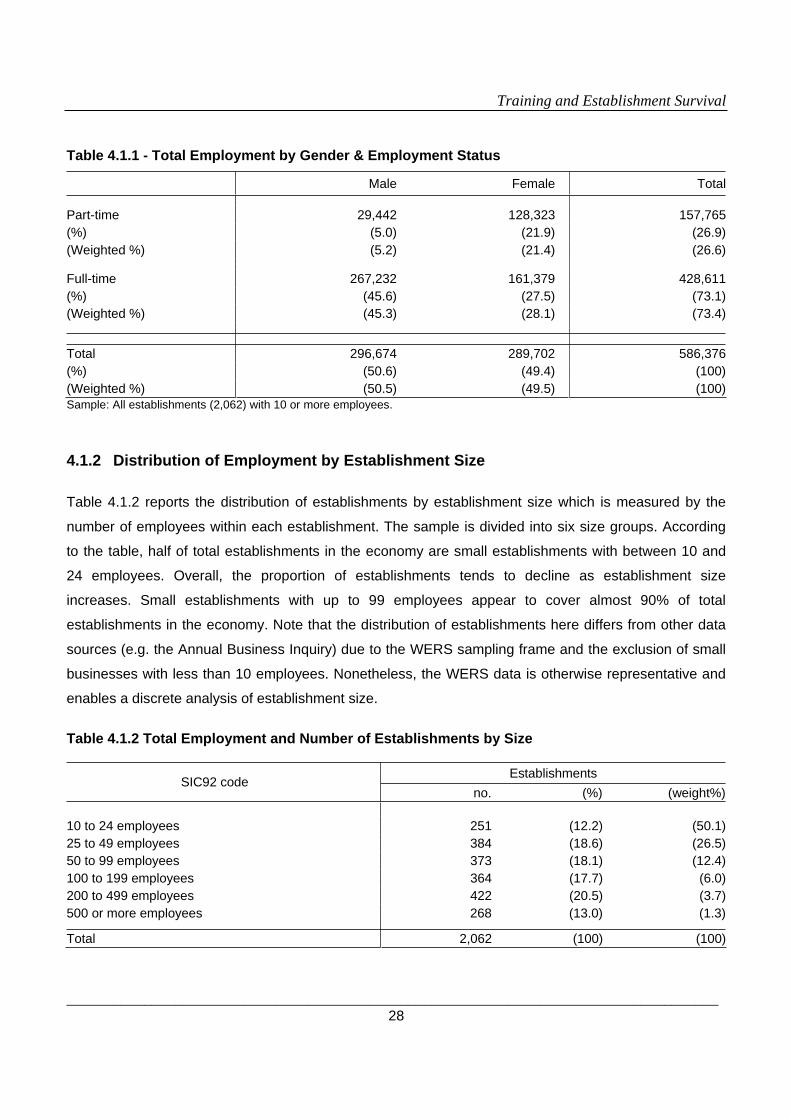
Table 4.1.1 reports the distribution of employment for WERS 98 by gender and employment status. The
table reveals that the proportion of male and female employees across establishments in the economy is
very similar (50.5% and 49.5% respectively). However, there is a notable difference in the distribution of
gender by employment status. Part-time employees account for approximately 27% of total employment
in the economy. More than 90% of male employees are employed on a full-time basis. Part-time male
employees account for 5% of total employment. Unlike male employees, only 55% of female employees
are employed on a full-time basis. This descriptive analysis is largely unaffected by the use of the WERS
sample.
J17473_Skills Report 20 8/3/07 08:28 Page 27
Training and Establishment Survival
____________________________________________________________________________________ 28
Table 4.1.1 - Total Employment by Gender & Employment Status
Male Female Total
Part-time 29,442 128,323 157,765 (%) (5.0) (21.9) (26.9) (Weighted %) (5.2) (21.4) (26.6)
Full-time 267,232 161,379 428,611 (%) (45.6) (27.5) (73.1) (Weighted %) (45.3) (28.1) (73.4)
Total 296,674 289,702 586,376 (%) (50.6) (49.4) (100) (Weighted %) (50.5) (49.5) (100)Sample: All establishments (2,062) with 10 or more employees.
4.1.2 Distribution of Employment by Establishment Size
Table 4.1.2 reports the distribution of establishments by establishment size which is measured by the
number of employees within each establishment. The sample is divided into six size groups. According
to the table, half of total establishments in the economy are small establishments with between 10 and
24 employees. Overall, the proportion of establishments tends to decline as establishment size
increases. Small establishments with up to 99 employees appear to cover almost 90% of total
establishments in the economy. Note that the distribution of establishments here differs from other data
sources (e.g. the Annual Business Inquiry) due to the WERS sampling frame and the exclusion of small
businesses with less than 10 employees. Nonetheless, the WERS data is otherwise representative and
enables a discrete analysis of establishment size.
Table 4.1.2 Total Employment and Number of Establishments by Size
Establishments SIC92 code
no. (%) (weight%)
10 to 24 employees 251 (12.2) (50.1)25 to 49 employees 384 (18.6) (26.5)50 to 99 employees 373 (18.1) (12.4)100 to 199 employees 364 (17.7) (6.0)200 to 499 employees 422 (20.5) (3.7)500 or more employees 268 (13.0) (1.3)
Total 2,062 (100) (100)
J17473_Skills Report 20 8/3/07 08:28 Page 28
Training and Establishment Survival
____________________________________________________________________________________ 29
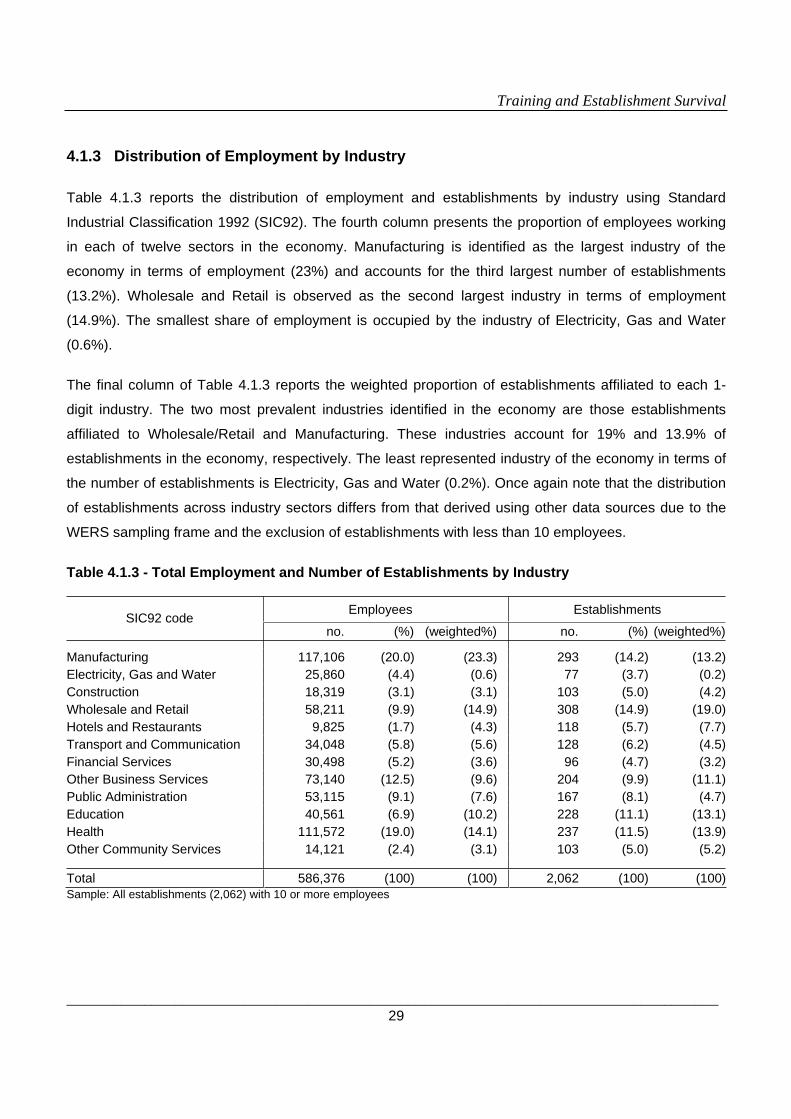
4.1.3 Distribution of Employment by Industry
Table 4.1.3 reports the distribution of employment and establishments by industry using Standard
Industrial Classification 1992 (SIC92). The fourth column presents the proportion of employees working
in each of twelve sectors in the economy. Manufacturing is identified as the largest industry of the
economy in terms of employment (23%) and accounts for the third largest number of establishments
(13.2%). Wholesale and Retail is observed as the second largest industry in terms of employment
(14.9%). The smallest share of employment is occupied by the industry of Electricity, Gas and Water
(0.6%).
The final column of Table 4.1.3 reports the weighted proportion of establishments affiliated to each 1-
digit industry. The two most prevalent industries identified in the economy are those establishments
affiliated to Wholesale/Retail and Manufacturing. These industries account for 19% and 13.9% of
establishments in the economy, respectively. The least represented industry of the economy in terms of
the number of establishments is Electricity, Gas and Water (0.2%). Once again note that the distribution
of establishments across industry sectors differs from that derived using other data sources due to the
WERS sampling frame and the exclusion of establishments with less than 10 employees.
Table 4.1.3 - Total Employment and Number of Establishments by Industry
Employees Establishments SIC92 code no. (%) (weighted%) no. (%) (weighted%)
Manufacturing 117,106 (20.0) (23.3) 293 (14.2) (13.2)Electricity, Gas and Water 25,860 (4.4) (0.6) 77 (3.7) (0.2)Construction 18,319 (3.1) (3.1) 103 (5.0) (4.2)Wholesale and Retail 58,211 (9.9) (14.9) 308 (14.9) (19.0)Hotels and Restaurants 9,825 (1.7) (4.3) 118 (5.7) (7.7)Transport and Communication 34,048 (5.8) (5.6) 128 (6.2) (4.5)Financial Services 30,498 (5.2) (3.6) 96 (4.7) (3.2)Other Business Services 73,140 (12.5) (9.6) 204 (9.9) (11.1)Public Administration 53,115 (9.1) (7.6) 167 (8.1) (4.7)Education 40,561 (6.9) (10.2) 228 (11.1) (13.1)Health 111,572 (19.0) (14.1) 237 (11.5) (13.9)Other Community Services 14,121 (2.4) (3.1) 103 (5.0) (5.2)
Total 586,376 (100) (100) 2,062 (100) (100)Sample: All establishments (2,062) with 10 or more employees
J17473_Skills Report 20 8/3/07 08:28 Page 29
Training and Establishment Survival
____________________________________________________________________________________ 30
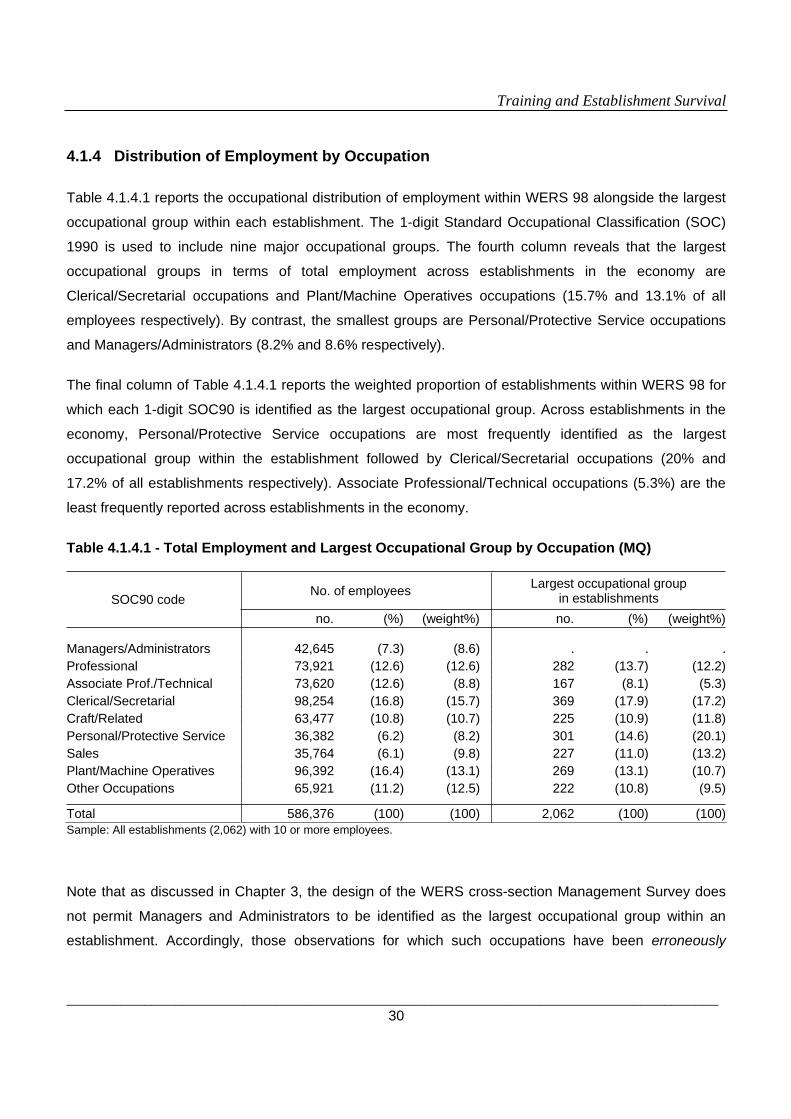
4.1.4 Distribution of Employment by Occupation
Table 4.1.4.1 reports the occupational distribution of employment within WERS 98 alongside the largest
occupational group within each establishment. The 1-digit Standard Occupational Classification (SOC)
1990 is used to include nine major occupational groups. The fourth column reveals that the largest
occupational groups in terms of total employment across establishments in the economy are
Clerical/Secretarial occupations and Plant/Machine Operatives occupations (15.7% and 13.1% of all
employees respectively). By contrast, the smallest groups are Personal/Protective Service occupations
and Managers/Administrators (8.2% and 8.6% respectively).
The final column of Table 4.1.4.1 reports the weighted proportion of establishments within WERS 98 for
which each 1-digit SOC90 is identified as the largest occupational group. Across establishments in the
economy, Personal/Protective Service occupations are most frequently identified as the largest
occupational group within the establishment followed by Clerical/Secretarial occupations (20% and
17.2% of all establishments respectively). Associate Professional/Technical occupations (5.3%) are the
least frequently reported across establishments in the economy.
Table 4.1.4.1 - Total Employment and Largest Occupational Group by Occupation (MQ)
No. of employees Largest occupational group in establishments SOC90 code
no. (%) (weight%) no. (%) (weight%)
Managers/Administrators 42,645 (7.3) (8.6) . . .Professional 73,921 (12.6) (12.6) 282 (13.7) (12.2)Associate Prof./Technical 73,620 (12.6) (8.8) 167 (8.1) (5.3)Clerical/Secretarial 98,254 (16.8) (15.7) 369 (17.9) (17.2)Craft/Related 63,477 (10.8) (10.7) 225 (10.9) (11.8)Personal/Protective Service 36,382 (6.2) (8.2) 301 (14.6) (20.1)Sales 35,764 (6.1) (9.8) 227 (11.0) (13.2)Plant/Machine Operatives 96,392 (16.4) (13.1) 269 (13.1) (10.7)Other Occupations 65,921 (11.2) (12.5) 222 (10.8) (9.5)
Total 586,376 (100) (100) 2,062 (100) (100)Sample: All establishments (2,062) with 10 or more employees.
Note that as discussed in Chapter 3, the design of the WERS cross-section Management Survey does
not permit Managers and Administrators to be identified as the largest occupational group within an
establishment. Accordingly, those observations for which such occupations have been erroneously
J17473_Skills Report 20 8/3/07 08:28 Page 30

Training and Establishment Survival
____________________________________________________________________________________ 31
recorded in the data as the largest occupational group have been excluded from the sample for
statistical purposes.
Table 4.1.4.2 reports the occupational distribution of employees using the WERS 98 Survey of
Employees (SEQ). Recall that this survey consists only of a random sample of employees from each
establishment. As such, it is not representative of the occupational distribution of employment across
establishments unless utilised with appropriate weights that reflect the probability of an employee being
selected for interview within a given establishment. This weighted analysis is provided in the final column
of Table 4.1.4.2 and is broadly in line with the weighted occupational distribution of employment reported
in the fourth column of Table 4.1.4.1.
Table 4.1.4.2 - Total Employment by Occupation (SEQ)
Employees SOC90 code
no. (%) (weighted%)
Managers/Administrators 2,962 (10.8) (8.6)Professional 4,667 (17.0) (13.0)Associate Professional/Technical 2,815 (10.3) (9.0)Clerical/Secretarial 5,639 (20.6) (15.9)Craft/Related 2,164 (7.9) (10.4)Personal/Protective Service 1,998 (7.3) (8.3)Sales 2,045 (7.5) (9.6)Plant/Machine Operatives 2,355 (8.6) (12.9)Other Occupations 2,767 (10.1) (12.4)
Total 27,412 (100) (100)Sample: All employees (27,412) within establishments with 10 or more employees in the Survey of Employees
J17473_Skills Report 20 8/3/07 08:28 Page 31

Training and Establishment Survival
____________________________________________________________________________________ 32
4.2 Establishment Closure
This section reports the distribution of establishment closure rates according to whether establishments
which existed in 1998 were still in existence or had subsequently closed down by the time of the WERS
2004 Survey. As discussed in Chapter 3, the within-sample (non-weighted) closure rate across those
establishments sampled in the WERS 98 data is 12.6% and the closure rate for all establishments in the
economy is 14.8%.
4.2.1 Establishment Closure and Establishment Status
Table 4.2.1 provides a simple summary of establishment closure rates when considering the formal
status of establishments. There is a distinct difference in establishment closure rates between the private
and public sector. Public sector establishments account for just under one third (31%) of establishments
in the sample and one quarter (25%) of the UK population of establishments. The closure rate for such
establishments is a little over 5% in both instances. This compares with a closure rate for private sector
establishments of between 16% (within sample) and 18% (UK population). Of course, public sector
establishments may not be exposed to the same commercial and competitive pressures faced by those
establishments operating in the private sector. Indeed, the pursuit of economic profit (and hence
commercial survival) may be less meaningful for many establishments operating outside of the private
sector. Accordingly, the descriptive analysis presented here indicates that the formal status of
establishments will need to be considered in any multivariate analysis of the data that is utilised to
explore further the relationship between employer training and establishment performance.
Table 4.2.1 - Establishment Closure by Formal Establishment Status
Establishments Closure
no. (%) (weighted%) (% establishments within sector) (weighted%)
Private sector 1,434 (69.5) (75.2) 15.9 17.9
Public sector 628 (30.5) (24.8) 5.1 5.5
Total 2,062 (100) (100) 12.6 14.8Sample: All establishments (2,062) with 10 or more employees
J17473_Skills Report 20 8/3/07 08:28 Page 32
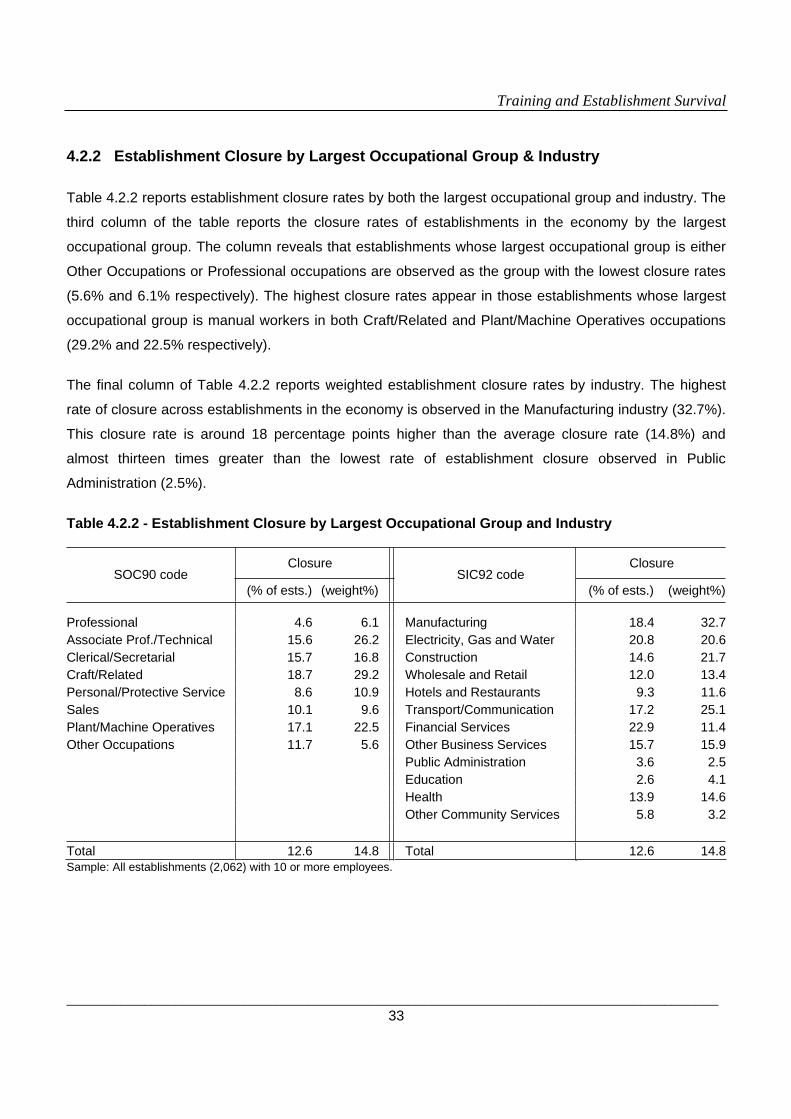
Training and Establishment Survival
____________________________________________________________________________________ 33
4.2.2 Establishment Closure by Largest Occupational Group & Industry
Table 4.2.2 reports establishment closure rates by both the largest occupational group and industry. The
third column of the table reports the closure rates of establishments in the economy by the largest
occupational group. The column reveals that establishments whose largest occupational group is either
Other Occupations or Professional occupations are observed as the group with the lowest closure rates
(5.6% and 6.1% respectively). The highest closure rates appear in those establishments whose largest
occupational group is manual workers in both Craft/Related and Plant/Machine Operatives occupations
(29.2% and 22.5% respectively).
The final column of Table 4.2.2 reports weighted establishment closure rates by industry. The highest
rate of closure across establishments in the economy is observed in the Manufacturing industry (32.7%).
This closure rate is around 18 percentage points higher than the average closure rate (14.8%) and
almost thirteen times greater than the lowest rate of establishment closure observed in Public
Administration (2.5%).
Table 4.2.2 - Establishment Closure by Largest Occupational Group and Industry
Closure Closure SOC90 code
(% of ests.) (weight%)SIC92 code
(% of ests.) (weight%)
Professional 4.6 6.1 Manufacturing 18.4 32.7 Associate Prof./Technical 15.6 26.2 Electricity, Gas and Water 20.8 20.6 Clerical/Secretarial 15.7 16.8 Construction 14.6 21.7 Craft/Related 18.7 29.2 Wholesale and Retail 12.0 13.4 Personal/Protective Service 8.6 10.9 Hotels and Restaurants 9.3 11.6 Sales 10.1 9.6 Transport/Communication 17.2 25.1 Plant/Machine Operatives 17.1 22.5 Financial Services 22.9 11.4 Other Occupations 11.7 5.6 Other Business Services 15.7 15.9 Public Administration 3.6 2.5 Education 2.6 4.1 Health 13.9 14.6 Other Community Services 5.8 3.2 Total 12.6 14.8 Total 12.6 14.8Sample: All establishments (2,062) with 10 or more employees.
J17473_Skills Report 20 8/3/07 08:28 Page 33

Training and Establishment Survival
____________________________________________________________________________________ 34
4.2.3 Establishment Closure by Average Educational Attainment of Employees
Table 4.2.3 reports establishment closure rates by the average level of educational attainment of
employees in each establishment. Employees sampled in the Survey of Employees were asked “What is the highest educational qualification you hold?” Responses to this question were coded to one of
six categories of educational attainment. We utilise this categorical information to construct the average
level of educational attainment in each establishment.14 The third column of Table 4.2.3 reveals the
average educational attainment of employees in approximately 65% of establishments to be GCSE
grades A to C or higher. 31% of establishments are identified with average educational attainment of
GCSE grades D to G or equivalent. A further 5% of establishments are identified with an average
educational attainment lower than the qualifications listed.
Table 4.2.3 - Establishment Closure by Average Educational Attainment of Employees
Establishments Closure
Educational Attainment no. (%) (weighted%) (% establishments within group) (weighted%)
None of the following 45 (2.7) (4.3) 15.6 6.7
CSE or equivalent/GCSE (grades d-g) 472 (27.9) (31.3) 17.0 22.3
O level or equivalent/ GCSE (grades a-c) 642 (37.9) (39.7) 10.9 12.3
A level or equivalent 427 (25.2) (19.4) 10.5 12.1
Degree or equivalent 106 (6.3) (4.9) 7.6 4.0
Postgraduate Degree or equivalent 2 (0.1) (0.5) 0.0 0.0
Total 1,694 (100) (100) 12.4 14.7
Sample: All establishments (1,694) with 10 or more employees.
The final column of Table 4.2.3 reports the closure rate for establishments by average educational
attainment of employees. Excluding the small number of establishments for which none of the listed
qualifications are identified, higher rates of establishment closure are associated with lower average
levels of educational attainment. Notably, the closure rate for those establishments with average
educational attainment of employees’ equivalent to GCSE grades D to G is ten percentage points higher
14 Employee responses are weighted to reflect the probability of selection for interview in the Survey of Employees.
J17473_Skills Report 20 8/3/07 08:28 Page 34
Training and Establishment Survival
____________________________________________________________________________________ 35
than for establishments with an average educational attainment equivalent to GCSE grades A to C. This
suggests that human capital accumulation may have an important impact on the commercial survival of
an establishment. Furthermore, this impact on establishment survival may be independent of
establishments’ investments in training. Of course, this impact may be correlated with other factors such
as industry affiliation and establishment size. Accordingly, we return to this important feature of the data
in Chapter 5 where we consider the impact of employees’ educational attainment in a multivariate
analysis of the impact of training on establishment survival.
4.3 Employer Training
This section reports the distribution of training across establishments using information drawn from
WERS 98. As discussed in Chapter 3, we consider four different measures of training from the data. Two
measures are drawn from the Survey of Mangers (MQ). The remaining two measures are derived from
the Survey of Employees (SEQ).
The Survey of Managers reports information concerning both the incidence and intensity of formal off-
the-job training. Off-the-job training is defined as training away from the normal place of work, but either
on or off the premises. The incidence of off-the-job training is identified in the survey from banded
responses to the following question: “What proportion of experienced [employees in the largest occupational group] have had formal off-the-job training over the past 12 months?” We utilise
responses to this question to derive a simple dichotomous variable that takes the value 1 (one) if the
establishment is observed to provide any formal off-the training, and 0 (zero) in the absence of such
training. The intensity of formal off-the-job training is identified from responses concerning the average
time experienced employees in the largest occupational group spent in formal off-the-job training.
Managers were asked to provide responses to the following question: “On average, about how much time did these experienced [employees in the largest occupational group] spend in formal off-the-job training sessions over the past 12 months?” Responses from this question are banded in
values ranging from “no time” spent training to “ten days or more”. For the purposes of this report, we
utilise this information to construct a dichotomous variable that distinguishes between those
J17473_Skills Report 20 8/3/07 08:28 Page 35
Training and Establishment Survival
____________________________________________________________________________________ 36
establishments that offer 2 or more days of formal off-the-job training and those that provide some, but
less than 2, days training.15
The Survey of Employees also reports information concerning both the incidence and intensity of training.
However, this information is not constrained to formal off-the-job training and as such cannot be directly
compared to those training measures determined from the Survey of Managers. Although these
additional training measures do not relate directly to formal-off-the-job training, 16 the employees
interviewed in the survey are randomly drawn across the full 1-digit spectrum of occupations. Hence,
one advantage of using information derived from the Survey of Employees is that the data permits a
partial insight into the incidence and intensity of training for Managers and Administrators which are
otherwise excluded from the Survey of Managers.
Once again, we derive two simple dichotomous variables to identify the incidence and intensity of
training. Both of these variables are derived from banded responses to the following question: “During
the last 12 months, how much training have you had, either paid for or organised by your employer?” The incidence of training is defined as a dichotomous variable that takes the value 1 (one)
where an establishment is observed to provide training for employees and 0 (zero) where it does not.
The intensity of training is again constructed as a dichotomous variable that identifies between those
establishments that have provided 2 or more days of training during the past 12 months and those
establishments which have provided some but less than 2 days of training.
4.3.1 Training, Establishment Status and Industry (MQ)
Evidence on the incidence of training taken from the Survey of Managers (MQ) indicates that 76% of
establishments in the economy provide formal off-the-job training for employees in the largest
occupational group.17 Almost half (49%) of all establishments in the economy provide 2 or more days of
formal training, which are equivalent to just over 65% of those training establishments. Significant
differences are discernable when evaluating the incidence of off-the-job training by establishment status.
Of those establishments identified as being in the public sector, 95% provide formal off-the job-training
15 This division gave sufficient observations in each category to maintain precision in the estimates; experimentation with other bandings suggested that there was no value attempting a more finely-tuned analysis. 16 Training is defined as training either on or off the premises but away from the normal place of work.17 Within the sample, 1,793 establishments (unweighted 87%) provide formal off-the-job training for employees in the largest occupational group.
J17473_Skills Report 20 8/3/07 08:28 Page 36
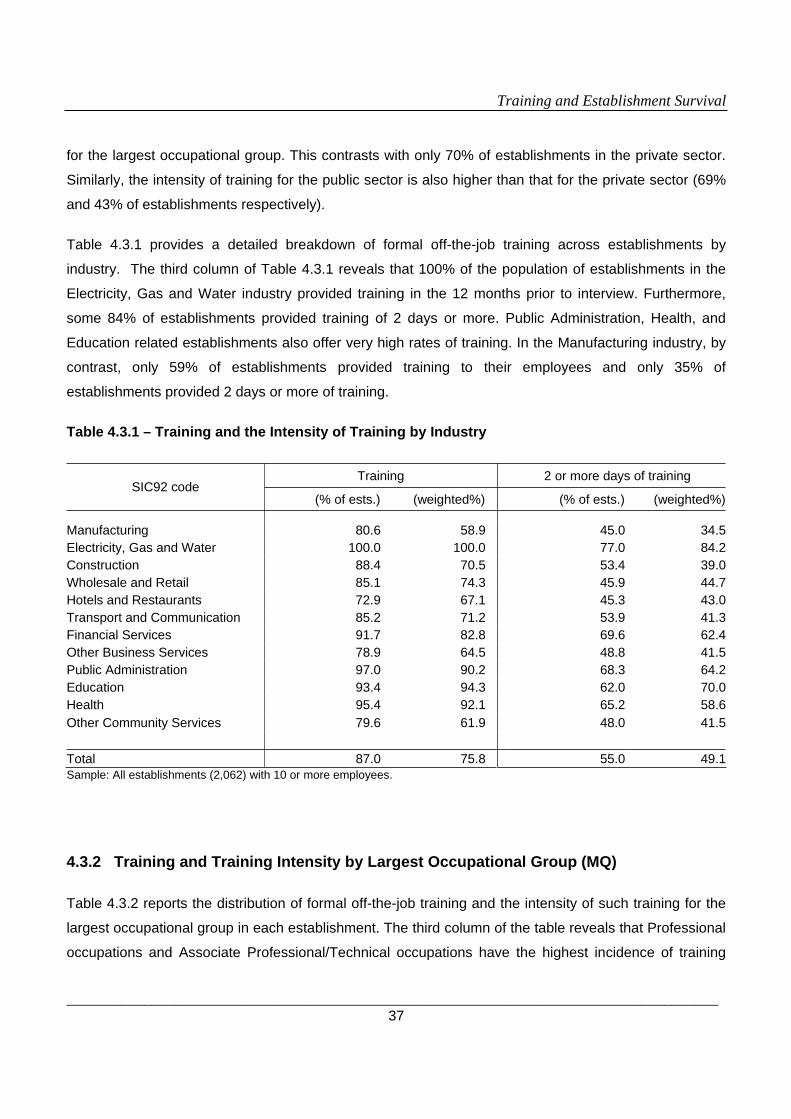
Training and Establishment Survival
____________________________________________________________________________________ 37
for the largest occupational group. This contrasts with only 70% of establishments in the private sector.
Similarly, the intensity of training for the public sector is also higher than that for the private sector (69%
and 43% of establishments respectively).
Table 4.3.1 provides a detailed breakdown of formal off-the-job training across establishments by
industry. The third column of Table 4.3.1 reveals that 100% of the population of establishments in the
Electricity, Gas and Water industry provided training in the 12 months prior to interview. Furthermore,
some 84% of establishments provided training of 2 days or more. Public Administration, Health, and
Education related establishments also offer very high rates of training. In the Manufacturing industry, by
contrast, only 59% of establishments provided training to their employees and only 35% of
establishments provided 2 days or more of training.
Table 4.3.1 – Training and the Intensity of Training by Industry
Training 2 or more days of training SIC92 code
(% of ests.) (weighted%) (% of ests.) (weighted%)
Manufacturing 80.6 58.9 45.0 34.5 Electricity, Gas and Water 100.0 100.0 77.0 84.2 Construction 88.4 70.5 53.4 39.0 Wholesale and Retail 85.1 74.3 45.9 44.7 Hotels and Restaurants 72.9 67.1 45.3 43.0 Transport and Communication 85.2 71.2 53.9 41.3 Financial Services 91.7 82.8 69.6 62.4 Other Business Services 78.9 64.5 48.8 41.5 Public Administration 97.0 90.2 68.3 64.2 Education 93.4 94.3 62.0 70.0 Health 95.4 92.1 65.2 58.6 Other Community Services 79.6 61.9 48.0 41.5 Total 87.0 75.8 55.0 49.1 Sample: All establishments (2,062) with 10 or more employees.
4.3.2 Training and Training Intensity by Largest Occupational Group (MQ)
Table 4.3.2 reports the distribution of formal off-the-job training and the intensity of such training for the
largest occupational group in each establishment. The third column of the table reveals that Professional
occupations and Associate Professional/Technical occupations have the highest incidence of training
J17473_Skills Report 20 8/3/07 08:28 Page 37

Training and Establishment Survival
____________________________________________________________________________________ 38
across the UK population of establishments for which those occupations are reported as the largest
occupational group (97% and 96.8% of establishments with these as the largest occupational group
respectively). By contrast, the lowest incidence of training is reported in all three manual occupational
groups: Plant/Machine Operatives occupations (55%), Craft/Related occupations (64.4%), and Other
Occupations (72%).
The results for training intensity are broadly in line with those reported for the incidence of training. The
final column of Table 4.3.2 reveals that in terms of the average number of days of training, Professional
and Associate Professional/Technical occupations spend the most time undertaking formal off-the-job
training whilst manual occupations (Other Occupations, Plant/Machine Operatives and Craft/Related
occupations) spend the least time engaged in training.
Table 4.3.2 – Training and Training Intensity by Largest Occupational Group
Training 2 or more days of training SOC90 code
(% of ests.) (weighted%) (% of ests.) (weighted%)
Professional 97.5 97.0 71.7 78.0 Associate Prof./Technical 97.6 96.8 76.4 72.8 Clerical/Secretarial 91.3 71.4 57.8 43.0 Craft/Related 82.7 64.4 57.4 38.1 Personal/Protective Service 83.1 78.8 55.4 54.2 Sales 88.6 78.8 48.4 43.4 Plant/Machine Operatives 79.6 55.0 39.7 31.0 Other Occupations 75.2 71.9 35.9 40.7 Total 87.0 75.8 55.0 49.1 Sample: All establishments (2,062) with 10 or more employees.
Overall, it is notable that, on average, it is those establishments for which the largest occupational group
is more highly skilled that provided the most training. Establishments with non-manual occupations as
the largest occupational group are more frequently observed to train their workforce than those with
manual occupations. These establishments also provided more time for their employees to undertake
such training. This relationship between training and the skill level of occupations is consistent with many
previous studies of the determinants of training.
J17473_Skills Report 20 8/3/07 08:28 Page 38

Training and Establishment Survival
____________________________________________________________________________________ 39
4.3.3 Training and Training Intensity by Occupation (SEQ)
Table 4.3.3 reports the distribution of training and the intensity of training as derived from the WERS 98
Survey of Employees (SEQ). These alternative measures of training are useful in that they provide a
glimpse of both the incidence and intensity of training for Managers and Administrators which are
otherwise excluded from the WERS 98 Survey of Managers. Nevertheless, the two training measures
derived here are not directly comparable with those derived using the Survey of Managers as reported in
the previous sub-section.
An initial glance of Table 4.3.3 reveals both the incidence and intensity of training across occupations for
the sample of employees to be much lower than for those training measures discussed in the previous
sub-section. That aside, the general pattern of training is broadly consistent across the two surveys.
Employees in non-manual occupations are more frequently trained than those in manual occupations.
The intensity of training is also greater in this regard. This pattern is consistent both within sample and
across the UK population of establishments.
Table 4.3.3 – Training and Training Intensity by Occupation
Training 2 or more days of training SOC90 code
(% of employees) (weighted%) (% of employees) (weighted%)
Managers/Administrators 75.2 73.4 57.1 56.1 Professional 79.1 76.3 55.9 53.8 Associate Prof./Technical 73.9 72.8 51.4 50.6 Clerical/Secretarial 64.9 62.6 38.9 36.6 Craft/Related 49.6 43.5 33.0 28.2 Personal/Protective Service 73.5 71.7 50.2 49.0 Sales 66.8 66.1 31.3 30.1 Plant/Machine Operatives 37.8 38.9 19.5 21.0 Other Occupations 40.8 41.7 18.7 18.7 Total 64.1 59.7 41.1 37.1 Sample: All employees (27,412) within establishments with 10 or more employees.
Whilst there are marked differences in the level of training between the two sets of measures outlined
here and in the previous sub-section, one should not be too concerned. As stated previously, the two
series are not directly comparable. Firstly, the two sets of measures utilise different definitions of training
across the two surveys. Secondly, the training measures derived from the Survey of Managers relate to
J17473_Skills Report 20 8/3/07 08:28 Page 39

Training and Establishment Survival
____________________________________________________________________________________ 40
all employees within the largest occupational group of each establishment. By contrast, the training
measures derived from the Survey of Employees relate only to a weighted random sample of employees
drawn from each establishment. Accordingly, any meaningful comparison using the training measures
derived using the Survey of Employees must consider the probability of selection for employees and
hence the sample weights that accompany this particular survey.18
4.4 Summary of Chapter 4
This chapter has had the limited objective of introducing the data on which the study is to be based, and
presenting some descriptive tables as a preliminary exercise before embarking on the substantive
analyses to follow. The two WERS surveys from 1998 and 2004 have been described in sufficient detail
to give a good idea of what is going to be possible with the subsequent analyses. Concentrating on the
1998 survey we have tabulated the distribution of establishments and of employees across industries
and occupations, and examined the commercial survival/closure rates of establishments, finding that the
closure rate varied considerably across these groups.
We then related how training is measured in the management and employee parts of the survey. The
management questionnaire gives information about off-the-job training of the workers in the largest
occupational group working in the establishment. It is thus not perfect as a measure of the training input
in the establishment, since it does not cover the training of other minority groups in the establishment;
nevertheless it is a good proxy as to the training investment of the establishment. The employee
questionnaire applies to all groups of workers in the establishment, but the training information applies
only to each individual questioned, and hence the level of training in the establishment has to be inferred
from those individuals responding to the survey. The chapter has presented the raw distribution of
training across industries and occupations, using each of these two sources of information (managers
and employees). It also examined the intensity of training measured by the number of days training
undertaken in the previous year. The extent of training was found, among other things, to be related
positively to the skill level of occupational groups, and to vary considerably across industries.
18 Responses drawn from the Survey of Employees are weighted by employment to reflect the probability of selection for each establishment. By contrast, responses drawn from the Survey of Managers are weighted using establishment weights.
J17473_Skills Report 20 8/3/07 08:28 Page 40
Training and Establishment Survival
____________________________________________________________________________________ 41
Chapter 5 - Training and Establishment Closure
In the previous chapter, we reported the results of the descriptive analysis of the WERS data. We
examined the distribution of employees and establishments by occupation and industry. We also
investigated the distribution of establishment closure and that of training by occupation and industry. In
the current chapter, we explore the relationship between training and establishment closure in greater
detail. First, we report the results of a bivariate analysis of establishment closure according to both the
incidence and intensity of training derived from both the Survey of Managers (MQ) and the Survey of
Employees (SEQ). We also examine the links between training and closure within occupations and
industries to investigate whether observed links are due to differences between those industries and
occupations. Second, we present multi-variate probit regression analyses of the impact of training on
establishment closure while controlling for other factors deemed important in determining the commercial
success (failure) of establishments. Controlling for other factors enables us to test for the robustness of
the impacts of training on closure. Finally, in order to investigate whether there are differential effects of
training on closure, we report the results of multi-variate probit regression analyses for each
occupational and industrial sub-group. The chapter concludes with a summary of the empirical findings.
5.1 Training and Establishment Closure
This section reports the results of a comparison of establishment closure rates according to whether
establishments provided training and, if so, how intensively such training was provided. The discussion
here relates to the training measures derived from both the Survey of Managers (MQ) and the Survey of
Employees (SEQ) derived from WERS 98, and establishment closure rates for the period 1998-2004
derived from the Panel Survey of WERS 2004.
5.1.1 Training and Establishment Closure (MQ)
Table 5.1.1.1 reports establishment closure rates according to both the incidence and intensity of formal
off-the-job training derived from the MQ. The table reveals that some 27% of the UK population of
establishments which did not provide training for the largest occupational group closed down compared
with some 11% of establishments which did provide training. The difference in these proportions is
J17473_Skills Report 20 8/3/07 08:28 Page 41

Training and Establishment Survival
____________________________________________________________________________________ 42
statistically significant at the 1% level (p=0.0). Interestingly, the closure rates for training establishments
are almost identical regardless of the duration of such training.19
Table 5.1.1.1 – Training and Establishment Closure (MQ)
No Training Less than 2 days of training
2 or more days of training Total
Not Closed 209^ 574 992 1,775(%) (77.7) (89.0) (88.9) (87.4)(weighted %) (73.1) (89.9) (88.5) (85.2)
Closed 60^ 71 124 255(%) (22.3) (11.0) (11.1) (12.6)(weighted %) (26.9) (10.1) (11.5) (14.9)
Total 269 645 1,116 2,030(%) (100) (100) (100) (100)Sample: All establishments (2,030) with 10 or more employees.
Additional insight into the relationship between training and establishment closure is provided in Table
5.1.1.2 which considers establishments and establishment closure by the proportion of the largest
occupational group receiving training. The table reveals that approximately one quarter (24%) of the UK
population of establishments did not provide formal off-the-job training to employees in the largest
occupational group. By contrast, almost one fifth (18%) of establishments provide training to all
employees (100%) in this group.
Consistent with Table 5.1.1.1, those establishments which provide no training to employees in the
largest occupational group are identified in the data as those establishments with the highest rates of
commercial closure: 27% of non-training establishments close down over the period 1998 to 2004. This
compares with closure rates of 17% for establishments providing training to between 1 and 99% of
employees in the largest occupational group, and 6% for those establishments for which complete
coverage (100% of employees in receipt of training) is observed. The difference in these proportions is
statistically significant at the 1% level (p=0.0).
19 ^ means statistically significant at 1%; it indicates that there is only a 1% chance that, through random variation, the closure rate for the no-training establishments in the sample would be found to be so much higher than for the training establishments if there were really no differences between the training and non-training establishments in the general population; hence it is reasonable to conclude that there is a difference, with only a small chance of error.
J17473_Skills Report 20 8/3/07 08:28 Page 42
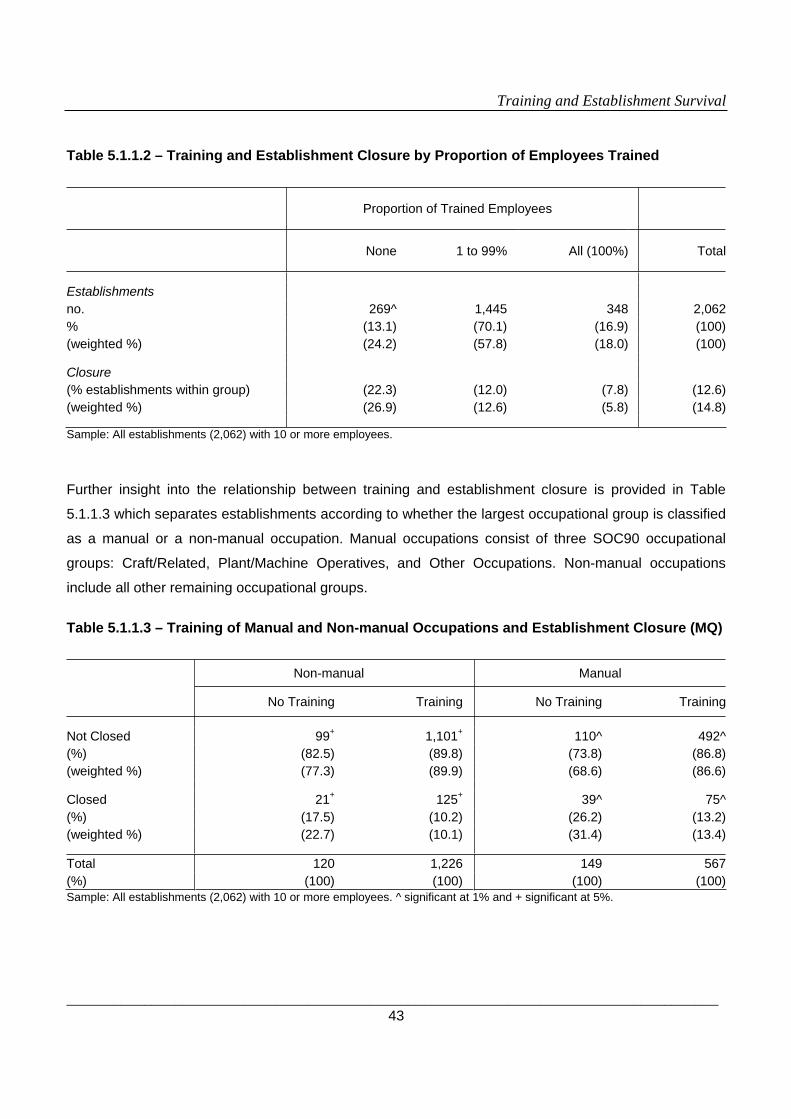
Training and Establishment Survival
____________________________________________________________________________________ 43
Table 5.1.1.2 – Training and Establishment Closure by Proportion of Employees Trained
Proportion of Trained Employees
None 1 to 99% All (100%) Total
Establishments no. 269^ 1,445 348 2,062% (13.1) (70.1) (16.9) (100)(weighted %) (24.2) (57.8) (18.0) (100)
Closure (% establishments within group) (22.3) (12.0) (7.8) (12.6)(weighted %) (26.9) (12.6) (5.8) (14.8)
Sample: All establishments (2,062) with 10 or more employees.
Further insight into the relationship between training and establishment closure is provided in Table
5.1.1.3 which separates establishments according to whether the largest occupational group is classified
as a manual or a non-manual occupation. Manual occupations consist of three SOC90 occupational
groups: Craft/Related, Plant/Machine Operatives, and Other Occupations. Non-manual occupations
include all other remaining occupational groups.
Table 5.1.1.3 – Training of Manual and Non-manual Occupations and Establishment Closure (MQ)
Non-manual Manual
No Training Training No Training Training
Not Closed 99+ 1,101+ 110^ 492^(%) (82.5) (89.8) (73.8) (86.8) (weighted %) (77.3) (89.9) (68.6) (86.6)
Closed 21+ 125+ 39^ 75^(%) (17.5) (10.2) (26.2) (13.2) (weighted %) (22.7) (10.1) (31.4) (13.4)
Total 120 1,226 149 567(%) (100) (100) (100) (100)Sample: All establishments (2,062) with 10 or more employees. ^ significant at 1% and + significant at 5%.
J17473_Skills Report 20 8/3/07 08:28 Page 43
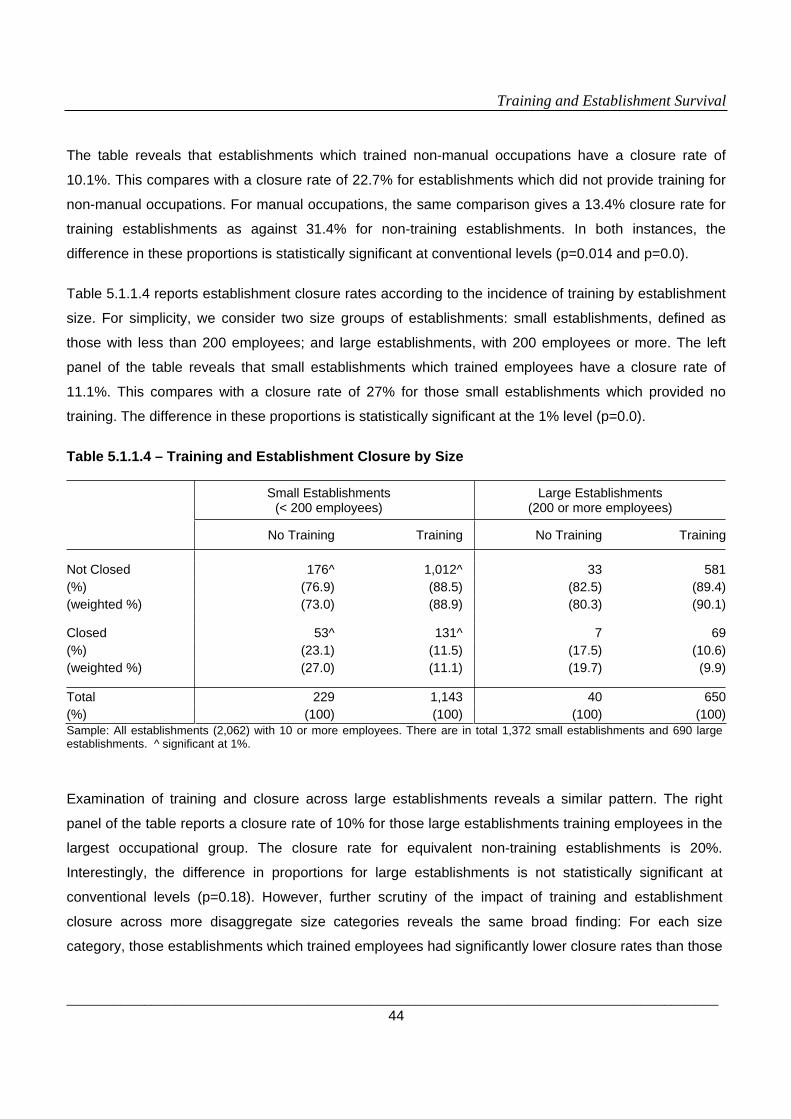
Training and Establishment Survival
____________________________________________________________________________________ 44
The table reveals that establishments which trained non-manual occupations have a closure rate of
10.1%. This compares with a closure rate of 22.7% for establishments which did not provide training for
non-manual occupations. For manual occupations, the same comparison gives a 13.4% closure rate for
training establishments as against 31.4% for non-training establishments. In both instances, the
difference in these proportions is statistically significant at conventional levels (p=0.014 and p=0.0).
Table 5.1.1.4 reports establishment closure rates according to the incidence of training by establishment
size. For simplicity, we consider two size groups of establishments: small establishments, defined as
those with less than 200 employees; and large establishments, with 200 employees or more. The left
panel of the table reveals that small establishments which trained employees have a closure rate of
11.1%. This compares with a closure rate of 27% for those small establishments which provided no
training. The difference in these proportions is statistically significant at the 1% level (p=0.0).
Table 5.1.1.4 – Training and Establishment Closure by Size
Small Establishments (< 200 employees)
Large Establishments (200 or more employees)
No Training Training No Training Training
Not Closed 176^ 1,012^ 33 581(%) (76.9) (88.5) (82.5) (89.4) (weighted %) (73.0) (88.9) (80.3) (90.1)
Closed 53^ 131^ 7 69(%) (23.1) (11.5) (17.5) (10.6) (weighted %) (27.0) (11.1) (19.7) (9.9)
Total 229 1,143 40 650(%) (100) (100) (100) (100)Sample: All establishments (2,062) with 10 or more employees. There are in total 1,372 small establishments and 690 large establishments. ^ significant at 1%.
Examination of training and closure across large establishments reveals a similar pattern. The right
panel of the table reports a closure rate of 10% for those large establishments training employees in the
largest occupational group. The closure rate for equivalent non-training establishments is 20%.
Interestingly, the difference in proportions for large establishments is not statistically significant at
conventional levels (p=0.18). However, further scrutiny of the impact of training and establishment
closure across more disaggregate size categories reveals the same broad finding: For each size
category, those establishments which trained employees had significantly lower closure rates than those
J17473_Skills Report 20 8/3/07 08:28 Page 44

Training and Establishment Survival
____________________________________________________________________________________ 45
which did not provide training. The difference in these proportions was statistically significant at
conventional levels for all size categories up to and including 100-199 employees. Hence, the
disaggregate results are in line with the findings reported above.
5.1.2 Training and Establishment Closure (SEQ)
Table 5.1.2 reports establishment closure rates according to both the incidence and intensity of training
derived from the Survey of Employees (SEQ). The table reveals that some 39% of establishments which
did not provide training to employees in the economy closed down compared with an average 14.4% of
establishments which provided training. The closure rate for training establishments with less than 2
days of training (24%) is 10 percentage points greater than the closure rate for those with 2 or more
days of training (13.8%). The difference in these proportions is statistically significant at the 1% level
(p=0.0).
Table 5.1.2 – Training and Establishment Closure (SEQ)
No Training Less than 2 days of training
2 or more days of training Total
Not Closed 12^ 36^ 1,362^ 1,410(%) (63.2) (76.6) (88.4) (87.7) (weighted %) (61.2) (76.0) (86.2) (84.8)
Closed 7^ 11^ 179^ 197(%) (36.8) (23.4) (11.6) (12.3) (weighted %) (38.8) (24.0) (13.8) (15.2)
Total 19 47 1,541 1,607(%) (100) (100) (100) (100) Sample: All establishments (1,607) with 10 or more employees and at least 5 employees responding to the training question of the SEQ. ^ significant at 1%.
So far, an association between training and closure has been shown using both the managers’ and the
employees’ responses to WERS. In both analyses, non-training establishments fared substantially worse
than training establishments. Even though the definitions are not identical and the sources of information
quite distinct, the two analyses tell the same story. They give the first suggestive evidence, that the
minority of establishments which do not train their workers could improve their commercial survival
J17473_Skills Report 20 8/3/07 08:28 Page 45
Training and Establishment Survival
____________________________________________________________________________________ 46
chances by becoming trainers. But before this conclusion can be accepted, it is necessary to see how
far the findings are robust.
In the case of the employees’ responses (the SEQ), it was also found that of those establishments
providing training, establishments which trained employees for an average of two or more days per year
were more likely to survive than those which trained an average of less than two days. Nonetheless, it
should be noted that proportions of non-training and low-training establishments, as defined in the
Survey of Employees, are low. In contrast, since the management-derived information on training
applies only to the largest occupational group, there are several establishments in the Survey of
Managers (13% of the sample) for which no training is provided. Further analysis found that, among
those establishments that provided at least some training for the largest occupational group, the closure
rate was not associated with the intensity (duration) of training. We consider the possible implications of
this finding in Chapter 7.
5.2 Training and Closure by Occupation
In the previous section, the link between training and establishment closure was examined across
occupations. However, it is possible that the observed links are due to differences between occupations,
or indeed other variables. Accordingly, the remainder of the section now proceeds to consider the link
between training and closure within occupations and to control for other important establishment
characteristics. Section 5.3 continues this analysis for industries.
This section reports establishment closure rates according to the incidence of training for two sets of
occupational groups of employees. The first set is for the largest occupational group of employees in the
establishment derived from the Survey of Managers (MQ). The other is for occupational groups of
employees derived from the Survey of Employees (SEQ).
5.2.1 Training and Closure by Largest Occupational Group in Establishment (MQ)
This sub-section reports establishment closure rates according to the incidence of formal off-the-job
training for the largest occupational groups derived from the MQ. For statistical reliability, the analysis is
restricted to those occupational groups for which at least 10 establishments are identified as not
J17473_Skills Report 20 8/3/07 08:28 Page 46
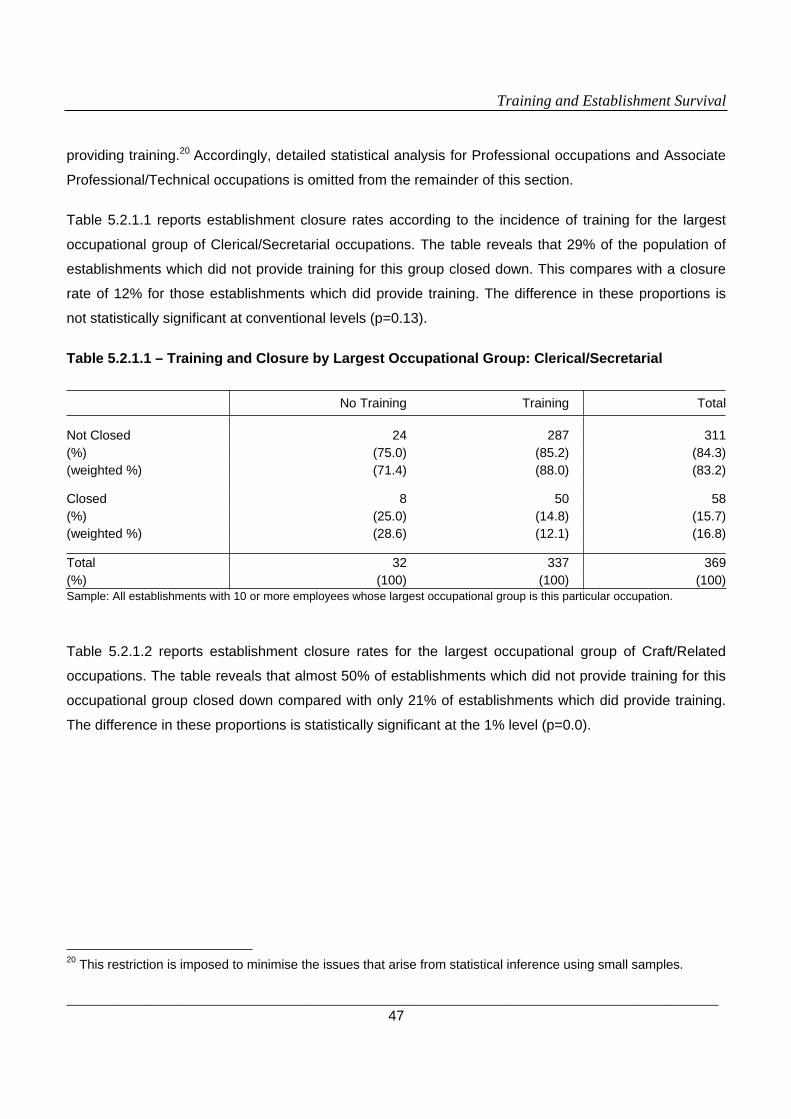
Training and Establishment Survival
____________________________________________________________________________________ 47
providing training.20 Accordingly, detailed statistical analysis for Professional occupations and Associate
Professional/Technical occupations is omitted from the remainder of this section.
Table 5.2.1.1 reports establishment closure rates according to the incidence of training for the largest
occupational group of Clerical/Secretarial occupations. The table reveals that 29% of the population of
establishments which did not provide training for this group closed down. This compares with a closure
rate of 12% for those establishments which did provide training. The difference in these proportions is
not statistically significant at conventional levels (p=0.13).
Table 5.2.1.1 – Training and Closure by Largest Occupational Group: Clerical/Secretarial
No Training Training Total
Not Closed 24 287 311(%) (75.0) (85.2) (84.3)(weighted %) (71.4) (88.0) (83.2)
Closed 8 50 58(%) (25.0) (14.8) (15.7)(weighted %) (28.6) (12.1) (16.8)
Total 32 337 369(%) (100) (100) (100)Sample: All establishments with 10 or more employees whose largest occupational group is this particular occupation.
Table 5.2.1.2 reports establishment closure rates for the largest occupational group of Craft/Related
occupations. The table reveals that almost 50% of establishments which did not provide training for this
occupational group closed down compared with only 21% of establishments which did provide training.
The difference in these proportions is statistically significant at the 1% level (p=0.0).
20 This restriction is imposed to minimise the issues that arise from statistical inference using small samples.
J17473_Skills Report 20 8/3/07 08:28 Page 47
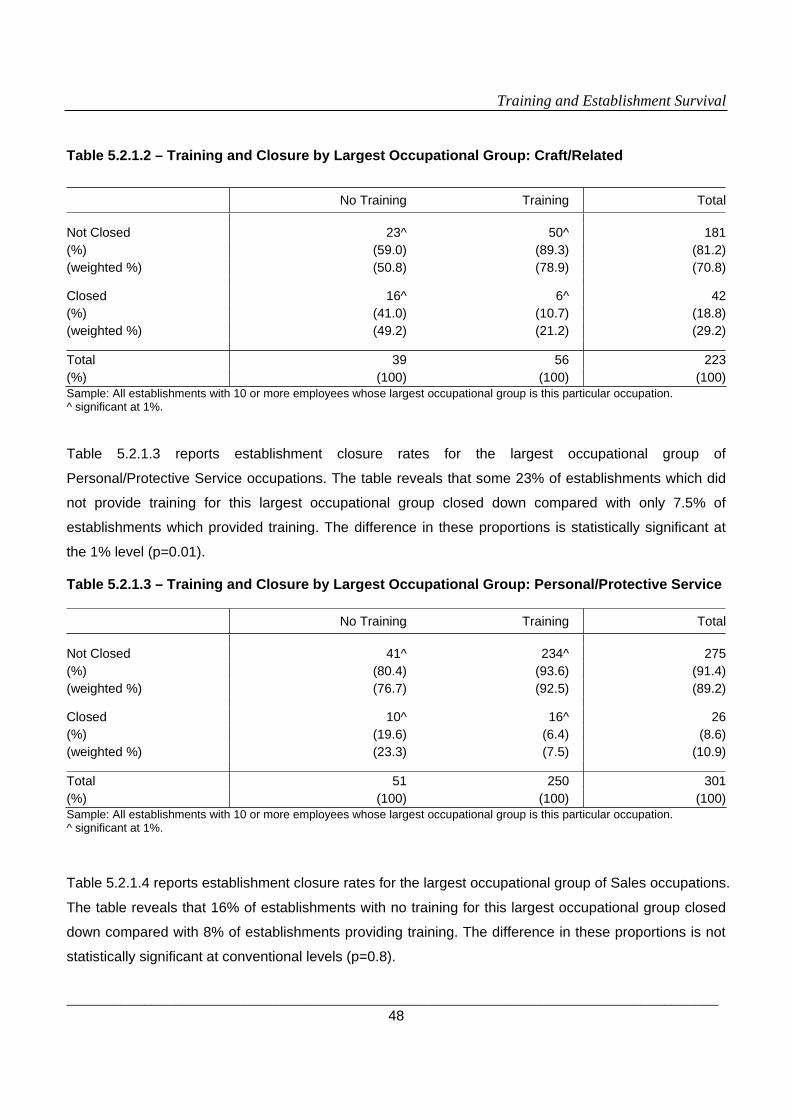
Training and Establishment Survival
____________________________________________________________________________________ 48
Table 5.2.1.2 – Training and Closure by Largest Occupational Group: Craft/Related
No Training Training Total
Not Closed 23^ 50^ 181(%) (59.0) (89.3) (81.2)(weighted %) (50.8) (78.9) (70.8)
Closed 16^ 6^ 42(%) (41.0) (10.7) (18.8)(weighted %) (49.2) (21.2) (29.2)
Total 39 56 223(%) (100) (100) (100)Sample: All establishments with 10 or more employees whose largest occupational group is this particular occupation. ^ significant at 1%.
Table 5.2.1.3 reports establishment closure rates for the largest occupational group of
Personal/Protective Service occupations. The table reveals that some 23% of establishments which did
not provide training for this largest occupational group closed down compared with only 7.5% of
establishments which provided training. The difference in these proportions is statistically significant at
the 1% level (p=0.01).
Table 5.2.1.3 – Training and Closure by Largest Occupational Group: Personal/Protective Service
No Training Training Total
Not Closed 41^ 234^ 275(%) (80.4) (93.6) (91.4)(weighted %) (76.7) (92.5) (89.2)
Closed 10^ 16^ 26(%) (19.6) (6.4) (8.6)(weighted %) (23.3) (7.5) (10.9)
Total 51 250 301(%) (100) (100) (100)Sample: All establishments with 10 or more employees whose largest occupational group is this particular occupation. ^ significant at 1%.
Table 5.2.1.4 reports establishment closure rates for the largest occupational group of Sales occupations.
The table reveals that 16% of establishments with no training for this largest occupational group closed
down compared with 8% of establishments providing training. The difference in these proportions is not
statistically significant at conventional levels (p=0.8).
J17473_Skills Report 20 8/3/07 08:28 Page 48

Training and Establishment Survival
____________________________________________________________________________________ 49
Table 5.2.1.4 – Training and Closure by Largest Occupational Group: Sales
No Training Training Total
Not Closed 23 181 204(%) (88.5) (90.1) (89.9)(weighted %) (84.2) (92.1) (90.4)
Closed 3 20 23(%) (11.5) (10.0) (10.1)(weighted %) (15.8) (7.9) (9.6)
Total 26 201 227(%) (100) (100) (100)Sample: All establishments with 10 or more employees whose largest occupational group is this particular occupation.
Table 5.2.1.5 reports establishment closure rates for the largest occupational group of Plant/Machine
Operatives occupations. The table reveals that 28% of establishments which did not provide training for
this largest occupational group closed down compared with 23% of establishments which provided
training. The difference in these proportions is statistically significant at the 5% level (p=0.025).
Table 5.2.1.5 – Training and Closure by Largest Occupational Group: Plant/Machine Operatives
No Training Training Total
Not Closed 40+ 89+ 221(%) (72.7) (84.0) (82.8)(weighted %) (72.3) (76.6) (77.3)
Closed 15+ 17+ 46(%) (27.3) (16.0) (17.2)(weighted %) (27.7) (23.4) (22.7)
Total 55 106 267(%) (100) (100) (100)Sample: All establishments with 10 or more employees whose largest occupational group is this particular occupation. + significant at 5%.
Table 5.2.1.6 reports establishment closure rates according to training for the largest occupational group
of Other Occupations. The table reveals that some 10% of establishments with no training for this largest
occupational group closed down compared with only 4% of training establishments. The difference in
these proportions is not statistically significant (p=0.45).
J17473_Skills Report 20 8/3/07 08:28 Page 49
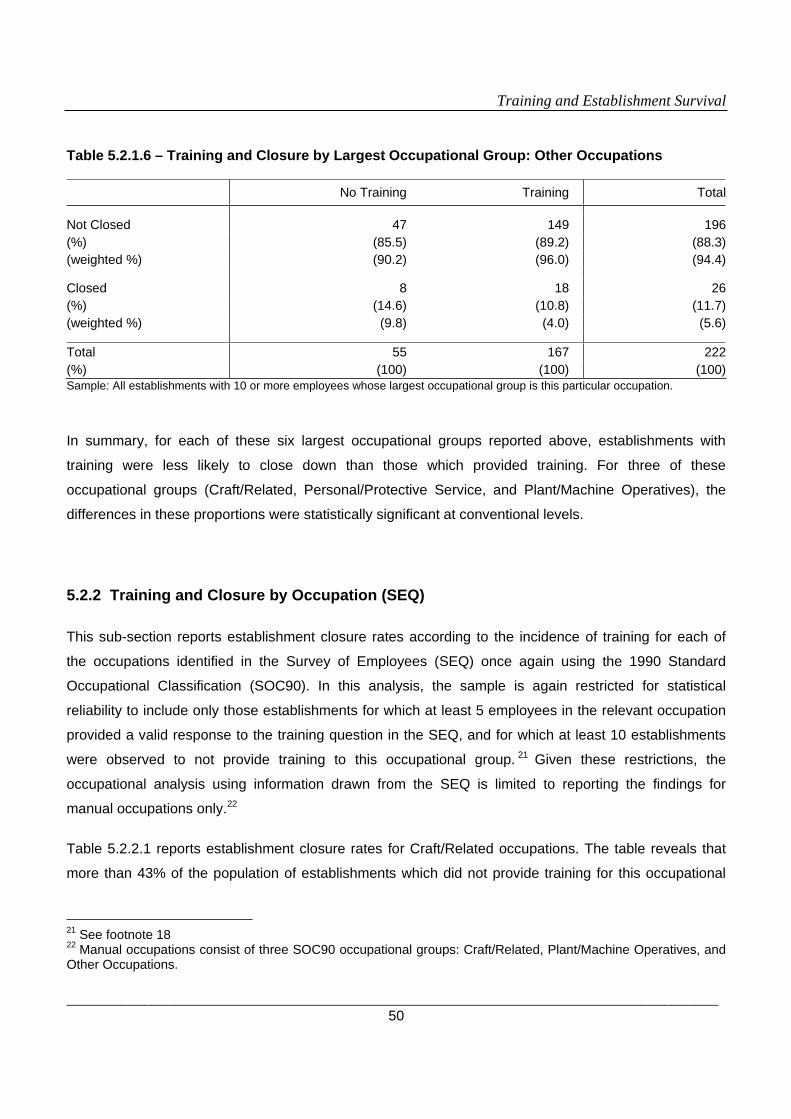
Training and Establishment Survival
____________________________________________________________________________________ 50
Table 5.2.1.6 – Training and Closure by Largest Occupational Group: Other Occupations
No Training Training Total
Not Closed 47 149 196(%) (85.5) (89.2) (88.3)(weighted %) (90.2) (96.0) (94.4)
Closed 8 18 26(%) (14.6) (10.8) (11.7)(weighted %) (9.8) (4.0) (5.6)
Total 55 167 222(%) (100) (100) (100)Sample: All establishments with 10 or more employees whose largest occupational group is this particular occupation.
In summary, for each of these six largest occupational groups reported above, establishments with
training were less likely to close down than those which provided training. For three of these
occupational groups (Craft/Related, Personal/Protective Service, and Plant/Machine Operatives), the
differences in these proportions were statistically significant at conventional levels.
5.2.2 Training and Closure by Occupation (SEQ)
This sub-section reports establishment closure rates according to the incidence of training for each of
the occupations identified in the Survey of Employees (SEQ) once again using the 1990 Standard
Occupational Classification (SOC90). In this analysis, the sample is again restricted for statistical
reliability to include only those establishments for which at least 5 employees in the relevant occupation
provided a valid response to the training question in the SEQ, and for which at least 10 establishments
were observed to not provide training to this occupational group. 21 Given these restrictions, the
occupational analysis using information drawn from the SEQ is limited to reporting the findings for
manual occupations only.22
Table 5.2.2.1 reports establishment closure rates for Craft/Related occupations. The table reveals that
more than 43% of the population of establishments which did not provide training for this occupational
21 See footnote 18 22 Manual occupations consist of three SOC90 occupational groups: Craft/Related, Plant/Machine Operatives, and Other Occupations.
J17473_Skills Report 20 8/3/07 08:28 Page 50
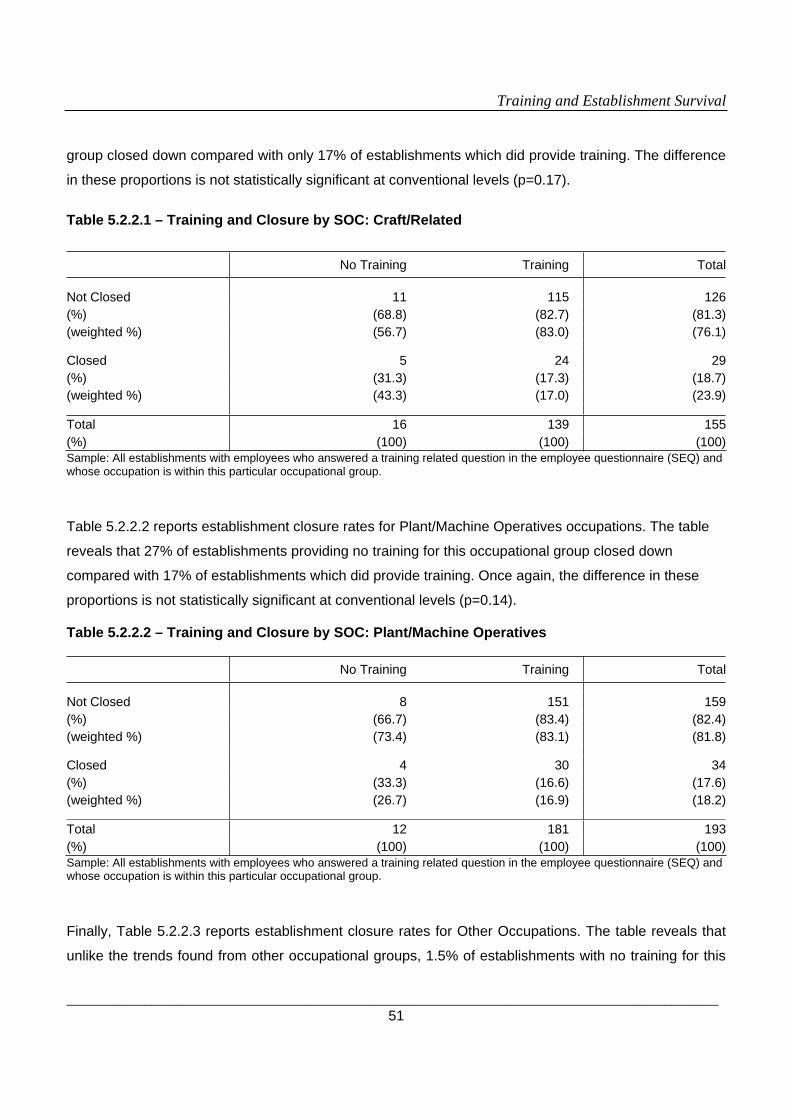
Training and Establishment Survival
____________________________________________________________________________________ 51
group closed down compared with only 17% of establishments which did provide training. The difference
in these proportions is not statistically significant at conventional levels (p=0.17).
Table 5.2.2.1 – Training and Closure by SOC: Craft/Related
No Training Training Total
Not Closed 11 115 126(%) (68.8) (82.7) (81.3)(weighted %) (56.7) (83.0) (76.1)
Closed 5 24 29(%) (31.3) (17.3) (18.7)(weighted %) (43.3) (17.0) (23.9)
Total 16 139 155(%) (100) (100) (100)Sample: All establishments with employees who answered a training related question in the employee questionnaire (SEQ) and whose occupation is within this particular occupational group.
Table 5.2.2.2 reports establishment closure rates for Plant/Machine Operatives occupations. The table
reveals that 27% of establishments providing no training for this occupational group closed down
compared with 17% of establishments which did provide training. Once again, the difference in these
proportions is not statistically significant at conventional levels (p=0.14).
Table 5.2.2.2 – Training and Closure by SOC: Plant/Machine Operatives
No Training Training Total
Not Closed 8 151 159(%) (66.7) (83.4) (82.4)(weighted %) (73.4) (83.1) (81.8)
Closed 4 30 34(%) (33.3) (16.6) (17.6)(weighted %) (26.7) (16.9) (18.2)
Total 12 181 193(%) (100) (100) (100)Sample: All establishments with employees who answered a training related question in the employee questionnaire (SEQ) and whose occupation is within this particular occupational group.
Finally, Table 5.2.2.3 reports establishment closure rates for Other Occupations. The table reveals that
unlike the trends found from other occupational groups, 1.5% of establishments with no training for this
J17473_Skills Report 20 8/3/07 08:28 Page 51

Training and Establishment Survival
____________________________________________________________________________________ 52
occupational group closed down compared with 5.5% of establishments with training. Nevertheless, the
difference in these proportions is not statistically significant at all (p=0.95).
Table 5.2.2.3 – Training and Closure by SOC: Other Occupations
No Training Training Total
Not Closed 16 135 151(%) (94.1) (93.8) (93.8)(weighted %) (98.5) (94.5) (94.8)
Closed 1 9 10(%) (5.9) (6.3) (6.2)(weighted %) (1.5) (5.5) (5.2)
Total 17 144 161(%) (100) (100) (100)Sample: All establishments with employees who answered a training related question in the employee questionnaire (SEQ) and whose occupation is within this particular occupational group.
This sub-section has reported establishment closure rates according to the incidence of training for three
manual SOCs of Craft/Related, Plant/Machine Operatives and Other Occupations using training
measures derived from the Survey of Employees (SEQ). For Craft/Related occupations and
Plant/Machine Operatives occupations, establishments with training were less likely to close down than
those with no training. These results are in line with those for the largest occupational groups drawn from
the Survey of Managers (MQ) reported in the previous sub-section. They are also consistent with the
findings reported in Table 5.1.1.2 which reports the relationship between establishment closure and
training of manual and non-manual occupations.
5.3 Training and Closure by Industry (MQ)
In the previous section, we reported establishment closure rates according to the incidence of training for
occupational groups of employees. In a similar way, this section examines the link between formal off-
the-job training and closure within industrial groups of establishments defined by the 1992 Standard
Industrial Classification (SIC92). Training measures used in this section are derived from the Survey of
Managers (MQ). Once again, as in Section 5.2, the analysis is restricted for statistical reliability purposes
to those industries for which at least 10 establishments are observed to provide no training to employees
in the largest occupational group.
J17473_Skills Report 20 8/3/07 08:28 Page 52

Training and Establishment Survival
____________________________________________________________________________________ 53
Table 5.3.1 – Training and Closure by SIC: Manufacturing
No Training Training Total
Not Closed 37^ 202^ 239(%) (64.9) (85.6) (81.6)(weighted %) (48.9) (80.1) (67.3)
Closed 20^ 34^ 54(%) (35.1) (14.4) (18.4)(weighted %) (51.1) (20.0) (32.7)
Total 57 236 293(%) (100) (100) (100)Sample: All establishments with 10 or more employees within this particular industrial group of SICs. ^ significant at 1%.
Table 5.3.1 reports establishment closure rates for the SIC of Manufacturing. The table reveals that
more than 50% of the population of establishments which did not provide training in the Manufacturing
industry closed down compared with 20% of establishments which provided training. The difference in
these proportions is statistically significant at the 1% level (p=0.0).
Table 5.3.2 reports establishment closure rates according to training for the Construction industry. The
table reveals that 47% of establishments which did not provide training in this industry closed down
compared with 11% of establishments which did provide training. The difference in these proportions is
statistically significant at the 1% level (p=0.005).
Table 5.3.2 – Training and Closure by SIC: Construction
No Training Training Total
Not Closed 7^ 81^ 88(%) (58.3) (89.0) (85.4)(weighted %) (52.7) (89.0) (78.3)
Closed 5^ 10^ 15(%) (41.7) (11.0) (14.6)(weighted %) (47.4) (11.0) (21.7)
Total 12 91 103(%) (100) (100) (100)Sample: All establishments with 10 or more employees within this particular industrial group of SICs. ^ significant at 1%.
J17473_Skills Report 20 8/3/07 08:28 Page 53

Training and Establishment Survival
____________________________________________________________________________________ 54
Table 5.3.3 reports establishment closure rates according to training for the Wholesale/Retail industry.
The table reveals that some 24% of establishments which did not provide training in this industry closed
down compared with less than 10% of establishments which provided training. The difference in these
proportions is statistically significant at the 1% level (p=0.001).
Table 5.3.3 – Training and Closure by SIC: Wholesale/Retail
No Training Training Total
Not Closed 34^ 237^ 271(%) (73.9) (90.5) (88.0)(weighted %) (76.2) (90.2) (86.6)
Closed 12^ 25^ 37(%) (26.1) (9.5) (12.0)(weighted %) (23.8) (9.8) (13.4)
Total 46 262 308(%) (100) (100) (100)Sample: All establishments with 10 or more employees within this particular industrial group of SICs. ^ significant at 1%.
Table 5.3.4 reports establishment closure rates according to training for the SIC of Hotels/Restaurants.
The table reveals that some 28% of the population of establishments which did not provide training in
this industry closed down compared with only 3% of establishments which provided training. The
difference in these proportions is statistically significant at the 5% level (p=0.032).
Table 5.3.4 – Training and Closure by SIC: Hotels/Restaurant
No Training Training Total
Not Closed 26+ 81+ 107(%) (81.3) (94.2) (90.7)(weighted %) (71.6) (96.7) (88.4)
Closed 6+ 5+ 11(%) (18.8) (5.8) (9.3)(weighted %) (28.4) (3.3) (11.6)
Total 32 86 118(%) (100) (100) (100)Sample: All establishments with 10 or more employees within this particular industrial group of SICs. + significant at 5%.
J17473_Skills Report 20 8/3/07 08:28 Page 54

Training and Establishment Survival
____________________________________________________________________________________ 55
Table 5.3.5 reports establishment closure rates according to training for the Transport/Communication
industry. The table reveals that some 38% of establishments which did not provide training in this
industry closed down compared with 20% of establishments which provided training. The difference in
these proportions is not statistically significant (p=0.25).
Table 5.3.5 – Training and Closure by SIC: Transport/Communication
No Training Training Total
Not Closed 14 92 106(%) (73.7) (84.4) (82.8)(weighted %) (62.2) (80.0) (74.9)
Closed 5 17 22(%) (26.3) (15.6) (17.2)(weighted %) (37.8) (20.0) (25.1)
Total 19 109 128(%) (100) (100) (100)Sample: All establishments with 10 or more employees within this particular industrial group of SICs.
Table 5.3.6 reports establishment closure rates according to training for the SIC of Other Business
Services. The table reveals that establishments which did not provide training in this industry have a
closure rate of 12% and the closure rate for those which provided training is 18%. The difference in
these proportions is not statistically significant (p=0.9).
Table 5.3.6 – Training and Closure by SIC: Other Business Services
No Training Training Total
Not Closed 36 136 172(%) (83.7) (84.5) (84.3)(weighted %) (88.1) (81.9) (84.1)
Closed 7 25 32(%) (16.3) (15.5) (15.7)(weighted %) (11.9) (18.1) (15.9)
Total 43 161 204(%) (100) (100) (100)Sample: All establishments with 10 or more employees within this particular industrial group of SICs.
J17473_Skills Report 20 8/3/07 08:28 Page 55

Training and Establishment Survival
____________________________________________________________________________________ 56
Table 5.3.7 reports establishment closure rates according to training for the SIC of Education. The table
reveals that none of the establishments which did not provide training in this industry closed down while
those which provided training have a closure rate of only 4%. The difference in these proportions is not
statistically significant (p=0.5).
Table 5.3.7 – Training and Closure by SIC: Education
No Training Training Total
Not Closed 15 207 222(%) (100.0) (97.2) (97.4)(weighted %) (100.0) (95.6) (95.9)
Closed 0 6 6(%) . (2.8) (2.6)(weighted %) . (4.4) (4.1)
Total 15 213 228(%) (100) (100) (100)Sample: All establishments with 10 or more employees within this particular industrial group of SICs.
Table 5.3.8 reports establishment closure rates according to training for the Health industry. The table
reveals that establishments which did not provide training in this industry have a closure rate of 18%
while those which provided training have a closure rate of 14%. The difference in these proportions is
not statistically significant at conventional levels (p=0.19).
Table 5.3.8 – Training and Closure by SIC: Health
No Training Training Total
Not Closed 8 196 204(%) (72.7) (86.7) (86.1)(weighted %) (82.4) (85.6) (85.4)
Closed 3 30 33(%) (27.3) (13.3) (13.9)(weighted %) (17.6) (14.4) (14.6)
Total 11 226 237(%) (100) (100) (100)Sample: All establishments with 10 or more employees within this particular industrial group of SICs.
Finally, Table 5.3.9 reports establishment closure rates according to training for the SIC of Other
Community Services. The table reveals that only less than 3.5% of establishments which did not provide
J17473_Skills Report 20 8/3/07 08:28 Page 56
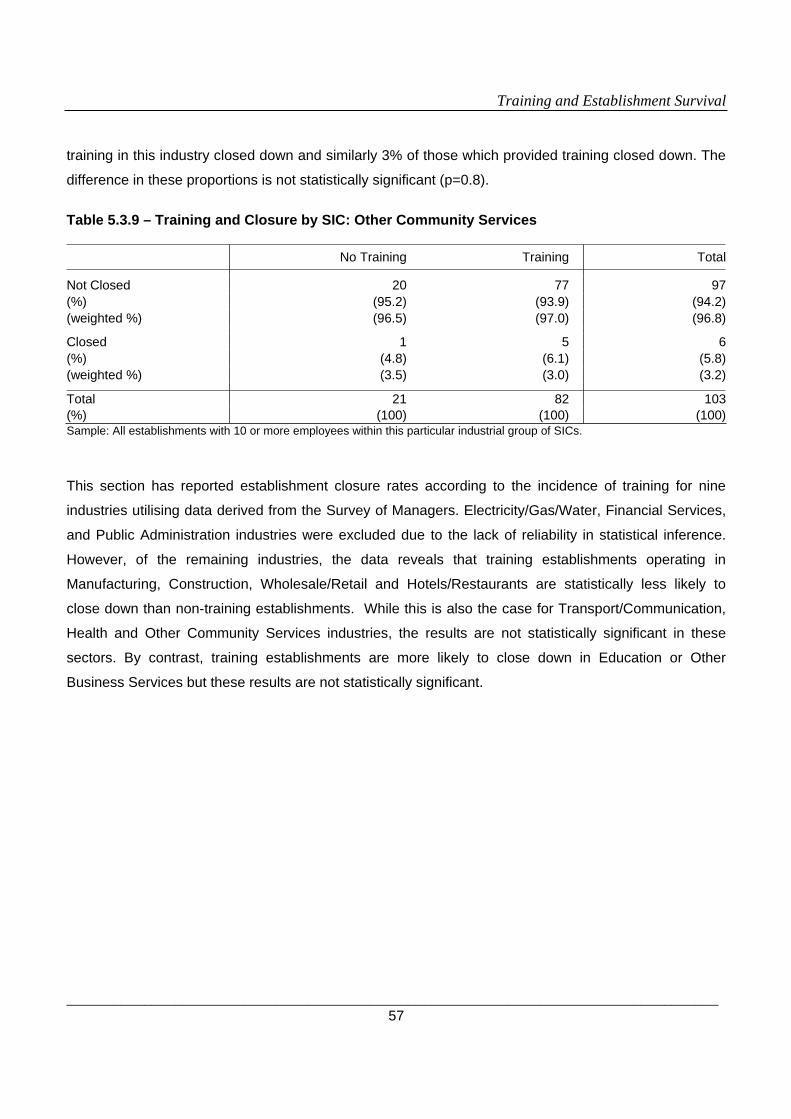
Training and Establishment Survival
____________________________________________________________________________________ 57
training in this industry closed down and similarly 3% of those which provided training closed down. The
difference in these proportions is not statistically significant (p=0.8).
Table 5.3.9 – Training and Closure by SIC: Other Community Services
No Training Training Total
Not Closed 20 77 97(%) (95.2) (93.9) (94.2)(weighted %) (96.5) (97.0) (96.8)
Closed 1 5 6(%) (4.8) (6.1) (5.8)(weighted %) (3.5) (3.0) (3.2)
Total 21 82 103(%) (100) (100) (100)Sample: All establishments with 10 or more employees within this particular industrial group of SICs.
This section has reported establishment closure rates according to the incidence of training for nine
industries utilising data derived from the Survey of Managers. Electricity/Gas/Water, Financial Services,
and Public Administration industries were excluded due to the lack of reliability in statistical inference.
However, of the remaining industries, the data reveals that training establishments operating in
Manufacturing, Construction, Wholesale/Retail and Hotels/Restaurants are statistically less likely to
close down than non-training establishments. While this is also the case for Transport/Communication,
Health and Other Community Services industries, the results are not statistically significant in these
sectors. By contrast, training establishments are more likely to close down in Education or Other
Business Services but these results are not statistically significant.
J17473_Skills Report 20 8/3/07 08:28 Page 57
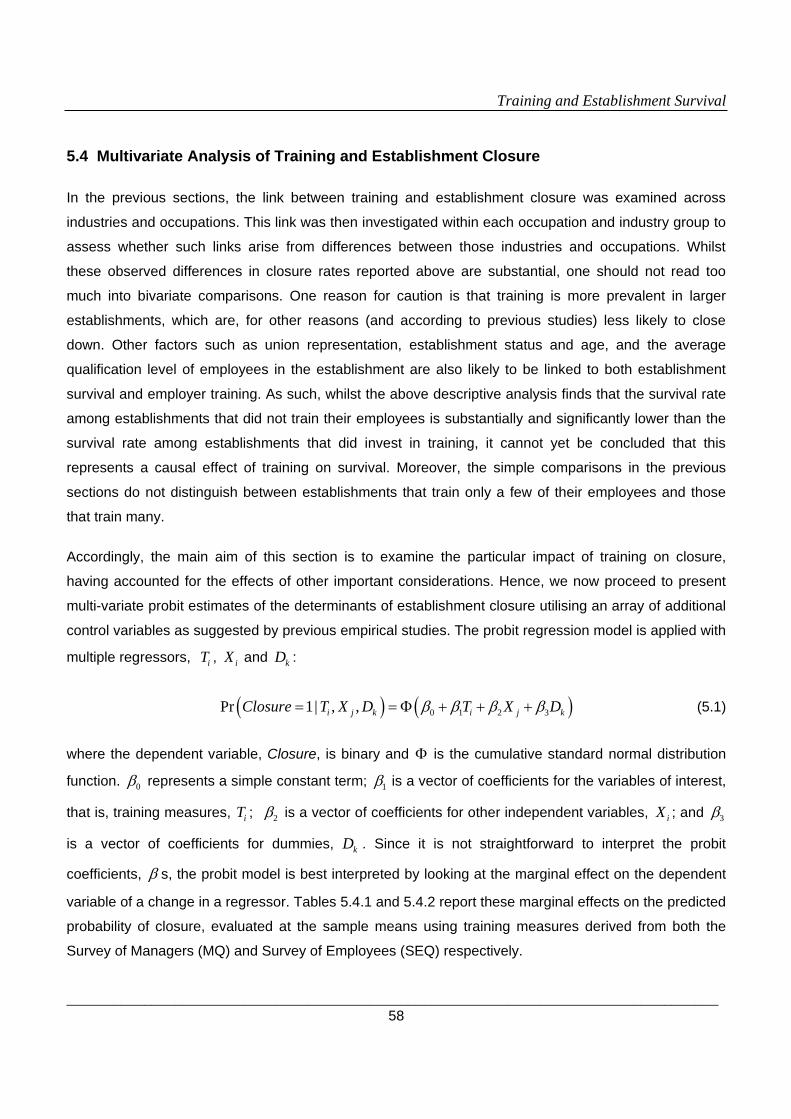
Training and Establishment Survival
____________________________________________________________________________________ 58
5.4 Multivariate Analysis of Training and Establishment Closure
In the previous sections, the link between training and establishment closure was examined across
industries and occupations. This link was then investigated within each occupation and industry group to
assess whether such links arise from differences between those industries and occupations. Whilst
these observed differences in closure rates reported above are substantial, one should not read too
much into bivariate comparisons. One reason for caution is that training is more prevalent in larger
establishments, which are, for other reasons (and according to previous studies) less likely to close
down. Other factors such as union representation, establishment status and age, and the average
qualification level of employees in the establishment are also likely to be linked to both establishment
survival and employer training. As such, whilst the above descriptive analysis finds that the survival rate
among establishments that did not train their employees is substantially and significantly lower than the
survival rate among establishments that did invest in training, it cannot yet be concluded that this
represents a causal effect of training on survival. Moreover, the simple comparisons in the previous
sections do not distinguish between establishments that train only a few of their employees and those
that train many.
Accordingly, the main aim of this section is to examine the particular impact of training on closure,
having accounted for the effects of other important considerations. Hence, we now proceed to present
multi-variate probit estimates of the determinants of establishment closure utilising an array of additional
control variables as suggested by previous empirical studies. The probit regression model is applied with
multiple regressors, iT , iX and kD :
0 1 2 3Pr 1| , ,i j k i j kClosure T X D T X D (5.1)
where the dependent variable, Closure, is binary and is the cumulative standard normal distribution
function. 0 represents a simple constant term; 1 is a vector of coefficients for the variables of interest,
that is, training measures, iT ; 2 is a vector of coefficients for other independent variables, iX ; and 3
is a vector of coefficients for dummies, kD . Since it is not straightforward to interpret the probit
coefficients, s, the probit model is best interpreted by looking at the marginal effect on the dependent
variable of a change in a regressor. Tables 5.4.1 and 5.4.2 report these marginal effects on the predicted
probability of closure, evaluated at the sample means using training measures derived from both the
Survey of Managers (MQ) and Survey of Employees (SEQ) respectively.
J17473_Skills Report 20 8/3/07 08:28 Page 58
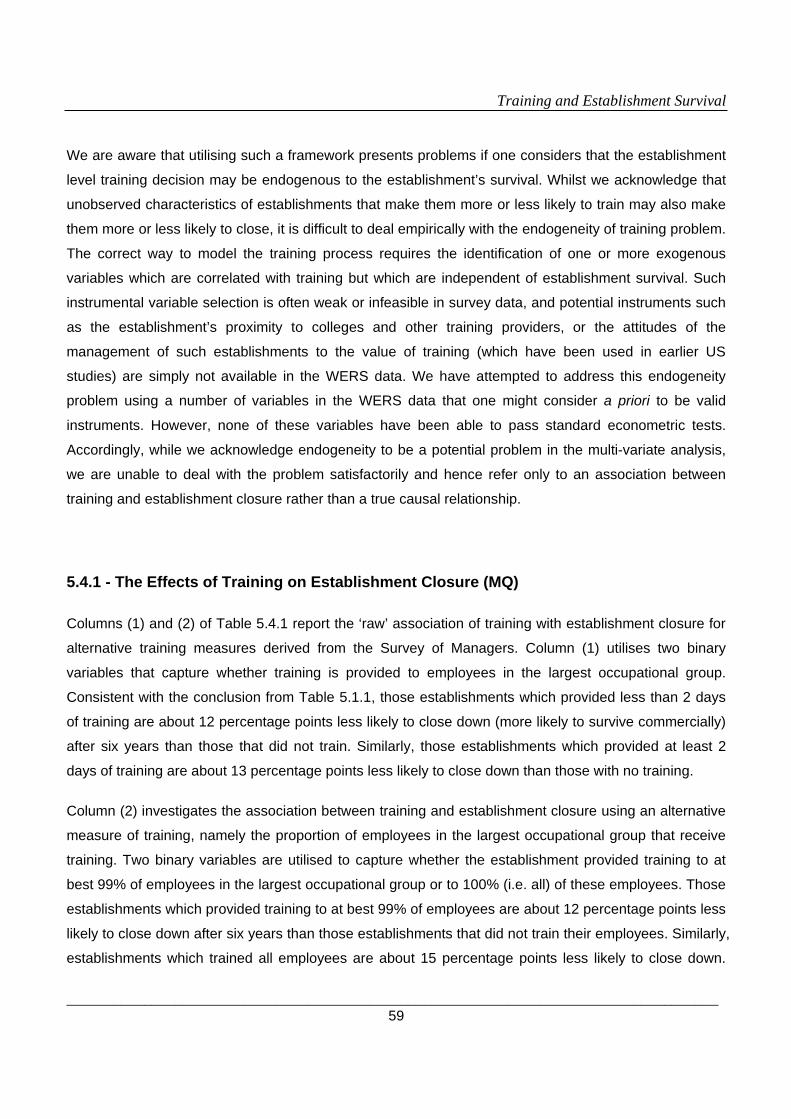
Training and Establishment Survival
____________________________________________________________________________________ 59
We are aware that utilising such a framework presents problems if one considers that the establishment
level training decision may be endogenous to the establishment’s survival. Whilst we acknowledge that
unobserved characteristics of establishments that make them more or less likely to train may also make
them more or less likely to close, it is difficult to deal empirically with the endogeneity of training problem.
The correct way to model the training process requires the identification of one or more exogenous
variables which are correlated with training but which are independent of establishment survival. Such
instrumental variable selection is often weak or infeasible in survey data, and potential instruments such
as the establishment’s proximity to colleges and other training providers, or the attitudes of the
management of such establishments to the value of training (which have been used in earlier US
studies) are simply not available in the WERS data. We have attempted to address this endogeneity
problem using a number of variables in the WERS data that one might consider a priori to be valid
instruments. However, none of these variables have been able to pass standard econometric tests.
Accordingly, while we acknowledge endogeneity to be a potential problem in the multi-variate analysis,
we are unable to deal with the problem satisfactorily and hence refer only to an association between
training and establishment closure rather than a true causal relationship.
5.4.1 - The Effects of Training on Establishment Closure (MQ)
Columns (1) and (2) of Table 5.4.1 report the ‘raw’ association of training with establishment closure for
alternative training measures derived from the Survey of Managers. Column (1) utilises two binary
variables that capture whether training is provided to employees in the largest occupational group.
Consistent with the conclusion from Table 5.1.1, those establishments which provided less than 2 days
of training are about 12 percentage points less likely to close down (more likely to survive commercially)
after six years than those that did not train. Similarly, those establishments which provided at least 2
days of training are about 13 percentage points less likely to close down than those with no training.
Column (2) investigates the association between training and establishment closure using an alternative
measure of training, namely the proportion of employees in the largest occupational group that receive
training. Two binary variables are utilised to capture whether the establishment provided training to at
best 99% of employees in the largest occupational group or to 100% (i.e. all) of these employees. Those
establishments which provided training to at best 99% of employees are about 12 percentage points less
likely to close down after six years than those establishments that did not train their employees. Similarly,
establishments which trained all employees are about 15 percentage points less likely to close down.
J17473_Skills Report 20 8/3/07 08:28 Page 59

Training and Establishment Survival
____________________________________________________________________________________ 60
Table 5.4.1- The Effects of Training on Establishment Closure (MQ)
Dependent Variable Establishment Closure between 1998 and 2004 (0/1) Regressors (in 1998) (1) (2) (3) (4) (5)
Training: less than 2 days -0.124 -0.087 (3.56)^ (3.85)^ Training: 2 or more days -0.130 -0.091 (3.49)^ (3.56)^ Training: 1 to 99% of employees -0.121 -0.098 (3.28)^ (3.72)^ Training: 100% of employees -0.148 -0.095 (4.38)^ (4.57)^ Educational Qualification -0.034 -0.044 -0.046 (1.73)* (2.80)^ (2.93)^ Part-Time Employees (reference: <10%)
10 to 60% of employees -0.045 -0.047 (1.68)* (1.72)* > 60% of employees -0.077 -0.077 (2.49)+ (2.50)+ Establishment Age (reference: > 20 years)
< 1 year 0.266 0.269 (3.94)^ (4.04)^
1 to 10 years 0.092 0.095 (3.18)^ (3.33)^
10 to 20 years 0.079 0.080 (2.08)+ (2.13)+ Any Member of Unions (0/1) 0.009 0.013 (0.36) (0.53) Independent Ests. (0/1) -0.032 -0.029 (1.41) (1.31) Public Ests. (0/1) -0.047 -0.030 (1.45) (0.94) Quality Circle (0/1) 0.011 0.013 (0.51) (0.66) Establishment Size (reference: 25 to 49) 10 to 24 employees -0.102 -0.101
(4.31)^ (4.33)^ 50 to 99 employees -0.070 -0.067 (3.76)^ (3.50)^
100 to 199 employees -0.055 -0.055 (2.62)^ (2.70)^ 200 to 499 employees -0.048 -0.048 (2.30)+ (2.32)+ 500 employees or more -0.059 -0.059 (2.50)+ (2.60)^
Pseudo R2 0.0398 0.0480 0.0086 0.2648 0.2664 Sample Size 2030 2062 1694 1649 1672 Sample: All establishments with 10 or more employees. Robust z statistics in parentheses. Estimates reported here are weighted. * significant at 10%; + significant at 5%; ^ significant at 1%. Regressors in Columns (4) and (5) include occupationaldummies, industrial dummies and regional dummies.
J17473_Skills Report 20 8/3/07 08:28 Page 60
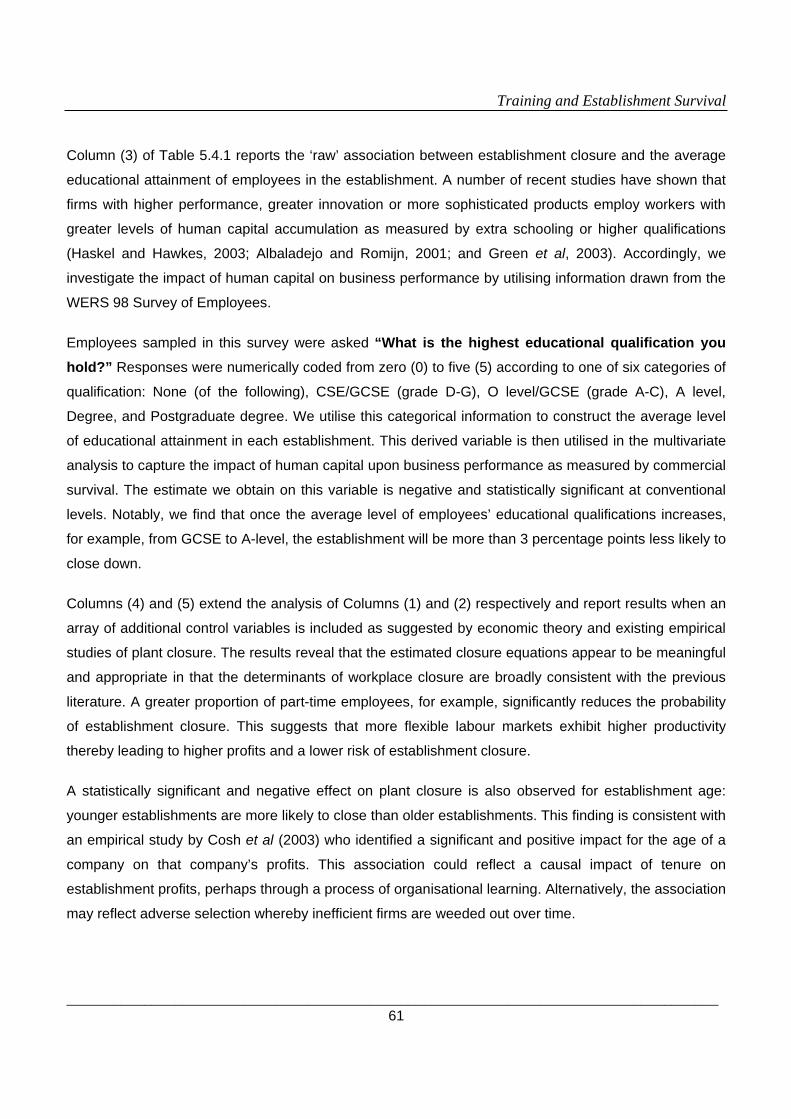
Training and Establishment Survival
____________________________________________________________________________________ 61
Column (3) of Table 5.4.1 reports the ‘raw’ association between establishment closure and the average
educational attainment of employees in the establishment. A number of recent studies have shown that
firms with higher performance, greater innovation or more sophisticated products employ workers with
greater levels of human capital accumulation as measured by extra schooling or higher qualifications
(Haskel and Hawkes, 2003; Albaladejo and Romijn, 2001; and Green et al, 2003). Accordingly, we
investigate the impact of human capital on business performance by utilising information drawn from the
WERS 98 Survey of Employees.
Employees sampled in this survey were asked “What is the highest educational qualification you hold?” Responses were numerically coded from zero (0) to five (5) according to one of six categories of
qualification: None (of the following), CSE/GCSE (grade D-G), O level/GCSE (grade A-C), A level,
Degree, and Postgraduate degree. We utilise this categorical information to construct the average level
of educational attainment in each establishment. This derived variable is then utilised in the multivariate
analysis to capture the impact of human capital upon business performance as measured by commercial
survival. The estimate we obtain on this variable is negative and statistically significant at conventional
levels. Notably, we find that once the average level of employees’ educational qualifications increases,
for example, from GCSE to A-level, the establishment will be more than 3 percentage points less likely to
close down.
Columns (4) and (5) extend the analysis of Columns (1) and (2) respectively and report results when an
array of additional control variables is included as suggested by economic theory and existing empirical
studies of plant closure. The results reveal that the estimated closure equations appear to be meaningful
and appropriate in that the determinants of workplace closure are broadly consistent with the previous
literature. A greater proportion of part-time employees, for example, significantly reduces the probability
of establishment closure. This suggests that more flexible labour markets exhibit higher productivity
thereby leading to higher profits and a lower risk of establishment closure.
A statistically significant and negative effect on plant closure is also observed for establishment age:
younger establishments are more likely to close than older establishments. This finding is consistent with
an empirical study by Cosh et al (2003) who identified a significant and positive impact for the age of a
company on that company’s profits. This association could reflect a causal impact of tenure on
establishment profits, perhaps through a process of organisational learning. Alternatively, the association
may reflect adverse selection whereby inefficient firms are weeded out over time.
J17473_Skills Report 20 8/3/07 08:28 Page 61
Training and Establishment Survival
____________________________________________________________________________________ 62
Evidence concerning the nature and activity of establishments is mixed. Estimated coefficients regarding
the public/private status of establishments and establishments that operate independently of a larger
multi-site organisation are correctly signed in identifying a negative impact upon establishment closure.
Similarly, a positive impact on establishment closure is identified for union recognition. These findings
are consistent with previous studies of establishment closure drawn from British workplace data.
Nevertheless, none of the associations reported here are statistically significant at conventional levels.
It is well known that training is more widespread in larger firms and establishments. A typical rationale for
having less training in smaller establishments is that the costs are disproportionately high, at least for
formal training. In particular, it is often stated that it is difficult to spare workers from direct production
activities. The implication is that the optimal level of training is greater in large than in small
establishments. It is also possible that the impact of training on company performance may differ
according to the size of establishment. In Columns (4) and (5), we investigate this issue by including a
number of dummy variables which capture establishment size.23
The estimates reported in Columns (4) and (5) reveal a non-linear relationship between establishment
closure and size. Relative to the reference category of establishments with between 25 and 49
employees, establishments employing 10 to 24 employees are 10 percentage points less likely to close
down. Statistically significant negative impacts are also observed for medium and large establishments
employing greater than 50 employees. Nevertheless, the magnitudes of these estimates do not simply
increase with establishment size. Rather, they fluctuate between 5 and 7 percentage points. These latter
associations are all significantly different from zero at the 5% level.
The net effect of controlling for these other determinants of establishment closure is to reduce the
coefficients on the variables of training. Column (4) indicates that conditional upon other determinants of
closure, establishments which provide training to employees in the largest occupational group are 9
percentage points less likely to close down than establishments which provide no training regardless of
the length of training provided. Similarly, Column (5) indicates that establishments which provide training
to the largest occupational group are 10 percentage points less likely to close down than those which do
not invest in training regardless of the proportion of employees for which such investments made.
23 Recall that establishments with less than 10 workers are excluded from WERS 98.
J17473_Skills Report 20 8/3/07 08:28 Page 62
Training and Establishment Survival
____________________________________________________________________________________ 63
5.4.2 - The Effects of Training on Establishment Closure (SEQ)
Table 5.4.2 reports the association of training with establishment closure using training measures
derived from the WERS 98 Survey of Employees. Columns (1) and (2) report the ‘raw’ association of
training upon establishment closure. Column (1) utilises two binary variables that capture whether there
is any training of employees for less than or at least 2 days. The estimated coefficient on training of 2
days or more indicates that establishments which provided at least 2 days of training are 25 percentage
points less likely to close down than those which provide no training. This association is statistically
significant at the 10% level. This result is in line with the conclusion from Table 5.4.1 for the MQ although
the magnitudes of the coefficients are different. A negative coefficient is also obtained for less than 2
days of training but this is statistically insignificant at conventional levels.
Column (2) investigates the raw association between establishment closure and the proportion of all
employees receiving training.24 The estimate is statistically significant at the 1% level and indicates that
those establishments which provided training to all employees surveyed in the Survey of Employees are
22 percentage points less likely to close down than those establishments for which no training was
reported.
To further explore the impact of human capital on commercial survival, Column (3) of Table 5.4.2 reports
the ‘raw’ association between establishment closure and average educational attainment as previously
discussed in Section 5.4.1. The point estimate on this variable is broadly similar to that identified in Table
5.4.1 though this effect is insignificant at conventional levels.
Columns (4) and (5) of Table 5.4.2 extend the analysis of Columns (1) and (2) respectively and report
results when an array of control variables is additionally included. The main effect of including these
other determinants of establishment closure is to reduce the size of the estimated training effects.
Column (4) reports that, other things equal, those establishments which provided less than 2 days of
training are about 3.3 percentage points less likely to close down than those with no training.
Establishments which provided at least 2 days of training are about 13 percentage points less likely to
close down. Column (5) reports that establishments which provided training are about 9 percentage
points more likely to survive than those with no training provision. However, this latter association is not
statistically significant at conventional levels.
24 The proportion of trained employees used for the SEQ analysis is measured by the ratio of the number of employees receiving training in an establishment to the number of employees who responded to the training question of the SEQ in that establishment.
J17473_Skills Report 20 8/3/07 08:28 Page 63
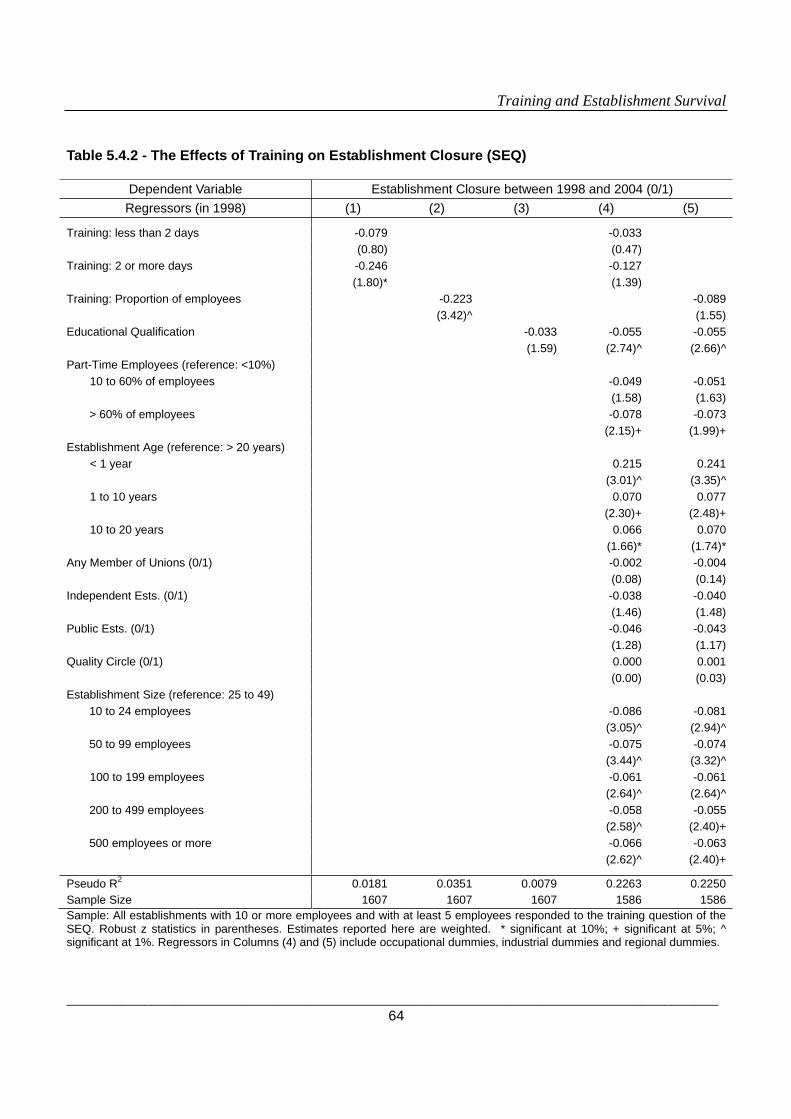
Training and Establishment Survival
____________________________________________________________________________________ 64
Table 5.4.2 - The Effects of Training on Establishment Closure (SEQ)
Dependent Variable Establishment Closure between 1998 and 2004 (0/1) Regressors (in 1998) (1) (2) (3) (4) (5)
Training: less than 2 days -0.079 -0.033 (0.80) (0.47) Training: 2 or more days -0.246 -0.127 (1.80)* (1.39) Training: Proportion of employees -0.223 -0.089 (3.42)^ (1.55) Educational Qualification -0.033 -0.055 -0.055 (1.59) (2.74)^ (2.66)^ Part-Time Employees (reference: <10%)
10 to 60% of employees -0.049 -0.051 (1.58) (1.63) > 60% of employees -0.078 -0.073 (2.15)+ (1.99)+ Establishment Age (reference: > 20 years)
< 1 year 0.215 0.241 (3.01)^ (3.35)^
1 to 10 years 0.070 0.077 (2.30)+ (2.48)+
10 to 20 years 0.066 0.070 (1.66)* (1.74)* Any Member of Unions (0/1) -0.002 -0.004 (0.08) (0.14) Independent Ests. (0/1) -0.038 -0.040 (1.46) (1.48) Public Ests. (0/1) -0.046 -0.043 (1.28) (1.17) Quality Circle (0/1) 0.000 0.001 (0.00) (0.03) Establishment Size (reference: 25 to 49) 10 to 24 employees -0.086 -0.081 (3.05)^ (2.94)^ 50 to 99 employees -0.075 -0.074 (3.44)^ (3.32)^
100 to 199 employees -0.061 -0.061 (2.64)^ (2.64)^ 200 to 499 employees -0.058 -0.055 (2.58)^ (2.40)+ 500 employees or more -0.066 -0.063 (2.62)^ (2.40)+
Pseudo R2 0.0181 0.0351 0.0079 0.2263 0.2250 Sample Size 1607 1607 1607 1586 1586 Sample: All establishments with 10 or more employees and with at least 5 employees responded to the training question of the SEQ. Robust z statistics in parentheses. Estimates reported here are weighted. * significant at 10%; + significant at 5%; ^ significant at 1%. Regressors in Columns (4) and (5) include occupational dummies, industrial dummies and regional dummies.
J17473_Skills Report 20 8/3/07 08:28 Page 64

Training and Establishment Survival
____________________________________________________________________________________ 65
Although our interpretation of these findings has been that investment in training does generate above-
normal returns and hence lower closure rates, it is possible that the conditional correlation being
captured in these estimates derives from omitted factors that are associated both with training and long-
term commercial survival. Such omitted factors may be unobserved in the data. One such consideration,
for example, could be the extent to which the management of an establishment has a long-termist
horizon. A company which looks to the long-term future may adopt a range of strategies for securing
long-term prosperity. As part of this strategy it might decide that the workforce has a high level of training
needs. If so, we might be according too much weight to training per se. The effect of the training that we
measure in 1998 might also be attributable to other training in earlier and subsequent years, since the
level of training is likely to persist. Alternatively, as the HRM literature hypothesises, the effect of training
on performance may be linked to the usage of “high-performance” practices. Whitfield (2000) explores
the relationship between such practices and training. Channels for communication are a necessary
ingredient of getting employees involved in the establishment, which is at the core of the high-
performance model (Appelbaum et al, 2000). In other probit estimations not shown here we found that
variables measuring the presence of communication channels, such as consultative committees or
suggestion schemes, had no significant association with the probability of closure. Nevertheless, since
we have not removed unobserved fixed effects in this analysis, the fact that high-training establishments
are associated in some cases with a greater likelihood of survival should only be interpreted as causal if
one is prepared to assume that the unobserved fixed effects do not generate substantial biases in the
estimates.
5.5 The Effects of Training on Closure by Occupation
In Sections 5.5 and 5.6 we consider three extensions to our basic findings. First, we consider the
separate effect on establishment closure of training in each of the largest occupational groups (LOG)
derived from the Survey of Managers (MQ). Second, we examine the effect on establishment closure of
training in each of the occupational groups (SOC90) derived from the Survey of Employees (SEQ).
Finally, we explore the training effects in each of the industrial groups (SIC92). By disaggregating the
training investment in the workforce among these constituent groups, we can investigate whether
training has differential effects across groups, and hence whether the discrepancy between training and
its optimal level varies across groups.
J17473_Skills Report 20 8/3/07 08:28 Page 65

Training and Establishment Survival
____________________________________________________________________________________ 66
5.5.1 The Effects of Training on Closure by Largest Occupational Group (MQ)
Table 5.5.1.1 reports the association of training with establishment closure by largest occupational group
in the establishment. Note that, as discussed in Section 5.2.1, analysis by largest occupational group is
restricted to those occupational groups for which at least 10 establishments are identified as not
providing training. Accordingly, Professional occupations and Associate Professional/Technical
occupations are excluded from this more detailed analysis.
The table reports the conditional association of training with establishment closure for the incidence of
formal off-the-job training within each of the largest occupational groups over the past year. The
coefficients on training for each of the six remaining occupational groups are negative implying that
training reduces the probability of closure. Furthermore, of these six groups, three of the training
associations (Craft/Related, Personal/Protective Service and Other Occupations) are found to be
statistically significant. Hence, the results are broadly consistent with the conclusions drawn from sub-
section 5.2.1.
Notably, there is significant variation in the size of the association across these different groups. Column
(2), for example, reports that for the largest occupational group of Craft/Related, establishments which
provided training are some 44 percentage points less likely to close down after six years than those that
did not train. By contrast, Columns (3) and (6), which report training associations for Personal/Protective
Services and Other Occupations respectively, reveal training establishments to be approximately 22
percentage points less likely to close down than non-training equivalents.
The results for the educational qualification of employees are mixed and appear less well determined
than in the previous analysis. Clerical/Secretarial and Personal/Protective Service occupations provide
an exception here. They suggest that once the average level of employees’ educational qualification
increases, for example, from GCSE to A-level, establishments for which Clerical/Secretarial occupations
are the largest occupational group are around 9 percentage points less likely to close down. For
Personal/Protective Service occupations, the gain is around 6 percentage points.
J17473_Skills Report 20 8/3/07 08:28 Page 66

Training and Establishment Survival
____________________________________________________________________________________ 67
Table 5.5.1.1 - The Effects of the Incidence of Training on Closure by Largest Occupational Group (MQ)
(1) (2) (3) (4) (5) (6)
Largest occupational group Clerical/Secretarial
Craft/ Related
Personal/ Protective Sales Plant/
Machine Other
Occupations
Training (0/1) -0.087 -0.440^ -0.233^ -0.072 -0.151 -0.215^
(1.22) (3.51) (2.90) (1.14) (1.61) (2.74)
Educational Qualification -0.089+ 0.140 -0.060+ -0.015 -0.049 -0.021 (1.98) (1.47) (2.35) (0.69) (0.59) (0.62)
Pseudo R2 0.2808 0.2682 0.2486 0.2048 0.1292 0.2671 Sample Size 302 185 240 169 203 159 Sample: All establishments with 10 or more employees within the group. Robust z statistics in parentheses. Estimates reported here are weighted. * significant at 10%; + significant at 5%; ^ significant at 1%. Regressors in all regressions include dummiesfor part-time employees, the age of establishment and establishment size.
Table 5.5.1.2 reports the conditional association of training with establishment closure for two binary
training variables that capture whether the establishment provided training to at best 99% of employees
or to all of them. Regardless of occupational classification, the table reports a negative and statistically
significant association between training and establishment closure for establishments providing training
to 100% of employees in each of the largest occupational groups. For the largest occupational groups of
Craft/Related, Personal/Protective Service, and Other Occupations, similar effects are observed for
establishments providing training to less than 100% of employees in that occupation. For example, for
the largest occupational group of Craft/Related employees, establishments providing training to at best
99% of employees are 36 percentage points less likely to close down than those establishments not
providing training. Where 100% of employees were trained in this group, establishments are 31
percentage points less likely to close down. Results for the educational qualification of employees are
similar to those reported in Table 5.5.1.1.
J17473_Skills Report 20 8/3/07 08:28 Page 67
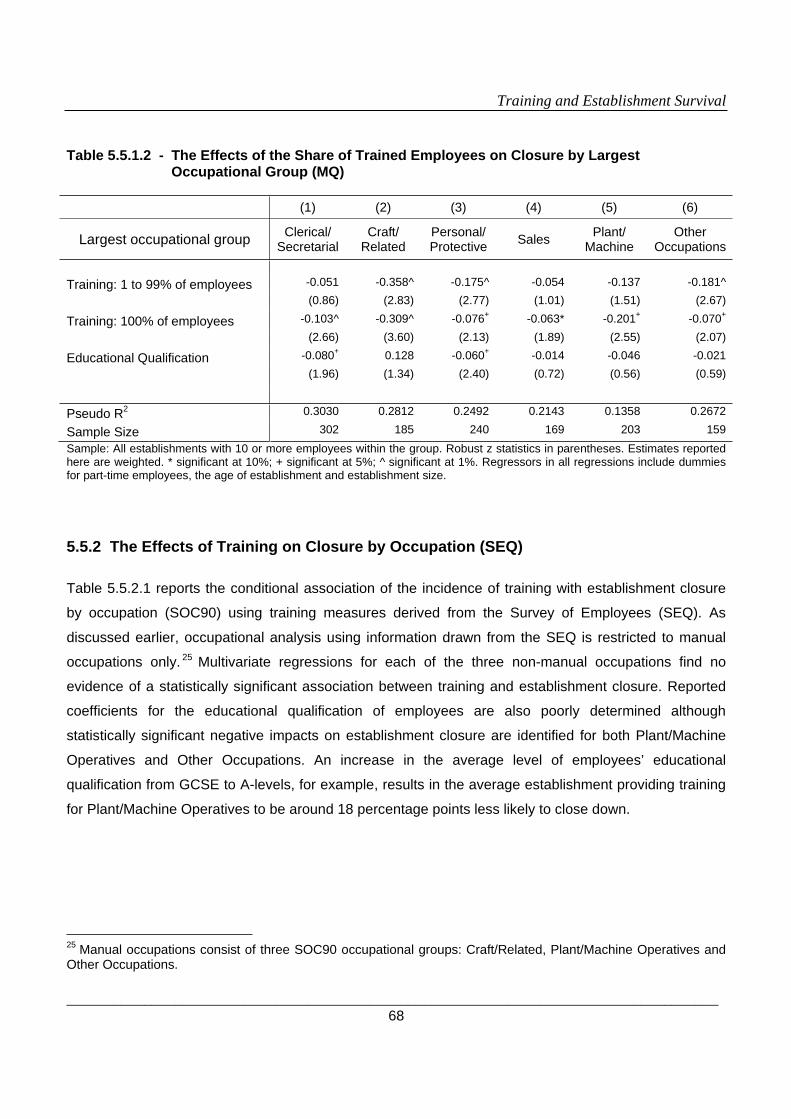
Training and Establishment Survival
____________________________________________________________________________________ 68
Table 5.5.1.2 - The Effects of the Share of Trained Employees on Closure by Largest Occupational Group (MQ)
(1) (2) (3) (4) (5) (6)
Largest occupational group Clerical/Secretarial
Craft/ Related
Personal/ Protective Sales Plant/
Machine Other
Occupations
Training: 1 to 99% of employees -0.051 -0.358^ -0.175^ -0.054 -0.137 -0.181^ (0.86) (2.83) (2.77) (1.01) (1.51) (2.67)
Training: 100% of employees -0.103^ -0.309^ -0.076+ -0.063* -0.201+ -0.070+
(2.66) (3.60) (2.13) (1.89) (2.55) (2.07)
Educational Qualification -0.080+ 0.128 -0.060+ -0.014 -0.046 -0.021 (1.96) (1.34) (2.40) (0.72) (0.56) (0.59)
Pseudo R2 0.3030 0.2812 0.2492 0.2143 0.1358 0.2672
Sample Size 302 185 240 169 203 159 Sample: All establishments with 10 or more employees within the group. Robust z statistics in parentheses. Estimates reported here are weighted. * significant at 10%; + significant at 5%; ^ significant at 1%. Regressors in all regressions include dummiesfor part-time employees, the age of establishment and establishment size.
5.5.2 The Effects of Training on Closure by Occupation (SEQ)
Table 5.5.2.1 reports the conditional association of the incidence of training with establishment closure
by occupation (SOC90) using training measures derived from the Survey of Employees (SEQ). As
discussed earlier, occupational analysis using information drawn from the SEQ is restricted to manual
occupations only. 25 Multivariate regressions for each of the three non-manual occupations find no
evidence of a statistically significant association between training and establishment closure. Reported
coefficients for the educational qualification of employees are also poorly determined although
statistically significant negative impacts on establishment closure are identified for both Plant/Machine
Operatives and Other Occupations. An increase in the average level of employees’ educational
qualification from GCSE to A-levels, for example, results in the average establishment providing training
for Plant/Machine Operatives to be around 18 percentage points less likely to close down.
25 Manual occupations consist of three SOC90 occupational groups: Craft/Related, Plant/Machine Operatives and Other Occupations.
J17473_Skills Report 20 8/3/07 08:28 Page 68

Training and Establishment Survival
____________________________________________________________________________________ 69
Table 5.5.2.1 - The Effects of the Incidence of Training on Closure by SOC (SEQ)
(1) (2) (3)
SOC Craft/Related Plant/Machine Operatives Other Occupations
Training (0/1) -0.144 0.058 -0.010
(1.14) (0.64) (0.22)
Educational Qualification -0.060 -0.177* -0.148+
(0.46) (1.90) (2.26)
Pseudo R2 0.2321 0.0838 0.1833
Observations 138 190 117 Sample: All establishments with 10 or more employees and with at least 5 employees responded to the training question of the SEQ within the group. Robust z statistics in parentheses. Estimates reported here are weighted. * significant at 10%; + significant at 5%; ^ significant at 1% . Regressors in all regressions include dummies for part-time employees, the age of establishment and establishment size.
Table 5.5.2.2 reports the conditional association of training with establishment closure for the proportion
of employees receiving training in the establishment. As in Table 5.5.2.1, none of these three SOCs
report a significant association between training and establishment closure. The results for the
educational qualification are similar to those from Table 5.2.2.1.
Table 5.5.2.2 - The Effects of the Share of Trained Employees on Closure by SOC (SEQ)
(1) (2) (3)
SOC Craft/Related Plant/Machine Operatives Other Occupations
% of Employees Trained -0.293 -0.137 -0.064
(1.64) (0.74) (0.75)
Educational Qualification -0.019 -0.150* -0.148+
(0.15) (1.68) (2.51)
Pseudo R2 0.2488 0.0843 0.1895
Observations 138 190 117 Sample: All establishments with 10 or more employees and with at least 5 employees responded to the training question of the SEQ within the group. Robust z statistics in parentheses. Estimates reported here are weighted. * significant at 10%; + significant at 5%; ^ significant at 1%. Regressors in all regressions include dummies for part-time employees, the age of establishment and establishment size.
J17473_Skills Report 20 8/3/07 08:28 Page 69
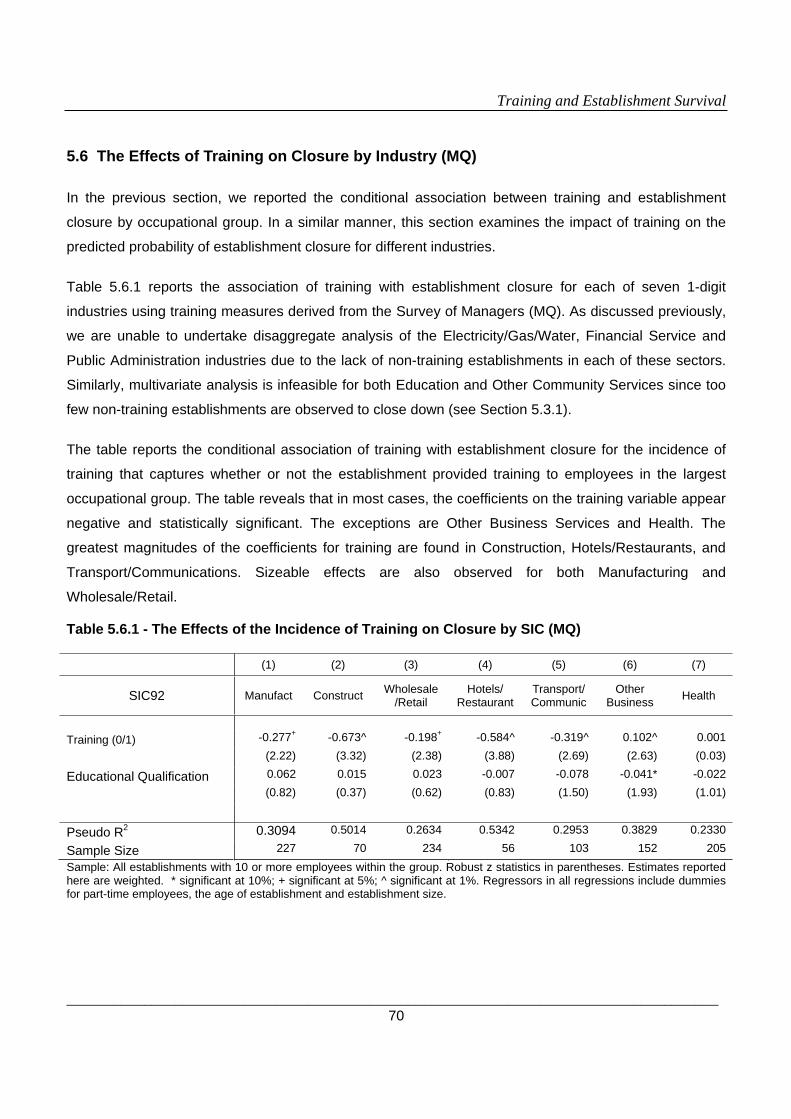
Training and Establishment Survival
____________________________________________________________________________________ 70
5.6 The Effects of Training on Closure by Industry (MQ)
In the previous section, we reported the conditional association between training and establishment
closure by occupational group. In a similar manner, this section examines the impact of training on the
predicted probability of establishment closure for different industries.
Table 5.6.1 reports the association of training with establishment closure for each of seven 1-digit
industries using training measures derived from the Survey of Managers (MQ). As discussed previously,
we are unable to undertake disaggregate analysis of the Electricity/Gas/Water, Financial Service and
Public Administration industries due to the lack of non-training establishments in each of these sectors.
Similarly, multivariate analysis is infeasible for both Education and Other Community Services since too
few non-training establishments are observed to close down (see Section 5.3.1).
The table reports the conditional association of training with establishment closure for the incidence of
training that captures whether or not the establishment provided training to employees in the largest
occupational group. The table reveals that in most cases, the coefficients on the training variable appear
negative and statistically significant. The exceptions are Other Business Services and Health. The
greatest magnitudes of the coefficients for training are found in Construction, Hotels/Restaurants, and
Transport/Communications. Sizeable effects are also observed for both Manufacturing and
Wholesale/Retail.
Table 5.6.1 - The Effects of the Incidence of Training on Closure by SIC (MQ)
(1) (2) (3) (4) (5) (6) (7)
SIC92 Manufact Construct Wholesale /Retail
Hotels/ Restaurant
Transport/ Communic
Other Business Health
Training (0/1) -0.277+ -0.673^ -0.198+ -0.584^ -0.319^ 0.102^ 0.001
(2.22) (3.32) (2.38) (3.88) (2.69) (2.63) (0.03)
Educational Qualification 0.062 0.015 0.023 -0.007 -0.078 -0.041* -0.022 (0.82) (0.37) (0.62) (0.83) (1.50) (1.93) (1.01)
Pseudo R2 0.3094 0.5014 0.2634 0.5342 0.2953 0.3829 0.2330
Sample Size 227 70 234 56 103 152 205 Sample: All establishments with 10 or more employees within the group. Robust z statistics in parentheses. Estimates reported here are weighted. * significant at 10%; + significant at 5%; ^ significant at 1%. Regressors in all regressions include dummiesfor part-time employees, the age of establishment and establishment size.
J17473_Skills Report 20 8/3/07 08:28 Page 70
Training and Establishment Survival
____________________________________________________________________________________ 71
Column (2) of Table 5.6.1, for example, reveals that for the SIC of Construction, establishments which
provide training to the largest occupational group are 67 percentage points less likely to close down than
those establishments which do not provide training. Column (4) likewise suggests training
establishments in Hotels/Restaurants are 58 percentage points less likely to close. Similarly large and
significant effects are reported for Transport/Communication, Manufacturing and Wholesale/Retail. The
finding of a significant and positive impact of training on establishment closure for Other Business
Services is at odds with the results for other industries. Given the theoretical exposition developed in
Section 2.1, one plausible interpretation is that establishments in this industry are over-investing in
training. This may appear at odds with the bivariate analysis of training and closure reported in Table
4.3.1 which identifies Other Business Services as an industry with a low incidence of training relative to
other industries. However, this finding is consistent if we augment our framework to consider that training
needs (and hence the relevance of training) may differ across industry sectors. This is an important
avenue for future research which we discuss further in Chapter 7.
In contrast to the training measures, no significant impact on establishment closure is observed for the
average educational attainment of employees in the establishment. A notable exception is the coefficient
for Other Business Services. The estimate in Column (6) indicates that once the average level of
employees’ educational qualification increases by one level (say, from GCSE to A-level), the average
establishment in Other Business Services will be approximately 4 percentage points less likely to close
down.
Table 5.6.2 reports the conditional association of training with establishment closure for two binary
training variables that capture whether the establishment provided training to at best 99% of employees
or to all employees. The table reveals that coefficients on both training variables for the first five SICs
appear to be both negative and statistically significant. By contrast, the coefficient for Other Business
Services is again statistically significant and positive. The general tenor of the results is broadly similar to
those findings reported in Table 5.6.1.
Column (2) of Table 5.6.2, for example, suggests that for the SIC of Construction, those establishments
which provided training to at best 99% of employees are 43 percentage points less likely to close down
after six years than those that did not train and those establishments which provided training to all
employees are some 13 percentage points less likely to close than those with no training. Column (1)
reveals the equivalent figures for the SIC of Manufacturing to be 22% and 37% respectively. Similarly
large effects are observed for Hotels/Restaurants and Wholesale/Retail. By contrast, a significant
J17473_Skills Report 20 8/3/07 08:28 Page 71

Training and Establishment Survival
____________________________________________________________________________________ 72
positive association between training and establishment closure is once again identified for Other
Business Services. The results for educational qualification are also consistent with those in Table 5.6.1.
Table 5.6.2 - The Effects of the Share of Trained Employees on Closure by SIC (MQ)
(1) (2) (3) (4) (5) (6) (7)
SIC92 Manufact Construct Wholesale /Retail
Hotels/ Restaurant
Transport/ Communic
Other Business Health
T:1 to 99% of employees -0.217* -0.434^ -0.155+ -0.646^ -0.301+ 0.146^ 0.001
(1.72) (3.36) (2.17) (3.75) (2.08) (2.95) (0.02)
Train: 100% of employees -0.371^ -0.125^ -0.109+ . . 0.011 0.003 (3.33) (3.11) (2.53) . . (0.21) (0.06)
Educational Qualification 0.052 0.009 0.021 -0.017 -0.091 -0.037+ -0.022 (0.68) (0.23) (0.59) (0.84) (1.34) (1.96) (1.03)
Pseudo R2 0.3347 0.5102 0.2686 0.5324 0.2674 0.4240 0.2331
Sample Size 227 70 234 50 80 152 205 Sample: All establishments with 10 or more employees within the group. Robust z statistics in parentheses. Estimates reported here are weighted. * significant at 10%; + significant at 5%; ^ significant at 1%. Regressors in all regressions include dummiesfor part-time employees, the age of establishment and establishment size.
5.7 Summary of Chapter 5
In Chapter 5, we have endeavoured to investigate the link between training and establishment closure
using the WERS data. In the simple bivariate analysis on the link between training and establishment
closure, we found a significant association of establishment closure with both the incidence of training
and the intensity of training across industries and occupations using training measures derived from both
the Survey of Managers (MQ) and the Survey of Employees (SEQ).
We also found a significant association between training and establishment closure within occupations
and industries. In the within-occupation analysis using training measures drawn from the Survey of
Managers, establishments which provided training to the largest occupational group were found to be
less likely to close down than those which did not train. This finding is statistically significant for three of
the largest occupational groups: Craft/Related, Personal/Protective Service, and Plant/Machine
Operatives. Equivalent within-occupation analysis using SOCs drawn from the Survey of Employees
finds no statistically significant association between training and establishment closure. However, strong
and significant negative associations between training and establishment closure are found in a within-
industry analysis of the WERS data.
J17473_Skills Report 20 8/3/07 08:28 Page 72

Training and Establishment Survival
____________________________________________________________________________________ 73
In the multivariate probit analysis of establishment closure, we were able to provide more concrete
evidence of the significant relationship between training and establishment closure. After controlling for
other possible determinants of establishment closure (as suggested in previous studies), we still found a
negative and significant impact of training on establishment closure using training measures derived
from the Survey of Managers. The findings suggest that those establishments which provided training
are about 9 percentage points less likely to close down than those which did not train, regardless of
whether they provided less than or at least 2 days of training.
Using an alternative measure of training, that is the proportion of employees receiving training in an
establishment derived from the MQ, we obtained estimates indicating a stronger and significant link
between training and closure. The estimates suggest that those establishments which provided formal
off-the-job training are on average about 10 percentage points less likely to close down than those with
no training. The result about training intensity is also repeated, namely that this effect does not vary
according to the proportion of workers trained. As long as some workers are trained, it appears that
there is an effect on establishment closure. However, we could not find any significant association using
training measures drawn from the Survey of Employees. Nevertheless, the information on training in the
SEQ is not constrained to formal off-the-job training, as such cannot be directly compared to those
training measures derived from the MQ.
Further investigation suggested that the gains from training varied substantially according to which
occupational groups of employees were being trained and according to which industrial groups of
establishments provided training. Our estimates for the MQ suggest that training for two largest
occupational groups of Craft/Related, and Personal/Protective Service occupations was sub-optimal in
1998, in the sense that establishments which trained at least one employee of these largest occupational
groups could generate a lower risk of closure. Using the proportion of employees who received training,
moreover, we found a negative and significant association between training and establishment closure
for establishments with largest occupational groups of Clerical/Secretarial, Craft/Related,
Personal/Protective Service, Plant/Machine Operatives, and Other Occupations. However, there is no
significant association found for Sales workers. From the estimates for the SEQ, in contrast, we could
not found any significant association between training and closure as it was in the bivariate analysis.
Our findings for a breakdown of the MQ sample by industry suggest that training was sub-optimal for
establishments within each of five industry sectors of Construction, Hotels/Restaurants, Manufacturing,
Transport/Communication and Wholesale/Retail, in the sense that establishments which trained either at
least one employee or greater proportions of employees could generate a lower risk of closure. In
J17473_Skills Report 20 8/3/07 08:28 Page 73

Training and Establishment Survival
____________________________________________________________________________________ 74
contrast, we found a positive and significant impact of training on commercial closure for the SIC of
Other Business Services (suggesting that that there might be too much training in this industry).
For other determinants of commercial closure suggested by previous studies, we found that the average
level of the highest educational qualifications of employees sampled in the SEQ has a negative and
significant impact on closure for the whole sample. The share of part-time employees was found to
significantly affect commercial closure in the sense that establishments which employed greater
proportions of part-time workers could generate a lower risk of closure. It was also found that younger
establishments may be exposed to a higher risk of closure. According to our estimates on the size of
establishments, finally, either of very small establishments with 10 to 24 employees or medium and large
establishments with at least 50 employees are less likely to close down than those small establishments
with 25 to 49 employees.
We consider the implications of these findings in Chapter 7.
J17473_Skills Report 20 8/3/07 08:28 Page 74

Training and Establishment Survival
____________________________________________________________________________________ 75
Chapter 6 – The Determinants of Establishment Training
This chapter considers the determinants of employer-provided off-the-job training using the longitudinal
component of the WERS 2004 data. As we have seen in the previous chapter, formal off-the-job training
has an important role in contributing to an establishment’s profitability and medium-term commercial
survival. In this regard, it is important to consider the determinants of training and identify those factors
that may be considered as key drivers in determining the level of training investment across
establishments.
6.1 Introduction and Motivation
Although there are many existing studies of the factors associated with training in establishments, doubt
often remains as to how far such factors are causal determinants of training, and how far merely
correlates of training, with the real cause being some other unobserved factor associated with the
establishment. Most studies present evidence on the determinants of training utilising cross-section data.
Studies based on these data provide a useful insight to training at a given moment in time. They are
unable, however, to shed light on important time-varying processes that may influence the dynamics of
training over time. Neither can they take account of the impact of unobserved heterogeneity, that is,
differences across establishments that are otherwise important in the determination of training but which
are not observed in the data and hence not captured in the empirical modelling.
Failure to control for unobserved heterogeneity will tend to bias upwards estimated coefficients for the
determinants of training. This, in turn, may entail spurious inference decisions. Longitudinal data that
follows establishments at different points in time (i.e. panel data) allows researchers to utilise empirical
frameworks that can control for the effect of time-invariant unobserved heterogeneity. It may also enable
the identification of important time-varying processes that underlie establishments’ decisions to invest in
training. Accordingly, estimates of the determinants of training derived from empirical models utilising
longitudinal data are more likely to yield a true representation of the important causal factors.
To the best of our knowledge, no existing studies utilise longitudinal data to investigate the determinants
of training at the establishment level. This chapter provides a first insight into the use of such data and
provides a comparison of estimates using both standard cross-section and panel based empirical
models. In particular, the chapter sets out to compare estimates obtained through panel and cross-
J17473_Skills Report 20 8/3/07 08:28 Page 75

Training and Establishment Survival
____________________________________________________________________________________ 76
sectional methods in order to determine whether potential biases arising from unobserved heterogeneity
are important. Hence, the reported findings seek to shed light on the perceived wisdom of existing
studies using conventional cross-section data.
6.2 Previous Studies on the Determinants of Training
There have been a large number of empirical studies which examine the determinants of employer
provided training (Greenhalgh and Stewart, 1987; Booth, 1991 & 1993; Green, 1993a & 1993b; Blundell
et al, 1996). Most of these studies construct a reduced form model that combines both supply-side and
demand-side effects in a single equation for estimating training participation, intensity or duration. Such
studies face an array of econometric issues. The most notable of these concerns the issue of
endogeneity and selection. As discussed in Chapter 2, observed outcomes for employer-provided
training are the consequence of a joint decision by employer and employee. Firstly, there is the
employer’s decision to select employees for training. Secondly, there is the decision of these employees
to accept the employer’s offer. Randomized selection procedures onto training schemes are rare.
Accordingly, estimates of the determinants of training that fail to account for selection onto these
schemes run the risk of being correlated with unobservable determinants of training participation.
Techniques to overcome this issue include instrumental variable (IV) and fixed-effects (FE) estimation.
Both of these techniques place great demands on the quality of available data, many of which are simply
not tenable for most cross-section analyses.
Regardless of the choice of econometric modelling, most empirical studies investigating the
determinants of and returns to different types of training focus on those determinants of training that are
commonly assumed to be exogenous as predicted by the human capital model. For example, it is widely
found that training participation declines with both age and job tenure. This is not particularly surprising
but it is at least consistent with seeing training as future-oriented, as all theories maintain. Training
participation is also commonly found to increase with educational attainment. This finding is again
consistent with human capital theory. High ability workers who learn quickly will recognise the benefits of
training. They will also have lower costs for training and hence are more likely to self-select on to
employer-provided training schemes.
Many studies report on the changing degree of discrimination in access to training. Early studies on the
determinants of training report women to receive less training than men. More recent studies, however,
J17473_Skills Report 20 8/3/07 08:28 Page 76

Training and Establishment Survival
____________________________________________________________________________________ 77
suggest the reverse to be true (e.g. Green and Zanchi, 1997). This catch-up of women in training, from
an earlier position in which men had greater access, is associated with the growing participation of
women in the labour market and the changing composition of occupations. By contrast, there has been
no reported change in the incidence of employer-provided training for non-whites: White employees
continue to receive more training than non-whites.
Several studies examine whether unions affect training, and if so how. A simple human capital model
predicts a negative union effect. Conversely, the “voice” model of unionism and non-competitive theories
of training can imply a positive impact. The evidence from U.S. studies is somewhat mixed. Lynch (1992)
reports a significant positive impact of unions on training. By contrast, Mincer (1983) and Frazis,
Gittleman, and Joyce (2000) report a significantly negative impact. Empirical evidence from British
studies is more consistent in this regard. Arulampalam and Booth (1998), Green et al (1999), Harris
(1999), and Boheim and Booth (2004) all demonstrate a robust positive impact of unions on training in
Britain.
Another issue concerns whether training is ‘bundled’ with other HR policies in supporting new work
practices. The introduction of innovative and new work practices under the broad heading of the high-
performance work system raises important issues regarding the compatibility of such practices with skill
formation and the level of training undertaken at the establishment level. Adoption of the high-
performance work system typically necessitates that workers deploy a greater range of skills and identify
more strongly with a specified range of tasks. This implies that new and existing employees require more
training. Studies by Macduffie and Kochan (1995), Osterman (1995), and Whitfield (2000) present
evidence broadly in support of this view.
There are other important findings for which there is general consensus in the empirical literature. For
example, it is commonly found that large organisations provide more training than small organisations.
Having controlled for employer size, public sector establishments provide more training than private
sector establishments. On the demand side, there is also evidence to support the view that technological
change requires more skills: Industries with growing or rapidly changing technology provide more
training. Finally, almost all studies report full-time employees to receive more training than part-time
employees.
J17473_Skills Report 20 8/3/07 08:28 Page 77
Training and Establishment Survival
____________________________________________________________________________________ 78
6.3 Data Overview
The data utilized in this Chapter of the Report are drawn from the longitudinal component of the WERS
2004 data. The 1998-2004 Panel Survey in WERS 2004 was selected from the WERS 98 achieved
sample of 2,191 cross-section interviews using a stratified random sample defined by establishment size
at the time of the 1998 interview. Some 1,479 workplaces from the 1998 Cross-Section were selected to
be traced for re-interview in 2004. The same restrictions of scope were reapplied to the subset of
workplaces that were still in existence in 2004 and therefore eligible for re-interview in the second wave
of the panel. Hence, for the purposes of the second-wave interview, a continuing workplace was defined
as one that was in-scope in both 1998 and 2004 and that had continued to operate throughout the
intervening period.
The survey yielded a response rate of 77 per cent with an achieved sample of 956 continuing
workplaces. From these, 938 establishments were re-interviewed with the express purpose of
investigating changes that had taken place in those establishments over the preceding six years. The
longitudinal component of the WERS 2004 data provides a rich source of establishment information
regarding recruitment and training, workforce composition, the organisation of work, and employee
representation amongst others. However, not all of the questions asked of respondents in 1998 are
subsequently re-asked in 2004. Hence, whilst the panel provides some insight into change within
establishments in recent years, it does not provide complete coverage of all the issues identified in the
WERS 98 cross-section.
We restrict analysis to those establishments in the survey who provide valid responses across a range of
questions commonly identified as important in empirical studies of this sort. This restriction to deal with
missing or incomplete information yields a final sample of 898 establishments, each of which is observed
across both years. Table 6.3.1 reports the incidence of off-the-job training for the largest occupational
group in these 898 establishments in 1998 and also 2004. After taking into account the sample weights,
83.0% of establishments are identified as providing off-the-job training to the largest occupational group
in 1998. This figure rises to 89.3% in 2004. The incidence of off-the-job training observed for these
establishments is slightly higher than that reported in Chapter 4 for the WERS 98 and WERS 2004
cross-section data (75.8% and 84.2% respectively). The increase in off-the-job training over the six year
period is also slightly smaller. Nonetheless, the data once again reveals a significant increase in training
provision over this relatively short time frame.
J17473_Skills Report 20 8/3/07 08:28 Page 78

Training and Establishment Survival
____________________________________________________________________________________ 79
Table 6.3.1 - Distribution of Training Provided to Largest Occupational Group in Establishment
No Training Training Total
No. of Ests 97 801 898
(%) (10.8) (89.2) (100) Year 1998
(weighted %) (17.1) (83.0) (100)
No. of Ests 47 851 898
(%) (5.2) (94.8) (100) Year 2004
(weighted %) (10.7) (89.3) (100) The weights used for 1998 is est_wt and those for 2004 is estwtnr.
Table 6.3.2 sheds further light on this increase in training and reports the associated transition
probabilities for training and non-training establishments across the period as a whole. The unweighted
data reveals that of the 97 non-training establishments in 1998, 15% continued as non-training
establishments in 2004. Hence, 85% of non-training establishments in 1998 switched to being training
providers over this relatively short period. Conversely, of the 801 training establishments in 1998, only
4% switched to being non-training establishments over the same period.
Table 6.3.2 - Transitions in the Incidence of Off-the-job Training Provided to Largest Occupational Group in Establishment
Year 2004
No Training Training Total
No Training 15 82 97
(%) (15.5) (84.5) (100)
Training 32 769 801Year 1998
(%) (4.0) (96.0) (100)
Total 47 851 898
(%) (5.2) (94.8) (100)
Additional insight into trends in training investment over this period is gleaned from a further breakdown
of employer provided off-the-job training at the establishment level which considers the proportion of the
largest occupational group for which training is provided. Table 6.3.3 reports the distribution of training
J17473_Skills Report 20 8/3/07 08:28 Page 79

Training and Establishment Survival
____________________________________________________________________________________ 80
investments as measured by the proportion of employees receiving training in the largest occupational
group. Consistent with Table 6.3.1, the weighted analyses in Table 6.3.3 report that 17.1% of
establishments in 1998 provided no off-the-job training whatsoever for the largest occupational group. By
contrast, 22.3% of establishments provided training to 100% of the workforce in that group i.e. complete
coverage.
Table 6.3.3 - Distribution of Training by Proportion of Trained Employees in the Largest Occupational Group by Year
Year 1998 Year 2004 Share of Trained Emps. No. of Ests % Weighted % No. of Ests % Weighted %
None (0%) 97 10.8 17.1 47 5.2 10.7 Just a few (1-19%) 172 19.2 23.9 113 12.6 13.0 Some (20-39%) 148 16.5 15.0 135 15.0 14.3 Around half (40-59%) 103 11.5 8.0 107 11.9 7.2 Most (60-79%) 109 12.1 7.6 123 13.7 15.0 Almost all (80-99%) 105 11.7 6.2 168 18.7 15.3 All (100%) 164 18.3 22.3 205 22.8 24.5
Total 898 100 100 898 100 100
If we exclude the non-training establishments, a further 38.9% of establishments interviewed in 1998
provided off-the-job training to less than 40% of employees in the largest occupational group. This latter
proportion of establishments falls by some 11 percentage points in 2004 and coincides with a sizeable
increase in the proportion of establishments providing training to more than 60% of the largest
occupational group over this limited six-year period.
6.4 Multivariate Analysis of the Determinants of Establishment Training
In this section, we focus on employer-provided off-the-job training and investigate the role of unobserved
establishment heterogeneity on the determinants of establishment training. In particular, we consider the
evidence presented in Section 6.2 and investigate the impact of unobserved heterogeneity on an array
of observable establishment characteristics which are commonly agreed upon in the empirical literature
to be important determinants of training.
J17473_Skills Report 20 8/3/07 08:28 Page 80

Training and Establishment Survival
____________________________________________________________________________________ 81
We adopt a two-step approach to the analysis of the determinants of training. First, we estimate a pooled
OLS cross-section training equation of the form:
it i itT x (6.1)
where itT is the proportion of workers (in the largest occupational group) receiving off-the-job training in
establishment i, is the constant, ix is a vector of establishment characteristics, is a vector of
parameters to be estimated, and it is a random disturbance term.
Second, we use an econometric technique that takes into account the panel nature of the data and
estimate a fixed-effects model where unobserved establishment-specific heterogeneity is assumed to be
time-invariant but correlated with explanatory variables. The basic framework is a regression model of
the form:
1 1it i it itT x , i , ,N t , ,T , (6.2)
where itT is the proportion of workers (in the largest occupational group) receiving off-the-job training in
establishment i at time t, i is an establishment-specific component of training reflecting unobserved
establishment characteristics (possibly correlated with the observables), and it is a random error term
independently and identically distributed over i and t. The i are eliminated in the standard way (by
differencing from individual means) to produce the fixed-effects (or within) estimator. The fixed-effects
estimator produces consistent and efficient estimates of the parameters when the time-invariant effects
are assumed correlated with the regressors.
6.4.1 The Determinants of Establishment Training
Columns (1) and (2) of Table 6.4.1 report unweighted and weighted estimates for the determinants of
training using a pooled OLS specification. Column (1) reports the unweighted estimates. These
estimates appear to be both meaningful and appropriate in that they are consistent with the evidence
presented in previous studies, and hence what would be expected a priori. Having controlled for time,
industry and occupation, the proportion of training undertaken in the largest occupational group is
significantly greater for large organisations and establishments with formal union recognition. The
J17473_Skills Report 20 8/3/07 08:28 Page 81

Training and Establishment Survival
____________________________________________________________________________________ 82
proportion of employees receiving training is also greater for those establishments that employ a
strategy for employee development, flexible working, and/or profit sharing.
Table 6.4.1 – The Determinants of Establishment Training
Dependent Variable Proportion of Employees Receiving Training
Regressors OLS Weighted OLS FE Weighted FE
Proportion of Part-Time Employees -0.172 -0.226 -0.013 0.281 (3.58)^ (2.20)+ (0.12) (1.50)
Proportion of Ethnic Employees 0.002 -0.151 0.154 -0.587 (0.03) (1.10) (0.86) (1.53)
Proportion of Female Employees 0.082 0.160 -0.213 -0.490 (1.55) (1.61) (1.62) (2.14)
Organisation Size (Reference: <100) 100 & <1,000 Employees 0.062 0.074 0.097 0.017
(2.20)+ (1.34) (1.82)* (0.19) 1,000 & <10,000 Employees 0.069 0.108 0.056 0.161
(2.33)+ (2.07)+ (0.97) (1.84)* 10,000 Employees 0.075 0.104 0.077 0.279
(2.44)+ (1.76)* (1.24) (2.61)^ Full/Part Foreign Owned -0.021 -0.052 -0.008 -0.023
(1.09) (1.27) (0.33) (0.57) Union Recognition 0.052 0.123 0.030 0.096
(2.34)+ (2.63)^ (0.68) (1.13) Profit Sharing 0.040 0.001 0.038 0.038
(1.98)+ (0.03) (1.28) (0.51) Strategy for Employee Development 0.140 0.097 0.075 0.093
(6.76)^ (2.31)+ (2.44)+ (1.75)* Work Life Practices 0.038 0.062 0.023 0.002
(1.93)* (1.64) (0.83) (0.04)
Industry (1-digit SIC) Yes Yes Yes YesLargest occupational group in 1998 Yes Yes Yes YesYear Yes Yes Yes Yes
R2 0.19 0.27 0.68 0.73 NT 1,678 1,678 1,678 1,678 Sample: All establishments with 10 or more employees. Robust t statistics are in parentheses. * significant at 10%; + significant at 5%; ^ significant at 1%.
J17473_Skills Report 20 8/3/07 08:28 Page 82
Training and Establishment Survival
____________________________________________________________________________________ 83
Interestingly, the pooled cross-section analysis finds no significant impact for either gender or ethnicity.
A statistically significant negative impact on establishment training is found for the proportion of part-time
employees. This result is consistent with previous studies and economic theory. Part-time workers have
a shorter period over which training investments can provide an economic return. Accordingly, we would
expect establishments with a high proportion of part-time workers to invest less in training.
Column (2) reports weighted OLS estimates using the panel survey weights. These weights take into
account the sample design of WERS 2004 and should be used if one wishes to obtain unbiased
population estimates of the determinants of establishment training. The weighted estimates are broadly
consistent with the unweighted estimates. Union recognition, organisation size and a strategy for
employee development continue to exert positive and statistically significant impacts on training
investment. For example, moving from an organisation with less than 100 employees to one with 1,000
employees or more raises the proportion of employees in the largest occupational group receiving
training by approximately ten percentage points. Once again, a higher proportion of part-time employees
yields a statistically significant negative impact on establishment training. There is no statistically
significant impact on establishment training from either gender or ethnicity.
These results concerning the importance of establishment variables in explaining training investments
are consistent with previous cross-section studies that investigate the determinants of training. They are
also consistent in being able to account for only a small part of the total variation in establishment
training as seen in the R2 values reported in the diagnostics. Of course, pooled/cross-section estimates
cannot control for unobserved differences between establishments which are correlated with their
training investments. These unobserved establishment-specific differences may help to explain the
statistical significance of observable establishment characteristics. For example, a positive impact on
training for organisation size is commonly agreed upon. Nevertheless, it may be that organisation size is
not important. Rather, it may be that some unobserved characteristics of large organisations have a
significant and positive effect on the level of training investment. These unobserved establishment
differences may also explain the remaining unexplained variation in establishment training that is
common to most cross-section studies.
Columns (3) and (4) present fixed-effects estimates of the determinants of establishment training. We
utilise the panel component of the data to estimate the fixed-effects specification of equation (6.2) which
is able to account for unobserved characteristics of establishments that remain fixed over time. Column
(3) reports unweighted estimates whilst Column (4) reports the weighted estimates that take into account
the sample design of the WERS 2004 data.
J17473_Skills Report 20 8/3/07 08:28 Page 83
Training and Establishment Survival
____________________________________________________________________________________ 84
Contrasting these results with the pooled cross-section results in Columns (1) and (2) highlights a
number of important issues and reveals some interesting findings. As anticipated, a comparison of the
unweighted estimates reveals the inclusion of establishment fixed-effects to significantly reduce the size
and significance of many of the reported coefficients. Another notable feature of the results is the high
proportion of the variation in training investment between establishments that is now ‘explained’: The R2
in Column (1) rises from 19% to 68% in Column (3) once establishment fixed-effects are accounted for.
Despite the fall in the magnitude and significance of parameter estimates reported in Column (3),
organisation size continues to have a positive impact on establishment training. Having a strategy for
employee development also remains important. By contrast, the estimates regarding workforce
composition are more surprising. In contrast to the pooled OLS estimates presented in Columns (1) and
(2), the fixed-effects results in Columns (3) and (4) reveal the proportion of part-time employees to have
no significant impact on establishment training. Conversely, the proportion of female employees in the
establishment has a significant negative impact on establishment training. This finding contrasts with
recent evidence by Green and Zanchi (1997) but is consistent with the findings of Arulampalam and
Booth (1997), and Booth (1991) using British data.
6.5 Summary of Chapter 6
In Chapter 6, we have endeavored to investigate the determinants of establishment training utilizing
longitudinal data drawn from WERS 2004. The use of longitudinal data enables us to take into
consideration the impact of unobserved establishment characteristics which may be important in the
determination of training but which are not otherwise observed in cross-section analyses. To the best of
our knowledge, no existing studies utilise longitudinal data to investigate the determinants of training at
the establishment level. Accordingly, this Chapter provides a first insight into the use of such data and
has an important contribution in identifying whether potential biases arising from unobserved
heterogeneity have important implications for the findings of previous studies which are based on cross-
section data.
The important result in this Chapter is that unobserved characteristics of establishments that remain
fixed over time are an important determinant of establishment training. We find that the inclusion of
establishment fixed-effects is important for explaining significant variation in training between
establishments. Nevertheless, establishment characteristics identified as important in previous studies of
J17473_Skills Report 20 8/3/07 08:28 Page 84

Training and Establishment Survival
____________________________________________________________________________________ 85
the determinants of training, continue to be important once we have controlled for the effect of
unobservable (time-invariant) establishment heterogeneity. Hence, organisation size has a positive
effect on the proportion of employees trained in the largest occupational group. A higher proportion of
female employees is shown to have a negative effect. Thus, the main findings cited in previous studies
of the determinants of training appear robust to the longitudinal analysis of the WERS 2004 data.
J17473_Skills Report 20 8/3/07 08:28 Page 85
Training and Establishment Survival
____________________________________________________________________________________ 86
Chapter 7 - Summary & Conclusions
In this chapter we summarise the main empirical conclusions from our analyses, consider how they
might be interpreted, and draw out some of the policy implications.
7.1 Key Findings
7.1.1 The Link Between Training and Establishment Closure.
Our main findings, reported in Chapter 5 in detail, provide supportive evidence of a statistically
significant and substantial link between training participation and the commercial survival of
establishments. These findings throw light on the link between training and long-term profitability of
companies.
In the “raw” data, it was found that more than 27% of non-training establishments (those that did not
provide off-the-job training to any of the workers in the largest occupational group in the establishment)
closed for business over the 1998-2004 period, while only 11% of training establishments closed down.
Confirmation is provided by the separate reports of training provided by the employees.
Some of this difference between training and non-training establishments could be accounted for by the
fact that there were also differences in a number of other established characteristics. After controlling for
industry, occupation and a number of other variables that are expected to affect establishment survival
chances, the estimate of the association between training participation and closure is much reduced, but
remains substantial and statistically significant. The estimates indicate that, after allowing for all other
observable factors, trainers are 9 percentage points less likely to close than trainers. Again, confirmation
about the direction of this effect, though not the precise magnitude, comes from the employee-provided
data.
We interpret the findings as evidence that, compared with the non-trainers, the training investment made
by the trainers on average provided an above-normal rate of return, thereby lowering the risk of
establishment closure. This interpretation is subject to the usual caveats about inferences drawn from a
cross-section. Although we have been able to control for other determinants of establishment closure as
suggested by previous studies, and although the training investment in 1998 is a pre-determined
variable in relation to subsequent decisions taken from 1999 to 2004, it remains possible that there are
J17473_Skills Report 20 8/3/07 08:28 Page 86
Training and Establishment Survival
____________________________________________________________________________________ 87
other factors that might affect establishment closure which are also correlated with the 1998 training
investment. In fact, it seems likely that many of the establishments which provide no training to the
largest occupational group amongst their employees, are neglecting the development of the workforce in
a number of other informal ways also. In so far as that is the case, the estimates reported here might be
ascribing too much importance to the formal off-the-job training per se rather than the accompanying
factors. Even if that is the case, the fact remains that the provision of training appears to be positively
related to establishment survival chances, and hence that both training and any accompanying
developmental policies should be introduced in those establishments that neglect them if the employers
wish to improve their chances of commercial survival. It may be noted that in 1998 some 24 percent of
establishments neglected to provide formal training to their employees in the largest occupational group,
a remarkably large proportion in a supposedly “knowledge economy”, though since many of these non-
trainers were smaller establishments they represented only 13.5% of employment. The encouraging
news is that the proportion of non-trainers had fallen to 16% of establishments by 2004.
There are some differences in the impacts of training on establishment survival within the occupational
and industrial sub-groups for which it has been possible to carry out separate analyses. Nevertheless,
for most of the sub-groups the negative association between training participation and closure is
repeated, in most cases at an acceptable level of statistical significance. Among the industries, an
exception is the Other Business Services industry for which we found a positive and significant impact of
training on commercial closure. Since this is the only exception no firm conclusions should be taken
about training participation in that industry without further investigation. A negative and significant effect
was found in respect of each of the single-digit occupations.
The evidence about the relationship between training intensity – measured either by the average number
of days training per employee trained or by the proportion of employees receiving training – and
establishment closure is much less decisive. Indeed, in the main results using the management
responses we could find no significant relationship. With the employee responses a relationship with
intensity is found, but the association is not very precisely determined. While the lack of precision for the
employee data is partly down to small numbers, especially in some specifications, it remains the case
that one cannot statistically reject the hypothesis that, once there is some participation in training, there
is no further relationship between training intensity and establishment survival.
At first sight, it might appear puzzling that training participation is associated with better chances of
commercial survival, while the amount of training appears to make little difference. This finding differs
from previous work, covering the early part of the 1990s, which had indicated that training participation
J17473_Skills Report 20 8/3/07 08:28 Page 87

Training and Establishment Survival
____________________________________________________________________________________ 88
and increased training among participants had some positive benefits for the chances of survival. There
are at least two potential interpretations that can be drawn.
First, it might be argued that the data on the extent of training is subject to undue measurement error. It
might be the case that managers have a very good idea about whether the workers in a particular group
have received training, but that when it comes to assessing whether they have had, on average, two,
four or eight days training over the course of a year, their powers of recall are insufficient. If the training
intensity measure is subject to large error, it follows from a well known statistical proof that the estimates
of its impact in a regression would be downward biased. Thus, we might simply be missing the result
because we cannot accurately distinguish between the high-trainers and the low-trainers.
We cannot here assess comprehensively the reliability of the training intensity data. However, we think
that measurement error is unlikely to be an adequate explanation for finding hardly any link between
training intensity and closure in the management-derived data. Though one can concede that fine
distinctions between, say, three or four days, might be difficult to make accurately, the difference
between a little training, say of one or two days, and a lot of training, say of a week or more, would in our
view be apparent to most managers responding to the survey.
An alternative potential explanation is that, among those establishments that do engage in formal off-the-
job training for at least some of the continuing employees in the largest occupational group, the
managers are able to choose something approximating the optimal amount of training, so that raising or
lowering their training at the margin makes relatively little difference to their profitability. In other words, it
may be that most modern managers in training establishments, in a world where training has become
more widespread than in the early 1990s, have become better attuned than their earlier counterparts to
making reasonably well-informed judgements about the efficacy of training and hence about optimal
amounts of training. In contrast, it may be that many of the managers in establishments that do no
training at all have given insufficient thought to the benefits of training. If they did train, their long-term
profitability and survival chances would be improved; the fact that they do not implies that they
underinvest in training. In this explanation, there is in effect a barrier or threshold to be overcome: not
tackling the training question is perhaps easy for managers in the short run, and it avoids the need for
long-term planning. Once you have decided to provide some training, however, you may be more likely
to calculate more rationally or strategically the level of training that is needed for the establishment. To
do this, you may invest time also in assessing the effectiveness of the training that takes place, and so
be better informed, and perhaps in a more influential position within the company so as to make a
difference to the decision made.
J17473_Skills Report 20 8/3/07 08:28 Page 88
Training and Establishment Survival
____________________________________________________________________________________ 89
This explanation is offered as one plausible post-hoc rationale for our finding. We have not here pursued
the idea further. To examine the issue further one would first want to test whether non-trainers tend to
consider the benefits and costs of training in a rational and strategic manner, or whether they simply
neglect the question. Among the trainers, the issue would be whether the amount of resources devoted
to deciding and influencing the training level in the establishment (as opposed to implementing the
training) is related to training intensity. If our explanation is right, we might expect to find that low-
intensity trainers are as well-placed as high-intensity trainers when it comes to making the right training
decision.
7.1.2 The Determinants of Training in a Panel of Establishments
Our findings in Chapter 6 provide credence to previous studies on the determinants of training in
identifying an important role for establishment characteristics. Our empirical framework exploits the
longitudinal component of the WERS 2004 data and estimates the determinants of establishment
training having controlled for unobservable (time-invariant) differences between establishments that are
otherwise not discernable in cross-section data. These unobserved differences are found to be
important in explaining variation in training across establishments. They do not, however, diminish the
impact of those observable causal determinants of training which are commonly identified in cross-
section studies.
Having controlled for unobserved establishment heterogeneity and other important causal effects,
significant positive impacts for training are found in relation both to organization size and whether the
establishment has a strategy for employee development. There is also a significant negative impact for
the proportion of female employees. Ceteris paribus, a higher proportion of female employees in the
establishment reduces the proportion of employees (in the largest occupational group) receiving training.
The reasons for this gender bias have not been investigated and therefore need further examination.
One reason might be that female employees often bear a greater proportion of family responsibilities and
may therefore be absent from work for greater period over their working lives: employers will be less
inclined to invest in training where the returns to training are more uncertain.
Given the evidence of a statistically significant and substantial link between training participation and the
commercial survival of establishments reported in Chapter 5, the finding of a significant gender bias in
establishment training suggests an important role for government and education providers alike to set
out more clearly the benefits of training even when faced with an uncertain environment. There is also
J17473_Skills Report 20 8/3/07 08:28 Page 89
Training and Establishment Survival
____________________________________________________________________________________ 90
supportive evidence for government agencies to promote greater awareness amongst business of the
need to develop strategies for employee development. Developing a strategy for employee development
raises awareness within the establishment of both employer and employee needs. This increased
awareness can help stimulate and direct training investments where they are most needed. In turn,
improved efficacy in training investments may raise future profitability and hence medium-term
commercial survival.
7.2 Policy Implications
As indicated in Chapter 1 of this report, findings about the relationship between training and
establishment survival have a potential bearing on policy-making in the field of training. We suggested
there that, if no relationship were to be found between training and establishment closure, this would
imply that on average managers were succeeding in choosing an approximately optimal level of training
in this uncertain world. But if more training led to increased chances of survival, this would imply that the
companies doing less (or no) training were underinvesting in training. Such underinvestment, it should
be noted, would be sub-optimal from the private point of view of the employer, in the sense that, if it
occurs, the employer could improve long-term profitability by making a better training decision. If private
underinvestment does not occur, and the level of training is, as far as can be discerned from the data,
optimal from the employer’s private point of view, this does not necessarily obviate the need for public
intervention in the training market. As is well-known, training has external benefits that arise through
labour mobility, whereby other employers can benefit from the training provided and funded by the
current employer (Stevens, 1999). And training might be constrained in other ways, for example by
capital market limitations facing employees. The case for, or against, training market interventions for
these reasons is not affected by the findings reported in this paper. Rather, the question being
addressed here is whether employers are themselves taking the best decisions in their own long-term
interests and, if not, what policy conclusions follow.
This approach to policy-making theory is, it should be noted, not a conventional one among economic
theorists, who typically assume that employers always take the best decisions in their own interests.
Notwithstanding this economic approach, a number of policy approaches in recent decades have really
been premised on the idea that it may be possible to persuade businesses to raise their level of training,
and more generally their investments in employee development. This has led to two schools of thought.
On one hand, there are those who believe that many businesses are open to guidance, advocacy and
J17473_Skills Report 20 8/3/07 08:28 Page 90
Training and Establishment Survival
____________________________________________________________________________________ 91
ultimately persuadable about the benefits of training. On the other hand there are those who argue that
employers and managers can and should decide on their own, without intervention or advice, what is
best in their own businesses.
If the interpretation of the findings of this study are correct, it is implied that there were at least some
businesses in 1998 where a better approach to decision-making could have improved their long-term
prospects, in that they would have been still there in 2004, while others might have made more long-
term profits even though they survived. These were the non-trainers, who experienced significantly
higher rates of establishment closure. This finding cannot be dismissed as something to do with the
sector, industry, occupation or any of the other factors that might be linked to establishment success,
such as the age and size of the establishment. The value of studies like the current one is that, in
principle, it can be used as part of the evidence to be used to demonstrate the advantages of becoming
a training establishment. As suggested in Chapter 1, the evidence is itself a public good, like many other
pieces of useful information, from which many employers could benefit.
The findings imply that it would be prudent for policy-makers pursuing the route of persuasion and
advice to employers to focus their attention on non-training establishments. These are a minority of
establishments, though probably harder to reach than those already engaging in training. This inference
that policy should focus on non-trainers appears to hold in respect of most of the sub-groups that we
considered in the project, although our findings here are more tentative in a number of cases owing to
the small numbers in the relevant sub-samples. On the bright side, it should be noted, the proportion of
non-training establishments was, at 16%, much lower in 2004 than it had been in 1998 when 24% were
non-trainers – see Table 7.2.1. Whether this fall is attributable to policy and institutional influences over
this period is not assessed here, but the implication is that the number of establishments where less than
optimal training decisions are now being taken appears to be quite a lot less than in the past.
The finding that, among training establishments, the intensity of training is not significantly related to the
probability of survival should make one think twice about trying to advise private employers who are
already doing some training of the need to train more. If the findings are accepted at least provisionally
(which means accepting that the measurement error is not too high), it suggests that persuasive efforts
by policy-makers to influence the quantity of training among these already-training establishments would
not be effective because they would be perceived as trying to improve upon the already-optimal
decisions taken by the employers themselves. If intervention among training establishments were to be
justified, then, it would have to be on the basis that there are significant benefits external to the firm,
which would thereby merit financial incentives of one form or another to increase training, rather than
J17473_Skills Report 20 8/3/07 08:28 Page 91
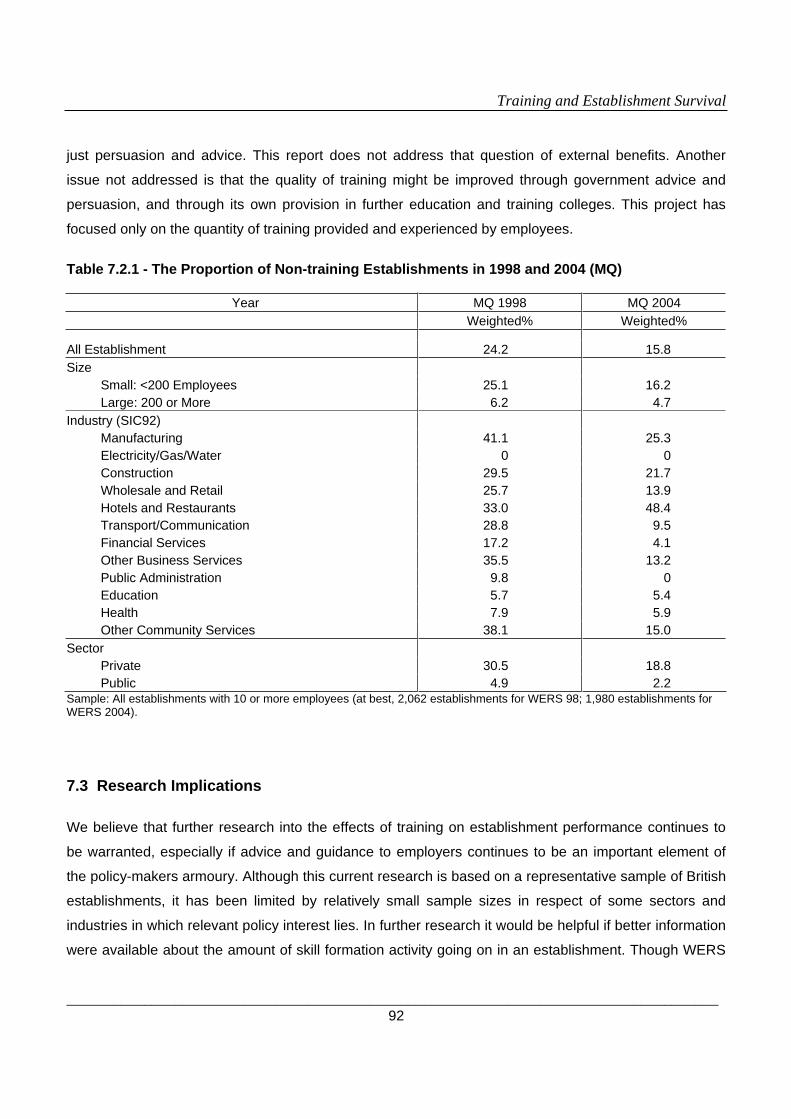
Training and Establishment Survival
____________________________________________________________________________________ 92
just persuasion and advice. This report does not address that question of external benefits. Another
issue not addressed is that the quality of training might be improved through government advice and
persuasion, and through its own provision in further education and training colleges. This project has
focused only on the quantity of training provided and experienced by employees.
Table 7.2.1 - The Proportion of Non-training Establishments in 1998 and 2004 (MQ)
Year MQ 1998 MQ 2004 Weighted% Weighted%
All Establishment 24.2 15.8Size Small: <200 Employees 25.1 16.2 Large: 200 or More 6.2 4.7Industry (SIC92) Manufacturing 41.1 25.3 Electricity/Gas/Water 0 0 Construction 29.5 21.7 Wholesale and Retail 25.7 13.9 Hotels and Restaurants 33.0 48.4 Transport/Communication 28.8 9.5 Financial Services 17.2 4.1 Other Business Services 35.5 13.2 Public Administration 9.8 0 Education 5.7 5.4 Health 7.9 5.9 Other Community Services 38.1 15.0Sector Private 30.5 18.8 Public 4.9 2.2Sample: All establishments with 10 or more employees (at best, 2,062 establishments for WERS 98; 1,980 establishments for WERS 2004).
7.3 Research Implications
We believe that further research into the effects of training on establishment performance continues to
be warranted, especially if advice and guidance to employers continues to be an important element of
the policy-makers armoury. Although this current research is based on a representative sample of British
establishments, it has been limited by relatively small sample sizes in respect of some sectors and
industries in which relevant policy interest lies. In further research it would be helpful if better information
were available about the amount of skill formation activity going on in an establishment. Though WERS
J17473_Skills Report 20 8/3/07 08:28 Page 92

Training and Establishment Survival
____________________________________________________________________________________ 93
98 and WERS 2004 were not primarily surveys about skill formation, we believe that skill formation is so
central to modern establishments and to the thinking of policy-makers that it is regrettable that the
WERS surveys, which are not confined to traditional industrial relations issues, should not have
embraced a wider measure of skill formation. As it is, we have made use of the good data it provides on
the off-the-job training of the largest non-managerial occupation in the establishment, but do not have
information on informal training for that group, or about any training for other staff in the establishment
except through the employee survey. The latter has proved a very useful source of information, but it is
also limited by the sampling procedure, which is restricted to at most 25 respondents per establishment,
and is subject to an additional non-response rate. In some respects, the management-based data on
skill formation is not as full as was obtained in 1991/2 in the Employer Manpower Practices and Skills
Survey, which followed up on the establishments sampled in the 1990 Workplace Industrial Relations
Survey.
Apart from further fleshing out the findings of this report, further research along similar lines in the future
could also be expected to track improvements over time, to see whether further awareness of training’s
benefits is filtering through to managers in the course of a decade or more of policy and advice. We have
also alluded already above to the benefits of pursuing further the potential explanation that we have
offered for the finding that it is participation that makes a difference to establishment survival, rather than
greater training intensity among already-training establishments. In short, we think that not enough may
be known about the attitudes and practices of the non-trainers, and that more information may be helpful
in confirming our hypothesis and in formulating approaches to address the issue of a lack of a strategic
approach to deciding about training. Knowledge gleaned from the findings of this study may contribute in
assisting non-trainers to consider training in a more rational and strategic way. It may also help to
stimulate greater awareness and understanding of the longer-term impacts of training in such a way as
to encourage businesses to no longer consider training as an arbitrary response to imposed market
conditions and/or government initiatives but instead recognise training as an integral aspect of business
strategy, planning and investment. If and when a new WERS is undertaken, and assuming it were to
include a panel element as last time, it will be possible to evaluate the extent to which the non-training
establishments in the 2004 sample have indeed put themselves at increased risk of closure.
In addition to establishing further information regarding the extent to which training’s benefits is
recognised and understood by non-training establishments, further research could also be undertaken to
establish the relevance of training to sectoral need. This study has reported evidence of significant
differences in the impacts of training on establishment survival across occupational and industrial sub-
J17473_Skills Report 20 8/3/07 08:28 Page 93

Training and Establishment Survival
____________________________________________________________________________________ 94
groups. Data limitations prevent us from undertaking a more detailed evaluation of training across these
sub-groups. In particular, we are unable to accurately assess the extent to which the quality and type of
training differs across such groups and the degree to which these differences reflect differences in
training needs. Information gleaned from future data sources incorporating a larger sampling frame and
more detailed enquiry of training provision would permit additional analysis of these important issues. It
may also facilitate further consideration of the mechanisms by which human capital impacts on
establishment survival. The current study utilises information drawn from a random (weighted) sample of
25 employees in each establishment to report evidence of a modest but significant negative impact of
the average level of employees’ educational attainment on establishment closure. This impact is
independent of the negative impact identified for training on establishment survival. Greater coverage of
establishments using matched employer-employee data would provide additional insight into the
distribution of human capital across the population of establishments and permit more robust analyses at
the industry and occupation level.
Finally, it should be possible in future research about training and establishment performance to look
also into the assumption underpinning this project concerning the link between profitability and survival.
For a minority of establishments in surveys like WERS it is increasingly becoming possible to link the
survey data with administrative data sets covering objective performance data, including productivity and
financial performance data drawn from public accounts. We have presented the findings of this report in
terms of the predicted impact on the probability of survival, but have not converted the findings to
estimates of their impacts on profits. With long-term profits data over a number of years imputed from
matched data sets, it should be possible to calibrate survival probabilities against profit rates, and also in
future projects to estimate directly the relationship between training and long-term profitability.
Alternatively, if suitable data on the costs of training were also available one could, with matched data,
compute direct estimates of the rate of return to training expenditures. Unfortunately, it is somewhat
unlikely that adequate data to fulfill these possibilities will be available in the near future. This project has
been pragmatic in taking advantage of existing data, and taken the objective fact of establishment
survival or closure as a good first indication of long-term profitability. We think that further projects
making the same assumption may be useful in future years.
J17473_Skills Report 20 8/3/07 08:28 Page 94
Training and Establishment Survival
____________________________________________________________________________________ 95
Annex I: References
Acemoglu, D. and J.-S. Pischke (1999). “The Structure of Wages and Investment in General Training.” Journal of Political Economy 107 (3): 539-572.
Agarwal, R. (1996). “Technological Activity and Survival of Firms.” Economics Letters 52 (1): 101-108.
Albaladejo, M. and H. Romijn (2001). “Determinants of Innovation Capability in Small UK Firms.” ESIC Working Paper No. 00.13.
Alba-Ramirez, A. (1994). “Formal Training, Temporary Contracts, Productivity and Wages in Spain.” Oxford Bulletin of Economics and Statistics 56 (2): 151-170.
Appelbaum, E., T. Bailey and A. L. Kalleberg (2000). “Manufacturing Advantage: Why High-Performance Work Systems Pay Off’.” Ithaca and London, Cornell University Press.
Arulampalam, W. and A.L.Booth (1997). “Who Gets over the Training Hurdle? A Study of the Training Experiences of Young Men and Women in Britain.” Journal of Population Economics 10 (2): 197-217.
Arulampalam, W. and A.L. Booth (1998). “Training and Labour Market Flexibility: Is There a Trade-off?” British Journal of Industrial Relations 36 (4): 521-36.
Ashton D. and J. Sung (2005). Supporting Workplace Learning for High Performance Working, ILO.
Barrett, A., B. Hovels, P. den Boer and G. Kraayvanger (1998). “Exploring the Returns to Continuing Vocational Training in Enterprises: A Review of Research Within and Outside of the European Union.” Thessaloniki, CEDEFOP.
Barron, J. M., D. A. Black and M. A. Loewenstein (1989). “Job Matching and On-the-Job Training.” Journal of Labor Economics (7): 1-19.
Bartel, A. P. (1995). “Training, Wage Growth, and Job Performance: Evidence from a Company Database.” Journal of Labor Economics 13 (3): 401-425.
Bartel, A. P. (2000). “Measuring the Employer's Return on Investments in Training: Evidence from the Literature.” Industrial Relations 39 (3): 502-524.
Bishop, J. H. (1994). “The Impact of Previous Training on Productivity and Wages.” Training and the Private Sector. International Comparisons. L. M. Lynch. Chicago, University of Chicago Press.
Bishop, J. (1997). “What Do We Know about Employer Provided Training.” Research in Labor Economics 16 (1-87).
Black, S. E. and L. M. Lynch (2001). “How to Compete: The Impact of Workplace Practices and Information Technology on Productivity.” Review of Economics and Statistics 83 (3): 434-445.
Blundell, R., L. Dearden and C. Meghir (1996). “The Determinants and Effects of Work-Related Training in Britain.” London, Institute for Fiscal Studies.
J17473_Skills Report 20 8/3/07 08:28 Page 95
Training and Establishment Survival
____________________________________________________________________________________ 96
Boheim, R. and A.L. Booth (2004). “Trade Union Presence and Employer-Provided Training in Britain.” Industrial Relations 43 (3): 520-545.
Booth, A. L. (1991). “Job-related Formal Training: Who Receives It and What Is It Worth?'', Oxford Bulletin of Economics and Statistics 53 (3): 281-94.
Booth, A. L. (1993). “Private Sector Training and Graduate Earnings.'' The Review of Economics and Statistics 75 (1): 164-70.
Booth, A. L.and G. Zoega (2000). “Why Do Firms Invest in General Training? “Good” Firms and “Bad” Firms as a Source of Monopsony Power.” CEPR Discussion Papers 2536, Centre for Economic Policy and Research.
Booth, A. L., M. Francesconi and G. Zoega (2003). “Unions, Work-related Training, and Wages.” Industrial and Labor Relations Review 57 (October): 68-91.
Bryson, A. (2001). “Employee Voice, Workplace Closure and Employment Growth.” London, Policy Studies Institute.
Cabinet Office (2001). “In Demand: Adult Skills for the 21st Century.” London, Cabinet Office.
Card, D. (2000). “Estimating the Return to Schooling: Progress on Some Persistent Econometric Problems.” Econometrica, 69 (5): 1127-1160.
Centre for Educational Research and Innovation (1998). Human Capital Investment. An International Comparison. Paris, OECD.
Collier, W., F. Green and J.Peirson (2005). “Training and Establishment Survival.” Scottish Journal of Political Economy 52 (5): 710-35.
Colombo, M. G. and M. Delmastro (2001). “Technology Use and Plant Closure.” Research Policy 30(1): 21-34.
Cosh, A., A. Hughes, A. Bullock and M. Potton (2003), “The Relationship between Training and Business Performance.” Reseach Report RR454, Department for Education and Skills.
Dearden, L., S. Machin, H. Reed, and D. Wilkinson (1996) “Labour Turnover and Work-Related Training,” Report to the Department for Education and Employment.
Dearden, L., H. Reed and J. Van Reenen (2000). Who Gains When Workers Train? The Institute for Fiscal Studies, Working Paper 00/04.
Dench, S. (1993) “What Types of Employer Train?” Employment Department, Social Science Research Branch Working Paper No. 3.
DuMouchel, W. H. and G. J. Duncan (1983). “Using Sample Survey Weights in Multiple Regression Analyses of Stratified Samples.” Journal of the American Statistical Association 78: 535-543.
Eraut, M., J. Alderton, G. Cole and P. Senker (1998). “Development of Knowledge and Skills in Employment.” Research Report No. 5, University of Sussex Institute of Education.
J17473_Skills Report 20 8/3/07 08:28 Page 96
Training and Establishment Survival
____________________________________________________________________________________ 97
Felstead, A., F. Green and K. Mayhew (1997). “Getting the Measure of Training.” Leeds, Centre for Industrial Policy and Performance, University of Leeds.
Finegold, D. (1991). “Institutional Incentives and Skill Creation: Understanding the Decisions That Lead to a High Skill Equilibrium.” International Comparisons of Vocational Education and Training for Intermediate Skills. P. Ryan. London, Falmer Press: 93-116.
Frazis, H., M. Gittleman and M. Joyce (2000). “Correlates of Training: An Analysis Using Both Employer and Employee Characteristics.” Industrial and Labor Relations Review 53 (3): 443–62.
Godard, J. (2004). "A Critical Assessment of the High-Performance Paradigm." British Journal of Industrial Relations 42 (2): 349-378.
Green, F. (1993). "The Determinants of Training of Male and Female Employees in Britain", Oxford Bulletin of Economics and Statistics 55 (1): 101-20.
Green, F. (1993). "The Effect of Trade Unions on Training in Britain." Applied Economics 25 (8): 1033-43.
Green, F. (1997). “Review of Information on the Benefits of Training for Employers.” Research Report No 7, Department for Education and Employment.
Green, F. (1999). “Training The Workers.” The State of Working Britain. P. Gregg and L. Wadsworth. Manchester, Manchester University Press: 127-146.
Green, F. (2003). Employer Perspective Survey. Department for Education and Skills.
Green, F., M. Hoskins and S. Montgomery (1996). “The Effects of Training, Further Education and YTS on the Earnings of Young Employees.” Oxford Bulletin of Economics and Statistics 58: 471-488.
Green, F., S. Machin and D. Wilkinson (1999). "Trade Unions and Training Practices in British Workplaces." Industrial & Labor Relations Review 52 (2): 175-195.
Green, F., A. Felstead, K. Mayhew and A. Pack (2000). “The Impact of Training on Labour Mobility: Individual and Firm Level Evidence from Britain.” British Journal of Industrial Relations 38 (2): 261-275.
Green, F. and L. Zanchi (1997). “Trends in the Training of Male and Female Workers in the United Kingdom'', British Journal of Industrial Relations 35 (4): 635-44.
Greenhalgh, C. and M. Stewart (1987). "The Effects and Determinants of Training", Oxford Bulletin of Economics and Statistics 49 (2): 71-90.
Hage, J., P. D. Collins, F. Hull and J. Teachman (1993). “The Impact of Knowledge on the Survival of American Manufacturing Plants.” Social Forces 72 (1): 223-246.
Harris, R. (1999). “The Determinants of Work-Related Training in Britain in 1995 and the Implications of Employer Size.” Applied Economics 31(4): 451–63.
Haskel, J. and D. Hawkes (2003). “How Much of the Productiveity Spread is Explained by Skills? UK Evidence Sunig Matched Establishment/Workforce Survey Data.” CeRIBA discussion paper.
J17473_Skills Report 20 8/3/07 08:28 Page 97

Training and Establishment Survival
____________________________________________________________________________________ 98
Hey, J. D. (1984). “The Economics of Optimism and Pessimism: A Definition and Some Applications.” Kyklos 37 (2): 181-205.
Holzer, H., R. Block, M. Cheatham and J. Knott (1993). “Are Training Subsidies for Firms Effective? The Michigan Experience.” Industrial and Labor Relations Review 46 (July): 625-36.
Huselid, M. (1995). “The Impact of Human Resource Management Practices on Turnover, Productivity and Corporate Financial Performance.” Academy of Management Journal 38 (5): 635-672.
Huselid, M. and B. Becker (1996). “Methodological Issues in Cross-Sectional and Panel Estimates of the Human Resource-Firm Performance Link.” Industrial Relations 35 (3): 400-422.
Ichniowski, C., K. Shaw and G. Prennushi (1997). “The Impact of Human Resource Management Practices on Productivity.” American Economic Review 87 (June): 291-313.
International Labour Office (1998). World Employment Report 1998-99. Employability in the Global Economy. How Training Matters. Geneva, International Labour Office.
Kirkham, J., S. Richbell and D. Watts (1999). “Manpower Factors and Plant Closures in Multiplant Firms.” International Journal of Manpower 20 (7): 458-468.
Kitching, J. and R. Blackburn (2002), “The Nature of Training and Motivation to Training in Small Firms.” Reseach Report RR330, Department for Education and Skills.
Klepper, S. and K. L. Simons (2000). “The Making of an Oligopoly: Firm Survival and Technological Change in the Evolution of the US Tire Industry.” Journal of Political Economy 108 (4): 728-760.
Krueger, A. and C. Rouse (1998). “The Impact of Workplace Education on Earnings, Turnover and Job Performance.” Journal of Labor Economics 16 (January): 61-94.
Loewenstein, M. A. and J. R. Spletzer (1998). “Dividing the Costs and Returns to General Training.” Journal of Labor Economics 16 (January): 142-171.
Lynch, L.M. (1992). “Private Sector Training and the Earnings of Young Workers.” American Economic Review 82 (1): 299-312.
Lynch, L. M. and S. E. Black (1995). “Beyond the Incidence of Training: Evidence from a National Employers Survey.” Working Paper No. 5231, National Bureau of Economic Research.
MacDuffie, J-P. and T. Kochan (1995). “Human Resource Bundles and Manufacturing Performance: Flexible Production Systems in the World Auto Industry.” Industrial and Labor Relations Review 48 (2): 197-221.
MacDuffie, J-P. and T. Kochan (1995). “Do U.S. Firms Invest Less in Human Resources? Training in the World Auto Industry.” Industrial Relations 34 (2): 147-68.
Machin, S. (1995). “Plant Closures and Unionisation in British Establishments.” British Journal of Industrial Relations 33(1): 55-68.
Marquand, J. (1994). Training Policy and Economic Theory: A Policy Maker's Perspective. The Market for Training. R. McNabb and K. Whitfield. Aldershot, Avebury.
J17473_Skills Report 20 8/3/07 08:28 Page 98
Training and Establishment Survival
____________________________________________________________________________________ 99
Michie, J. and M. Sheehan-Quinn (2001). “Labour Market Flexibility, Human Resource Management and Corporate Performance.” British Journal of Management 12: 287-306.
Middleton, J., A. Ziderman and A. Van Adams (1993). Skills for Productivity. Vocational Education and Training in Developing Countries. New York, Oxford University Press for the World Bank.
Mincer, J. (1983). “Union Effects: Wages, Turnover and Job Training.” New Approaches to Labor Unions.Greenwich. JAI Press.
Nestler, K. and E. Kailis (2002). “Costs and Funding of Continuing Vocational Training in Enterprises in Europe,” Eurostat.
Osterman, P. (1995). “Skill, Training and Work Organization in American Establishments.” Industrial Relations 34 (2): 125-46.
Spilsbury, D. (2001). “Learning and Training at Work 2000.” DfES Research Brief No. 269.
Stevens, M. (1994). “An Investment Model for the Supply of Training by Employers.” The Economic Journal 104 (May): 556-570.
Stevens, M. (1999). “Human Capital Theory and UK Vocational Training Policy.” Oxford Review of Economic Policy 15 (1): 16-32.
Tamkin, P. (2005). “The Contribution of Skills to Business Performance.” Institute of Employment Studies.
Van Reenen, J., Dearden, L., H. Reed and (2000). Who Gains When Workers Train? The Institute for Fiscal Studies, Working Paper 00/04.
Vickerstaff, S. (1992). “Training for Economic Survival.” Education for Economic Survival. P. Brown and H.Lauder. London, Routledge: 244-267.
Vignoles, A., F. Galindo-Rueda and L. Feinstein (2004). "The Labour Market Impact of Adult Education and Training: A Cohort Analysis." Scottish Journal of Political Economy 51 (2): 266-280.
Wall, T. D. and S. J. Wood (2005). "The Romance of Human Resource Management and Business Performance, and the Case for Big Science." Human Relations 58 (4): 429-462.
Whitfield, K. (2000) “High-performance Workplaces, Training, and the Distribution of Skills.” Industrial Relations 39 (1): 1-25.
Williamson, O.E. (1970). “Corporate Control and Business Behaviour.” Prentice-Hall, Englewood Cliffs, New Jersey.
Zwick, T. (2002). “Training and Firm Productivity - Panel Evidence for Germany,” Oxford and Warwick Universities, SKOPE Research Paper No. 23.
J17473_Skills Report 20 8/3/07 08:28 Page 99
Training and Establishment Survival
____________________________________________________________________________________ 100
Annex II: The Analysis for Sector Skills Councils
This Annex reports the results of the disaggregate analysis of the association between training and
establishment closure by sectoral groups using the 'best fit' of SIC codes to Sector Skills Councils'
definitions. The analysis for the SSC extends the disaggregate analysis for occupational and industrial
groups reported in the main report (see Annex III for the SIC code definitions of the SSC sectors), but
due to the relatively small sample size, the results shown on Tables A2.1 to A4.1 should be treated as
indicative only and with caution.
A1 Sector Skills Council (SSC)
The Survey of Managers in WERS 98 enables us to analyse the distribution of establishments at the
more disaggregate level of Sector Skills Council (SSC) sectors. As mentioned in the main report, the
SSC sectors are not available using the main release of the WERS 98 data. However, more detailed
information concerning industrial classification is available using restricted files held by the Department
of Trade and Industry. We utilise this additional information to identify establishment sectors across 28
sectors (25 SSCs plus 3 sectors incorporating all other sectors not covered by SSCs). This yields a final
working sample of 2,036 establishments from the WERS surveys which may be used for statistical
analyses. By disaggregating the training investment among these sectoral groups, we can investigate
whether training has differential effects across the SSCs.
A2 Distribution of Employment by SSC
This section examines the distribution of employment across establishments by Sector Skills Councils
(SSC) using the WERS 98 cross-section data. Table A2.1 utilises employment information drawn from
the Survey of Managers (MQ) to report the distribution of employment and establishments by SSC.
Column (4) of Table A2.1 reports the proportion of employees working in each of the 28 sectors in the
economy. The final column of Table A2.1 reports the proportion of establishments covered by each
SSC.26
26 Note: The exclusion of Agriculture, forestry and fishing and coal mining impacts on sector data for Lantra and Proskills. It should also be noted that this excludes establishments with less than 10 employees which impacts on all SSCs.
J17473_Skills Report 20 8/3/07 08:28 Page 100
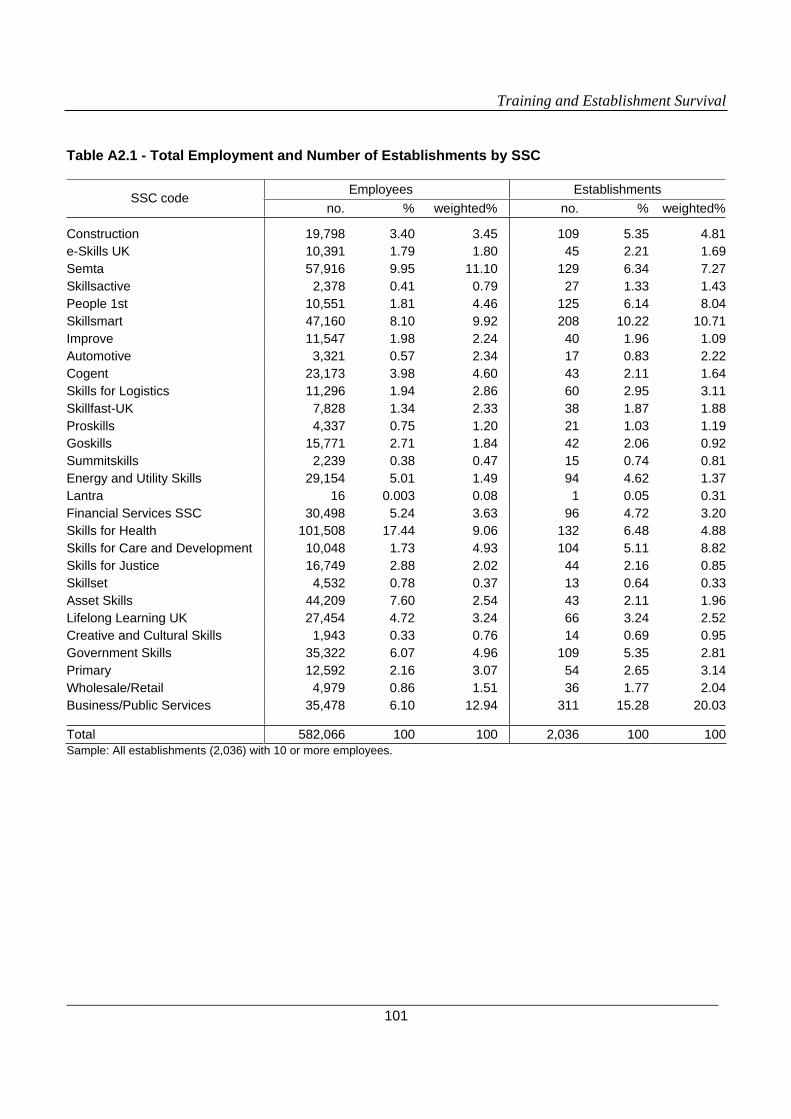
Training and Establishment Survival
____________________________________________________________________________________ 101
Table A2.1 - Total Employment and Number of Establishments by SSC
Employees Establishments SSC code
no. % weighted% no. % weighted%
Construction 19,798 3.40 3.45 109 5.35 4.81e-Skills UK 10,391 1.79 1.80 45 2.21 1.69Semta 57,916 9.95 11.10 129 6.34 7.27Skillsactive 2,378 0.41 0.79 27 1.33 1.43People 1st 10,551 1.81 4.46 125 6.14 8.04Skillsmart 47,160 8.10 9.92 208 10.22 10.71Improve 11,547 1.98 2.24 40 1.96 1.09Automotive 3,321 0.57 2.34 17 0.83 2.22Cogent 23,173 3.98 4.60 43 2.11 1.64Skills for Logistics 11,296 1.94 2.86 60 2.95 3.11Skillfast-UK 7,828 1.34 2.33 38 1.87 1.88Proskills 4,337 0.75 1.20 21 1.03 1.19Goskills 15,771 2.71 1.84 42 2.06 0.92Summitskills 2,239 0.38 0.47 15 0.74 0.81Energy and Utility Skills 29,154 5.01 1.49 94 4.62 1.37Lantra 16 0.003 0.08 1 0.05 0.31Financial Services SSC 30,498 5.24 3.63 96 4.72 3.20Skills for Health 101,508 17.44 9.06 132 6.48 4.88Skills for Care and Development 10,048 1.73 4.93 104 5.11 8.82Skills for Justice 16,749 2.88 2.02 44 2.16 0.85Skillset 4,532 0.78 0.37 13 0.64 0.33Asset Skills 44,209 7.60 2.54 43 2.11 1.96Lifelong Learning UK 27,454 4.72 3.24 66 3.24 2.52Creative and Cultural Skills 1,943 0.33 0.76 14 0.69 0.95Government Skills 35,322 6.07 4.96 109 5.35 2.81Primary 12,592 2.16 3.07 54 2.65 3.14Wholesale/Retail 4,979 0.86 1.51 36 1.77 2.04Business/Public Services 35,478 6.10 12.94 311 15.28 20.03
Total 582,066 100 100 2,036 100 100Sample: All establishments (2,036) with 10 or more employees.
J17473_Skills Report 20 8/3/07 08:28 Page 101
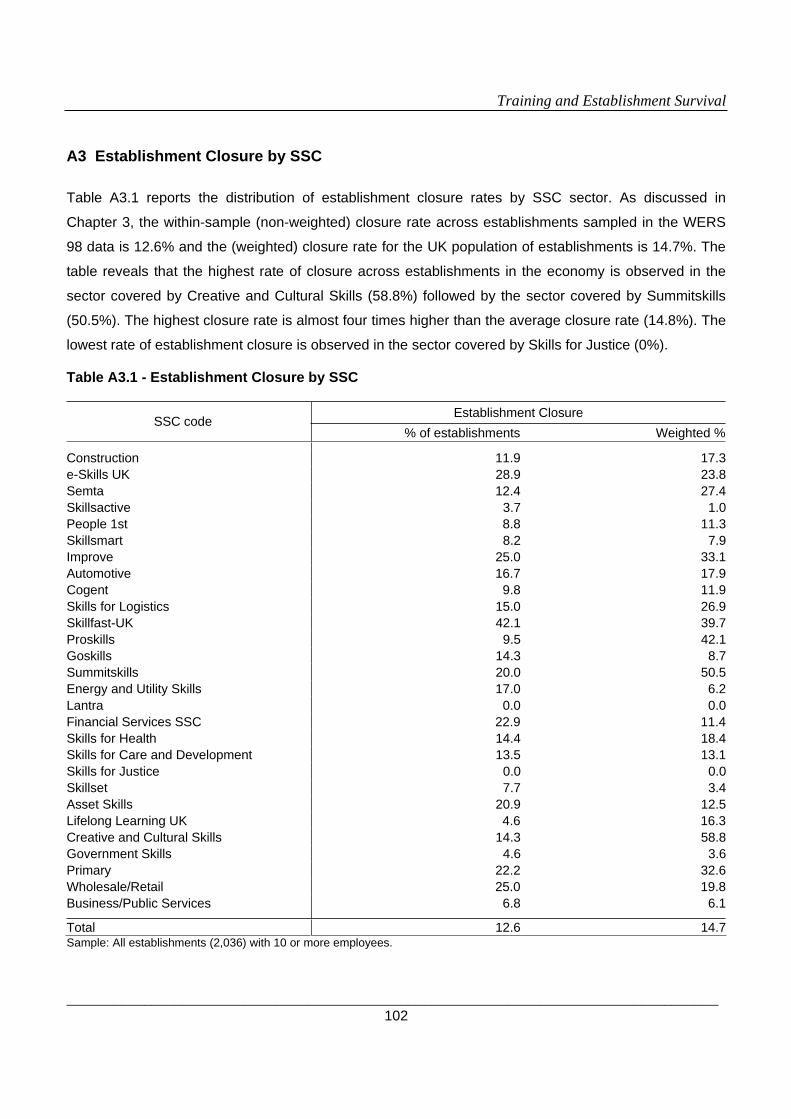
Training and Establishment Survival
____________________________________________________________________________________ 102
A3 Establishment Closure by SSC
Table A3.1 reports the distribution of establishment closure rates by SSC sector. As discussed in
Chapter 3, the within-sample (non-weighted) closure rate across establishments sampled in the WERS
98 data is 12.6% and the (weighted) closure rate for the UK population of establishments is 14.7%. The
table reveals that the highest rate of closure across establishments in the economy is observed in the
sector covered by Creative and Cultural Skills (58.8%) followed by the sector covered by Summitskills
(50.5%). The highest closure rate is almost four times higher than the average closure rate (14.8%). The
lowest rate of establishment closure is observed in the sector covered by Skills for Justice (0%).
Table A3.1 - Establishment Closure by SSC
Establishment Closure SSC code
% of establishments Weighted %
Construction 11.9 17.3e-Skills UK 28.9 23.8Semta 12.4 27.4Skillsactive 3.7 1.0People 1st 8.8 11.3Skillsmart 8.2 7.9Improve 25.0 33.1Automotive 16.7 17.9Cogent 9.8 11.9Skills for Logistics 15.0 26.9Skillfast-UK 42.1 39.7Proskills 9.5 42.1Goskills 14.3 8.7Summitskills 20.0 50.5Energy and Utility Skills 17.0 6.2Lantra 0.0 0.0Financial Services SSC 22.9 11.4Skills for Health 14.4 18.4Skills for Care and Development 13.5 13.1Skills for Justice 0.0 0.0Skillset 7.7 3.4Asset Skills 20.9 12.5Lifelong Learning UK 4.6 16.3Creative and Cultural Skills 14.3 58.8Government Skills 4.6 3.6Primary 22.2 32.6Wholesale/Retail 25.0 19.8Business/Public Services 6.8 6.1
Total 12.6 14.7Sample: All establishments (2,036) with 10 or more employees.
J17473_Skills Report 20 8/3/07 08:28 Page 102

Training and Establishment Survival
____________________________________________________________________________________ 103
A4 Employer Training by SSC (MQ)
Table A4.1 reports the distribution of formal off-the-job training across establishments by SSC sector. As
in the main report, we consider two different measures of training. The sample used is 2,036
establishments. Evidence on the incidence of training drawn from this survey indicates that 76%
establishments in the economy provided formal off-the-job training for employees in the largest
occupational group.27 By comparison, 49% of establishments provided 2 or more days of formal training.
Table A4.1 – Training and the Intensity of Training by SSC
Training 2 or more days of training SSC code
% weighted% % weighted%
Construction 90.8 78.5 52.8 44.1 e-Skills UK 97.8 93.8 84.4 76.8 Semta 85.3 66.7 50.8 43.4 Skillsactive 88.9 65.4 57.7 41.4 People 1st 72.8 66.9 44.4 42.7 Skillsmart 85.6 76.0 41.6 35.2 Improve 80.0 75.0 28.2 15.8 Automotive 85.7 70.9 58.8 50.8 Cogent 80.5 76.2 51.2 53.8 Skills for Logistics 78.3 61.2 43.3 36.4 Skillfast-UK 55.3 32.5 26.3 20.5 Proskills 90.5 50.2 61.9 38.2 Goskills 85.7 89.6 47.6 38.9 Summitskills 86.7 72.3 66.7 44.0 Energy and Utility Skills 95.7 73.9 72.5 65.8 Lantra 0 0 0 0Financial Services SSC 91.7 82.8 69.6 62.4 Skills for Health 93.2 85.0 62.7 45.2 Skills for Care and Development 99.0 99.3 68.9 68.0 Skills for Justice 95.5 97.6 79.6 93.6 Skillset 92.3 36.1 76.9 32.0 Asset Skills 60.5 67.9 38.1 43.7 Lifelong Learning UK 97.0 98.7 60.9 77.5 Creative and Cultural Skills 50.0 18.3 42.9 16.0 Government Skills 97.3 84.1 62.1 54.3 Primary 88.9 75.6 59.3 60.9 Wholesale/Retail 77.8 56.6 38.2 30.4 Business/Public Services 86.8 77.6 54.8 53.7
Total 86.9 75.6 55.0 49.0 Sample: All establishments (2,036) with 10 or more employees.
27 Within the sample, 1,769 (87%) establishments provided formal off-the-job training for employees in the largest occupational group.
J17473_Skills Report 20 8/3/07 08:28 Page 103

Training and Establishment Survival
____________________________________________________________________________________ 104
The third column of Table A4.1 reveals that almost all establishments (99%) in the sector covered by
Skills for Care and Development provided training in the 12 months prior to interview. Furthermore, some
68% of establishments provided training of 2 days or more (see the final column). In two other sectors
(covered by Lifelong Learning UK and Skills for Justice) almost 100% of establishments provided
training. The lowest incidence of formal off-the-job training is reported for the sector covered by Creative
and Cultural Skills (18%). By contrast, the sector covered by Improve reports the lowest intensity of
training with almost 16% of establishments training employees in the largest occupational group for 2
days or more.
A5 Training and Closure by SSC (MQ)
This section reports establishment closure rates according to the incidence of formal off-the-job training
for sectoral groups of the SSC. As in the previous section, the training measure used here is derived
from the Survey of Managers. We report the results for four SSCs, namely: Construction, Semta, People
1st and Skillsmart. Each of these SSC sectors is identified by more than 90 establishments in the sample.
Additionally, at least 10 of these establishments provide no training. As in the main report, this restriction
is imposed to minimise the issues that arise when using small samples.
Table A5.1 reports establishment closure rates for the sector covered by Construction. The table reveals
that 40% of the population of establishments which did not provide training in this sector closed down
compared with only 11% of establishments which provided training. The difference in these proportions
is statistically significant at the 1% level (p=0.005).
Table A5.1 – Training and Establishment Closure by SSC: Construction
No Training Training Total
Not Closed 6^ 90^ 96(%) (60.0) (90.9) (88.1)(weighted %) (60.2) (88.9) (82.7)
Closed 4^ 9^ 13(%) (40.0) (9.1) (11.9)(weighted %) (39.8) (11.1) (17.3)
Total 10 99 109(%) (100) (100) (100)Sample: All establishments with 10 or more employees within this particular sector of SSCs which contain more than 90 establishments. ^ significant at 1%.
J17473_Skills Report 20 8/3/07 08:28 Page 104
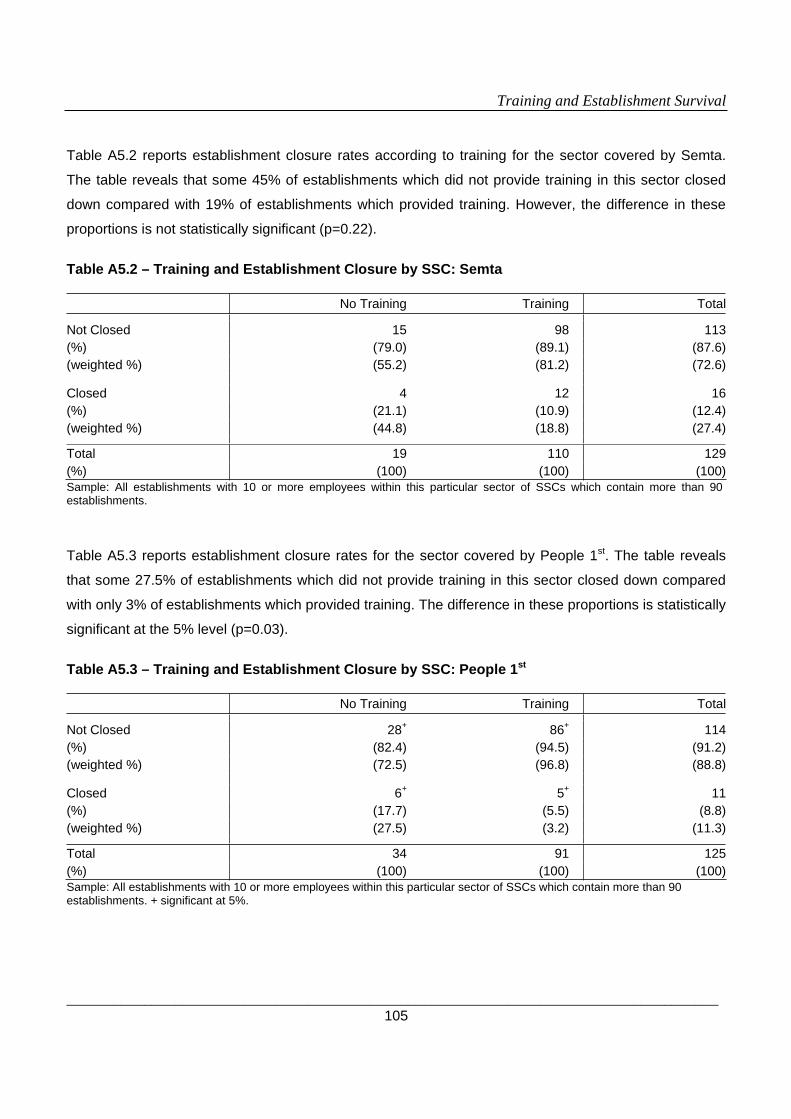
Training and Establishment Survival
____________________________________________________________________________________ 105
Table A5.2 reports establishment closure rates according to training for the sector covered by Semta.
The table reveals that some 45% of establishments which did not provide training in this sector closed
down compared with 19% of establishments which provided training. However, the difference in these
proportions is not statistically significant (p=0.22).
Table A5.2 – Training and Establishment Closure by SSC: Semta
No Training Training Total
Not Closed 15 98 113(%) (79.0) (89.1) (87.6)(weighted %) (55.2) (81.2) (72.6)
Closed 4 12 16(%) (21.1) (10.9) (12.4)(weighted %) (44.8) (18.8) (27.4)
Total 19 110 129(%) (100) (100) (100)Sample: All establishments with 10 or more employees within this particular sector of SSCs which contain more than 90 establishments.
Table A5.3 reports establishment closure rates for the sector covered by People 1st. The table reveals
that some 27.5% of establishments which did not provide training in this sector closed down compared
with only 3% of establishments which provided training. The difference in these proportions is statistically
significant at the 5% level (p=0.03).
Table A5.3 – Training and Establishment Closure by SSC: People 1st
No Training Training Total
Not Closed 28+ 86+ 114(%) (82.4) (94.5) (91.2)(weighted %) (72.5) (96.8) (88.8)
Closed 6+ 5+ 11(%) (17.7) (5.5) (8.8)(weighted %) (27.5) (3.2) (11.3)
Total 34 91 125(%) (100) (100) (100)Sample: All establishments with 10 or more employees within this particular sector of SSCs which contain more than 90 establishments. + significant at 5%.
J17473_Skills Report 20 8/3/07 08:28 Page 105

Training and Establishment Survival
____________________________________________________________________________________ 106
Table A5.4 reports establishment closure rates according to training for the sector covered by Skillsmart.
The table reveals that some 19% of establishments which did not provide training closed down
compared with only 4% of training establishments. The difference in these proportions is statistically
significant at the 10% level (p=0.066).
Table A5.4 – Training and Establishment Closure by SSC: Skillsmart
No Training Training Total
Not Closed 25* 166* 191(%) (83.3) (93.3) (91.8)(weighted %) (80.7) (95.7) (92.1)
Closed 5* 12* 17(%) (16.7) (6.7) (8.2)(weighted %) (19.3) (4.4) (7.9)
Total 30 178 208(%) (100) (100) (100)Sample: All establishments with 10 or more employees within this particular sector of SSCs which contain more than 90 establishments. * significant at 10%.
This section of the report has reported establishment closure rates according to the incidence of formal
off-the-job training for each of four SSC sectors. Establishments which provided training are less likely to
close down than those which did not train in all cases. The differences in these proportions were found
to be statistically significant for three SSC sectors of Construction, People 1st, and Skillsmart.
A6 The Effects of Training on Establishment Closure by SSC (MQ)
This section examines the separate effect on establishment closure of training in each of the sectoral
groups of the SSC using training measures derived from the Survey of Managers. As in the previous
section, we report multivariate regression results only for those SSCs for which we observe at least 90
establishments in the survey, 10 of which provide no training.
Table A6.1 reports the conditional association of training with establishment closure for the incidence of
training that captures whether the establishment provided training to employees in the largest
occupational group. The table reveals that coefficients on the training variable for all four SSC sectors
appear to be negative. Furthermore, the estimates for Construction, People 1st and Skillsmart are
J17473_Skills Report 20 8/3/07 08:28 Page 106

Training and Establishment Survival
____________________________________________________________________________________ 107
statistically significant at conventional levels. The strongest effect of training on establishment closure is
found for the sector covered by Construction. This finding is consistent with those reported in Section A5.
Table A6.1 - The Effects of the Incidence of Training on Closure by SSC (MQ)
(1) (2) (3) (4)
SSC Construct Semta People 1st Skillsmart
Training (0/1) -0.595^ -0.185 -0.243+ -0.110^ (2.93) (1.30) (2.44) (2.87)
Pseudo R2 0.4897 0.3775 0.2190 0.4050
Sample Size 92 123 90 206 Sample: All establishments with 10 or more employees within the group. Robust z statistics in parentheses. Estimates reported here are weighted. * significant at 10%; + significant at 5%; ^ significant at 1%. Regressors in all regressions include dummiesfor part-time employees, the age of establishment and establishment size. The educational qualification was excluded due to a dramatic reduction in the sample size.
Column (1) of Table A6.1 reveals that for the sector covered by Construction, those establishments
which provided training are around 60 percentage points less likely to close down than those with no
training. Column (3) reports similarly for the sector covered by People 1st: Those establishments which
provide training to the largest occupational group are more than 24 percentage points less likely to close
down than those establishments which do not provide training. The estimate for the Skillsmart sector in
Column (4) suggests that those establishments which train have a 11 percentage points lower chance of
closure.
Table A6.2 reports the conditional association of training with establishment closure for two binary
training variables that capture whether the establishment provided training to at best 99% of employees
or to all employees. The table reveals that coefficients on these training variables are negative for all
those five SSCs and coefficients on both or either of the training variables are statistically significant for
all the SSC sectors. The strongest impact of the proportion of trained employees on establishment
closure is found in the sector covered by Construction, followed by People 1st, Semta, and Skillsmart.
This is in line with the findings with the incidence of training from Table A6.1.
J17473_Skills Report 20 8/3/07 08:28 Page 107
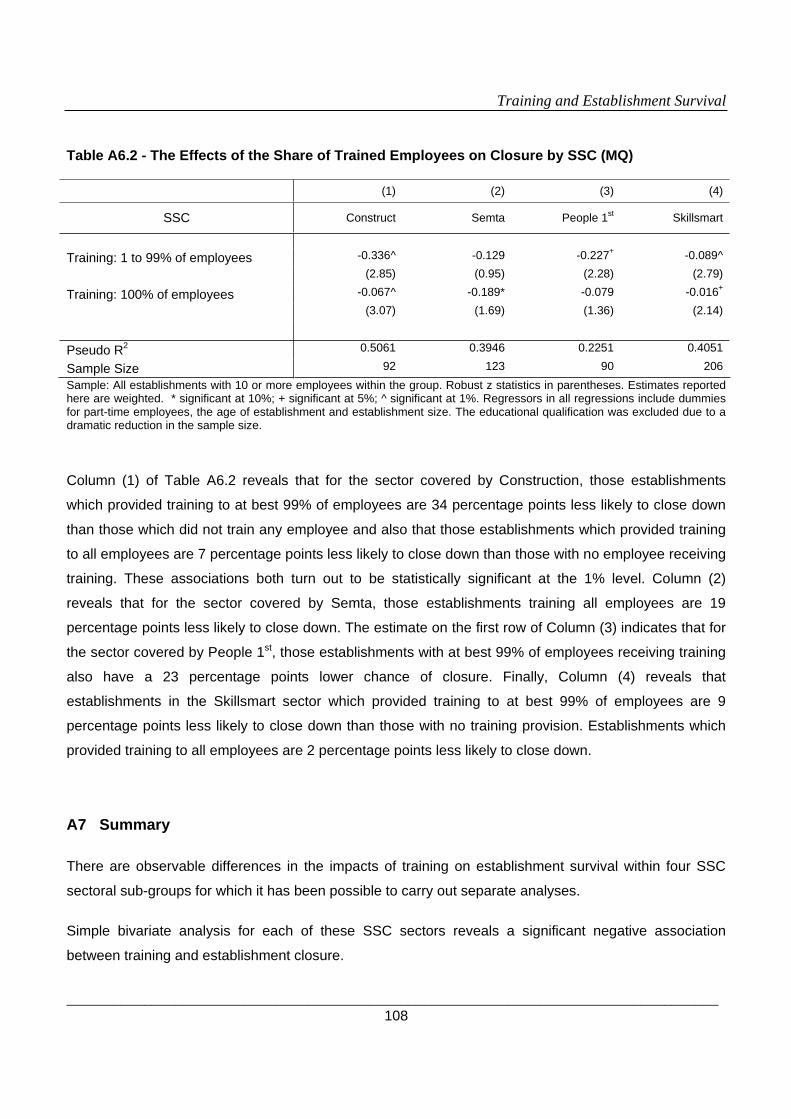
Training and Establishment Survival
____________________________________________________________________________________ 108
Table A6.2 - The Effects of the Share of Trained Employees on Closure by SSC (MQ)
(1) (2) (3) (4)
SSC Construct Semta People 1st Skillsmart
Training: 1 to 99% of employees -0.336^ -0.129 -0.227+ -0.089^
(2.85) (0.95) (2.28) (2.79)
Training: 100% of employees -0.067^ -0.189* -0.079 -0.016+
(3.07) (1.69) (1.36) (2.14)
Pseudo R2 0.5061 0.3946 0.2251 0.4051
Sample Size 92 123 90 206 Sample: All establishments with 10 or more employees within the group. Robust z statistics in parentheses. Estimates reported here are weighted. * significant at 10%; + significant at 5%; ^ significant at 1%. Regressors in all regressions include dummiesfor part-time employees, the age of establishment and establishment size. The educational qualification was excluded due to a dramatic reduction in the sample size.
Column (1) of Table A6.2 reveals that for the sector covered by Construction, those establishments
which provided training to at best 99% of employees are 34 percentage points less likely to close down
than those which did not train any employee and also that those establishments which provided training
to all employees are 7 percentage points less likely to close down than those with no employee receiving
training. These associations both turn out to be statistically significant at the 1% level. Column (2)
reveals that for the sector covered by Semta, those establishments training all employees are 19
percentage points less likely to close down. The estimate on the first row of Column (3) indicates that for
the sector covered by People 1st, those establishments with at best 99% of employees receiving training
also have a 23 percentage points lower chance of closure. Finally, Column (4) reveals that
establishments in the Skillsmart sector which provided training to at best 99% of employees are 9
percentage points less likely to close down than those with no training provision. Establishments which
provided training to all employees are 2 percentage points less likely to close down.
A7 Summary
There are observable differences in the impacts of training on establishment survival within four SSC
sectoral sub-groups for which it has been possible to carry out separate analyses.
Simple bivariate analysis for each of these SSC sectors reveals a significant negative association
between training and establishment closure.
J17473_Skills Report 20 8/3/07 08:28 Page 108

Training and Establishment Survival
____________________________________________________________________________________ 109
Findings derived from a multi-variate analysis for each SSC are consistent with those obtained from the
simple bivariate analysis. These findings suggest that training was sub-optimal for establishments within
the SSC sectors of Construction, Semta, People 1st, and Skillsmart, in the sense that establishments
which trained either at least one employee or greater proportions of employees could generate a lower
risk of closure.
J17473_Skills Report 20 8/3/07 08:28 Page 109

Training and Establishment Survival
____________________________________________________________________________________ 110
Annex III: UK Standard Industrial Classification 1992 (SIC 92) Codes
This Annex describes UK Standard Industrial Classification of Economic Activities 1992 (SIC 92). Table
AA.1 lists the definitions of SIC codes corresponding to twelve SIC industries. Table AA.2 lists the
definitions of SIC 92 codes covered by Sector Skills Council (SSC) sectors, which consist of 25 SSCs
plus 3 sectors incorporating all other sectors not covered by the SSCs.
Table AA.1 - UK Standard Industrial Classification of Economic Activities 1992 (SIC 92) Codes
SICSection Industry SIC Codes
D Manufacturing 15 - 37 E Electricity, gas and water supply 40, 41 F Construction 45
G Wholesale and retail trade; repair of motor vehicles, motorcycles and personal and household goods 50 - 52
H Hotels and restaurants 55 I Transport, storage and communication 60 - 64 J Financial intermediation 65 - 67 K Real estate, renting and business activities 70 - 74 L Public administration and defence; compulsory social security 75 M Education 80 N Health and social work 85 O Other community, social and personal service activities 90 - 93
J17473_Skills Report 20 8/3/07 08:28 Page 110
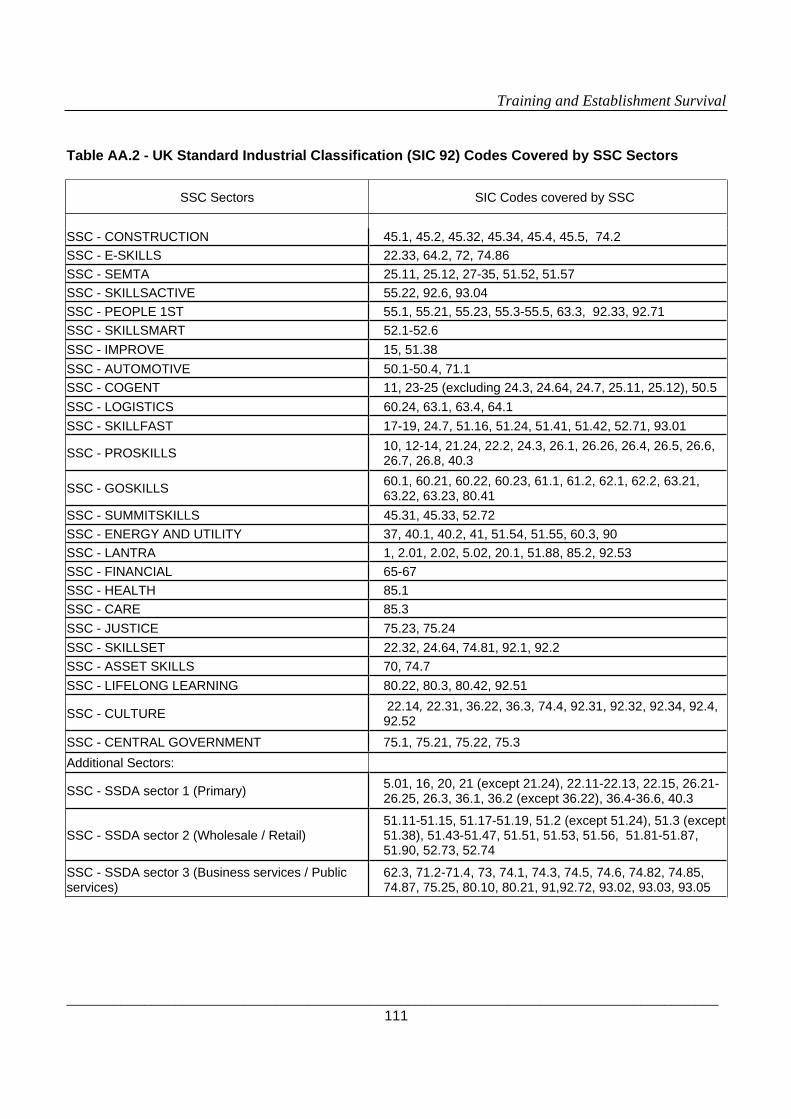
Training and Establishment Survival
____________________________________________________________________________________ 111
Table AA.2 - UK Standard Industrial Classification (SIC 92) Codes Covered by SSC Sectors
SSC Sectors SIC Codes covered by SSC
SSC - CONSTRUCTION 45.1, 45.2, 45.32, 45.34, 45.4, 45.5, 74.2 SSC - E-SKILLS 22.33, 64.2, 72, 74.86 SSC - SEMTA 25.11, 25.12, 27-35, 51.52, 51.57 SSC - SKILLSACTIVE 55.22, 92.6, 93.04 SSC - PEOPLE 1ST 55.1, 55.21, 55.23, 55.3-55.5, 63.3, 92.33, 92.71 SSC - SKILLSMART 52.1-52.6 SSC - IMPROVE 15, 51.38 SSC - AUTOMOTIVE 50.1-50.4, 71.1 SSC - COGENT 11, 23-25 (excluding 24.3, 24.64, 24.7, 25.11, 25.12), 50.5 SSC - LOGISTICS 60.24, 63.1, 63.4, 64.1 SSC - SKILLFAST 17-19, 24.7, 51.16, 51.24, 51.41, 51.42, 52.71, 93.01
SSC - PROSKILLS 10, 12-14, 21.24, 22.2, 24.3, 26.1, 26.26, 26.4, 26.5, 26.6, 26.7, 26.8, 40.3
SSC - GOSKILLS 60.1, 60.21, 60.22, 60.23, 61.1, 61.2, 62.1, 62.2, 63.21, 63.22, 63.23, 80.41
SSC - SUMMITSKILLS 45.31, 45.33, 52.72 SSC - ENERGY AND UTILITY 37, 40.1, 40.2, 41, 51.54, 51.55, 60.3, 90 SSC - LANTRA 1, 2.01, 2.02, 5.02, 20.1, 51.88, 85.2, 92.53 SSC - FINANCIAL 65-67 SSC - HEALTH 85.1 SSC - CARE 85.3 SSC - JUSTICE 75.23, 75.24 SSC - SKILLSET 22.32, 24.64, 74.81, 92.1, 92.2 SSC - ASSET SKILLS 70, 74.7 SSC - LIFELONG LEARNING 80.22, 80.3, 80.42, 92.51
SSC - CULTURE 22.14, 22.31, 36.22, 36.3, 74.4, 92.31, 92.32, 92.34, 92.4, 92.52
SSC - CENTRAL GOVERNMENT 75.1, 75.21, 75.22, 75.3 Additional Sectors:
SSC - SSDA sector 1 (Primary) 5.01, 16, 20, 21 (except 21.24), 22.11-22.13, 22.15, 26.21-26.25, 26.3, 36.1, 36.2 (except 36.22), 36.4-36.6, 40.3
SSC - SSDA sector 2 (Wholesale / Retail) 51.11-51.15, 51.17-51.19, 51.2 (except 51.24), 51.3 (except 51.38), 51.43-51.47, 51.51, 51.53, 51.56, 51.81-51.87, 51.90, 52.73, 52.74
SSC - SSDA sector 3 (Business services / Public services)
62.3, 71.2-71.4, 73, 74.1, 74.3, 74.5, 74.6, 74.82, 74.85, 74.87, 75.25, 80.10, 80.21, 91,92.72, 93.02, 93.03, 93.05
J17473_Skills Report 20 8/3/07 08:28 Page 111

List of previous SSDA Publications Please note all publications can be downloaded from our website www.ssda.org.uk or contact 01709 765 444
Research Report 1: Skills for Business 1000
Research Report 2: Evaluation of the Trailblazer Phase of the Sector Skills Council Network
Research Report 3: Skills for Business Network – Phase I Evaluation
Research Report 4: Skills for Business 2003 – Survey of Employers
Research Report 5: Skills Pay: The Contribution of Skills to Business Success
Research Report 6: The UK Skills and Productivity Agenda: The Evidence Base for the SSDA’s Strategic Plan 2005-2008
Research Report 7: The UK Workforce: Realising our Potential
Research Report 8: Sectoral Management Priorities: Management Skills and Capacities
Research Report 9: Raising Sector Skills Levels – How Responsive is Local Training Supply?
Research Report 10: Skills for Business Network: Phase 2 Evaluation Main Report
Research Report 11: Skills for Business 2004: Survey of Employers
Research Report 12: Skills for Business Network: Phase 2 Evaluation Case Studies
Research Report 13: Sectoral Productivity Differences Across the UK
Research Report 14: Sectors Matter: An International Study of Sector Skills and Productivity
Research Report 15: Evaluation of Pathfinder Sector Skills Agreement Process
Research Report 16: Skills Abroad: A Comparative Assessment of International Policy Approaches to Skills Leading to the Development of Policy Recommendations for the UK
Research Report 17: The Comparative Capability of UK Managers
Research Report 18: Skills for Business Network 2005: Survey of Employers
Research Report 19: Skills for Business Network: Phase 3 Evaluation Main Report
Working Futures 2: National Report 2004-2014
J17473_Skills Report 20 8/3/07 08:28 Page 112