towerswatson.com © 2013 Towers Watson. All rights reserved. Proprietary and Confidential. For Towers Watson and Towers Watson client use only.
Total Reward Strategies for the 21st CenturyA Quantitative Approach to Total Rewards
Lubca PaclikovaRichard Gendron
October 15, 2013
towerswatson.com © 2013 Towers Watson. All rights reserved. Proprietary and Confidential. For Towers Watson and Towers Watson client use only.
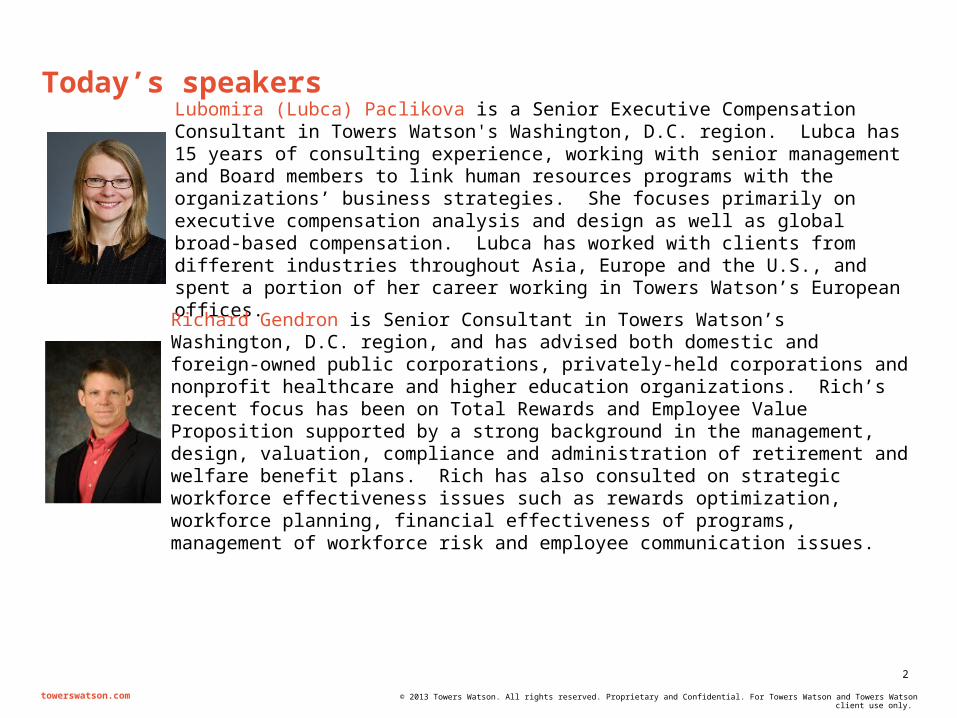
Today’s speakers
Lubomira (Lubca) Paclikova is a Senior Executive Compensation Consultant in Towers Watson's Washington, D.C. region. Lubca has 15 years of consulting experience, working with senior management and Board members to link human resources programs with the organizations’ business strategies. She focuses primarily on executive compensation analysis and design as well as global broad-based compensation. Lubca has worked with clients from different industries throughout Asia, Europe and the U.S., and spent a portion of her career working in Towers Watson’s European offices.
Richard Gendron is Senior Consultant in Towers Watson’s Washington, D.C. region, and has advised both domestic and foreign-owned public corporations, privately-held corporations and nonprofit healthcare and higher education organizations. Rich’s recent focus has been on Total Rewards and Employee Value Proposition supported by a strong background in the management, design, valuation, compliance and administration of retirement and welfare benefit plans. Rich has also consulted on strategic workforce effectiveness issues such as rewards optimization, workforce planning, financial effectiveness of programs, management of workforce risk and employee communication issues.
2

towerswatson.com © 2013 Towers Watson. All rights reserved. Proprietary and Confidential. For Towers Watson and Towers Watson client use only.
Today’s discussion
Why Total Rewards…Now? Insights from our research Getting started Total Rewards Optimization Case studies Questions
3
towerswatson.com © 2013 Towers Watson. All rights reserved. Proprietary and Confidential. For Towers Watson and Towers Watson client use only.
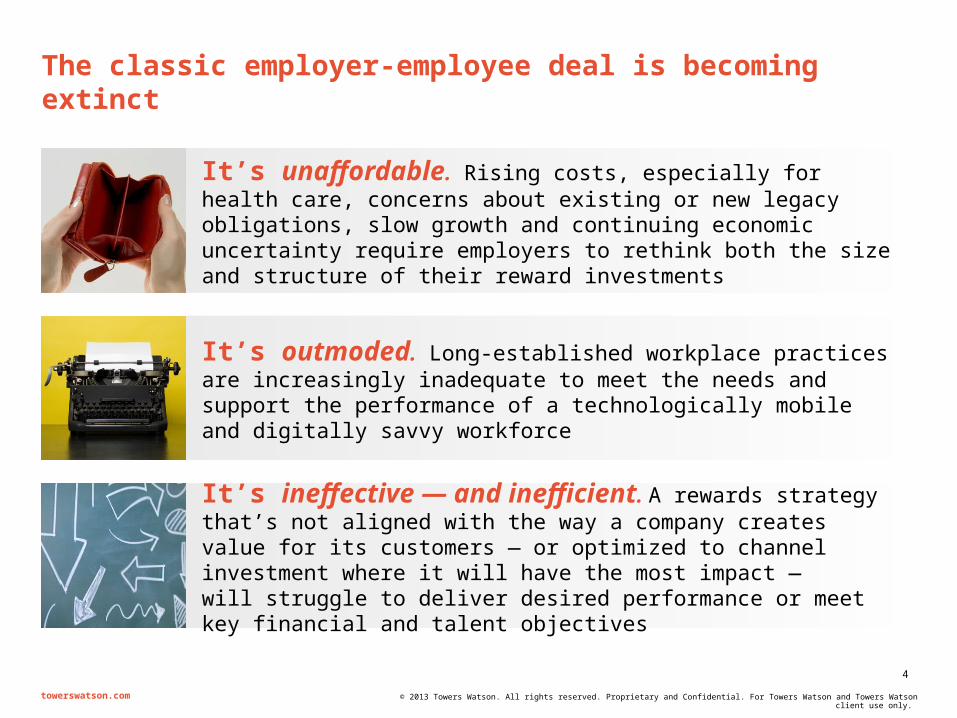
The classic employer-employee deal is becoming extinct
It’s unaffordable. Rising costs, especially for health care, concerns about existing or new legacy obligations, slow growth and continuing economic uncertainty require employers to rethink both the size and structure of their reward investments
It’s outmoded. Long-established workplace practices are increasingly inadequate to meet the needs and support the performance of a technologically mobile and digitally savvy workforce
It’s ineffective — and inefficient. A rewards strategy that’s not aligned with the way a company creates value for its customers — or optimized to channel investment where it will have the most impact — will struggle to deliver desired performance or meet key financial and talent objectives
4

towerswatson.com © 2013 Towers Watson. All rights reserved. Proprietary and Confidential. For Towers Watson and Towers Watson client use only.
Companies face serious challenges when it comes to attraction, retention and engagement of talent. Our research reveals what it takes to get it right
5Xmore likely to report their
employees are highly engaged
2Xmore likely to report achieving
financial performance significantly above their peers
Companies that have adopted an increasingly integrated approach to Total Rewards strategy, design and delivery decisions — supported by
an overarching Employee Value Proposition — are:
*Source: Towers Watson 2012 Talent Management and Rewards Study – Global. 5
towerswatson.com © 2013 Towers Watson. All rights reserved. Proprietary and Confidential. For Towers Watson and Towers Watson client use only.
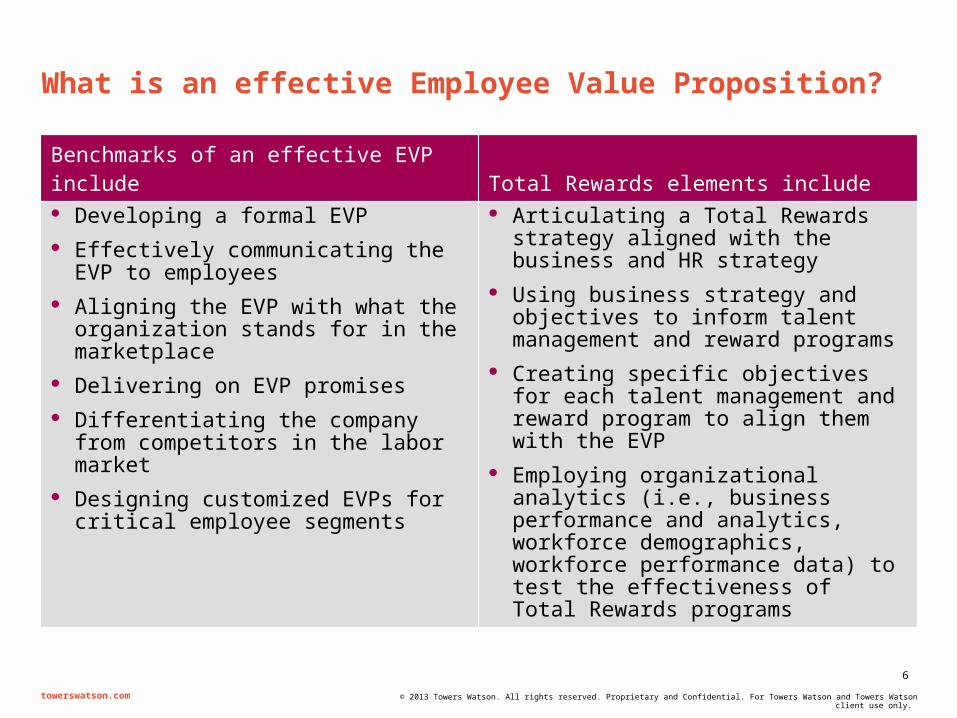
What is an effective Employee Value Proposition?
Benchmarks of an effective EVP include Total Rewards elements include Developing a formal EVP
Effectively communicating the EVP to employees
Aligning the EVP with what the organization stands for in the marketplace
Delivering on EVP promises
Differentiating the company from competitors in the labor market
Designing customized EVPs for critical employee segments
Articulating a Total Rewards strategy aligned with the business and HR strategy
Using business strategy and objectives to inform talent management and reward programs
Creating specific objectives for each talent management and reward program to align them with the EVP
Employing organizational analytics (i.e., business performance and analytics, workforce demographics, workforce performance data) to test the effectiveness of Total Rewards programs
6

towerswatson.com © 2013 Towers Watson. All rights reserved. Proprietary and Confidential. For Towers Watson and Towers Watson client use only.
The evolution of an effective EVP and Total Rewards strategy
Have formally articulated an EVP and adopted a Total Rewards approach
Greater focus on an integrated strategy for managing rewards and talent management
Have stated objectives for each reward and talent management program
Have not progressed in formally articulating an EVP or in developing a total rewards strategy
Have effectively communicated their EVP to employees and delivered on their EVP promises
Tactical
Integrated and Strategic
Communicating and Delivering
Have differentiated their EVP from other organizations with whom they compete for talent
Have customized EVPs for critical workforce segments
More likely to employ organizational analytics to test the effectiveness of total rewards programs
Segmenting and Differentiating
7
towerswatson.com © 2013 Towers Watson. All rights reserved. Proprietary and Confidential. For Towers Watson and Towers Watson client use only.
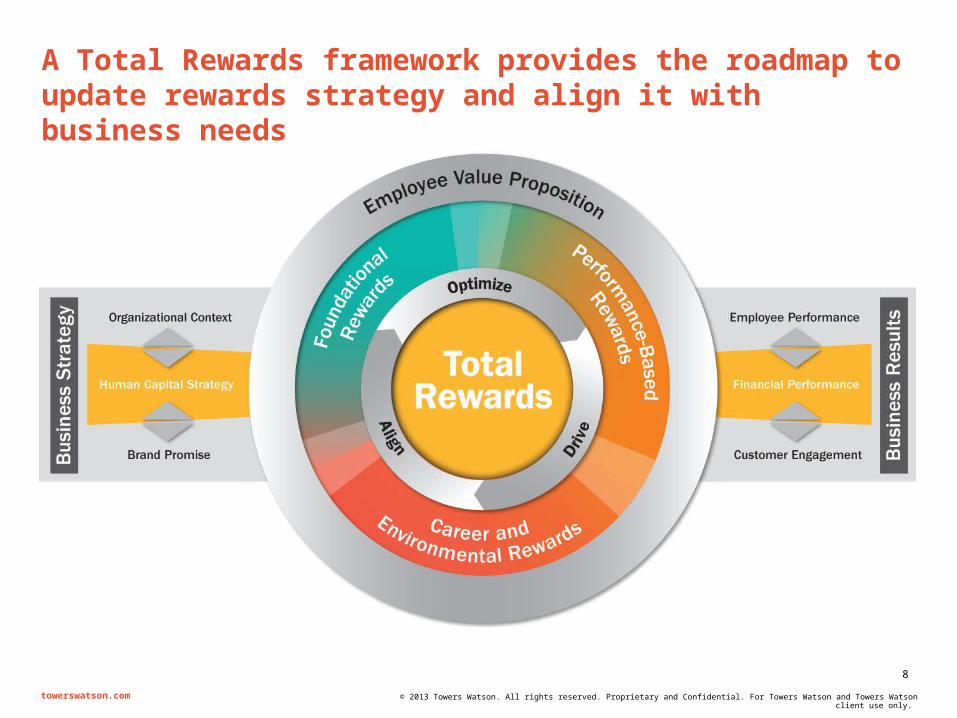
A Total Rewards framework provides the roadmap to update rewards strategy and align it with business needs
8
towerswatson.com © 2013 Towers Watson. All rights reserved. Proprietary and Confidential. For Towers Watson and Towers Watson client use only.
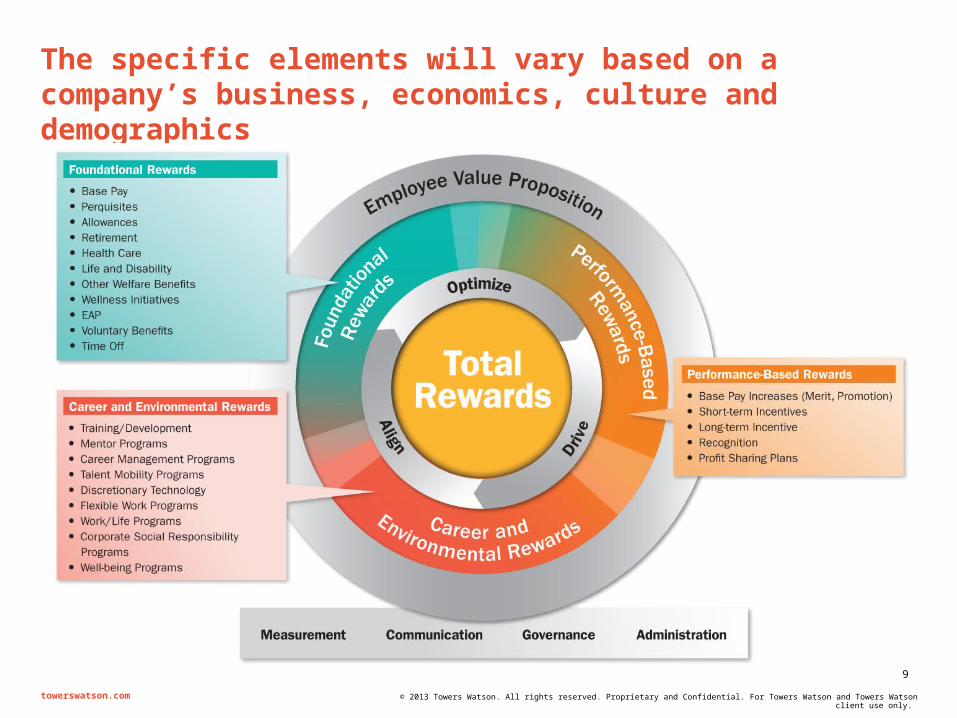
The specific elements will vary based on a company’s business, economics, culture and demographics
9
towerswatson.com © 2013 Towers Watson. All rights reserved. Proprietary and Confidential. For Towers Watson and Towers Watson client use only.
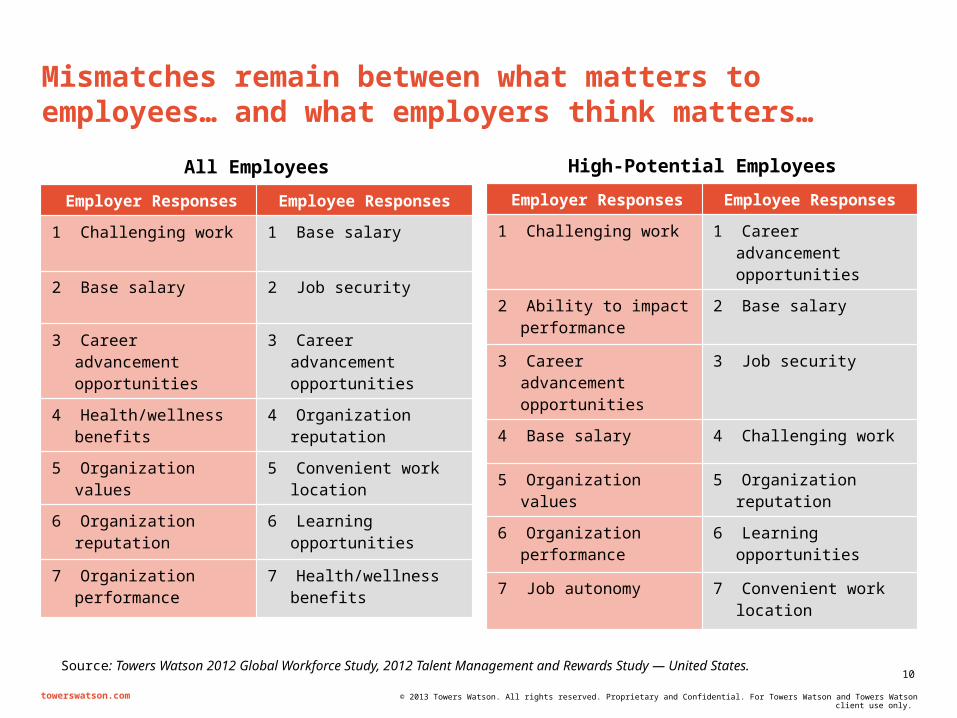
Mismatches remain between what matters to employees… and what employers think matters…
All Employees
Employer Responses Employee Responses
1 Challenging work 1 Base salary
2 Base salary 2 Job security
3 Career advancement opportunities
3 Career advancement opportunities
4 Health/wellness benefits 4 Organization reputation
5 Organization values 5 Convenient work location
6 Organization reputation 6 Learning opportunities
7 Organization performance
7 Health/wellness benefits
High-Potential Employees
Employer Responses Employee Responses
1 Challenging work 1 Career advancement opportunities
2 Ability to impact performance
2 Base salary
3 Career advancement opportunities
3 Job security
4 Base salary 4 Challenging work
5 Organization values 5 Organization reputation
6 Organization performance
6 Learning opportunities
7 Job autonomy 7 Convenient work location
Source: Towers Watson 2012 Global Workforce Study, 2012 Talent Management and Rewards Study — United States.10
towerswatson.com © 2013 Towers Watson. All rights reserved. Proprietary and Confidential. For Towers Watson and Towers Watson client use only.
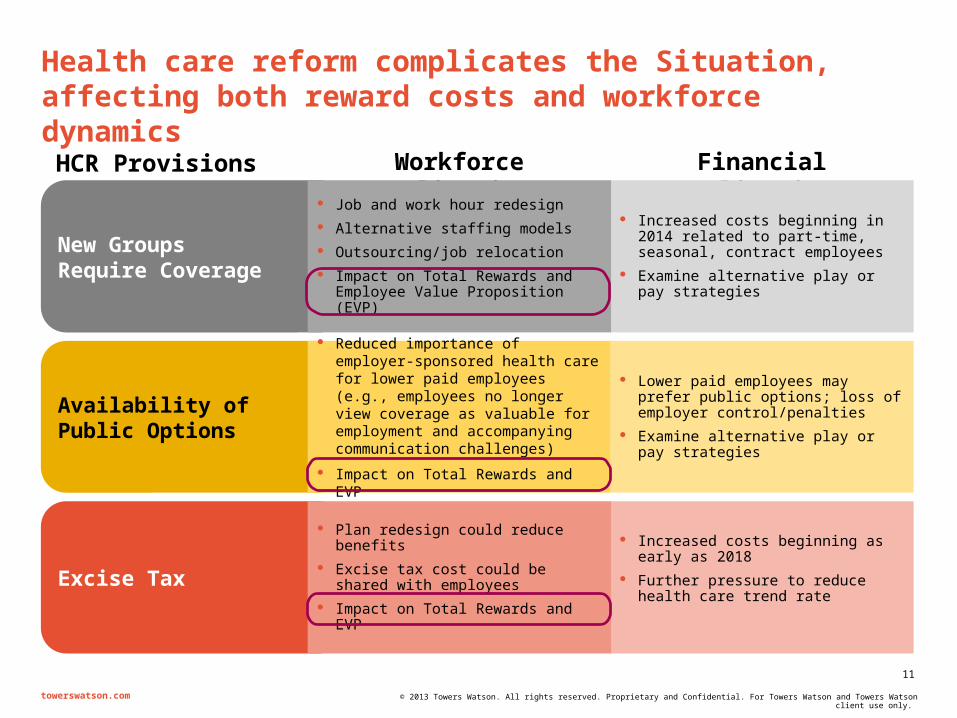
Health care reform complicates the Situation, affecting both reward costs and workforce dynamics
HCR Provisions Financial ImplicationsWorkforce Implications
Excise Tax
Increased costs beginning as early as 2018
Further pressure to reduce health care trend rate
Plan redesign could reduce benefits Excise tax cost could be shared with
employees Impact on Total Rewards and EVP
New Groups Require Coverage
Increased costs beginning in 2014 related to part-time, seasonal, contract employees
Examine alternative play or pay strategies
Job and work hour redesign Alternative staffing models Outsourcing/job relocation Impact on Total Rewards and Employee
Value Proposition (EVP)
Availability of Public Options
Reduced importance of employer-sponsored health care for lower paid employees (e.g., employees no longer view coverage as valuable for employment and accompanying communication challenges)
Impact on Total Rewards and EVP
Lower paid employees may prefer public options; loss of employer control/penalties
Examine alternative play or pay strategies
11

towerswatson.com © 2013 Towers Watson. All rights reserved. Proprietary and Confidential. For Towers Watson and Towers Watson client use only.
2014 2015 2016 2017 2018 2019 2020 $500
$600
$700
$800
$900
$1,000
$1,100
Sin
gle
Co
ve
rag
e M
on
thly
Ra
te Defer excise tax by lowering the value of
the plan
Companies that do not improve efficiency will likely reduce the value of benefits to contain cost and avoid excise tax
* Excise tax threshold indexed at 4% for 2019 and 3% per year thereafter.
NOTE: Results depicted are for illustrative purposes only based on single coverage monthly rate for ‘median efficiency’ plan and assumed savings/trend reduction.
HIGH-PERFORMING GROUP
OR PRIVATE EXCHANGE
Avoid excise tax by lowering long-term cost trends using
thoughtfully-designed incentives, optimal care management,
consumerism, engagement and
other health activities
EXCISE TAX THRESHOLD*
‘MEDIAN EFFICIENCY’ SELF-INSURED
GROUP PLAN
towerswatson.com12
towerswatson.com © 2013 Towers Watson. All rights reserved. Proprietary and Confidential. For Towers Watson and Towers Watson client use only.
Sample Plan Value Comparison
Current Program Illustrative Program0.5
0.55
0.6
0.65
0.7
0.75
0.8
0.85
0.90.86
0.750.78
0.7 HMOPPO
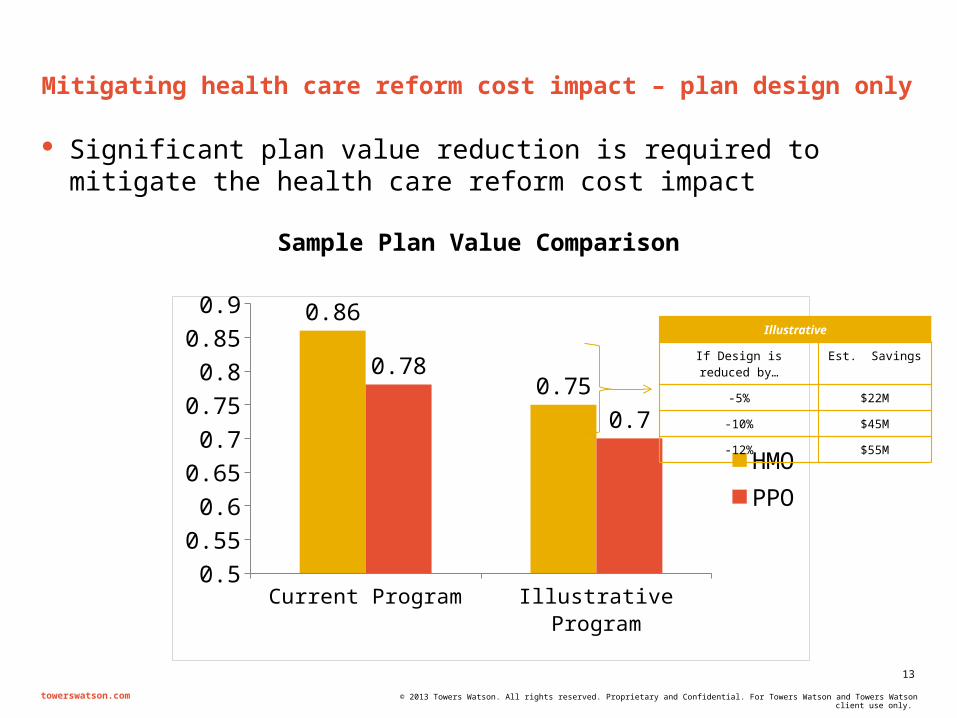
Mitigating health care reform cost impact – plan design only
Significant plan value reduction is required to mitigate the health care reform cost impact
Illustrative
If Design is reduced by… Est. Savings
-5% $22M
-10% $45M
-12% $55M
13

towerswatson.com © 2013 Towers Watson. All rights reserved. Proprietary and Confidential. For Towers Watson and Towers Watson client use only.
Health insurance exchange
Platinum (90% Value)
Gold (80% Value)
Silver (70% Value)
Bronze (60% Value)
Plan Offerings
* All subsidies based on Silver (70%) Value Plan. All dollar amounts are annual figures.
Family Incomeas % of FPL
< 138% 138% - 150% 150% - 200% 200% - 250% 250% - 300% 300% - 400% > 400%
* Max Family SalarySingle/Family of 4
$15,856 / $32,499 $17,235 / $35,325 $22,980 / $47,100 $28,725 / $58,875 $34,470 / $70,650 $45,960 / $94,200 N/A
* Max Premium Costas % of Income
2% 3% - 4% 4% - 6.3% 6.3% - 8.05% 8.05% - 9.5% 9.50% N/A
* Max Premium $ AmountSingle/Family of 4
$317 / $650 $689 / $1,413 $1,448 / $2,967 $2,312 / $4,739 $3,120 / $6,394 $4,159 / $8,525 N/A
* Max Out of Pocket(Single/Family)Actuarial Value
$1,983 / $3,96794%
$1,983 / $3,96794%
$1,983 / $3,96785%
$2,975 / $5,95073%
$2,975 / $5,95070%
$3,987 / $7,97370%
N/A
Employer Penalty in 2015 +
None $3,000 per employee N/A
14
Other requirements: guarantee issue; no medical underwriting; no pre-existing condition limits; essential health benefits; preventive care at 100%; no lifetime or annual limits; maximum out-of-pocket limits $6,350/$12,700
towerswatson.com © 2013 Towers Watson. All rights reserved. Proprietary and Confidential. For Towers Watson and Towers Watson client use only.
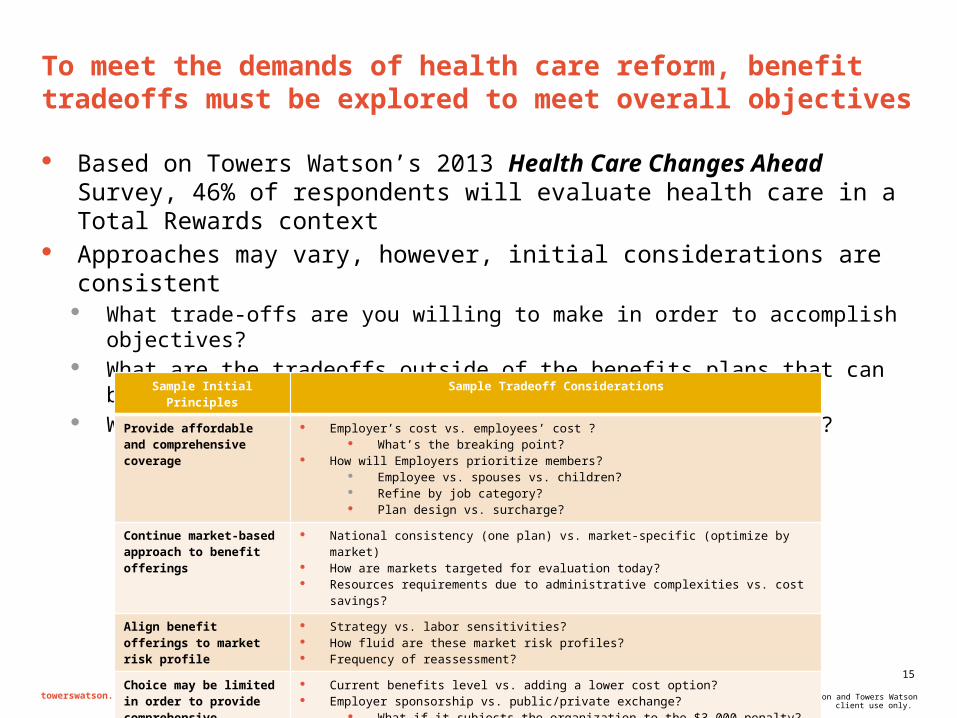
To meet the demands of health care reform, benefit tradeoffs must be explored to meet overall objectives
Based on Towers Watson’s 2013 Health Care Changes Ahead Survey, 46% of respondents will evaluate health care in a Total Rewards context
Approaches may vary, however, initial considerations are consistent What trade-offs are you willing to make in order to accomplish objectives? What are the tradeoffs outside of the benefits plans that can be used to balance your
business/workforce objectives? Who will drive the reward mix: Employer and/or employees?
Sample Initial Principles Sample Tradeoff Considerations
Provide affordable and comprehensive coverage
Employer’s cost vs. employees’ cost ? What’s the breaking point?
How will Employers prioritize members? Employee vs. spouses vs. children? Refine by job category? Plan design vs. surcharge?
Continue market-based approach to benefit offerings
National consistency (one plan) vs. market-specific (optimize by market) How are markets targeted for evaluation today? Resources requirements due to administrative complexities vs. cost savings?
Align benefit offerings to market risk profile
Strategy vs. labor sensitivities? How fluid are these market risk profiles? Frequency of reassessment?
Choice may be limited in order to provide comprehensive coverage
Current benefits level vs. adding a lower cost option? Employer sponsorship vs. public/private exchange?
What if it subjects the organization to the $3,000 penalty? Will your strategy differ by market or segment?
15
towerswatson.com © 2013 Towers Watson. All rights reserved. Proprietary and Confidential. For Towers Watson and Towers Watson client use only.
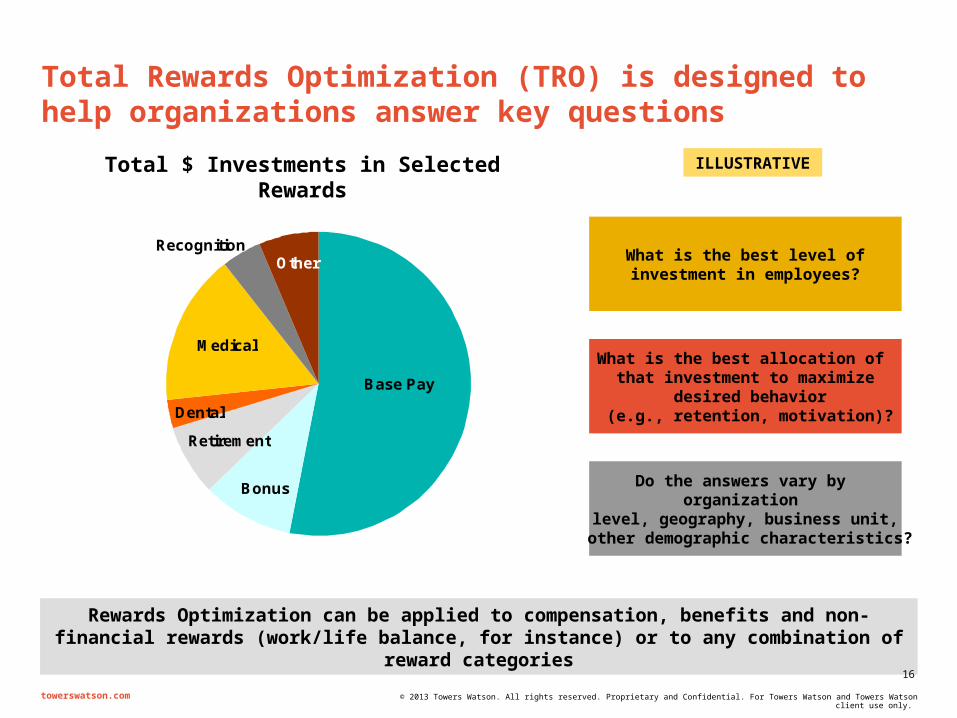
Total Rewards Optimization (TRO) is designed to help organizations answer key questions
Base Pay andCash Incentives$929.8 million
What is the best level ofinvestment in employees?
Benefits$81 million
What is the best allocation of that investment to maximize
desired behavior (e.g., retention, motivation)?
Do the answers vary by organization
level, geography, business unit, other demographic characteristics?
Rewards Optimization can be applied to compensation, benefits and non-financial rewards (work/life balance, for instance) or to any combination of reward categories
Base Pay
Bonus
Medical
Dental
Retirement
RecognitionOther
Total $ Investments in Selected Rewards ILLUSTRATIVE
16
towerswatson.com © 2013 Towers Watson. All rights reserved. Proprietary and Confidential. For Towers Watson and Towers Watson client use only.
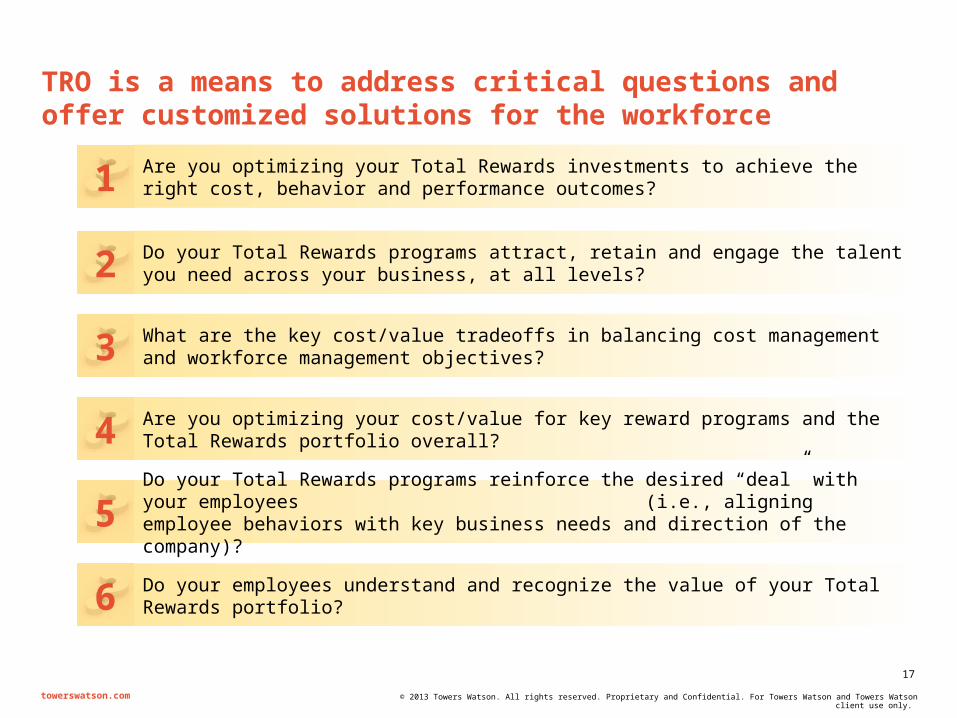
TRO is a means to address critical questions and offer customized solutions for the workforce
Are you optimizing your Total Rewards investments to achieve the right cost, behavior and performance outcomes?1
Do your Total Rewards programs attract, retain and engage the talent you need across your business, at all levels?2
What are the key cost/value tradeoffs in balancing cost management and workforce management objectives?3
Are you optimizing your cost/value for key reward programs and the Total Rewards portfolio overall?4
Do your Total Rewards programs reinforce the desired “deal” with your employees (i.e., aligning employee behaviors with key business needs and direction of the company)?
5
Do your employees understand and recognize the value of your Total Rewards portfolio? 6
17

towerswatson.com © 2013 Towers Watson. All rights reserved. Proprietary and Confidential. For Towers Watson and Towers Watson client use only.
Compared to a traditional survey, TRO provides richer data insights to better inform programmatic decisions
Focus Groups
Traditional Survey
Conjoint Survey
Total Rewards Optimization
Directional information on understanding and importance of programs Information on employee awareness and understanding of current programs Quantitative information on the most important rewards Accurate information on various employee segments Data and analysis on how specific rewards changes/trade-offs will affect employees Data and analysis on what specific rewards changes will cost ROI for specific rewards changes or reallocations Ability to test cost-benefit of different rewards and demographic scenarios with modeling tool
18
towerswatson.com © 2013 Towers Watson. All rights reserved. Proprietary and Confidential. For Towers Watson and Towers Watson client use only.
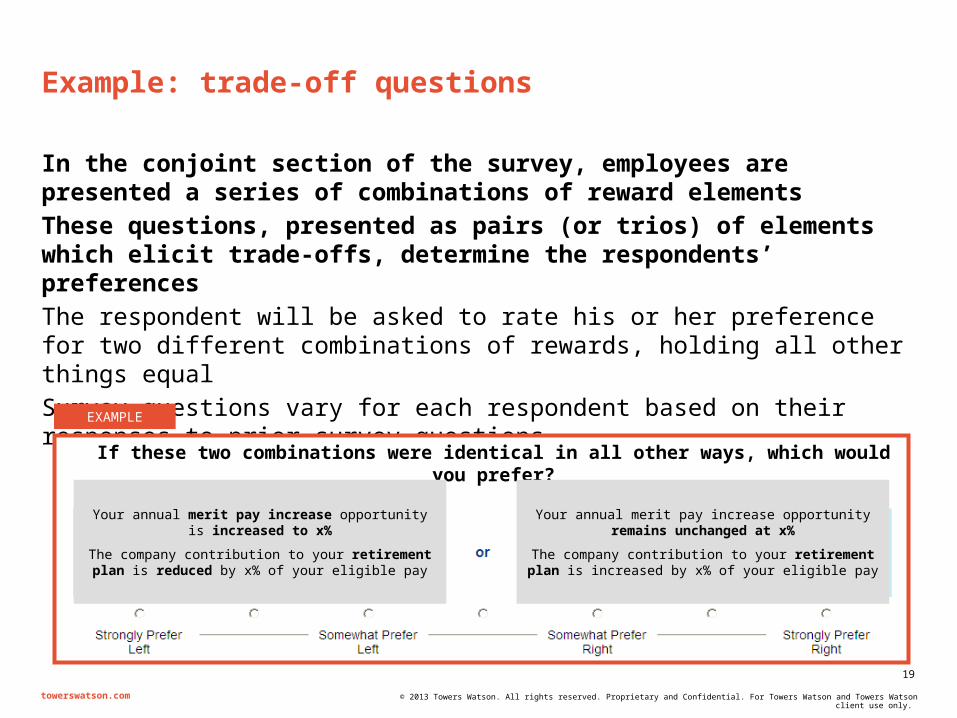
Example: trade-off questions
In the conjoint section of the survey, employees are presented a series of combinations of reward elements
These questions, presented as pairs (or trios) of elements which elicit trade-offs, determine the respondents’ preferences
The respondent will be asked to rate his or her preference for two different combinations of rewards, holding all other things equal
Survey questions vary for each respondent based on their responses to prior survey questions
If these two combinations were identical in all other ways, which would you prefer?
Your annual merit pay increase opportunity is increased to x%
The company contribution to your retirement plan is reduced by x% of your eligible pay
Your annual merit pay increase opportunity remains unchanged at x%
The company contribution to your retirement plan is increased by x% of your eligible pay
EXAMPLE
19
towerswatson.com © 2013 Towers Watson. All rights reserved. Proprietary and Confidential. For Towers Watson and Towers Watson client use only.
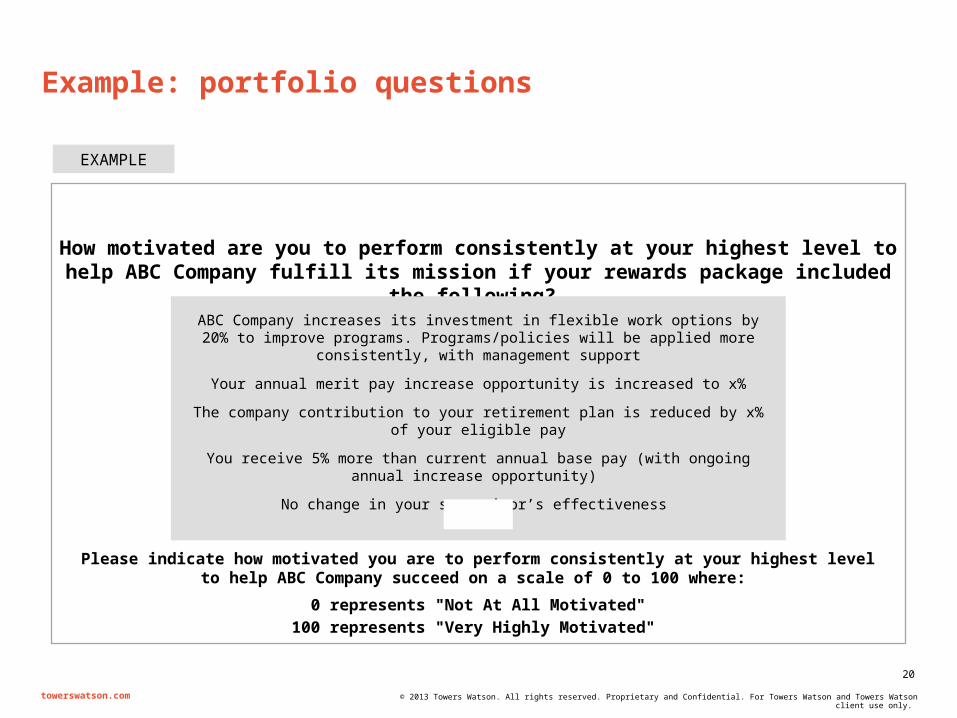
Example: portfolio questions
How motivated are you to perform consistently at your highest level to help ABC Company fulfill its mission if your rewards package included the following?
EXAMPLE
Please indicate how motivated you are to perform consistently at your highest level to help ABC Company succeed on a scale of 0 to 100 where:
0 represents "Not At All Motivated"
100 represents "Very Highly Motivated"
ABC Company increases its investment in flexible work options by 20% to improve programs. Programs/policies will be applied more consistently, with management
support
Your annual merit pay increase opportunity is increased to x%
The company contribution to your retirement plan is reduced by x% of your eligible pay
You receive 5% more than current annual base pay (with ongoing annual increase opportunity)
No change in your supervisor’s effectiveness
20

towerswatson.com © 2013 Towers Watson. All rights reserved. Proprietary and Confidential. For Towers Watson and Towers Watson client use only.
Optimum Levelof Investment
Optimum Allocationof Investment
Segment-Specific Strategy
PortfolioOptimization
ConjointAnalysis
Reflects cost constraints on investment
Develops an efficient frontier of optimum allocation of investments
Determines optimum investment level on the basis of program costs and turnover cost savings
Optimum solution may be to Improve retention/motivation
by changing allocation while maintaining the current level of investment
Maintain current level of retention/motivation at lower level of investment by changing allocation
Increase investment and retention/motivation to economically efficient level
+ = Is a surveying method
used for many years in marketing to capture subjective preferences
Asks employees to make trade-offs among program features as opposed to assessing the features individually
Is a more reliable forecast
of behavior than traditional survey methods
TRO combines conjoint analysis with financial optimization
21
towerswatson.com © 2013 Towers Watson. All rights reserved. Proprietary and Confidential. For Towers Watson and Towers Watson client use only.
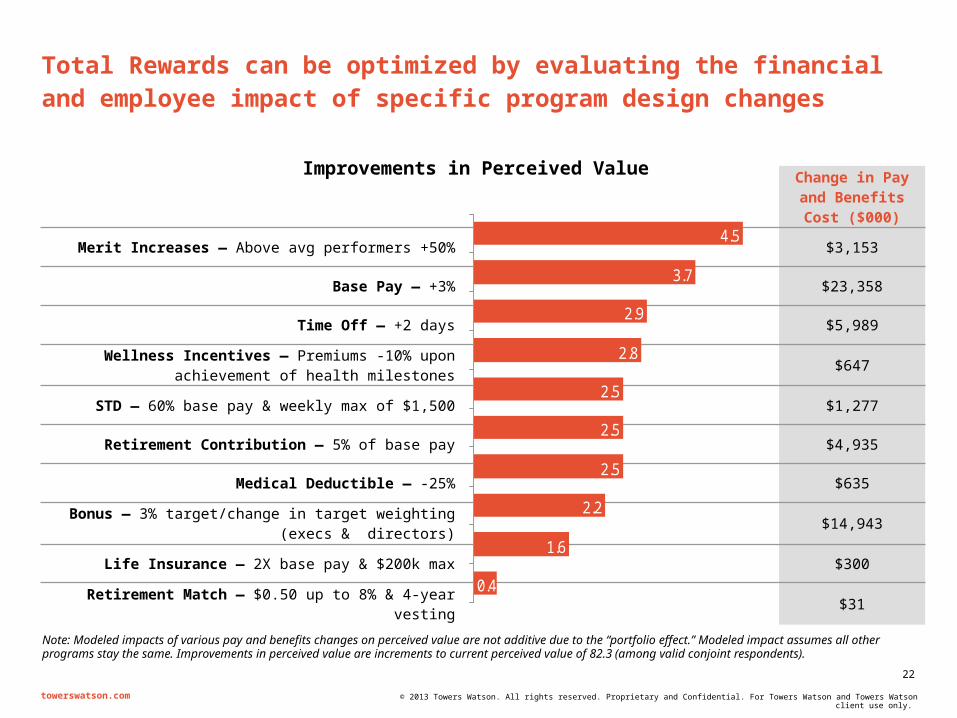
Change in Pay and Benefits Cost ($000)
Merit Increases — Above avg performers +50% $3,153
Base Pay — +3% $23,358
Time Off — +2 days $5,989
Wellness Incentives — Premiums -10% upon achievement of health milestones $647
STD — 60% base pay & weekly max of $1,500 $1,277
Retirement Contribution — 5% of base pay $4,935
Medical Deductible — -25% $635
Bonus — 3% target/change in target weighting (execs & directors) $14,943
Life Insurance — 2X base pay & $200k max $300
Retirement Match — $0.50 up to 8% & 4-year vesting $31
4.5
3.7
2.9
2.8
2.5
2.5
2.5
2.2
1.6
0.4
Total Rewards can be optimized by evaluating the financial and employee impact of specific program design changes
Improvements in Perceived Value
Note: Modeled impacts of various pay and benefits changes on perceived value are not additive due to the “portfolio effect.” Modeled impact assumes all other programs stay the same. Improvements in perceived value are increments to current perceived value of 82.3 (among valid conjoint respondents).
22

towerswatson.com © 2013 Towers Watson. All rights reserved. Proprietary and Confidential. For Towers Watson and Towers Watson client use only.
Understanding what employees value — opportunities for improving employee perceived value and associated costs
Note: Modeled impacts of various pay and benefits changes on perceived value are not additive due to the “portfolio effect.” Modeled impact assumes all other programs stay the same. Improvements in perceived value are increments to current perceived value of 83.2 for A respondents and 79.1 for B respondents (among valid conjoint respondents).
Division ADivision B
4.4
3.6
2.9
2.7
2.4
2.3
2.1
2.0
1.5
-0.2
4.9
4.0
3.2
3.0
3.4
3.9
2.7
3.1
2.0
2.6
Improvements in Perceived Value Change in Pay and Benefits Cost ($000)
Merit Increases — Above avg performers +50%
$3,153
Base Pay — +3% $23,358
Time Off — +2 days $5,989
Wellness Incentives — Premiums -10% upon achievement of health milestones
$647
STD — 60% base pay & weekly max of $1,500 $1,277
Retirement Contribution — 5% of Base Pay $4,935
Medical Deductible — -25% $635
CARE/Bonus — 3% target/change in target weighting (execs & directors)
$14,943
Life Insurance — 2X base pay & $200k max $300
Retirement Match — $0.50 up to 8% & 4-year vesting
$31
23

towerswatson.com © 2013 Towers Watson. All rights reserved. Proprietary and Confidential. For Towers Watson and Towers Watson client use only.
-4.2
-4.5
-4.7
-6.6
-7.1
-7.4
-7.6
-8.1
-2.2
-4.2
-4.6
-5.0
-6.8
-6.9
-7.5
-7.8
-8.6
-1.1
Change in Pay and Benefits Cost ($000)
($4,635) Medical Premiums — +20%
($570) Medical Copays — +25%
($360) Prescription Copays — +25%
($5,989) Time Off — -2 days
($1,452) Medical Deductible — +25%
($473) Medical Copays — Coinsurance of 20%
($294)Prescription Copays — Coinsurance of 20%
($1,670)Wellness Incentives — Premiums +10% upon failure to meet health milestones
($3,750) CARE/Bonus — Eliminated
Understanding what employees value — identifying cost savings and the associated decrease in employee perceived value
Note: Modeled impacts of various pay and benefits changes on perceived value are not additive due to the “portfolio effect.” Modeled impact assumes all other programs stay the same. Declines in perceived value are decrements to current perceived value of 83.2 for A respondents and 79.1 for B respondents (among valid conjoint respondents).
Declines in Perceived Value
Division ADivision B
24
towerswatson.com © 2013 Towers Watson. All rights reserved. Proprietary and Confidential. For Towers Watson and Towers Watson client use only.
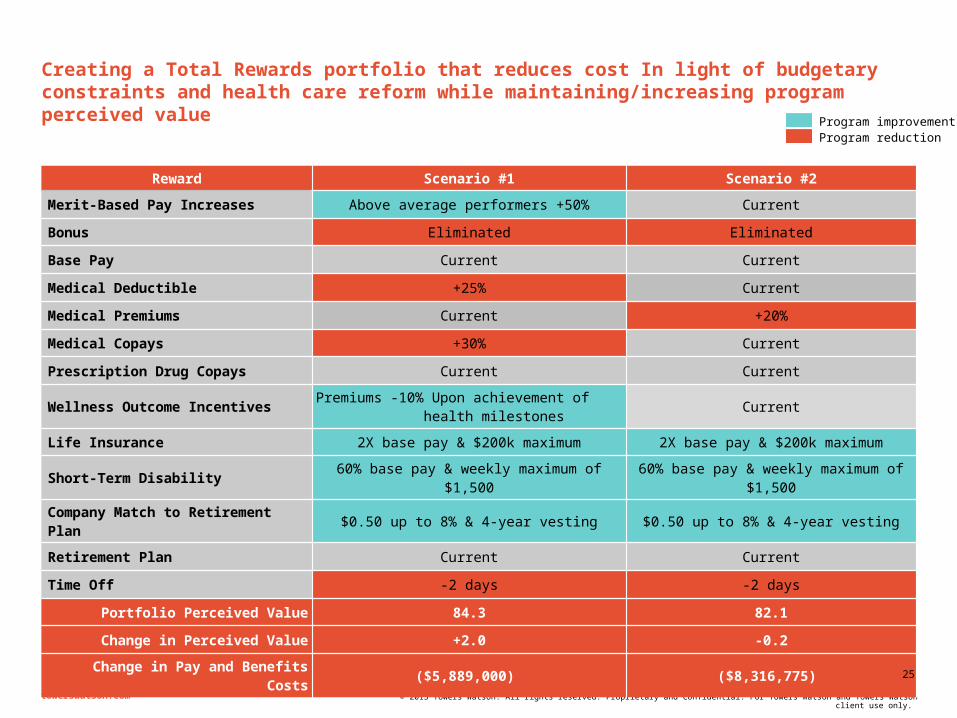
Creating a Total Rewards portfolio that reduces cost In light of budgetary constraints and health care reform while maintaining/increasing program perceived value
Reward Scenario #1 Scenario #2
Merit-Based Pay Increases Above average performers +50% Current
Bonus Eliminated Eliminated
Base Pay Current Current
Medical Deductible +25% Current
Medical Premiums Current +20%
Medical Copays +30% Current
Prescription Drug Copays Current Current
Wellness Outcome Incentives Premiums -10% Upon achievement of health milestones Current
Life Insurance 2X base pay & $200k maximum 2X base pay & $200k maximum
Short-Term Disability 60% base pay & weekly maximum of $1,500 60% base pay & weekly maximum of $1,500
Company Match to Retirement Plan $0.50 up to 8% & 4-year vesting $0.50 up to 8% & 4-year vesting
Retirement Plan Current Current
Time Off -2 days -2 days
Portfolio Perceived Value 84.3 82.1
Change in Perceived Value +2.0 -0.2
Change in Pay and Benefits Costs ($5,889,000) ($8,316,775)
Program improvementProgram reduction
25

towerswatson.com © 2013 Towers Watson. All rights reserved. Proprietary and Confidential. For Towers Watson and Towers Watson client use only.
Three Points on the Curve
1) To reduce total cost, the curve identifies which programs should be reduced to reallocate investments in other areas and maintain current level of perceived value
2) To maintain current investment levels, the curve identifies how to reallocate investment across programs to increase perceived value without raising cost
3) To increase perceived value dramatically and make the most of each reward dollar, the curve indicates the best ways to invest additional rewards funds
–$20mm 0 $10mm
Increase in Indicated Perceived Value from Current Level
(Percentage)
–$10mm $20mm $30mm
Increase in investmentfrom current level
Decrease in investment from current level
2) Maintain current level of investment while increasing perceived value1) Maintain current
level of perceived value at lower investment
10%
20%
30%
40%
Portfolio optimization analysis
Current levels of perceived value and reward investment
3) Increase investment and increase perceived value Each point along the curve
represents the best allocation of the corresponding total investment
26

towerswatson.com © 2013 Towers Watson. All rights reserved. Proprietary and Confidential. For Towers Watson and Towers Watson client use only.
Case study #1: health care organization
Situation
12,000 employees, ten hospitals, five clinics Acute, long-term and home health care 33% annual turnover among nurses, technicians, and
support services Many millions spent on contract labor due to high turnover
and volatile staffing requirements Labor shortage and agency market preventing competition
for labor based solely on pay Desire to avoid “silver bullet” approaches to reducing
unwanted turnover
Actions
Conducted focus groups in each facility to develop the survey; invited all employees to participate in online survey
Analyzed results by position and service offering to determine optimum rewards portfolios
After corporate review, presented/discussed results with facility leadership to build the case for change and discuss next steps
Implemented changes to training, leadership development, dental plan, tuition reimbursement, PTO, and medical insurance
Actual Results
Turnover dropped from 33% to 21% (a 36% improvement over three years)
Turnover dropped even as area turnover was increasing
Recommended changes to rewards generated an ROI of $4M in year one, contributed to system’s stronger financial performance
Gallup scores increased from 3.46 to 3.8 Avoided large-scale pay increase with a
negative return on investment
Projected –vs– Actual Results
The optimization model projected a 10% drop in turnover, while actual results produced at 12% reduction
Please note, this kind of comparison is directional rather than exact. As is common, how organizations implement a number of rewards changes to address employee turnover issues varies, which could include some changes that were not modeled in the TRO analyses
27
towerswatson.com © 2013 Towers Watson. All rights reserved. Proprietary and Confidential. For Towers Watson and Towers Watson client use only.
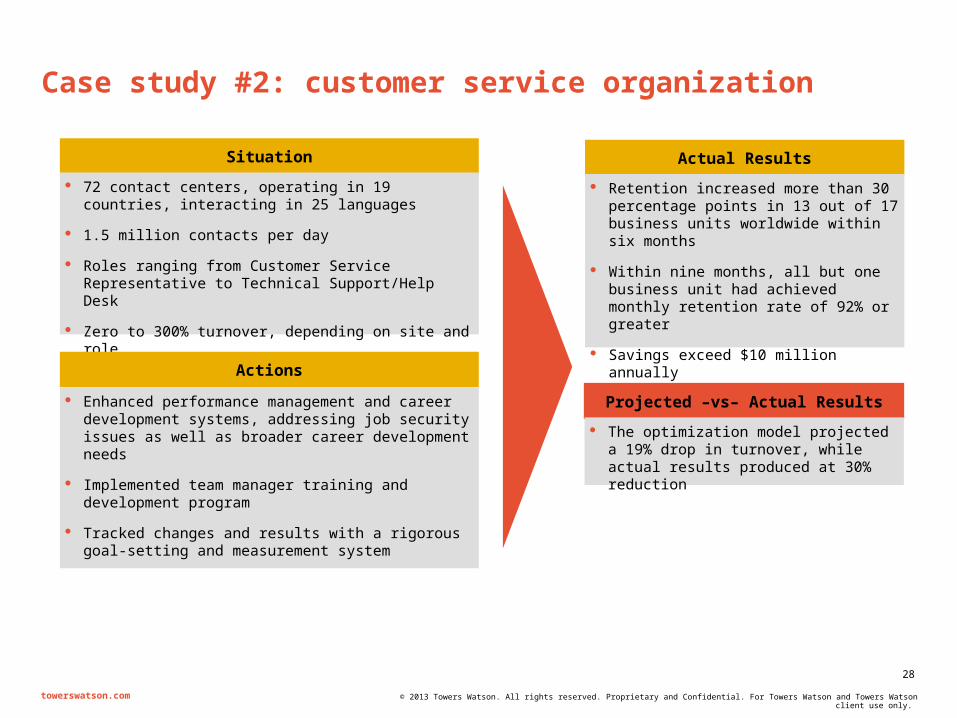
Case study #2: customer service organization
Situation
72 contact centers, operating in 19 countries, interacting in 25 languages
1.5 million contacts per day
Roles ranging from Customer Service Representative to Technical Support/Help Desk
Zero to 300% turnover, depending on site and role
Actions
Enhanced performance management and career development systems, addressing job security issues as well as broader career development needs
Implemented team manager training and development program
Tracked changes and results with a rigorous goal-setting and measurement system
Actual Results
Retention increased more than 30 percentage points in 13 out of 17 business units worldwide within six months
Within nine months, all but one business unit had achieved monthly retention rate of 92% or greater
Savings exceed $10 million annually
Projected –vs– Actual Results
The optimization model projected a 19% drop in turnover, while actual results produced at 30% reduction
28

towerswatson.com © 2013 Towers Watson. All rights reserved. Proprietary and Confidential. For Towers Watson and Towers Watson client use only.
29
towerswatson.com © 2013 Towers Watson. All rights reserved. Proprietary and Confidential. For Towers Watson and Towers Watson client use only.
For More Information
To learn more about Towers Watson’s Total Rewards Optimization and related research, please follow
(http://www.towerswatson.com/en/Services/Services/total-rewards-optimization)
Please also contact: Lubomira (Lubca) PaclikovaSenior Consultant
901 North Glebe Road | Arlington, VA 22203 Phone: [email protected]
Richard GendronSenior Consultant
901 North Glebe Road | Arlington, VA 22203 Phone: [email protected]
30