Three-Dimensional Distribution of Ryanodine Receptor Clusters inCardiac Myocytes
Ye Chen-Izu,* Stacey L. McCulle,* Chris W. Ward,y Christian Soeller,z Bryan M. Allen,§ Cal Rabang,{
Mark B. Cannell,z C. William Balke,* and Leighton T. Izu**University of Kentucky, College of Medicine, Lexington, Kentucky; yUniversity of Maryland, School of Nursing, Baltimore, Maryland;zUniversity of Auckland, Auckland, New Zealand; §Rochester Institute of Technology, Rochester, New York; and {University of Maryland,Baltimore County, Maryland
ABSTRACT The clustering of ryanodine receptors (RyR2) into functional Ca21 release units is central to current models forcardiac excitation-contraction (E-C) coupling. Using immunolabeling and confocal microscopy, we have analyzed the distributionof RyR2 clusters in rat and ventricular atrial myocytes. The resolution of the three-dimensional structure was improved by a noveltransverse sectioning method as well as digital deconvolution. In contrast to earlier reports, the mean RyR2 cluster transversespacingwasmeasured1.05mm in ventricularmyocytes andestimated0.97mm inatrialmyocytes. IntercalatedRyR2clusterswerefound interspersed between the Z-disks on the cell periphery but absent in the interior, forming double rows flanking the localZ-disks on the surface. The longitudinal spacing between the adjacent rows of RyR2 clusters on the Z-diskswasmeasured to havea mean value of 1.87 mm in ventricular and 1.69 mm in atrial myocytes. The measured RyR2 cluster distribution is compatible withmodels of Ca21 wave generation. The size of the typical RyR2 cluster was close to 250 nm, and this suggests that;100 RyR2smight be present in a cluster. The importance of cluster size and three-dimensional spacing for current E-C coupling models isdiscussed.
INTRODUCTION
The ryanodine receptor subtype 2 (RyR2) is predominantly
expressed in cardiac muscle (1–3) and plays a central role
in the Ca21 signaling that controls cardiac excitation-
contraction (E-C) coupling. The RyR2 molecule is a protein
tetramer with molecular mass of 565 kDa per subunit (4,5).
Structurally, the RyR2 molecules are congregated in discrete
clusters that are densely localized in the Z-disk (or Z-line as
viewed in the two-dimensional image) in cardiac myocytes
(6). Functionally, the RyR2 serves as an intracellular Ca21
channel in the sarcoplasmic reticulum (SR) membrane. An
increase in the cytosolic Ca21 opens the RyR2 channel to
allow Ca21 release from the SR into the cytosol, triggering a
regenerative process known as Ca21-induced Ca21 release
(7–9). Hence the RyR2 molecules in a cluster are activated
by Ca21 in a cooperative manner, releasing quantal amounts
of Ca21 that are visualized as Ca21 sparks (10–13). In other
words, a RyR2 cluster serves as an elementary Ca21 release
unit (CRU) in cardiac myocytes. We will use these two terms
interchangeably from here on.
Distribution of the discrete RyR2 clusters in three-
dimensional (3-D) space provides structural arrangements
for the local control of CRUs by L-type Ca21 channels,
which permits the graded control of cardiac E-C coupling
(14). In further development of this idea, recent studies show
that the stochastic nature of discrete CRUs also play a part in
determining the spread of Ca21 release events from CRUs to
the neighboring CRUs in the form of propagating Ca21
waves (15–17). Spontaneously arising Ca21 waves can dis-
rupt normal muscle contraction and electrical activity (18),
leading to fibrillation and arrhythmias in ventricular and
atrial myocytes. In the atrial myocytes that lack a t-tubule
system, action potential-triggered Ca21 waves also serve a
physiological function by facilitating a rapid increase of
global Ca21 to cause muscle contraction (19,20).
The Ca21 signaling system, in essence, is a controlled non-
linear dynamic system with positive feedback (due to Ca21-
induced Ca21 release from RyR2). The control of Ca21
wave generation is influenced by multiple factors, including
the SR Ca21 load, the endogenous Ca21 buffers, the Ca21-
sensitivity of RyR2, and the spatial distance between the
RyR2 clusters. To understand the Ca21-signaling dynamics
in cardiac myocytes, we aim to develop a quantitative model
that is based on realistic parameters measured from the cells.
In our earlier modeling of Ca21 spark properties and the
Ca21 wave dynamics in atrial cells, we used a CRU trans-
verse spacing of 2 mm as reported in a previous publication
(21), along with the well-established longitudinal spacing of
2 mm. However, our modeling study suggested that Ca21
waves could not initiate unless the transverse spacing is
closer to 1 mm. This problem highlights the need for detailed
knowledge on the spatial organization of CRUs, and we have
SubmittedNovember 3, 2005, and accepted for publication February 1, 2006.
Address reprint requests to Leighton T. Izu, PhD, Institute of Molecular
Medicine, University of Kentucky BBSRB, Rm. B257, 741 South
Limestone St., Lexington, KY 40536-0509. Tel.: 859-323-6882; E-mail:
[email protected]; web site: http://www.mc.uky.edu/imm/; or Ye
Chen-Izu, PhD, Institute of Molecular Medicine, University of Kentucky
BBSRB, Rm. B257, 741 South Limestone St., Lexington, KY 40536-0509,
Tel.: 859-323-6882; E-mail: [email protected]; web site: http://www.
mc.uky.edu/imm/.
� 2006 by the Biophysical Society
0006-3495/06/07/1/13 $2.00 doi: 10.1529/biophysj.105.077180
Biophysical Journal Volume 91 July 2006 1–13 1
therefore carried out a study to obtain accurate measurements
of the 3-D distribution of RyR2 clusters in cardiac myocytes.
We used antibody labeling and confocal microscopy to
visualize the RyR2 clusters in rat ventricular and atrial myo-
cytes. To improve the accuracy in measuring the distance
between adjacent clusters, we developed a new method to
take confocal images of the cell’s transverse plane in ad-
dition to the longitudinal plane to achieve high resolution
(confocal microscope x,y resolution of 0.25 mm) for all three
spatial dimensions and analyzed these data using a density-
dependent filter. Thus we obtained the distribution of RyR2
clusters in three regions of interest (ROIs): 1), along the
longitudinal direction, 2), within the transverse plane, and 3),
as a novel finding interspersed between the Z-lines on the
cell periphery (intercalated RyR2 clusters). In addition, we
also performed 3-D image deconvolution and reconstruction
to aid visualization of the RyR2 cluster distribution. Based
on these measurements we constructed a model to reflect the
3-D geometry of CRU distribution in the ventricular and
atrial myocytes. This model is used in our construction of a
quantitative model to simulate the relationship between the
CRU spacing and the probability of Ca21 wave initiation
and propagation, and to predict the influence of altered CRU
spacing on the spontaneous Ca21 wave generation under
pathological conditions (22).
METHODS AND MATERIALS
Cell isolation
The Sprague-Dawley rats were purchased from Harlan (Indianapolis, IN).
Rats were anesthetized with sodium pentobarbital (100 mg/kg injected IP,
4000 u/kg heparin). After the suppression of spinal cord reflexes, the hearts
were removed via midline thoracotomy. A standard enzymatic technique
(20) was used to isolate the ventricle and atrial myocytes. All animals and
procedures were handled strictly in accordance with the National Institutes
of Health guidelines and protocols approved by our Institutional Animal
Care and Use Committee.
Chemicals and reagents were purchased from Sigma-Aldrich (St. Louis,
MO) if not specified otherwise.
Frozen tissue section preparation
The heart was first perfused with Ca21-free phosphate buffered saline (PBS)
by injection into the left ventricle with venting from a small incision on the
right atrial free wall (;60 ml/30 s). The heart was then removed and laterally
dissected to expose the ventricular walls and chambers. Tissue freezing
medium was filled into the chambers to preserve the morphology during the
subsequent freezing process. The tissue was flash frozen by submerging first
into chilled isopentane for 10–20 s, then placed in dry ice, and finally stored
in a �80�C freezer. For thin sectioning, the frozen tissue was placed in a
Reichert Cryostat 2800 Frigocut-E (Bannockburn, IL) and allowed to
equilibrate to the box temperature of �30�C. The tissue was then sliced into
20 mm thick sections. The frozen tissue sections were again stored in a
�80�C freezer until use.
Antibody labeling of isolated cells
Freshly isolated ventricular and atrial myocytes were fixed in 1%
paraformaldehyde PBS solution for 5 min, washed twice in cold PBS,
then permeablized in 0.1% Triton X-100 PBS solution for 5 min. The cells
were incubated in the primary antibody (1:100 dilution) solution containing
5% bovine serum albumin (BSA), 3% goat serum 0.01%, and Triton X-100
in PBS for 1.5–2 h at room temperature; washed twice in cold PBS, and then
incubated in the Alexa Fluor 488 conjugated secondary antibody (1:200
dilution, Molecular Probes, Eugene, OR) solution for 1.5–2 h at room
temperature. For specific labeling of RyR2, we used anti-RyR2 monoclonal
antibody (mouse IgG1, clone C3-33, from Affinity BioReagents, Golden,
CO) that strongly detects RyR2 and only weakly detects RyR1 (23,24). In
some earlier experiments, we also used a polyclonal anti-RyR2 (aa5029)
antibody (rabbit IgG, from A. R. Marks Lab, Columbia University, New
York, NY) and another monoclonal antibody (mouse IgG1, clone C34 from
Affinity BioReagents), which detects RyR2 as well as RyR1 and RyR3. All
antibodies generated similar labeling patterns.
The quality of labeling was evaluated by the maintenance of cell mor-
phology (i.e., clear striations, rod-like shape for ventricular cells, and
spindle-like shape for atrial cells) and the uniformly bright labeling. In well-
preserved and well-labeled cells, the peripheral RyR2 labeling shows a
clean and smooth outline and the intercalated RyR2 units are clearly visible.
In contrast, in overpermeablized cells the peripheral outline often became
jagged and the intercalated RyR2 units were missing.
Antibody labeling of tissue sections
The tissue sample slides were thawed at room temperature for 5 min.
The tissue sections were incubated in the blocking solution containing
5% goat serum and 3% BSA in PBS for 30 min, rinsed twice in PBS,
then incubated in the primary antibody solution (1:200 dilution) for 1.5 h,
rinsed twice in PBS, and then incubated in the secondary antibody solu-
tion (1:200 dilution) for another 1.5 h. The antibody-labeled tissue sections
were covered with antifade and sealed under a No. 1 glass coverslip for
imaging.
Confocal imaging of the longitudinal andtransverse sections of cardiac myocytes
Confocal images were obtained using a BioRad (Hercules, CA) Radiance
2000 confocal microscope with a water emersion objective 633 numerical
aperture 1.2, corrected for the thickness of the No. 1 glass coverslip. The
pixel dimensions are 0.02 mm 3 0.02 mm in the focal plane, and the
z-sectioning interval was 0.2 mm. For 3-D image deconvolution, we
determined the microscope’s point spread function (PSF) following the
method of Hollingworth et al. (25) with cubic pixels of 0.10 mm in x, y, and
z. Briefly, we embedded fluorescence beads (Molecular Probes) in the
agarose gel with a refractive index of 1.38 (30% sucrose, 0.5% agarose) to
match the cell’s refractive index and used the optical settings for Alexa Fluor
488 to obtain a series of x-y (pixel size 0.10 3 0.10 mm) images of a single
fluorescent bead (f ; 0.17 mm) using z-sectioning (z interval 0.1 mm),
starting 20 mm below and ending 20 mm above the bead. Deconvolution and
reconstruction of 3-D images was carried out using the method described
previously (26).
High resolution images were obtained from both the longitudinal and
transverse sections of cardiac myocytes. For longitudinal sectioning, the
cells were suspended in solution and allowed to settle on the glass coverslip,
and hence the cell’s longitudinal plane was naturally oriented in parallel to
the microscope’s focal plane. For transverse sectioning, we embedded the
cells in agarose with a low melting temperature (,36�C, 1.5%–2% in PBS).
The cells became immobilized at various orientations after cooling the agar
to room temperature. This cell-in-agar ‘‘sausage’’ was then sliced and placed
onto the glass coverslip for confocal imaging. By chance, some of the cells
embedded in the agarose were oriented with the transverse plane parallel to
the glass coverslip (Fig. 3 D), which allowed optical sectioning in transverse
planes to take advantage of the x,y resolution of ;0.25 mm, instead of the
z-resolution of ;1 mm.
2 Chen-Izu et al.
Biophysical Journal 91(1) 1–13
Measurement of RyR2 separation distances in thelongitudinal section images
Three characteristic RyR2 cluster separation distances were measured in
the isolated ventricular and atrial myocytes: 1), the longitudinal spacing, 2),
the transverse spacing, and 3), the peripheral spacing. Measurements were
taken only in the regions of the cell where the RyR2 were arrayed on a
straight line. Since atrial cells were often curved, measurements were taken
from shorter straight sections. To measure, for example, the transverse
spacing, the image was rotated to make the RyR2 row horizontal. The ROI
was selected (yellow box in Fig. 2 A), and the fluorescence intensity averaged
along the width of the region (0.8 mm wide in 40 pixels) was plotted against
the length of the region. The spacing between RyR2 clusters is defined as the
distance between peaks in the average fluorescence values.
Measurement of nearest neighbor distancebetween RyR2 clusters in the transversesection images
Among the randomly oriented cells imbedded in agar, our measurements
were carried out only on cells that were vertically oriented, that is, their
longitudinal axis parallel to the optical axis and their transverse plane
parallel to the microscope focal plane. The distinction between vertically
oriented cells from those that were tilted is based on the criteria that
vertically oriented cells showed no lateral motion of the surface contour as
the focal plane traveled up and down the z axis (z-sectioning), whereas the
surface contour of tilted cells migrated systematically across the optical field.
Examples of z-sections of a vertical and a tilted myocyte are available in the
Supplementary Materials in the movies of stacked images.
To determine the nearest neighbor distance of RyR2 clusters in a
transverse section, a binary image was generated by eliminating all pixels
whose values were ,0.8 of the maximum in that image. The binary image
had ‘‘islands’’ of closely packed pixels with variable sizes as well as isolated
‘‘atolls’’ that had only a few neighboring pixels or a single pixel. We used a
density-dependent filter (27) to fill in the coves in the islands and to remove
atolls using a ‘‘live-or-die’’ algorithm. The parameters in the filter were
optimized to recover the identifiable labeling in the original images and the
algorithm tested using model simulations. The resulting islands are hence
identified as clusters of RyR2. The distance between the center of masses of
island i and every other island was calculated, and the shortest distance was
the nearest neighbor distance to island i. We only used transverse sections
spaced 2 mm apart to minimize the contribution of fluorescence from
adjacent Z-disks.
Confocal imaging of antibody-labeledtissue sections
Confocal imaging of the antibody-labeled tissue sections was carried out
using the same optical settings as for imaging isolated cells. The focal plane
was placed in the middle of the 20 mm thick tissue slice to avoid the interface
between the tissue and the glass. To obtain the RyR2 cluster longitudinal
spacing in the tissue cross section, we selected the muscle bundles with the
longitudinal axis oriented in parallel to the microscope’s focal plane. The
samples were chosen by randomly scanning the ventricular tissue section to
find such longitudinally running muscle bundles in the optical field. We also
sampled various areas in the tissue sections to obtain an average value.
Measurement of sarcomere spacing
Freshly isolated cardiac myocytes were bathed in the Tyrode solution
containing (in mM): NaCl 135, KCl 4, NaHPO4 0.33, MgSO4 1, HEPES 10,
Glucose 10, CaCl2 1.8, pH 7.3. The cell suspension was placed in a chamber
mounted on the microscope stage (Nikon, Tokyo, Japan) with a No. 1 glass
coverslip forming the bottom of the chamber. The cells were oriented with
the longitudinal plane parallel to the focal plane. We used an IonOptix
system (IonOptix, Milton, MA) to acquire transmitted light images of
the cell, measure the optical density across the sarcomeres, and calculate
the average sarcomere spacing using a fast Fourier transform algorithm.
RESULTS
Antibody labeling of RyR2 in the isolated celland in the tissue cross section
The RyR2 labeling in rat cardiac myocytes displays punctate
staining with a well-organized pattern. Fig. 1 shows
pseudocolored confocal images of the RyR2 labeling in the
ventricular and atrial myocytes in isolated cell preparations
and in frozen tissue cross sections. The RyR2 clusters were
identified by a monoclonal anti-RyR2 antibody and visual-
ized using a secondary antibody-conjugated Alexa Fluor
488. The background fluorescence was negligible (data not
shown).
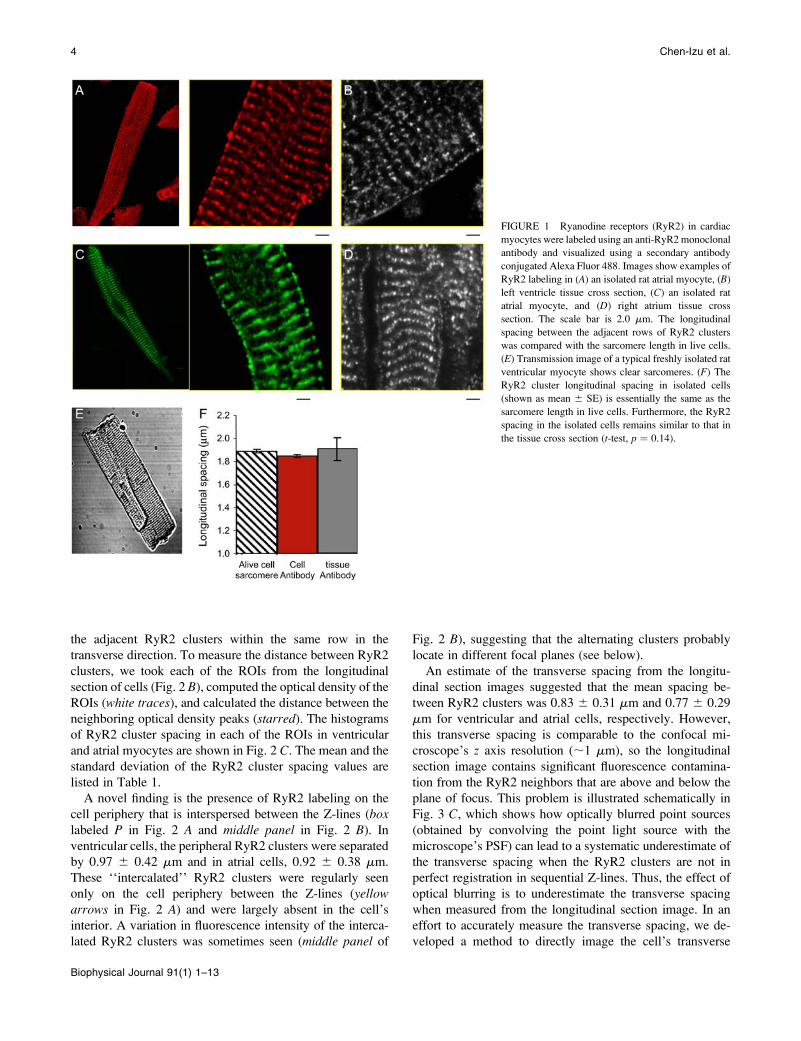
Measurements of the RyR2 cluster spacing in isolated
cells were made after taking precautions to ensure that the
antibody-labeling procedure did not alter cell shape or cluster
spacing. First we compared the longitudinal spacing between
the adjacent rows of RyR2 clusters (located on Z-lines) in the
antibody-labeled ventricular cells with the sarcomere length
(which is equal to the Z-line spacing according to the known
muscle ultrastructure) observed in freshly isolated live cells.
The former was 1.87 6 0.18 mm (mean 6 SD, n¼ 151 cells)
and the latter 1.89 6 0.12 mm (n ¼ 45 cells). The close
agreement of these values suggests that antibody-labeled
cells maintained the structure of live cells. We also compared
the RyR2 cluster spacing in the isolated cells with those in
the tissue cross sections. The longitudinal spacing in the
tissue samples was 1.94 6 0.31 mm, similar to that measured
in the isolated cells (t-test, p ¼ 0.14, Fig. 1 F).
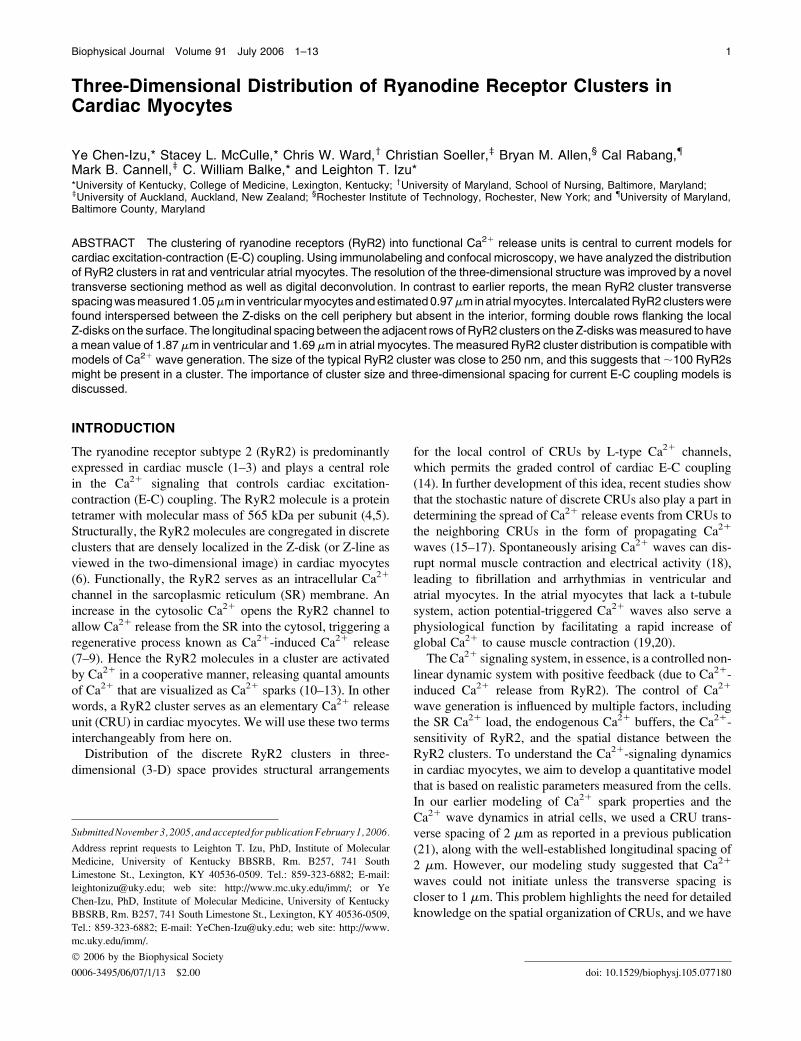
Three distinctive features of the RyR2 clusterdistribution measured from the longitudinalsection image
Due to their rod-like shape, isolated cardiac myocytes settle
onto the glass coverslip (mounted on the microscope stage)
with their longitudinal plane oriented parallel to the micro-
scope’s focal plane; and the confocal image taken in this
plane captures the cell’s longitudinal section as seen in Fig.
1. In the longitudinal section, the distribution pattern of
RyR2 clusters was characterized by three distinctive ROIs as
illustrated in Fig. 2 A: 1), the longitudinal spacing defined as
the distance between the adjacent rows of RyR2 clusters
along the longitudinal direction inside the cell, 2), the pe-
ripheral spacing as the distance between the adjacent RyR2
clusters along the longitudinal direction on the cell periph-
ery, and 3), the transverse spacing as the distance between
RyR2 Distribution in Cardiac Myocytes 3
Biophysical Journal 91(1) 1–13
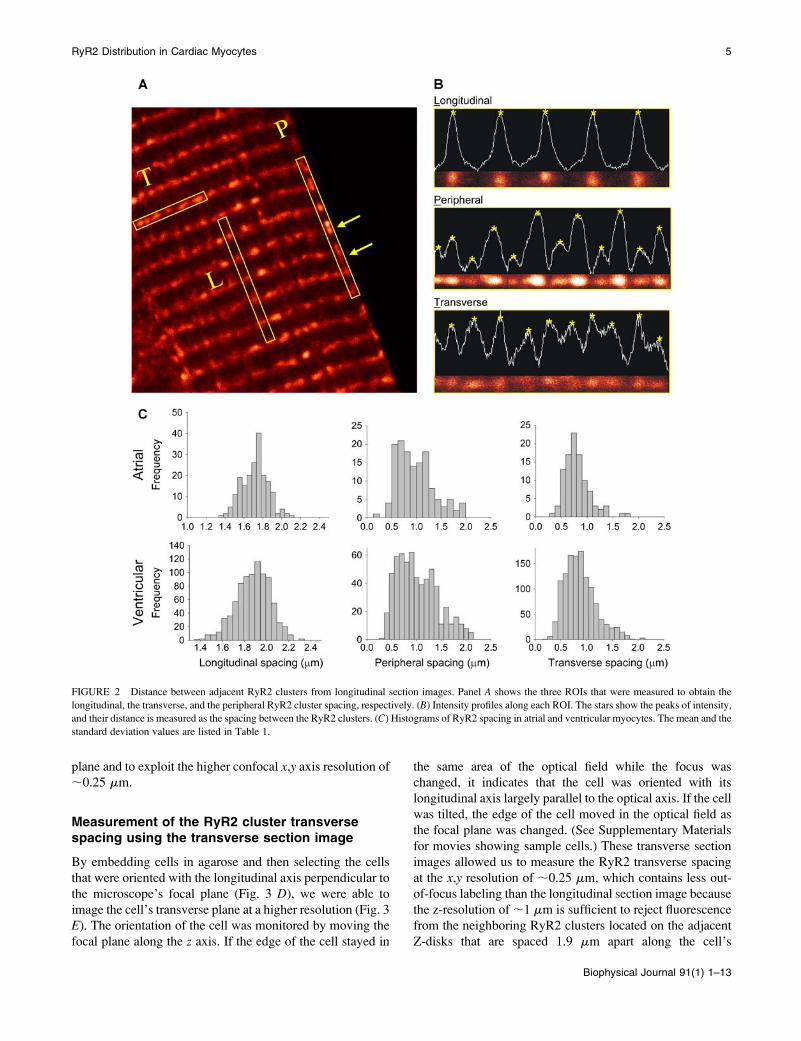
the adjacent RyR2 clusters within the same row in the
transverse direction. To measure the distance between RyR2
clusters, we took each of the ROIs from the longitudinal
section of cells (Fig. 2 B), computed the optical density of the
ROIs (white traces), and calculated the distance between the
neighboring optical density peaks (starred). The histograms
of RyR2 cluster spacing in each of the ROIs in ventricular
and atrial myocytes are shown in Fig. 2 C. The mean and the
standard deviation of the RyR2 cluster spacing values are
listed in Table 1.
A novel finding is the presence of RyR2 labeling on the
cell periphery that is interspersed between the Z-lines (boxlabeled P in Fig. 2 A and middle panel in Fig. 2 B). In
ventricular cells, the peripheral RyR2 clusters were separated
by 0.97 6 0.42 mm and in atrial cells, 0.92 6 0.38 mm.
These ‘‘intercalated’’ RyR2 clusters were regularly seen
only on the cell periphery between the Z-lines (yellowarrows in Fig. 2 A) and were largely absent in the cell’s
interior. A variation in fluorescence intensity of the interca-
lated RyR2 clusters was sometimes seen (middle panel of
Fig. 2 B), suggesting that the alternating clusters probably
locate in different focal planes (see below).
An estimate of the transverse spacing from the longitu-
dinal section images suggested that the mean spacing be-
tween RyR2 clusters was 0.83 6 0.31 mm and 0.77 6 0.29
mm for ventricular and atrial cells, respectively. However,
this transverse spacing is comparable to the confocal mi-
croscope’s z axis resolution (;1 mm), so the longitudinal
section image contains significant fluorescence contamina-
tion from the RyR2 neighbors that are above and below the
plane of focus. This problem is illustrated schematically in
Fig. 3 C, which shows how optically blurred point sources
(obtained by convolving the point light source with the
microscope’s PSF) can lead to a systematic underestimate of
the transverse spacing when the RyR2 clusters are not in
perfect registration in sequential Z-lines. Thus, the effect of
optical blurring is to underestimate the transverse spacing
when measured from the longitudinal section image. In an
effort to accurately measure the transverse spacing, we de-
veloped a method to directly image the cell’s transverse
FIGURE 1 Ryanodine receptors (RyR2) in cardiac
myocytes were labeled using an anti-RyR2 monoclonal
antibody and visualized using a secondary antibody
conjugated Alexa Fluor 488. Images show examples of
RyR2 labeling in (A) an isolated rat atrial myocyte, (B)
left ventricle tissue cross section, (C) an isolated rat
atrial myocyte, and (D) right atrium tissue cross
section. The scale bar is 2.0 mm. The longitudinal
spacing between the adjacent rows of RyR2 clusters
was compared with the sarcomere length in live cells.
(E) Transmission image of a typical freshly isolated rat
ventricular myocyte shows clear sarcomeres. (F) The
RyR2 cluster longitudinal spacing in isolated cells
(shown as mean 6 SE) is essentially the same as the
sarcomere length in live cells. Furthermore, the RyR2
spacing in the isolated cells remains similar to that in
the tissue cross section (t-test, p ¼ 0.14).
4 Chen-Izu et al.
Biophysical Journal 91(1) 1–13
plane and to exploit the higher confocal x,y axis resolution of
;0.25 mm.
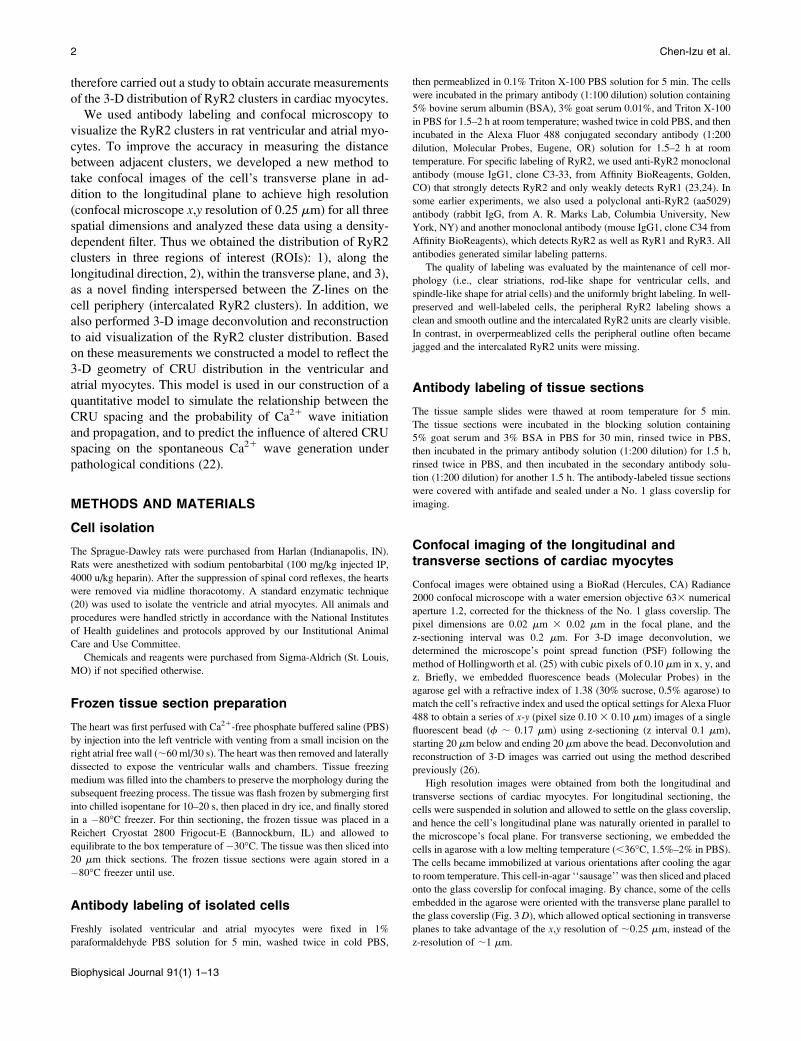
Measurement of the RyR2 cluster transversespacing using the transverse section image
By embedding cells in agarose and then selecting the cells
that were oriented with the longitudinal axis perpendicular to
the microscope’s focal plane (Fig. 3 D), we were able to
image the cell’s transverse plane at a higher resolution (Fig. 3
E). The orientation of the cell was monitored by moving the
focal plane along the z axis. If the edge of the cell stayed in
the same area of the optical field while the focus was
changed, it indicates that the cell was oriented with its
longitudinal axis largely parallel to the optical axis. If the cell
was tilted, the edge of the cell moved in the optical field as
the focal plane was changed. (See Supplementary Materials
for movies showing sample cells.) These transverse section
images allowed us to measure the RyR2 transverse spacing
at the x,y resolution of ;0.25 mm, which contains less out-
of-focus labeling than the longitudinal section image because
the z-resolution of ;1 mm is sufficient to reject fluorescence
from the neighboring RyR2 clusters located on the adjacent
Z-disks that are spaced 1.9 mm apart along the cell’s
FIGURE 2 Distance between adjacent RyR2 clusters from longitudinal section images. Panel A shows the three ROIs that were measured to obtain the
longitudinal, the transverse, and the peripheral RyR2 cluster spacing, respectively. (B) Intensity profiles along each ROI. The stars show the peaks of intensity,
and their distance is measured as the spacing between the RyR2 clusters. (C) Histograms of RyR2 spacing in atrial and ventricular myocytes. The mean and the
standard deviation values are listed in Table 1.
RyR2 Distribution in Cardiac Myocytes 5
Biophysical Journal 91(1) 1–13
longitudinal direction. Since ventricular myocytes are more
rod-like and straighter than atrial myocytes, we primarily
used this method for ventricular cells.
Fig. 3 E shows a typical transverse section image from
a ventricular cell. To test whether the process of embedd-
ing the cells in agar altered the spatial distribution of RyR2,
we measured the longitudinal RyR2 cluster spacing from a
series of transverse section images along the z axis. The
intensity in any selected region should vary from section to
section as that region traversed sequential Z-disks and
encountered RyR2 labeling (Fig. 3, E and F). For example,
the mean distance between intensity peaks was 2.1 6 0.7 mm
and 1.9 6 0.6 mm for sites A and B, respectively, which are
not significantly different from the RyR2 spacing measured
in longitudinal sections. We therefore conclude that the
process of embedding the cells had little impact on the
distribution of RyR2 labels. This view was further supported
by examination of images from the cells embedded in agar
that happened to lie parallel to the focal plane; in these cells
there was no detectable difference in the RyR2-labeling
pattern from that described above for cells in solution. We
therefore conclude that the RyR2 distribution was not
significantly altered by embedding the cells in agar.
To measure the nearest neighbor distances between RyR2
clusters in the transverse section images, we developed a
two-step filtering method to pick out the in-focus labeling
from out-of-focus labeling and background noise (see
Methods and Materials). Sample image processing is illus-
trated in Fig. 3 G: The left-hand panel shows RyR2 labeling
in a single transverse section image, and the binary repre-
sentation of that labeling is shown in the middle panel. The
result of applying the density-dependent filter to the binary
data is shown in the right-hand panel. The resulting image
contains islands of labeling that represent RyR2 clusters.
From these data we calculated the nearest neighbor distances
between islands of RyR2 labeling as the shortest distance
between the signal mass centers. Thus we obtained the his-
togram of nearest neighbor distances for the transverse spac-
ing of RyR2 clusters, including those on the cell periphery
(Fig. 3 H). This histogram exhibited some kurtosis (see Dis-
cussion) with a median value of 0.96 mm and a mean value
of 1.05 6 0.44 mm.
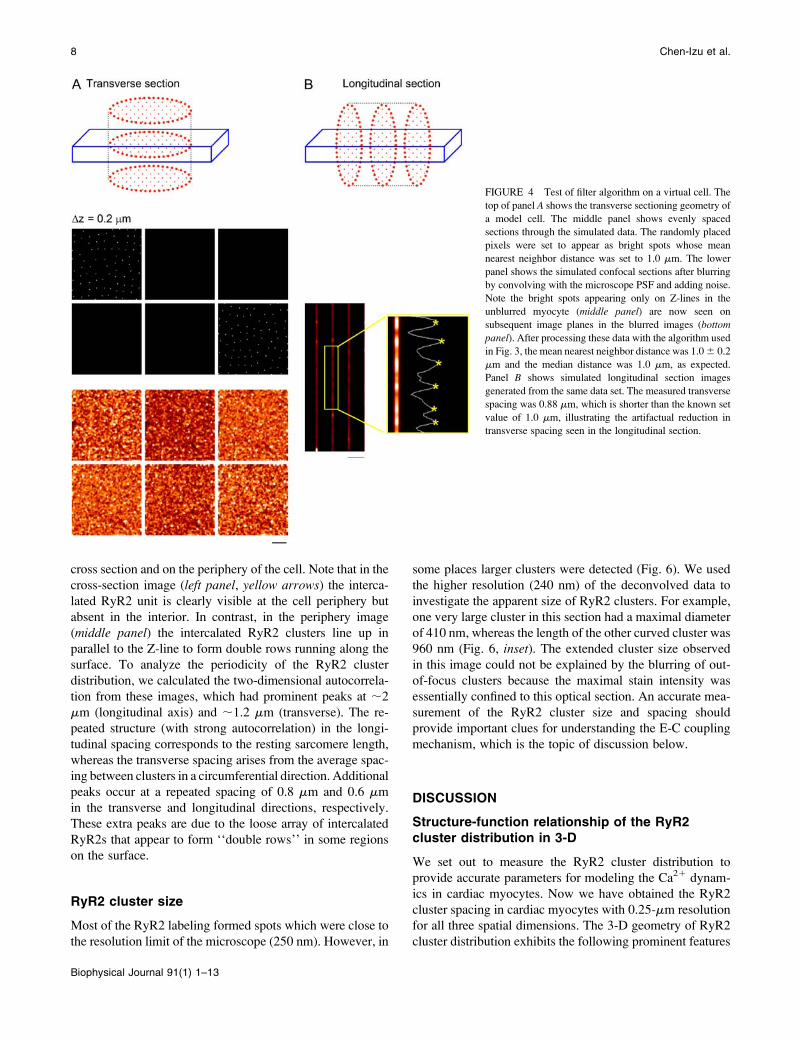
To establish the validity of the filtering method, we tested
the algorithm on a virtual cell (Fig. 4) made from a 3-D
distribution of dots with longitudinal spacing of 2.0 mm and
transverse spacing of 1.0 mm (randomly distributed in the
transverse plane, middle panel). After blurring by convolu-
tion with the microscope PSF and adding background noise,
the resulting images (lower panel) resembled the raw images
obtained in experiments. (Notice that the bright spots present
only on Z-disks in the model cell are now seen on subsequent
image planes in the blurred cell.) After applying the same
filtering algorithm with the same parameter settings as used
in the above image analysis, the nearest neighbor distance
was calculated to be 1.0 6 0.2 mm, as expected from the
model construction.
To compare the difference in the transverse section and the
longitudinal section measurements, we also took longitudi-
nal section images from the blurred virtual cell (Fig. 4 B).
The transverse spacing measurement was carried out in the
same way as described above and shown in Fig. 2, which
gave an average value of 0.88 mm. As might be expected,
this value was an underestimate of the preset value of 1.0 mm
in the virtual cell, confirming that limited axial resolution in
the longitudinal section image leads to a systematic under-
estimate of true RyR2 cluster spacing in the transverse plane.
From these data we conclude that the RyR2 cluster trans-
verse spacing has a mean value of 1.05 mm in the ventricular
myocyte as obtained from the transverse section method and
that the lower value obtained from the longitudinal section
method (0.83 mm) is an artifact arising from the limited axial
resolution of the microscope and complex sample geometry.
Although we did not use the transverse section method
on the atrial myocyte, one can calculate the mean trans-
verse spacing to be 0.97 mm by scaling from the under-
estimated value from the longitudinal section measurement
(0.77 mm).
RyR2 cluster phase waves
Cursory examination of longitudinal sections suggests that
the RyR2 on the Z-lines are mostly in linear register. How-
ever, on closer examination we sometimes see small devi-
ations from linearity. For example, in Fig. 3 B we see that the
Z-lines are slightly bowed out to the left and if the Z-line
registration is followed carefully on the right-hand side of the
image there is a discontinuity in the registration across the
cell. Fig. 3 F shows that, because the fluorescence intensity
rises and falls periodically along the z axis, we can assign an
angular phase at each point in the transverse section, with the
maximum defined (arbitrarily) to have a phase of 0�. There-
fore, the phase is 0� for location A and ;180� for location B
TABLE 1 RyR2 cluster nearest neighbor distance
Nearest neighbor distance in transverse plane
Longitudinal distance Peripheral distance Transverse section Longitudinal section
Ventricular myocyte (n ¼ 151 cells from nine hearts) 1.87 6 0.18 0.97 6 0.42 1.05 6 0.44 0.83 6 0.31
Atrial myocyte (n ¼ 65 cells from eight hearts) 1.69 6 0.41 0.92 6 0.38 0.97 (calculated) 0.77 6 0.29
Unit, mm; mean 6 SD.
6 Chen-Izu et al.
Biophysical Journal 91(1) 1–13
(marked by dashed line). If the angular phases were un-
correlated at each x-y point then there would be no dis-
cernible spatial pattern in the fluorescence intensity as the
focal plane travels. Instead, we see propagation of ‘‘phase
waves’’ that arise from local regions that are in close reg-
istration (Fig. 3 I, also see Supplementary Materials). By a
phase wave, we mean that the position of, say, the loci of 0�phase moves across the transverse section as the focal plane
moves up. The appearance of such waves can be explained
by a small angle between the (often slightly curved) planes of
Z-discs and the planes of confocal sectioning.
RyR2 cluster distribution on the periphery
In addition to the quantitative measurements of RyR2 cluster
spacing within the cell, we also performed 3-D image
deconvolution and reconstruction to aid visualization of the
3-D geometry of RyR2 cluster distribution on the periphery
of ventricular myocytes. Fig. 5 A presents a series of longi-
tudinal section images taken at a z interval of 0.2 mm from a
ventricular myocyte. After using the PSF to perform 3-D
deconvolution and reconstruction of the images, Fig. 5 B
shows the reconstructed images of the RyR2 labeling in the
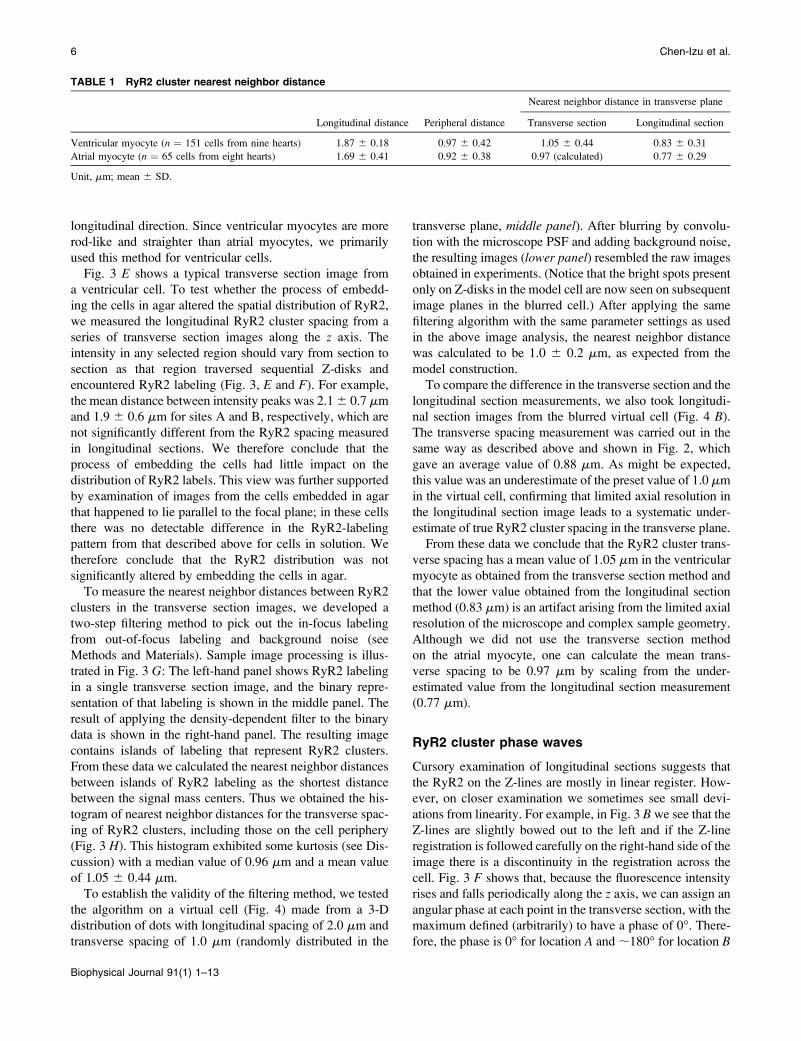
FIGURE 3 Analysis of transverse RyR2
cluster spacing. Panel A shows the conven-
tional orientation of confocal sectioning
with respect to the cell axis. PanelB shows a
typical cross section. Note the points of
dislocation (arrows) and the curved distri-
bution of RyR2 labeling. Panel C shows
how 3-D distribution of RyR2 clusters,
when combined with an extended section
resolution, leads to an overestimate of
RyR2 density. The long ellipses represent
optically blurred RyR2 clusters. D shows
the cell orientation used in the agarose
embedding method. In this orientation,
resolution of the transverse section is
increased to that of the microscope’s in-
plane resolution. Panel E shows a typical
cell cross section when the cell is oriented
as shown in D. Arrows A and B show
regions analyzed in panelF. Note the phase
difference between the maxima of labeling
intensity as the confocal section is moved
along the cell. The mean distance between
peaks is 2.16 0.7mm and 1.96 0.6mm for
site A and B, respectively, which is in
agreement with the longitudinal RyR2
spacing value obtained from the conven-
tional longitudinal section method as
shown in Fig. 1. See the movie in Supple-
mentary Materials for an animated display
of the RyR2 labeling in transverse section
images along the z axis. Panel G shows
image processing with a new digital filter to
define the center of RyR2 cluster labeling
(see Methods and Materials). The original
image, the binary image after thresholding,
and the density-dependent filtered image
are displayed in order from left to right. In
the filtered image, the in-focus RyR2
labeling is picked up and the background
noise is reduced. H shows the histogram of
RyR2 cluster nearest neighbor distances in
the transverse plane. The mean and stan-
dard deviation are 1.05 6 0.44 mm with a
median value of 0.96mm for the transverse
spacing. Panel I shows the curvature of
RyR2 cluster distribution in the transverse
section. Note how the position of the wave
moves across the cell with section position.
Scale bar 5.0 mm.
RyR2 Distribution in Cardiac Myocytes 7
Biophysical Journal 91(1) 1–13
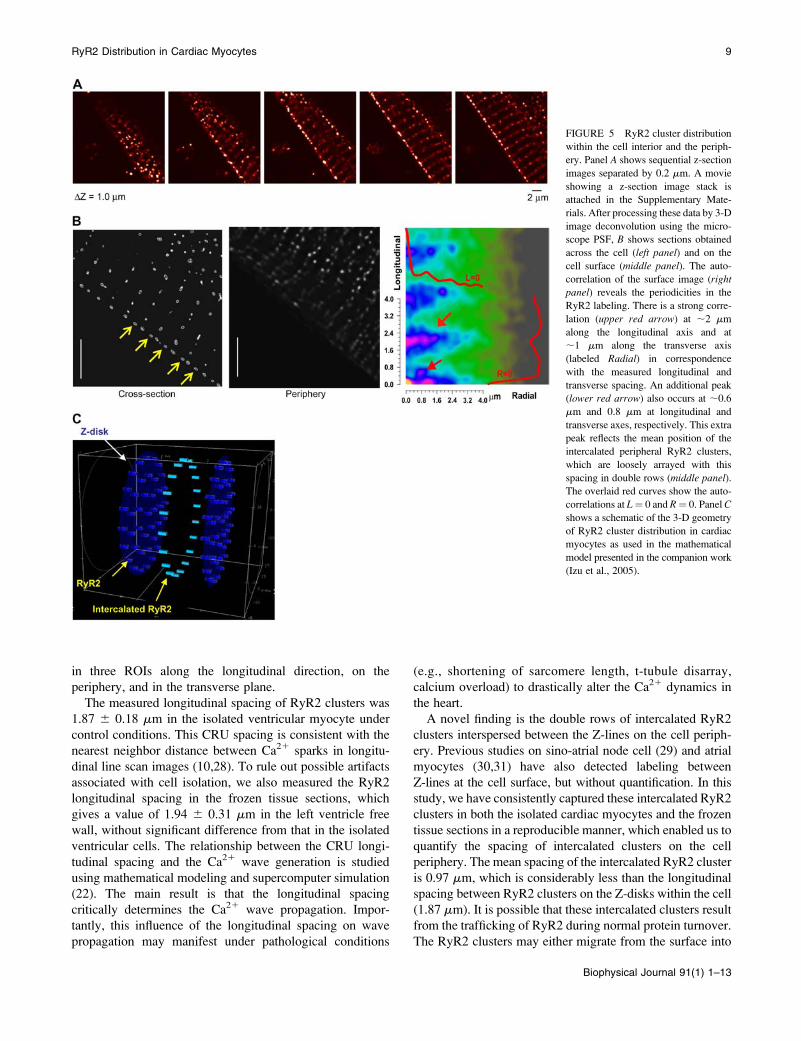
cross section and on the periphery of the cell. Note that in the
cross-section image (left panel, yellow arrows) the interca-
lated RyR2 unit is clearly visible at the cell periphery but
absent in the interior. In contrast, in the periphery image
(middle panel) the intercalated RyR2 clusters line up in
parallel to the Z-line to form double rows running along the
surface. To analyze the periodicity of the RyR2 cluster
distribution, we calculated the two-dimensional autocorrela-
tion from these images, which had prominent peaks at ;2
mm (longitudinal axis) and ;1.2 mm (transverse). The re-
peated structure (with strong autocorrelation) in the longi-
tudinal spacing corresponds to the resting sarcomere length,
whereas the transverse spacing arises from the average spac-
ing between clusters in a circumferential direction. Additional
peaks occur at a repeated spacing of 0.8 mm and 0.6 mm
in the transverse and longitudinal directions, respectively.
These extra peaks are due to the loose array of intercalated
RyR2s that appear to form ‘‘double rows’’ in some regions
on the surface.
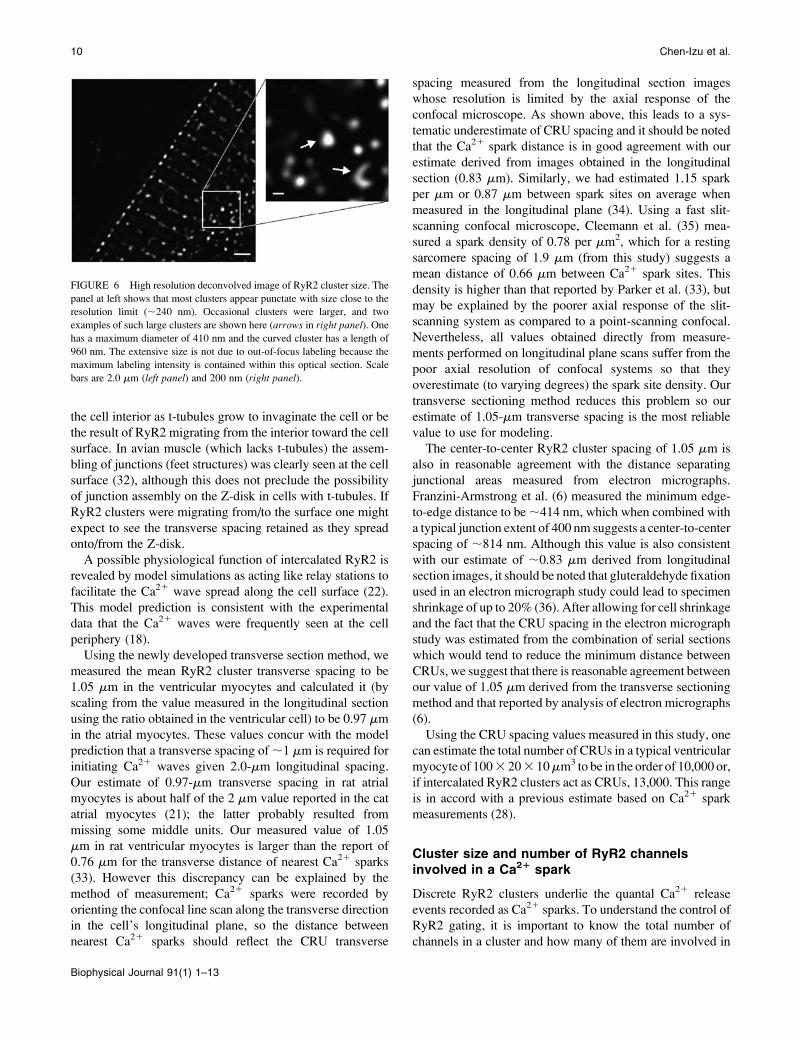
RyR2 cluster size
Most of the RyR2 labeling formed spots which were close to
the resolution limit of the microscope (250 nm). However, in
some places larger clusters were detected (Fig. 6). We used
the higher resolution (240 nm) of the deconvolved data to
investigate the apparent size of RyR2 clusters. For example,
one very large cluster in this section had a maximal diameter
of 410 nm, whereas the length of the other curved cluster was
960 nm (Fig. 6, inset). The extended cluster size observed
in this image could not be explained by the blurring of out-
of-focus clusters because the maximal stain intensity was
essentially confined to this optical section. An accurate mea-
surement of the RyR2 cluster size and spacing should
provide important clues for understanding the E-C coupling
mechanism, which is the topic of discussion below.
DISCUSSION
Structure-function relationship of the RyR2cluster distribution in 3-D
We set out to measure the RyR2 cluster distribution to
provide accurate parameters for modeling the Ca21 dynam-
ics in cardiac myocytes. Now we have obtained the RyR2
cluster spacing in cardiac myocytes with 0.25-mm resolution
for all three spatial dimensions. The 3-D geometry of RyR2
cluster distribution exhibits the following prominent features
FIGURE 4 Test of filter algorithm on a virtual cell. The
top of panel A shows the transverse sectioning geometry of
a model cell. The middle panel shows evenly spaced
sections through the simulated data. The randomly placed
pixels were set to appear as bright spots whose mean
nearest neighbor distance was set to 1.0 mm. The lower
panel shows the simulated confocal sections after blurring
by convolving with the microscope PSF and adding noise.
Note the bright spots appearing only on Z-lines in the
unblurred myocyte (middle panel) are now seen on
subsequent image planes in the blurred images (bottom
panel). After processing these data with the algorithm used
in Fig. 3, the mean nearest neighbor distance was 1.0 6 0.2
mm and the median distance was 1.0 mm, as expected.
Panel B shows simulated longitudinal section images
generated from the same data set. The measured transverse
spacing was 0.88 mm, which is shorter than the known set
value of 1.0 mm, illustrating the artifactual reduction in
transverse spacing seen in the longitudinal section.
8 Chen-Izu et al.
Biophysical Journal 91(1) 1–13
in three ROIs along the longitudinal direction, on the
periphery, and in the transverse plane.
The measured longitudinal spacing of RyR2 clusters was
1.87 6 0.18 mm in the isolated ventricular myocyte under
control conditions. This CRU spacing is consistent with the
nearest neighbor distance between Ca21 sparks in longitu-
dinal line scan images (10,28). To rule out possible artifacts
associated with cell isolation, we also measured the RyR2
longitudinal spacing in the frozen tissue sections, which
gives a value of 1.94 6 0.31 mm in the left ventricle free
wall, without significant difference from that in the isolated
ventricular cells. The relationship between the CRU longi-
tudinal spacing and the Ca21 wave generation is studied
using mathematical modeling and supercomputer simulation
(22). The main result is that the longitudinal spacing
critically determines the Ca21 wave propagation. Impor-
tantly, this influence of the longitudinal spacing on wave
propagation may manifest under pathological conditions
(e.g., shortening of sarcomere length, t-tubule disarray,
calcium overload) to drastically alter the Ca21 dynamics in
the heart.
A novel finding is the double rows of intercalated RyR2
clusters interspersed between the Z-lines on the cell periph-
ery. Previous studies on sino-atrial node cell (29) and atrial
myocytes (30,31) have also detected labeling between
Z-lines at the cell surface, but without quantification. In this
study, we have consistently captured these intercalated RyR2
clusters in both the isolated cardiac myocytes and the frozen
tissue sections in a reproducible manner, which enabled us to
quantify the spacing of intercalated clusters on the cell
periphery. The mean spacing of the intercalated RyR2 cluster
is 0.97 mm, which is considerably less than the longitudinal
spacing between RyR2 clusters on the Z-disks within the cell
(1.87 mm). It is possible that these intercalated clusters result
from the trafficking of RyR2 during normal protein turnover.
The RyR2 clusters may either migrate from the surface into
FIGURE 5 RyR2 cluster distribution
within the cell interior and the periph-
ery. Panel A shows sequential z-section
images separated by 0.2 mm. A movie
showing a z-section image stack is
attached in the Supplementary Mate-
rials. After processing these data by 3-D
image deconvolution using the micro-
scope PSF, B shows sections obtained
across the cell (left panel) and on the
cell surface (middle panel). The auto-
correlation of the surface image (rightpanel) reveals the periodicities in the
RyR2 labeling. There is a strong corre-
lation (upper red arrow) at ;2 mm
along the longitudinal axis and at
;1 mm along the transverse axis
(labeled Radial) in correspondence
with the measured longitudinal and
transverse spacing. An additional peak
(lower red arrow) also occurs at ;0.6
mm and 0.8 mm at longitudinal and
transverse axes, respectively. This extra
peak reflects the mean position of the
intercalated peripheral RyR2 clusters,
which are loosely arrayed with this
spacing in double rows (middle panel).The overlaid red curves show the auto-
correlations at L¼ 0 and R¼ 0. Panel C
shows a schematic of the 3-D geometry
of RyR2 cluster distribution in cardiac
myocytes as used in the mathematical
model presented in the companion work
(Izu et al., 2005).
RyR2 Distribution in Cardiac Myocytes 9
Biophysical Journal 91(1) 1–13
the cell interior as t-tubules grow to invaginate the cell or be
the result of RyR2 migrating from the interior toward the cell
surface. In avian muscle (which lacks t-tubules) the assem-
bling of junctions (feet structures) was clearly seen at the cell
surface (32), although this does not preclude the possibility
of junction assembly on the Z-disk in cells with t-tubules. If
RyR2 clusters were migrating from/to the surface one might
expect to see the transverse spacing retained as they spread
onto/from the Z-disk.
A possible physiological function of intercalated RyR2 is
revealed by model simulations as acting like relay stations to
facilitate the Ca21 wave spread along the cell surface (22).
This model prediction is consistent with the experimental
data that the Ca21 waves were frequently seen at the cell
periphery (18).
Using the newly developed transverse section method, we
measured the mean RyR2 cluster transverse spacing to be
1.05 mm in the ventricular myocytes and calculated it (by
scaling from the value measured in the longitudinal section
using the ratio obtained in the ventricular cell) to be 0.97 mm
in the atrial myocytes. These values concur with the model
prediction that a transverse spacing of ;1 mm is required for
initiating Ca21 waves given 2.0-mm longitudinal spacing.
Our estimate of 0.97-mm transverse spacing in rat atrial
myocytes is about half of the 2 mm value reported in the cat
atrial myocytes (21); the latter probably resulted from
missing some middle units. Our measured value of 1.05
mm in rat ventricular myocytes is larger than the report of
0.76 mm for the transverse distance of nearest Ca21 sparks
(33). However this discrepancy can be explained by the
method of measurement; Ca21 sparks were recorded by
orienting the confocal line scan along the transverse direction
in the cell’s longitudinal plane, so the distance between
nearest Ca21 sparks should reflect the CRU transverse
spacing measured from the longitudinal section images
whose resolution is limited by the axial response of the
confocal microscope. As shown above, this leads to a sys-
tematic underestimate of CRU spacing and it should be noted
that the Ca21 spark distance is in good agreement with our
estimate derived from images obtained in the longitudinal
section (0.83 mm). Similarly, we had estimated 1.15 spark
per mm or 0.87 mm between spark sites on average when
measured in the longitudinal plane (34). Using a fast slit-
scanning confocal microscope, Cleemann et al. (35) mea-
sured a spark density of 0.78 per mm2, which for a resting
sarcomere spacing of 1.9 mm (from this study) suggests a
mean distance of 0.66 mm between Ca21 spark sites. This
density is higher than that reported by Parker et al. (33), but
may be explained by the poorer axial response of the slit-
scanning system as compared to a point-scanning confocal.
Nevertheless, all values obtained directly from measure-
ments performed on longitudinal plane scans suffer from the
poor axial resolution of confocal systems so that they
overestimate (to varying degrees) the spark site density. Our
transverse sectioning method reduces this problem so our
estimate of 1.05-mm transverse spacing is the most reliable
value to use for modeling.
The center-to-center RyR2 cluster spacing of 1.05 mm is
also in reasonable agreement with the distance separating
junctional areas measured from electron micrographs.
Franzini-Armstrong et al. (6) measured the minimum edge-
to-edge distance to be ;414 nm, which when combined with
a typical junction extent of 400 nm suggests a center-to-center
spacing of ;814 nm. Although this value is also consistent
with our estimate of ;0.83 mm derived from longitudinal
section images, it should be noted that gluteraldehyde fixation
used in an electron micrograph study could lead to specimen
shrinkage of up to 20% (36). After allowing for cell shrinkage
and the fact that the CRU spacing in the electron micrograph
study was estimated from the combination of serial sections
which would tend to reduce the minimum distance between
CRUs, we suggest that there is reasonable agreement between
our value of 1.05 mm derived from the transverse sectioning
method and that reported by analysis of electron micrographs
(6).
Using the CRU spacing values measured in this study, one
can estimate the total number of CRUs in a typical ventricular
myocyte of 1003 203 10mm3 to be in the order of 10,000 or,
if intercalated RyR2 clusters act as CRUs, 13,000. This range
is in accord with a previous estimate based on Ca21 spark
measurements (28).
Cluster size and number of RyR2 channelsinvolved in a Ca21 spark
Discrete RyR2 clusters underlie the quantal Ca21 release
events recorded as Ca21 sparks. To understand the control of
RyR2 gating, it is important to know the total number of
channels in a cluster and how many of them are involved in
FIGURE 6 High resolution deconvolved image of RyR2 cluster size. The
panel at left shows that most clusters appear punctate with size close to the
resolution limit (;240 nm). Occasional clusters were larger, and two
examples of such large clusters are shown here (arrows in right panel). One
has a maximum diameter of 410 nm and the curved cluster has a length of
960 nm. The extensive size is not due to out-of-focus labeling because the
maximum labeling intensity is contained within this optical section. Scale
bars are 2.0 mm (left panel) and 200 nm (right panel).
10 Chen-Izu et al.
Biophysical Journal 91(1) 1–13
generating a spark. The RyR2 cluster size measured in this
study ranges from 250 nm to 960 nm across, which is in
reasonable agreement with the electron micrographic anal-
ysis of cluster distribution by Franzini-Armstrong et al. (6).
If most RyR2 clusters are ;250 3 250 nm2 and the average
area occupied by a single RyR2 molecule is 29 3 29 nm2,
such a cluster would contain ;74 RyR2s with the largest
clusters (250 3 960 nm2) containing up to 285 RyR2s.
Franzini-Armstrong et al. (6) estimated that the typical rat
RyR2 cluster contained ;250 RyR2s, a value larger than our
estimated typical value. Since our resolution limit prevents
quantification of areas ,250 3 250 nm2, some RyR2 clus-
ters might be even smaller, which would widen the dis-
crepancy with the data of Franzini-Armstrong et al. (6).
The cause of this discrepancy may lie in the method used
to calculate the number of RyR2s. In our study, we assume
that the extent of label area delimits the cluster. If the
junctional region was highly curved within the resolution
limit, we would underestimate the total number. In the worst
case, if the RyR2s were within a circle of diameter equal to
the resolution limit, we would underestimate the number by a
factor of p/2, suggesting an upper bound of ;116 RyR2s in
a typical cluster. However most electron micrographs sug-
gest that junctional area is an incomplete circle (6,37). On the
other hand, in electron micrographs, the number of RyR2s
was calculated on the assumption that the junctional area was
circular and the entire junctional area was occupied by RyR2s
(6,32), which would tend to overestimate the total number.
For the discussion below we will assume the typical cluster
contains 100 RyR2s.
The flux (current) of Ca21 underlying a Ca21 spark is
Ispark ¼ N 3 Po 3 iRyR, where N is the total number of
RyR2s in a cluster, Po the single RyR2 channel open
probability, and iRyR the single channel Ca21 current. If iRyR
is ;0.5 pA (38) and Ispark ; 10 pA as back calculated from
the amount of Ca21 in a spark (13,39,40), then the number of
RyR2 channels that open during a spark is 20. This value is
also in accord with the estimation of 17–20 RyR2s as derived
from noise analysis of spark amplitude variability (41) and
with the estimation of more than 10 RyR2s based on RyR2
inhibition studies (39). However, by analyzing the rate of rise
of Ca21 sparks, Cheng’s group suggested a different
estimate of 1–3 RyR2s underlying a triggered Ca21 spark
(42,43). Although more work is needed to resolve these
discrepancies and to refine the estimates, an important
insight can be gained by analyzing the relationship between
the number of RyR2s involved in a spark and the CRU firing
probability. In an extreme case, when only 1 out of 100
RyR2s channels in a cluster opens, the single channel open
probability is Po ¼ 0.01, from which the probability of a
CRU failing to have any RyR2 opening, the null probability,
is Po(0) ¼ (1 � Po)N ¼ 0.37. In this scenario, since all RyRs
may close with high probability, the CRU either deactivates
or does not respond to the trigger at all. Indeed, this was
shown to be the case in the analysis of failures by Cheng’s
group. However, if 20 RyR2s open during the spark, then
Po ¼ 0.2 and Po(0) ¼ 2 3 10�10. In this scenario, the
CRU not only has high probability to be activated but
also to maintain that activation by having regenerative
Ca21-induced Ca21 release. On the other hand, robust CRU
shutdown must reside in some other mechanism such as
terminal depletion in this case. It is important to note that the
critical factor here is NPo. For example, if only 1 RyR2 from
a cluster of 50 or 250 RyR2s opens during the spark, the null
probability Po(0) remains very large (0.36 and 0.37 respec-
tively); if 20 RyR2s open, the Po(0) remains very small (8 3
10�12 and 9 3 10�10, respectively). This sensitivity of Po(0)
to NPo can be understood by noticing that Po(0) ¼ (1 � Po)N
ffi e�NPo, when Po is small and N is large.
Junctional and nonjunctional RyR2 clusters
In adult mammalian ventricular myocytes, the majority of
RyR2 clusters are thought to form junctional coupling with
L-type Ca21 channels on the sarcolemma and in the t-tubules.
The junctional coupling serves as a ‘‘couplon’’ (44) to initiate
intracellular Ca21 signaling in response to membrane exci-
tation. Such junctional RyR2 has been visualized in the
electron micrograph in the ‘‘feet’’ structure that is closely
associated with the sarcolemma or t-tubules in the form of
‘‘peripheral couplings’’ and ‘‘dyads’’ (6). The junctional cou-
pling was also inferred from the optical colocalization of
antibody-labeled RyR2 and L-type Ca21 channel. The
arrangement for RyR2 coupling is markedly different in cells
lacking a t-tubule system such as adult atrial myocytes (20),
sino-atrial node cells (29), Purkinje cells (45), neonatal
cardiac myocytes (46), and avian ventricular myocytes
(32,47), where the junctional coupling exists at the cell
periphery immediately under the sarcolemma. Since the
interior RyR2 clusters are not directly coupled to surface
membrane L-type Ca21 channels, they are ‘‘nonjunctional’’.
In cells lacking internal junctions, the peripheral junctions
provide the means to achieve E-C coupling as Ca21 released
from junctional RyR2 (20,45,48) diffuses to form a centrip-
etally propagating Ca21 wave. In some cases, this wave can
initiate release from the nonjunctional RyR2 clusters but this
is not always the case as it depends on the excitability of the
internal RyR2 clusters (20,45).
In the ventricular myocyte, the action potential triggers a
synchronized global Ca21 elevation via junctional RyR2
couplings distributed throughout the cell. Although the
resulting synchronous release would preclude initiation of a
spontaneous Ca21 wave, under certain pathological condi-
tions, spontaneous Ca21 waves arise during diastole to
interfere with Ca21 signaling and trigger irregular electrical
activity via Na1/Ca21 exchange (18,48). As an essential step
in developing realistic models for E-C coupling which may
explain the transition to such nonuniform behavior, we have
measured the CRU spacing at a resolution sufficient to allow
model construction. The 3-D geometry of CRU distribution
RyR2 Distribution in Cardiac Myocytes 11
Biophysical Journal 91(1) 1–13
presented in this model (Fig. 5 C) is applicable to both
ventricular and atrial myocytes with the spacing values ad-
justed to each cell type, regardless of the different arrange-
ments for the junctional coupling between RyR2 and L-type
Ca21 channels in these cells.
Dislocation in RyR2 cluster distribution
In some regions within the cell interior we found dislocations
in the transverse structure which result in a phase shift of
periodicity in the longitudinal direction. It seems likely that
such dislocations are the consequence of local nonunifor-
mities in growth during maturation of the myocyte as sarco-
meres are added (49). Such dislocation may cause the effective
distance between RyR2 clusters to be reduced in the longi-
tudinal direction, which may bring the cell closer to the
threshold for Ca21 wave initiation. For example, our model-
ing studies suggest that if the CRU longitudinal spacing were
reduced to 1.6 mm, the probability of spontaneous Ca21
wave initiation would increase drastically (22). Hence, the
Ca21 wave would tend to spread along the dislocation region
and from there across the cell. On the other hand, the normal
longitudinal spacing of 1.9 mm would serve to limit the
spread of a Ca21 wave. It is possible that cardiac hypertro-
phy may make such dislocations more common, in which
case the probability of Ca21 wave generation and the
likelihood of triggered arrhythmias might increase. This in-
triguing possibility should be examinable with the methods
we have presented here.
SUPPLEMENTARY MATERIAL
An online supplement to this article can be found by visiting
BJ Online at http://www.biophysj.org.
Our transverse sectioning technique was inspired by Dr. Hugo Gonzalez-
Serratos’s experiments viewing Ca21 release down the long axis of skeletal
muscle fibers. We are grateful to Drs. Jeanine A. Ursitti, Robert J. Bloch,
and Shawn W. Robinson for kindly providing the instruments and technical
advice for immunohistochemistry experiments; and to Drs. Andrew R.
Marks, Steven R. Reiken, and Xander H. T. Wehrens for providing the
polyclonal anti-RyR antibody. Our gratitude also goes to June Clopein for
administrative support and to William T. Sinclair for machine shop support.
Financial support was provided by an American Heart Association National
Scientist Development Grant to Y.C. (AHA 0335250N), a National
Institutes of Health K25 grant to L.T.I. (NIH 1K25HL68704), an NIH R01
grant to C.W.B. and L.T.I. (RO1HL071865), NIH grants RO1HL68733 and
HL50435-05 to C.W.B., a Veterans Affairs Merit Review Award to C.W.B.
and L.T.I. (VA MCB00006N), and a National Center for Supercomputing
Applications Grant to L.T.I.
REFERENCES
1. Nakai, J., T. Imagawa, Y. Hakamat, M. Shigekawa, H. Takeshima, andS. Numa. 1990. Primary structure and functional expression fromcDNA of the cardiac ryanodine receptor/calcium release channel. FEBSLett. 271:169–177.
2. Kuwajima, G., A. Futatsugi, M. Niinobe, S. Nakanishi, and K.Mikoshiba. 1992. Two types of ryanodine receptors in mouse brain:
skeletal muscle type exclusively in Purkinje cells and cardiac muscletype in various neurons. Neuron. 9:1133–1142.
3. Giannini, G., A. Conti, S. Mammarella, M. Scrobogna, and V.Sorrentino. 1995. The ryanodine receptor/calcium channel genes arewidely and differentially expressed in murine brain and peripheraltissues. J. Cell Biol. 128:893–904.
4. Otsu, K., H. F. Willard, V. K. Khanna, F. Zorzato, N. M. Green, andD. H. MacLennan. 1990. Molecular cloning of cDNA encoding theCa21 release channel (ryanodine receptor) of rabbit cardiac musclesarcoplasmic reticulum. J. Biol. Chem. 265:13472–13483.
5. Tunwell, R. E. A., C. Wickenden, B. M. A. Bertrand, V. I.Shevchenko, M. B. Walsh, P. D. Allen, and F. A. Lai. 1996. Thehuman cardiac muscle ryanodine receptor-calcium release channel:identification, primary structure and topological analysis. Biochem. J.318:477–487.
6. Franzini-Armstrong, C., F. Protasi, and V. Ramesh. 1999. Shape, size,and distribution of Ca21 release units and couplons in skeletal andcardiac muscles. Biophys. J. 77:1528–1539.
7. Fabiato, A., and F. Fabiato. 1972. Excitation-contraction coupling ofisolated cardiac fibers with disrupted or closed sarcolemmas. Calcium-dependent cyclic and tonic contractions. Circ. Res. 31:293–307.
8. Fabiato, A., and F. Fabiato. 1978. Calcium-induced release of calciumfrom the sarcoplasmic reticulum of skinned cells from adult human,dog, cat, rabbit, rat, and frog hearts and from fetal and new-born ratventricles. Ann. N. Y. Acad. Sci. 307:491–522.
9. Fabiato, A. 1992. Two kinds of calcium-induced release of calciumfrom the sarcoplasmic reticulum of skinned cardiac cells. Adv. Exp.Med. Biol. 311:245–262.
10. Lopez-Lopez, J. R., P. S. Shacklock, C. W. Balke, and W. G. Wier.1994. Local, stochastic release of Ca21 in voltage-clamped rat heartcells: visualization with confocal microscopy. J. Physiol. 480:21–29.
11. Lopez-Lopez, J. R., P. S. Shacklock, C. W. Balke, and W. G. Wier.1995. Local calcium transients triggered by single L-type calciumchannel currents in cardiac cells. Science. 268:1042–1045.
12. Cheng, H., W. J. Lederer, and M. B. Cannell. 1993. Calcium sparks:elementary events underlying excitation-contraction coupling in heartmuscle. Science. 262:740–744.
13. Izu, L. T., J. R. Mauban, C. W. Balke, and W. G. Wier. 2001. Largecurrents generate cardiac Ca21 sparks. Biophys. J. 80:88–102.
14. Stern, M. D. 1992. Theory of excitation-contraction coupling in cardiacmuscle. Biophys. J. 63:497–517.
15. Keizer, J., and G. D. Smith. 1998. Spark-to-wave transition: saltatorytransmission of calcium waves in cardiac myocytes. Biophys. Chem.72:87–100.
16. Keizer, J., G. D. Smith, S. Ponce-Dawson, and J. E. Pearson. 1998.Saltatory propagation of Ca21 waves by Ca21 sparks. Biophys. J. 75:595–600.
17. Izu, L. T., W. G. Wier, and C. W. Balke. 2001. Evolution of cardiaccalcium waves from stochastic calcium sparks. Biophys. J. 80:103–120.
18. Berlin, J. R., M. B. Cannell, and W. J. Lederer. 1989. Cellular originsof the transient inward current in cardiac myocytes. Role of fluctuationsand waves of elevated intracellular calcium. Circ. Res. 65:115–126.
19. Berlin, J. R. 1995. Spatiotemporal changes of Ca21 during electricallyevoked contractions in atrial and ventricular cells. Am. J. Physiol.269:H1165–H1170.
20. Kirk, M. M., L. T. Izu, Y. Chen-Izu, S. L. McCulle, W. G. Wier, C. W.Balke, and S. R. Shorofsky. 2003. Role of the transverse-axial tubulesystem in generating calcium sparks and calcium transients in rat atrialmyocytes. J. Physiol. 547:441–451.
21. Kockskamper, J., K. A. Sheehan, D. J. Bare, S. L. Lipsius, G. A.Mignery, and L. A. Blatter. 2001. Activation and propagation of Ca21
release during excitation-contraction coupling in atrial myocytes.Biophys. J. 81:2590–2605.
22. Izu, L. T., S. Means, J. Shadid, Y. Chen-Izu, and C.W. Balke. 2006.Interplay of ryanodine receptor distribution and calcium dynamics.Biophys. J. 91:95–112.
12 Chen-Izu et al.
Biophysical Journal 91(1) 1–13
23. Lai, F. A., Q. Y. Liu, L. Xu, A. Hashem, N. R. Kramarcy, R. Sealock,and G. Meissner. 1992. Amphibian ryanodine receptor isoforms arerelated to those of mammalian skeletal or cardiac muscle. Am. J.Physiol. 263:C365–C372.
24. McPherson, P. S., and K. P. Campbell. 1993. Characterization ofthe major brain form of the ryanodine receptor/Ca21 release channel.J. Biol. Chem. 268:19785–19790.
25. Hollingworth, S., C. Soeller, S. M. Baylor, and M. B. Cannell. 2000.Sarcomeric Ca21 gradients during activation of frog skeletal musclefibres imaged with confocal and two-photon microscopy. J. Physiol.526:551–560.
26. Soeller, C., and M. B. Cannell. 1999. Examination of the transversetubular system in living cardiac rat myocytes by 2-photon microscopyand digital image processing techniques. Circ. Res. 84:266–275.
27. Izu, L. T., W. G. Wier, and C. W. Balke. 1998. Theoretical analysis ofthe Ca21 spark amplitude distribution. Biophys. J. 75:1144–1162.
28. Cannell, M. B., H. Cheng, and W. J. Lederer. 1995. The control ofcalcium release in heart muscle. Science. 268:1045–1049.
29. Rigg, L., B. M. Heath, Y. Cui, and D. A. Terrar. 2000. Localisation andfunctional significance of ryanodine receptors during [beta]-adreno-ceptor stimulation in the guinea-pig sino-atrial node. Cardiovasc. Res.48:254–264.
30. Tijskens, P., G. Meissner, and C. Franzini-Armstrong. 2003. Locationof ryanodine and dihydropyridine receptors in frog myocardium.Biophys. J. 84:1079–1092.
31. Carl, S. L., K. Felix, A. H. Caswell, N. R. Brandt, W. J. Ball Jr., P. L.Vaghy, G. Meissner, and D. G. Ferguson. 1995. Immunolocalization ofsarcolemmal dihydropyridine receptor and sarcoplasmic reticulartriadin and ryanodine receptor in rabbit ventricle and atrium. J. CellBiol. 129:673–682.
32. Protasi, F., X. H. Sun, and C. Franzini-Armstrong. 1996. Formationand maturation of the calcium release apparatus in developing andadult avian myocardium. Dev. Biol. 173:265–278.
33. Parker, I., W. J. Zang, and W. G. Wier. 1996. Ca21 sparks involvingmultiple Ca21 release sites along Z-lines in rat heart cells. J. Physiol.497:31–38.
34. Cannell, M. B., H. Cheng, and W. J. Lederer. 1994. Spatial non-uniformities in [Ca21]i during excitation-contraction coupling incardiac myocytes. Biophys. J. 67:1942–1956.
35. Cleemann, L., W. Wang, and M. Morad. 1998. Two-dimensional confocalimages of organization, density, and gating of focal Ca21 release sites inrat cardiac myocytes. Ann. N. Y. Acad. Sci. 95:10984–10989.
36. Jearanaikoon, S., and J. V. Abraham-Peskir. 2005. An x-ray micros-copy perspective on the effect of glutaraldehyde fixation on cells. J.Microsc. 218:185–192.
37. Forbes, M. S., and E. E. van Neil. 1988. Membrane systems of guineapig myocardium: ultrastructure and morphometric studies. Anat. Rec.222:362–379.
38. Mejia-Alvarez, R., C. Kettlun, E. Rios, M. Stern, and M. Fill. 1999.Unitary Ca21 current through cardiac ryanodine receptor channelsunder quasi-physiological ionic conditions. J. Gen. Physiol. 113:177–186.
39. Lukyanenko, V., I. Gyorke, S. Subramanian, A. Smirnov, T. F.Wiesner, and S. Gyorke. 2000. Inhibition of Ca21 sparks by rutheniumred in permeabilized rat ventricular myocytes. Biophys. J. 79:1273–1284.
40. Soeller, C., and M. B. Cannell. 2002. Estimation of the sarcoplasmicreticulum Ca21 release flux underlying Ca21 sparks. Biophys. J.82:2396–2414.
41. Bridge, J. H., P. R. Ershler, and M. B. Cannell. 1999. Properties ofCa21 sparks evoked by action potentials in mouse ventricularmyocytes. J. Physiol. 518:469–478.
42. Wang, S.-Q., L.-S. Song, E. G. Lakatta, and H. Cheng. 2001. Ca21
signalling between single L-type Ca21 channels and ryanodinereceptors in heart cells. Nature. 410:592–596.
43. Wang, S. Q., M. D. Stern, E. Rios, and H. Cheng. 2004. The quantalnature of Ca21 sparks and in situ operation of the ryanodine receptorarray in cardiac cells. Ann. N. Y. Acad. Sci. 101:3979–3984.
44. Rios, E., and M. D. Stern. 1997. Calcium in close quarters:microdomain feedback in excitation-contraction coupling and othercell biological phenomena. Annu. Rev. Biophys. Biomol. Struct. 26:47–82.
45. Cordeiro, J. M., K. W. Spitzer, W. R. Giles, P. E. Ershler, M. B.Cannell, and J. H. B. Bridge. 2001. Location of the initiation site ofcalcium transients and sparks in rabbit heart Purkinje cells. J. Physiol.531:301–314.
46. Sedarat, F., L. Xu, E. D. W. Moore, and G. F. Tibbits. 2000.Colocalization of dihydropyridine and ryanodine receptors in neonaterabbit heart using confocal microscopy. Am. J. Physiol. 279:H202–H209.
47. Junker, J., J. R. Sommer, M. Sar, and G. Meissner. 1994. Extendedjunctional sarcoplasmic reticulum of avian cardiac muscle containsfunctional ryanodine receptors. J. Biol. Chem. 269:1627–1634.
48. Loughrey, C. M., K. E. MacEachern, P. Neary, and G. L. Smith. 2002.The relationship between intracellular [Ca21] and Ca21 wave charac-teristics in permeabilised cardiomyocytes from the rabbit. J. Physiol.543:859–870.
49. Yu, J. G., and B. Russell. 2005. Cardiomyocyte remodeling andsarcomere addition after uniaxial static strain in vitro. J. Histochem.Cytochem. 53:839–844.
RyR2 Distribution in Cardiac Myocytes 13
Biophysical Journal 91(1) 1–13


![Department of Molecular Physiology and Biophysics · [3H]ryanodine binding to both triads and the purified skeletal ryanodine receptor (2). [3H]ABRy binding to skeletal muscle triads](https://static.cupdf.com/doc/110x72/5f18359e7a2bcd7fee70963a/department-of-molecular-physiology-and-3hryanodine-binding-to-both-triads-and.jpg)