AMERICAN ASSOCIATION OF WINE ECONOMISTS
AAWE WORKING PAPER No. 25 Economics
THE SIDEWAYS EFFECT: A TEST FOR CHANGES IN THE DEMAND FOR
MERLOT AND PINOT NOIR WINES
Steven Cuellar, Dan Karnowsky and
Frederick Acosta
October 2008 www.wine-economics.org

The Sideways Effect: A Test for Changes in the Demand for Merlot and Pinot Noir Wines
Steven S. Cuellar, Ph.D.* Department of Economics Sonoma State University 1801 East Cotati Avenue Rohnert Park, CA 94928
(707) 664-2305 [email protected]
Dan Karnowsky
President Sonoma Research Associates
Glen Ellen,CA. 95442 [email protected]
(707) 935-1210
Frederick Acosta Research Associate
Sonoma Research Associates Glen Ellen, CA 95442
[email protected] (707) 935-1210
Abstract This paper examines the effect of the movie Sideways on US wine consumption. Specifically, we examine the effects of the movie on the consumption of Merlot, which is derided in the movie and the effect on Pinot Noir, which is praised. We examine the trends in consumption before and after the movie and perform statistical tests for structural changes in consumption. We also estimate demand functions for both Merlot and Pinot Noir and test for differences in their demands before and after the movie. Finally, we test for changes in consumption of each varietal by price point.
Key words: Sideways, Chow Test, Demand Estimation. *Denotes contact author. The authors would like to thank participants at Sonoma State University’s Department of Economics Seminar Series, participants of the Second Annual Meeting of the American Association of Wine Economists in Portland, Oregon, as well as a an anonymous referee for helpful comments. We would also like to thank Sonoma State University’s Wine Business Program for funding this research.
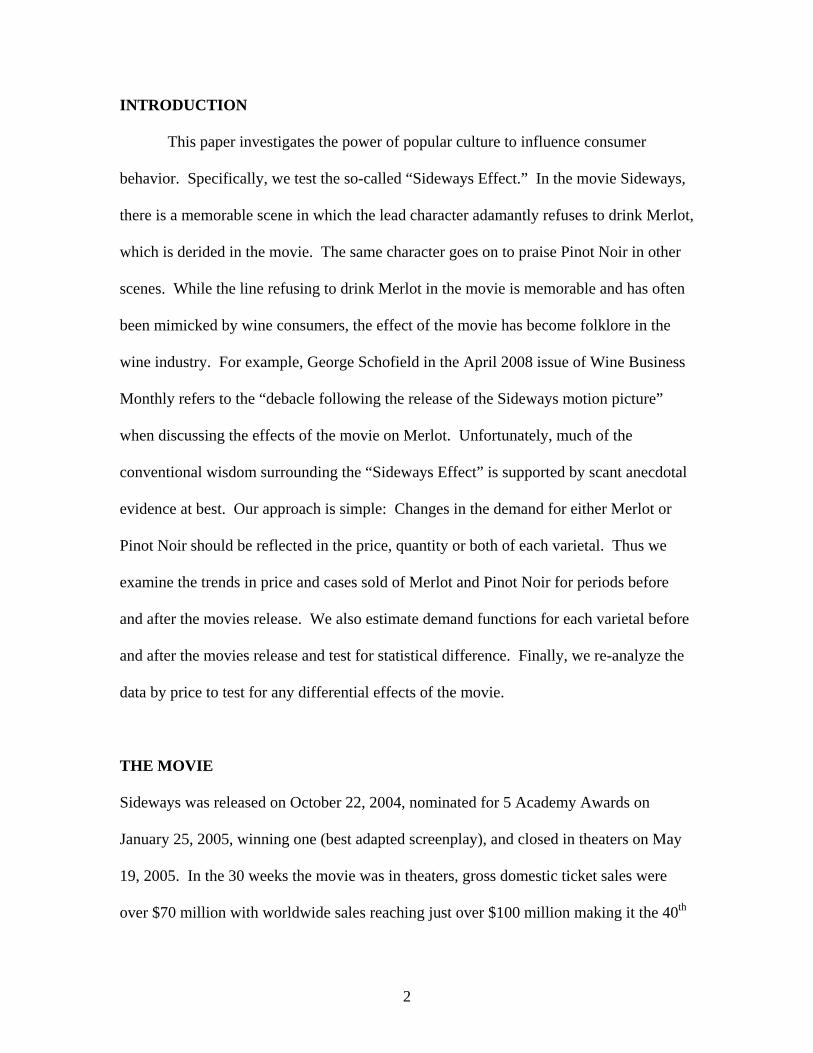
INTRODUCTION
This paper investigates the power of popular culture to influence consumer
behavior. Specifically, we test the so-called “Sideways Effect.” In the movie Sideways,
there is a memorable scene in which the lead character adamantly refuses to drink Merlot,
which is derided in the movie. The same character goes on to praise Pinot Noir in other
scenes. While the line refusing to drink Merlot in the movie is memorable and has often
been mimicked by wine consumers, the effect of the movie has become folklore in the
wine industry. For example, George Schofield in the April 2008 issue of Wine Business
Monthly refers to the “debacle following the release of the Sideways motion picture”
when discussing the effects of the movie on Merlot. Unfortunately, much of the
conventional wisdom surrounding the “Sideways Effect” is supported by scant anecdotal
evidence at best. Our approach is simple: Changes in the demand for either Merlot or
Pinot Noir should be reflected in the price, quantity or both of each varietal. Thus we
examine the trends in price and cases sold of Merlot and Pinot Noir for periods before
and after the movies release. We also estimate demand functions for each varietal before
and after the movies release and test for statistical difference. Finally, we re-analyze the
data by price to test for any differential effects of the movie.
THE MOVIE
Sideways was released on October 22, 2004, nominated for 5 Academy Awards on
January 25, 2005, winning one (best adapted screenplay), and closed in theaters on May
19, 2005. In the 30 weeks the movie was in theaters, gross domestic ticket sales were
over $70 million with worldwide sales reaching just over $100 million making it the 40th
2
highest grossing movie of the year. The number one grossing movie of the year Shrek 2,
grossed over $440 million and nearly a billion dollars worldwide that same year. The
movie was released on DVD in the USA and Canada in April 2005.
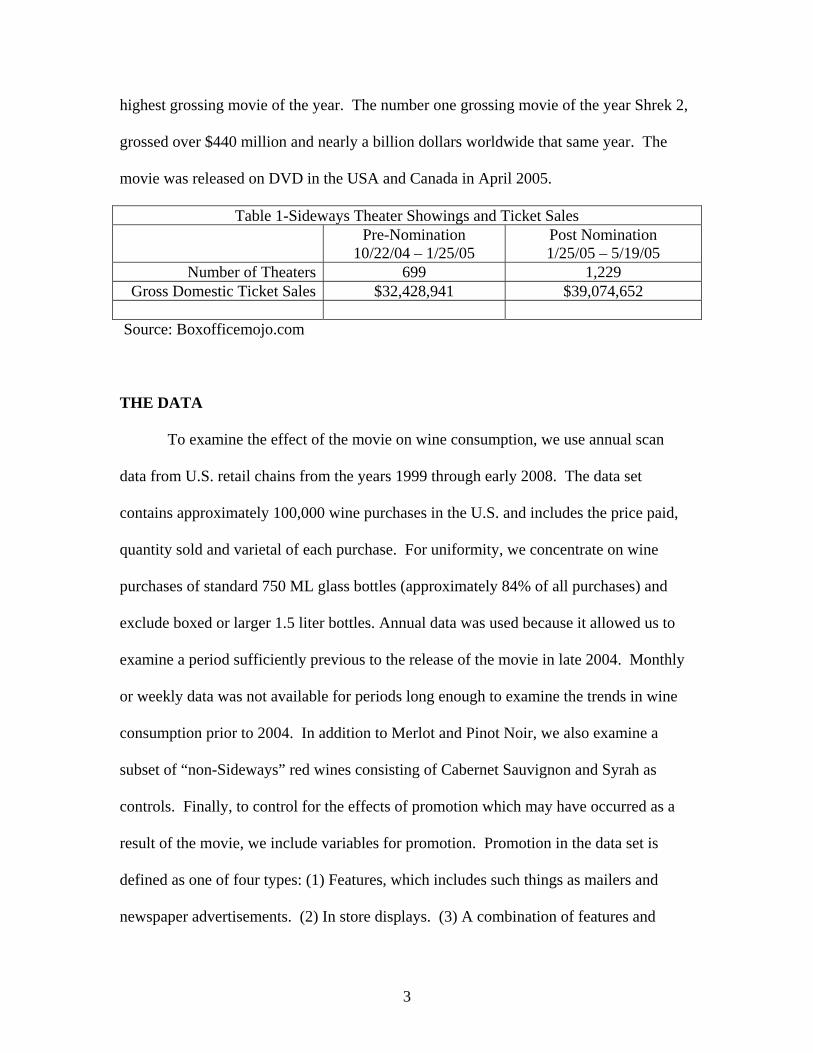
Table 1-Sideways Theater Showings and Ticket Sales Pre-Nomination
10/22/04 – 1/25/05 Post Nomination 1/25/05 – 5/19/05
Number of Theaters 699 1,229 Gross Domestic Ticket Sales $32,428,941 $39,074,652
Source: Boxofficemojo.com
THE DATA
To examine the effect of the movie on wine consumption, we use annual scan
data from U.S. retail chains from the years 1999 through early 2008. The data set
contains approximately 100,000 wine purchases in the U.S. and includes the price paid,
quantity sold and varietal of each purchase. For uniformity, we concentrate on wine
purchases of standard 750 ML glass bottles (approximately 84% of all purchases) and
exclude boxed or larger 1.5 liter bottles. Annual data was used because it allowed us to
examine a period sufficiently previous to the release of the movie in late 2004. Monthly
or weekly data was not available for periods long enough to examine the trends in wine
consumption prior to 2004. In addition to Merlot and Pinot Noir, we also examine a
subset of “non-Sideways” red wines consisting of Cabernet Sauvignon and Syrah as
controls. Finally, to control for the effects of promotion which may have occurred as a
result of the movie, we include variables for promotion. Promotion in the data set is
defined as one of four types: (1) Features, which includes such things as mailers and
newspaper advertisements. (2) In store displays. (3) A combination of features and
3

displays. (4) Temporary price reductions of 5% or more. For our purposes, we only
distinguish between promoted and non-promoted price and sales.
ANALYSIS
As noted above, we rely on economic theory to hypothesize that any changes in
the demand for either Merlot or Pinot Noir caused by the movie Sideways should be
reflected in the price, quantity or both of each varietal. For Merlot, a reduction in
demand resulting from the negative portrayal in the movie should reduce price and/or
quantity. Conversely, for Pinot Noir, an increase in demand should increase price and/or
quantity. Thus we examine the trends in price and cases sold of Merlot and Pinot Noir
for periods before and after the movie’s release.
We chose the end of 2005 as the period in which we expect the effects, if any, of
the movie Sideways to begin to manifest themselves on wine consumption. Recall that
the movie was released in October 2004, nominated for an Academy Award in January of
2005 and was released on DVD in April 2005. Furthermore, as Table 1 shows, the
number of theaters the movie was shown in nearly doubled once the Academy Award
nominations were announced. Because the wine data is end of year data, we feel that the
end of 2005 is the most reasonable choice.
CASE VOLUME
We begin by examining annual case volume of the three groups: Merlot, Pinot
Noir and the control group of non-Sideways red wines consisting of Cabernet Sauvignon
and Syrah. The largest seller by volume in the U.S. is Merlot, followed by Cabernet
Sauvignon, Syrah and Pinot Noir with Merlot and Cabernet Sauvignon selling almost
4
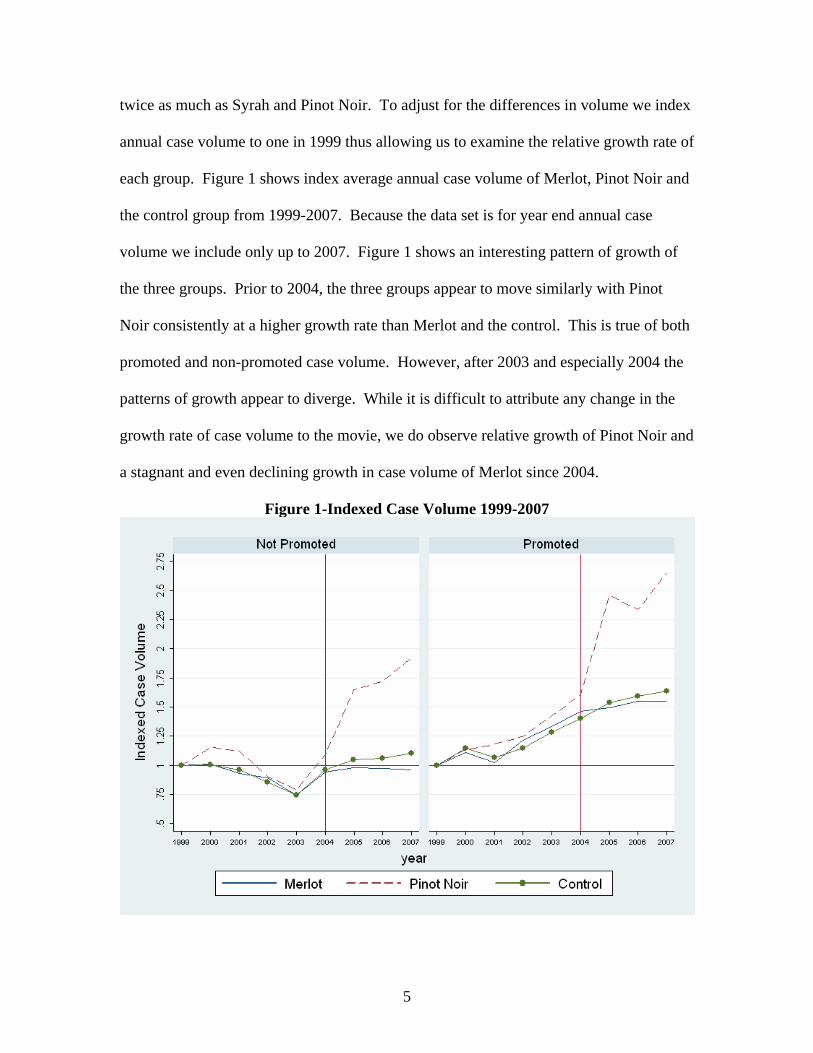
twice as much as Syrah and Pinot Noir. To adjust for the differences in volume we index
annual case volume to one in 1999 thus allowing us to examine the relative growth rate of
each group. Figure 1 shows index average annual case volume of Merlot, Pinot Noir and
the control group from 1999-2007. Because the data set is for year end annual case
volume we include only up to 2007. Figure 1 shows an interesting pattern of growth of
the three groups. Prior to 2004, the three groups appear to move similarly with Pinot
Noir consistently at a higher growth rate than Merlot and the control. This is true of both
promoted and non-promoted case volume. However, after 2003 and especially 2004 the
patterns of growth appear to diverge. While it is difficult to attribute any change in the
growth rate of case volume to the movie, we do observe relative growth of Pinot Noir and
a stagnant and even declining growth in case volume of Merlot since 2004.
Figure 1-Indexed Case Volume 1999-2007
5

To investigate further, we estimate the following equation:
Casesit = (1) itititit uTDDTimeTime +++++ 20052005 432
210 βββββ
Where: Casesit represents the annual case volume of wine i sold in year t.
Timei is a linear time variable representing the years 1999-2008.
Time2 represents the square of time.
D2005 represents a dummy variable which equals one for the years 2005-
2008 and zero for years prior.
D2005T is the interaction of D2005 and time.
Equation 1 examines the time trend before the movie and a set of dummy and
interaction variables to examine the trend after the movie. Because the trends in sales
prior to 2005 were non-linear, we include the square of time. Table 2 shows the
regression results for indexed case volume. The regression results are generally
consistent with Figure 1 and support the hypothesis that the movie Sideways did have a
negative impact on the growth rate of annual sales of Merlot. The effects on Pinot Noir
are mixed showing a statistically insignificant effect on non-promoted Pinot Noir and a
statistically significant effect on promoted Pinot Noir. For the control group, both non-
promoted and promoted annual case volumes show a small but statistically significant
effect.
Table 2-Regression Results for Case Volume
Non
Promoted Promoted Non
Promoted Promoted Non
Promoted Promoted Merlot Merlot Pinot Noir Pinot Noir Control Control
Time -0.137 -0.013 -0.157 -0.055 -0.164 -0.048 (60.42)** (8.07)** (26.44)** (9.87)** (99.02)** (6.76)**
Time Squared 0.015 0.015 0.019 0.024 0.02 0.012 (48.22)** (66.96)** (23.69)** (31.76)** (90.68)** (12.15)**
D2005 0.83 1.237 0.572 2.036 0.806 0.711 (44.45)** (91.57)** (12.13)** (46.79)** (61.35)** (12.67)**
D2005*Time -0.112 -0.197 -0.005 -0.218 -0.116 -0.109
6
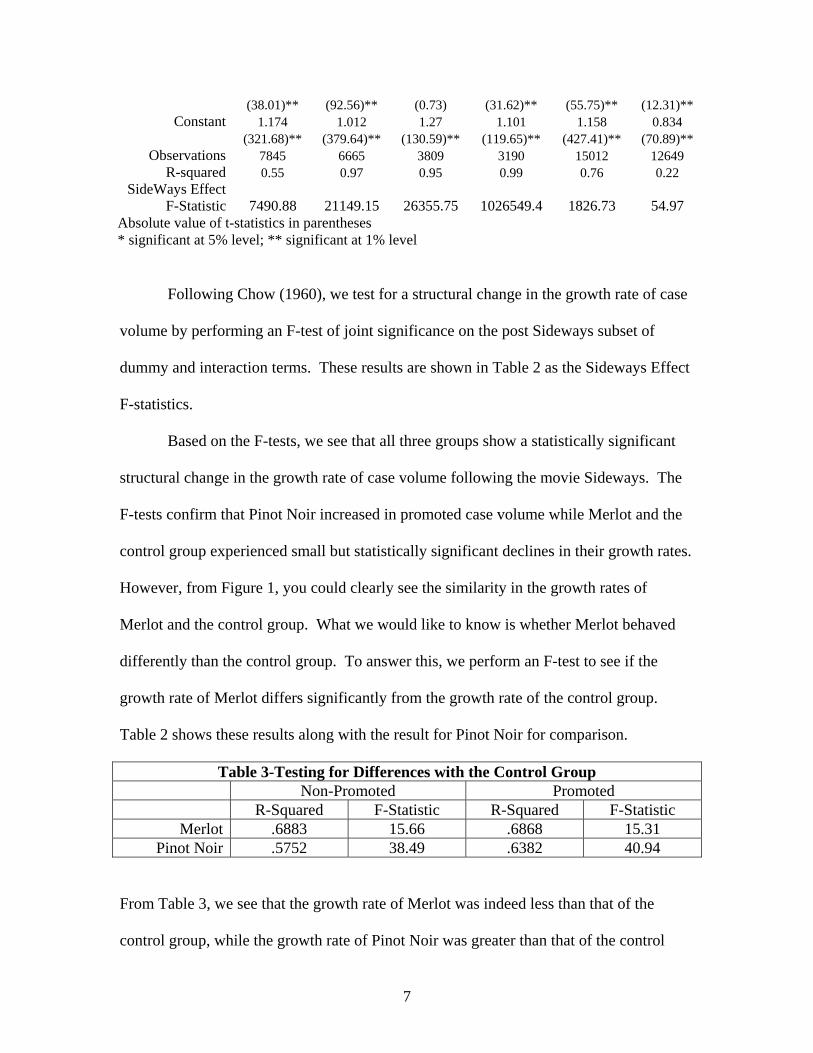
(38.01)** (92.56)** (0.73) (31.62)** (55.75)** (12.31)** Constant 1.174 1.012 1.27 1.101 1.158 0.834
(321.68)** (379.64)** (130.59)** (119.65)** (427.41)** (70.89)** Observations 7845 6665 3809 3190 15012 12649
R-squared 0.55 0.97 0.95 0.99 0.76 0.22 SideWays Effect
F-Statistic 7490.88 21149.15 26355.75 1026549.4 1826.73 54.97 Absolute value of t-statistics in parentheses * significant at 5% level; ** significant at 1% level
Following Chow (1960), we test for a structural change in the growth rate of case
volume by performing an F-test of joint significance on the post Sideways subset of
dummy and interaction terms. These results are shown in Table 2 as the Sideways Effect
F-statistics.
Based on the F-tests, we see that all three groups show a statistically significant
structural change in the growth rate of case volume following the movie Sideways. The
F-tests confirm that Pinot Noir increased in promoted case volume while Merlot and the
control group experienced small but statistically significant declines in their growth rates.
However, from Figure 1, you could clearly see the similarity in the growth rates of
Merlot and the control group. What we would like to know is whether Merlot behaved
differently than the control group. To answer this, we perform an F-test to see if the
growth rate of Merlot differs significantly from the growth rate of the control group.
Table 2 shows these results along with the result for Pinot Noir for comparison.
Table 3-Testing for Differences with the Control Group Non-Promoted Promoted R-Squared F-Statistic R-Squared F-Statistic
Merlot .6883 15.66 .6868 15.31 Pinot Noir .5752 38.49 .6382 40.94
From Table 3, we see that the growth rate of Merlot was indeed less than that of the
control group, while the growth rate of Pinot Noir was greater than that of the control
7

group. All results are statistically significant and hold for promoted and non-promoted
case volume.
While the results so far appear to coincide with conventional wisdom regarding
the effect of Sideways on wine consumption, it is possible that much of the growth in
annual wine sales are confounded by the increased coverage of the Nielsen data since
1999. To correct for this we construct three new variables examining the ratio of case
volume among the three groups. We examine the ratio of Merlot to Pinot Noir, Merlot to
the control group and Pinot Noir to the control group. Figure 3 shows a graph of all three
of the new variables. Once again we index the ratios to one for ease of interpretation.
Consider first the ratio of Merlot to Pinot Noir. If the move Sideways induced a decrease
in Merlot consumption while simultaneously increasing Pinot Noir consumption, then we
would expect the ratio of the two to decrease.
Figure 2-Indexed Ratio of Case Volume
8
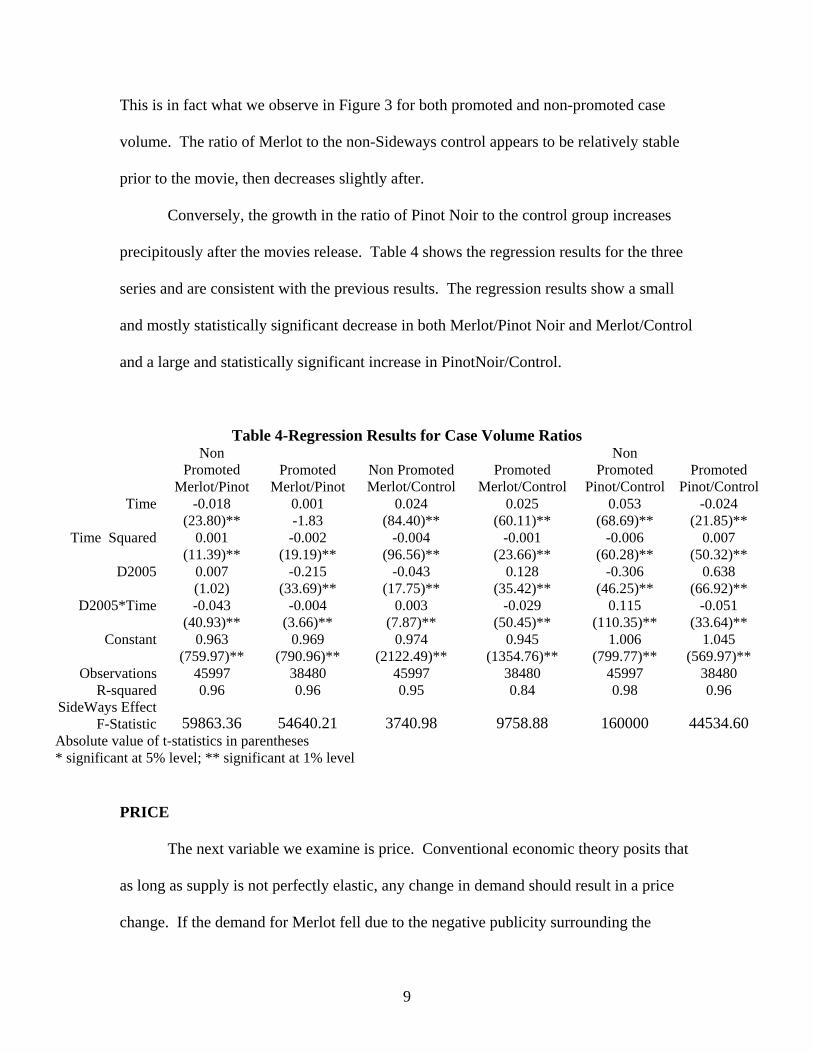
This is in fact what we observe in Figure 3 for both promoted and non-promoted case
volume. The ratio of Merlot to the non-Sideways control appears to be relatively stable
prior to the movie, then decreases slightly after.
Conversely, the growth in the ratio of Pinot Noir to the control group increases
precipitously after the movies release. Table 4 shows the regression results for the three
series and are consistent with the previous results. The regression results show a small
and mostly statistically significant decrease in both Merlot/Pinot Noir and Merlot/Control
and a large and statistically significant increase in PinotNoir/Control.
Table 4-Regression Results for Case Volume Ratios
Non
Promoted Promoted Non Promoted Promoted Non
Promoted Promoted Merlot/Pinot Merlot/Pinot Merlot/Control Merlot/Control Pinot/Control Pinot/Control
Time -0.018 0.001 0.024 0.025 0.053 -0.024 (23.80)** -1.83 (84.40)** (60.11)** (68.69)** (21.85)**
Time Squared 0.001 -0.002 -0.004 -0.001 -0.006 0.007 (11.39)** (19.19)** (96.56)** (23.66)** (60.28)** (50.32)**
D2005 0.007 -0.215 -0.043 0.128 -0.306 0.638 (1.02) (33.69)** (17.75)** (35.42)** (46.25)** (66.92)**
D2005*Time -0.043 -0.004 0.003 -0.029 0.115 -0.051 (40.93)** (3.66)** (7.87)** (50.45)** (110.35)** (33.64)**
Constant 0.963 0.969 0.974 0.945 1.006 1.045 (759.97)** (790.96)** (2122.49)** (1354.76)** (799.77)** (569.97)**
Observations 45997 38480 45997 38480 45997 38480 R-squared 0.96 0.96 0.95 0.84 0.98 0.96
SideWays Effect F-Statistic 59863.36 54640.21 3740.98 9758.88 160000 44534.60
Absolute value of t-statistics in parentheses * significant at 5% level; ** significant at 1% level
PRICE
The next variable we examine is price. Conventional economic theory posits that
as long as supply is not perfectly elastic, any change in demand should result in a price
change. If the demand for Merlot fell due to the negative publicity surrounding the
9

movie Sideways, then we expect observe a decrease in the price of Merlot. Similarly, if
the demand for Pinot Noir rose as a result of the movie Sideways, we expect observe an
increase in the price of Pinot Noir. Figure 3 shows a graph of the real price of Merlot,
Pinot Noir and the non-Sideways red wine control group of Cabernet Sauvignon and
Syrah. All prices are indexed to one in 1999. From Figure 3 we can see that indeed both
the price of Merlot and Pinot Noir move consistent with a predicted Sideways effect. For
Merlot, both promoted and non-promoted price falls while for Pinot Noir both promoted
and non-promoted price rises following the movie Sideways. How these changes
resonate within each varietal are examined later, for example how Merlot and Pinot Noir
are affected at different price segments, but clearly these results are consistent with a
decrease in demand for Merlot and an increase in demand for Pinot Noir.
Figure 3-Indexed Real Price
10

The test used to examine the effects of the movie on price is analogous to what we
used to examine the effect on quantity, but here we replace cases in Equation 1 with price
and estimate the follow equation by OLS:
Priceit = (2) itititit uTDDTimeTime +++++ 20052005 432
210 βββββ
Table 5 summarizes the regression results and indicates that for all three groups, the
movie Sideways induced statistically significant changes. While directionally, all the
coefficients move consistent with theory that the movie Sideways decreased the demand
for Merlot and increased the demand for Pinot Noir, the magnitude of the changes differs
between Merlot and Pinot Noir. While the price of Merlot continues a decline started in
2003, well before the movie began, Merlot does exhibit a small statistically significant
decrease in price. For non-promoted Pinot Noir, however, price in 2005 reverses a
downward trend beginning in 2003. For promoted Pinot Noir, price increases following
the movie after being stagnant from 2001-2004. Results for non-promoted and promoted
Pinot Noir are statistically significant.
Consistent with an overall increase in the demand for wine following the movie, it
appears that the movie sideways resulted in an increase in non-promoted price of the non-
Sideways red wine control group while producing a small but statistically significant
increase in the promoted price of the control group.
Table 5-Regression Results for Price
Non
Promoted Promoted Non
Promoted Promoted Non
Promoted Promoted
Merlot Merlot Pinot Noir
Pinot Noir Control Control
Time 0.023 0.043 0.115 0.074 0.059 0.023 (42.88)** (73.08)** (107.19)** (66.71)** (163.59)** (76.03)**
Time Squared -0.005 -0.007 -0.016 -0.008 -0.011 -0.002 (74.58)** (85.47)** (112.39)** (57.44)** (223.05)** (54.74)**
D2005 -0.328 -0.418 -1.15 -0.544 -0.876 -0.087 (70.95)** (81.32)** (125.58)** (57.97)** (285.25)** (34.42)**
11

D2005*Time 0.052 0.061 0.179 0.087 0.137 0.013 (71.47)** (75.07)** (123.74)** (59.05)** (283.47)** (33.78)**
Constant 0.989 0.971 0.892 0.97 0.967 0.979 (1140.60)** (999.63)** (499.46)** (519.21)** (1609.09)** (1952.80)**
Observations 8832 7484 4441 3725 17238 14484 R-squared 0.93 0.92 0.79 0.88 0.91 0.58
SideWays Effect F-Statistic 2553.86 4495.87 7931.76 1767.65 40684.89 599.98
Absolute value of t-statistics in parentheses * significant at 5% level; ** significant at 1% level
DEMAND
Next we estimate demand functions for Merlot, Pinot Noir and the control group
for the years before and after the movies release. The following model is estimated,
Casesit = (3) itititit uiceDIncomeice +++++ 05Pr2005Pr 43210 βββββ
As with all demand estimations, we are concerned about issues of endogeneity
and identification. Tests for endogeneity (Hausman 1978), indicate the presence of
simultaneity between the price per bottle of wine and the number of cases sold. To
correct for this endogeneity we instrument the price of wine using grape prices. Grape
prices appear to be the most obvious choice of instruments for the price of wine
satisfying the conditions needed for a valid instrument: Grape prices appear uncorrelated
with the error term in the demand for wine and as the primary ingredient in a bottle of
wine, should be highly correlated with wine prices. Unfortunately, correlations between
the price of wine and the price of grapes show little relationship. This is not too
surprising given the variation in the price of wine across varietals as well as the variation
in price within varietals. In addition, while grapes are the primary ingredient in a bottle
of wine, grapes do not constitute the primary cost in producing a bottle of wine,
12

accounting for only about 10% of the price of the average bottle of wine.1 Nevertheless,
of the costs associated with the production of wine, grapes seem a logical choice and
appear to be the most tractable. Following Cuellar and Huffman (2008) we correlate the
price of grapes using the “bottle price” rule where the price per ton of grapes is roughly
100 times the price of a 750 ML bottle of wine.2
The instrument we use is defined as,
Priceit = (4) itn
ntin viceGrapes ++ ∑=
−
3
1,0 Prαα
Where: Priceit represents the price of a bottle of wine of type i in year t.
PriceGrapes is the current and lagged price of grapes per ton for each
varietal. Lagged price is included because wine sold today may be
influenced by the price paid for grapes used at the time of production.
The results for the estimated demand functions for Merlot, Pinot Noir and the control
group are shown in Table 6 along with the F-statistics testing for changes in demand.
Table 6-Estimated Demand Functions Merlot Pinot Noir Control
Non-
Promoted
Promoted Non-
Promoted
Promoted Non-
Promoted
Promoted Cases Cases Cases Cases Cases Cases
Price -0.686 -1.256 -1.143 -1.564 -0.765 -1.265 (10.52)** (16.51)** (11.05)** (12.79)** (16.85)** (22.77)**
D2005 0.009 -1.109 0.018 -0.477 -0.276 -0.632 (0.04) (4.25)** (0.05) (1.11) (1.82) (3.76)**
Price*D2005 0.076 0.477 0.236 0.391 0.113 0.375 (0.84) (4.54)** (1.77) (2.54)* (1.89) (5.26)**
Income -3.267 0.767 -2.469 0.307 -1.593 1.897 (3.63)** (0.76) (1.95) (0.22) (2.25)* (2.39)*
Constant 37.748 0.453 31.059 5.177 6.917 7.553 (4.45)** (0.05) (2.60)** (0.39) (60.86)** (58.72)**
Observations 8832 7484 4441 3725 14575 12174
1 This is according to a wine industry report published by Gomberg-Frederickson which breaks down the cost of a $13 bottle of wine as follows: Grapes 11%, bottling and packaging 5%, wine making 10%, winery profit, marketing and overhead 19%, distribution 23% and retail markup 32%. 2 See Cuellar and Huffman (2008) for a complete discussion of the bottle price rule.
13
R-squared 0.03 0.05 0.06 0.08 0.04 0.07 Sideways Effect
F-Statistic 1.69 10.47 10.21 7.72 3.82 14.10 Absolute value of t-statistics in parentheses * significant at 5% level; ** significant at 1% level
From Table 6 you can see that non-promoted demand for Merlot does show a
slight decrease, as would be expected if the move had a negative impact, but these affects
are statistically insignificant. Promoted demand for Merlot does however indicate a
statistically significant change, although the results can be best interpreted as mixed.
While the demand for both non-promoted and promoted Pinot Noir increase, as
expected if the movie Sideways had a positive effect, Table 6 shows that only promoted
Pinot Noir increased significantly. F-test, however, indicate that both promoted and non-
promoted demands increased significantly.
The results for the control group wines are once again best described as mixed.
From Table 6, you can see that both promoted and non-promoted demands pivot causing
demand to become more inelastic. Also, Table 6 indicates that the affect on the promoted
control group is greater than the affect on the non-promoted control group demand.
However, non-promoted demand for the control group does not shift in a statistically
significant way, while promoted demand does show a statistically significant shift. While
the F-tests show that the changes are statistically significant, the effects on the non-
promoted demand are economically small and significant at the 5% level of significance
but not 1%.
14

ANALYSIS BY PRICE
Finally we examine whether the movie Sideways had different effects on different
price segments of wine consumers. For example, we want to know if low end wine
consumers were more affected by the movie Sideways than high end wine consumers.
This might be true if high end wine consumers are more representative of core consumers
than low end wine consumers, and if core wine consumers are less susceptible to events
such as movies and promotion than casual wine consumers, then we would expect the
movie Sideways to have a larger effect on consumers of lower priced wines than on
consumers of higher priced wines. To investigate whether the effects of the movie differ
by price we re-examine the data segmenting the wines into three categories: Less than
$10, $10-less than $20, and $20-$40.
The results for annual cases sold of Merlot are shown graphically in Figure 4 and
regression results are shown in Table 7. Figure 4 and Table 7 indicate that promoted and
non-promoted volume for the lowest priced Merlot (under $10 per bottle) result in a small
but statistically significant decrease after the movie Sideways. For the middle priced
segment, the results are mixed: Non-promoted Merlot indicates a small but statistically
significant increase while promoted Merlot indicates a small and statistically significant
decrease in case volume.
15

Figure 4-Merlot Case Volume by Price
For the highest priced segment of Merlot ($20-$40), the results are mixed with
volume decreasing for non-promoted Merlot but increasing for higher priced Merlot.
Table 7-Merlot Case Volume Regression Results by Price
Not
Promoted Promoted Not
Promoted Promoted Not
Promoted Promoted
Under $10
Under $10 $10- <$20
$10- <$20 $20-$40
$20-$40
Time -0.064 0.344 0.35 0.334 0.761 4.011 (7.70)** (29.79)** (47.37)** (8.63)** (18.60)** (20.66)**
Time Squared 0.007 -0.033 -0.059 -0.016 -0.091 -0.491 (6.32)** (21.37)** (58.87)** (3.13)** (16.77)** (19.72)**
D2005 2.276 0.827 -2.949 4.417 -1.413 -16.846 (31.13)** (8.19)** (45.58)** (13.22)** (4.07)** (10.92)**
D2005*Time -0.278 -0.064 0.504 -0.514 0.342 3.288 (24.20)** (4.05)** (49.26)** (9.74)** (6.24)** (13.61)**
Constant 1.019 0.554 0.672 0.503 0.574 -4.031 (74.93)** (29.69)** (55.97)** (7.85)** (8.26)** (11.58)**
SideWays Effect 2066.68 633.91 1608.56 513.90 184.81 388.72
16
F-Statistic Observations 4749 4815 3036 2136 934 490
R-squared 0.56 0.61 0.85 0.61 0.62 0.75 Absolute value of t-statistics in parentheses * significant at 5% level; ** significant at 1% level
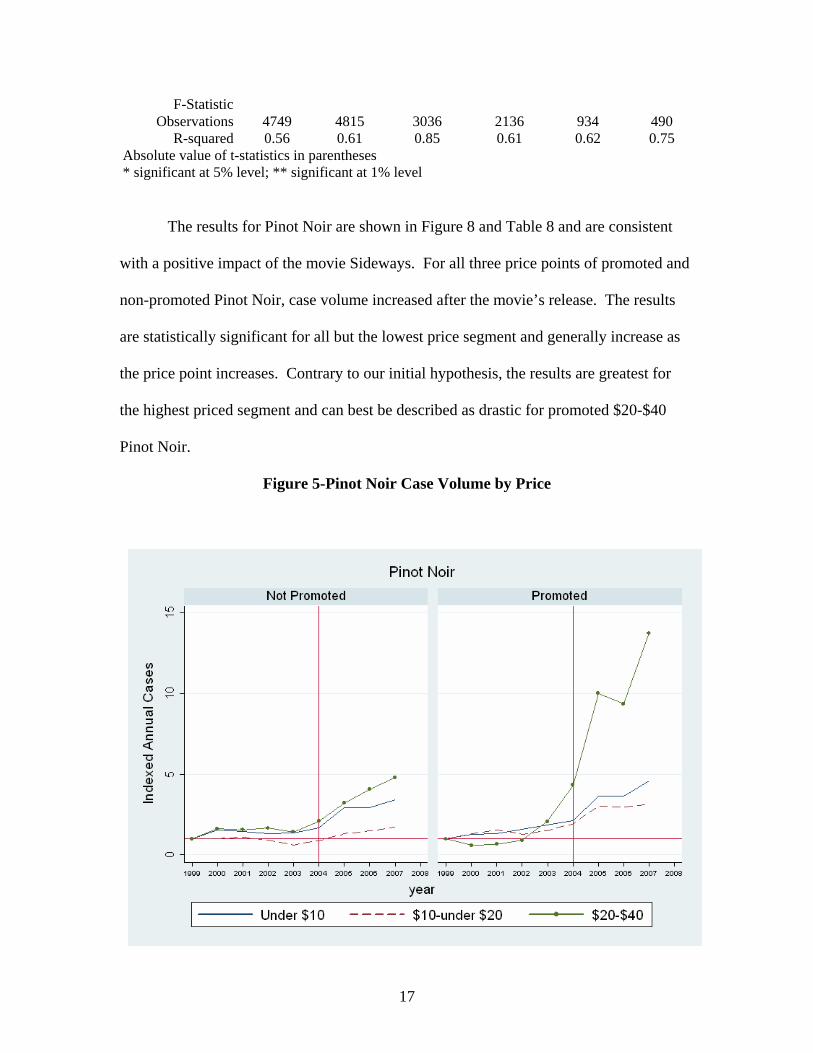
The results for Pinot Noir are shown in Figure 8 and Table 8 and are consistent
with a positive impact of the movie Sideways. For all three price points of promoted and
non-promoted Pinot Noir, case volume increased after the movie’s release. The results
are statistically significant for all but the lowest price segment and generally increase as
the price point increases. Contrary to our initial hypothesis, the results are greatest for
the highest priced segment and can best be described as drastic for promoted $20-$40
Pinot Noir.
Figure 5-Pinot Noir Case Volume by Price
17

Table 8 –Pinot Noir Case Volume Regression Results by Price
Not
Promoted Promoted Not
Promoted Promoted Not
Promoted Promoted
Under $10 Under $10
$10- <$20
$10- <$20 $20-$40
$20-$40 Time 0.712 0.912 0.324 0.77 2.079 7.551
(12.21)** (12.29)** (13.67)** (17.56)** (17.02)** (11.51)** Time Squared -0.087 -0.097 -0.052 -0.084 -0.259 -0.825
(10.93)** (9.56)** (16.40)** (14.48)** (16.30)** (10.33)** D2005 -0.053 1.384 -1.379 1.052 -8.459 -23.382
(0.1) (2.11)* (6.79)** (2.89)** (8.45)** (4.83)** D2005*Time 0.329 0.178 0.372 0.137 1.778 5.011
(4.06)** (1.72) (11.62)** (2.40)* (11.28)** (6.67)** Constant 0.241 -0.187 0.579 0.006 -1.892 -13.247
(2.61)** (1.57) (14.72)** (0.07) (8.66)** (10.33)** SideWays Effect
F-Statistic 600.66 535.56 975.75 1279.13 402.97 204.30 Observations 994 1215 2190 1829 1164 647
R-squared 0.71 0.71 0.51 0.75 0.59 0.65 Absolute value of t-statistics in parentheses * significant at 5% level; ** significant at 1% level
Finally, we estimate demand functions for Merlot and Pinot Noir at each of the
three price points. The regression results for the estimated demand functions for Merlot
are given in Table 9.
For the lowest priced segment of non-promoted Merlot, we obtain a demand
function that is positive, though statistically insignificant, in price. This is clearly
problematic and may be an issue of future research in itself. However, ignoring the
issues associated with the positive price coefficient we do observe changes in demand
due to the movie Sideways. For the lowest priced segment, the regression results show
18

that the demand for non-promoted Merlot does decrease but the affects are marginally
significant while the effect on promoted demand is statistically insignificant.
The remaining price categories of Merlot all result in conventional downward
sloping demand functions. While all categories indicate a negative effect of the movie,
only the $20-$40 promoted Merlot indicates a statistically significant decrease in
demand. The F-tests on the subset of coefficients produce F-statistics that are consistent
with the regression results and indicate a statistically significant effect for non-promoted
Merlot under $10 and statistically insignificant results for the remaining categories.
Table 9-Estimated Demand Functions by Price-Merlot Merlot
Not
Promoted Promoted Not
Promoted Promoted Not
Promoted Promoted
Under $10
Under $10 $10- <$20
$10- <$20 $20-$40
$20-$40 Cases Cases Cases Cases Cases Cases
Price 0.17 -0.229 -0.786 -0.445 -2.647 -3.668 (0.99) (1.42) (2.75)** (1.2) (4.69)** (5.16)**
D2005 -0.822 -0.498 -0.922 -1.215 -0.261 -6.031 (1.76) (1.14) (0.86) (0.88) (0.1) (1.93)
Price*D2005 0.551 0.205 0.411 0.421 0.059 1.935 (2.38)* (0.93) (1.01) (0.8) (0.08) (2.01)*
Income -3.297 -0.41 -3.172 3.425 -1.793 4.514 (2.63)** (0.32) (2.15)* (1.89) (0.7) (1.4)
Constant 36.408 9.738 37.217 -26.755 30.014 -27.857 (3.08)** (0.81) (2.67)** (1.56) (1.24) (0.92)
Observations 4749 4815 3036 2136 934 490 R-squared 0.01 0 0.01 0.01 0.05 0.09
Sideways Effect F-Statistic 3.86* 0.71 0.82 0.46 0.03 2.19
Absolute value of t-statistics in parentheses * significant at 5% level; ** significant at 1% level
The regression results for the estimated demand functions for Pinot Noir are given
in Table 10. Similar to low priced Merlot, the demand functions for low priced Pinot
Noir result in positive price coefficients, although like the results for Merlot, neither price
19

coefficients are statistically significant. The remaining demand functions all produce
negative and mostly significant price coefficients resulting in downward sloping
demands.
Again, ignoring the price coefficient, the effects of the movie Sideways on the
demand for Pinot Noir are mixed. For the lowest price segment, demand shifts but is
only statistically significant for non-promoted demand. For the middle price segment
($10-under $20), the regression results indicate that demand became more inelastic for
both promoted and non-promoted Pinot Noir. For the highest priced segment ($20-$40)
we obtain similar results, but the effects are statistically insignificant.
Table 10-Estimated Demand Functions by Price-Pinot Noir
Not
Promoted Promoted Not
Promoted Promoted Not
Promoted Promoted
Under $10
Under $10 $10- <$20
$10- <$20 $20-$40
$20-$40 Cases Cases Cases Cases Cases Cases
Price 0.546 0.315 -1.612 -2.15 -2.97 -2.686 (1.34) (0.92) (4.57)** (5.15)** (5.61)** (3.27)**
D2005 -2.283 -1.047 -2.745 -1.052 -3.181 -0.205 (1.97)* (1.03) (2.14)* (0.74) (1.51) (0.07)
Price*D2005 1.28 0.647 1.395 0.644 1.111 0.197 (2.32)* (1.33) (2.91)** (1.2) (1.72) (0.21)
Income -0.806 -0.169 -5.339 -0.393 2.032 8.914 (0.29) (0.06) (3.08)** (0.2) (0.89) (2.84)**
Constant 11.855 6.008 59.579 13.505 -5.705 -73.31 (0.45) (0.24) (3.64)** (0.74) (0.26) (2.49)*
Observations 994 1215 2190 1829 1164 647 R-squared 0.03 0.01 0.02 0.04 0.06 0.14
Sideways Effect F-Statistic 3.00* 1.11 13.92** 4.60** 2.62 0.73
Absolute value of t-statistics in parentheses * significant at 5% level; ** significant at 1% level
20
CONCLUSIONS
This paper tests the so called Sideways effect. Specifically we investigate
whether or not the movie Sideways had a significant effect on the consumption of Merlot,
Pinot Noir and overall wine consumption. Our results are consistent with the theory that
the movie Sideways had a small negative impact on the consumption of Merlot while
increasing the consumption of Pinot Noir. However, far from having a “devastating”
effect, the positive impact on Pinot Noir appears greater than the negative impact on
Merlot. For example, while the sales of Merlot slow following the movie, sales of Pinot
Noir increase significantly. We observe a similar effect with respect to price. Following
the movie Sideways, the price of Merlot continues an already decreasing trend, while the
price of Pinot Noir reverses a decreasing trend and increases following the movie. The
estimated demands confirm these results showing a small decrease in the demand for
Merlot and an increase in the demand for Pinot Noir. Furthermore, the paper shows that
there appears to be a general increase in wine consumption, as measured by the control
group red wines, as a result in the movies popularity.
Lastly, we examined whether the affects of the movie Sideways differed by price
point. Our results show that the negative effects of Merlot were confined mostly to the
lower priced segment, under $10 per bottle and that the higher priced segments may have
even increased, although the results are mixed. The effects on Pinot Noir, on the other
hand, were positive across all price points, with the largest impact being on the highest
price point of $20-$40 per bottle.
21

Works Cited
Gregory C. Chow (1960), “Tests of Equality Between Sets of Coefficients in Two Linear Regressions.” Econometrica 28(3), 591-605.
Cuellar, Steven S. and Ryan Huffman (2008), “Estimating the Demand for Wine Using
Instrumental Variable Techniques.” Under review Journal of Wine Economics.
Hausman, J. (1978), “Specification Tests in Econometrics.” Econometrica 46(6), 1251-71.
22