THE INFLUENCE OF INDIGENOUS AFRICAN CULTURE ON SME ADOPTION
OF DIGITAL GOVERNMENT SERVICES IN ZAMBIA
by
YAKOMBA YAVWA
submitted in accordance with the requirements for
the degree of
DOCTOR OF PHILOSOPHY
In
INFORMATION SYSTEMS
at the
UNIVERSITY OF SOUTH AFRICA
PROMOTER: PROFESSOR HOSSANA TWINOMURINZI
2019
© University of South Africa
ii | P a g e
DECLARATION
Name: Yakomba Yavwa
Student Number: 58539905
Degree: Ph.D. Degree in Information Systems
Ethics Certificate: 029/YY/2018/CSET_SOC
Exact wording of the title of the thesis as appearing on the copies submitted for examination:
THE INFLUENCE OF INDIGENOUS AFRICAN CULTURE AND INTERNET ACCESS ON
SME ADOPTION OF DIGITAL GOVERNMENT SERVICES: E-FILING AND E-PAYMENT
SERVICES IN ZAMBIA
I declare that the above thesis is my own work and that all the sources that I have used or quoted have
been indicated and acknowledged by means of complete references.
I further declare that I submitted the thesis to originality checking software and that it falls within the
accepted requirements for originality.
I further declare that I have not previously submitted this work, or part of it, for examination at UNISA
for another qualification or at any other higher education institution.
11th February 2020
_____________________________________________________________________
SIGNATURE DATE
© University of South Africa
iii | P a g e
Abstract
Many low-income countries desire to implement and adopt digital government as a springboard for
economic and social development but face many challenges. The United Nations identifies that Africa
has especially lagged consistently in digital government development and adoption. Most scholars
largely attribute the challenges to infrastructure and skills, and often rhetorically cite culture as playing
a strong role. This study specifically examined the role of indigenous African culture (‘spirituality’,
‘communalism’ and ‘respect for authority and elders’) and internet access on the adoption of digital
government services (e-filing and e-payment of taxes) by Small and Micro Enterprises (SMEs) in
Zambia, with the Unified Theory of Acceptance and Use of Technologies (UTAUT) as the
underpinning theoretical lens. Data analysis was done using Structural Equation Modelling with
principal attention given to the moderating and mediating influence of indigenous African culture. The
influence of internet access on the intention to adopt digital government was also examined. The
findings from the cross sectional study of 401 tax registered SMEs suggests that ‘spirituality’, ‘African
communalism’ and ‘respect for authority and elders’ have significant negative moderating effects on
the adoption of e-filing but not on e-payment; and ‘spirituality’, ‘African communalism’ and ‘respect
for authority and elders’ are all significant mediators of the intention to adopt both e-filing and e-
payment. This means that indigenous African culture plays a significant role in explaining Africa’s
position in digital government development and adoption. The findings also showed a negative
influence of internet access on the intention to adopt digital government services despite the measures
that government has put in place. These results make a novel contribution to Information Systems (IS)
theory in identifying a critical yet often overlooked indigenous cultural influence on the adoption of
digital innovations in low-income countries. The findings also calls for finding new or adapted IS
theories that take into account such unique cultural constructs. The thesis recommends that the research
is extended to other low-income countries as well as other contexts that exhibit strong indigenous
cultural values.
Keywords
Digital government, African culture, indigenous culture, spirituality, communalism, respect, internet access, e-
filing, e-payment.
Key terms
Digital government; indigenous African Culture; Spirituality; African Communalism; Respect; Internet Access;
Unified Theory of Acceptance and Use of Technologies (UTAUT); digital government maturity models; Structural
Equations Modelling (SEM), Electronic filing; Electronic Payments.
© University of South Africa
iv | P a g e
Acknowledgements
I wish to thank my Supervisor, Professor Hossana Twinomurinzi for his patience, benevolence and the
way in which he empowered me to do and complete my research.
I also wish to thank the Zambia Revenue Authority for providing demographic data that was used for
systematic random sampling to enable selection of respondents used in the study. Special thanks to the
SMEs who are also taxpayers in Zambia, who agreed to complete the questionnaires to make this study
a success.
Special thanks to my family for their patience during the difficult period of conducting research and
writing.
I wish to specifically acknowledge the help obtained from Professor Andrew F. Hayes of The Ohio
State University in the USA for his guidance in the interpretation of the results of Model 1 of Hayes
macro in SPSS.
© University of South Africa
v | P a g e
The publications indicated below are part of the work undertaken during this research.
Published Journal Papers
[J1] Yavwa, Y. (2018). Efficient tax system in Zambia. Muma Case Review 3(15). 1-
23. https://doi.org/10.28945/4217 (accepted and published journal article).
Published Conference Papers
[C1] Yakomba Yavwa, and Hossana Twinomurinzi (2018) Impact of culture on e-government
adoption using UTAUT: A case of Zambia. Submitted to the International conference on e-
democracy and e-government, Ambato, Ecuador, 4-6 April, 2018. https://edem-
egov.org/awards-icedeg-2018. (awarded best presentation) (4 Citations).
[C2] Yavwa, Y and Twinomurinzi, H (2019). The moderation of spirituality on digital government
services in low-income countries: a case of SMEs in Zambia. Twelfth Annual AIS SIG Global
Development pre-ICIS Workshop, Munich, Germany, December 15, 2019.
Invited Panel Member
[P] Invited by Professor Chrisanthi Avgerou as a panellist to discuss the topic “Exploring the role
of spirituality in the digital era” at the European Conference on Information Systems (ECIS),
Marrakech, Morocco, June 15-17, 2020.
Under review
[U1] Yavwa, Y and Twinomurinzi, H (xxx). The role of culture on digital government adoption in
developing countries: A systematic literature review, Journal of Information Technology for
Development.
Submitted
[S1] Yavwa, Y and Twinomurinzi, H (2020) The moderating effect of African communalism on
digital government: a case of SMEs in Zambia. Information Systems Journal.
© University of South Africa
vi | P a g e
TABLE OF CONTENTS
Table of Contents _________________________________________________________________ vi
CHAPTER 1 _____________________________________________________________________ 3
1. INTRODUCTION AND THESIS OVERVIEW _____________________________________ 3
1.1 Introduction and Background ________________________________________________ 3
1.2 SMEs in Zambia and e-Filing ________________________________________________ 4
1.3 Problem Statement _________________________________________________________ 6
1.4 Research Objective and Questions ____________________________________________ 7
1.5 Overview of Theory and Methodological Approach ______________________________ 8
1.6 Thesis Roadmap ___________________________________________________________ 9
CHAPTER 2 ____________________________________________________________________ 11
2. LITERATURE REVIEW Digital government & Culture ____________________________ 26
2.1 Introduction ______________________________________________________________ 26
2.2 Digital Government _______________________________________________________ 26
2.3 Definition ________________________________________________________________ 26
2.3.1 Evolutionary Stages of Government ________________________________________ 28
2.3.2 Generally Applied Digital Government Standards ____________________________ 33
2.3.3 Digital government and Development _______________________________________ 35
2.3.4 Digital Government Stimuli or Enablers ____________________________________ 37
2.4 Cultural Contexts _________________________________________________________ 40
2.4.1 Forms of Culture ________________________________________________________ 40
2.4.2 Indigenous Aspects of Culture _____________________________________________ 40
2.5 Internet Access ___________________________________________________________ 42
2.6 Efficiency Summary _______________________________________________________ 43
2.7 Conclusion _______________________________________________________________ 44
CHAPTER 3 ____________________________________________________________________ 46
3. A SYSTEMATIC LITERATURE REVIEW OF THE INFLUENCE OF INDIGENOUS
AFRICAN CULTURE ON DIGITAL GOVERNMENT ADOPTION ______________________ 46
3.1 Introduction ______________________________________________________________ 46
© University of South Africa
vii | P a g e
3.2 Methodology _____________________________________________________________ 46
3.2.1 Planning the Review _____________________________________________________ 46
3.2.1.3.1 Inclusion ________________________________________________________________ 48
3.2.1.3.2 Exclusion _______________________________________________________________ 48
3.2.2 Review Conduct ________________________________________________________ 49
3.3 Classification and coding ___________________________________________________ 50
3.4 Main findings _____________________________________________________________ 50
3.5 Analysis and discussion of findings ___________________________________________ 61
3.5.1 Cultural Dimensions _____________________________________________________ 61
3.5.2 Research Context _______________________________________________________ 62
3.5.3 Digital government perspectives ___________________________________________ 63
3.6 Conclusions ______________________________________________________________ 64
CHAPTER 4 ____________________________________________________________________ 65
4. Indigenous African Culture: Spirituality, Communalism and Respect __________________ 65
4.1 Introduction ______________________________________________________________ 65
4.2 Spirituality _______________________________________________________________ 65
4.2.1 Spirituality Defined ______________________________________________________ 65
4.2.2 The Importance of Spirituality ____________________________________________ 66
4.2.3 The How of Spirituality __________________________________________________ 67
4.3 Communalism ____________________________________________________________ 67
4.3.1 African Communalism Defined ____________________________________________ 68
4.3.2 The Importance of African Communalism___________________________________ 69
4.3.3 The How of African Communalism ________________________________________ 69
4.4 Respect for Elders and Authority ____________________________________________ 70
4.4.1 Respect for Authority and Elders in an African Context _______________________ 70
4.4.2 The Importance of Respect for Elders and Authority __________________________ 71
4.4.3 The How of Respect for Elders and Authority ________________________________ 71
4.5 Conclusion _______________________________________________________________ 72
© University of South Africa
viii | P a g e
CHAPTER 5 ____________________________________________________________________ 11
5. Zambia Case Study ___________________________________________________________ 11
5.1 Introduction ______________________________________________________________ 11
5.2 Demographic Information __________________________________________________ 11
5.3 Population _______________________________________________________________ 12
5.4 The Government Structure _________________________________________________ 13
5.4.1 Role Players and their Responsibilities ______________________________________ 14
5.5 Zambia's Digital Government Maturity Level __________________________________ 14
5.6 Zambian Culture __________________________________________________________ 17
5.7 Internet Access in Zambia __________________________________________________ 23
5.7.1 Network Infrastructure showing Zambia’s position ___________________________ 24
5.8 Conclusion _______________________________________________________________ 25
CHAPTER 6 ____________________________________________________________________ 73
6. THEORETICAL UNDERPINING ______________________________________________ 73
6.1 Introduction ______________________________________________________________ 73
6.2 Theory of Reasoned Action _________________________________________________ 73
6.3 Theory of Planned Behavior ________________________________________________ 74
6.4 Technology Acceptance Model ______________________________________________ 76
6.4.1 TAM 2 ________________________________________________________________ 77
6.5 Motivational Model ________________________________________________________ 77
6.6 Diffusion of Innovation _____________________________________________________ 78
6.7 Social Cognitive Theory ____________________________________________________ 79
6.8 Model of PC Utilization ____________________________________________________ 80
6.9 A Model Combining TAM & TPB ___________________________________________ 80
6.10 Unified Theory of Acceptance and Use of Technologies __________________________ 80
6.11 Limitations of the IS Theories _______________________________________________ 82
6.12 Hypotheses Design ________________________________________________________ 83
6.12.1 Internet Access _________________________________________________________ 83
6.12.2 Performance Expectancy _________________________________________________ 84
© University of South Africa
ix | P a g e
6.12.3 Effort Expectancy _______________________________________________________ 84
6.12.4 Social Influence _________________________________________________________ 84
6.12.5 Facilitating Conditions ___________________________________________________ 85
6.12.6 Behavioral Intention _____________________________________________________ 85
6.12.7 Adoption Model for E-filing and E-payment (AMfEE) Model ___________________ 86
6.13 Conclusion _______________________________________________________________ 87
CHAPTER 7 ____________________________________________________________________ 88
7. RESEARCH APPROACH _____________________________________________________ 88
7.1 Introduction ______________________________________________________________ 88
7.2 Research Philosophy _______________________________________________________ 89
7.3 Methodology _____________________________________________________________ 90
7.4 Strategy _________________________________________________________________ 91
7.5 Time horizon _____________________________________________________________ 91
7.6 Data Collection ___________________________________________________________ 92
7.7 Data Preparation and Analysis ______________________________________________ 92
7.7.1 Population _____________________________________________________________ 94
7.7.2 Missing data ____________________________________________________________ 95
7.7.3 Normality ______________________________________________________________ 96
7.7.4 Outliers________________________________________________________________ 96
7.7.5 Linearity_______________________________________________________________ 96
7.7.6 Sampling Strategy _______________________________________________________ 95
7.7.7 Unit of Analysis _________________________________________________________ 95
7.7.8 Validity and Reliability ___________________________________________________ 96
7.8 Ethical Consideration ______________________________________________________ 99
7.9 Conclusion ______________________________________________________________ 100
CHAPTER 8 ___________________________________________________________________ 100
8. DATA PREPARATION ______________________________________________________ 100
8.1 Introduction _____________________________________________________________ 100
8.2 Study Population _________________________________________________________ 100
© University of South Africa
x | P a g e
8.3 Demographic Information of the Study Sample _______________________________ 101
8.4 Data Screening __________________________________________________________ 105
8.5 Normality _______________________________________________________________ 111
8.6 Model Fit Indices _________________________________________________________ 112
8.7 Conclusion ______________________________________________________________ 116
CHAPTER 9 ___________________________________________________________________ 117
9. DATA ANALYSIS __________________________________________________________ 117
9.1 Introduction _____________________________________________________________ 117
9.2 Model Reliability _________________________________________________________ 117
9.3 Validity of a construct ____________________________________________________ 121
9.4 AMfEE – Exploratory Factor Analysis (EFA) _________________________________ 121
9.5 Examining the AMfEE Model ______________________________________________ 130
9.5.1 SEM overview _________________________________________________________ 130
9.6 Confirmatory Factor Analysis (CFA) of the Research Model ____________________ 133
9.6.1 CFA at Individual Construct Level ________________________________________ 136
9.6.2 CFA for AMfEE Model -e-Filing __________________________________________ 138
9.6.2.1 Assessing Moderation for E-filing Model _______________________________________ 138
9.6.2.1.1 Spirituality _____________________________________________________________ 138
9.6.2.1.2 Communalism __________________________________________________________ 140
9.6.2.1.3 Respect ________________________________________________________________ 140
9.6.3 CFA for AMfEE – e-Payment ____________________________________________ 147
9.6.4 Modified e-Payment Model ______________________________________________ 152
9.7 Evaluation of the Overall Research Model ____________________________________ 155
9.8 Conclusion ______________________________________________________________ 158
CHAPTER 10 __________________________________________________________________ 159
10. DISCUSSION ____________________________________________________________ 159
10.1 Introduction _____________________________________________________________ 159
10.2 Influence of Internet Access on Adoption of Digital Government Services __________ 160
10.3 Influence of Performance Expectancy on Adoption of Digital Government Services _ 160
© University of South Africa
xi | P a g e
10.4 Influence of Effort Expectancy on Adoption of Digital Government Services _______ 161
10.5 Influence of Social Influence on Adoption of Digital Government Services _________ 162
10.6 Moderating and Mediating Influence of Indigenous African Culture on Social Influence
162
10.7 Influence of Facilitating Conditions on Usage of Digital Government Services ______ 164
CHAPTER 11 __________________________________________________________________ 165
11. CONCLUSION ___________________________________________________________ 165
11.1 Introduction _____________________________________________________________ 165
11.2 Effect of Indigenous African Culture ________________________________________ 165
11.3 Practical effect of Internet Access and UTAUT Constructs ______________________ 167
11.4 Digital Government Usage _________________________________________________ 168
11.5 Theoretical Implications of the Research _____________________________________ 168
11.6 Research Contributions ___________________________________________________ 169
11.7 Recommendations and Future Work ________________________________________ 169
11.8 Research Limitation ______________________________________________________ 170
12. REFERENCES __________________________________________________________ 171
APPENDIX I : Research Questionnaire 1 ________________________________________ 195
APPENDIX II : e-filing Modification Indices ____________________________________ 195
APPENDIX III : e-Payment Modification Indices ________________________________ 217
APPENDIX IV : Working title of Research_______________________________________ 231
APPENDIX V : Research Assistants _____________________________________________ 233
APPENDIX VI : SLR Search Terms _____________________________________________ 235
APPENDIX VII : Codification Framework _______________________________________ 236
APPENDIX VIII : Dimensions of Culture________________________________________ 239
© University of South Africa
xii | P a g e
List of Tables
TABLE 2.1: DIGITAL GOVERNMENT MATURITY MODELS. ..................................................................................... 31
TABLE 2.2: TEN DIGITAL GOVERNMENT STANDARDS. ........................................................................................... 34
TABLE 2.3: REGIONAL AND ECONOMIC GROUPINGS FOR EGDI. ............................................................................ 35
TABLE 2.4:EGDI FOR SADC COUNTRIES. ............................................................................................................. 36
TABLE 3.2: ELECTRONIC DATABASES ................................................................................................................... 47
TABLE 3.3: CLASSIFICATION AND CODES ............................................................................................................... 50
TABLE 3.4: SUMMARY OF PREVIOUS STUDIES INVOLVING CULTURE AND DIGITAL GOVERNMENT ...................... 50
TABLE 3.5: CULTURAL DIMENSIONS IN DIGITAL GOVERNMENT RESEARCH ............................................................ 61
TABLE 3.6: DIGITAL GOVERNMENT RESEARCH CONTEXTS .................................................................................... 62
TABLE 3.7: DIGITAL GOVERNMENT RESEARCH PERSPECTIVES OR FOCUS .............................................................. 63
TABLE 5.1: ZAMBIAN POPULATION BY PROVINCES ............................................................................................... 12
TABLE 5.2: ZAMBIA'S DIGITAL GOVERNMENT MATURITY STAGES BY MINISTRY. ......................................... 15
TABLE 5.3: ZAMBIA'S CULTURE EXPRESSED THROUGH TRADITIONAL CEREMONIES. ............................................. 18
TABLE 6.1: LIMITATIONS OF THE IS THEORIES. ..................................................................................................... 82
TABLE 7.1: COMPARING QUALITATIVE AND QUANTITATIVE METHODS. ............................................................... 90
TABLE 7.2: CRONBACH'S ALPHA CLASSIFICATION(PETERSON, 1994). .................................................................. 99
TABLE 8.1: DEMOGRAPHY OF THE SAMPLE DATA. ........................................................................................... 101
TABLE 8.2: DEMOGRAPHY OF THE SAMPLE DATA. ............................................................................................... 102
TABLE 8.3: INTERNET PROFICIENCY AND DIGITAL GOVERNMENT SERVICES. ..................................................... 103
TABLE 8.4: EIGENVALUES. .................................................................................................................................. 106
TABLE 8.5: DESCRIPTIVE STATISTICS. ................................................................................................................. 108
TABLE 8.6: ACCEPTABLE LEVELS OF MODEL FIT INDICES (TREIBLMAIER ET AL., 2004). .................................... 115
TABLE 9.1: OVERALL CRONBACH'S ALPHA FOR E-FILING.................................................................................... 118
TABLE 9.2: OVERALL CRONBACH'S ALPHA FOR E-PAYMENT. ............................................................................. 118
TABLE 9.3: INDIVIDUAL CONSTRUCT RELIABILITY. ............................................................................................ 119
TABLE 9.4: EXPLORATORY FACTOR ANALYSIS OF NEW CONSTRUCTS. ................................................................ 122
TABLE 9.5: AMFEE ITEM LOADING FOR E-FILING SERVICE. ................................................................................ 125
TABLE 9.6: AMFEE ITEM LOADING FOR E-PAYMENT SERVICE. ........................................................................... 128
TABLE 9.7: STEPS FOLLOWED IN RUNNING THE CFA (AWANG, 2012). ................................................................ 134
© University of South Africa
xiii | P a g e
TABLE 9.8: MODEL FIT MEASUREMENTS FOR INDIVIDUAL CONSTRUCTS FOR THE E-FILING SCALE (N=401). ...... 136
TABLE 9.9: MODEL FIT MEASUREMENTS FOR INDIVIDUAL CONSTRUCTS FOR E-PAYMENT SCALE (N=401).......... 137
TABLE 9.10: HAYES PROCESS MACRO RESULTS FOR MODEL 1 – MODERATION OF SPIRITUALITY ......................... 139
TABLE 9.11: RESULTS OF THE CFA OF AMFEE MODEL- E-FILING. .................................................................... 142
TABLE 9.12: MEDIATING EFFECTS OF S, C AND R ON INTENTION TO E-FILE. ....................................................... 146
TABLE 9.13: RESULTS OF THE CFA OF AMFEE MODEL - E-PAYMENT. ............................................................... 149
TABLE 9.14:MEDIATION EFFECTS OF S, C, AND R ON E-PAYMENT. ..................................................................... 154
TABLE 9.15: EVALUATED HYPOTHESES. ............................................................................................................. 155
TABLE 9.16: PARAMETER ESTIMATES FOR THE STRUCTURAL MODELS. ............................................................... 157
© University of South Africa
1 | P a g e
List of Figures
FIGURE 1.1:THESIS ROADMAP. .............................................................................................................................. 10
FIGURE 2.1: DIGITAL GOVERNMENT INTERACTIONS ............................................................................................. 27
FIGURE 2.2: STAGES IN THE EVOLUTION OF GOVERNMENT. ................................................................................... 28
FIGURE 2.3: SMART GOVERNMENT – ADAPTED (LOPES, 2017; SCHOLL & SCHOLL, 2014). ................................... 29
FIGURE 3.1: STUDIES SCREENED USING THE PRISMA FLOWCHART. ..................................................................... 49
FIGURE 5.1: LOCATION OF ZAMBIA. ...................................................................................................................... 12
FIGURE 5.2: ZAMBIAN GOVERNANCE STRUCTURE. ............................................................................................... 13
FIGURE 5.3: CULTURE EXPRESSED THROUGH MAKISHI MASQUERADE. ................................................................. 21
FIGURE 5.4: UNDERLYING INFRASTRUCTURE TO ENABLE INTERNET ACCESS......................................................... 24
FIGURE 5.5: AFRICAN UNDERSEA CABLES FROM WHICH ZAMBIA CAN ACCESS INTERNET. .................................... 25
FIGURE 6.1: THEORY OF REASONED ACTION (OTIENO ET AL., 2016) (BI = A + SN; BI IS DEPENDENT ON A AND
SN). ............................................................................................................................................................. 74
FIGURE 6.2: DIAGRAMMATIC VIEW OF THEORY OF PLANNED BEHAVIOUR (TAYLOR & TODD, 1995). .................. 75
FIGURE 6.3: DECOMPOSED TPB(TAYLOR & TODD, 1995)..................................................................................... 75
FIGURE 6.4: FINAL PATH MODEL FOR TAM (CHUTTUR, 2014). ............................................................................ 76
FIGURE 6.5: TECHNOLOGY ACCEPTANCE MODEL 2 (TAM 2). .............................................................................. 77
FIGURE 6.6: MOTIVATIONAL MODEL (SZALMA, 2014). ......................................................................................... 78
FIGURE 6.7: VARIABLES DETERMINING DIFFUSION OF INNOVATION(ROGERS, 1995). ........................................... 79
FIGURE 6.8: SOCIAL COGNITIVE THEORY(AL-MAMARY ET AL., 2016; WOOD & BANDURA, 1989). ...................... 79
FIGURE 6.9: THE UTAUT MODEL (VENKATESH , MORRIS , DAVIS, 2003). ........................................................... 81
FIGURE 6.10: PROPOSED AMFEE MODEL. ............................................................................................................ 86
FIGURE 7.1: RESEARCH ONION (SAUNDERS & TOSEY, 2012). ............................................................................... 88
FIGURE 9.1: EXAMPLE OF SEM MODEL. ............................................................................................................. 131
FIGURE 9.2: EXAMPLE OF SEM MODEL SHOWING CONSTRUCTS CORRELATION. ................................................. 132
FIGURE 9.3: EXAMPLE OF SEM MODEL SHOWING MODERATION BY CONSTRUCT C. ........................................... 132
FIGURE 9.4: EXAMPLE OF SEM MODEL SHOWING MEDIATION BY CONSTRUCT C. .............................................. 133
FIGURE 9.5: MODERATION OF CULTURE ON THE INFLUENCE OF SI ON BI TOWARDS E-FILING. ............................ 138
FIGURE 9.6: THE E-FILING MODEL WITH MEDIATION OF CULTURAL CONSTRUCTS. ............................................. 141
FIGURE 9.7: MODIFIED E-FILING MODEL. ............................................................................................................ 145
© University of South Africa
2 | P a g e
FIGURE 9.8: MEDIATION OF S, C, AND R FOR E-FILING MODEL. ........................................................................... 146
FIGURE 9.9: MODERATION OF INDIGENOUS AFRICAN CULTURE ON SI → BI RELATIONSHIP FOR E-PAYMENT. ... 147
FIGURE 9.10:THE E-PAYMENT MODEL ................................................................................................................ 149
FIGURE 9.11: MODIFIED E-PAYMENT MODEL. ..................................................................................................... 153
FIGURE 9.12: MEDIATION OF S, C AND R ON BI FOR E-PAYMENT. ...................................................................... 154
Equations
EQUATION 7-1: MODELLING A REFLECTIVE CONSTRUCT ..................................................................... 93
EQUATION 7-2: CONTENT VALIDITY RATION ........................................................................................... 98
EQUATION 7-3: CONSTRUCT RELIABILITY ................................................................................................ 98
EQUATION 8-1: GOODNESS OF FIT INDEX ................................................................................................. 113
EQUATION 8-2: ADJUSTED GOODNESS OF FIT INDEX ............................................................................ 113
EQUATION 9-1: CRONBACH'S ALPHA ........................................................................................................ 118
© University of South Africa
3 | P a g e
CHAPTER 1
1. INTRODUCTION AND THESIS OVERVIEW
1.1 Introduction and Background
Many low-income countries are implementing digital government systems aimed at
improving services offered by government (Samboma, 2019). Digital government systems
are designed and implemented to overcome bottlenecks to achieve a digital service delivery
system that is efficient and contributes to the development of a country (Khamis and
VanderWeide, 2017). The adoption however, has had consistent challenges, especially in
low-income countries (UNDESA, 2018).
The Department of Economic and Social Affairs of the United Nations, in their survey of
2018, showed that low-income countries of Africa and Oceania have the lowest index for
digital government development (UNDESA, 2018). High income regions of Europe have
the highest Electronic Government Development Index (EGDI). EGDI reflects level of
digital government adoption in a given region in comparative terms. Africa has consistently
lagged behind both in implementation as well as digital government adoption (Weerakkody
et al., 2007; Kupe and Okello, 2012; UNDESA, 2016, 2018).
Considerable research has been undertaken with the objective of understanding the factors
influencing the acceptance of digital government (Alok and Deepti, 2012; Azmi,
Kamarulzaman and Hamid, 2012b; Chandra, 2015; Gupta, Syed, et al., 2015; Gupta, Udo,
et al., 2015; Mustapha, Normala and Sheikh, 2015; Syed, Henderson and Gupta, 2017). The
findings largely point to political, financial, technological, social and to a lesser extent
cultural factors (Kupe and Okello, 2012; Choudrie et al., 2017). While political, financial
and technological factors are universal and have the same nature of impact regardless of
region or location, culture, on the other hand, is context specific. The moderating and
mediating influence of culture, especially indigenous culture, is different from region to
region depending on the extent to which it is embedded in communities and individuals.
The argument in this thesis is that the embodiment of culture in its indigenous form in
communities and individuals in Africa is different compared to other regions (Táíwò, 2016)
and hence the need to investigate its influence on digital government adoption. The study
also sought to bring to the fore the impact of internet access on digital government adoption,
particularly in Zambia, following the reduction of the telecommunication tariffs by mobile
© University of South Africa
4 | P a g e
service operators and the government efforts to implement telecommunication towers to
enable the achievement of sustainable development goal (SDG) Target 9. The SDG
recommends for the provision of universal and affordable internet access in low-income
countries by 2020 (UN-OHRLLS, 2018).
1.2 SMEs in Zambia and e-Filing
Small and Micro Enterprises (SMEs) in Zambia account for 80% of the companies that are
enlisted with the registrar of companies and yet only a few of them use digital government
services (Nhekairo, 2014; Nuwagaba, 2015), particularly the e-filing service. SMEs are
targeted in this study because they cumulatively account for 70% of Zambia’s GDP and
88% of employment in Zambia (International Trade Centre, 2019). SMEs contribute
significantly to the national treasury through taxes, thus playing a key role in national
development. SMEs in Zambia are involved in various business activities in the
manufacturing, trading, service and mining sectors.
In Zambia, e-payment and e-filing systems for submission of declarations and payment of
liabilities for either tax, pension or company registration are considered digital innovations.
The services were developed and implemented to serve citizens and businesses better, who
previously had to wait for hours to have their returns manually processed. E-filing is aimed
at enhancing intentional conformity to set requirements for submitting declarations while at
the same time making it easier for individuals and organisations to access support. In respect
of e-filing, the more declarations are submitted online, the greater the projected government
income (Collins, 2011) and the easier it is to administer tax. The e-filing portal enables
people to submit returns (forms) via the internet, to lodge applications to register for various
services, to submit objections, to check their online accounts and to perform other online
services without physically visiting the respective government offices. E-payment is aimed
at simplifying the payment process for liabilities. Despite substantial investments by
government to put in place innovations, SMEs that use digital services compared to the
registered citizens remain few.
Many scholars (Mamta, 2012; P. Ada and Cukai, 2014; Kumar, 2017; Syed, Henderson and
Gupta, 2017) utilised e-filing as well as e-payment in their models with the objective of
establishing the causes of digital government adoption. For example, an empirical study was
carried out in India (Kumar and Sachan, 2017) to ascertain forecasters of one’s desire to
adopt e-filing as well as e-payment. E-filing was also used in a model in Malaysia (Ambali,
© University of South Africa
5 | P a g e
2009) to determine influencers of one’s desire to utilise digital government. Similarly, this
research employed e-filing and e-payment to investigate influence of indigenous African
culture as well as that of internet access on digital government uptake in Zambia.
Several research articles often point to culture (Maumbe, Owei and Alexander, 2008;
Choudrie et al., 2017; Mensah, Mi and Feng, 2017) as having an important influencing role
on adoption of ICTs in low-income countries, yet are not explicit (Alshehri and Drew, 2011)
as to the nature of what is meant by culture. Even further, there is inadequate research that
endeavours to engage on notions of indigenous African culture and digital government
adoption.
Prior research has primarily investigated culture albeit from a different perspective. For
instance, Hofstede presented culture as a fundamental factor for technology adoption
(Hofstede and Hofstede, 1980) and defines it as a tangible social prodigy representing
indispensable personality of specific societies (Hofstede and Hofstede, 2005). Even if
Hofstede’s cultural elements are predominantly employed in prediction of intention at
national level (Khalil, 2011), they are less appropriate cultural characteristics for SMEs
(Syed, Henderson and Gupta, 2017). These studies overlook the lived reality of indigenous
culture and the associated values and belief systems such as the spirituality of individuals,
communal pressures as well as respect in a given society or region (Schein, 1984; Leung et
al., 2005). For instance, attention on the influence of spirituality is gaining momentum in
other disciplines, such as healthcare (Hovland, Niederriter and Thoman, 2018; Mesquita et
al., 2018; Nahardani et al., 2019) and management (Mishra and Varma, 2019). In this study,
the attention is placed on the indigenous values and belief systems that define indigenous
culture in African local contexts and their influence on digital government adoption.
From an African community context, culture is beyond the explanation given by Hofstede
(2011). It is entrenched in practices and traditions which are centred on ethnic and family
groupings (Johnson, 2013). It describes the nature of African social order. Extant practices
as well as traditions emanate from systems of belief that are mainly taken to be ideal. African
culture is defined by belief systems centred on communalism, spirituality, tradition of
storytelling, high regard for elders as well as those in authority, and even polygamy among
others (Tchombe, 1995). For example, Kenya recently signed into law polygamy
(AWAPSA, 2018) and women celebrated the decision. This shows that indigenous African
culture is different from what the West prescribe. Such belief as well as perception has
fundamental effects on one’s disposition, which is inherited by generations (Banda, 2012)
© University of South Africa
6 | P a g e
and strongly impacts (Ali, Weerakkody and El-Haddadeh, 2009b) one’s perception of
events such as digital government in the environment (Durmaz, 2014). Cultural influence is
driven by inherent belief systems, which are stronger in African cultural formations (Idang,
2015). As stated earlier, Indigenous African culture is also characterized by superstition,
which stands as an explanation for situations that are not understood (Omobola, 2013). ICTs
that are not understood could easily fall into the category of being classified as superstitious
elements. Such beliefs about technology could influence the desire to adopt new
technologies.
Harnessing of culture can stir behaviour in a positive productive direction (Xiang et al.,
2010). Cultures differ from region to region. For example, cultures from Europe, America,
Asia and Africa are inimitable in expression and form. Individuals in these regional
communities are influenced in different ways, either negatively or positively. Harnessing
the positive aspects of culture is key for digital government adoption. Indigenous African
culture influence on behaviour towards adoption and use of digital government has not been
investigated.
Apart from indigenous African culture, internet access influences the adoption of digital
government (Chipeta, 2018; El-Haddadeh, 2019). Key drivers of internet access are the
availability of infrastructure and affordability of the service. The two parameters of
availability and affordability are largely expected to be catalysts for internet access, and
ultimately precipitating digital government adoption. The emergence of optic fibre
infrastructure on the African continent and its linkage to the nineteen undersea cables on the
West coast, East coast and Mediterranean paves way for increased internet capacity.
Consequently, it is anticipated that internet will become more affordable thereby increasing
access. The extent to which internet access influences the adoption of digital government in
Zambia, especially after the reduced prices and intentional government efforts to make
internet more accessible, is a subject of this study.
1.3 Problem Statement
Zambia expressed her determination to accelerate digital government projects in 2015 by
launching the SMART Zambia programme under the theme, “embracing a transformational
culture for a SMART Zambia now”. The pillars of the SMART Zambia programme being
Smart Government, Smart Economy and Smart Society, enabled by ICTs. A Smart
Government is expected to be an efficient vehicle in the delivery system that supplies electronic
© University of South Africa
7 | P a g e
services to businesses and citizens (Anthopoulos and Reddick, 2016; Mboup and Oyelaran-
Oyeyinka, 2019). Citizens in a Smart Society are expected to access the electronic services
through mobile devices such as phones and iPads, Kiosks (publicly provided ICT facilities),
and computers in homes and businesses. Such efforts are only useful if digital government,
which is a precursor to smart government, was accepted and used by citizens, businesses and
other government departments. From 2015 to date, little progress has been recorded.
Identifying important underlying factors that influence citizen’s behaviour towards digital
technologies is central to issues of adoption in low-income countries.
This study therefore investigated the impact of indigenous African culture as well as internet
access on digital government adoption in Zambia. Zambia is one such country where e-filing
as well as e-payment are still considered digital innovations. The study further examined the
nature of influence manifested by indigenous African culture; moderating or mediating?
Literature identifies that studies that examine the causes of technology adoption are significant
for countries introducing new technologies like e-filing and e-payment of taxes (Syed,
Henderson and Gupta, 2017; Night and Bananuka, 2019) yet inadequate research concerning
impact of indigenous African culture on digital government services exists.
The study sample comprised SMEs. Compared to large enterprises that voluntarily adopt e-
filing as well as e-payment for processing their tax liabilities, the compliance levels for the
small and micro enterprises is very low. This study however only covered the tax paying SMEs.
The outcome of such research can strengthen the case for locally relevant policies in low-
income countries aimed at improving service delivery, which service delivery has many
inefficiencies.
1.4 Research Objective and Questions
The study primarily examined indigenous African culture’s influence, as well as that of internet
access on digital government uptake particularly electronic filing as well as electronic payment
in Zambia. Although the research sample comprised tax paying SMEs, they also utilise other
digital government services.
Literature reveals that SMEs do not enjoy paying taxes and that most would find ways not to
pay taxes (Otto et al., 2015). For example, literature shows that tax havens have been created
to avoid paying taxes (Otto et al., 2015). The avoidance of paying taxes and the creation of tax
havens are external to this research.
© University of South Africa
8 | P a g e
Specifically, the study sought to provide empirical evidence related to the primary research
inquiry below:
To what extent does indigenous African culture influence digital government adoption
by SMEs in Zambia?
Secondary questions supporting primary research inquiry include:
a) To what extent does internet access influence digital government adoption in Zambia?
b) How is indigenous African culture exhibited in Zambia?
c) How does social influence impact digital government adoption, when moderated and
mediated by indigenous African culture?
1.5 Overview of Theory and Methodological Approach
Unified Theory of Acceptance and Use of Technologies (UTAUT) was utilised as guiding
theory. This theory was chosen based on the knowledge of its validity in predicting both
Intention and usage (Tarhini et al., 2016). UTAUT has been extensively used by many
researchers (Alghamdi, Goodwin and Rampersad, 2011; Alshehri, 2012; Ghalandari, 2012;
Mtebe and Roope, 2014; Alraja, 2016; Gupta, Singh and Bhaskar, 2016) to understand
technology adoption, Literature supports the use of UTAUT in a context-specific consumer
technology use (Tarhini et al., 2016). This notion of a context specific application of UTAUT
is further supported by Venkatesh, Morris and Davis(2003).
Research philosophy employed in this research is positivism which is supported by a
quantitative overarching methodological approach. The research strategy or instrument used
was a survey administered by use of questionnaires. Questionnaires were administered to
statistically determined sample of SMEs, who are also Taxpayers. In Zambia, tax paying
population was also expected to file returns for other government services such as pension
contributory schemes and company registration returns. The study was cross-sectional with a
scope of tax paying population in three geographical locations; Lusaka, Copper belt Province
and North-Western Province. The unit of analysis was every SME that used e-filing as well as
e-payment and either utilised or hoped to use other digital government services. Data analysis
was based on structural equations modeling techniques.
© University of South Africa
9 | P a g e
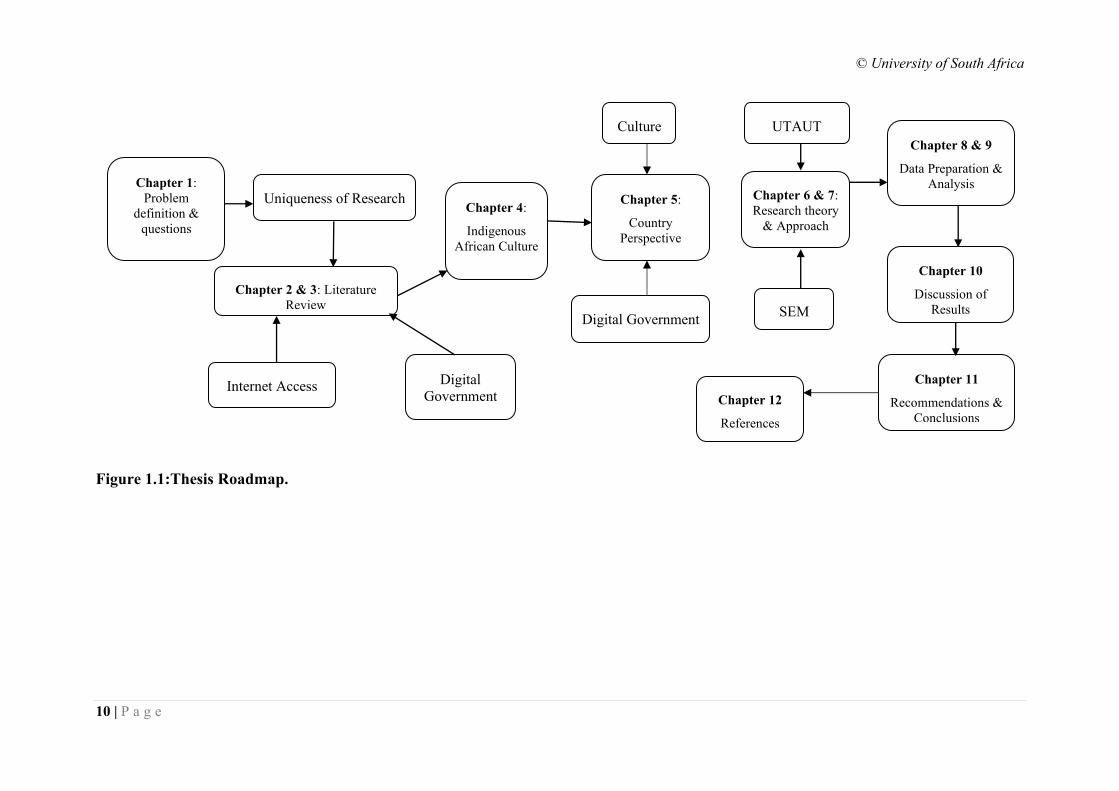
1.6 Thesis Roadmap
The roadmap of this thesis and how it is organised are presented below.
Chapter 2 reviews existing literature. Chapter 3 emphasizes gaps in research through a
systematic literature review. Chapter 4 deepens understanding of indigenous African culture.
Chapter 5 gives a country perspective of digital government, culture and infrastructure. Chapter
6 highlights the theoretical underpinning of the research model. Chapter 7 presents the research
approach. Data Preparation is discussed in Chapter 8. Chapter 9 presents Data Analysis.
Chapter 10 presents a discussion of results. Recommendations and conclusions are made in
Chapter 11. Chapter 12 presents the references. Graphical illustration of this organisation is
summarised in Figure 1.1.
© University of South Africa
10 | P a g e
Figure 1.1:Thesis Roadmap.
Chapter 6 & 7:
Research theory
& Approach
Chapter 8 & 9
Data Preparation &
Analysis
Chapter 10
Discussion of
Results
Chapter 11
Recommendations &
Conclusions
SEM
UTAUT
Chapter 12
References
Chapter 1:
Problem
definition &
questions
Chapter 2 & 3: Literature
Review
Internet Access
Uniqueness of Research
Digital
Government
Chapter 4:
Indigenous
African Culture
Chapter 5:
Country
Perspective
Culture
Digital Government
© University of South Africa
11 | P a g e
CHAPTER 2
2. ZAMBIA CASE STUDY
2.1 Introduction
The previous chapter provided context and defined the influencing role indigenous culture has
on digital government adoption. The chapter outlined the problem statement, the research
objectives, a brief layout of methodology, research questions and highlighted importance of
and contribution made by this study.
In this chapter, the Zambian country perspective of digital government, culture and existing
infrastructure that supports internet access is discussed.
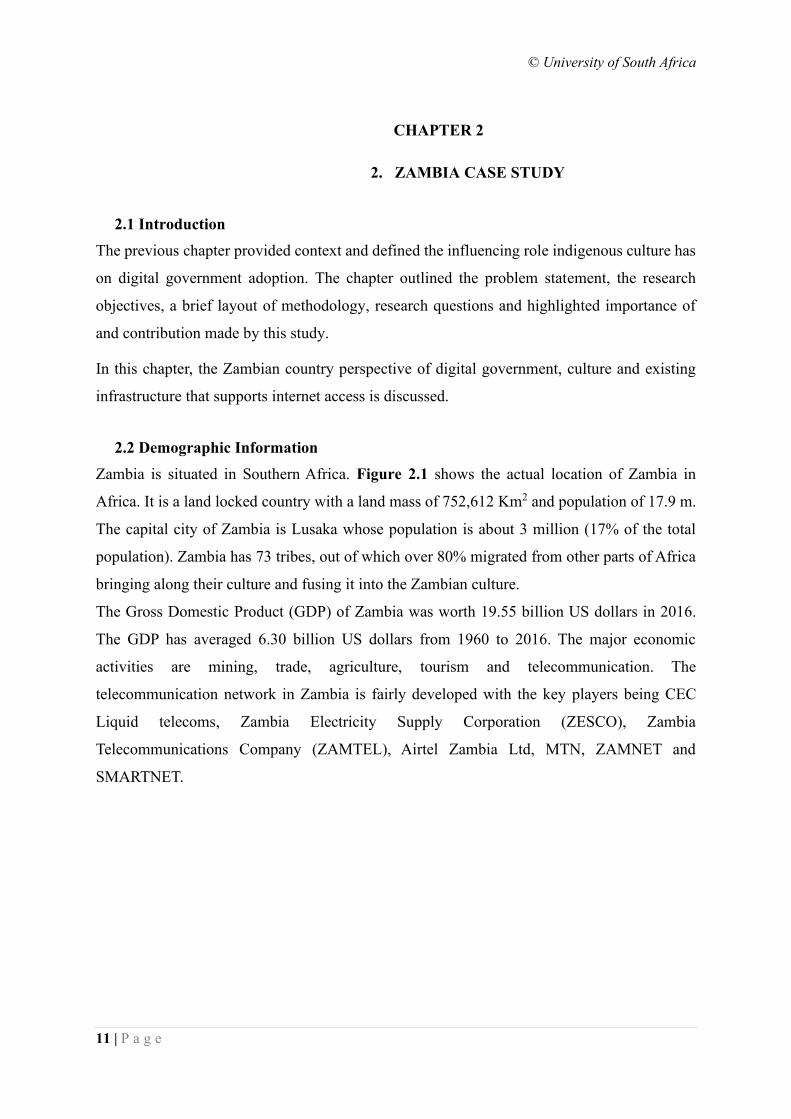
2.2 Demographic Information
Zambia is situated in Southern Africa. Figure 2.1 shows the actual location of Zambia in
Africa. It is a land locked country with a land mass of 752,612 Km2 and population of 17.9 m.
The capital city of Zambia is Lusaka whose population is about 3 million (17% of the total
population). Zambia has 73 tribes, out of which over 80% migrated from other parts of Africa
bringing along their culture and fusing it into the Zambian culture.
The Gross Domestic Product (GDP) of Zambia was worth 19.55 billion US dollars in 2016.
The GDP has averaged 6.30 billion US dollars from 1960 to 2016. The major economic
activities are mining, trade, agriculture, tourism and telecommunication. The
telecommunication network in Zambia is fairly developed with the key players being CEC
Liquid telecoms, Zambia Electricity Supply Corporation (ZESCO), Zambia
Telecommunications Company (ZAMTEL), Airtel Zambia Ltd, MTN, ZAMNET and
SMARTNET.
© University of South Africa
12 | P a g e
Figure 2.1: Location of Zambia.
2.3 Population
According to the Population and Demographic Projections of 2011 to 2035, the population of
Zambia is expected to be 17, 885, 422 by the year 2020 (CSOl, 2012) as indicated in Table
2.1.
Table 2.1: Zambian Population by Provinces
Province/Year 2011 2015 2020 (projected)
Central 1,355,775 1,515,086 1,734,601
Copper belt 2,143,413 2,362,207 2,669,635
Eastern 1,628,880 1,813,445 2,065,590
Luapula 1,015,629 1,127,453 1,276,608
Lusaka 2,362,967 2,777,439 3,360,183
Muchinga 749,449 895,058 1,095,535
Northern 1,146,392 1,304,435 1,520,004
North Western 746,982 833,818 950,789
Southern 1,642,757 1,853.464 2,135,794
Western 926,478 991,500 1,076,683
Total 13,718,722 15,473,905 17,885,422
Table 2.1 shows that Copper belt and Lusaka provinces are the most populous, representing one third
of Zambia’s population and therefore can confidently be utilised for sample size selection.
© University of South Africa
13 | P a g e
2.4 The Government Structure
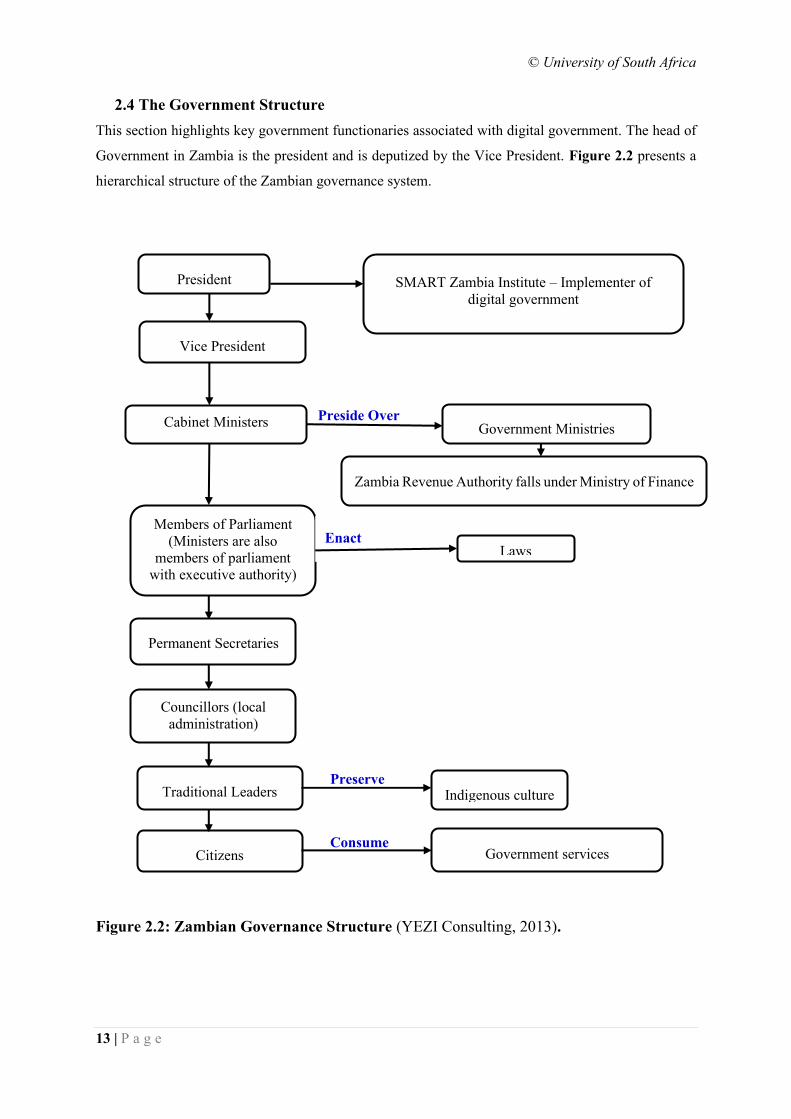
This section highlights key government functionaries associated with digital government. The head of
Government in Zambia is the president and is deputized by the Vice President. Figure 2.2 presents a
hierarchical structure of the Zambian governance system.
Figure 2.2: Zambian Governance Structure (YEZI Consulting, 2013).
Consume
Preside Over
Preserve
Zambia Revenue Authority falls under Ministry of Finance
President
Vice President
Cabinet Ministers
Members of Parliament
(Ministers are also
members of parliament
with executive authority)
Permanent Secretaries
Councillors (local
administration)
Traditional Leaders
Citizens
Government Ministries
Laws
Government services
SMART Zambia Institute – Implementer of
digital government
Indigenous culture
Enact
© University of South Africa
14 | P a g e
2.4.1 Role Players and their Responsibilities
The key role players in ensuring the success of digital government in Zambia include the
following; the President, the Vice President, Cabinet Ministers, Members of Parliament,
Permanent Secretaries, Councillors, Traditional Leaders and Citizens. The President is
strategically positioned to influence the implementation and adoption of digital government.
He exercises political influence, which is necessary for transformative reforms. Currently, the
SMART Zambia Institute which is mandated to implement digital government is domiciled in
the office of the President. Similarly, the Vice President as a deputy to the President can
influence issues related to digital government adoption. Cabinet Ministers, being in charge of
ministries, are well placed to ensure that ministries implement digital government and design
programmes to foster adoption. Currently, Zambia has thirty-one ministries. One of the
ministries is the Ministry of Finance, which is the supervising ministry for the Tax Authority.
The digital government services whose adoption is being investigated are developed and
administered by the Tax Authority.
Permanent Secretaries are chief executives of government ministries. They are the link between
civil servants (government employees) and Cabinet Ministers and ensure that ministerial
directives are implemented. Councillors are a link between traditional leaders and political
leadership. They help to create harmony between traditional and political needs. Traditional
leaders are viewed as role models and custodians of traditional values. They work through
headmen to propagate traditional values such as spirituality, respect for elders and authority as
well as communalism described in Chapters 3 and 4. Citizens, whose normative environment
is characterised by indigenous culture are also expected to consume the digital government
services.
In the hierarchy, the members of parliament also play a key role in enacting enabling laws for
digital government. Current laws include the constitution, the information and communication
technologies Act number 15 of 2009 (ZambianGovernment, 2009b), and the electronic
communications and transactions act number 21 of 2009 (ZambianGovernment, 2009a;
Mzyece, 2012a).
2.5 Zambia's Digital Government Maturity Level
As stated in Chapter 1, the launch of digital government implementation in Zambia through a
vehicle called SMART Zambia was initiated in 2015. Prior to this launch, attempts to
© University of South Africa
15 | P a g e
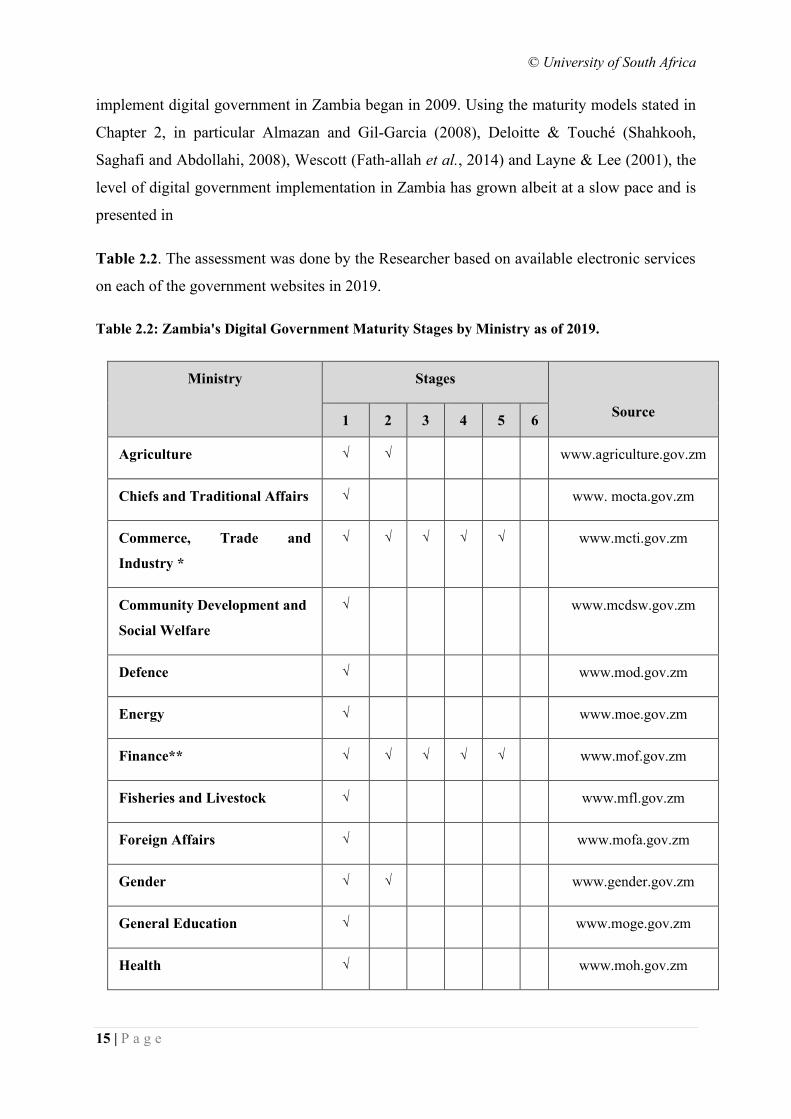
implement digital government in Zambia began in 2009. Using the maturity models stated in
Chapter 2, in particular Almazan and Gil-Garcia (2008), Deloitte & Touché (Shahkooh,
Saghafi and Abdollahi, 2008), Wescott (Fath-allah et al., 2014) and Layne & Lee (2001), the
level of digital government implementation in Zambia has grown albeit at a slow pace and is
presented in
Table 2.2. The assessment was done by the Researcher based on available electronic services
on each of the government websites in 2019.
Table 2.2: Zambia's Digital Government Maturity Stages by Ministry as of 2019.
Ministry Stages
Source 1 2 3 4 5 6
Agriculture √ √ www.agriculture.gov.zm
Chiefs and Traditional Affairs √ www. mocta.gov.zm
Commerce, Trade and
Industry *
√ √ √ √ √ www.mcti.gov.zm
Community Development and
Social Welfare
√ www.mcdsw.gov.zm
Defence √ www.mod.gov.zm
Energy √ www.moe.gov.zm
Finance** √ √ √ √ √ www.mof.gov.zm
Fisheries and Livestock √ www.mfl.gov.zm
Foreign Affairs √ www.mofa.gov.zm
Gender √ √ www.gender.gov.zm
General Education √ www.moge.gov.zm
Health √ www.moh.gov.zm

© University of South Africa
16 | P a g e
Ministry Stages
Source 1 2 3 4 5 6
Higher Education √ √ www.mohe.gov.zm
Home Affairs √ www.moha.gov.zm
Housing and Infrastructure
Development
√ www.mhid.gov.zm
Information and Broadcasting √ www.mibs.gov.zm
Justice √ www.moj.gov.zm
Labour and Social Security √ √ √ www.mlss.gov.zm
Lands & Natural Resources √ www.mlnr.gov.zm
Local Government √ www.mlgh.gov.zm
Mines & Mineral Development √ www.nnnd.gov.zm
National Development &
Planning
√ www.mndp.gov.zm
Office of Vice President √ www.ovp.gov.zm
Presidential Affairs √ www.sh.gov.zm
National Guidance &Religious
Affairs
√ www.mngra.gov.zm
Tourism & Arts √ √ www.mota.gov.zm
Transport & Communication √ www.mtc.gov.zm
Water Development,
Sanitation & Environmental
Protection
√ www.mwdsep.gov.zm
Works & Supplies √ www.mws.gov.zm
© University of South Africa
17 | P a g e
Ministry Stages
Source 1 2 3 4 5 6
Youth, Sport & Child
Development
√ www.myscd.gov.zm
*E-services under this ministry are largely driven by the Patents and Company Registration Agency (PACRA).
**Tax Authority falls under this ministry. It is also worth noting that cabinet office has attained level 2 of the
maturity level.
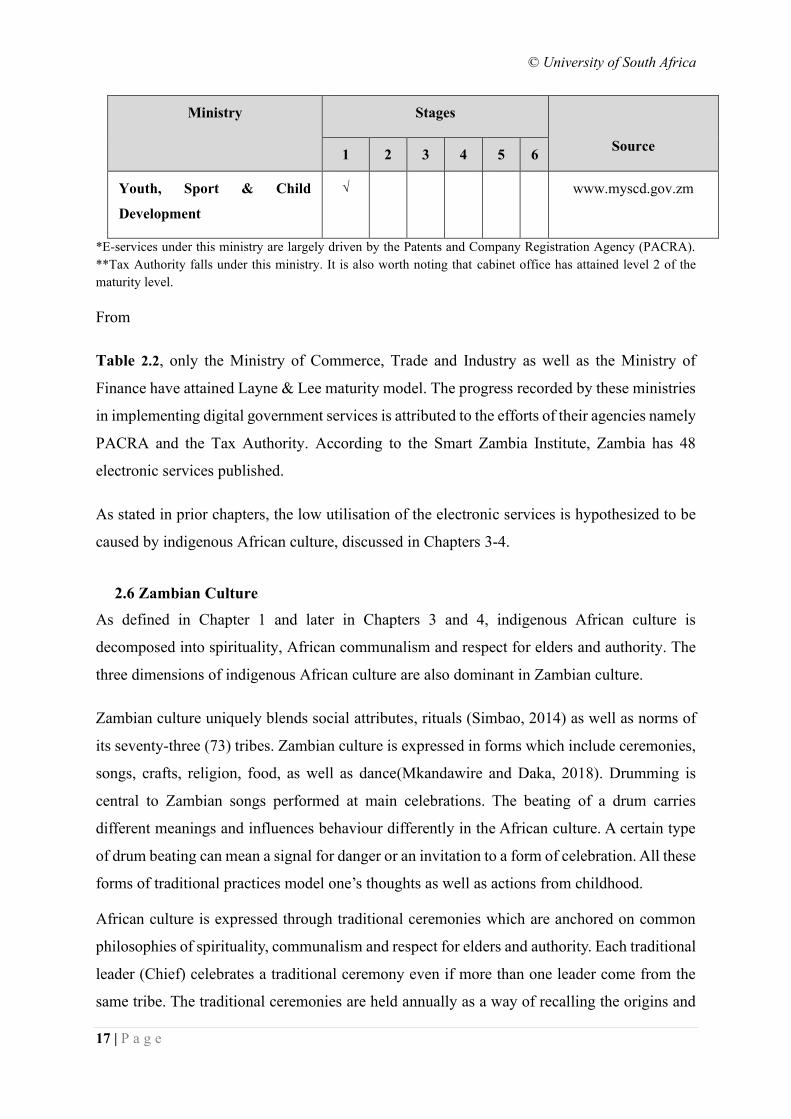
From
Table 2.2, only the Ministry of Commerce, Trade and Industry as well as the Ministry of
Finance have attained Layne & Lee maturity model. The progress recorded by these ministries
in implementing digital government services is attributed to the efforts of their agencies namely
PACRA and the Tax Authority. According to the Smart Zambia Institute, Zambia has 48
electronic services published.
As stated in prior chapters, the low utilisation of the electronic services is hypothesized to be
caused by indigenous African culture, discussed in Chapters 3-4.
2.6 Zambian Culture
As defined in Chapter 1 and later in Chapters 3 and 4, indigenous African culture is
decomposed into spirituality, African communalism and respect for elders and authority. The
three dimensions of indigenous African culture are also dominant in Zambian culture.
Zambian culture uniquely blends social attributes, rituals (Simbao, 2014) as well as norms of
its seventy-three (73) tribes. Zambian culture is expressed in forms which include ceremonies,
songs, crafts, religion, food, as well as dance(Mkandawire and Daka, 2018). Drumming is
central to Zambian songs performed at main celebrations. The beating of a drum carries
different meanings and influences behaviour differently in the African culture. A certain type
of drum beating can mean a signal for danger or an invitation to a form of celebration. All these
forms of traditional practices model one’s thoughts as well as actions from childhood.
African culture is expressed through traditional ceremonies which are anchored on common
philosophies of spirituality, communalism and respect for elders and authority. Each traditional
leader (Chief) celebrates a traditional ceremony even if more than one leader come from the
same tribe. The traditional ceremonies are held annually as a way of recalling the origins and
© University of South Africa
18 | P a g e
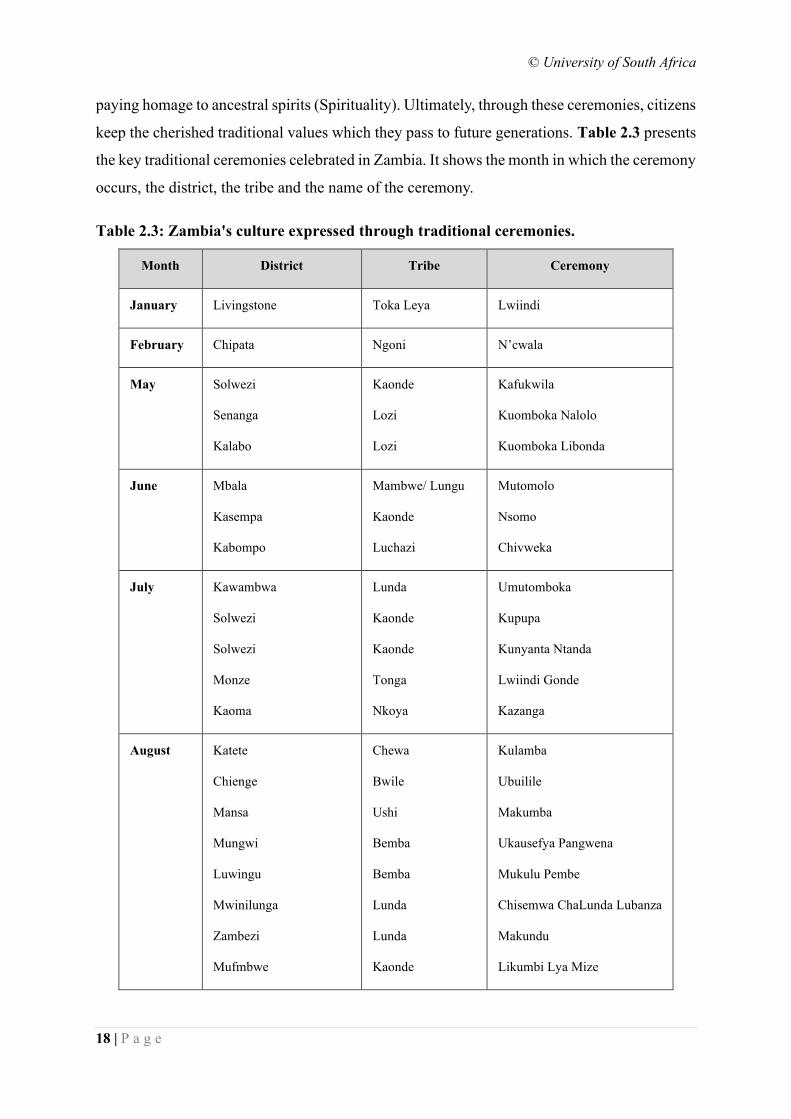
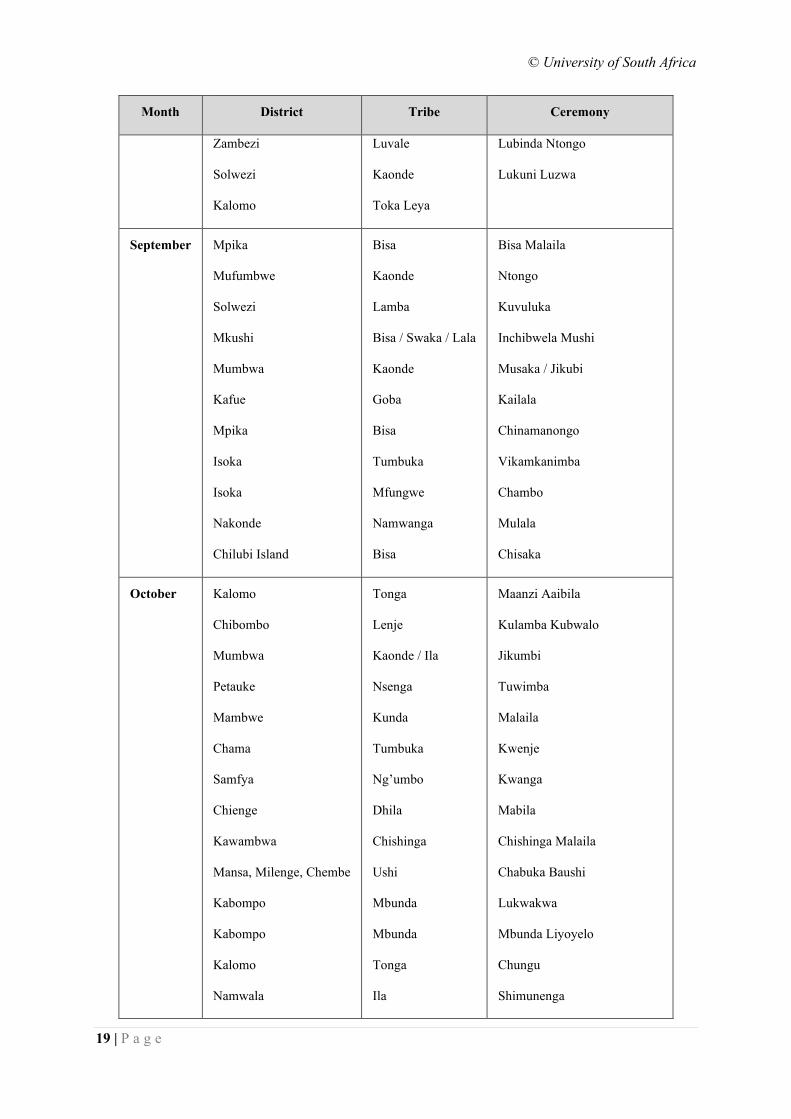
paying homage to ancestral spirits (Spirituality). Ultimately, through these ceremonies, citizens
keep the cherished traditional values which they pass to future generations. Table 2.3 presents
the key traditional ceremonies celebrated in Zambia. It shows the month in which the ceremony
occurs, the district, the tribe and the name of the ceremony.
Table 2.3: Zambia's culture expressed through traditional ceremonies.
Month District Tribe Ceremony
January Livingstone Toka Leya Lwiindi
February Chipata Ngoni N’cwala
May
Solwezi
Senanga
Kalabo
Kaonde
Lozi
Lozi
Kafukwila
Kuomboka Nalolo
Kuomboka Libonda
June
Mbala
Kasempa
Kabompo
Mambwe/ Lungu
Kaonde
Luchazi
Mutomolo
Nsomo
Chivweka
July
Kawambwa
Solwezi
Solwezi
Monze
Kaoma
Lunda
Kaonde
Kaonde
Tonga
Nkoya
Umutomboka
Kupupa
Kunyanta Ntanda
Lwiindi Gonde
Kazanga
August
Katete
Chienge
Mansa
Mungwi
Luwingu
Mwinilunga
Zambezi
Mufmbwe
Chewa
Bwile
Ushi
Bemba
Bemba
Lunda
Lunda
Kaonde
Kulamba
Ubuilile
Makumba
Ukausefya Pangwena
Mukulu Pembe
Chisemwa ChaLunda Lubanza
Makundu
Likumbi Lya Mize
© University of South Africa
19 | P a g e
Month District Tribe Ceremony
Zambezi
Solwezi
Kalomo
Luvale
Kaonde
Toka Leya
Lubinda Ntongo
Lukuni Luzwa
September
Mpika
Mufumbwe
Solwezi
Mkushi
Mumbwa
Kafue
Mpika
Isoka
Isoka
Nakonde
Chilubi Island
Bisa
Kaonde
Lamba
Bisa / Swaka / Lala
Kaonde
Goba
Bisa
Tumbuka
Mfungwe
Namwanga
Bisa
Bisa Malaila
Ntongo
Kuvuluka
Inchibwela Mushi
Musaka / Jikubi
Kailala
Chinamanongo
Vikamkanimba
Chambo
Mulala
Chisaka
October
Kalomo
Chibombo
Mumbwa
Petauke
Mambwe
Chama
Samfya
Chienge
Kawambwa
Mansa, Milenge, Chembe
Kabompo
Kabompo
Kalomo
Namwala
Tonga
Lenje
Kaonde / Ila
Nsenga
Kunda
Tumbuka
Ng’umbo
Dhila
Chishinga
Ushi
Mbunda
Mbunda
Tonga
Ila
Maanzi Aaibila
Kulamba Kubwalo
Jikumbi
Tuwimba
Malaila
Kwenje
Kwanga
Mabila
Chishinga Malaila
Chabuka Baushi
Lukwakwa
Mbunda Liyoyelo
Chungu
Shimunenga

© University of South Africa
20 | P a g e
Month District Tribe Ceremony
November
November
Masaiti
Mpongwe
Luangwa
Chinyunyu
Isoka
Lamba
Lamba
Nsenga-Lizi
Soli
Namwanga
Chabalankata
Chitentamo
Mbambala
Chibwela Kumushi
Ng’ondo
Source: www.zambiatourism.com
The Lwiindi traditional ceremony is celebrated in January by the Toka Leya and Tonga people.
During this ceremony, the community unites as an aspect of communalism to pray for rain and
to thank the ancestors for the harvest. As an expression of Spirituality, they visit the shrines to
ask for the rain or for assistance to eliminate threatening diseases from their ancestors. This is
done in a dignified manner such as wearing special type of clothing, approaching the shrines
crawling and saying many words that show Respect.
The N’cwala ceremony is celebrated in February by the Ngoni people of Chipata (originally
from South Africa) in the Eastern part of Zambia. It is held to offer thanksgiving to God and
the ancestors for the first harvest of the year.
Like the Ngoni people, the Kaonde people of Kasempa in North Western part of Zambia also
commemorate the traditional first harvest ceremony called “Juba ja Nsomo”. The ceremony is
characterised by offering thanks to ancestors. The three cultural aspects of communalism,
spirituality and respect are expressed.
Likumbi Lyamize is celebrated by the Luvale people (incorporating Chokwes) of Zambezi in
North Western Province. The ceremony is held to commemorate their heritage and to remember
their trek into Zambia from the Democratic Republic of Congo. The Luvale and Chokwe
possess deep-seated spiritual beliefs connected to their past (Penoni, 2018). Luvale as well as
Chokwe’s spirituality is linked to their ancestors’ traditions and is expressed in their day to day
lives. The link with ancestry has a greater meaning for them. Moreover, they believe that
preservation of ancestral beliefs was critical to guarantee their safety. As a mode of
safeguarding ancestral beliefs, propitiation rituals are ordered. For the Luvale as well as
Chokwe, life is valueless and powerless in the absence of ancestral spirits. Ancestral spirits
© University of South Africa
21 | P a g e
take the place of gods that are close to them; being portrayed as part of ‘tribal’ family with the
potential to offer solutions. This is true for almost all tribal groupings in Zambia. Likumbi
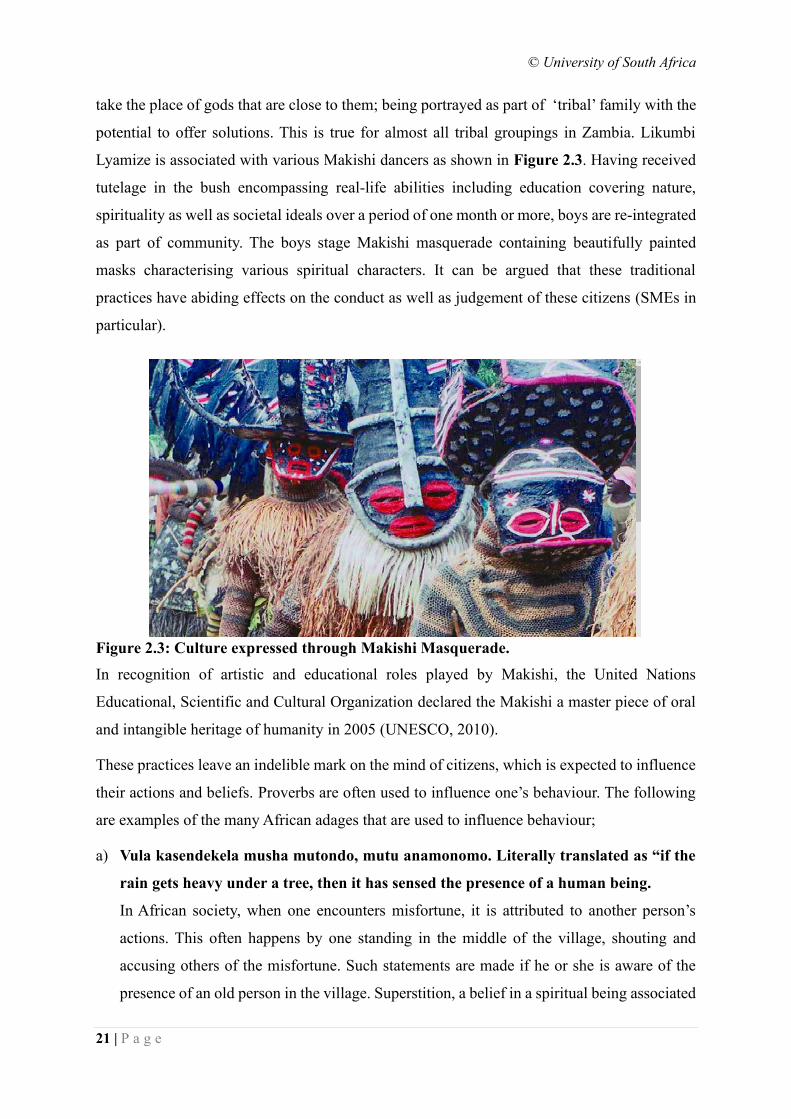
Lyamize is associated with various Makishi dancers as shown in Figure 2.3. Having received
tutelage in the bush encompassing real-life abilities including education covering nature,
spirituality as well as societal ideals over a period of one month or more, boys are re-integrated
as part of community. The boys stage Makishi masquerade containing beautifully painted
masks characterising various spiritual characters. It can be argued that these traditional
practices have abiding effects on the conduct as well as judgement of these citizens (SMEs in
particular).
Figure 2.3: Culture expressed through Makishi Masquerade.
In recognition of artistic and educational roles played by Makishi, the United Nations
Educational, Scientific and Cultural Organization declared the Makishi a master piece of oral
and intangible heritage of humanity in 2005 (UNESCO, 2010).
These practices leave an indelible mark on the mind of citizens, which is expected to influence
their actions and beliefs. Proverbs are often used to influence one’s behaviour. The following
are examples of the many African adages that are used to influence behaviour;
a) Vula kasendekela musha mutondo, mutu anamonomo. Literally translated as “if the
rain gets heavy under a tree, then it has sensed the presence of a human being.
In African society, when one encounters misfortune, it is attributed to another person’s
actions. This often happens by one standing in the middle of the village, shouting and
accusing others of the misfortune. Such statements are made if he or she is aware of the
presence of an old person in the village. Superstition, a belief in a spiritual being associated
© University of South Africa
22 | P a g e
with unexplained experiences, is an aspect found in African culture. Not all users of digital
government appreciate ICT. Such belief systems can potentially impact their ability to
adopt ICTs.
b) Ndoho yakanuke kuyayema, alioze kuyishi kulembuka. Ndoho yamukulwana
yakuyema nyi kulembuka. Literal translation is that food prepared by a young person
is nice but the one prepared by an adult is better.
The meaning is that in the heart of an adult, you find knowledge and wisdom more than
there is in a young person’s heart. This adage instils the cultural value of respect. Adults
and those in authority must be respected. This potentially means that elders and those in
positions of authority can influence one’s desire to adopt or use digital government services.
c) Tuka lutwe, keshi kutuka nyima. Literal translation is that one should insult the
future and not the past. The meaning is that a person should be closely associated with
his family members and the society in which he lives rather than external people that are
foreign to him. This adage propagates communalism. By being closer to one’s community,
one acquires community norms or behaviour.
d) Mwafwa mukula mwasalakana muyombo. Literal translation is that when a
“mukula” tree dries, you should plant another tree called “muyombo”.
The meaning is that when a village headman dies, his nephew or his grand child should
inherit him so that traditions are passed from one generation to another, which is an aspect
of communalism.
e) Mukanwa kamukulwana mwanuka mwawu. Literal translation is that an adult’s
mouth smells when he yawns.
This adage inculcates an aspect of respect for elders and authority in the young people. It
means the words that come out of an adult’s mouth are very heavy or important and
therefore should be obeyed and followed. Such a statement has the ability to influence
behaviour especially that in the Africa culture, young people are not expected to question
adults.
© University of South Africa
23 | P a g e
f) Meya aswita kanuke, keshi kumana pwila shina aswita mukulwana. Literal
translation is that the water that a young person draws will not quench the thirsty.
Only the water that an adult draw will quench the thirsty.
Again this adage encourages young people to respect and listen to adults. Adults are
believed to poses wisdom and knowledge to rule over cases in an exhaustive manner than
young people.
The young people grow in an environment in which culture is inherited and eventually passed
on to their children. Regardless of the education acquired and the social status, tradition
continues to contribute to the shaping of one’s thoughts and actions. We can summarise that
the three aspects of spirituality, communalism and respect for elders and authority discussed in
this section are common to Zambian culture.
Section 2.6 endeavoured to answer the secondary question, “How is indigenous African culture
exhibited in Zambia?”. The section brought to the fore salient aspects of indigenous African
culture and explained how these are espoused by SMEs in Zambia. Section 2.7 considers
internet access in the context of existing enabling ICT infrastructure in Zambia.
2.7 Internet Access in Zambia
The term internet access refers to the ability by individuals to access and use the internet in
order to get services provided by government. As stated earlier, internet access is enabled by
availability and affordability. Affordability was discussed earlier. Figure 2.4 presents the
underlying infrastructure that supports internet access in Zambia while Figure 2.5 shows that
Zambia has access to several undersea cables that provide internet to countries in Africa. The
two figures show that availability has been enabled in Zambia.
© University of South Africa
24 | P a g e
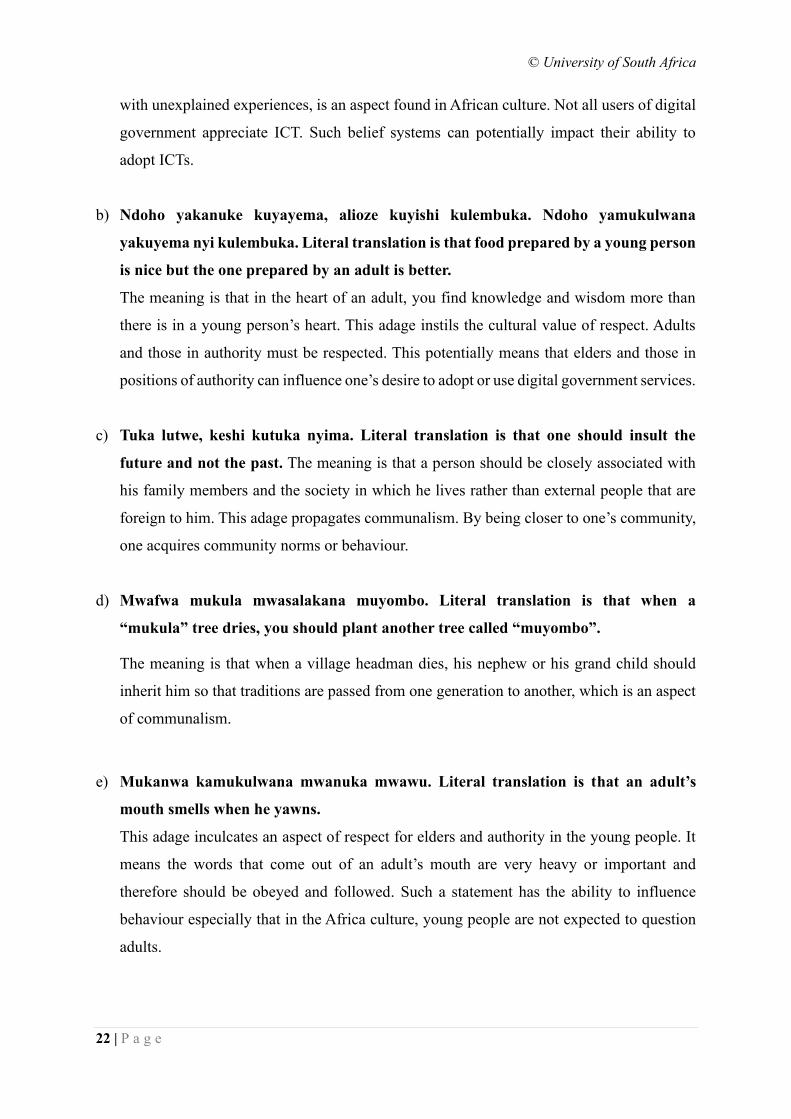
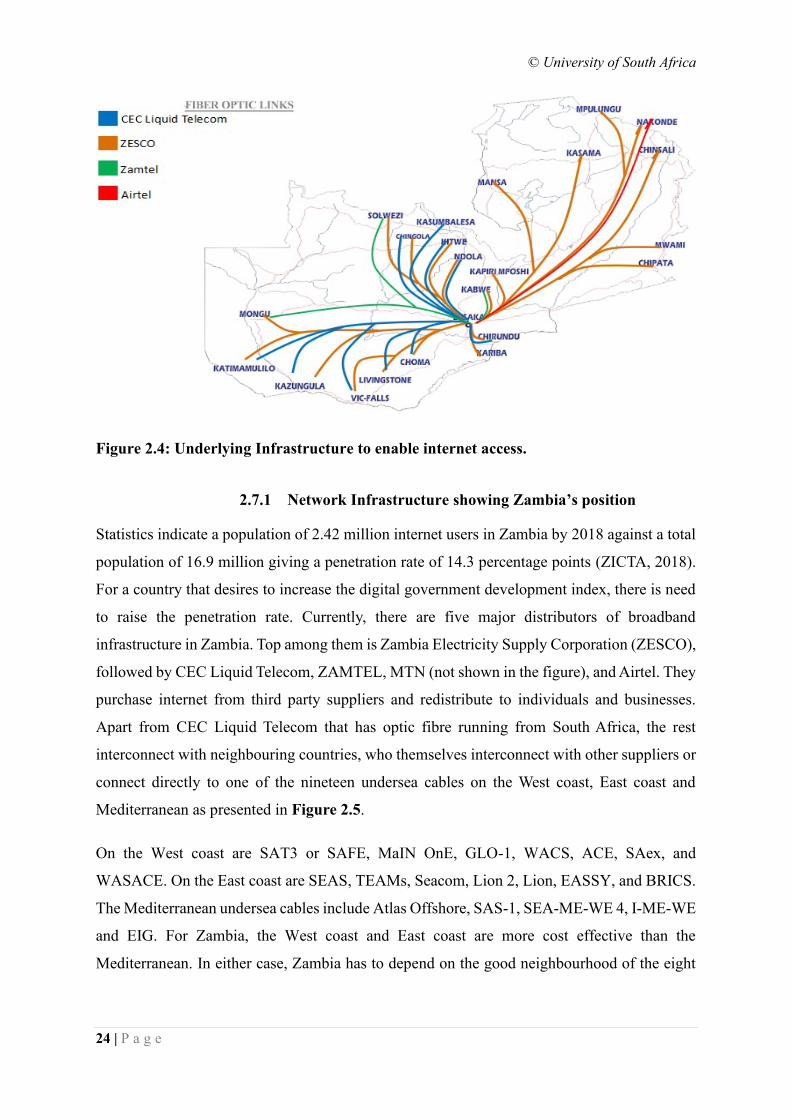
Figure 2.4: Underlying Infrastructure to enable internet access.
2.7.1 Network Infrastructure showing Zambia’s position
Statistics indicate a population of 2.42 million internet users in Zambia by 2018 against a total
population of 16.9 million giving a penetration rate of 14.3 percentage points (ZICTA, 2018).
For a country that desires to increase the digital government development index, there is need
to raise the penetration rate. Currently, there are five major distributors of broadband
infrastructure in Zambia. Top among them is Zambia Electricity Supply Corporation (ZESCO),
followed by CEC Liquid Telecom, ZAMTEL, MTN (not shown in the figure), and Airtel. They
purchase internet from third party suppliers and redistribute to individuals and businesses.
Apart from CEC Liquid Telecom that has optic fibre running from South Africa, the rest
interconnect with neighbouring countries, who themselves interconnect with other suppliers or
connect directly to one of the nineteen undersea cables on the West coast, East coast and
Mediterranean as presented in Figure 2.5.
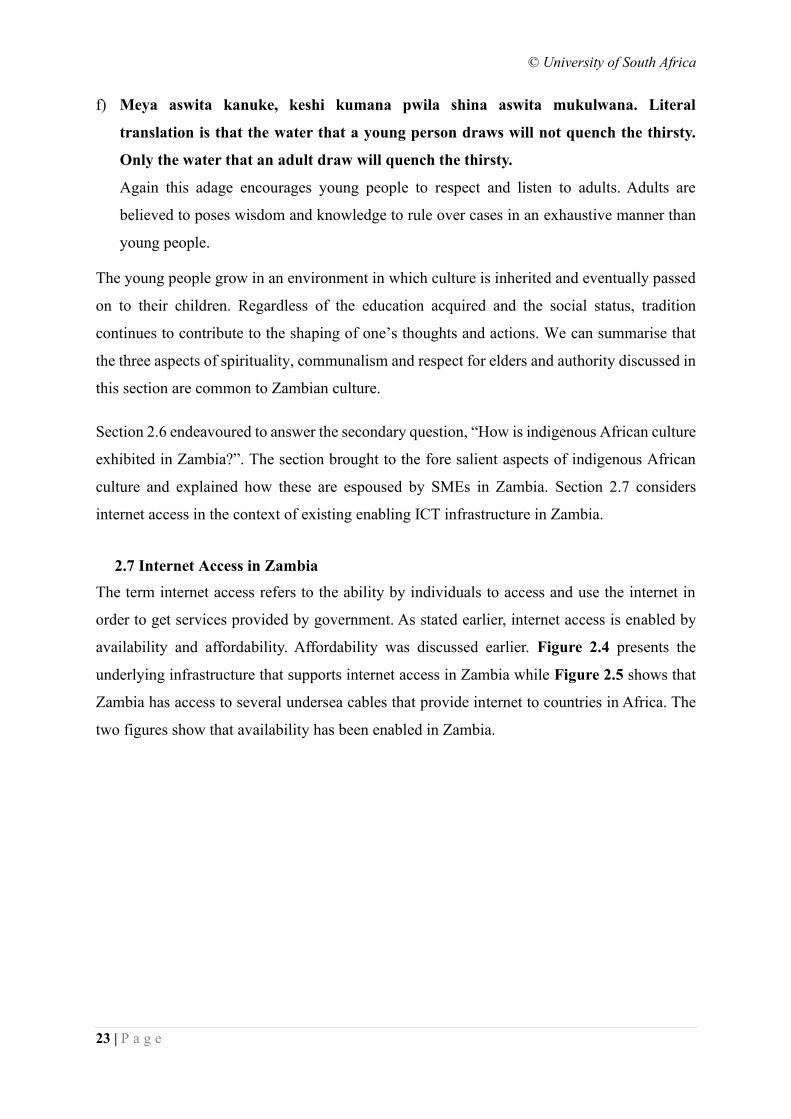
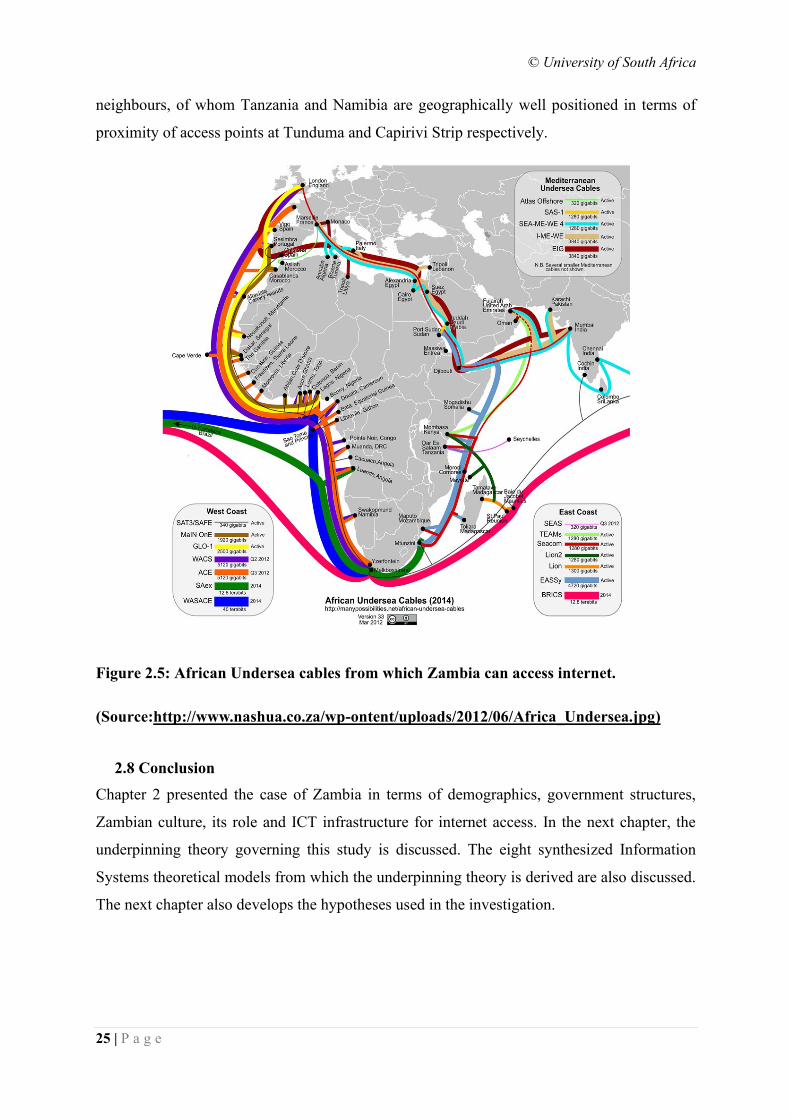
On the West coast are SAT3 or SAFE, MaIN OnE, GLO-1, WACS, ACE, SAex, and
WASACE. On the East coast are SEAS, TEAMs, Seacom, Lion 2, Lion, EASSY, and BRICS.
The Mediterranean undersea cables include Atlas Offshore, SAS-1, SEA-ME-WE 4, I-ME-WE
and EIG. For Zambia, the West coast and East coast are more cost effective than the
Mediterranean. In either case, Zambia has to depend on the good neighbourhood of the eight
© University of South Africa
25 | P a g e
neighbours, of whom Tanzania and Namibia are geographically well positioned in terms of
proximity of access points at Tunduma and Capirivi Strip respectively.
Figure 2.5: African Undersea cables from which Zambia can access internet.
(Source:http://www.nashua.co.za/wp-ontent/uploads/2012/06/Africa_Undersea.jpg)
2.8 Conclusion
Chapter 2 presented the case of Zambia in terms of demographics, government structures,
Zambian culture, its role and ICT infrastructure for internet access. In the next chapter, the
underpinning theory governing this study is discussed. The eight synthesized Information
Systems theoretical models from which the underpinning theory is derived are also discussed.
The next chapter also develops the hypotheses used in the investigation.
© University of South Africa
26 | P a g e
CHAPTER 3
3. LITERATURE REVIEW: DIGITAL GOVERNMENT &
CULTURE
3.1 Introduction
Chapter 2 presented the country perspective in terms of demographics, government structures,
Zambia’s digital government maturity levels, culture and ICT infrastructure for internet access.
The chapter also explained the potential effect of indigenous African culture on digital
government adoption.
This chapter provides insights into digital government, reviews existing literature on culture in
relation to digital government and SMEs. The review also considers the role of internet access
on digital government adoption.
3.2 Digital Government
Different terms are applied when describing Digital Government. These include electronic
Government, Virtual Government (Fountain, 2001), E-Governance (Alcaide–Muñoz et al.,
2017), Online Government, E-Gov (Alshehri, 2010) and even smart government. These terms
are associated with different and distinct stages in the evolution of digital government. This
section therefore describes the fundamental building blocks of digital government and provides
background knowledge that helps to understand digital government and its role in generating
and delivering electronic services to citizens and businesses.
3.2.1 Definition
Digital government has been defined to be a socio-technical phenomena or mechanism by
which government provides efficient services using ICT in a seamless and integrated manner
(Chugunov, Kabanov and Misnikov, 2017). A slight variation to this definition is made in this
study by replacing the word integrated with interfaced, a socio-technical phenomena or
mechanism by which government provides efficient services using ICT in a seamless and
interfaced manner. The use of the word interfaced arises from the understanding that various
government agencies and departments operate independently but collaboratively. It is the
processes of these independent entities that feed into each other (interface) to complete a
© University of South Africa
27 | P a g e
government task. Citizens as well as businesses (SMEs) access Government amenities using
electronic platforms with minimal or no human contact. Efficient and seamless interactions
occur within government to process the requests from citizens and businesses.
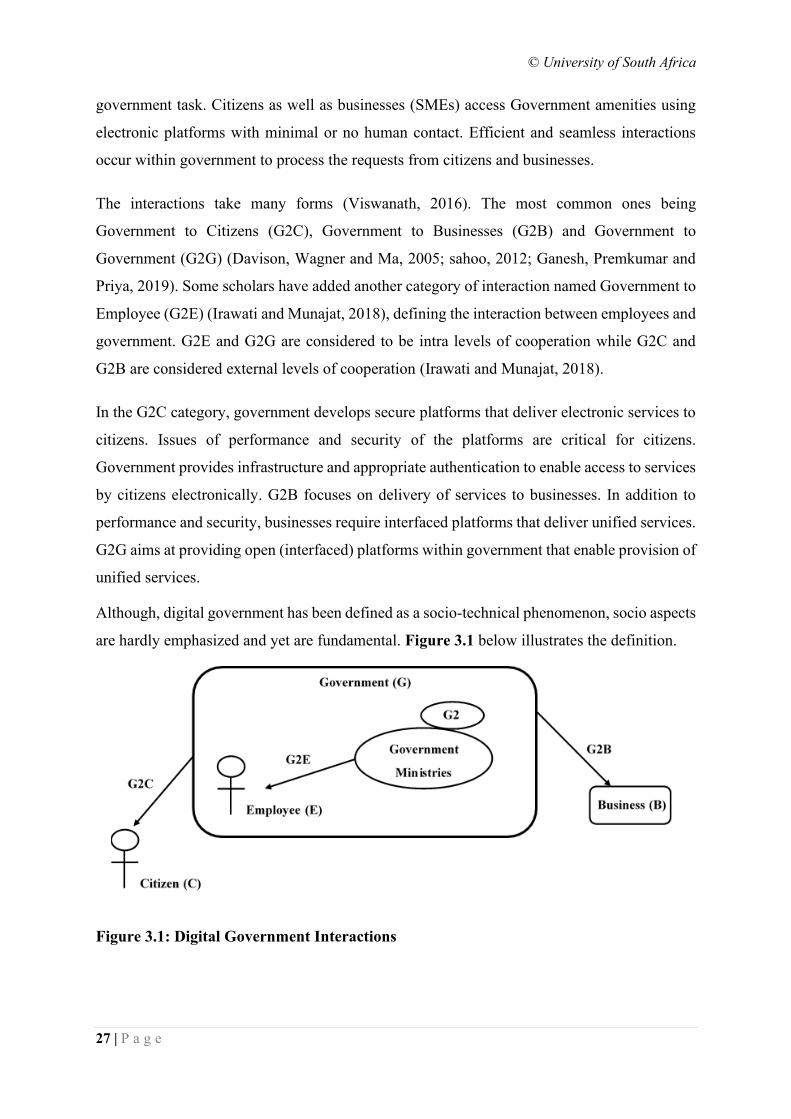
The interactions take many forms (Viswanath, 2016). The most common ones being
Government to Citizens (G2C), Government to Businesses (G2B) and Government to
Government (G2G) (Davison, Wagner and Ma, 2005; sahoo, 2012; Ganesh, Premkumar and
Priya, 2019). Some scholars have added another category of interaction named Government to
Employee (G2E) (Irawati and Munajat, 2018), defining the interaction between employees and
government. G2E and G2G are considered to be intra levels of cooperation while G2C and
G2B are considered external levels of cooperation (Irawati and Munajat, 2018).
In the G2C category, government develops secure platforms that deliver electronic services to
citizens. Issues of performance and security of the platforms are critical for citizens.
Government provides infrastructure and appropriate authentication to enable access to services
by citizens electronically. G2B focuses on delivery of services to businesses. In addition to
performance and security, businesses require interfaced platforms that deliver unified services.
G2G aims at providing open (interfaced) platforms within government that enable provision of
unified services.
Although, digital government has been defined as a socio-technical phenomenon, socio aspects
are hardly emphasized and yet are fundamental. Figure 3.1 below illustrates the definition.
Figure 3.1: Digital Government Interactions
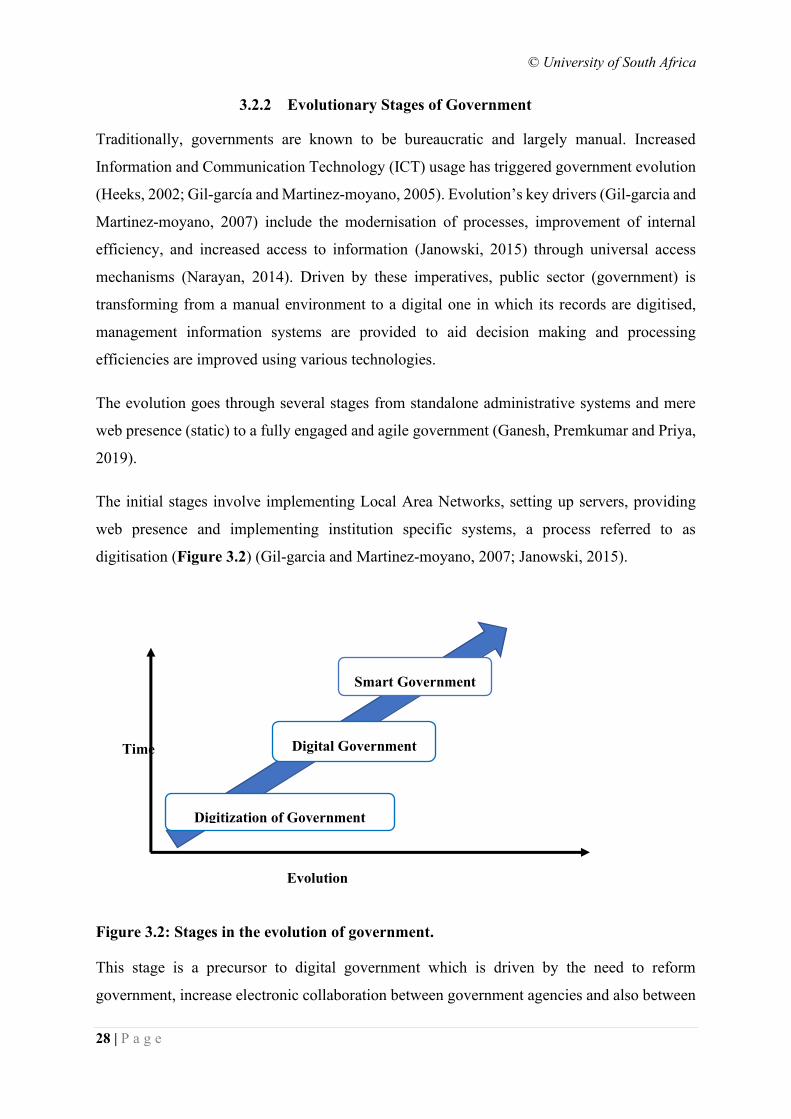
© University of South Africa
28 | P a g e
3.2.2 Evolutionary Stages of Government
Traditionally, governments are known to be bureaucratic and largely manual. Increased
Information and Communication Technology (ICT) usage has triggered government evolution
(Heeks, 2002; Gil-garcía and Martinez-moyano, 2005). Evolution’s key drivers (Gil-garcia and
Martinez-moyano, 2007) include the modernisation of processes, improvement of internal
efficiency, and increased access to information (Janowski, 2015) through universal access
mechanisms (Narayan, 2014). Driven by these imperatives, public sector (government) is
transforming from a manual environment to a digital one in which its records are digitised,
management information systems are provided to aid decision making and processing
efficiencies are improved using various technologies.
The evolution goes through several stages from standalone administrative systems and mere
web presence (static) to a fully engaged and agile government (Ganesh, Premkumar and Priya,
2019).
The initial stages involve implementing Local Area Networks, setting up servers, providing
web presence and implementing institution specific systems, a process referred to as
digitisation (Figure 3.2) (Gil-garcia and Martinez-moyano, 2007; Janowski, 2015).
Figure 3.2: Stages in the evolution of government.
This stage is a precursor to digital government which is driven by the need to reform
government, increase electronic collaboration between government agencies and also between
Time
Evolution
Digitization of Government
Smart Government
Digital Government
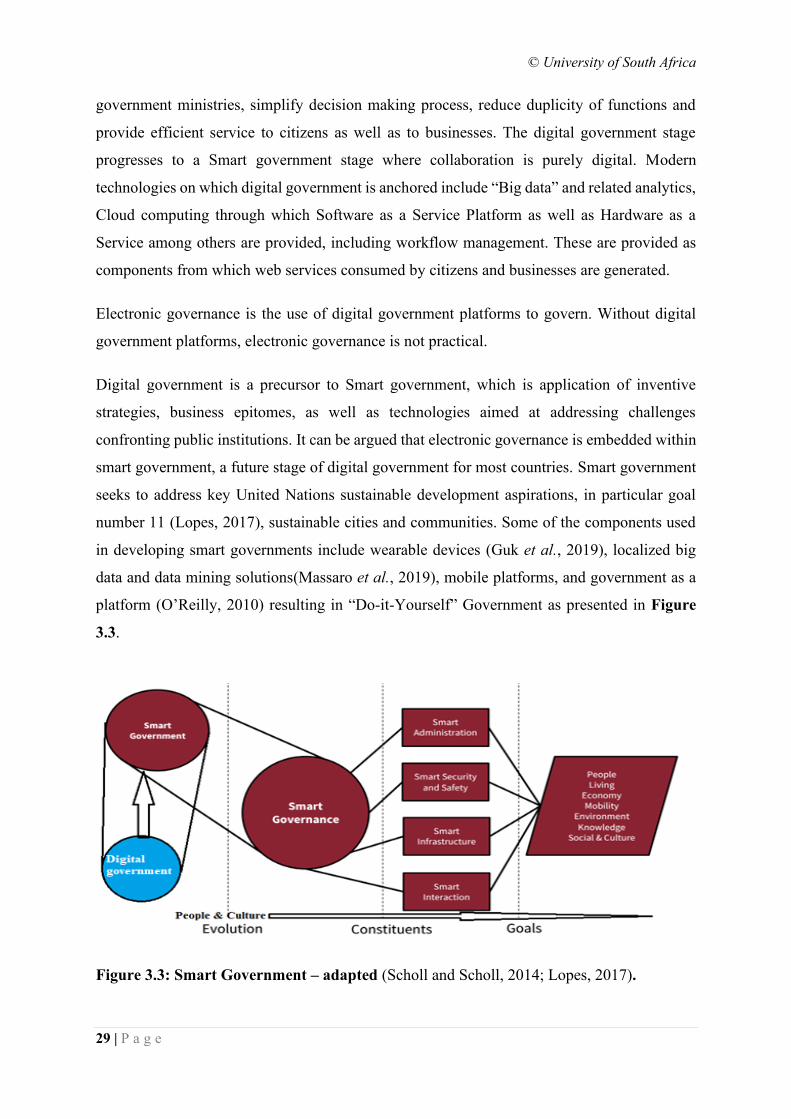
© University of South Africa
29 | P a g e
government ministries, simplify decision making process, reduce duplicity of functions and
provide efficient service to citizens as well as to businesses. The digital government stage
progresses to a Smart government stage where collaboration is purely digital. Modern
technologies on which digital government is anchored include “Big data” and related analytics,
Cloud computing through which Software as a Service Platform as well as Hardware as a
Service among others are provided, including workflow management. These are provided as
components from which web services consumed by citizens and businesses are generated.
Electronic governance is the use of digital government platforms to govern. Without digital
government platforms, electronic governance is not practical.
Digital government is a precursor to Smart government, which is application of inventive
strategies, business epitomes, as well as technologies aimed at addressing challenges
confronting public institutions. It can be argued that electronic governance is embedded within
smart government, a future stage of digital government for most countries. Smart government
seeks to address key United Nations sustainable development aspirations, in particular goal
number 11 (Lopes, 2017), sustainable cities and communities. Some of the components used
in developing smart governments include wearable devices (Guk et al., 2019), localized big
data and data mining solutions(Massaro et al., 2019), mobile platforms, and government as a
platform (O’Reilly, 2010) resulting in “Do-it-Yourself” Government as presented in Figure
3.3.
Figure 3.3: Smart Government – adapted (Scholl and Scholl, 2014; Lopes, 2017).
© University of South Africa
30 | P a g e
Driven by the need to reach out to citizens and businesses, provision of oversight for citizens
and businesses, effective and efficient engagement, Smart government provides platforms for
smart governance in all areas of public service delivery as highlighted in Figure 3.3.
Smart government can only be realised if digital government itself is understood, well
implemented and adopted by citizens and businesses. It is worth emphasising that digital
government is contextualised (Janowski, 2015) to suit local needs and can be at different
maturity levels in terms of implementation. The understanding of the maturity levels guides
the developers or implementers to design appropriate digital government projects that
incorporate cultural needs of citizens as well as businesses alike. Table 3.1 provides some of
the scholarly models that are applied when measuring information systems maturity levels.
Several maturity models (Davison, Wagner and Ma, 2005; Andersen and Henriksen, 2006;
Kumar et al., 2007; Klievink and Janssen, 2009) have been developed to assess or guide digital
government projects. Some of these models or a hybrid of them have been used by governments
to align their digital government implementations. The underlying philosophy for these
maturity models is similar; the need for transformation in governments. This research argues
that even if the desired maturity level is attained, either internet access or indigenous cultural
dimensions or both could hinder the adoption of digital government. Table 3.1 presents the
various models used to measure digital government maturity.
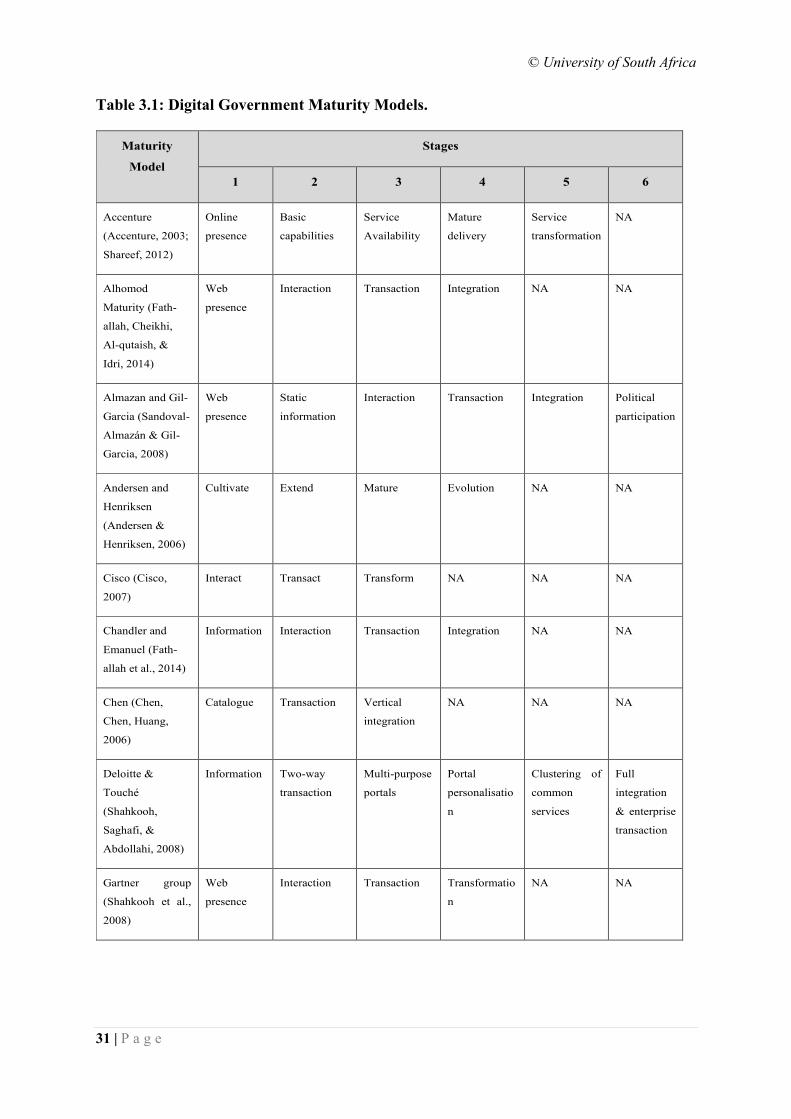
© University of South Africa
31 | P a g e
Table 3.1: Digital Government Maturity Models.
Maturity
Model
Stages
1 2 3 4 5 6
Accenture
(Accenture, 2003;
Shareef, 2012)
Online
presence
Basic
capabilities
Service
Availability
Mature
delivery
Service
transformation
NA
Alhomod
Maturity (Fath-
allah, Cheikhi,
Al-qutaish, &
Idri, 2014)
Web
presence
Interaction Transaction Integration NA NA
Almazan and Gil-
Garcia (Sandoval-
Almazán & Gil-
Garcia, 2008)
Web
presence
Static
information
Interaction Transaction Integration Political
participation
Andersen and
Henriksen
(Andersen &
Henriksen, 2006)
Cultivate Extend Mature Evolution NA NA
Cisco (Cisco,
2007)
Interact Transact Transform NA NA NA
Chandler and
Emanuel (Fath-
allah et al., 2014)
Information Interaction Transaction Integration NA NA
Chen (Chen,
Chen, Huang,
2006)
Catalogue Transaction Vertical
integration
NA NA NA
Deloitte &
Touché
(Shahkooh,
Saghafi, &
Abdollahi, 2008)
Information Two-way
transaction
Multi-purpose
portals
Portal
personalisatio
n
Clustering of
common
services
Full
integration
& enterprise
transaction
Gartner group
(Shahkooh et al.,
2008)
Web
presence
Interaction Transaction Transformatio
n
NA NA
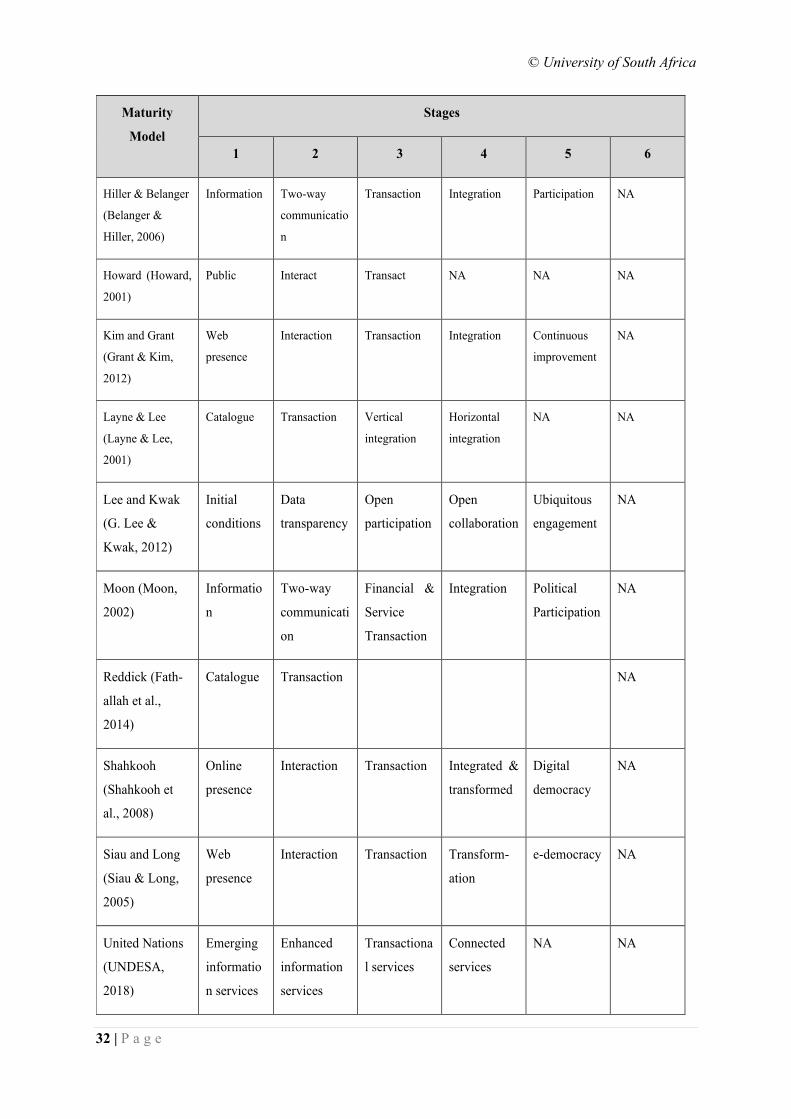
© University of South Africa
32 | P a g e
Maturity
Model
Stages
1 2 3 4 5 6
Hiller & Belanger
(Belanger &
Hiller, 2006)
Information Two-way
communicatio
n
Transaction Integration Participation NA
Howard (Howard,
2001)
Public Interact Transact NA NA NA
Kim and Grant
(Grant & Kim,
2012)
Web
presence
Interaction Transaction Integration Continuous
improvement
NA
Layne & Lee
(Layne & Lee,
2001)
Catalogue Transaction Vertical
integration
Horizontal
integration
NA NA
Lee and Kwak
(G. Lee &
Kwak, 2012)
Initial
conditions
Data
transparency
Open
participation
Open
collaboration
Ubiquitous
engagement
NA
Moon (Moon,
2002)
Informatio
n
Two-way
communicati
on
Financial &
Service
Transaction
Integration Political
Participation
NA
Reddick (Fath-
allah et al.,
2014)
Catalogue Transaction NA
Shahkooh
(Shahkooh et
al., 2008)
Online
presence
Interaction Transaction Integrated &
transformed
Digital
democracy
NA
Siau and Long
(Siau & Long,
2005)
Web
presence
Interaction Transaction Transform-
ation
e-democracy NA
United Nations
(UNDESA,
2018)
Emerging
informatio
n services
Enhanced
information
services
Transactiona
l services
Connected
services
NA NA
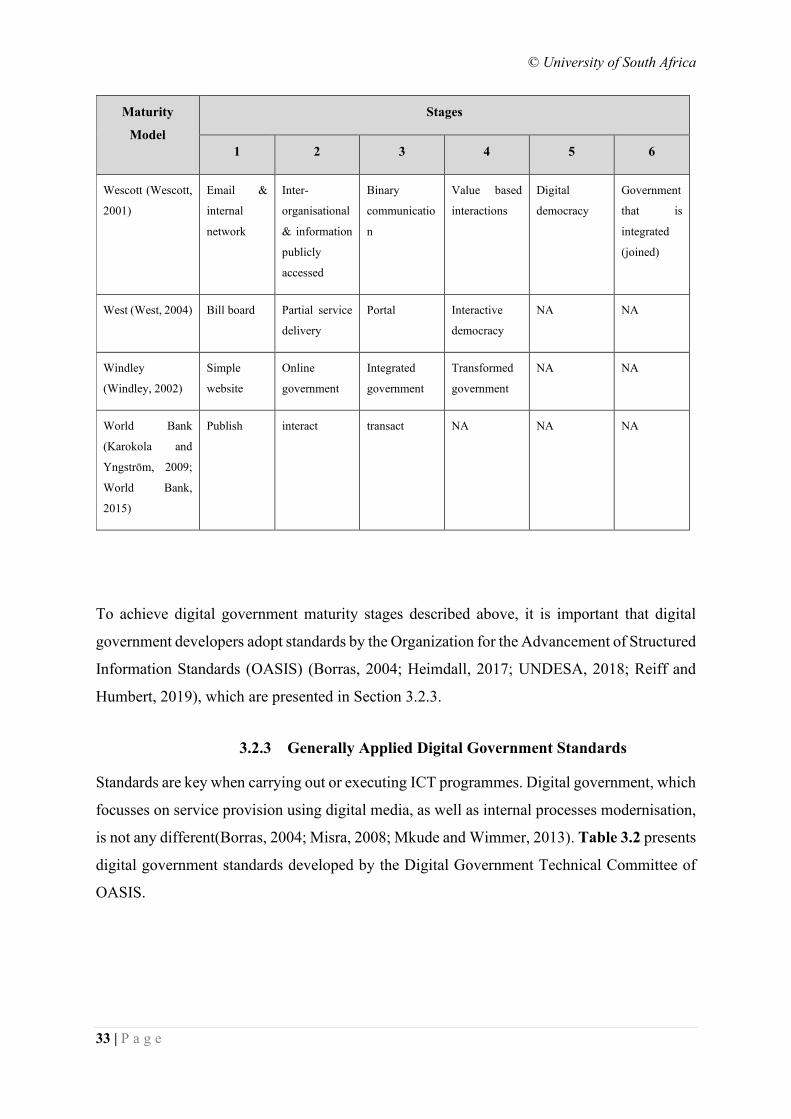
© University of South Africa
33 | P a g e
To achieve digital government maturity stages described above, it is important that digital
government developers adopt standards by the Organization for the Advancement of Structured
Information Standards (OASIS) (Borras, 2004; Heimdall, 2017; UNDESA, 2018; Reiff and
Humbert, 2019), which are presented in Section 3.2.3.
3.2.3 Generally Applied Digital Government Standards
Standards are key when carrying out or executing ICT programmes. Digital government, which
focusses on service provision using digital media, as well as internal processes modernisation,
is not any different(Borras, 2004; Misra, 2008; Mkude and Wimmer, 2013). Table 3.2 presents
digital government standards developed by the Digital Government Technical Committee of
OASIS.
Maturity
Model
Stages
1 2 3 4 5 6
Wescott (Wescott,
2001)
Email &
internal
network
Inter-
organisational
& information
publicly
accessed
Binary
communicatio
n
Value based
interactions
Digital
democracy
Government
that is
integrated
(joined)
West (West, 2004) Bill board Partial service
delivery
Portal Interactive
democracy
NA NA
Windley
(Windley, 2002)
Simple
website
Online
government
Integrated
government
Transformed
government
NA NA
World Bank
(Karokola and
Yngström, 2009;
World Bank,
2015)
Publish interact transact NA NA NA
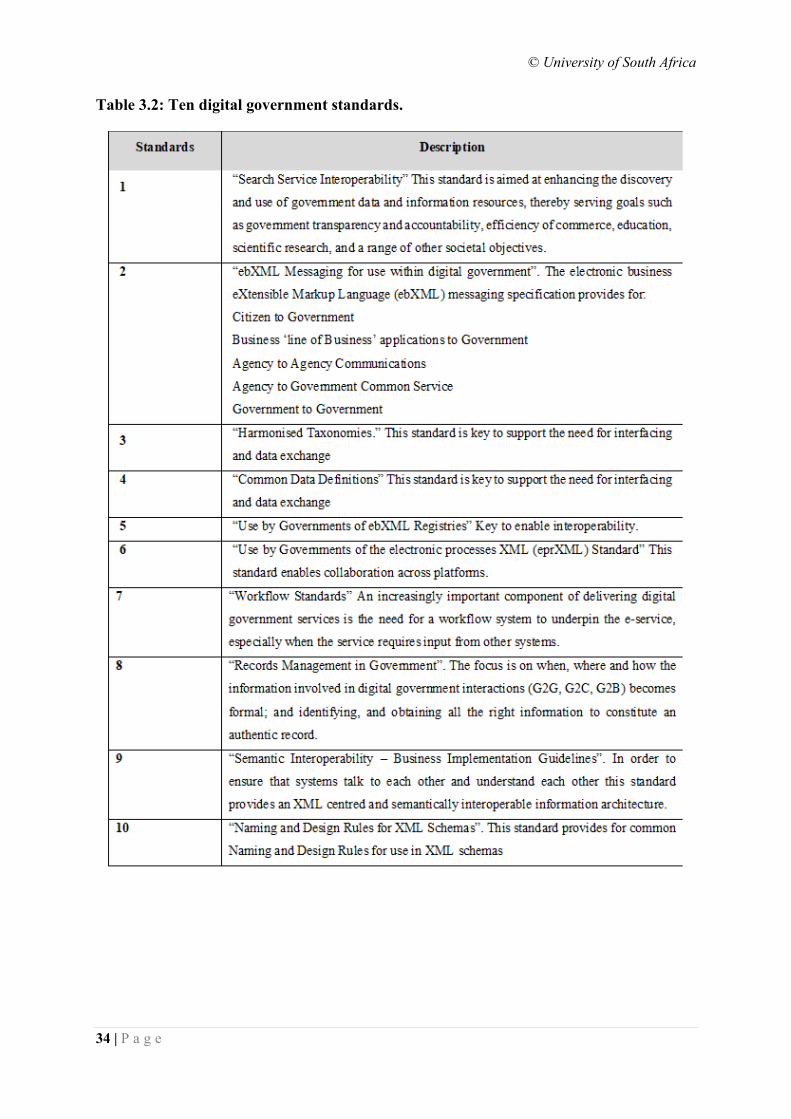
© University of South Africa
34 | P a g e
Table 3.2: Ten digital government standards.
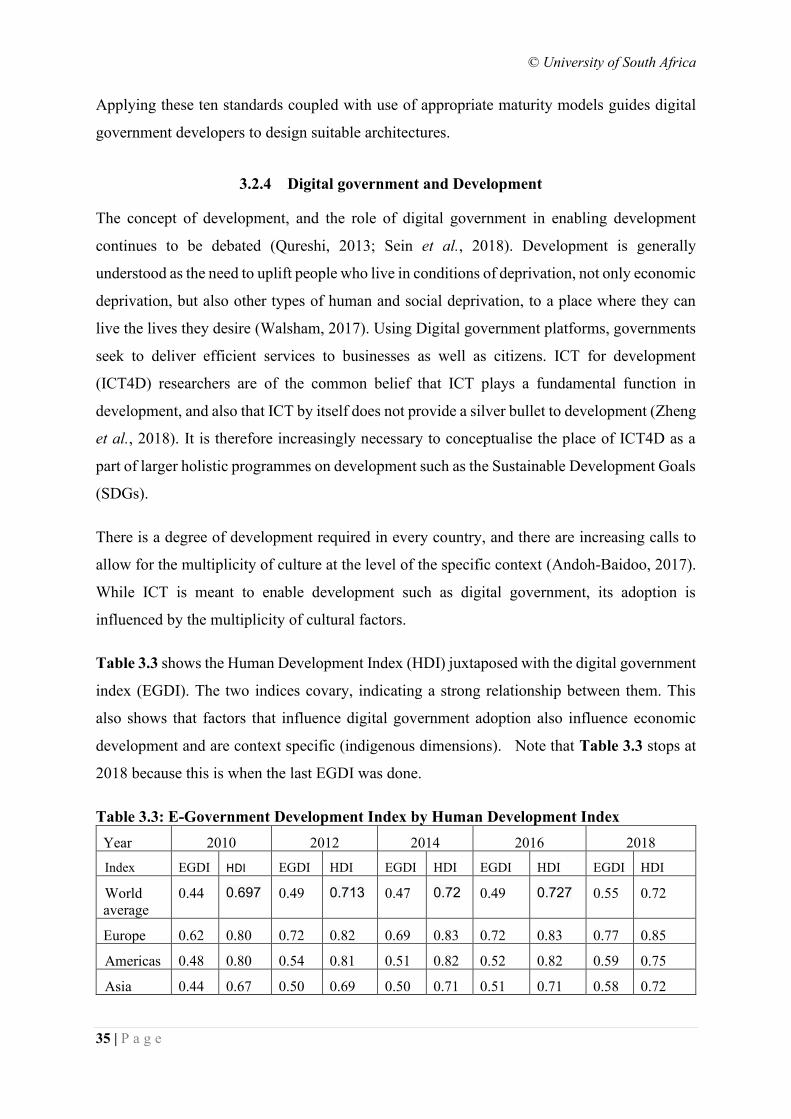
© University of South Africa
35 | P a g e
Applying these ten standards coupled with use of appropriate maturity models guides digital
government developers to design suitable architectures.
3.2.4 Digital government and Development
The concept of development, and the role of digital government in enabling development
continues to be debated (Qureshi, 2013; Sein et al., 2018). Development is generally
understood as the need to uplift people who live in conditions of deprivation, not only economic
deprivation, but also other types of human and social deprivation, to a place where they can
live the lives they desire (Walsham, 2017). Using Digital government platforms, governments
seek to deliver efficient services to businesses as well as citizens. ICT for development
(ICT4D) researchers are of the common belief that ICT plays a fundamental function in
development, and also that ICT by itself does not provide a silver bullet to development (Zheng
et al., 2018). It is therefore increasingly necessary to conceptualise the place of ICT4D as a
part of larger holistic programmes on development such as the Sustainable Development Goals
(SDGs).
There is a degree of development required in every country, and there are increasing calls to
allow for the multiplicity of culture at the level of the specific context (Andoh-Baidoo, 2017).
While ICT is meant to enable development such as digital government, its adoption is
influenced by the multiplicity of cultural factors.
Table 3.3 shows the Human Development Index (HDI) juxtaposed with the digital government
index (EGDI). The two indices covary, indicating a strong relationship between them. This
also shows that factors that influence digital government adoption also influence economic
development and are context specific (indigenous dimensions). Note that Table 3.3 stops at
2018 because this is when the last EGDI was done.
Table 3.3: E-Government Development Index by Human Development Index
Year 2010 2012 2014 2016 2018
Index EGDI HDI EGDI HDI EGDI HDI EGDI HDI EGDI HDI
World
average
0.44 0.697 0.49 0.713 0.47 0.72 0.49 0.727 0.55 0.72
Europe 0.62 0.80 0.72 0.82 0.69 0.83 0.72 0.83 0.77 0.85
Americas 0.48 0.80 0.54 0.81 0.51 0.82 0.52 0.82 0.59 0.75
Asia 0.44 0.67 0.50 0.69 0.50 0.71 0.51 0.71 0.58 0.72
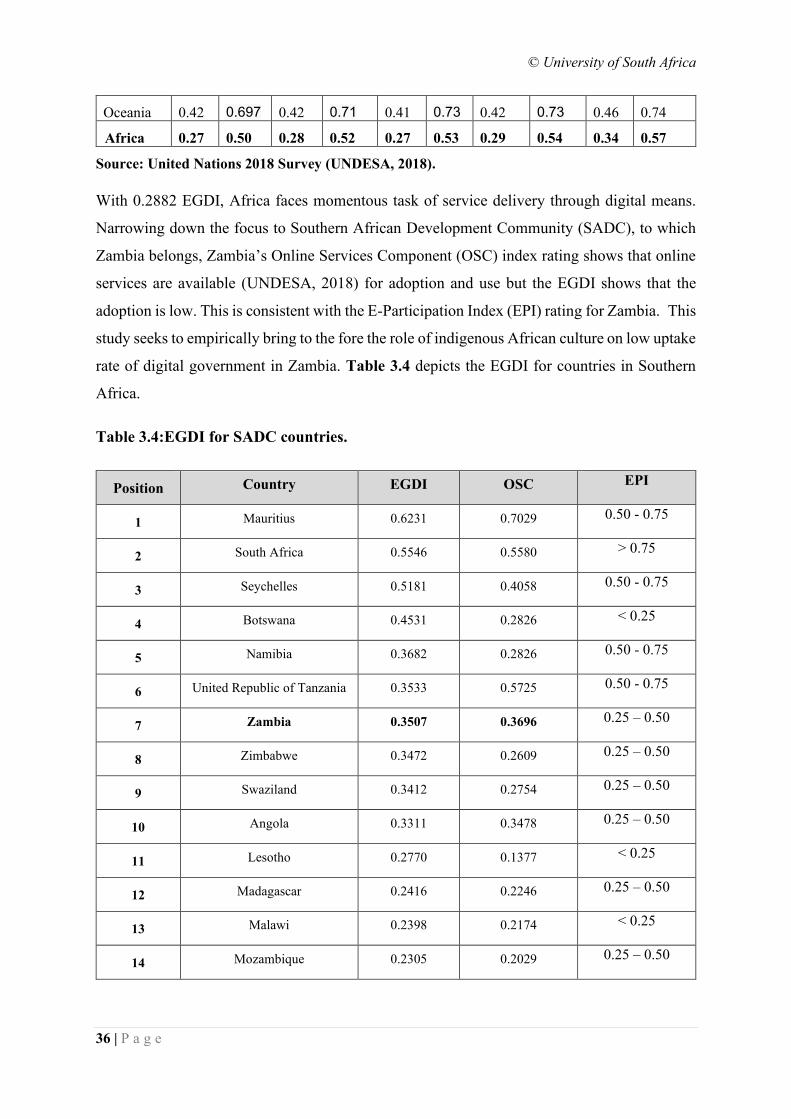
© University of South Africa
36 | P a g e
Oceania 0.42 0.697 0.42 0.71 0.41 0.73 0.42 0.73 0.46 0.74
Africa 0.27 0.50 0.28 0.52 0.27 0.53 0.29 0.54 0.34 0.57
Source: United Nations 2018 Survey (UNDESA, 2018).
With 0.2882 EGDI, Africa faces momentous task of service delivery through digital means.
Narrowing down the focus to Southern African Development Community (SADC), to which
Zambia belongs, Zambia’s Online Services Component (OSC) index rating shows that online
services are available (UNDESA, 2018) for adoption and use but the EGDI shows that the
adoption is low. This is consistent with the E-Participation Index (EPI) rating for Zambia. This
study seeks to empirically bring to the fore the role of indigenous African culture on low uptake
rate of digital government in Zambia. Table 3.4 depicts the EGDI for countries in Southern
Africa.
Table 3.4:EGDI for SADC countries.
Position Country EGDI OSC EPI
1 Mauritius 0.6231 0.7029 0.50 - 0.75
2 South Africa 0.5546 0.5580 > 0.75
3 Seychelles 0.5181 0.4058 0.50 - 0.75
4 Botswana 0.4531 0.2826 < 0.25
5 Namibia 0.3682 0.2826 0.50 - 0.75
6 United Republic of Tanzania 0.3533 0.5725 0.50 - 0.75
7 Zambia 0.3507 0.3696 0.25 – 0.50
8 Zimbabwe 0.3472 0.2609 0.25 – 0.50
9 Swaziland 0.3412 0.2754 0.25 – 0.50
10 Angola 0.3311 0.3478 0.25 – 0.50
11 Lesotho 0.2770 0.1377 < 0.25
12 Madagascar 0.2416 0.2246 0.25 – 0.50
13 Malawi 0.2398 0.2174 < 0.25
14 Mozambique 0.2305 0.2029 0.25 – 0.50
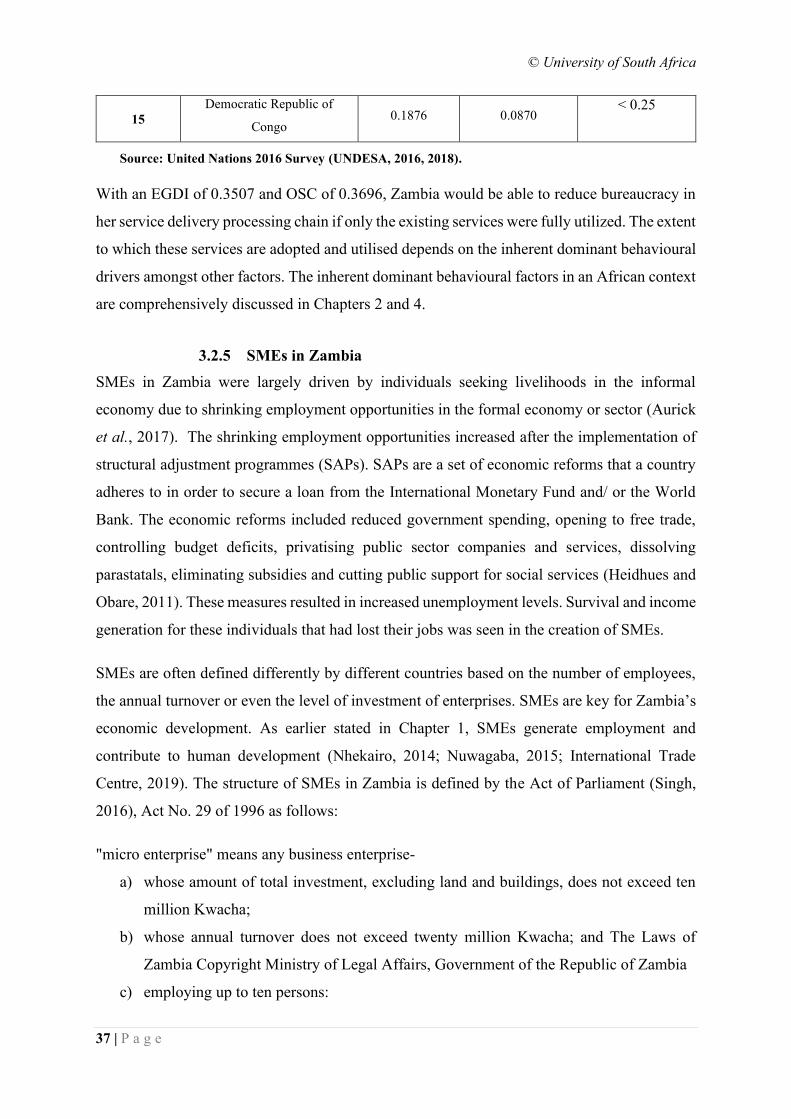
© University of South Africa
37 | P a g e
15
Democratic Republic of
Congo 0.1876 0.0870
< 0.25
Source: United Nations 2016 Survey (UNDESA, 2016, 2018).
With an EGDI of 0.3507 and OSC of 0.3696, Zambia would be able to reduce bureaucracy in
her service delivery processing chain if only the existing services were fully utilized. The extent
to which these services are adopted and utilised depends on the inherent dominant behavioural
drivers amongst other factors. The inherent dominant behavioural factors in an African context
are comprehensively discussed in Chapters 2 and 4.
3.2.5 SMEs in Zambia
SMEs in Zambia were largely driven by individuals seeking livelihoods in the informal
economy due to shrinking employment opportunities in the formal economy or sector (Aurick
et al., 2017). The shrinking employment opportunities increased after the implementation of
structural adjustment programmes (SAPs). SAPs are a set of economic reforms that a country
adheres to in order to secure a loan from the International Monetary Fund and/ or the World
Bank. The economic reforms included reduced government spending, opening to free trade,
controlling budget deficits, privatising public sector companies and services, dissolving
parastatals, eliminating subsidies and cutting public support for social services (Heidhues and
Obare, 2011). These measures resulted in increased unemployment levels. Survival and income
generation for these individuals that had lost their jobs was seen in the creation of SMEs.
SMEs are often defined differently by different countries based on the number of employees,
the annual turnover or even the level of investment of enterprises. SMEs are key for Zambia’s
economic development. As earlier stated in Chapter 1, SMEs generate employment and
contribute to human development (Nhekairo, 2014; Nuwagaba, 2015; International Trade
Centre, 2019). The structure of SMEs in Zambia is defined by the Act of Parliament (Singh,
2016), Act No. 29 of 1996 as follows:
"micro enterprise" means any business enterprise-
a) whose amount of total investment, excluding land and buildings, does not exceed ten
million Kwacha;
b) whose annual turnover does not exceed twenty million Kwacha; and The Laws of
Zambia Copyright Ministry of Legal Affairs, Government of the Republic of Zambia
c) employing up to ten persons:
© University of South Africa
38 | P a g e
Provided that the values under paragraphs (a) and (b) may be varied by the Minister, by
statutory instrument;
"small enterprise" means any business enterprise-
(a) whose amount of total investment, excluding land and building, does not exceed-
i. in the case of manufacturing and processing enterprises, fifty million
Kwacha in plant and machinery; and
ii. in the case of trading and service providing enterprises, ten million
Kwacha;
(b) whose annual turnover does not exceed eighty million kwacha; and
(c) employing up to thirty persons;
Provided that the values under paragraphs (a) and (b) may be varied by the Minister, by
statutory instrument.
The values stipulated in the Act of 1996 have since been revised in subsequent Acts and policies
such as the Small Industries Development Act, The Commercial, Trade and Industrial Policy,
Small Enterprises Development Act, and the Micro, Small and Medium Enterprise
Development Policy.
The economic activities of SMEs are mainly distributed around the traditional economic
sectors that rely on social networks (Aurick et al., 2017; Liu et al., 2017). The performance
and strength of the SMEs is dependent upon the strength of their social networks among others
where network cohesion serves as an important structural feature that moderates the influence
of interpersonal networks (Liu et al., 2017). Friedkin (1993) noted that personal influence
exhibited a stronger growth within more cohesive social networks than less cohesive ones.
Social networks therefore play a key role in positioning SMEs in the market. Similarly,
indigenous culture, which can be viewed as being congruent with social networks, plays a key
role in positioning SMEs in the digital government domain.
3.2.6 Digital Government Stimuli or Enablers
There are many factors that impact digital government uptake. The extent to which these factors
impact digital government development and adoption differs from region to region. Due to
these regional context differences, there is hardly a universal blueprint for digital government.
Many Scholars (Mawela, Ochara and Twinomurinzi, 2017; Xia, 2017; Olaniyi, 2019) have
identified political, financial, technological and even culture as key factors.
© University of South Africa
39 | P a g e
3.2.6.1 Political
The political factor defines the level of leadership inherent in the governance system. This
factor is expressed as political will, which increases the chances of succeeding in implementing
as well as adopting digital government initiatives. Lack of political will leads to digital
government implementation failure. Mzyece (2012b) noted the need for political will at
different levels of governance; national, provincial and local. For Zambia, the launch of the
SMART Zambia Institute at national level requires corresponding structures at provincial and
local levels to enable coordination and support for digital government programmes. Currently,
such structures are lacking at lower levels.
3.2.6.2 Financial
The financial factor is largely dependent on the political factor. Without the political will,
digital government programmes cannot be funded. Without funding, it is not possible to
implement digital government programmes and ultimately, there would be no digital services
for citizens and businesses to adopt.
3.2.6.3 Technological
The technological factor is dependent on financial factors. In the absence of funding, it is not
easy to procure necessary technologies required for digital government reforms. The
technological factor takes a fundamental dimension as it creates the digital government artefact.
Without technological factor, there would be no digital government.
3.2.6.4 Culture
As noted in Chapter 1, culture is believed to influence digital government adoption (Yavwa
and Twinomurinzi, 2018). Cultural issues require more attention than the other factors because
culture has several contextual dimensions (Alshehri and Drew, 2010) whose impact on digital
government adoption is yet to be investigated.
Scholars have considered the impact of some dimensions of culture largely at national,
organisational and group levels. There is limited research that has considered the impact of
culture in an indigenous context such as African context. While political, financial and
technological factors may be universal and well researched, cultural factors (Al-Lamki, 2018)
© University of South Africa
40 | P a g e
are diverse and thus require examining from an indigenous perspective. This study seeks to
bring to the fore indigenous cultural contexts influencing digital government in Africa.
3.3 Cultural Contexts
Different contexts are associated with culture, from its definition to its manifestation.
Schein(1984) defines culture based on a form of elementary beliefs conceived, found or
established . The discovery occurs in the process of acquiring knowledge of the environment
and adapting therein. External adaptation involves coping with new environments and other
cultures arising from migration while internal integration involves coping with different ethnic
groups and efforts to co-exist in a cultural heterogeneous environment. The acquired
knowledge is inherited by future generations and becomes the right way of perceiving, thinking
as well as expression when confronted with problems .
3.3.1 Forms of Culture
Culture takes different forms. The five types of culture commonly considered include group,
national, organizational, professional and global culture (Leung et al., 2005). Group culture
describes a belief and value system of a group. National culture is exhibited through perceived
collective behavior of people in a nation, while organizational culture relates to perceived
collective behavior of staff of an organization. Professional culture is a perception of collective
behavior of people of a specific profession. Global culture relates to global behavioral patterns
exhibited in a global world. Culture can therefore be further described as a pattern of belief
systems governing people’s approach to life (Hall, 1976).
Hofstede’s seminal work (Hofstede and Hofstede, 2005) conceptualizes culture based on
national dimensions and describes national culture by a shared mental conditioning which gives
identity to a group of people.
3.3.2 Indigenous Aspects of Culture
Using the definition by (Leung et al., 2005) and to a certain extent by Schein (Schein, 1984),
culture can be conceptualized in an indigenous context. Both Leung and Schein conjecture that
culture is anchored on an indigenous value and belief system of individuals comprising a given
society or region. For example, the value system of Eastern (Asia) and African societies
includes message passing through idioms, adages or aphorisms. These depict cultural
constructs that portray the characteristics of the individuals in that society. Their perception of
© University of South Africa
41 | P a g e
technology such as digital government is impacted by inherited subjective norms or acquired
social norms in the environment. This assertion is supported by literature which reveals that
only 20% of the success of digital government is attributed to technology (Asianzu and Maiga,
2012) while 80% is attributed to social or cultural factors (Asianzu and Maiga, 2012). Yet many
governments spend more resources on technical factors than on the cultural imperatives.
Consequently, digital government initiatives failure rate remains high (Heeks, 2009; Knox and
Janenova, 2019). This is generally true for Africa and Zambia in particular where the digital
government projects began in 2009 (Bwalya, 2009a) and yet most mainstream government
ministries only have static websites to date.
Literature highlights the need to take into account cultural orientation of a society when
designing and implementing digital government systems to avoid misalignment (Heeks, 2009).
The misalignment arises from the use of external vendors (Wachira, 2014), who hardly
understand the local cultural environment in which the intended beneficiaries of digital
government services reside. They tend to adapt the digital government implementations to their
own socio-technical and cultural contexts (Alshehri, 2012) which may not be suitable for low-
income countries. The United Nations (UNDESA, 2018) attributes the lagged digital
government implementation and adoption in low-income countries to a multiplicity of factors.
The factors indicated are largely technical, void of the important aspects of indigenous culture.
Culture is known to exert influence on societies resulting in either remarkable gains (Banda,
2012) or retrogression. The Confucian work dynamism construct for example is believed to be
responsible for the rapid economic growth of East Asian Societies between 1960 and 1990
(Davison and Martinsons, 2016). Another Chinese cultural super construct named guanxi,
composed of favour, trust, dependence, and adaptation (Leung, 2001; Davison and Martinsons,
2016) influences behaviour towards online consumption of e-commerce services on TaoBao,
an e-commerce portal in China. These constructs demonstrate that culture can be positively
harnessed once its direction of causality is identified.
Prior studies (Buabeng-Andoh, 2012; Mamta, 2012; Blut and Wang, 2020) reveal existence of
supporting as well as inhibiting views concerning ICT which determine readiness to accept or
not to accept new technologies. These beliefs constitute compelling or inhibiting philosophies
concerning technology (Mamta, 2012; Blut and Wang, 2020). Compelling or favourable views
influence their behaviour towards ICTs while the negative or inhibiting beliefs hold them back.
It is the compelling or positive beliefs that are necessary for adoption of ICTs. Alshehri (2012)
© University of South Africa
42 | P a g e
defines such belief systems as culture. Literature reveals that culture is complex but also that it
is possible to develop many different dimensions of it (Ali, Weerakkody and El-Haddadeh,
2009b) which impact digital government initiatives. It is therefore not surprising that there are
several definitions, conceptualisations and dimensions used to describe culture (Hofstede,
2011). This strengthens the notion that culture is context specific.
The influence of culture has been investigated by Hofstede (2011) who developed six
measurements; uncertainty avoidance, power distance, masculinity/femininity,
individualism/collectivism, short term planning as well as indulgence. Although the
measurements are widely utilised in examining culture’s influence on digital government
adoption, they are more reflective of national culture (Ali, Weerakkody and El-Haddadeh,
2009b; Nguyen, 2016) than indigenous culture at individual, society or community level. Sehli
et. al. (2016) recognised that societal culture played an important role on digital government
adoption. Despite this recognition, they based their model on Hofstede’s cultural dimensions
as societal cultural dimensions. We argue that groups and societies depicted by Hofstede’s
seminal work are based on national attributes outlined in the online measures (Hofstede, 2011).
From an African perspective, there is hardly empirical study examining indigenous African
culture’s influence on digital government uptake. Most digital government research conducted
in Africa involving the influence of culture was largely based on Hofstede’s cultural
dimensions (Aida and Majdi, 2014; Hu and Khanam, 2016). Further, Sehli et. al. (2016) also
noted that research focusing on indigenous culture and digital government in low-income
countries is almost non-existent. This assertion was confirmed by Al-Hujran et. al. (2011).
Bwalya (2009a) attempted to investigate the impact of government commitment, awareness,
language content and trust and conceptually concluded that such constructs were necessary for
successful digital government initiatives in low-income countries. Alsaif (2013) also
investigated the influence of similar constructs in Saudi Arabia..
3.4 Internet Access
Besides indigenous African culture, this study also investigates extant influence of internet
access on digital government uptake in Zambia. ICT usage in Zambia is considered low or
rudimentary among SMEs (Hook, 2016) despite an increase in broadband services in Africa
(Narayan, 2014). The enabling infrastructure for Internet access used by SMEs includes dial
up connections, Integrated Services Digital Networks (ISDN), Digital Subscriber Lines (DSL),
Satellite connections, cable modems, Wireless Local Area Networks (WLAN), Wi-Fi (a
© University of South Africa
43 | P a g e
trademarked term for IEEE 802.11x standard) and Worldwide Interoperability for Microwave
Access (WiMAX) based on IEEE 802.16 standard. The precursors to access or use of the
internet are readiness, availability, accessibility and uptake (Bwalya and Healy, 2010).
Readiness depicts the preparedness to deploy, adopt and use ICT initiatives (Ismail, 2008).
Existing policies and infrastructure provide enabling conditions that encourage ICT initiatives
which target developmental needs. Some of the positive policies implemented in Zambia by
Mobile Network Operators (Zamtel, Airtel and MTN) included a reduction in the cost of data
bundles by nearly 70% at the end of 2017. Through the universal access project, the regulator
of telecommunication companies installed telecommunication towers across the country. These
efforts were aimed at preparing and enhancing the technical environment for the provision of
the internet service, which is a critical factor for enabling effective government service uptake
by citizens and businesses (especially SMEs whose role in national development is key).
Availability is the existence of internet to citizens and businesses in low-income countries
while accessibility is defined in the context of affordability. The uptake parameter describes
ways that simplify the application of ICT initiatives in a useful manner that contributes to the
satisfaction of the needs of citizens and businesses. Uptake is based on the knowledge that
using the proposed technologies to address a specific need would reduce the required effort (E)
to achieve the objective while at the same time increasing the users’ performance (P); (P):=
𝑘1
𝐸; where k is a moderating or mediating coefficient.
In low-income countries, internet access is a bottleneck to Digital Government adoption. A
reliable as well as affordable internet service is key for technology adoption (Agbemenu and
Marfo, 2016). As indicated earlier, the government policies implemented in Zambia are
expected to increase access to the internet thereby influencing intention to adopt digital
platforms offered by government. This research examines extant impact of internet access
following positive policies by the Zambian government.
3.5 Efficiency Summary
The introduction of technology in government sparked an evolution from a manually driven
government to a digitally driven government, guided by appropriate maturity models and
standards. Digital government systems, designed and implemented with the aim of improving
provision of public services suffer several adoption challenges (Kamal and Qureshi, 2009).
Amongst these challenges, culture exhibits a complex facet arising from its multi-dimensional
© University of South Africa
44 | P a g e
contexts. This research therefore argues for investigations of influence of culture to be
conducted in local contexts. Firstly, the local or indigenous culture should be understood prior
to investigating its influence on digital government.
In order to investigate indigenous culture influence from an African context, this study made
use of two digital government services; e-filing as well as e-payment. E-filing service has a far
reaching influence on economic development (Kumar, 2017; Syed, Henderson and Gupta,
2017). E-services increase intra-government efficiency, improve delivery of public services,
support transparency and open-government (Haldenwang, 2004). Considerable research has
been undertaken to investigate digital government uptake using e-filing (Azmi, Kamarulzaman
and Hamid, 2012b; Chandra, 2015; Gupta, Udo, et al., 2015; Mustapha, Normala and Sheikh,
2015; Syed, Henderson and Gupta, 2017). The low e-services usage in Zambia and generally
in Africa agrees with United Nations survey (UNDESA, 2016, 2018) where the results show
that Africa has consistently trailed as shown in Table 3.3.
3.6 Conclusion
This chapter discussed digital government and reviewed digital government literature
involving culture. The effect of culture on digital government adoption was also highlighted.
The implementation of information systems is an anchor to transformation of governments
from digitalisation stage through digital government to smart governments. The progression
through these stages can only be realised by ensuring that the fundamental digital government
standards necessary for collaboration are adhered to, coupled with periodic maturity
assessments to ascertain conformity to preselected digital government models.
The review also highlighted that the attainment of an appropriate digital government
architecture depended on factors such as political will, financial, technological and culture.
While political will, financial and technological factors are relatively well understood, culture
expresses itself in different dimensions and is context specific. Understanding these context
specific dimensions of culture is important for digital government adoption, especially in low-
income countries, where indigenous culture is rooted in societies and communities.
Further, literature revealed that many scholars investigated the effect of culture on digital
government uptake or adoption. They however investigated culture from the context of
prescribed cultural dimensions such as organisational, administrative and national culture
© University of South Africa
45 | P a g e
largely using Hofstede’s measurements. Research investigating indigenous culture’s influence,
especially in an African context, on digital government adoption is nearly non-existent.
Chapter 3 seeks to systematically bring to the fore the extent to which literature identifies
indigenous African culture as a factor in digital government adoption.
© University of South Africa
46 | P a g e
CHAPTER 4
4. A SYSTEMATIC LITERATURE REVIEW OF THE
INFLUENCE OF INDIGENOUS AFRICAN CULTURE ON
DIGITAL GOVERNMENT ADOPTION
4.1 Introduction
Chapter 3 highlighted gaps concerning digital government and culture. Chapter 4 identifies
gaps, challenges as well as opportunities for research into the influence of indigenous African
culture on digital government adoption. Specifically, the chapter sought to answer the
following secondary research questions:
RQ1: What indigenous cultural constructs influence digital government adoption in Africa?
RQ2: Which dimensions and contexts shape the direction of digital government research
involving culture?
The methodology for the systematic review is outlined in Section 4.2.
4.2 Methodology
The systematic review was centred on the methodology by Kitchenham and Charters (2007),
which follows a three stage process: planning, conducting actual review as well as reporting.
Reporting approach adopted the Preferred Reporting Items for Systematic Reviews and Meta-
Analysis (PRISMA) (Harris et al., 2014). The review considered publications written in
English covering both digital government and culture from 2000 to 2018. The process of
selecting articles was done from January 2019 to July 2019, while the analysis of the articles
was from August 2019 to January 2020. A schematic representation of the review protocol
based on PRISMA is presented in Figure 4.1.
The stages of the review protocol are outlined in subsequent sub sections.
4.2.1 Planning the Review
The planning of the review constituted three aspects; development of the search terms,
identification of the relevant data sources and the inclusion and exclusion criteria.
© University of South Africa
47 | P a g e
4.2.1.1 Development of search terms
The development of the search terms was derived from RQ1 and RQ2. The framework for the
development of the search strings presented in Appendix V is shown below;
[Unit of Analysis] AND [Technology artefact] AND [Phenomenon of Interest].
The specific terms for the [Unit of Analysis] are:
• Local culture OR
• African culture OR
• Indigenous culture OR
• Indigenous African Culture
The specific terms for the [Technology artefact] are:
• E-government OR
• E-gov OR
• Digital government OR
• E-governance OR
• Electronic Government OR
• Egovernment OR
• E government
The specific terms for the [Phenomenon of Interest] are:
• Acceptance
• Usage
• Adoption
4.2.1.2 Identification of the relevant data sources
The search was done using the identified ten electronic multidisciplinary databases as
shown in Table 4.1.
Table 4.1: Electronic Databases

© University of South Africa
48 | P a g e
Journals searched (2000–2018)
Taylor & Francis Online
Association for Information Systems electronic Library (AISeL),
African Journal of Information Systems (AJIS),
Scopus,
IEEE Xplore,
Association for Computing Machinery (ACM),
ScienceDirect,
African digital repository,
Springer,
Google Scholar
4.2.1.3 The inclusion and exclusion criteria
Articles were selected based on their relevance using the following criteria;
4.2.1.3.1 Inclusion
• Articles published between 2000 and 2018
• Articles published in English
• Articles containing both Digital government and culture
4.2.1.3.2 Exclusion
• Articles published before 2000
• Articles published in other languages
• Articles containing Digital government only
• Articles containing culture only
• Duplicate articles
• Articles without year of publication
• Articles without theoretical grounding
The actual conduct of the systematic review is explained in Section 4.2.
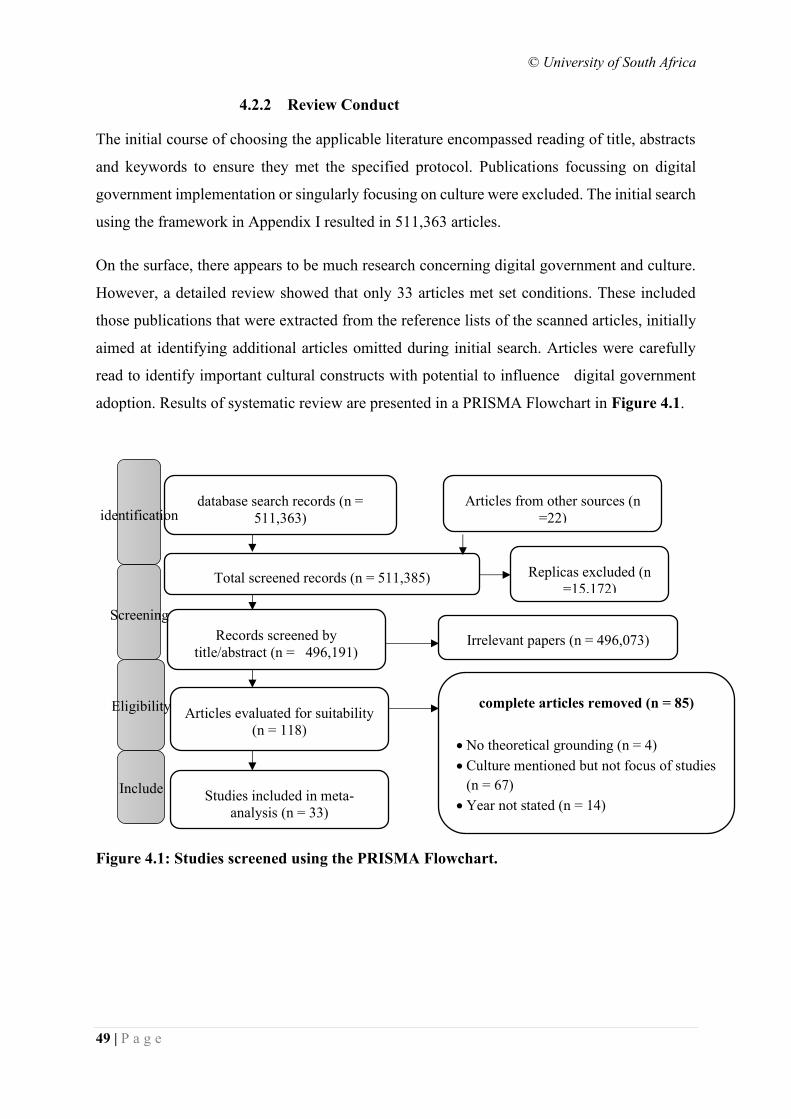
© University of South Africa
49 | P a g e
4.2.2 Review Conduct
The initial course of choosing the applicable literature encompassed reading of title, abstracts
and keywords to ensure they met the specified protocol. Publications focussing on digital
government implementation or singularly focusing on culture were excluded. The initial search
using the framework in Appendix I resulted in 511,363 articles.
On the surface, there appears to be much research concerning digital government and culture.
However, a detailed review showed that only 33 articles met set conditions. These included
those publications that were extracted from the reference lists of the scanned articles, initially
aimed at identifying additional articles omitted during initial search. Articles were carefully
read to identify important cultural constructs with potential to influence digital government
adoption. Results of systematic review are presented in a PRISMA Flowchart in Figure 4.1.
Figure 4.1: Studies screened using the PRISMA Flowchart.
database search records (n =
511,363)
Articles from other sources (n
=22)
Total screened records (n = 511,385) Replicas excluded (n
=15,172)
Records screened by
title/abstract (n = 496,191) Irrelevant papers (n = 496,073)
Articles evaluated for suitability
(n = 118)
Studies included in meta-
analysis (n = 33)
complete articles removed (n = 85)
• No theoretical grounding (n = 4)
• Culture mentioned but not focus of studies
(n = 67)
• Year not stated (n = 14)
• Cultural contexts external to Africa (n=41)
identification
Screening
Eligibility
Include
d
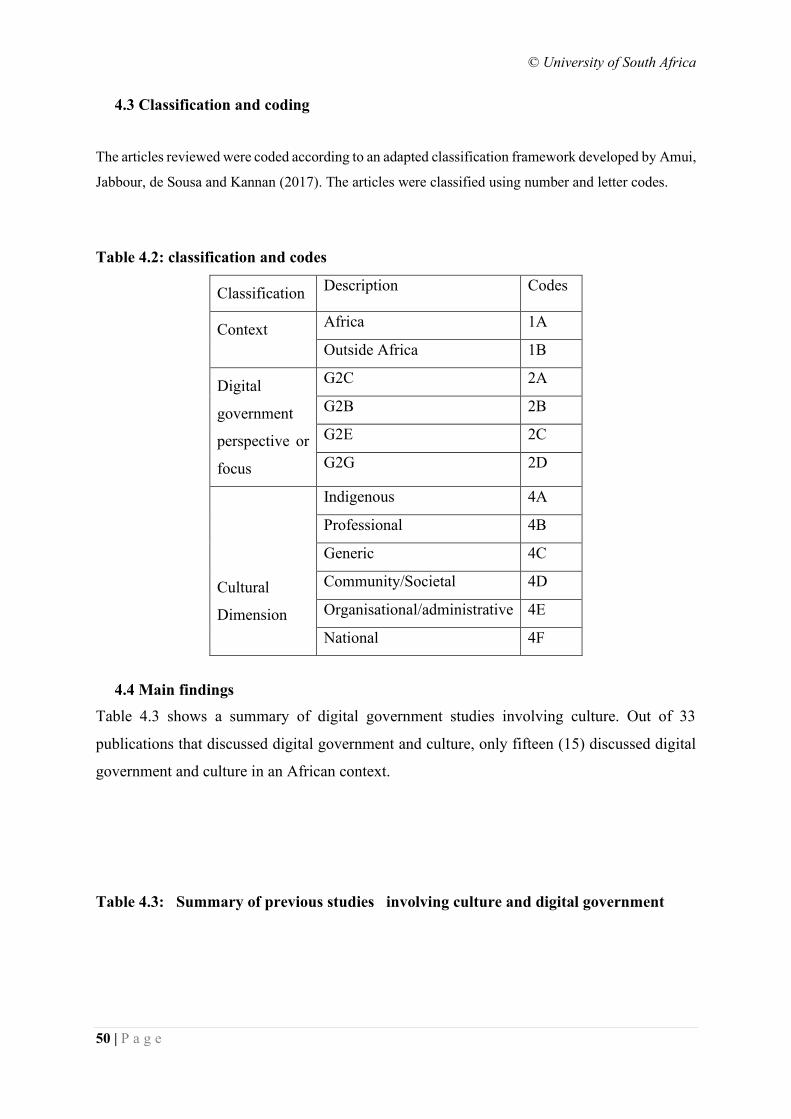
© University of South Africa
50 | P a g e
4.3 Classification and coding
The articles reviewed were coded according to an adapted classification framework developed by Amui,
Jabbour, de Sousa and Kannan (2017). The articles were classified using number and letter codes.
Table 4.2: classification and codes
Classification Description Codes
Context Africa 1A
Outside Africa 1B
Digital
government
perspective or
focus
G2C 2A
G2B 2B
G2E 2C
G2G 2D
Cultural
Dimension
Indigenous 4A
Professional 4B
Generic 4C
Community/Societal 4D
Organisational/administrative 4E
National 4F
4.4 Main findings
Table 4.3 shows a summary of digital government studies involving culture. Out of 33
publications that discussed digital government and culture, only fifteen (15) discussed digital
government and culture in an African context.
Table 4.3: Summary of previous studies involving culture and digital government
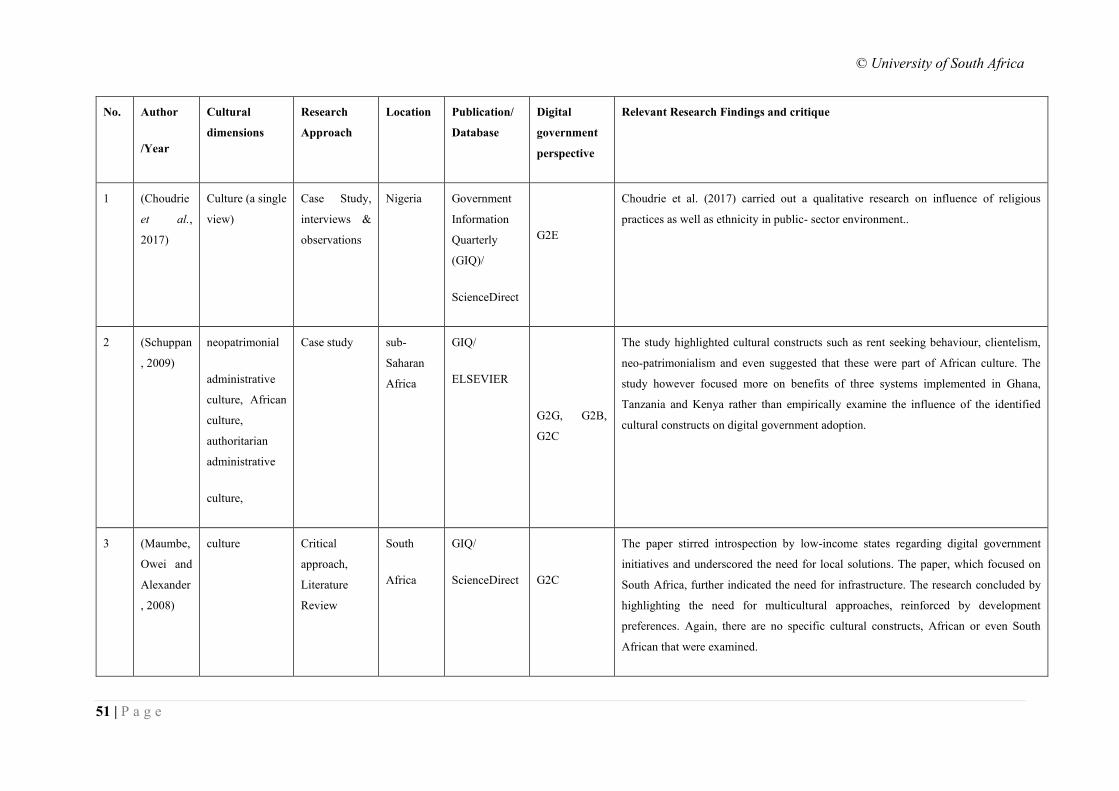
© University of South Africa
51 | P a g e
No. Author
/Year
Cultural
dimensions
Research
Approach
Location Publication/
Database
Digital
government
perspective
Relevant Research Findings and critique
1 (Choudrie
et al.,
2017)
Culture (a single
view)
Case Study,
interviews &
observations
Nigeria Government
Information
Quarterly
(GIQ)/
ScienceDirect
G2E
Choudrie et al. (2017) carried out a qualitative research on influence of religious
practices as well as ethnicity in public- sector environment..
2 (Schuppan
, 2009)
neopatrimonial
administrative
culture, African
culture,
authoritarian
administrative
culture,
Case study sub-
Saharan
Africa
GIQ/
ELSEVIER
G2G, G2B,
G2C
The study highlighted cultural constructs such as rent seeking behaviour, clientelism,
neo-patrimonialism and even suggested that these were part of African culture. The
study however focused more on benefits of three systems implemented in Ghana,
Tanzania and Kenya rather than empirically examine the influence of the identified
cultural constructs on digital government adoption.
3 (Maumbe,
Owei and
Alexander
, 2008)
culture Critical
approach,
Literature
Review
South
Africa
GIQ/
ScienceDirect
G2C
The paper stirred introspection by low-income states regarding digital government
initiatives and underscored the need for local solutions. The paper, which focused on
South Africa, further indicated the need for infrastructure. The research concluded by
highlighting the need for multicultural approaches, reinforced by development
preferences. Again, there are no specific cultural constructs, African or even South
African that were examined.
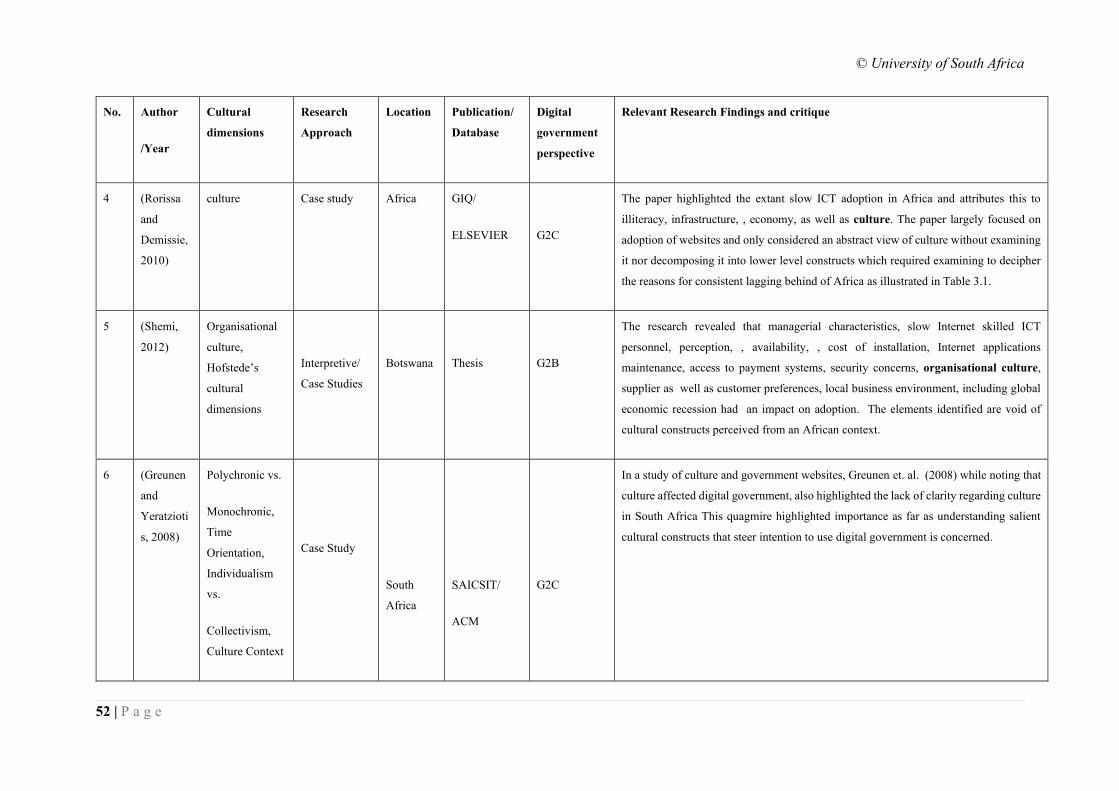
© University of South Africa
52 | P a g e
No. Author
/Year
Cultural
dimensions
Research
Approach
Location Publication/
Database
Digital
government
perspective
Relevant Research Findings and critique
4 (Rorissa
and
Demissie,
2010)
culture Case study Africa GIQ/
ELSEVIER
G2C
The paper highlighted the extant slow ICT adoption in Africa and attributes this to
illiteracy, infrastructure, , economy, as well as culture. The paper largely focused on
adoption of websites and only considered an abstract view of culture without examining
it nor decomposing it into lower level constructs which required examining to decipher
the reasons for consistent lagging behind of Africa as illustrated in Table 3.1.
5 (Shemi,
2012)
Organisational
culture,
Hofstede’s
cultural
dimensions
Interpretive/
Case Studies
Botswana
Thesis
G2B
The research revealed that managerial characteristics, slow Internet skilled ICT
personnel, perception, , availability, , cost of installation, Internet applications
maintenance, access to payment systems, security concerns, organisational culture,
supplier as well as customer preferences, local business environment, including global
economic recession had an impact on adoption. The elements identified are void of
cultural constructs perceived from an African context.
6 (Greunen
and
Yeratzioti
s, 2008)
Polychronic vs.
Monochronic,
Time
Orientation,
Individualism
vs.
Collectivism,
Culture Context
Case Study
South
Africa
SAICSIT/
ACM
G2C
In a study of culture and government websites, Greunen et. al. (2008) while noting that
culture affected digital government, also highlighted the lack of clarity regarding culture
in South Africa This quagmire highlighted importance as far as understanding salient
cultural constructs that steer intention to use digital government is concerned.
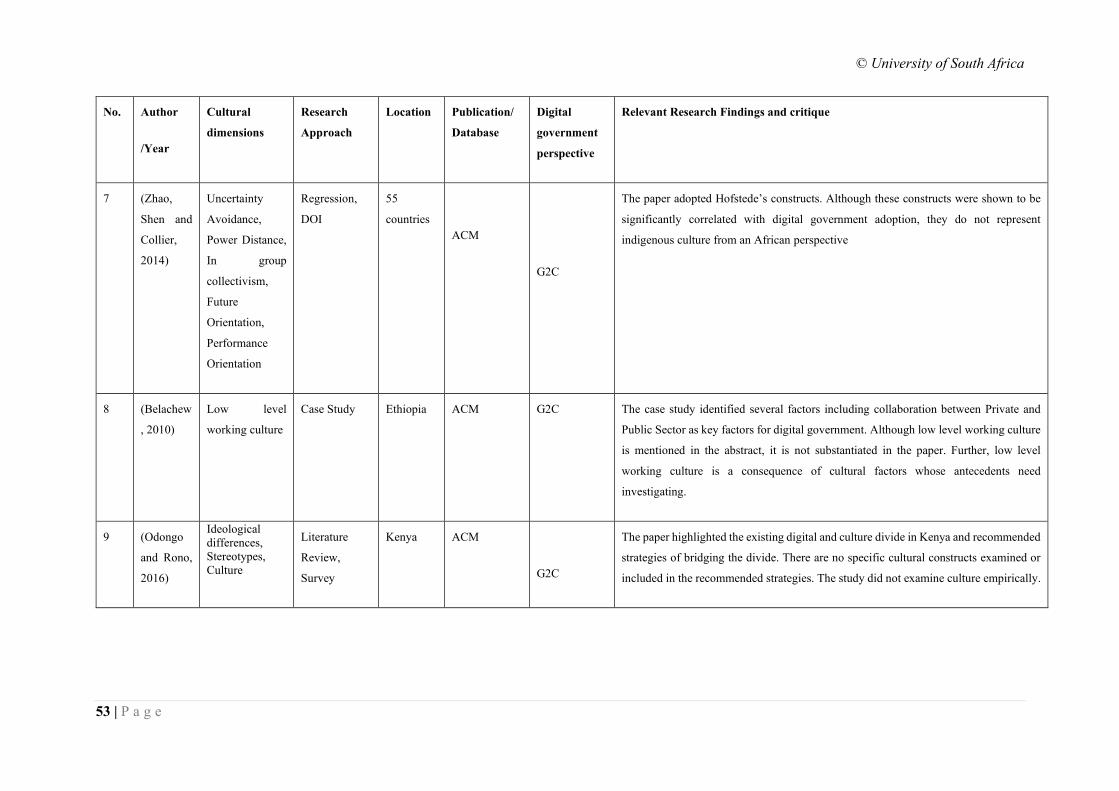
© University of South Africa
53 | P a g e
No. Author
/Year
Cultural
dimensions
Research
Approach
Location Publication/
Database
Digital
government
perspective
Relevant Research Findings and critique
7 (Zhao,
Shen and
Collier,
2014)
Uncertainty
Avoidance,
Power Distance,
In group
collectivism,
Future
Orientation,
Performance
Orientation
Regression,
DOI
55
countries
ACM
G2C
The paper adopted Hofstede’s constructs. Although these constructs were shown to be
significantly correlated with digital government adoption, they do not represent
indigenous culture from an African perspective
8 (Belachew
, 2010)
Low level
working culture
Case Study Ethiopia ACM G2C The case study identified several factors including collaboration between Private and
Public Sector as key factors for digital government. Although low level working culture
is mentioned in the abstract, it is not substantiated in the paper. Further, low level
working culture is a consequence of cultural factors whose antecedents need
investigating.
9 (Odongo
and Rono,
2016)
Ideological
differences,
Stereotypes,
Culture
Literature
Review,
Survey
Kenya ACM
G2C
The paper highlighted the existing digital and culture divide in Kenya and recommended
strategies of bridging the divide. There are no specific cultural constructs examined or
included in the recommended strategies. The study did not examine culture empirically.
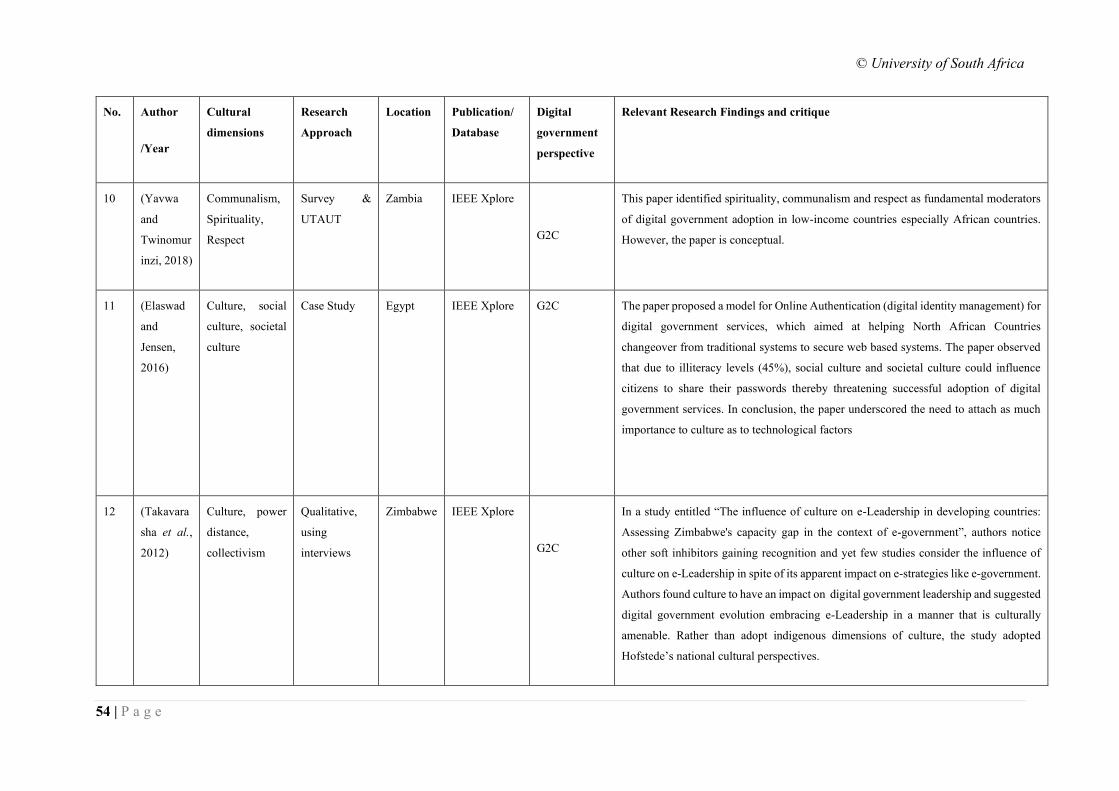
© University of South Africa
54 | P a g e
No. Author
/Year
Cultural
dimensions
Research
Approach
Location Publication/
Database
Digital
government
perspective
Relevant Research Findings and critique
10 (Yavwa
and
Twinomur
inzi, 2018)
Communalism,
Spirituality,
Respect
Survey &
UTAUT
Zambia IEEE Xplore
G2C
This paper identified spirituality, communalism and respect as fundamental moderators
of digital government adoption in low-income countries especially African countries.
However, the paper is conceptual.
11 (Elaswad
and
Jensen,
2016)
Culture, social
culture, societal
culture
Case Study Egypt IEEE Xplore G2C The paper proposed a model for Online Authentication (digital identity management) for
digital government services, which aimed at helping North African Countries
changeover from traditional systems to secure web based systems. The paper observed
that due to illiteracy levels (45%), social culture and societal culture could influence
citizens to share their passwords thereby threatening successful adoption of digital
government services. In conclusion, the paper underscored the need to attach as much
importance to culture as to technological factors
12 (Takavara
sha et al.,
2012)
Culture, power
distance,
collectivism
Qualitative,
using
interviews
Zimbabwe IEEE Xplore
G2C
In a study entitled “The influence of culture on e-Leadership in developing countries:
Assessing Zimbabwe's capacity gap in the context of e-government”, authors notice
other soft inhibitors gaining recognition and yet few studies consider the influence of
culture on e-Leadership in spite of its apparent impact on e-strategies like e-government.
Authors found culture to have an impact on digital government leadership and suggested
digital government evolution embracing e-Leadership in a manner that is culturally
amenable. Rather than adopt indigenous dimensions of culture, the study adopted
Hofstede’s national cultural perspectives.
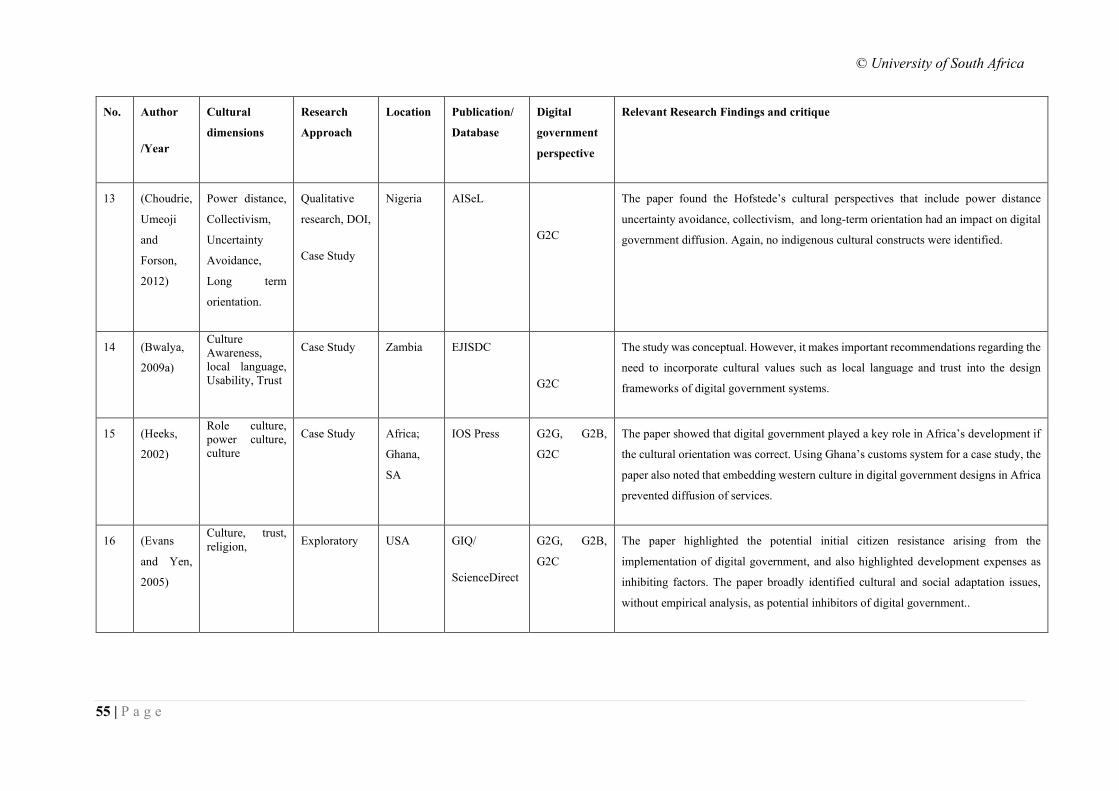
© University of South Africa
55 | P a g e
No. Author
/Year
Cultural
dimensions
Research
Approach
Location Publication/
Database
Digital
government
perspective
Relevant Research Findings and critique
13 (Choudrie,
Umeoji
and
Forson,
2012)
Power distance,
Collectivism,
Uncertainty
Avoidance,
Long term
orientation.
Qualitative
research, DOI,
Case Study
Nigeria AISeL
G2C
The paper found the Hofstede’s cultural perspectives that include power distance
uncertainty avoidance, collectivism, and long-term orientation had an impact on digital
government diffusion. Again, no indigenous cultural constructs were identified.
14 (Bwalya,
2009a)
Culture
Awareness,
local language,
Usability, Trust
Case Study Zambia EJISDC
G2C
The study was conceptual. However, it makes important recommendations regarding the
need to incorporate cultural values such as local language and trust into the design
frameworks of digital government systems.
15 (Heeks,
2002)
Role culture,
power culture,
culture
Case Study Africa;
Ghana,
SA
IOS Press G2G, G2B,
G2C
The paper showed that digital government played a key role in Africa’s development if
the cultural orientation was correct. Using Ghana’s customs system for a case study, the
paper also noted that embedding western culture in digital government designs in Africa
prevented diffusion of services.
16 (Evans
and Yen,
2005)
Culture, trust,
religion, Exploratory USA GIQ/
ScienceDirect
G2G, G2B,
G2C
The paper highlighted the potential initial citizen resistance arising from the
implementation of digital government, and also highlighted development expenses as
inhibiting factors. The paper broadly identified cultural and social adaptation issues,
without empirical analysis, as potential inhibitors of digital government..
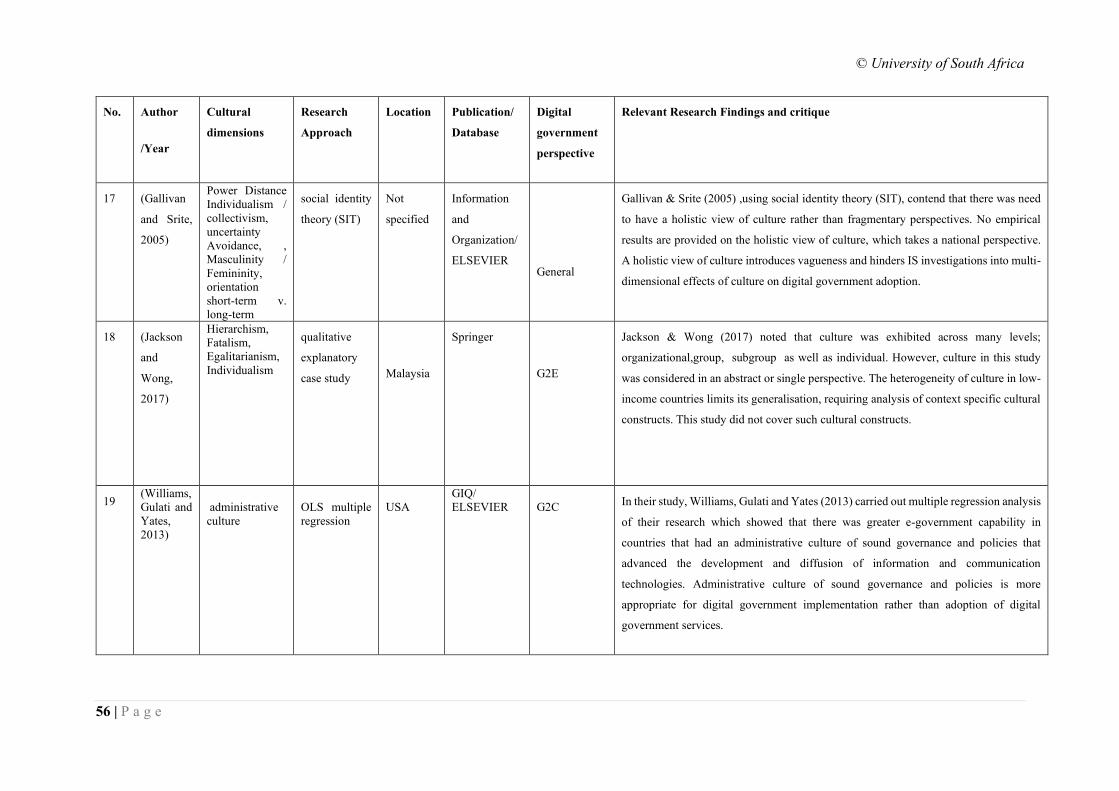
© University of South Africa
56 | P a g e
No. Author
/Year
Cultural
dimensions
Research
Approach
Location Publication/
Database
Digital
government
perspective
Relevant Research Findings and critique
17 (Gallivan
and Srite,
2005)
Power Distance
Individualism /
collectivism,
uncertainty
Avoidance, ,
Masculinity /
Femininity,
orientation
short-term v.
long-term
social identity
theory (SIT)
Not
specified
Information
and
Organization/
ELSEVIER
General
Gallivan & Srite (2005) ,using social identity theory (SIT), contend that there was need
to have a holistic view of culture rather than fragmentary perspectives. No empirical
results are provided on the holistic view of culture, which takes a national perspective.
A holistic view of culture introduces vagueness and hinders IS investigations into multi-
dimensional effects of culture on digital government adoption.
18 (Jackson
and
Wong,
2017)
Hierarchism,
Fatalism,
Egalitarianism,
Individualism
qualitative
explanatory
case study
Malaysia
Springer
G2E
Jackson & Wong (2017) noted that culture was exhibited across many levels;
organizational,group, subgroup as well as individual. However, culture in this study
was considered in an abstract or single perspective. The heterogeneity of culture in low-
income countries limits its generalisation, requiring analysis of context specific cultural
constructs. This study did not cover such cultural constructs.
19 (Williams,
Gulati and
Yates,
2013)
administrative
culture
OLS multiple
regression
USA
GIQ/
ELSEVIER
G2C In their study, Williams, Gulati and Yates (2013) carried out multiple regression analysis
of their research which showed that there was greater e-government capability in
countries that had an administrative culture of sound governance and policies that
advanced the development and diffusion of information and communication
technologies. Administrative culture of sound governance and policies is more
appropriate for digital government implementation rather than adoption of digital
government services.
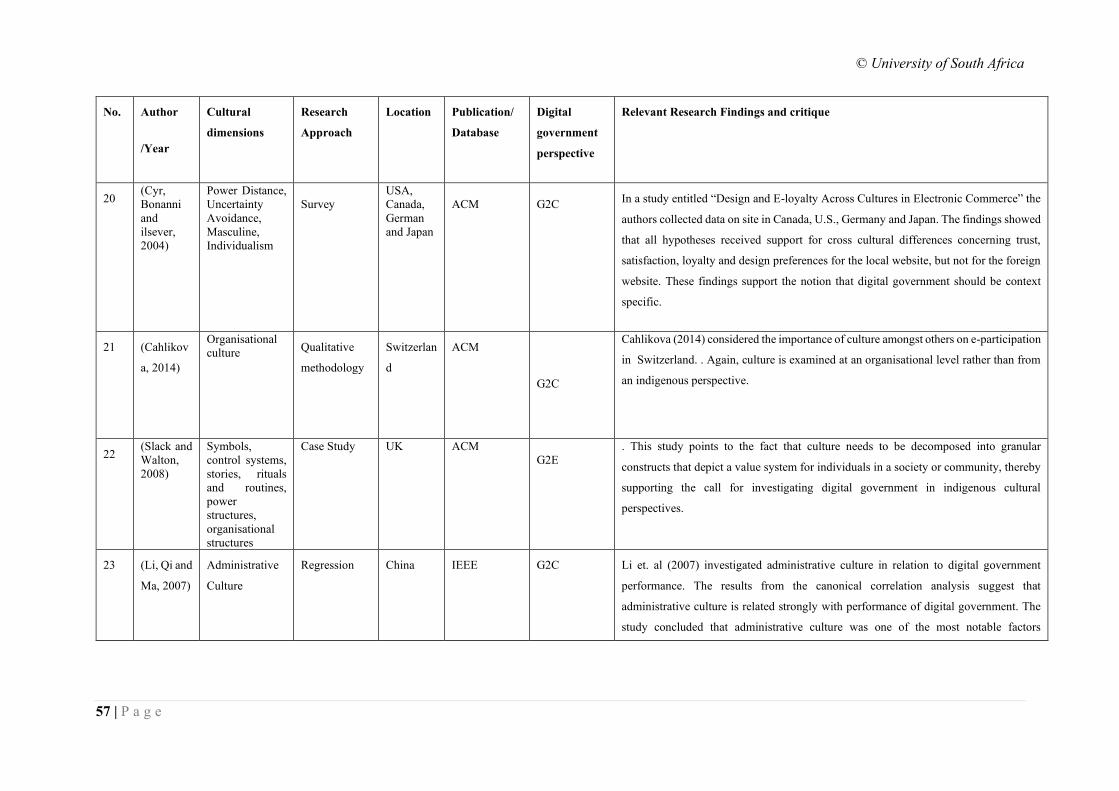
© University of South Africa
57 | P a g e
No. Author
/Year
Cultural
dimensions
Research
Approach
Location Publication/
Database
Digital
government
perspective
Relevant Research Findings and critique
20 (Cyr,
Bonanni
and
ilsever,
2004)
Power Distance,
Uncertainty
Avoidance,
Masculine,
Individualism
Survey
USA,
Canada,
German
and Japan
ACM
G2C In a study entitled “Design and E-loyalty Across Cultures in Electronic Commerce” the
authors collected data on site in Canada, U.S., Germany and Japan. The findings showed
that all hypotheses received support for cross cultural differences concerning trust,
satisfaction, loyalty and design preferences for the local website, but not for the foreign
website. These findings support the notion that digital government should be context
specific.
21 (Cahlikov
a, 2014)
Organisational
culture Qualitative
methodology
Switzerlan
d
ACM
G2C
Cahlikova (2014) considered the importance of culture amongst others on e-participation
in Switzerland. . Again, culture is examined at an organisational level rather than from
an indigenous perspective.
22 (Slack and
Walton,
2008)
Symbols,
control systems,
stories, rituals
and routines,
power
structures,
organisational
structures
Case Study UK ACM
G2E
. This study points to the fact that culture needs to be decomposed into granular
constructs that depict a value system for individuals in a society or community, thereby
supporting the call for investigating digital government in indigenous cultural
perspectives.
23 (Li, Qi and
Ma, 2007)
Administrative
Culture
Regression China IEEE G2C Li et. al (2007) investigated administrative culture in relation to digital government
performance. The results from the canonical correlation analysis suggest that
administrative culture is related strongly with performance of digital government. The
study concluded that administrative culture was one of the most notable factors
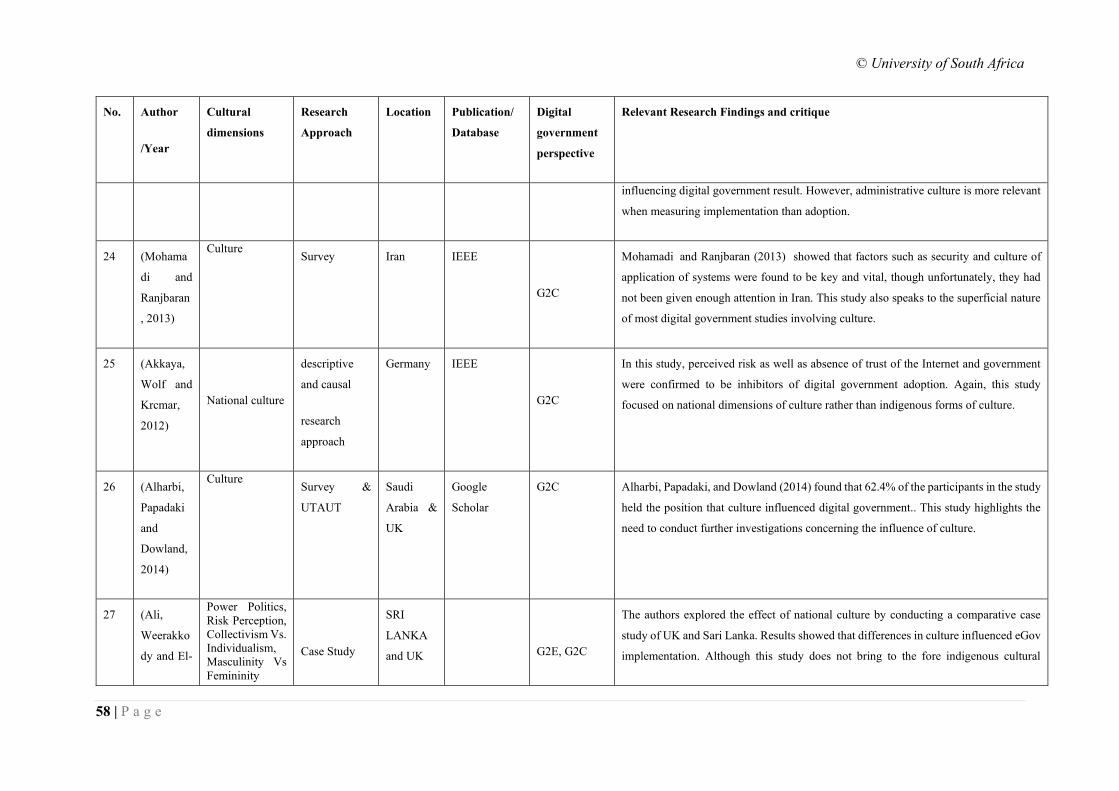
© University of South Africa
58 | P a g e
No. Author
/Year
Cultural
dimensions
Research
Approach
Location Publication/
Database
Digital
government
perspective
Relevant Research Findings and critique
influencing digital government result. However, administrative culture is more relevant
when measuring implementation than adoption.
24 (Mohama
di and
Ranjbaran
, 2013)
Culture Survey Iran IEEE
G2C
Mohamadi and Ranjbaran (2013) showed that factors such as security and culture of
application of systems were found to be key and vital, though unfortunately, they had
not been given enough attention in Iran. This study also speaks to the superficial nature
of most digital government studies involving culture.
25 (Akkaya,
Wolf and
Krcmar,
2012)
National culture
descriptive
and causal
research
approach
Germany IEEE
G2C
In this study, perceived risk as well as absence of trust of the Internet and government
were confirmed to be inhibitors of digital government adoption. Again, this study
focused on national dimensions of culture rather than indigenous forms of culture.
26 (Alharbi,
Papadaki
and
Dowland,
2014)
Culture Survey &
UTAUT
Saudi
Arabia &
UK
Scholar
G2C Alharbi, Papadaki, and Dowland (2014) found that 62.4% of the participants in the study
held the position that culture influenced digital government.. This study highlights the
need to conduct further investigations concerning the influence of culture.
27 (Ali,
Weerakko
dy and El-
Power Politics,
Risk Perception,
Collectivism Vs.
Individualism,
Masculinity Vs
Femininity
Case Study
SRI
LANKA
and UK
G2E, G2C
The authors explored the effect of national culture by conducting a comparative case
study of UK and Sari Lanka. Results showed that differences in culture influenced eGov
implementation. Although this study does not bring to the fore indigenous cultural
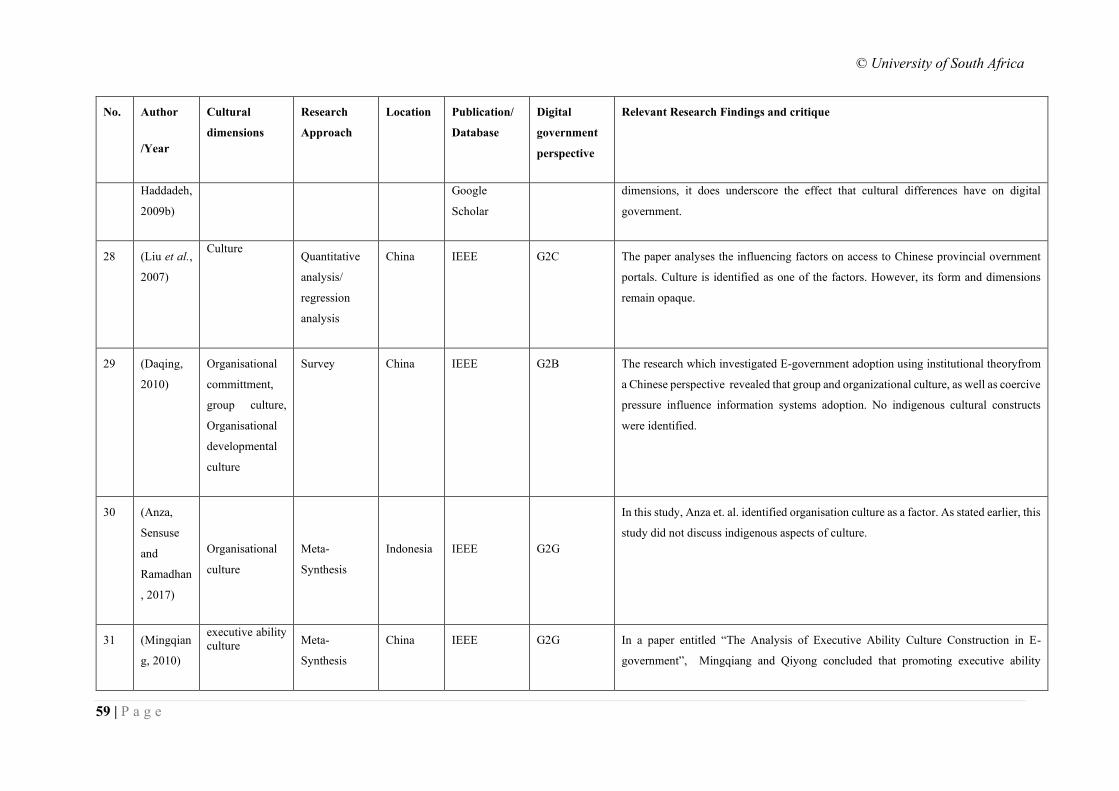
© University of South Africa
59 | P a g e
No. Author
/Year
Cultural
dimensions
Research
Approach
Location Publication/
Database
Digital
government
perspective
Relevant Research Findings and critique
Haddadeh,
2009b)
Scholar
dimensions, it does underscore the effect that cultural differences have on digital
government.
28 (Liu et al.,
2007)
Culture Quantitative
analysis/
regression
analysis
China IEEE G2C The paper analyses the influencing factors on access to Chinese provincial overnment
portals. Culture is identified as one of the factors. However, its form and dimensions
remain opaque.
29 (Daqing,
2010)
Organisational
committment,
group culture,
Organisational
developmental
culture
Survey China IEEE G2B The research which investigated E-government adoption using institutional theoryfrom
a Chinese perspective revealed that group and organizational culture, as well as coercive
pressure influence information systems adoption. No indigenous cultural constructs
were identified.
30 (Anza,
Sensuse
and
Ramadhan
, 2017)
Organisational
culture
Meta-
Synthesis
Indonesia
IEEE
G2G
In this study, Anza et. al. identified organisation culture as a factor. As stated earlier, this
study did not discuss indigenous aspects of culture.
31 (Mingqian
g, 2010)
executive ability
culture Meta-
Synthesis
China IEEE G2G In a paper entitled “The Analysis of Executive Ability Culture Construction in E-
government”, Mingqiang and Qiyong concluded that promoting executive ability
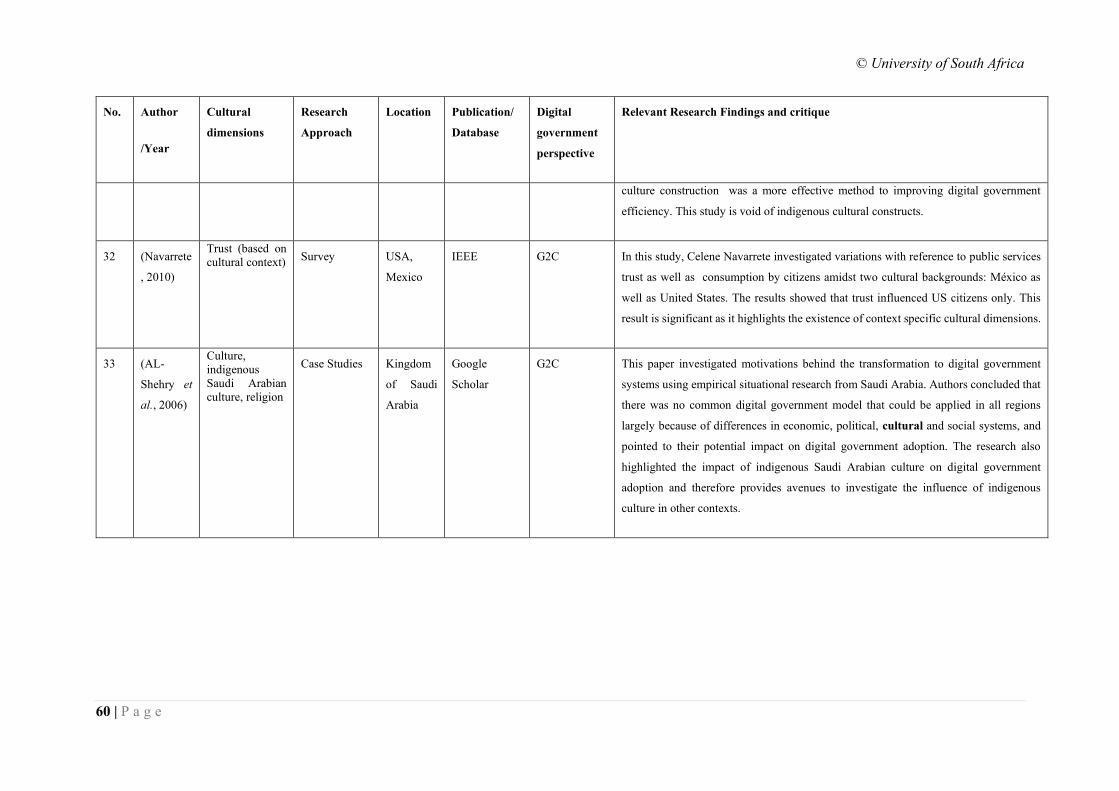
© University of South Africa
60 | P a g e
No. Author
/Year
Cultural
dimensions
Research
Approach
Location Publication/
Database
Digital
government
perspective
Relevant Research Findings and critique
culture construction was a more effective method to improving digital government
efficiency. This study is void of indigenous cultural constructs.
32 (Navarrete
, 2010)
Trust (based on
cultural context) Survey USA,
Mexico
IEEE G2C In this study, Celene Navarrete investigated variations with reference to public services
trust as well as consumption by citizens amidst two cultural backgrounds: México as
well as United States. The results showed that trust influenced US citizens only. This
result is significant as it highlights the existence of context specific cultural dimensions.
33 (AL-
Shehry et
al., 2006)
Culture,
indigenous
Saudi Arabian
culture, religion
Case Studies Kingdom
of Saudi
Arabia
Scholar
G2C This paper investigated motivations behind the transformation to digital government
systems using empirical situational research from Saudi Arabia. Authors concluded that
there was no common digital government model that could be applied in all regions
largely because of differences in economic, political, cultural and social systems, and
pointed to their potential impact on digital government adoption. The research also
highlighted the impact of indigenous Saudi Arabian culture on digital government
adoption and therefore provides avenues to investigate the influence of indigenous
culture in other contexts.
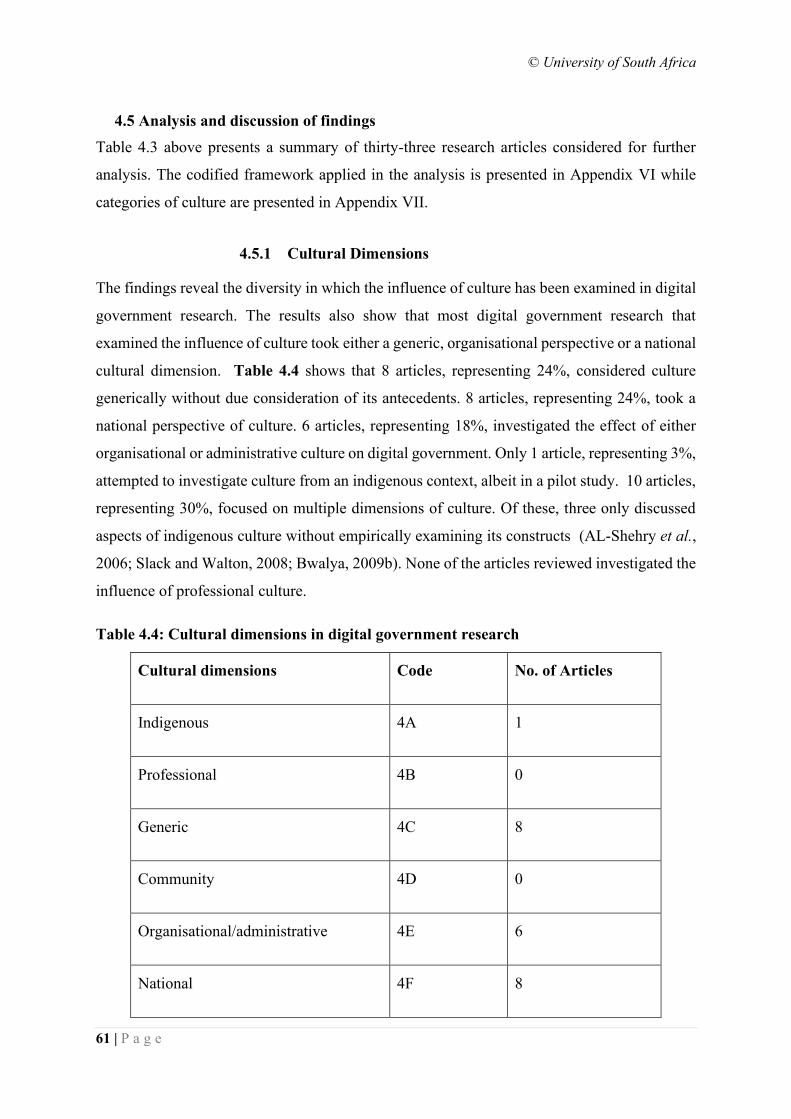
© University of South Africa
61 | P a g e
4.5 Analysis and discussion of findings
Table 4.3 above presents a summary of thirty-three research articles considered for further
analysis. The codified framework applied in the analysis is presented in Appendix VI while
categories of culture are presented in Appendix VII.
4.5.1 Cultural Dimensions
The findings reveal the diversity in which the influence of culture has been examined in digital
government research. The results also show that most digital government research that
examined the influence of culture took either a generic, organisational perspective or a national
cultural dimension. Table 4.4 shows that 8 articles, representing 24%, considered culture
generically without due consideration of its antecedents. 8 articles, representing 24%, took a
national perspective of culture. 6 articles, representing 18%, investigated the effect of either
organisational or administrative culture on digital government. Only 1 article, representing 3%,
attempted to investigate culture from an indigenous context, albeit in a pilot study. 10 articles,
representing 30%, focused on multiple dimensions of culture. Of these, three only discussed
aspects of indigenous culture without empirically examining its constructs (AL-Shehry et al.,
2006; Slack and Walton, 2008; Bwalya, 2009b). None of the articles reviewed investigated the
influence of professional culture.
Table 4.4: Cultural dimensions in digital government research
Cultural dimensions Code No. of Articles
Indigenous 4A 1
Professional 4B 0
Generic 4C 8
Community 4D 0
Organisational/administrative 4E 6
National 4F 8
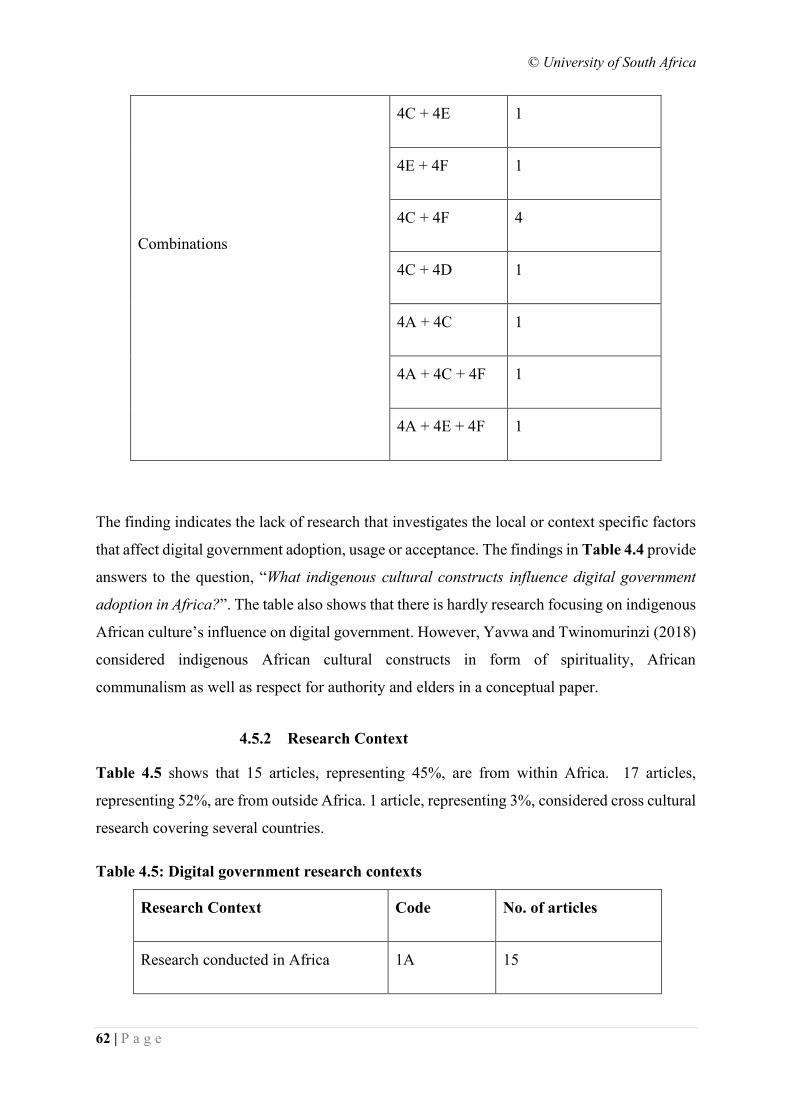
© University of South Africa
62 | P a g e
Combinations
4C + 4E 1
4E + 4F 1
4C + 4F 4
4C + 4D 1
4A + 4C 1
4A + 4C + 4F 1
4A + 4E + 4F 1
The finding indicates the lack of research that investigates the local or context specific factors
that affect digital government adoption, usage or acceptance. The findings in Table 4.4 provide
answers to the question, “What indigenous cultural constructs influence digital government
adoption in Africa?”. The table also shows that there is hardly research focusing on indigenous
African culture’s influence on digital government. However, Yavwa and Twinomurinzi (2018)
considered indigenous African cultural constructs in form of spirituality, African
communalism as well as respect for authority and elders in a conceptual paper.
4.5.2 Research Context
Table 4.5 shows that 15 articles, representing 45%, are from within Africa. 17 articles,
representing 52%, are from outside Africa. 1 article, representing 3%, considered cross cultural
research covering several countries.
Table 4.5: Digital government research contexts
Research Context Code No. of articles
Research conducted in Africa 1A 15
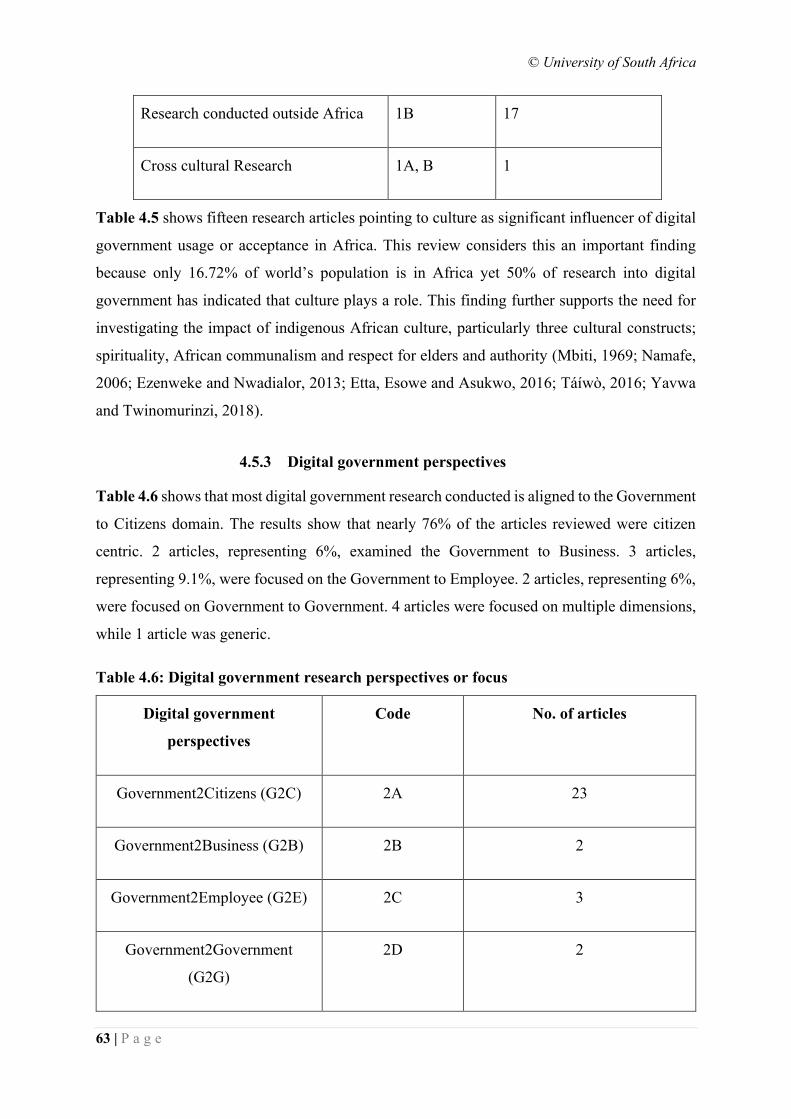
© University of South Africa
63 | P a g e
Research conducted outside Africa 1B 17
Cross cultural Research 1A, B 1
Table 4.5 shows fifteen research articles pointing to culture as significant influencer of digital
government usage or acceptance in Africa. This review considers this an important finding
because only 16.72% of world’s population is in Africa yet 50% of research into digital
government has indicated that culture plays a role. This finding further supports the need for
investigating the impact of indigenous African culture, particularly three cultural constructs;
spirituality, African communalism and respect for elders and authority (Mbiti, 1969; Namafe,
2006; Ezenweke and Nwadialor, 2013; Etta, Esowe and Asukwo, 2016; Táíwò, 2016; Yavwa
and Twinomurinzi, 2018).
4.5.3 Digital government perspectives
Table 4.6 shows that most digital government research conducted is aligned to the Government
to Citizens domain. The results show that nearly 76% of the articles reviewed were citizen
centric. 2 articles, representing 6%, examined the Government to Business. 3 articles,
representing 9.1%, were focused on the Government to Employee. 2 articles, representing 6%,
were focused on Government to Government. 4 articles were focused on multiple dimensions,
while 1 article was generic.
Table 4.6: Digital government research perspectives or focus
Digital government
perspectives
Code No. of articles
Government2Citizens (G2C) 2A 23
Government2Business (G2B) 2B 2
Government2Employee (G2E) 2C 3
Government2Government
(G2G)
2D 2
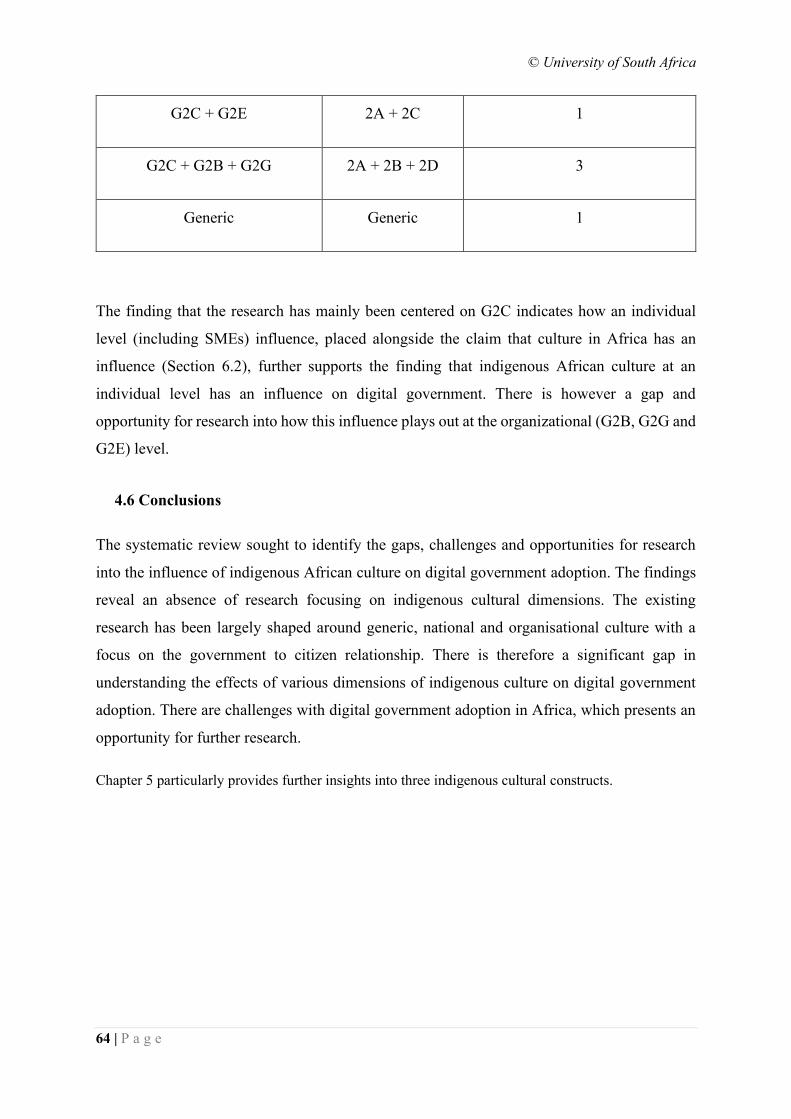
© University of South Africa
64 | P a g e
G2C + G2E 2A + 2C 1
G2C + G2B + G2G 2A + 2B + 2D 3
Generic Generic 1
The finding that the research has mainly been centered on G2C indicates how an individual
level (including SMEs) influence, placed alongside the claim that culture in Africa has an
influence (Section 6.2), further supports the finding that indigenous African culture at an
individual level has an influence on digital government. There is however a gap and
opportunity for research into how this influence plays out at the organizational (G2B, G2G and
G2E) level.
4.6 Conclusions
The systematic review sought to identify the gaps, challenges and opportunities for research
into the influence of indigenous African culture on digital government adoption. The findings
reveal an absence of research focusing on indigenous cultural dimensions. The existing
research has been largely shaped around generic, national and organisational culture with a
focus on the government to citizen relationship. There is therefore a significant gap in
understanding the effects of various dimensions of indigenous culture on digital government
adoption. There are challenges with digital government adoption in Africa, which presents an
opportunity for further research.
Chapter 5 particularly provides further insights into three indigenous cultural constructs.
© University of South Africa
65 | P a g e
CHAPTER 5
5. INDIGENOUS AFRICAN CULTURE: SPIRITUALITY,
COMMUNALISM AND RESPECT
Chapters 1-4 focused on problem definition, provided the context of this study, provided
literature on digital government, internet access and culture, and also through a systematic
review, highlighted extant gaps on cultural dimensions affecting the adoption of digital
government in an African context. This chapter amplifies dimensions indigenous to African
culture which include spirituality, communalism and respect for authority and elders.
5.1 Introduction
Chapter 3 revealed that culture is multi-dimensional and context specific. Contextualised
cultural dimensions that form the core of indigenous African culture were brought to the fore.
This chapter discusses the three key indigenous African cultural constructs; spirituality,
communalism and respect for elders and authority. These constructs highlight the lived reality
of the African people and bring to the surface their perceived effect on the development of
digital government in African societies.
5.2 Spirituality
Spirituality defines the essence of humanity. There is a close relationship between spirituality
and religion (Ali, Weerakkody and El-Haddadeh, 2009b) inherited beliefs as well as
superstition (Omobola, 2013). Spirituality dictates one’s behaviour in society and provides
boundary conditions for such behaviour. It can take a specific context such as spiritual health,
spiritual intelligence or spiritual self-consciousness (Giacalone and Jurkiewicz, 2003).
Spiritual self-consciousness, which focuses on personal spirituality, is considered for its
moderating and mediating influence on the adoption of digital government. Personal
spirituality allows an individual to have a sense of the sacred without necessarily having the
institutional practices and limitations that are associated with religion.
5.2.1 Spirituality Defined
Spirituality is defined as a belief in unseen forces that govern over existence and being
(Principe, 1983). The terms ‘spirituality’ and ‘religion’ are usually seen as complementary and
are used interchangeably, yet they have some important distinctions (Oman, 2013). Spirituality
© University of South Africa
66 | P a g e
is differentiated from religion, religion being the response of individuals to a belief in an unseen
force (Principe, 1983; Bregman, 2004). Spirituality therefore has both cultural and social
framings that determine the attitudes, beliefs and practices that influence individuals’ lives
(Gumo et al., 2012). From the African context, deeper values, attitudes, beliefs and practices
are articulated and shaped by African contexts.
Spirituality is a universal concept that represents experiences, attitudes, memories and a
mysterious consciousness of the connection between different realities (Hoogen, 2014).
Spirituality has also been defined as being a cultural spirit, communicating fundamental tenets
exhibited by that culture (Cilliers, 2009). Scholars advocate the inclusion of the sacred or
transcendent as part of spirituality when the influence of spirituality is investigated (Swart,
2017). Tanyi (2002) describes spirituality as comprising religion combined with indigenous
beliefs and values. Spirituality, when seen as part of culture (Hoogen, 2014), includes one’s
recognition of extant inward feelings as well as beliefs, that offer purpose, direction and
worthiness to life (Fisher, 2011). Individuals express these feelings and beliefs through
religious values, rituals, ceremonies and traditional practices (Tanyi, 2002), which serve as an
embodiment of their identity.
5.2.2 The Importance of Spirituality
Many scholars who have investigated effect of culture on digital government (Gallivan and
Srite, 2005; Weerakkody, Dwivedi and Kurunananda, 2009; Choudrie et al., 2017) examined
culture based on Hofstede’s (1980) national cultural dimensions (Nadi, 2012a). These studies
overlook the lived reality of indigenous culture and the associated values and belief systems
such as the spirituality of individuals in a given society or region (Schein, 1984; Leung et al.,
2005). For example, attention is being drawn to spirituality and its influence on other
disciplines, such as healthcare (Hovland, Niederriter and Thoman, 2018; Mesquita et al., 2018;
Nahardani et al., 2019) and management (Mishra and Varma, 2019). In this section, the
attention is placed on the indigenous values and belief systems that define spirituality in
African local contexts and their impact on digital government adoption.
The influence of African spirituality on everyday work practices is best described in the
following quote: “Wherever the African is, there is his religion: he carries it to the fields where
he is sowing seeds or harvesting a new crop; he takes it with him to the beer party or to attend
a funeral ceremony; and if he is educated, he takes religion with him to the examination room
© University of South Africa
67 | P a g e
at school or in the university; if he is a politician, he takes it to the house of parliament” (Mbiti,
1969). For example, the Zambian (African) adage, “Vula kasendekela musha mutondo, mutu
anamonomo”, literally meaning, “if the rain gets heavy under a tree, then it has sensed the
presence of a human being”, depicts a belief system rooted in African spirituality, where a
person who experiences unexplained realities attributes them to superstition. The lived realities
of spirituality have the potential to influence behaviour towards or against acceptance of
modern technologies like digital government.
5.2.3 The How of Spirituality
As outlined in Section 4.2.2, spirituality is embedded in belief systems practised by individuals
in African communities. In order to measure its influence, attributes of spirituality were
identified. The following attributes of spirituality as a construct (Tanyi, 2002; Kadar et al.,
2015) were investigated in the study:
• Turning to ancestral practices to deal with situations that are not understood.
• Turning to God for answers to challenging situations.
• Pursuing interests that are beyond self.
• Understanding importance of one’s deeds.
• Cultivating holistic inter-personal relationships.
The study hypothesised that such attributes have the potential to influence digital government
adoption.
5.3 Communalism
Communalism involves integration of shared possession as well as amalgamations of
extremely localized sovereign communities (Etta, Esowe and Asukwo, 2016). The basis of the
federation being common traditions, values, practices and social structures. In this
configuration, individuals constitute the socio-political environment which promotes strong
allegiance to socially constituted clique to which one belongs based on sharing history and
cultures characterized by collective cooperation.
Communalism can also be viewed as a universal philosophy. The aphorism “a minute fire is
soon quenched” from the East emphasizes a sense of community affection. Communalism in
the Chinese environment in which individuals contend for facilities, power, social as well as
economic acceptance arises from pressures to conform to community norms (Daqing, 2010).
© University of South Africa
68 | P a g e
These pressures are either coercive, mimetic or normative. Coercive pressure is either superior
coercive pressure, where individuals feel coerced to perform a behaviour influenced by
authority or Information System coercive pressure, where individuals are influenced by user
satisfaction. In communalism, individuals are also influenced by mimetic pressure arising from
a position of uncertainty. Normative pressure stems from a system of rationally ordered rules,
norms and customs to which individuals feel obliged to conform, a phenomenon closely
associated with society affection (Davison, Ou and Martinsons, 2018). These coercive, mimetic
or normative pressures are also expressed in an African context albeit with varying dimensions.
5.3.1 African Communalism Defined
African Communalism is defined as a contextual force that is both an African conceptual
framework and a set of cultural practices (Etta, Esowe and Asukwo, 2016) that prioritise the
role and function of the collective group over the individual (M’Baye and Ikuenobe, 2007).
The aphorisms “it takes a village to raise a child”, “a man outside his clan is like a grasshopper
that has its wings plucked”, “Mwafwa mukula mwasalakana muyombo” meaning that when a
village headman dies, his nephew or his grandchild inherits the throne so that heritage is passed
on to future generations, are all aspects of African communalism with a potential to influence
behaviour.
Similarly, the South African aphorism “Umuntu ngumuntu ngabantu” meaning “a person is a
person through other persons” (Cilliers, 2009) fosters a sense of dependence, which speaks to
the concept of communalism. One’s actions are largely influenced by other people. In the
notion of Ubuntu, the spirit of African communalism is epitomized (Etta, Esowe and Asukwo,
2016). The community is accorded a higher estimation than the individual. “Man is man not
on account of his colour or religion, but because he acts and lives in the community”(Etta,
Esowe and Asukwo, 2016). Scholars argue that communalism does not deprive the individual
of his rights and interests except when these are at variance with those of the community
(Oliver, Ezebui and Ojiakor, 2016). This notion juxtaposes true individualism and strengthens
the concept of African communalism, which potentially affects digital government adoption.
African Communalism (Agulanna, 2010) depicts an orientation based on communal life.
People congregate in communal places and village shrines for social, political, judicial and
religious tutelage. In relatively advanced social settings, individuals share their views, ideas
and belief systems using social media. They model their behaviour to society norms, i.e. society
© University of South Africa
69 | P a g e
takes on a form of possessor of an individual’s beliefs as well as conduct, providing emotional
and perceived security. Thereby, the society turns out to be a fountain for one’s socio-political
identity (Kanu, 2010). African communalism emphasizes community life as a living principle
of which the basic ideology is community identity. It is this identity that influences individuals
to align themselves with the interests of their own minority, ethnic or social group rather than
those of the nation as a whole. The alignment of one’s interests gives rise to social cohesion
whereby individuals in the society consistently pursue fundamental virtues on the basis of
advancing a common or social good. African communalism is also conceptualised as a social
structure that pervades traditions, values and practices in African contexts in which every
member voluntarily cooperates.
5.3.2 The Importance of African Communalism
As stated earlier, many studies overlook the lived reality of indigenous culture and the
associated values and belief systems embedded in indigenous African cultural constructs such
as communalism. African communalism has a great influence on its members. Literature
reveals that individuals are perceived to sieve, incorporate information received and align their
own beliefs accordingly when dealing with issues (Moussaıd et al., 2013). The alignment of
one’s beliefs to those of others or the community strengthens the hypothesis that communalism
moderates and mediates an individual’s conduct. This research therefore empirically
investigates influence of communalism on digital government adoption.
5.3.3 The How of African Communalism
African Communalism was examined for its moderating and mediating effects by considering
the following sub constructs:
• One’s alignment to communal life
o Communal interactions or interactions with others encourage me
• Community norms,
o Sharing community norms and values
• Allegiance to one’s own ethnic group rather than to the wider society or nation
o The community has a great impact on my will to perform an action
o Community norms and values are part of me.
Scholars have identified merits of African communalism (Etta, Esowe and Asukwo, 2016) as:
© University of South Africa
70 | P a g e
• Guaranteeing individual’s responsibility within the community
Promoting the ethics of mutual help and of caring for each other
• Promoting community spirit – meaning that the community is esteemed more than an
individual
• Enhancing internal security arising from the bond of unity and togetherness
• The whole African society is seen as a living network of relations
African communalism has been viewed as part of the obstacles to Africa’s economic success
(Etta, Esowe and Asukwo, 2016). “Outsiders” are regarded as enemies. They are not integrated
into communities regardless of their contribution to the community. Outsiders therefore seek
alternative places where the sense of communalism is not strong.
5.4 Respect for Elders and Authority
The presence of the construct “respect” has been inferred in many research areas. There is
hardly a standard meaning respect, thus creating bottlenecks in comprehending its place in
digital government. Several explanations or meanings of respect in different fields have been
coined, raising speculations about the form and nature of the construct, Respect (Dillon, 2007;
Rogers and Ashforth, 2017).
Scholars in different fields differentiate respect from two perspectives; grounded on humanity
and on socially valued attributes (Rogers and Ashforth, 2017), which gives rise to two types of
respect; “recognition respect” and “appraisal respect.” African tradition places emphasis on
recognition respect more than appraisal respect (Ezenweke and Nwadialor, 2013). A person in
authority is recognized as being in that position as a result of an act of a superior being. In a
similar vein, an elderly person is respected and looked at as a source of wisdom.
Those in authority including chiefs are sometimes referred to as ‘owners of power’ signifying
their leadership role in community (Walsh et al., 2018). This form of Respect for those in
authority has the potential to influence behaviour. Mianzi, from the concept of guanxi is a
specific Eastern construct referring to respect for authority (Davison, Ou and Martinsons,
2018).
5.4.1 Respect for Authority and Elders in an African Context
Respect denotes the value given to an individual by other individuals(Rogers and Ashforth,
2017). It is a resilient construct in an African cultural perspective (Banda, 2012). Africans are
© University of South Africa
71 | P a g e
educated to respect peers, older people as well as authority. Respect for older people, human
kind, as well as authority is strongly associated with African and more specifically Zambian
culture (Banda, 2012). The manifestation of respect is in the form of salutations as well as
address. It is expressed by kneeling down and clapping several times, nodding one’s head and
mentioning a chain of words as a form of greeting (Banda, 2012). Respect moderates the
relationship between people and how they carry out instructions as well as regulations. Respect
and the pressure to obey instructions from elders and authority are inextricably linked.
It is hypothesized that respect moderates and mediates one’s behavioural intention to perform
an action. Respect is termed to be a kingpin cultural construct (Namafe, 2006). In Zambia
(Namafe, 2006), Several terms such as thoughtfulness, honour, courtesy, favour, care, support,
relationship, mutuality, obedience and being dutybound denote respect. Respect is portrayed
as the invigorating principle (Namafe, 2006). It is the invigorating aspects of support,
relationship, obedience and being dutybound that give respect influencing attributes.
5.4.2 The Importance of Respect for Elders and Authority
This study seeks to stir theory forward concerning how respect from an indigenous African
context moderates and mediates behavior. First, the study lays a basis regarding the meaning
of respect from an indigenous African perspective. Second, given multidimensional nature of
respect, the study also seeks to develop theory which defines foundations of respect for elders
as well as authority. SMEs greatly value respect for elders and authority because it satisfies
their specific needs drawn from traditional values and practices (Choudrie, Umeoji and Forson,
2012).
5.4.3 The How of Respect for Elders and Authority
In order to measure the influence of respect for elders and authority, its attributes were
identified. The following attributes of respect were therefore investigated for a moderating and
mediating influence:
• Respect for authority
o When the authority requests me to perform an action, I obey
• Respect for elders
o When the elders request me to perform an action, I obey
• Respect for childhood peers
© University of South Africa
72 | P a g e
o When my peers request me to perform an action, I obey
• Respect for fellow human beings
o When my fellow human beings request me to perform an action, I obey
5.5 Conclusion
This chapter decomposed indigenous African culture into three major constituents namely
spirituality, African communalism and respect for elders and authority that illustrate the lived
reality of African people. The chapter also provided sub constructs that build up into question
items used for the investigation.
The next chapter provides a country perspective in terms of digital government, the existing
indigenous culture and the infrastructure that supports internet.
© University of South Africa
73 | P a g e
CHAPTER 6
6. THEORETICAL UNDERPINING
6.1 Introduction
Chapter 5 presented a deeper insight into indigenous African culture and defined its
constituents comprising spirituality, African communalism and respect for elders and authority
whose impact is being investigated.
This chapter provides background knowledge of the Information Systems theories that build
up to Unified Theory of Acceptance and Use of Technologies (UTAUT). UTAUT is used to
investigate the influence of African culture and internet access on the adoption of e-Filing, e-
payment of taxes and other digital government services in Zambia. UTAUT is a derivative of
eight synthesized Information Systems theoretical models (Alawadhi and Morris, 2008; Chen,
2013), which include Theory of Reasoned Action (TRA) (Madden, Ellen and Ajzen, 1992),
Theory of Planned Behaviour (TPB) (Ajzen, 1991a; Madden, Ellen and Ajzen, 1992),
Technology Acceptance Model (TAM) (Davis, 1986), Motivational Model (MM) (Guiffrida et
al., 2013), model Combining the Technology Acceptance Model and Theory of Planned
Behaviour (C-TAM-TPB) (Chen, 2013), Diffusion of Innovation (DoI) (Rogers, 2002), Social
Cognitive Theory (SCT) (Compeau, Higgins and Huff, 1999) and Model of PC Utilization
(MPCU) (AlAwadhi and Morris, 2009).
6.2 Theory of Reasoned Action
TRA predicts behavioural intention to perform a specified action such as implement, adopt or
use information technologies. It is one of the most fundamental, influential and highly cited
(Woosley, 2011) theories of human behaviour. It is anchored on two core constructs; attitude
towards behaviour and subjective norm (Henle and Michael, 1956). The theory argues that
salient beliefs and perceived social pressures are the reason for one’s intention towards a
specific behaviour (Otieno et al., 2016). The theory helps individuals and institutions to
implement their intentions by overcoming obstacles that inhibit performing the behaviour. The
theory positively influences intention. The salient beliefs antecedent to intention are either
behavioural or normative (Henle and Michael, 1956; Otieno et al., 2016). Behavioural beliefs
are hypothesized to be the underlying influence on attitude to perform a behaviour. On the other
hand, normative value systems impact an individual’s subjective norm to perform the
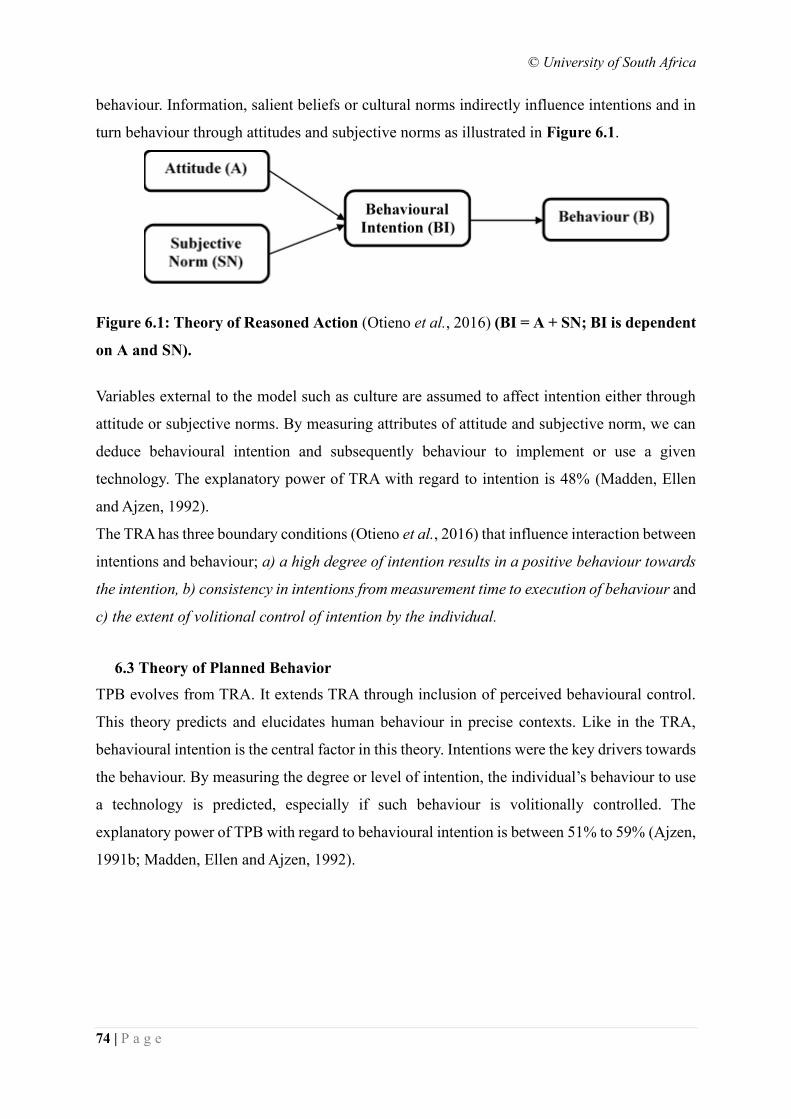
© University of South Africa
74 | P a g e
behaviour. Information, salient beliefs or cultural norms indirectly influence intentions and in
turn behaviour through attitudes and subjective norms as illustrated in Figure 6.1.
Figure 6.1: Theory of Reasoned Action (Otieno et al., 2016) (BI = A + SN; BI is dependent
on A and SN).
Variables external to the model such as culture are assumed to affect intention either through
attitude or subjective norms. By measuring attributes of attitude and subjective norm, we can
deduce behavioural intention and subsequently behaviour to implement or use a given
technology. The explanatory power of TRA with regard to intention is 48% (Madden, Ellen
and Ajzen, 1992).
The TRA has three boundary conditions (Otieno et al., 2016) that influence interaction between
intentions and behaviour; a) a high degree of intention results in a positive behaviour towards
the intention, b) consistency in intentions from measurement time to execution of behaviour and
c) the extent of volitional control of intention by the individual.
6.3 Theory of Planned Behavior
TPB evolves from TRA. It extends TRA through inclusion of perceived behavioural control.
This theory predicts and elucidates human behaviour in precise contexts. Like in the TRA,
behavioural intention is the central factor in this theory. Intentions were the key drivers towards
the behaviour. By measuring the degree or level of intention, the individual’s behaviour to use
a technology is predicted, especially if such behaviour is volitionally controlled. The
explanatory power of TPB with regard to behavioural intention is between 51% to 59% (Ajzen,
1991b; Madden, Ellen and Ajzen, 1992).
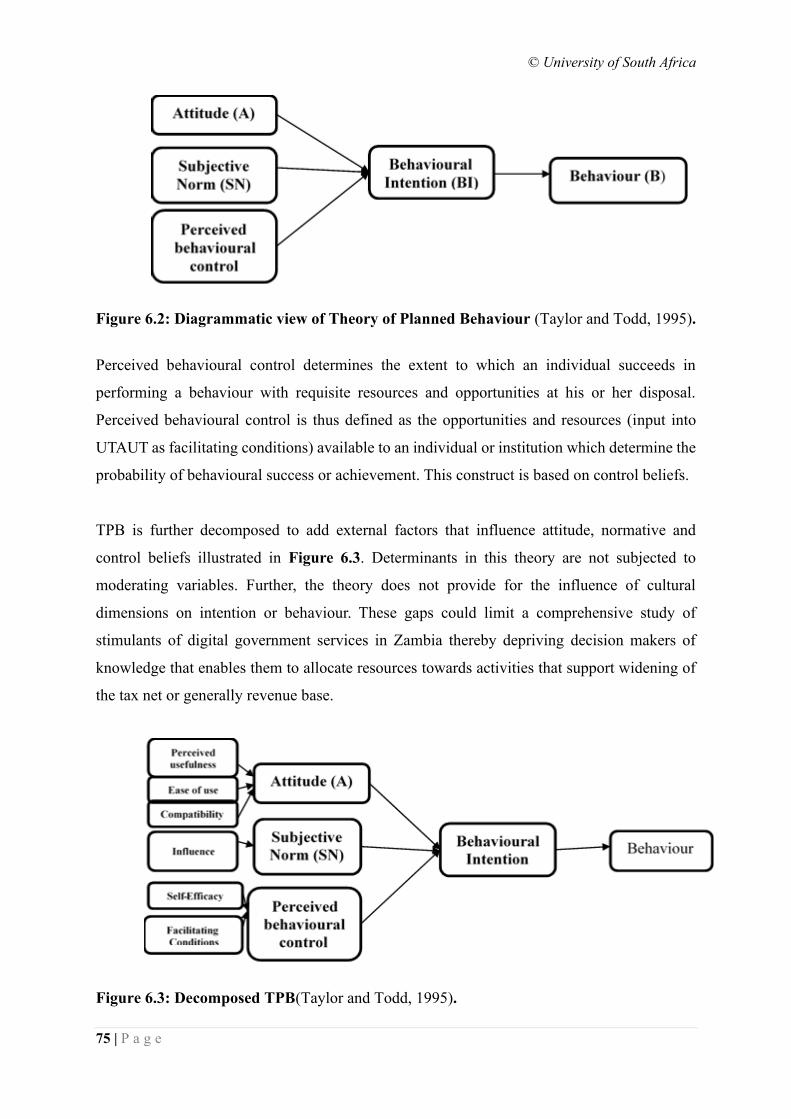
© University of South Africa
75 | P a g e
Figure 6.2: Diagrammatic view of Theory of Planned Behaviour (Taylor and Todd, 1995).
Perceived behavioural control determines the extent to which an individual succeeds in
performing a behaviour with requisite resources and opportunities at his or her disposal.
Perceived behavioural control is thus defined as the opportunities and resources (input into
UTAUT as facilitating conditions) available to an individual or institution which determine the
probability of behavioural success or achievement. This construct is based on control beliefs.
TPB is further decomposed to add external factors that influence attitude, normative and
control beliefs illustrated in Figure 6.3. Determinants in this theory are not subjected to
moderating variables. Further, the theory does not provide for the influence of cultural
dimensions on intention or behaviour. These gaps could limit a comprehensive study of
stimulants of digital government services in Zambia thereby depriving decision makers of
knowledge that enables them to allocate resources towards activities that support widening of
the tax net or generally revenue base.
Figure 6.3: Decomposed TPB(Taylor and Todd, 1995).
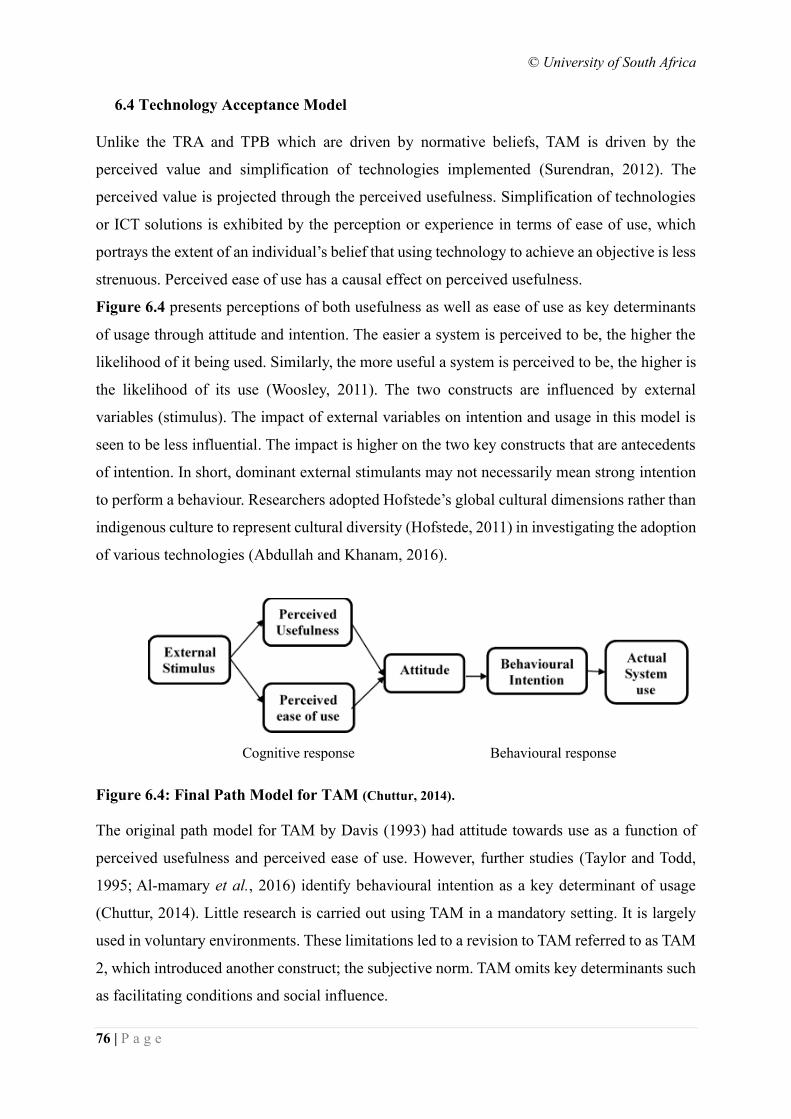
© University of South Africa
76 | P a g e
6.4 Technology Acceptance Model
Unlike the TRA and TPB which are driven by normative beliefs, TAM is driven by the
perceived value and simplification of technologies implemented (Surendran, 2012). The
perceived value is projected through the perceived usefulness. Simplification of technologies
or ICT solutions is exhibited by the perception or experience in terms of ease of use, which
portrays the extent of an individual’s belief that using technology to achieve an objective is less
strenuous. Perceived ease of use has a causal effect on perceived usefulness.
Figure 6.4 presents perceptions of both usefulness as well as ease of use as key determinants
of usage through attitude and intention. The easier a system is perceived to be, the higher the
likelihood of it being used. Similarly, the more useful a system is perceived to be, the higher is
the likelihood of its use (Woosley, 2011). The two constructs are influenced by external
variables (stimulus). The impact of external variables on intention and usage in this model is
seen to be less influential. The impact is higher on the two key constructs that are antecedents
of intention. In short, dominant external stimulants may not necessarily mean strong intention
to perform a behaviour. Researchers adopted Hofstede’s global cultural dimensions rather than
indigenous culture to represent cultural diversity (Hofstede, 2011) in investigating the adoption
of various technologies (Abdullah and Khanam, 2016).
Cognitive response Behavioural response
Figure 6.4: Final Path Model for TAM (Chuttur, 2014).
The original path model for TAM by Davis (1993) had attitude towards use as a function of
perceived usefulness and perceived ease of use. However, further studies (Taylor and Todd,
1995; Al-mamary et al., 2016) identify behavioural intention as a key determinant of usage
(Chuttur, 2014). Little research is carried out using TAM in a mandatory setting. It is largely
used in voluntary environments. These limitations led to a revision to TAM referred to as TAM
2, which introduced another construct; the subjective norm. TAM omits key determinants such
as facilitating conditions and social influence.
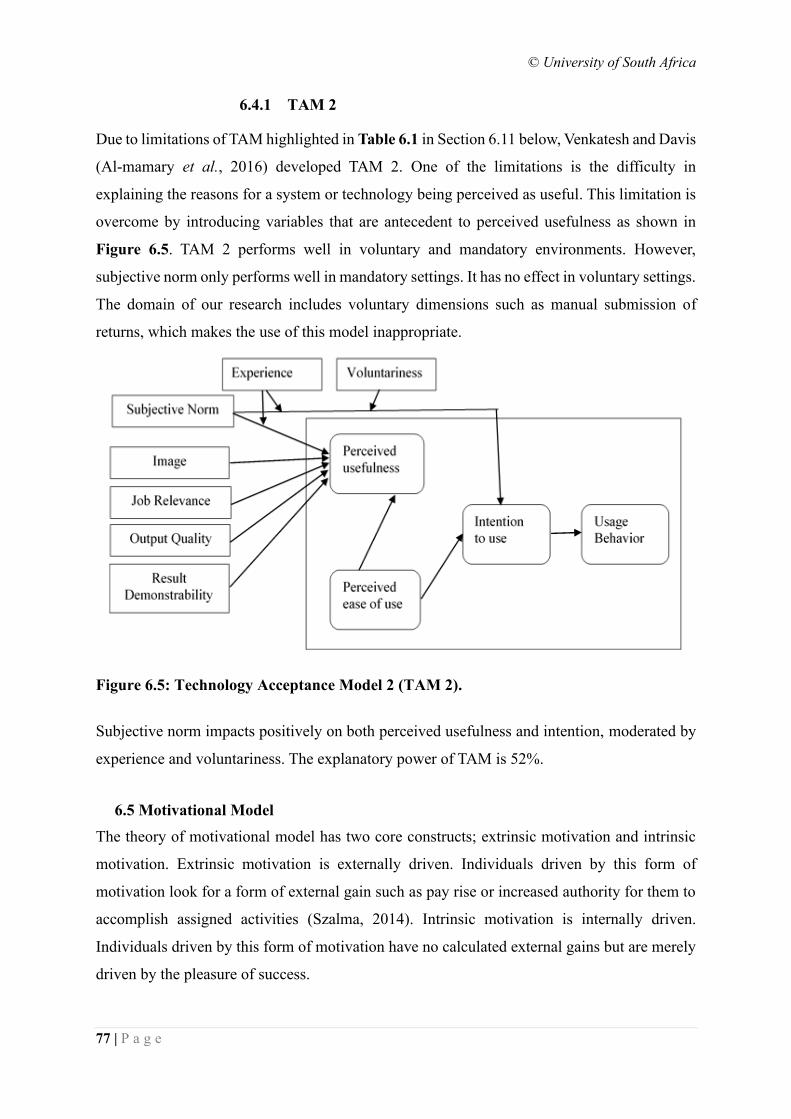
© University of South Africa
77 | P a g e
6.4.1 TAM 2
Due to limitations of TAM highlighted in Table 6.1 in Section 6.11 below, Venkatesh and Davis
(Al-mamary et al., 2016) developed TAM 2. One of the limitations is the difficulty in
explaining the reasons for a system or technology being perceived as useful. This limitation is
overcome by introducing variables that are antecedent to perceived usefulness as shown in
Figure 6.5. TAM 2 performs well in voluntary and mandatory environments. However,
subjective norm only performs well in mandatory settings. It has no effect in voluntary settings.
The domain of our research includes voluntary dimensions such as manual submission of
returns, which makes the use of this model inappropriate.
Figure 6.5: Technology Acceptance Model 2 (TAM 2).
Subjective norm impacts positively on both perceived usefulness and intention, moderated by
experience and voluntariness. The explanatory power of TAM is 52%.
6.5 Motivational Model
The theory of motivational model has two core constructs; extrinsic motivation and intrinsic
motivation. Extrinsic motivation is externally driven. Individuals driven by this form of
motivation look for a form of external gain such as pay rise or increased authority for them to
accomplish assigned activities (Szalma, 2014). Intrinsic motivation is internally driven.
Individuals driven by this form of motivation have no calculated external gains but are merely
driven by the pleasure of success.
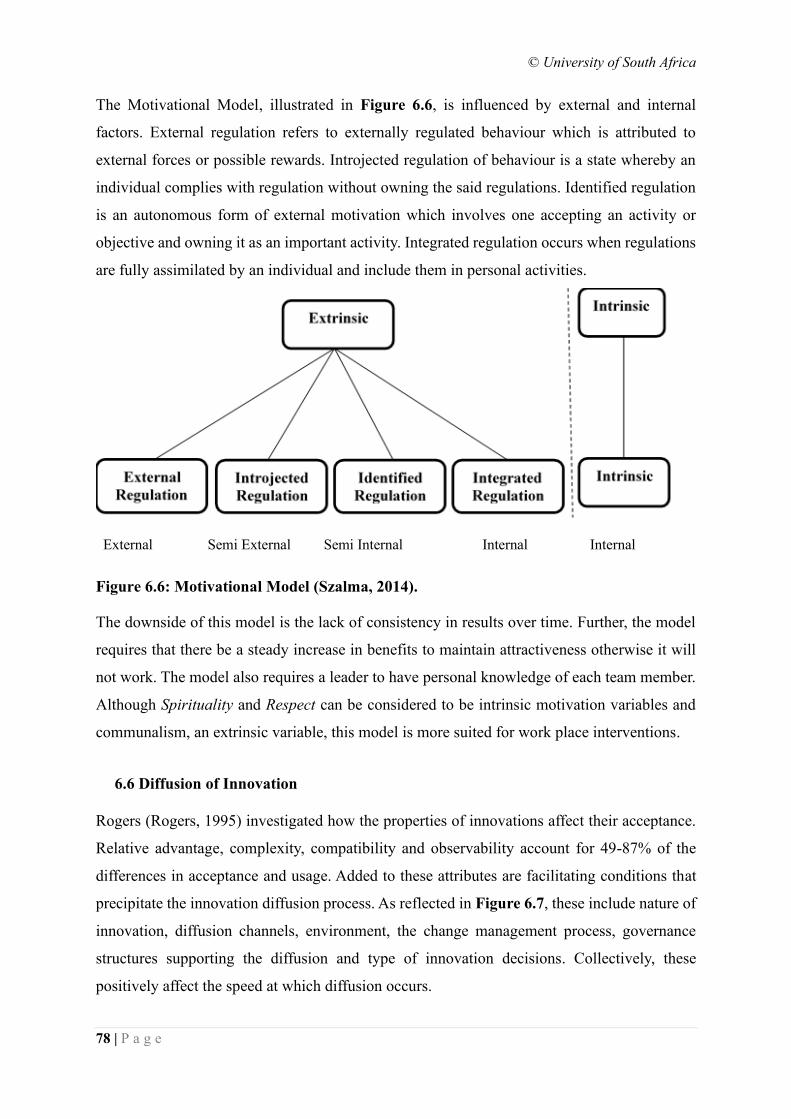
© University of South Africa
78 | P a g e
The Motivational Model, illustrated in Figure 6.6, is influenced by external and internal
factors. External regulation refers to externally regulated behaviour which is attributed to
external forces or possible rewards. Introjected regulation of behaviour is a state whereby an
individual complies with regulation without owning the said regulations. Identified regulation
is an autonomous form of external motivation which involves one accepting an activity or
objective and owning it as an important activity. Integrated regulation occurs when regulations
are fully assimilated by an individual and include them in personal activities.
External Semi External Semi Internal Internal Internal
Figure 6.6: Motivational Model (Szalma, 2014).
The downside of this model is the lack of consistency in results over time. Further, the model
requires that there be a steady increase in benefits to maintain attractiveness otherwise it will
not work. The model also requires a leader to have personal knowledge of each team member.
Although Spirituality and Respect can be considered to be intrinsic motivation variables and
communalism, an extrinsic variable, this model is more suited for work place interventions.
6.6 Diffusion of Innovation
Rogers (Rogers, 1995) investigated how the properties of innovations affect their acceptance.
Relative advantage, complexity, compatibility and observability account for 49-87% of the
differences in acceptance and usage. Added to these attributes are facilitating conditions that
precipitate the innovation diffusion process. As reflected in Figure 6.7, these include nature of
innovation, diffusion channels, environment, the change management process, governance
structures supporting the diffusion and type of innovation decisions. Collectively, these
positively affect the speed at which diffusion occurs.
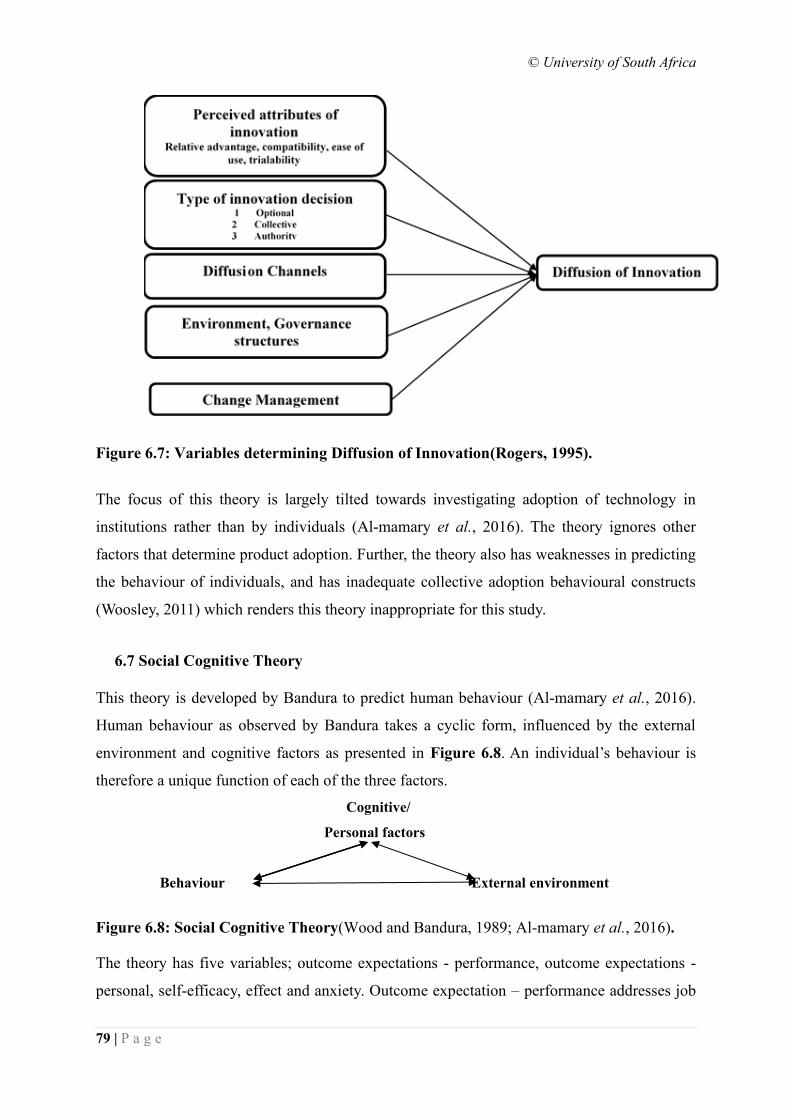
© University of South Africa
79 | P a g e
Figure 6.7: Variables determining Diffusion of Innovation(Rogers, 1995).
The focus of this theory is largely tilted towards investigating adoption of technology in
institutions rather than by individuals (Al-mamary et al., 2016). The theory ignores other
factors that determine product adoption. Further, the theory also has weaknesses in predicting
the behaviour of individuals, and has inadequate collective adoption behavioural constructs
(Woosley, 2011) which renders this theory inappropriate for this study.
6.7 Social Cognitive Theory
This theory is developed by Bandura to predict human behaviour (Al-mamary et al., 2016).
Human behaviour as observed by Bandura takes a cyclic form, influenced by the external
environment and cognitive factors as presented in Figure 6.8. An individual’s behaviour is
therefore a unique function of each of the three factors.
Cognitive/
Personal factors
Behaviour External environment
Figure 6.8: Social Cognitive Theory(Wood and Bandura, 1989; Al-mamary et al., 2016).
The theory has five variables; outcome expectations - performance, outcome expectations -
personal, self-efficacy, effect and anxiety. Outcome expectation – performance addresses job
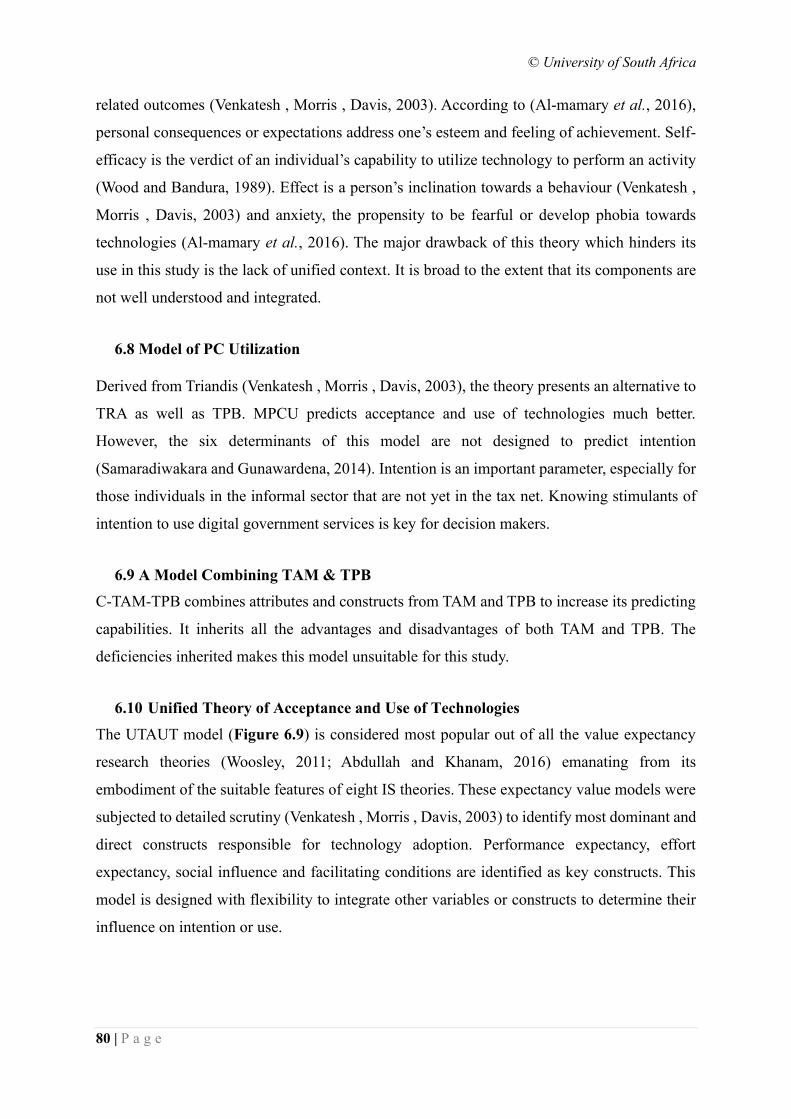
© University of South Africa
80 | P a g e
related outcomes (Venkatesh , Morris , Davis, 2003). According to (Al-mamary et al., 2016),
personal consequences or expectations address one’s esteem and feeling of achievement. Self-
efficacy is the verdict of an individual’s capability to utilize technology to perform an activity
(Wood and Bandura, 1989). Effect is a person’s inclination towards a behaviour (Venkatesh ,
Morris , Davis, 2003) and anxiety, the propensity to be fearful or develop phobia towards
technologies (Al-mamary et al., 2016). The major drawback of this theory which hinders its
use in this study is the lack of unified context. It is broad to the extent that its components are
not well understood and integrated.
6.8 Model of PC Utilization
Derived from Triandis (Venkatesh , Morris , Davis, 2003), the theory presents an alternative to
TRA as well as TPB. MPCU predicts acceptance and use of technologies much better.
However, the six determinants of this model are not designed to predict intention
(Samaradiwakara and Gunawardena, 2014). Intention is an important parameter, especially for
those individuals in the informal sector that are not yet in the tax net. Knowing stimulants of
intention to use digital government services is key for decision makers.
6.9 A Model Combining TAM & TPB
C-TAM-TPB combines attributes and constructs from TAM and TPB to increase its predicting
capabilities. It inherits all the advantages and disadvantages of both TAM and TPB. The
deficiencies inherited makes this model unsuitable for this study.
6.10 Unified Theory of Acceptance and Use of Technologies
The UTAUT model (Figure 6.9) is considered most popular out of all the value expectancy
research theories (Woosley, 2011; Abdullah and Khanam, 2016) emanating from its
embodiment of the suitable features of eight IS theories. These expectancy value models were
subjected to detailed scrutiny (Venkatesh , Morris , Davis, 2003) to identify most dominant and
direct constructs responsible for technology adoption. Performance expectancy, effort
expectancy, social influence and facilitating conditions are identified as key constructs. This
model is designed with flexibility to integrate other variables or constructs to determine their
influence on intention or use.
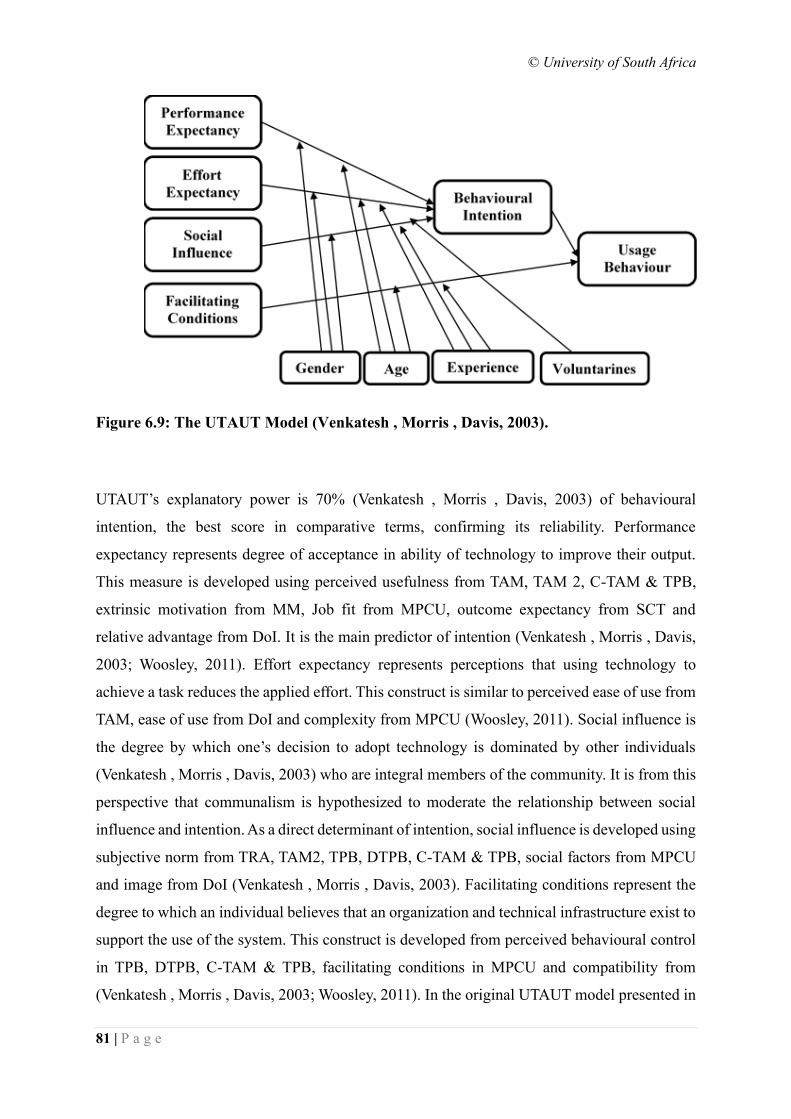
© University of South Africa
81 | P a g e
Figure 6.9: The UTAUT Model (Venkatesh , Morris , Davis, 2003).
UTAUT’s explanatory power is 70% (Venkatesh , Morris , Davis, 2003) of behavioural
intention, the best score in comparative terms, confirming its reliability. Performance
expectancy represents degree of acceptance in ability of technology to improve their output.
This measure is developed using perceived usefulness from TAM, TAM 2, C-TAM & TPB,
extrinsic motivation from MM, Job fit from MPCU, outcome expectancy from SCT and
relative advantage from DoI. It is the main predictor of intention (Venkatesh , Morris , Davis,
2003; Woosley, 2011). Effort expectancy represents perceptions that using technology to
achieve a task reduces the applied effort. This construct is similar to perceived ease of use from
TAM, ease of use from DoI and complexity from MPCU (Woosley, 2011). Social influence is
the degree by which one’s decision to adopt technology is dominated by other individuals
(Venkatesh , Morris , Davis, 2003) who are integral members of the community. It is from this
perspective that communalism is hypothesized to moderate the relationship between social
influence and intention. As a direct determinant of intention, social influence is developed using
subjective norm from TRA, TAM2, TPB, DTPB, C-TAM & TPB, social factors from MPCU
and image from DoI (Venkatesh , Morris , Davis, 2003). Facilitating conditions represent the
degree to which an individual believes that an organization and technical infrastructure exist to
support the use of the system. This construct is developed from perceived behavioural control
in TPB, DTPB, C-TAM & TPB, facilitating conditions in MPCU and compatibility from
(Venkatesh , Morris , Davis, 2003; Woosley, 2011). In the original UTAUT model presented in
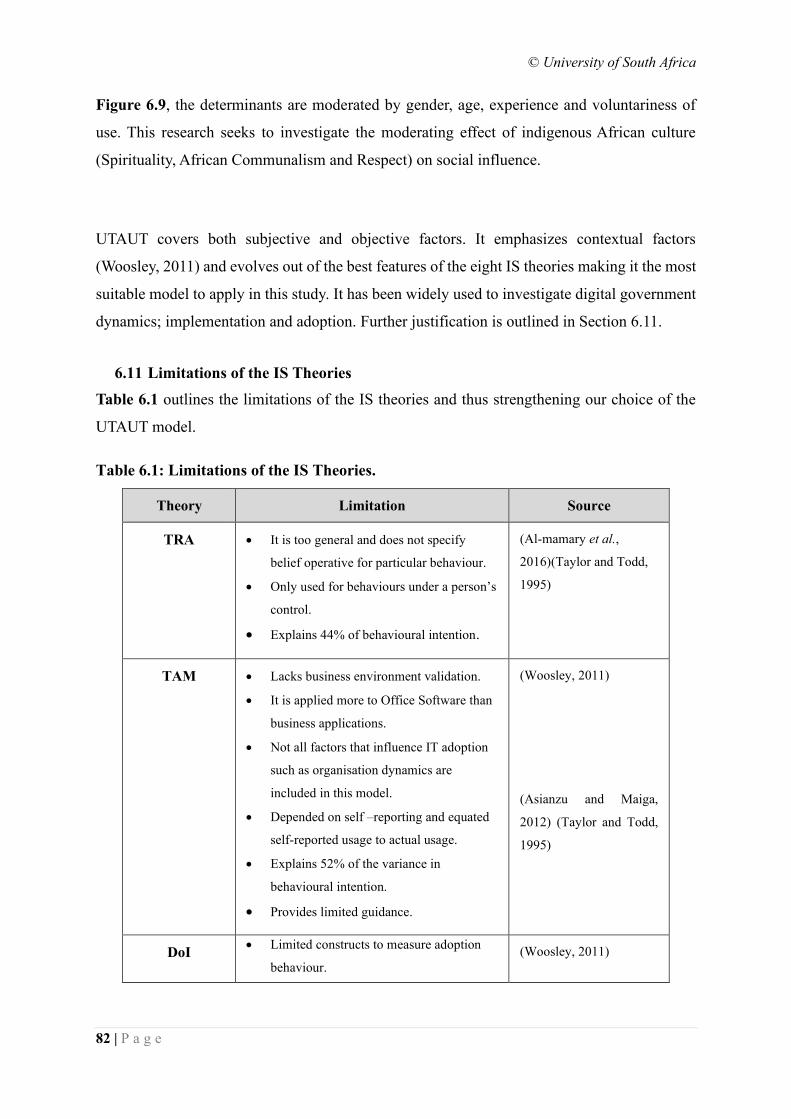
© University of South Africa
82 | P a g e
Figure 6.9, the determinants are moderated by gender, age, experience and voluntariness of
use. This research seeks to investigate the moderating effect of indigenous African culture
(Spirituality, African Communalism and Respect) on social influence.
UTAUT covers both subjective and objective factors. It emphasizes contextual factors
(Woosley, 2011) and evolves out of the best features of the eight IS theories making it the most
suitable model to apply in this study. It has been widely used to investigate digital government
dynamics; implementation and adoption. Further justification is outlined in Section 6.11.
6.11 Limitations of the IS Theories
Table 6.1 outlines the limitations of the IS theories and thus strengthening our choice of the
UTAUT model.
Table 6.1: Limitations of the IS Theories.
Theory Limitation Source
TRA • It is too general and does not specify
belief operative for particular behaviour.
• Only used for behaviours under a person’s
control.
• Explains 44% of behavioural intention.
(Al-mamary et al.,
2016)(Taylor and Todd,
1995)
TAM • Lacks business environment validation.
• It is applied more to Office Software than
business applications.
• Not all factors that influence IT adoption
such as organisation dynamics are
included in this model.
• Depended on self –reporting and equated
self-reported usage to actual usage.
• Explains 52% of the variance in
behavioural intention.
• Provides limited guidance.
(Woosley, 2011)
(Asianzu and Maiga,
2012) (Taylor and Todd,
1995)
DoI • Limited constructs to measure adoption
behaviour.
(Woosley, 2011)
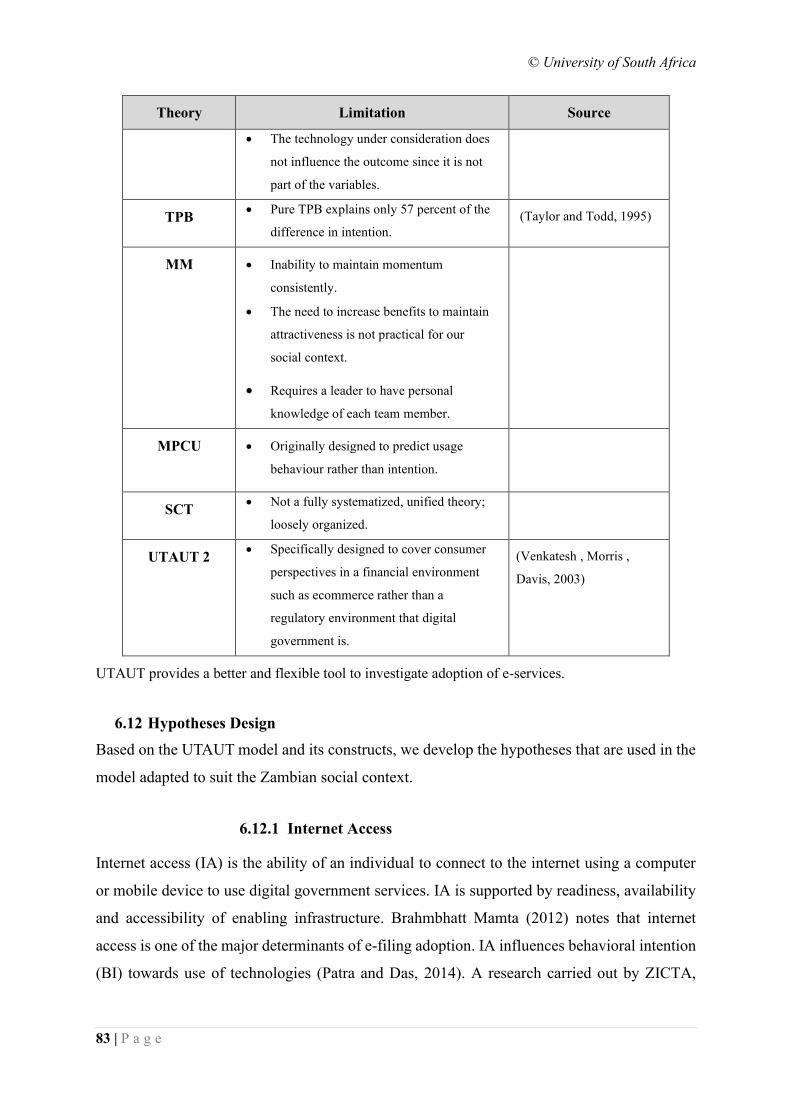
© University of South Africa
83 | P a g e
Theory Limitation Source
• The technology under consideration does
not influence the outcome since it is not
part of the variables.
TPB • Pure TPB explains only 57 percent of the
difference in intention.
(Taylor and Todd, 1995)
MM • Inability to maintain momentum
consistently.
• The need to increase benefits to maintain
attractiveness is not practical for our
social context.
• Requires a leader to have personal
knowledge of each team member.
MPCU • Originally designed to predict usage
behaviour rather than intention.
SCT • Not a fully systematized, unified theory;
loosely organized.
UTAUT 2 • Specifically designed to cover consumer
perspectives in a financial environment
such as ecommerce rather than a
regulatory environment that digital
government is.
(Venkatesh , Morris ,
Davis, 2003)
UTAUT provides a better and flexible tool to investigate adoption of e-services.
6.12 Hypotheses Design
Based on the UTAUT model and its constructs, we develop the hypotheses that are used in the
model adapted to suit the Zambian social context.
6.12.1 Internet Access
Internet access (IA) is the ability of an individual to connect to the internet using a computer
or mobile device to use digital government services. IA is supported by readiness, availability
and accessibility of enabling infrastructure. Brahmbhatt Mamta (2012) notes that internet
access is one of the major determinants of e-filing adoption. IA influences behavioral intention
(BI) towards use of technologies (Patra and Das, 2014). A research carried out by ZICTA,
© University of South Africa
84 | P a g e
Zambian Regulator of ICTs, shows that 12.7% of households access internet (ZICTA, 2015)
in Zambia. We can thus hypothesize that:
H1: IA positively affects SMEs’ BI to use e-filing and e-payment services in Zambia
6.12.2 Performance Expectancy
We define Performance Expectancy (PE) as the extent of an individual’s belief that utilising e-
filing and e-payment service increases efficiency, reduces operational costs, and provide
control. Tarhini et al.(2016) note that PE strongly predicts of BI to use information systems.
Venkatesh , Morris and Davis(2003) demonstrated that PE strongly predicted behavioural
intention towards usage of technologies both in involuntary as well as voluntary situations. In
addition, Azmi, Kamarulzaman and Hamid (2012a) as well as Ada and Cukai(2014)
hypothesized that perceived usefulness, an integral of PE, positively affects e-filing adoption.
Therefore, we postulate the following hypothesis:
H2: PE positively affects SMEs’ BI to use e-filing and e-payment services in Zambia
6.12.3 Effort Expectancy
Effort Expectancy (EE) depicts the extent of ease of use of e-filing and e-payment of taxes.
This construct is an important determinant of e-filing and e-payment acceptance and usage.
There are individuals who have technology phobia. The perception that using e-filing and e-
payment services is easy will determine their acceptance and adoption (Alawadhi and Morris,
2008). We thus propose the following hypothesis:
H3: EE positively affects SMEs’ BI to use e-filing as well as e-payment in Zambia
6.12.4 Social Influence
Social Influence (SI) is the extent by which individual’s behaviour is influenced by the way in
which other individuals or important people view them as a result of having used digital
government services such as e-filing and e-payment of taxes (Venkatesh , Morris , Davis,
2003). Their usage behaviour is subject to what others say or do, referred to as subjective norm
in other theories or normative social influence, whereby a person’s behaviour is influenced by
the desire to seek approval or avoid rejection. SI’s dimension or scope of influence on BI is
© University of South Africa
85 | P a g e
caveated by indigenous African culture. The majority of such individuals constitute SMEs in
the informal sector. We can therefore hypothesize the following:
H4: SI positively affects SMEs’ BI to use e-filing and e-payment services in Zambia
H4a: The positive influence of SI on BI to use e-filing and e-payment services is both i)
moderated and ii) mediated by 1) spirituality, 2) African communalism, and 3) respect for
elders and authority.
6.12.5 Facilitating Conditions
Facilitating conditions (FC) define the extent to which individuals believe that technical
infrastructure as well as organizational arrangements exist to reinforce use of e-filing and e-
payment (Venkatesh , Morris , Davis, 2003). Many Scholars (Ghalandari, 2012; Alraja, 2016)
discovered that facilitating conditions positively influence usage behaviour of technologies.
Unlike the previous constructs, FC directly determine technology use. FC include existing
infrastructure (connectivity, computers, mobile devices, affordable tariffs, regulations,
policies, e-filing and e-payment platforms) that supports technology acceptance. We can thus
postulate that:
H5a: FC positively influences usage behaviour of e-filing service
H5b: FC positively influences usage behaviour of e-payment service
6.12.6 Behavioral Intention
Prior studies have shown that BI positively influences usage of both e-payment and e-filing
services (Alghamdi, Goodwin and Rampersad, 2011; P. Ada and Cukai, 2014). Some Scholars
argue that behavioural intention is the most important determinant of actual behaviour
(Alghamdi, Goodwin and Rampersad, 2011). Zhou argues that the most important factor that
determines user acceptance and use of technology such as e-filing and e-payment, is the user’s
intention (Alghamdi, Goodwin and Rampersad, 2011). We can therefore hypothesize that:
H6: BI positively influences usage behaviour of e-filing service
H7: BI positively influences usage behaviour of e-payment service
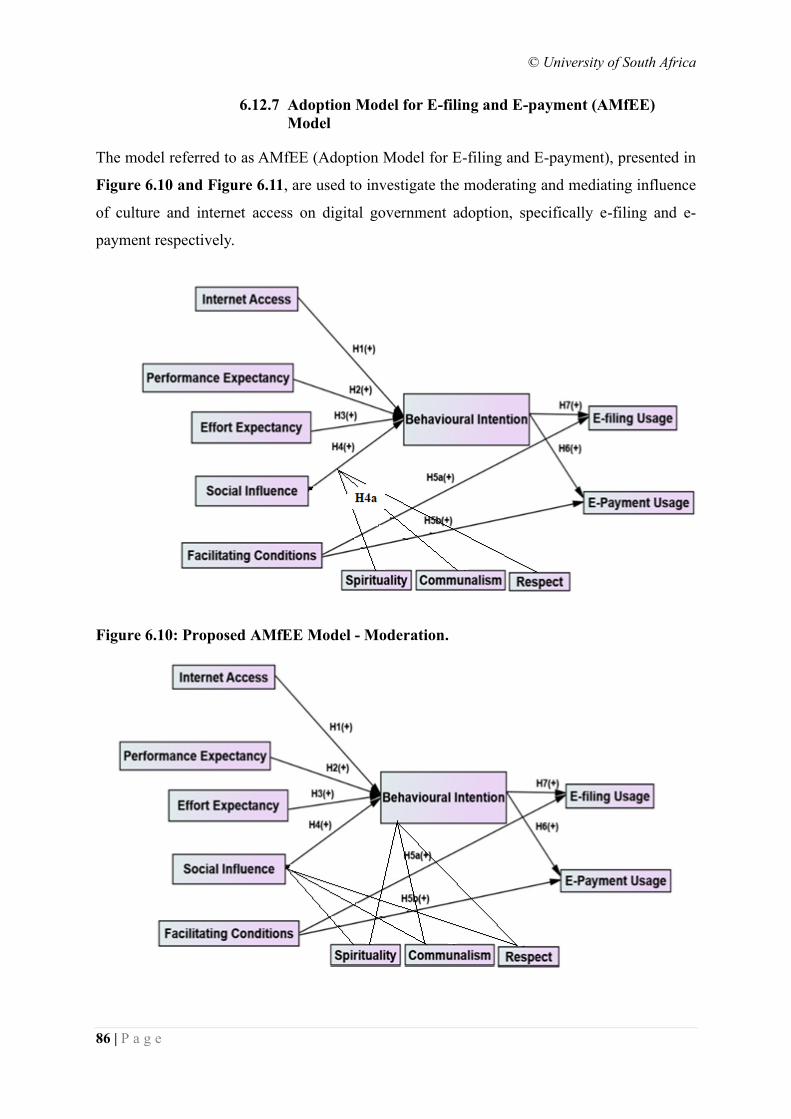
© University of South Africa
86 | P a g e
6.12.7 Adoption Model for E-filing and E-payment (AMfEE)
Model
The model referred to as AMfEE (Adoption Model for E-filing and E-payment), presented in
Figure 6.10 and Figure 6.11, are used to investigate the moderating and mediating influence
of culture and internet access on digital government adoption, specifically e-filing and e-
payment respectively.
Figure 6.10: Proposed AMfEE Model - Moderation.
© University of South Africa
87 | P a g e
Figure 6.11: Proposed AMfEE Model - Mediation
The digital government adoption model in Figure 6.10 and Figure 6.11 are derived from the
original UTAUT model. The adaptation of the original model to a context specific model is in
line with recommendations made by various authors (Venkatesh et al., 2003)
As already hypothesized, in addition to the impact of Internet Access, Performance Expectancy,
Effort Expectancy, and Social Influence on behavioural intention to use digital government,
this research is primarily interested in the moderating and mediating effect of cultural variables
encompassing spirituality, communalism and respect for elders and authority on the casual
relationship between Social Influence and intention.
6.13 Conclusion
Chapter 6 provided theoretical background of the Information Systems adoption theories. The
pros and cons of each theory are considered to determine the appropriate theoretical
underpinning. UTAUT is found to be a more preferred theory to guide the investigations. Based
on UTAUT, the necessary hypotheses are constructed and the adoption model is developed.
The next chapter, Chapter 7, defines the research approach based on the Saunders Research
Onion Strategy.
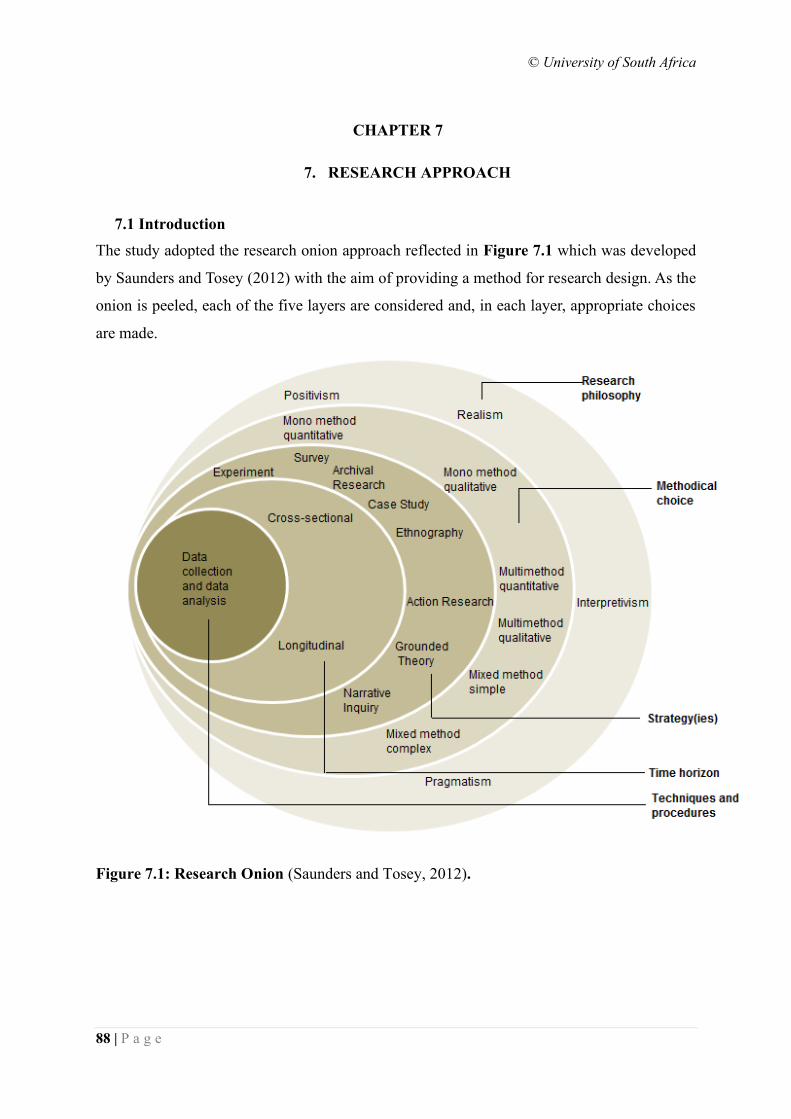
© University of South Africa
88 | P a g e
CHAPTER 7
7. RESEARCH APPROACH
7.1 Introduction
The study adopted the research onion approach reflected in Figure 7.1 which was developed
by Saunders and Tosey (2012) with the aim of providing a method for research design. As the
onion is peeled, each of the five layers are considered and, in each layer, appropriate choices
are made.
Figure 7.1: Research Onion (Saunders and Tosey, 2012).
© University of South Africa
89 | P a g e
7.2 Research Philosophy
Four research philosophies are considered in this study; Positivism, Realism, Interpretivism
and Pragmatism.
The realism paradigm is associated with the fact that reality exists. The Researcher perceives
this reality based on world views and own experiences. There are two forms of realism; direct
realism and critical realism. Direct realism focuses on what is experienced while critical
realism goes beyond and considers underlying transcendental complexities. Both forms of
realism are inappropriate for this study because they are more relevant for qualitative research.
Interpretivism (Heeks and Bailur, 2007) is associated with the qualitative research approach
involving in-depth investigations usually with small samples of data. Interpretivism seeks to
understand and interpret the intrinsic nature of human behaviour, making context rich
generalisations. Interpretivism adopts a more personal and flexible research structure and
avoids rigid structural frameworks as supported by positivism. The research question has
boundary conditions caveated by culture, internet access and digital government services. A
paradigm that is flexible and avoids structural frameworks would result in collection of
unnecessary data.
The pragmatism philosophy is more concerned with the practical consequences of the findings.
A pragmatist’s view point is that there are multiple realities and not a single reality to any
situation.
The positivism paradigm posits that real events are observed empirically and predicted
outcomes are explained with logical analysis. Its goal is to make time and law-like
generalizations with a clear distinction between reason and feeling (Ahmed and Mansoori,
2017). Positivism is associated with the quantitative research approach in which cause and
effect relationships are considered. It uses highly structured and measurable data to test theories
(Saunders and Tosey, 2012). In positivism, the researcher’s bias and values are not expected to
influence the research. To achieve this, large volumes of quantitative data are used to perform
statistical hypothesis testing. Positivism philosophy is preferred for this study because it offers
independence between the researcher and the research. In addition, positivism is positively
aligned to the UTAUT model. Further, the involvement of large volumes of data supports the
use of statistical methods which eliminate biasness.
Having considered the four research philosophies, the positivism philosophy is adopted for the
reasons stated above.
© University of South Africa
90 | P a g e
7.3 Methodology
The selection of a methodology was largely dependent on the type of research being conducted.
In general, the research methodologies fall in three categories; quantitative, qualitative and
mixed method approaches.
Quantitative research (Kaplan and Duchon, 1988) employs empirical methods and statements
to represent and manipulate numerical data to describe a phenomena reflected by given
observations. These observations can be captured in many forms. The common quantitative
research approaches include survey, correlational, experimental, exploratory, descriptive, or
causal-comparative. Quantitative research views reality from an objective standpoint in a value
free and unbiased manner. Like the positivism philosophy, the researcher in this approach is
independent of the research object. The process is deductive rather than inductive. The
generalization based on the research findings provided a foundation to understand and explain
the hypotheses.
Qualitative research (Kaplan and Duchon, 1988) is a strategy for systematic collection,
organization and interpretation of textual information. It broadly uses inductive approaches to
generate novel insights into phenomena that are difficult to measure quantitatively such as
social norms which are intangible factors. Other intangible factors include culture specific
information about values, opinions, behaviors and social contexts of focused groups. The
focused groups, participant observation and in-depth interviews are key data collection
techniques. Unlike quantitative research where a form of random sampling mechanism is used,
qualitative research uses purposeful sampling (Kaplan and Duchon, 1988) in which the
interviewees are carefully selected from those with specific experience in the subject being
investigated. While quantitative research assists to test and confirm designed hypotheses,
qualitative research through iterative interpretations will greatly help in our study to generate
the hypotheses that address the research question. The key elements of this approach are
exploration, description and interpretation. Table 7.1 highlights the key differences between
qualitative and quantitative research approaches.
Table 7.1: Comparing Qualitative and Quantitative Methods.
Comparator Qualitative Quantitative
Focus Quality or meaning of experience Quantity, frequency, magnitude
Philosophical roots Constructivism, Interpretivism Positivism
Goals of investigation Understand, describe, discover Predict, control, confirm, test
© University of South Africa
91 | P a g e
Design characteristics Flexible, evolving, emergent Structured, predetermined
Data collection Researcher as instrument External instruments; tests, surveys
Mixed methods approach is a methodology for conducting research that involves collecting,
analysing and integrating quantitative (e.g., experiments, surveys) and qualitative (e.g., focus
groups, interviews) data. It can either take a concurrent or sequential format. In a concurrent
mixed methods approach, the study either adopts triangulation or embedded design.
Quantitative and qualitative data collection and analyses are carried out concurrently. Using
the triangulation method, the outputs of the quantitative and qualitative processes would be
mixed and compared to produce a composite model. Triangulation offers different and diverse
angles of the problem being investigated. Sequential mixed methods approach includes
explanatory, exploratory and sequential embedded designs. In this approach, quantitative and
qualitative data collection and analyses are performed exclusively and sequentially. This
approach is time consuming. One process needed to be completed before another could
commence. The mixed methods approach becomes useful if neither the quantitative nor
qualitative approaches are sufficient to undertake the study.
Based on the foregoing, a quantitative methodology which is positivist in nature was adopted
and a survey of respondents from a sample size of 450 was conducted. The respondents were
randomly selected using systematic sampling with a sampling interval of 633.3 from a
sampling frame of small and micro enterprises that are part of the informal sector who are
registered for taxes and perform e-filing of tax returns. The sampling frame was made up of
132,354 tax payers. The survey instrument used is a five-point Likert-type scale questionnaire
based on “strongly disagree (=1)”, “disagree (=2)”, “neutral (= 3)”, “agree (=4)”, and
“strongly agree (=5)” containing questions to measure factors. The questions to measure
culture in a Zambian context were adapted from (Puchalski, 2001; Calma, 2010; Wilson, 2017).
7.4 Strategy
Since the research philosophy adopted is positivist utilising the quantitative methods, a survey
strategy was found to be most appropriate.
7.5 Time horizon
Since this research is time bound, the time horizon considered was cross-sectional.
© University of South Africa
92 | P a g e
7.6 Data Collection
The initial data collection was carried out during pilot study to aid research design and to assess
the reliability of the questionnaire to ensure that it was understood by the respondents. This
was followed by full data collection for comprehensive research aimed at validating the
moderating and mediating influence of indigenous African culture and internet access on digital
government adoption. Data was collected from statistically determined sample of tax paying
SMEs in Zambia, who are also users of other digital government services. The instrument for
information gathering was a survey using a five-point Likert-type scale questionnaire based on
“strongly disagree (=1)”, “disagree (=2)”, “neutral (=3)”, “agree (=4)”, and “strongly agree
(=5)”.
The Agree-Disagree (AD) rating scales are popularly used to analyse information about
observed variables which describe underlying constructs. Likert (1932) suggested that the
scales be delineated by five points. Dawes (2008), on the other hand, contended that 7-to 10-
points scales would yield more information than shorter scales. For instance, a 2- point scale
only permits evaluation of the direction of the attitude while a 3- point scale allows for
neutrality in addition to direction. In terms of quality of measurement, Revilla, Saris and
Krosnick (2014) demonstrated that, on an AD scale, the quality decreases as the number of
categories increases. The empirical results obtained by Revilla et.al.(2014) revealed that a 5-
point AD scale suggested by Likert provides better data quality than the 7- to 10- points scales.
The choice of the AD rating scale was therefore driven by the quality of the data required for
this study.
49 responses were rejected because the questionnaires were incomplete. The questionnaires
were administered via email, goggle survey and in person distribution by research assistants
between October 2018 and November 2019.
7.7 Data Preparation and Analysis
The data preparation and analysis was conducted using SPSS 25.0 and Structural Equation
Modelling (SEM) in SPSS AMOS 25.0. SEM has recently become more associated with
Information Systems research; providing capabilities to assess both measurement model and
path model to test theoretical relationships. Measures included correlation coefficients or path
coefficients which indicate the extent to which a given variable influences intention to perform
the action. Co-variances were used to indicate how variables relate to each other. Squared
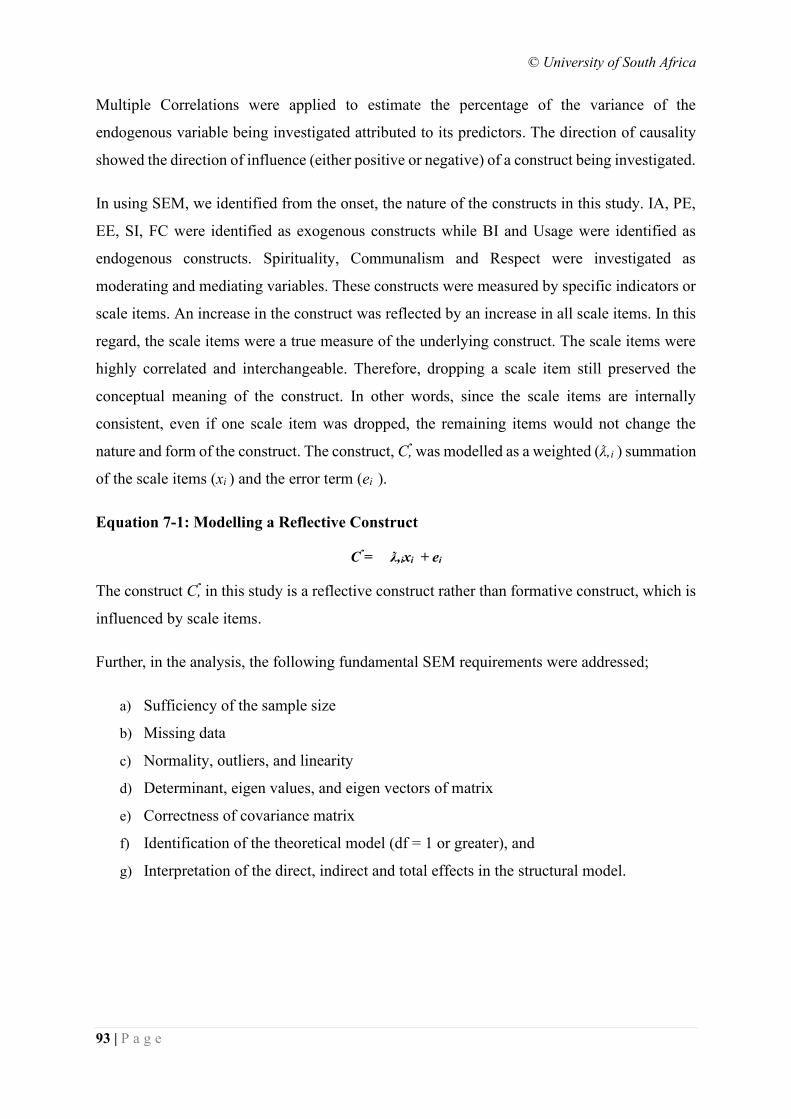
© University of South Africa
93 | P a g e
Multiple Correlations were applied to estimate the percentage of the variance of the
endogenous variable being investigated attributed to its predictors. The direction of causality
showed the direction of influence (either positive or negative) of a construct being investigated.
In using SEM, we identified from the onset, the nature of the constructs in this study. IA, PE,
EE, SI, FC were identified as exogenous constructs while BI and Usage were identified as
endogenous constructs. Spirituality, Communalism and Respect were investigated as
moderating and mediating variables. These constructs were measured by specific indicators or
scale items. An increase in the construct was reflected by an increase in all scale items. In this
regard, the scale items were a true measure of the underlying construct. The scale items were
highly correlated and interchangeable. Therefore, dropping a scale item still preserved the
conceptual meaning of the construct. In other words, since the scale items are internally
consistent, even if one scale item was dropped, the remaining items would not change the
nature and form of the construct. The construct, Ƈ, was modelled as a weighted (ƛ,i ) summation
of the scale items (xi ) and the error term (ei ).
Equation 7-1: Modelling a Reflective Construct
Ƈ = ƛ,ixi + ei
The construct Ƈ, in this study is a reflective construct rather than formative construct, which is
influenced by scale items.
Further, in the analysis, the following fundamental SEM requirements were addressed;
a) Sufficiency of the sample size
b) Missing data
c) Normality, outliers, and linearity
d) Determinant, eigen values, and eigen vectors of matrix
e) Correctness of covariance matrix
f) Identification of the theoretical model (df = 1 or greater), and
g) Interpretation of the direct, indirect and total effects in the structural model.
© University of South Africa
94 | P a g e
7.7.1 Population
The sample in this study is collected from a population of tax paying SMEs who run their own
businesses referred to as turnover taxpayers. The total population of this category of taxpayers
is 132,354.
Literature shows that SEM requires large samples (Livote, 2009; Wolf et al., 2013; Kline,
2015). Attempts have been made to adapt SEM techniques to work in smaller samples (Jung,
2013). Notwithstanding, Kline (Kline, 2015) notes that there are several factors that influence
the sample size requirements in SEM:
a) More complex models or those with more parameters require larger
sample sizes than relatively smaller models with fewer parameters,
b) analyses in which all outcome variables (endogenous variables) are
continuous and normally distributed require smaller sample sizes,
c) in situations where there are more incidences of missing data, larger sample
sizes are required.
Given the above factors, there is therefore no simple or single rule of thumb regarding the
determination of sample size that fits all situations in SEM. Kline (Kline, 2015) and Wolf et al.
(2015) provide alternative options that can be employed in determining sample size in SEM.
The first option is to consider the number of cases required in order for the results to have
adequate statistical precision and second is to consider the minimum sample size needed in
order for significance tests in SEM to have reasonable power (ability to explain the variance in
outcome variables).
Based on the two options, a further review was undertaken involving the N: q rule and power
analysis. Literature, revealed that an increase in regressive paths (attributed to large models)
resulted in the need for larger samples (Kline, 2015; Wolf et al., 2015). The recommended ratio
for the N:q rule is 20:1 (Kline, 2015). AMfEE has ten (10) parameters; Internet Access, PE,
EE, SI, FC, BI, UB, moderated by Spirituality, Communalism and Respect. Inductively, 20 x
10 cases are required to ensure adequacy in statistical precision and to have reasonable
explanatory power. Since SEM requires a single sample size for the entire model (Dwivedi et
al., 2017), the derived sample size is therefore 200.
The nature of the research population includes SMEs. To deal with such a population,
systematic random sampling in which the target population is ordered according to some
© University of South Africa
95 | P a g e
ordering scheme and then selecting elements starting from a random point at fixed periodic
intervals (the sampling interval).
The nature of the research population includes Individuals who pay taxes. The total tax
population for Domestic Taxes in Zambia is approximately 3,000,000 (3 million). From this
wider population, the specific population of interest for this research are the turnover taxpayers
who are SMEs. The number of turnover taxpayers is 132,354.
Since the minimum research sample size was 200, the sampling interval for such a sample is
therefore 662. From the turnover tax population given, the nth term (662nd) is selected to form
part of the sample size. The sample data would be selected using an SQL script.
7.7.2 Sampling Strategy
The nature of the research population included Individuals (particularly the SMEs). To deal
with such a population, systematic sampling in which elements are selected starting from a
random point at fixed periodic intervals (the sampling interval) was applied. The Tax
population for Domestic Taxes was 3,000,000 (3 million). From this population, the population
of turnover taxpayers (which includes SMEs) was 132,354. The acceptable SEM sample size
is 200. However, we chose a sample size that was relatively higher, 450, therefore the sampling
interval was 294.12. From the turnover tax population given, the nth term (294th) is selected to
form part of the sample size. This process was used to select the 450 respondents.
7.7.3 Unit of Analysis
The unit of analysis was every SME taxpayer that has used e-filing or e-payment services and
hopes to use them and other digital government services again.
7.7.4 Missing data
The statistical analysis of data is affected by missing data values in variables. Not every subject
has an actual value for every variable in the data set, some values may be missing. Such missing
data is addressed by one of the five options. Deletion is applied in a situation where most of
the data values are blank. Small number of blanks for continuous data is addressed using mean
substitution while regression imputation is used for ordinal data. The other methods are
expected maximum algorithm and response pattern. Listwise and pairwise deletion of cases
© University of South Africa
96 | P a g e
with missing data is avoided to eliminate the risk of reducing the sample size and affecting
parameter estimates and standard errors.
7.7.5 Normality
Variables are examined to determine if they are normally distributed as non-normality can
affect the resulting SEM Statistics. Skewness and kurtosis statistics were used in this study to
measure normality.
7.7.6 Outliers
Outliers negatively affect statistics such as means, standard deviation and correlations. These
are detected using methods such as box plots, scatterplots, histograms or frequency
distributions. Outliers can either be explained, deleted or accommodated.
7.7.7 Linearity
It is important that variables are linearly related as non-linearity can reduce the magnitude of
correlation. Linearity is detected using scatter plots and is addressed through transformations
or by deleting outliers.
7.7.8 Common Method Bias
This section provides a brief explanation of the Common Method Bias, its potential sources
and some of the remedial measures. The section also outlines how common method biases
were addressed in this research.
Common Method Bias is the variance that is attributed to the effect of applying a common
measurement method rather than to the constructs the measures represent (Podsakoff et al.,
2003). Method biases are one of the main sources of measurement error. Measurement error
has both a systematic and a random component(Bagozzi, Yi and Phillips, 1991). Although both
types of measurement error require attention, systematic measurement error is a particularly
serious problem because it provides an alternative explanation for the observed relationships
between measures of different constructs that is independent of the one
hypothesized(Podsakoff et al., 2003). One of the main sources of systematic measurement error
is method variance. Method variance can be attributed to any one of the four following causes:
independent and dependent variables being obtained from the same source; measurement items
© University of South Africa
97 | P a g e
themselves; context of the items within the measurement instrument; and context in which the
measures are obtained(Bagozzi, Yi and Phillips, 1991; Podsakoff et al., 2003).
Method variance or effects arising from obtaining independent and dependent variables from
the same source or rater include consistency motif, implicit theories and illusory correlations,
social desirability, leniency biases, acquiescence (yea-saying or nay-saying), positive and
negative affectivity, and transient mood state(Podsakoff et al., 2003). Method effects produced
from measurement items or item characteristics are based on the manner in which items are
presented to respondents to produce artifactual covariance in the observed
relationships(Podsakoff et al., 2003). These effects include item social desirability, item
complexity and/or ambiguity, scale format and scale anchors, and negatively worded items.
Method effects produced by item context arise from the influence or interpretation that a rater
assigns to an item solely because of its relation to the other items making up a measurement
instrument. These item context effects include item priming effects, item embeddedness,
context induced moods, scale length, and intermixing items of different constructs on the
questionnaire(Podsakoff et al., 2003; Podsakoff, MacKenzie and Podsakoff, 2012;
Viswanathan and Kayande, 2012). The fourth type of method effects are related to the context
in which the measures are obtained. Key among these contextual influences are the time,
location, and media used to measure the constructs(Podsakoff et al., 2003).
Two key remedies for common method bias are procedural and statistical remedies.
Procedurally, method variance can be controlled by identifying what the measures of the
independent and dependent variables have in common and eliminating or minimizing
commonalities through the design of the study. Some of the procedural techniques include
obtaining measures of the independent and dependent variables from different sources,
temporally, proximal, psychological, or methodological separation of measurement, protecting
respondent anonymity and reducing evaluation apprehension, counterbalancing question order,
and improving scale items(Podsakoff et al., 2003). The statistical remedies include the
Harman’s single-factor test, Common latent factor and the use of a Marker variable.
This study employed the procedural remedies such as protecting respondent anonymity and
reducing evaluation apprehension, temporally, proximal, psychological, or methodological
separation of measurement (indepenent and dependent constructs clearly separated),
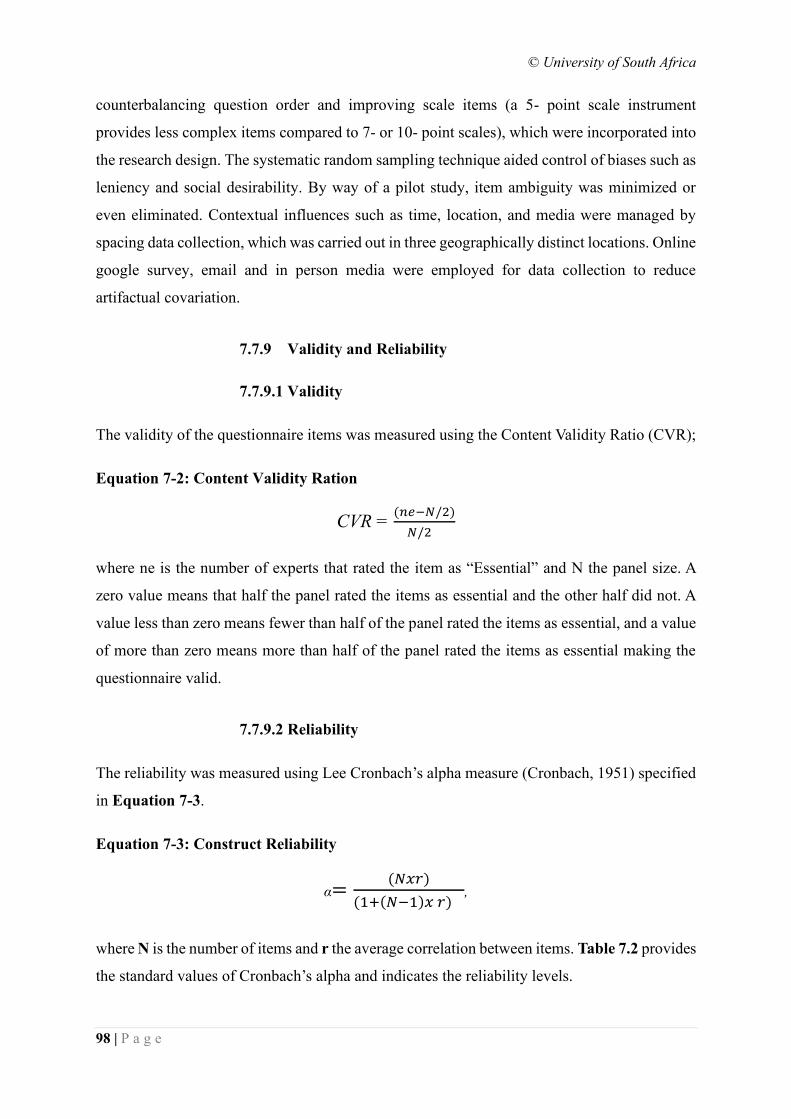
© University of South Africa
98 | P a g e
counterbalancing question order and improving scale items (a 5- point scale instrument
provides less complex items compared to 7- or 10- point scales), which were incorporated into
the research design. The systematic random sampling technique aided control of biases such as
leniency and social desirability. By way of a pilot study, item ambiguity was minimized or
even eliminated. Contextual influences such as time, location, and media were managed by
spacing data collection, which was carried out in three geographically distinct locations. Online
google survey, email and in person media were employed for data collection to reduce
artifactual covariation.
7.7.9 Validity and Reliability
7.7.9.1 Validity
The validity of the questionnaire items was measured using the Content Validity Ratio (CVR);
Equation 7-2: Content Validity Ration
CVR = (𝑛𝑒−𝑁/2)
𝑁/2
where ne is the number of experts that rated the item as “Essential” and N the panel size. A
zero value means that half the panel rated the items as essential and the other half did not. A
value less than zero means fewer than half of the panel rated the items as essential, and a value
of more than zero means more than half of the panel rated the items as essential making the
questionnaire valid.
7.7.9.2 Reliability
The reliability was measured using Lee Cronbach’s alpha measure (Cronbach, 1951) specified
in Equation 7-3.
Equation 7-3: Construct Reliability
α=(𝑁𝑥𝑟)
(1+(𝑁−1)𝑥 𝑟),
where N is the number of items and r the average correlation between items. Table 7.2 provides
the standard values of Cronbach’s alpha and indicates the reliability levels.
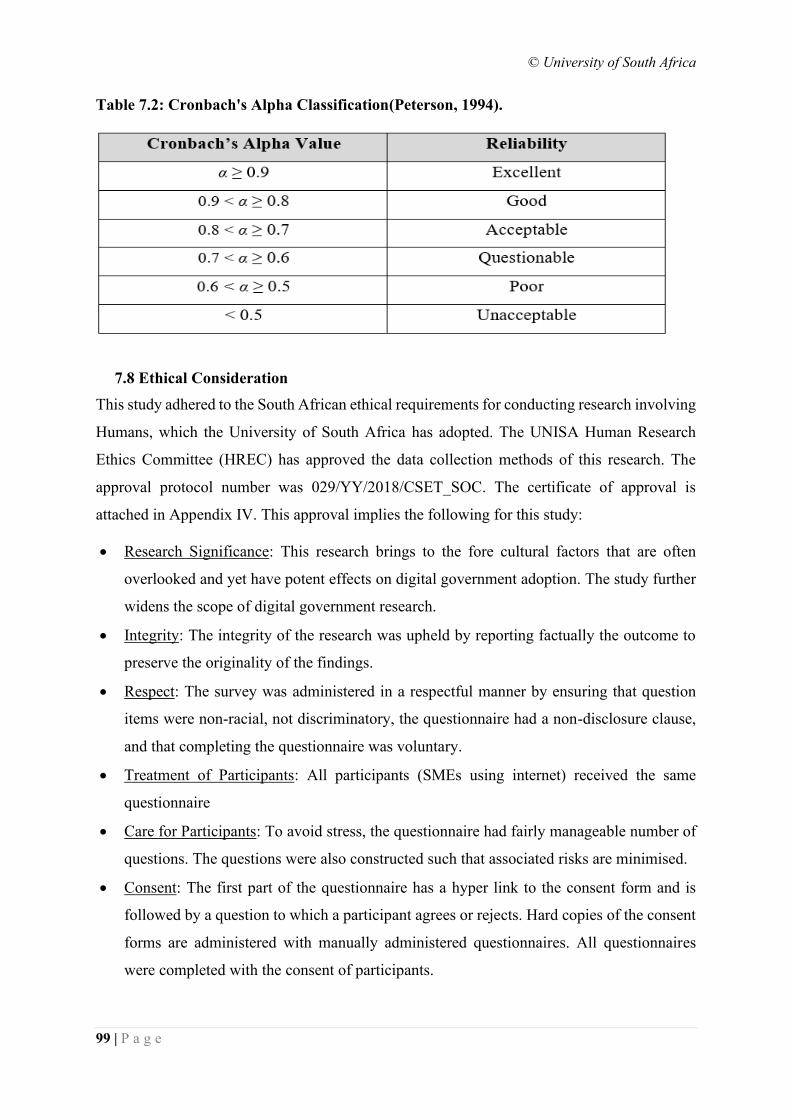
© University of South Africa
99 | P a g e
Table 7.2: Cronbach's Alpha Classification(Peterson, 1994).
7.8 Ethical Consideration
This study adhered to the South African ethical requirements for conducting research involving
Humans, which the University of South Africa has adopted. The UNISA Human Research
Ethics Committee (HREC) has approved the data collection methods of this research. The
approval protocol number was 029/YY/2018/CSET_SOC. The certificate of approval is
attached in Appendix IV. This approval implies the following for this study:
• Research Significance: This research brings to the fore cultural factors that are often
overlooked and yet have potent effects on digital government adoption. The study further
widens the scope of digital government research.
• Integrity: The integrity of the research was upheld by reporting factually the outcome to
preserve the originality of the findings.
• Respect: The survey was administered in a respectful manner by ensuring that question
items were non-racial, not discriminatory, the questionnaire had a non-disclosure clause,
and that completing the questionnaire was voluntary.
• Treatment of Participants: All participants (SMEs using internet) received the same
questionnaire
• Care for Participants: To avoid stress, the questionnaire had fairly manageable number of
questions. The questions were also constructed such that associated risks are minimised.
• Consent: The first part of the questionnaire has a hyper link to the consent form and is
followed by a question to which a participant agrees or rejects. Hard copies of the consent
forms are administered with manually administered questionnaires. All questionnaires
were completed with the consent of participants.
© University of South Africa
100 | P a g e
7.9 Conclusion
This chapter described the research approach using Saunders research onion strategy. Having
considered various options in each layer, a cross-sectional research based on a positivism
philosophy and a quantitative methodology is adopted. The strategy employed is a survey using
a five-point Likert Scale questionnaire. The next chapter considers data preparation and
assesses the normality of the sample data.
CHAPTER 8
8. DATA PREPARATION
8.1 Introduction
Chapter 7 discussed research approach as well as various measurement units to ascertain the
conformity of the sample data to predetermined criteria.
This chapter evaluates the data against the units of measurement to ascertain the degree of
representation of the study population by sample data. This process includes data screening,
detection of outliers, normality and linearity of the data. The tool used for parametric analysis
(SEM) requires that the data assumptions are tested. SPSS 26.0 served as a tool for conducting
preliminary investigation and to perform required data screening.
8.2 Study Population
Zambia conducts her population census after every ten years. The previous latest census
conducted in 2010 place the population at 13,092,666 (13 million) (Central Statistics Office
Zambia, 2012) 60.5% of citizens reside in the rural part of Zambia while 39.5% of citizens
reside in Urban parts of the country, of which the majority, 2,191,225 represents the population
of Lusaka alone. Lusaka, which is our study population, represents 42% of the urban
population. As of end of 2018, the internet penetration stood at 55% of the total population
(about 7,248,773 internet users), which is more than the population in the urban parts of
Zambia. Lusaka alone represents 30% of the internet users in Zambia. About 52% of the
population are aged 15- 64 years.
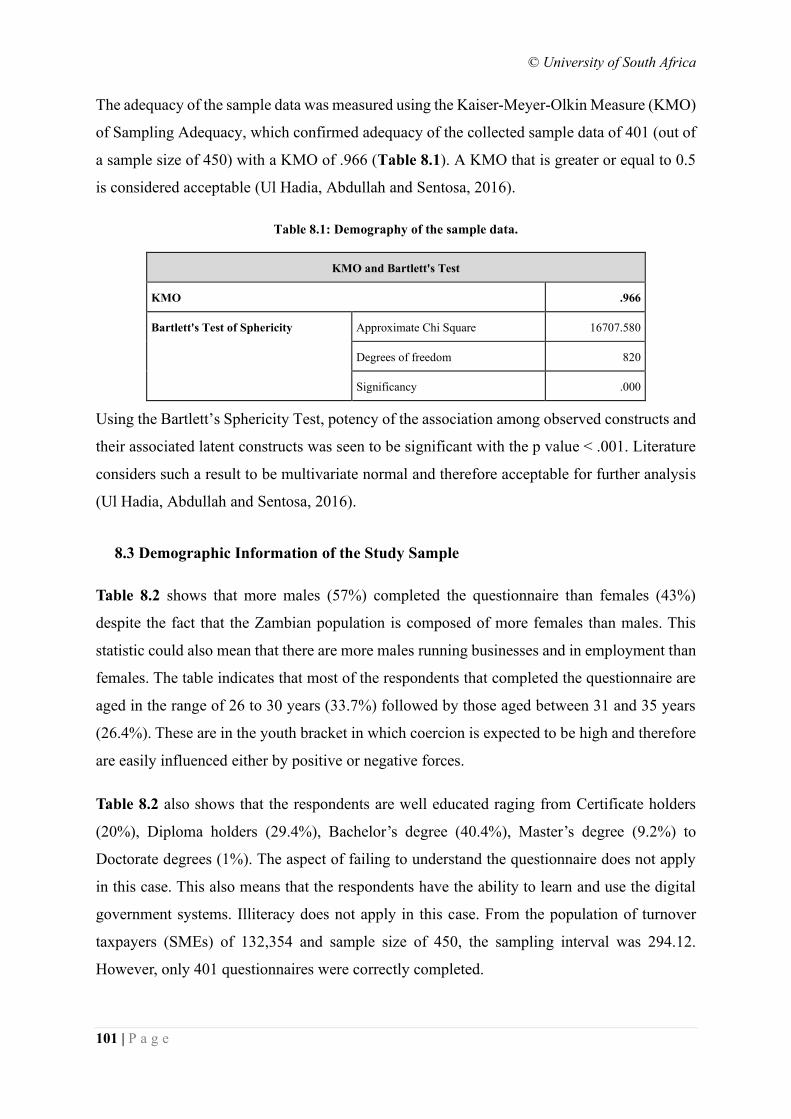
© University of South Africa
101 | P a g e
The adequacy of the sample data was measured using the Kaiser-Meyer-Olkin Measure (KMO)
of Sampling Adequacy, which confirmed adequacy of the collected sample data of 401 (out of
a sample size of 450) with a KMO of .966 (Table 8.1). A KMO that is greater or equal to 0.5
is considered acceptable (Ul Hadia, Abdullah and Sentosa, 2016).
Table 8.1: Demography of the sample data.
KMO and Bartlett's Test
KMO .966
Bartlett's Test of Sphericity Approximate Chi Square 16707.580
Degrees of freedom 820
Significancy .000
Using the Bartlett’s Sphericity Test, potency of the association among observed constructs and
their associated latent constructs was seen to be significant with the p value < .001. Literature
considers such a result to be multivariate normal and therefore acceptable for further analysis
(Ul Hadia, Abdullah and Sentosa, 2016).
8.3 Demographic Information of the Study Sample
Table 8.2 shows that more males (57%) completed the questionnaire than females (43%)
despite the fact that the Zambian population is composed of more females than males. This
statistic could also mean that there are more males running businesses and in employment than
females. The table indicates that most of the respondents that completed the questionnaire are
aged in the range of 26 to 30 years (33.7%) followed by those aged between 31 and 35 years
(26.4%). These are in the youth bracket in which coercion is expected to be high and therefore
are easily influenced either by positive or negative forces.
Table 8.2 also shows that the respondents are well educated raging from Certificate holders
(20%), Diploma holders (29.4%), Bachelor’s degree (40.4%), Master’s degree (9.2%) to
Doctorate degrees (1%). The aspect of failing to understand the questionnaire does not apply
in this case. This also means that the respondents have the ability to learn and use the digital
government systems. Illiteracy does not apply in this case. From the population of turnover
taxpayers (SMEs) of 132,354 and sample size of 450, the sampling interval was 294.12.
However, only 401 questionnaires were correctly completed.
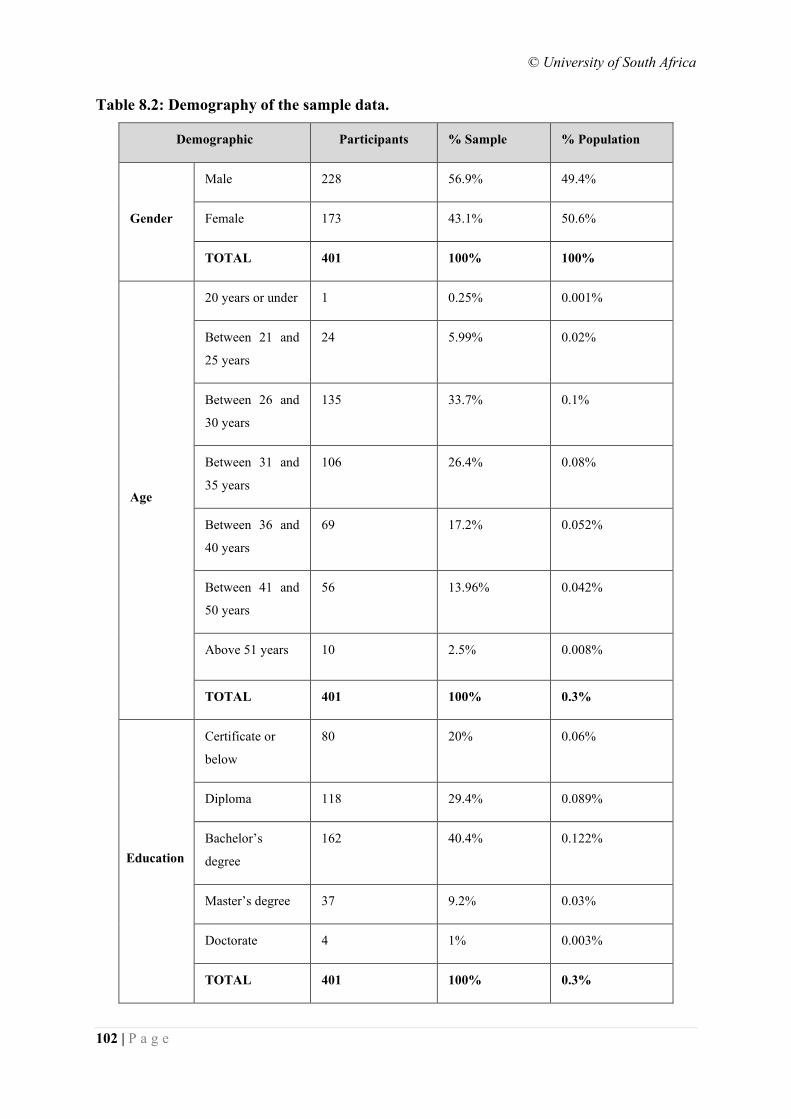
© University of South Africa
102 | P a g e
Table 8.2: Demography of the sample data.
Demographic Participants % Sample % Population
Gender
Male 228 56.9% 49.4%
Female 173 43.1% 50.6%
TOTAL 401 100% 100%
Age
20 years or under 1 0.25% 0.001%
Between 21 and
25 years
24 5.99% 0.02%
Between 26 and
30 years
135 33.7% 0.1%
Between 31 and
35 years
106 26.4% 0.08%
Between 36 and
40 years
69 17.2% 0.052%
Between 41 and
50 years
56 13.96% 0.042%
Above 51 years 10 2.5% 0.008%
TOTAL 401 100% 0.3%
Education
Certificate or
below
80 20% 0.06%
Diploma 118 29.4% 0.089%
Bachelor’s
degree
162 40.4% 0.122%
Master’s degree 37 9.2% 0.03%
Doctorate 4 1% 0.003%
TOTAL 401 100% 0.3%
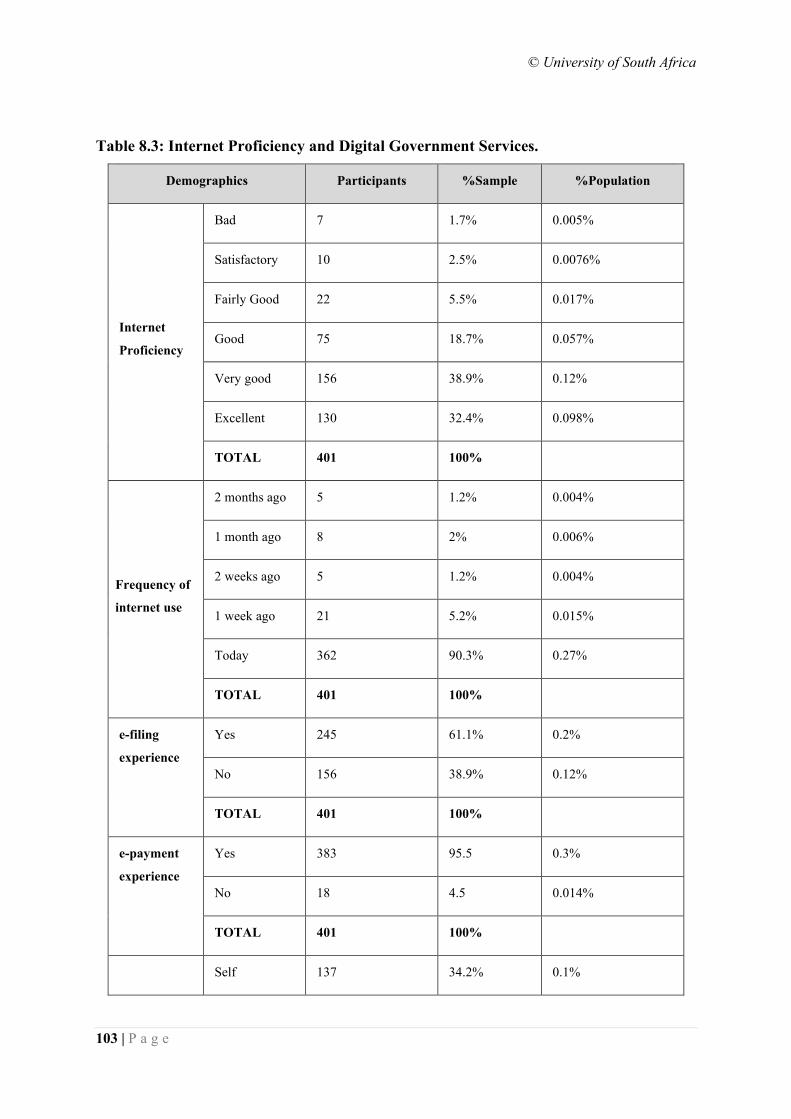
© University of South Africa
103 | P a g e
Table 8.3: Internet Proficiency and Digital Government Services.
Demographics Participants %Sample %Population
Internet
Proficiency
Bad 7 1.7% 0.005%
Satisfactory 10 2.5% 0.0076%
Fairly Good 22 5.5% 0.017%
Good 75 18.7% 0.057%
Very good 156 38.9% 0.12%
Excellent 130 32.4% 0.098%
TOTAL 401 100%
Frequency of
internet use
2 months ago 5 1.2% 0.004%
1 month ago 8 2% 0.006%
2 weeks ago 5 1.2% 0.004%
1 week ago 21 5.2% 0.015%
Today 362 90.3% 0.27%
TOTAL 401 100%
e-filing
experience
Yes 245 61.1% 0.2%
No 156 38.9% 0.12%
TOTAL 401 100%
e-payment
experience
Yes 383 95.5 0.3%
No 18 4.5 0.014%
TOTAL 401 100%
Self 137 34.2% 0.1%
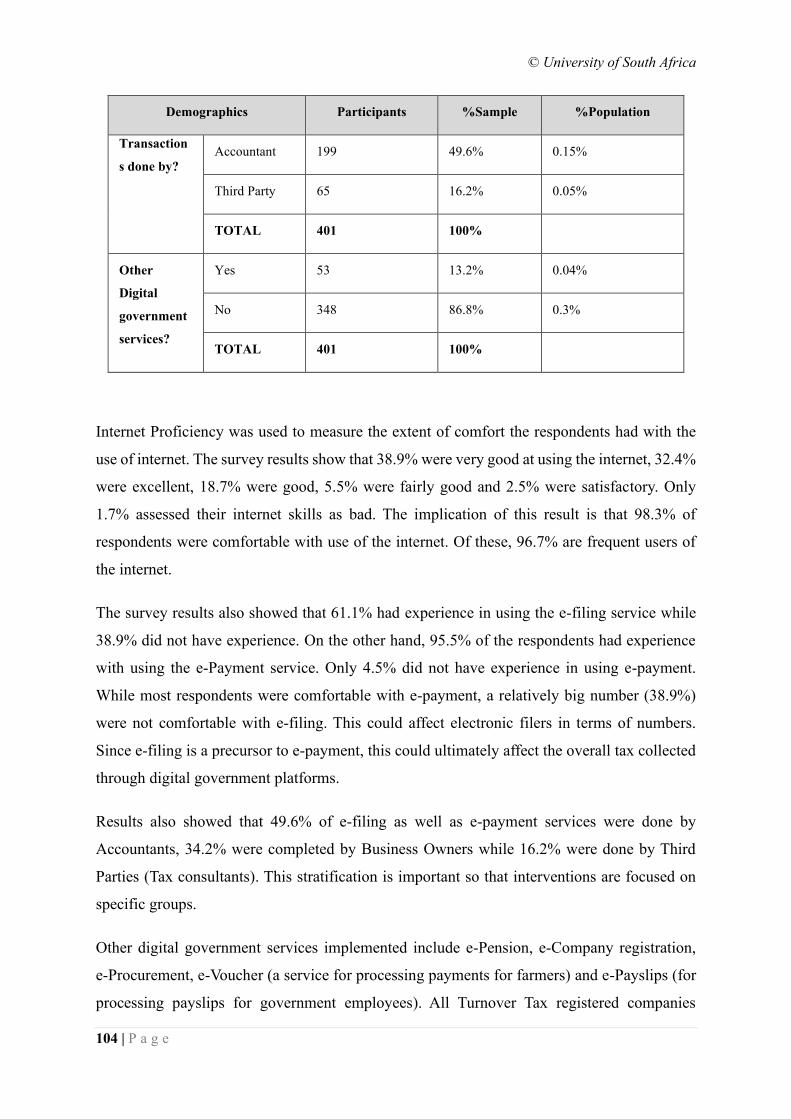
© University of South Africa
104 | P a g e
Demographics Participants %Sample %Population
Transaction
s done by?
Accountant 199 49.6% 0.15%
Third Party 65 16.2% 0.05%
TOTAL 401 100%
Other
Digital
government
services?
Yes 53 13.2% 0.04%
No 348 86.8% 0.3%
TOTAL 401 100%
Internet Proficiency was used to measure the extent of comfort the respondents had with the
use of internet. The survey results show that 38.9% were very good at using the internet, 32.4%
were excellent, 18.7% were good, 5.5% were fairly good and 2.5% were satisfactory. Only
1.7% assessed their internet skills as bad. The implication of this result is that 98.3% of
respondents were comfortable with use of the internet. Of these, 96.7% are frequent users of
the internet.
The survey results also showed that 61.1% had experience in using the e-filing service while
38.9% did not have experience. On the other hand, 95.5% of the respondents had experience
with using the e-Payment service. Only 4.5% did not have experience in using e-payment.
While most respondents were comfortable with e-payment, a relatively big number (38.9%)
were not comfortable with e-filing. This could affect electronic filers in terms of numbers.
Since e-filing is a precursor to e-payment, this could ultimately affect the overall tax collected
through digital government platforms.
Results also showed that 49.6% of e-filing as well as e-payment services were done by
Accountants, 34.2% were completed by Business Owners while 16.2% were done by Third
Parties (Tax consultants). This stratification is important so that interventions are focused on
specific groups.
Other digital government services implemented include e-Pension, e-Company registration,
e-Procurement, e-Voucher (a service for processing payments for farmers) and e-Payslips (for
processing payslips for government employees). All Turnover Tax registered companies
© University of South Africa
105 | P a g e
(medium, small and micro companies) are expected to file electronic or manual returns with
the companies responsible for pension and company registration. Only government employees
who also run their own companies would use the e-Payslips service. The e-Voucher service
would be used by turnover companies that are in the farming sector. Only 13.2% used other
digital government services besides e-filing and e-Payment. 86.8% of respondents did not use
other digital government services even though they were available. This statistic highlights the
core issue of lagged digital government adoption in low-income countries with specific focus
on Zambia.
8.4 Data Screening
This section identified the type of data that was captured and also the data that was not included
in the study. The section also assesses positive definiteness, extreme collinearity, outliers and
missing data in the sample data in the study.
Data was captured from a sample of 450 respondents using a positivist approach. The Small
and Micro Enterprises which were in the scope of this study but are not registered for taxes
were not included in the study. The large and medium taxpayers were also not included in the
study. Only Small and Micro Enterprises that were registered for taxes and perform electronic
filing and electronic payment of taxes were included in the study.
Positive definiteness refers to a positive definite data matrix, used by the SEM program, that is
non-singular or has an inverse; whose eigenvalues are all positive with a positive
determinant and no out-of-bounds correlations or covariances. A data matrix that lacks
these characteristics is non-positive definite (Kline, 2015). Attempts to analyse such a data
matrix would most likely not succeed. During the SEM computations, the inverse of the data
matrix is derived as part of regression operations. These operations would not succeed for a
singular matrix since it does not have an inverse.
Positive eigenvalues are important because they explain all the variance of the original
variables. If any eigenvalue is zero, it means that the matrix is singular or is an indication of
some pattern of collinearity that involves at least two variables. Negative eigenvalues (< 0) are
a sign or indication of a data matrix element, correlation or covariance that is out of bounds.
Table 8.4 presents the computed eigenvalues of the 41 construct items using the Principal Component
Analysis method.
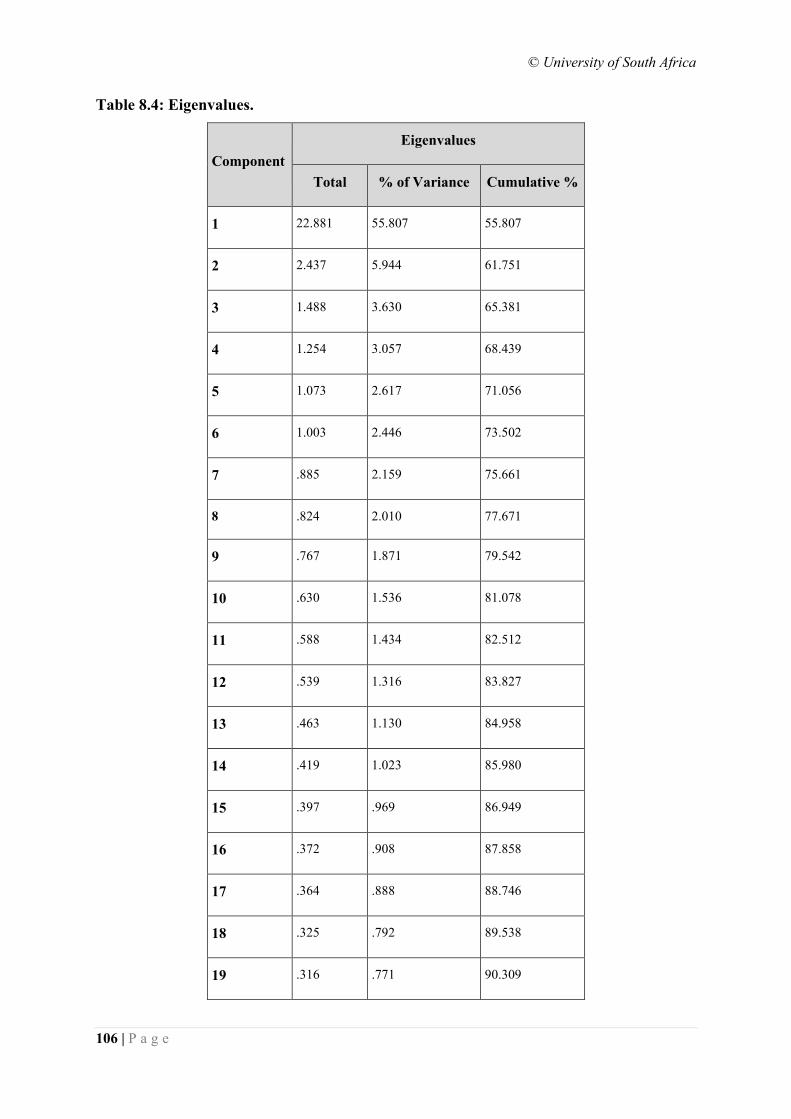
© University of South Africa
106 | P a g e
Table 8.4: Eigenvalues.
Component
Eigenvalues
Total % of Variance Cumulative %
1 22.881 55.807 55.807
2 2.437 5.944 61.751
3 1.488 3.630 65.381
4 1.254 3.057 68.439
5 1.073 2.617 71.056
6 1.003 2.446 73.502
7 .885 2.159 75.661
8 .824 2.010 77.671
9 .767 1.871 79.542
10 .630 1.536 81.078
11 .588 1.434 82.512
12 .539 1.316 83.827
13 .463 1.130 84.958
14 .419 1.023 85.980
15 .397 .969 86.949
16 .372 .908 87.858
17 .364 .888 88.746
18 .325 .792 89.538
19 .316 .771 90.309
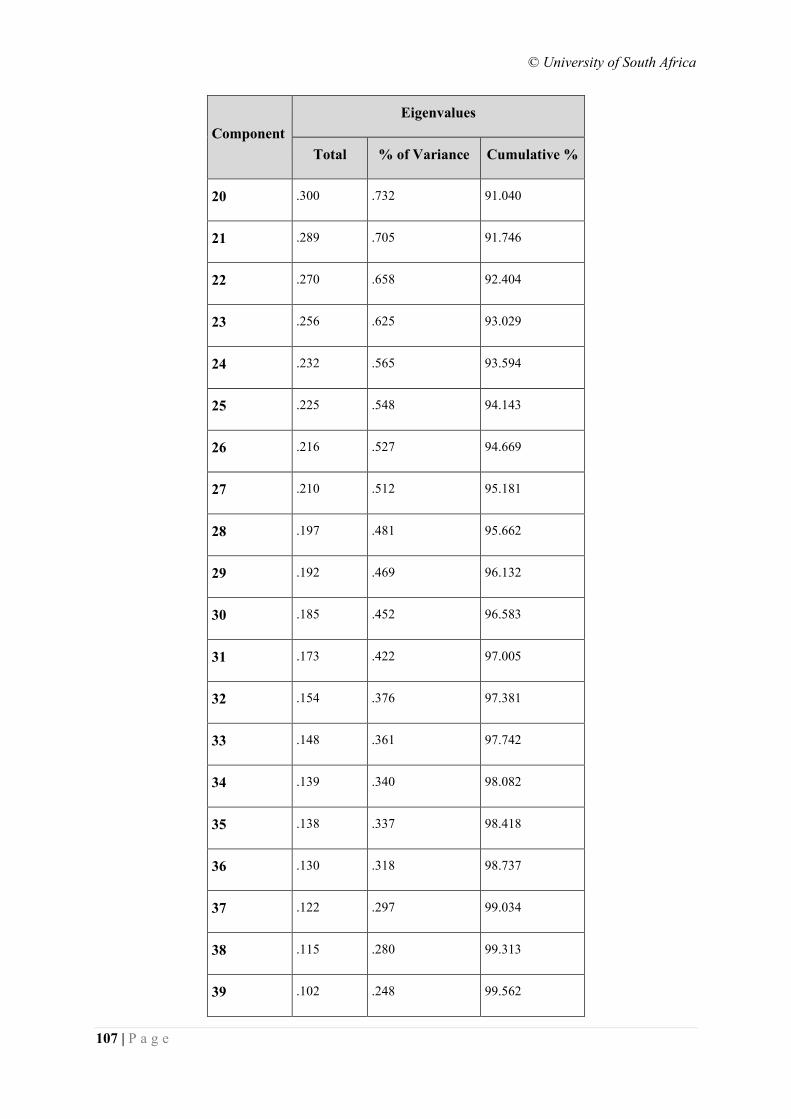
© University of South Africa
107 | P a g e
Component
Eigenvalues
Total % of Variance Cumulative %
20 .300 .732 91.040
21 .289 .705 91.746
22 .270 .658 92.404
23 .256 .625 93.029
24 .232 .565 93.594
25 .225 .548 94.143
26 .216 .527 94.669
27 .210 .512 95.181
28 .197 .481 95.662
29 .192 .469 96.132
30 .185 .452 96.583
31 .173 .422 97.005
32 .154 .376 97.381
33 .148 .361 97.742
34 .139 .340 98.082
35 .138 .337 98.418
36 .130 .318 98.737
37 .122 .297 99.034
38 .115 .280 99.313
39 .102 .248 99.562
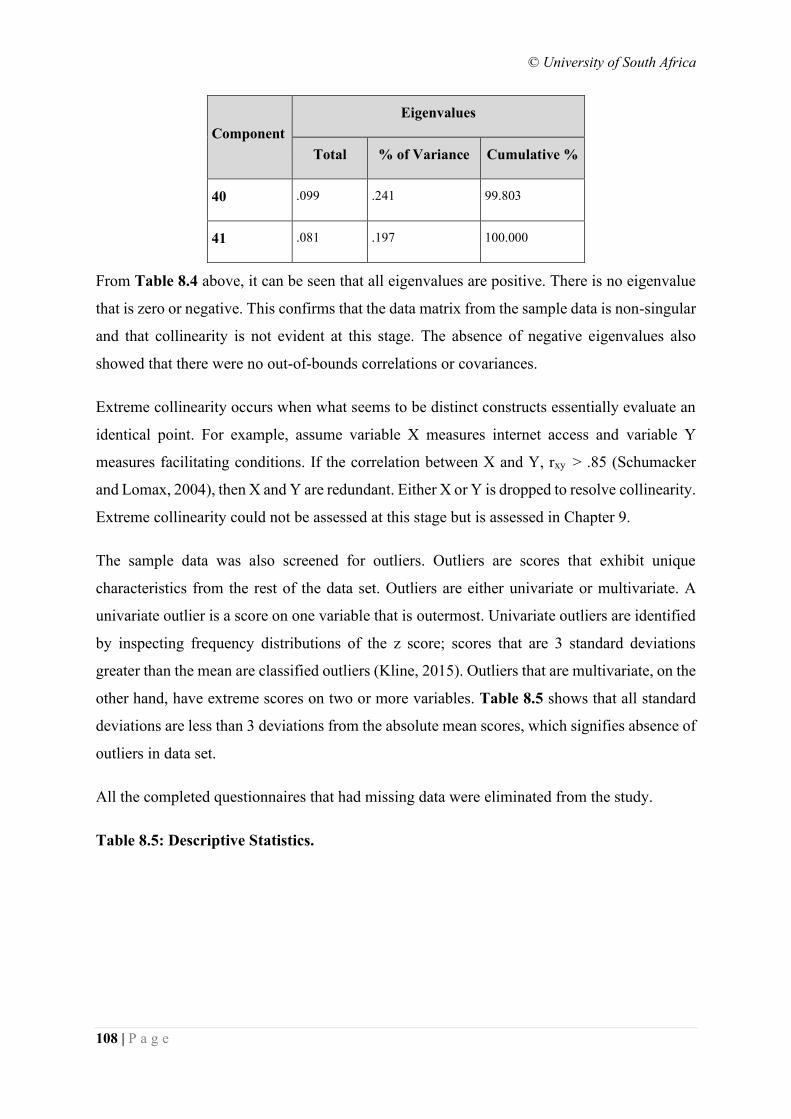
© University of South Africa
108 | P a g e
Component
Eigenvalues
Total % of Variance Cumulative %
40 .099 .241 99.803
41 .081 .197 100.000
From Table 8.4 above, it can be seen that all eigenvalues are positive. There is no eigenvalue
that is zero or negative. This confirms that the data matrix from the sample data is non-singular
and that collinearity is not evident at this stage. The absence of negative eigenvalues also
showed that there were no out-of-bounds correlations or covariances.
Extreme collinearity occurs when what seems to be distinct constructs essentially evaluate an
identical point. For example, assume variable X measures internet access and variable Y
measures facilitating conditions. If the correlation between X and Y, rxy > .85 (Schumacker
and Lomax, 2004), then X and Y are redundant. Either X or Y is dropped to resolve collinearity.
Extreme collinearity could not be assessed at this stage but is assessed in Chapter 9.
The sample data was also screened for outliers. Outliers are scores that exhibit unique
characteristics from the rest of the data set. Outliers are either univariate or multivariate. A
univariate outlier is a score on one variable that is outermost. Univariate outliers are identified
by inspecting frequency distributions of the z score; scores that are 3 standard deviations
greater than the mean are classified outliers (Kline, 2015). Outliers that are multivariate, on the
other hand, have extreme scores on two or more variables. Table 8.5 shows that all standard
deviations are less than 3 deviations from the absolute mean scores, which signifies absence of
outliers in data set.
All the completed questionnaires that had missing data were eliminated from the study.
Table 8.5: Descriptive Statistics.
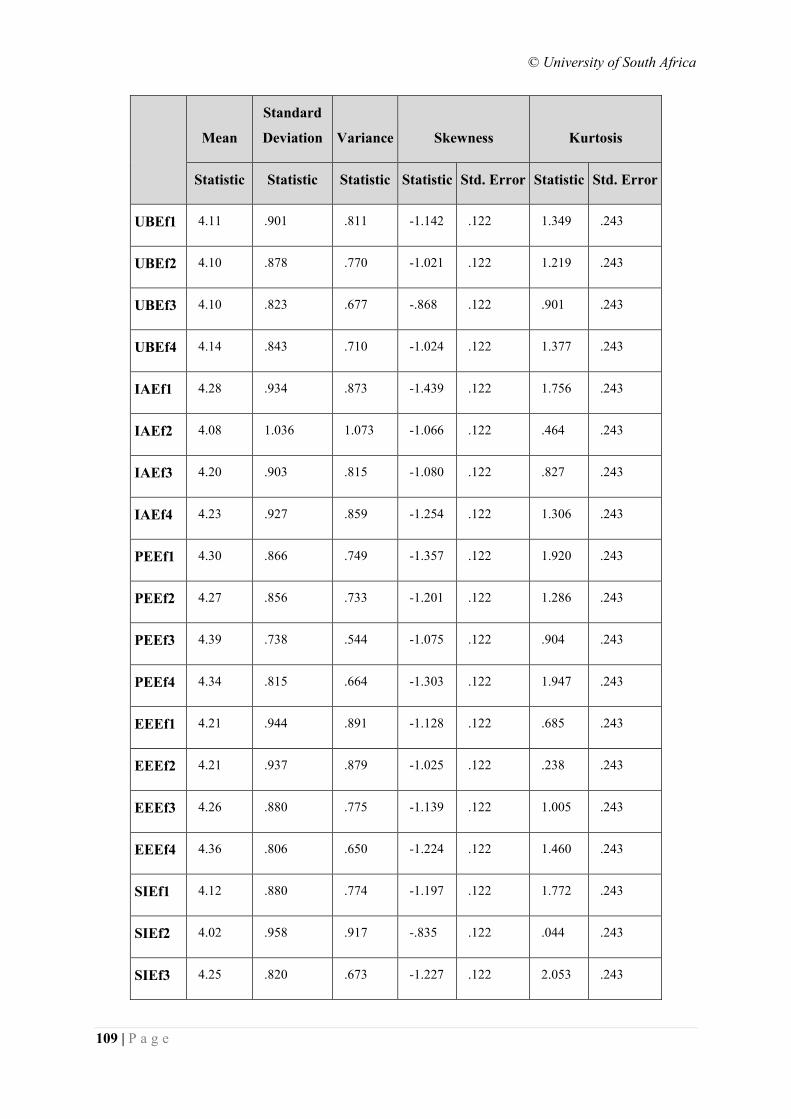
© University of South Africa
109 | P a g e
Mean
Standard
Deviation Variance Skewness Kurtosis
Statistic Statistic Statistic Statistic Std. Error Statistic Std. Error
UBEf1 4.11 .901 .811 -1.142 .122 1.349 .243
UBEf2 4.10 .878 .770 -1.021 .122 1.219 .243
UBEf3 4.10 .823 .677 -.868 .122 .901 .243
UBEf4 4.14 .843 .710 -1.024 .122 1.377 .243
IAEf1 4.28 .934 .873 -1.439 .122 1.756 .243
IAEf2 4.08 1.036 1.073 -1.066 .122 .464 .243
IAEf3 4.20 .903 .815 -1.080 .122 .827 .243
IAEf4 4.23 .927 .859 -1.254 .122 1.306 .243
PEEf1 4.30 .866 .749 -1.357 .122 1.920 .243
PEEf2 4.27 .856 .733 -1.201 .122 1.286 .243
PEEf3 4.39 .738 .544 -1.075 .122 .904 .243
PEEf4 4.34 .815 .664 -1.303 .122 1.947 .243
EEEf1 4.21 .944 .891 -1.128 .122 .685 .243
EEEf2 4.21 .937 .879 -1.025 .122 .238 .243
EEEf3 4.26 .880 .775 -1.139 .122 1.005 .243
EEEf4 4.36 .806 .650 -1.224 .122 1.460 .243
SIEf1 4.12 .880 .774 -1.197 .122 1.772 .243
SIEf2 4.02 .958 .917 -.835 .122 .044 .243
SIEf3 4.25 .820 .673 -1.227 .122 2.053 .243
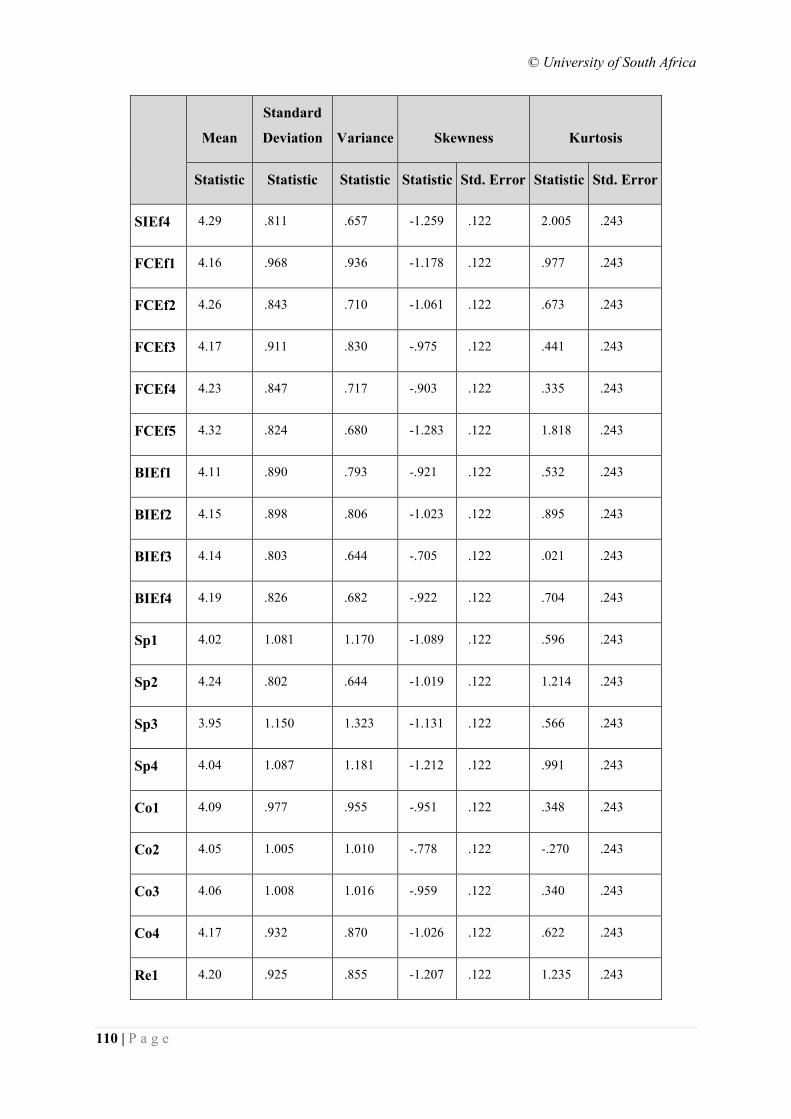
© University of South Africa
110 | P a g e
Mean
Standard
Deviation Variance Skewness Kurtosis
Statistic Statistic Statistic Statistic Std. Error Statistic Std. Error
SIEf4 4.29 .811 .657 -1.259 .122 2.005 .243
FCEf1 4.16 .968 .936 -1.178 .122 .977 .243
FCEf2 4.26 .843 .710 -1.061 .122 .673 .243
FCEf3 4.17 .911 .830 -.975 .122 .441 .243
FCEf4 4.23 .847 .717 -.903 .122 .335 .243
FCEf5 4.32 .824 .680 -1.283 .122 1.818 .243
BIEf1 4.11 .890 .793 -.921 .122 .532 .243
BIEf2 4.15 .898 .806 -1.023 .122 .895 .243
BIEf3 4.14 .803 .644 -.705 .122 .021 .243
BIEf4 4.19 .826 .682 -.922 .122 .704 .243
Sp1 4.02 1.081 1.170 -1.089 .122 .596 .243
Sp2 4.24 .802 .644 -1.019 .122 1.214 .243
Sp3 3.95 1.150 1.323 -1.131 .122 .566 .243
Sp4 4.04 1.087 1.181 -1.212 .122 .991 .243
Co1 4.09 .977 .955 -.951 .122 .348 .243
Co2 4.05 1.005 1.010 -.778 .122 -.270 .243
Co3 4.06 1.008 1.016 -.959 .122 .340 .243
Co4 4.17 .932 .870 -1.026 .122 .622 .243
Re1 4.20 .925 .855 -1.207 .122 1.235 .243
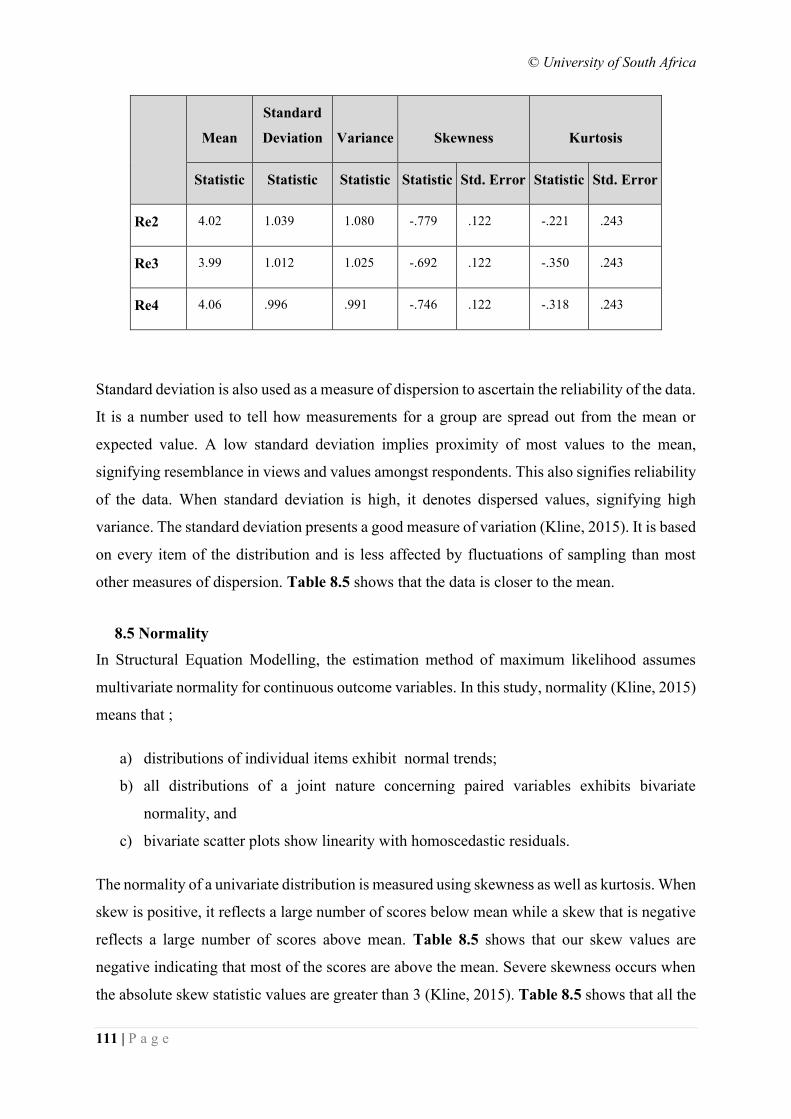
© University of South Africa
111 | P a g e
Mean
Standard
Deviation Variance Skewness Kurtosis
Statistic Statistic Statistic Statistic Std. Error Statistic Std. Error
Re2 4.02 1.039 1.080 -.779 .122 -.221 .243
Re3 3.99 1.012 1.025 -.692 .122 -.350 .243
Re4 4.06 .996 .991 -.746 .122 -.318 .243
Standard deviation is also used as a measure of dispersion to ascertain the reliability of the data.
It is a number used to tell how measurements for a group are spread out from the mean or
expected value. A low standard deviation implies proximity of most values to the mean,
signifying resemblance in views and values amongst respondents. This also signifies reliability
of the data. When standard deviation is high, it denotes dispersed values, signifying high
variance. The standard deviation presents a good measure of variation (Kline, 2015). It is based
on every item of the distribution and is less affected by fluctuations of sampling than most
other measures of dispersion. Table 8.5 shows that the data is closer to the mean.
8.5 Normality
In Structural Equation Modelling, the estimation method of maximum likelihood assumes
multivariate normality for continuous outcome variables. In this study, normality (Kline, 2015)
means that ;
a) distributions of individual items exhibit normal trends;
b) all distributions of a joint nature concerning paired variables exhibits bivariate
normality, and
c) bivariate scatter plots show linearity with homoscedastic residuals.
The normality of a univariate distribution is measured using skewness as well as kurtosis. When
skew is positive, it reflects a large number of scores below mean while a skew that is negative
reflects a large number of scores above mean. Table 8.5 shows that our skew values are
negative indicating that most of the scores are above the mean. Severe skewness occurs when
the absolute skew statistic values are greater than 3 (Kline, 2015). Table 8.5 shows that all the

© University of South Africa
112 | P a g e
absolute statistic values of skewness are less than 2, signifying that the sample data is within
the acceptable margins of normality.
Positive kurtosis shows weightier ends and significantly elevated peak while negative kurtosis
shows the reverse. A distribution that has positive kurtosis is called leptokurtic while one that
has negative kurtosis is platykurtic. Severe kurtosis occurs if the absolute statistic values are
greater than 10 (Kline, 2015). Table 8.5 shows absence of severe kurtosis. This means that
sample data is within the acceptable margins of normality.
Ensuring that sample data fitted the structural model was critical. Section 8.6 describes fit
indices used.
8.6 Model Fit Indices
Model fit establishes extent by which variance-covariance matrix fits structural equation
model. The measurements utilised in model fit includes Chi-square (χ2), Goodness-of-fit Index
(GFI) and adjusted goodness of fit (AGFI), Comparative fit index (CFI), Tucker-Lewis Index
(TLI), Normed Fit Index (NFI), Incremental fit index (IFI), root-mean-square error of
approximation (RMSEA), standardised root-mean-square residual index (SRMR) ) (Cangur
and Ercan, 2017). The CFI, TLI and NFI are model comparison indices that match a given
archetype against an independence archetype, which establishes a baseline (Kline, 2015).
The χ2 statistic is traditionally used to evaluate entire model for fitness. A significant CMIN/df
reflects difference in implied and observed variance-covariance matrices. Such a difference
could arise from a variation in sampling if the statistic is significant. The converse is true when
the χ2 is not significant, the value denotes similarity of the two matrices, depicting a significant
reproduction of the sample variance-covariance matrix by the theoretical model . Researchers
recommend that CMIN/df should not exceed 5.0 (Hooper, Coughlan and Mullen, 2008).
The χ2 model fit criteria is sample size sensitive because increases in sample size (particularly
greater than 200) result in the χ2 statistic which tends to exhibit significant probability levels
(Kline, 2015). On the contrary, as the sample size decreases (especially those less than one
hundred), the χ2 statistic shows non-significant probability measure. Determining an
appropriate sample size is therefore cardinal. For this research, a sample size of 450 serves as
an acceptable threshold that maintains statistical power as well as ensuring stable parameter
estimations and standard errors (Kline, 2015).
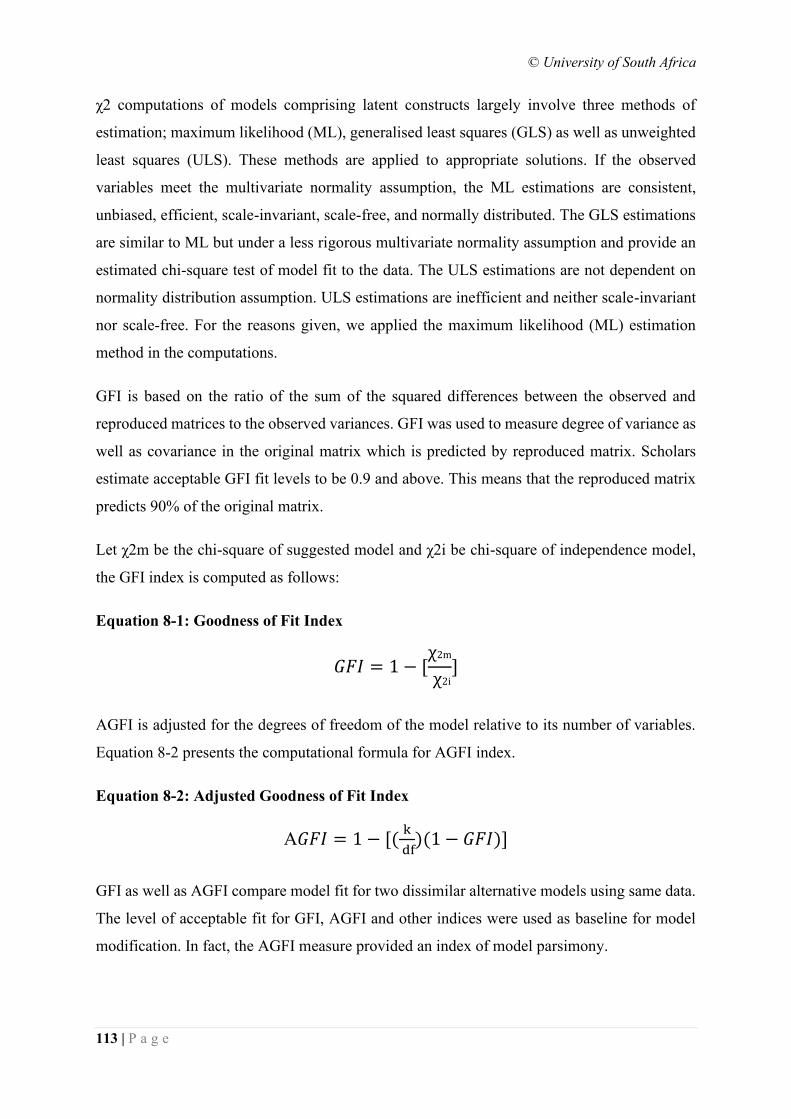
© University of South Africa
113 | P a g e
χ2 computations of models comprising latent constructs largely involve three methods of
estimation; maximum likelihood (ML), generalised least squares (GLS) as well as unweighted
least squares (ULS). These methods are applied to appropriate solutions. If the observed
variables meet the multivariate normality assumption, the ML estimations are consistent,
unbiased, efficient, scale-invariant, scale-free, and normally distributed. The GLS estimations
are similar to ML but under a less rigorous multivariate normality assumption and provide an
estimated chi-square test of model fit to the data. The ULS estimations are not dependent on
normality distribution assumption. ULS estimations are inefficient and neither scale-invariant
nor scale-free. For the reasons given, we applied the maximum likelihood (ML) estimation
method in the computations.
GFI is based on the ratio of the sum of the squared differences between the observed and
reproduced matrices to the observed variances. GFI was used to measure degree of variance as
well as covariance in the original matrix which is predicted by reproduced matrix. Scholars
estimate acceptable GFI fit levels to be 0.9 and above. This means that the reproduced matrix
predicts 90% of the original matrix.
Let χ2m be the chi-square of suggested model and χ2i be chi-square of independence model,
the GFI index is computed as follows:
Equation 8-1: Goodness of Fit Index
𝐺𝐹𝐼 = 1 − [χ2m
χ2i]
AGFI is adjusted for the degrees of freedom of the model relative to its number of variables.
Equation 8-2 presents the computational formula for AGFI index.
Equation 8-2: Adjusted Goodness of Fit Index
A𝐺𝐹𝐼 = 1 − [(k
df)(1 − 𝐺𝐹𝐼)]
GFI as well as AGFI compare model fit for two dissimilar alternative models using same data.
The level of acceptable fit for GFI, AGFI and other indices were used as baseline for model
modification. In fact, the AGFI measure provided an index of model parsimony.
© University of South Africa
114 | P a g e
CFI is an incremental fit index whose values range from zero to one. This index was used to
compare the amount of departure from close fit for the proposed model against that of the
independence (null) model. When CFI = 1, the proposed model has no departure from close
fit. Initially, a CFI value equal to or greater than 0.90 was considered ideal.. Nonetheless,
literature argues for a higher statistical value that is more than 0.90 to guarantee absence of mis
specified models (Hooper, Coughlan and Mullen, 2008). A statistic of CFI ≥ 0.95 suggests
good fit (Hooper, Coughlan and Mullen, 2008) although scholars argue that a CFI value ≥ 0.8
is tolerable (Khalil, 2012).
The Tucker-Lewis index (TLI) was applied to compare alternative models; the proposed model
against the null model. The independence model chi-square value also describes the null model.
A TLI statistic of zero implies no fit while one implies perfect fit. Another index in the same
category as TLI is the incremental fit index (IFI), which resolves aspects of model parsimony.
Unlike other indices, IFI is not sensitive to the size of sample data. Its values also lie between
zero and one.
The objective of model evaluation is to verify its validity and that of its constructs by
determining overall model fit, constructs’ reliability, standardised factor loadings, critical ratio
(CR), as well as correlation between the constructs (Hooper, Coughlan and Mullen, 2008;
Kline, 2015; Cangur and Ercan, 2017).
The model fit statistics provide a basis for comparing specified model (AMfEE) with
independence model to show model fit (Schaupp and Hobbs, 2009). RMSEA is determined by
considering discrepancy of each degree of freedom. A statistic figure of 0.08 or less shows an
acceptable error of estimation (Treiblmaier, Pinterits and Floh, 2004). GFI ranges from zero(no
fit) to one (perfect fit) (Treiblmaier, Pinterits and Floh, 2004). GFI is a stable and robust index
(Iacobucci, 2010). It denotes overall extent of fit and is not modified for degrees of freedom.
Table 8.6 presents the acceptable baselines for fit indices.
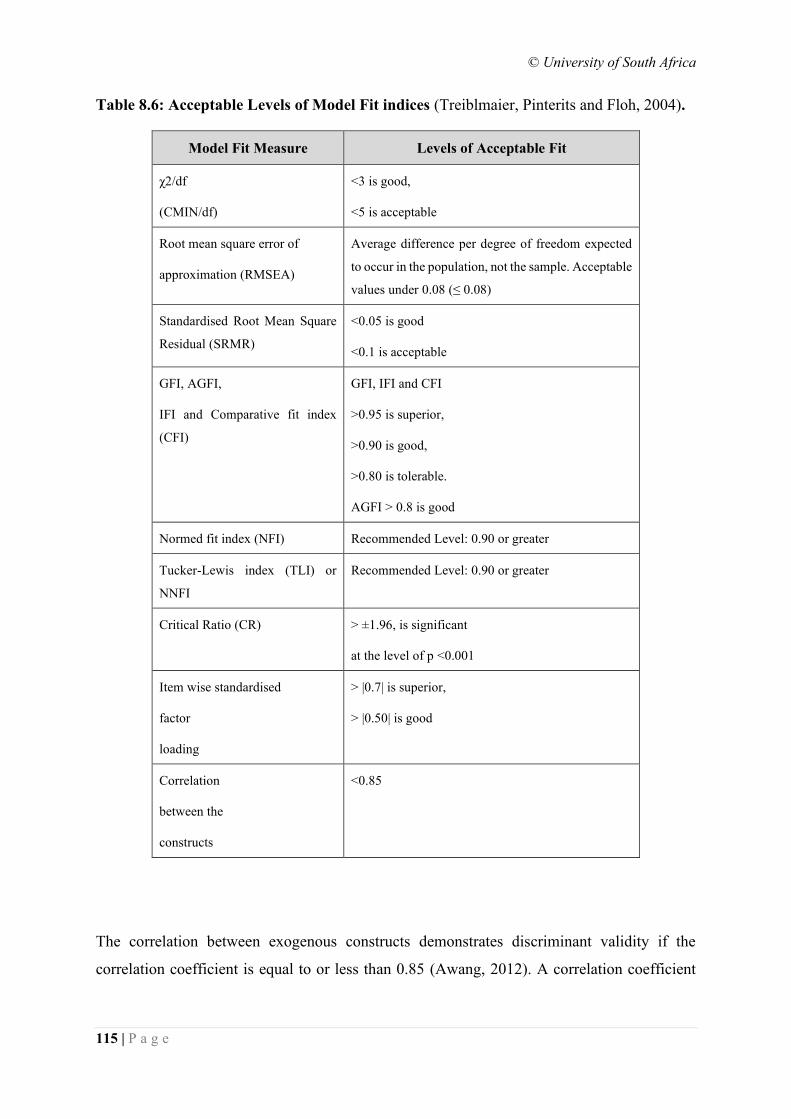
© University of South Africa
115 | P a g e
Table 8.6: Acceptable Levels of Model Fit indices (Treiblmaier, Pinterits and Floh, 2004).
The correlation between exogenous constructs demonstrates discriminant validity if the
correlation coefficient is equal to or less than 0.85 (Awang, 2012). A correlation coefficient
Model Fit Measure Levels of Acceptable Fit
χ2/df
(CMIN/df)
<3 is good,
<5 is acceptable
Root mean square error of
approximation (RMSEA)
Average difference per degree of freedom expected
to occur in the population, not the sample. Acceptable
values under 0.08 (≤ 0.08)
Standardised Root Mean Square
Residual (SRMR)
<0.05 is good
<0.1 is acceptable
GFI, AGFI,
IFI and Comparative fit index
(CFI)
GFI, IFI and CFI
>0.95 is superior,
>0.90 is good,
>0.80 is tolerable.
AGFI > 0.8 is good
Normed fit index (NFI) Recommended Level: 0.90 or greater
Tucker-Lewis index (TLI) or
NNFI
Recommended Level: 0.90 or greater
Critical Ratio (CR) > ±1.96, is significant
at the level of p <0.001
Item wise standardised
factor
loading
> |0.7| is superior,
> |0.50| is good
Correlation
between the
constructs
<0.85
© University of South Africa
116 | P a g e
more than 0.85 denotes multicollinearity problems or that the exogenous constructs are
redundant (Schumacker and Lomax, 2004), which would weaken the analysis of the model.
8.7 Conclusion
This chapter showed that the sample data represented the study population. Data screening
showed that no outliers were detected, the sample data was normally distributed and there was
no evidence of collinearity in the data.
The sample data was therefore found acceptable for further data analysis, which is conducted
in Chapter 9.
© University of South Africa
117 | P a g e
CHAPTER 9
9. DATA ANALYSIS
9.1 Introduction
Chapter 8 discussed data preparation, data fit measurements and evaluated the sample data
against predetermined parameters. This chapter presents analysis based on Structural Equation
Modelling (SEM) in SPSS AMOS and Model 1 of Hayes’ PROCESS macro in SPSS 26.0.
SEM has proven capabilities to assess both measurement and path models to test their
theoretical relationships. SEM is a quantitative research instrument which has recently become
more associated with information systems.
Quantitative research instruments, particularly those involving positivist epistemology, are
employed in capturing as well as measuring theoretical models (Khalil and Nadi, 2012). The
abstract concepts are developed to suggest, corroborate, or reject formerly proposed models
and to derive appropriate deductions as well as outcomes. The reliability as well as validity of
the tool applied is verified by application of appropriate heuristics(Straub, 1989). To that effect,
appropriate investigative methods were applied to define additional constructs which include
Internet Access, African spirituality, African communalism as well as respect for authority and
elders Confirmatory Factory Analysis was then performed to confirm factor loadings for the
model.
9.2 Model Reliability
Model reliability defines extent of precision of loadings in a chosen sample. Loadings or scores
are approximated by considering the difference between one and the sum of observed variance
arising from random error. (Kline, 2015). The weight of the score, also called reliability
coefficient, indicates internal consistency of the model. An experimental reliability coefficient
that is negative is construed to be zero (Kline, 2015) indicating an internal consistency problem.
Such a coefficient requires detailed examination of the item total correlation. Reliability
coefficients differ from factor loadings in that the former indicates the level of internal
consistency while the latter shows matchiness of questions to latent variables.
The type of reliability coefficient reported is called Cronbach’s alpha. It evaluates inner
stability or degree of consistency of responses to which answers are consistent through
measured items. Low stability (i.e. approaching zero or less than .5), means items are so
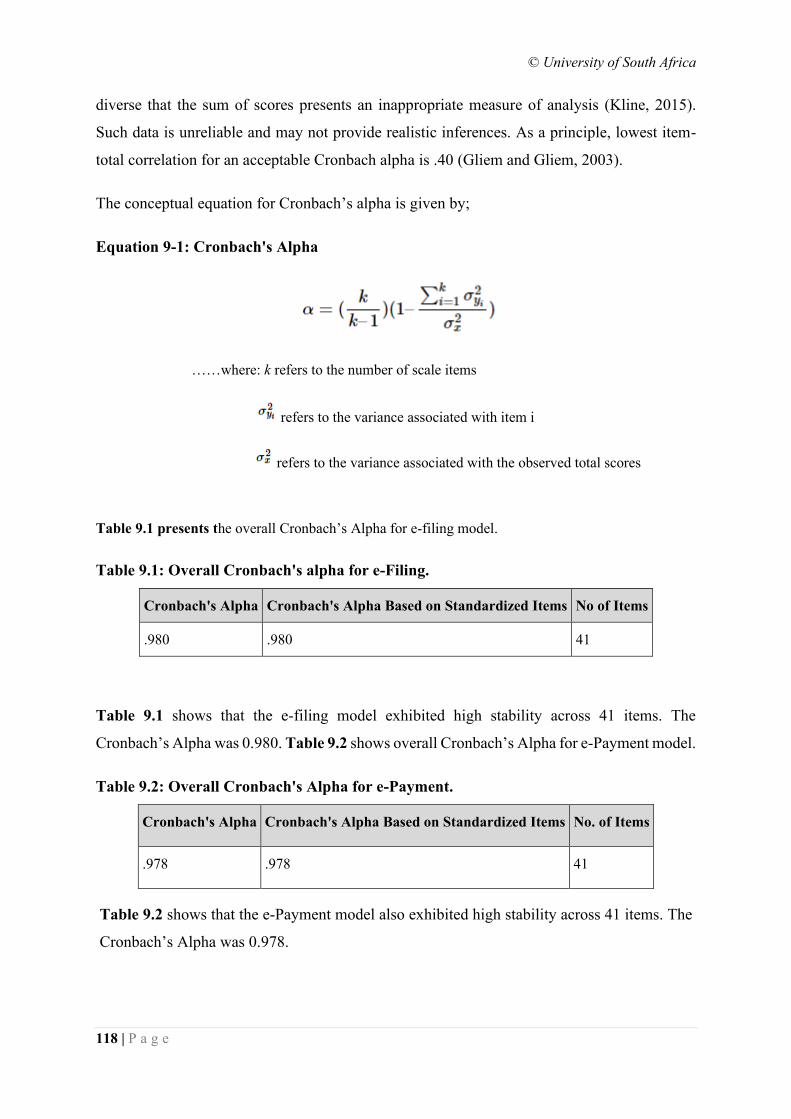
© University of South Africa
118 | P a g e
diverse that the sum of scores presents an inappropriate measure of analysis (Kline, 2015).
Such data is unreliable and may not provide realistic inferences. As a principle, lowest item-
total correlation for an acceptable Cronbach alpha is .40 (Gliem and Gliem, 2003).
The conceptual equation for Cronbach’s alpha is given by;
Equation 9-1: Cronbach's Alpha
Table 9.1 presents the overall Cronbach’s Alpha for e-filing model.
Table 9.1: Overall Cronbach's alpha for e-Filing.
Cronbach's Alpha Cronbach's Alpha Based on Standardized Items No of Items
.980 .980 41
Table 9.1 shows that the e-filing model exhibited high stability across 41 items. The
Cronbach’s Alpha was 0.980. Table 9.2 shows overall Cronbach’s Alpha for e-Payment model.
Table 9.2: Overall Cronbach's Alpha for e-Payment.
Cronbach's Alpha Cronbach's Alpha Based on Standardized Items No. of Items
.978 .978 41
Table 9.2 shows that the e-Payment model also exhibited high stability across 41 items. The
Cronbach’s Alpha was 0.978.
……where: k refers to the number of scale items
refers to the variance associated with item i
refers to the variance associated with the observed total scores
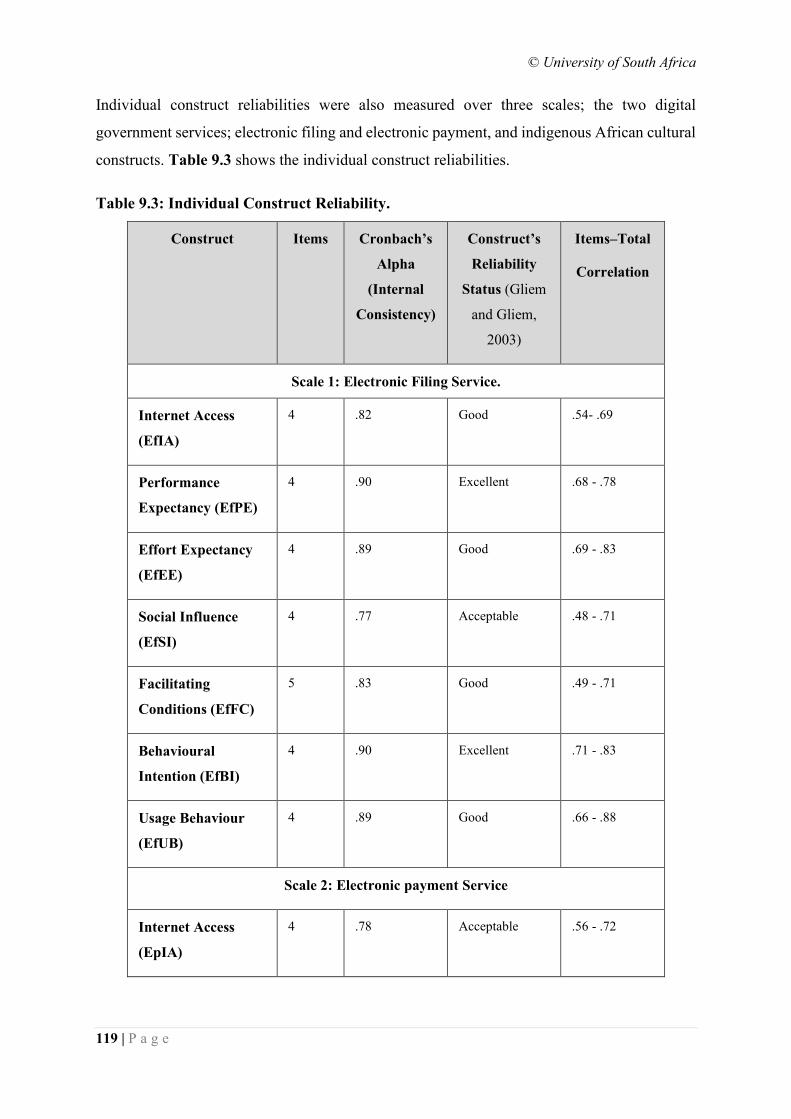
© University of South Africa
119 | P a g e
Individual construct reliabilities were also measured over three scales; the two digital
government services; electronic filing and electronic payment, and indigenous African cultural
constructs. Table 9.3 shows the individual construct reliabilities.
Table 9.3: Individual Construct Reliability.
Construct Items Cronbach’s
Alpha
(Internal
Consistency)
Construct’s
Reliability
Status (Gliem
and Gliem,
2003)
Items–Total
Correlation
Scale 1: Electronic Filing Service.
Internet Access
(EfIA)
4 .82 Good .54- .69
Performance
Expectancy (EfPE)
4 .90 Excellent .68 - .78
Effort Expectancy
(EfEE)
4 .89 Good .69 - .83
Social Influence
(EfSI)
4 .77 Acceptable .48 - .71
Facilitating
Conditions (EfFC)
5 .83 Good .49 - .71
Behavioural
Intention (EfBI)
4 .90 Excellent .71 - .83
Usage Behaviour
(EfUB)
4 .89 Good .66 - .88
Scale 2: Electronic payment Service
Internet Access
(EpIA)
4 .78 Acceptable .56 - .72
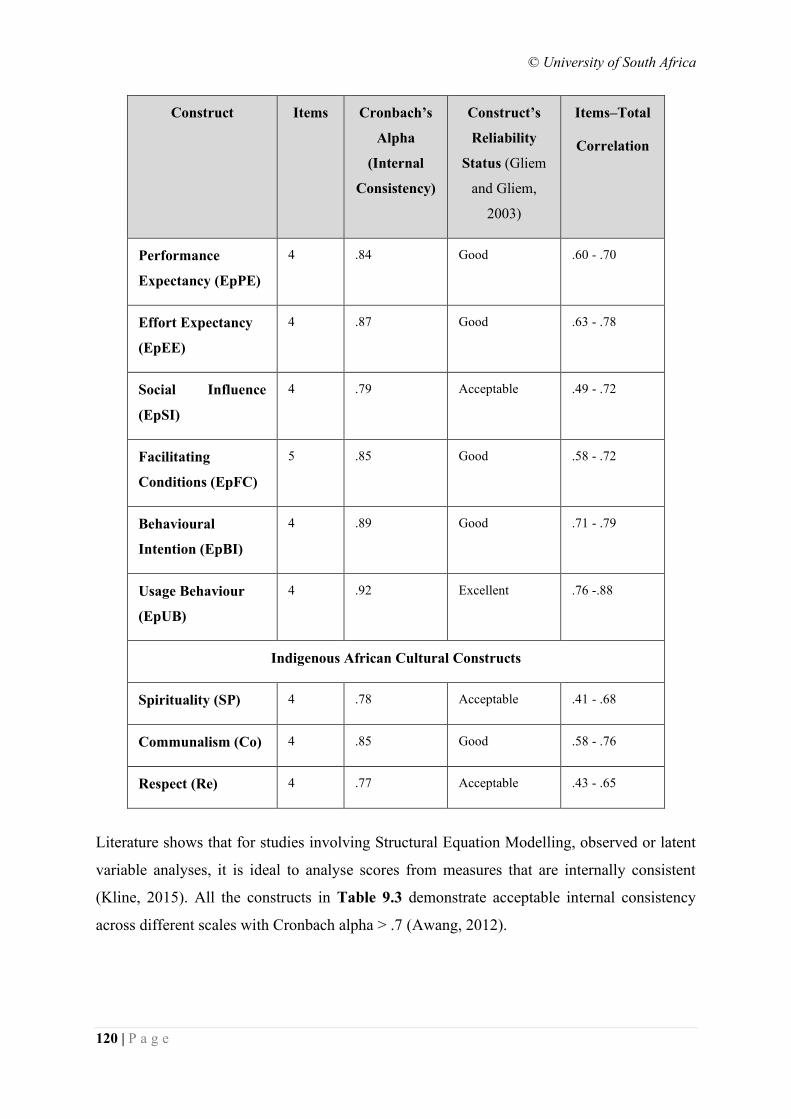
© University of South Africa
120 | P a g e
Construct Items Cronbach’s
Alpha
(Internal
Consistency)
Construct’s
Reliability
Status (Gliem
and Gliem,
2003)
Items–Total
Correlation
Performance
Expectancy (EpPE)
4 .84 Good .60 - .70
Effort Expectancy
(EpEE)
4 .87 Good .63 - .78
Social Influence
(EpSI)
4 .79 Acceptable .49 - .72
Facilitating
Conditions (EpFC)
5 .85 Good .58 - .72
Behavioural
Intention (EpBI)
4 .89 Good .71 - .79
Usage Behaviour
(EpUB)
4 .92 Excellent .76 -.88
Indigenous African Cultural Constructs
Spirituality (SP) 4 .78 Acceptable .41 - .68
Communalism (Co) 4 .85 Good .58 - .76
Respect (Re) 4 .77 Acceptable .43 - .65
Literature shows that for studies involving Structural Equation Modelling, observed or latent
variable analyses, it is ideal to analyse scores from measures that are internally consistent
(Kline, 2015). All the constructs in Table 9.3 demonstrate acceptable internal consistency
across different scales with Cronbach alpha > .7 (Awang, 2012).
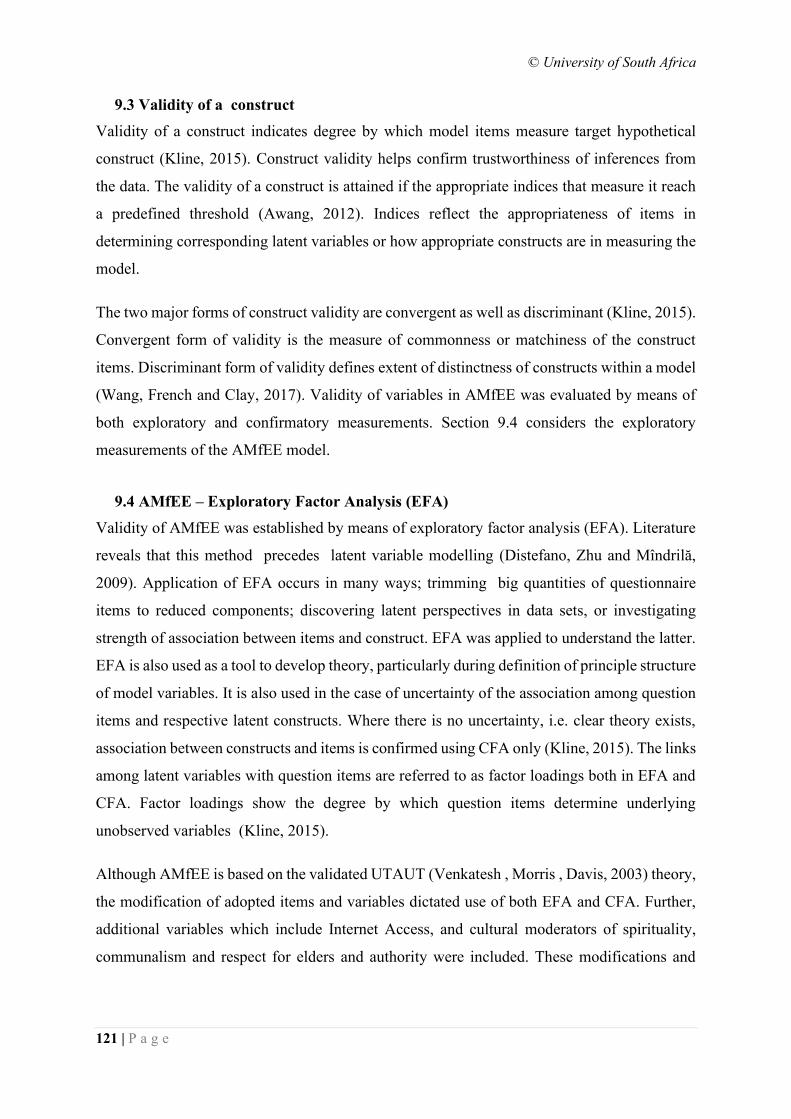
© University of South Africa
121 | P a g e
9.3 Validity of a construct
Validity of a construct indicates degree by which model items measure target hypothetical
construct (Kline, 2015). Construct validity helps confirm trustworthiness of inferences from
the data. The validity of a construct is attained if the appropriate indices that measure it reach
a predefined threshold (Awang, 2012). Indices reflect the appropriateness of items in
determining corresponding latent variables or how appropriate constructs are in measuring the
model.
The two major forms of construct validity are convergent as well as discriminant (Kline, 2015).
Convergent form of validity is the measure of commonness or matchiness of the construct
items. Discriminant form of validity defines extent of distinctness of constructs within a model
(Wang, French and Clay, 2017). Validity of variables in AMfEE was evaluated by means of
both exploratory and confirmatory measurements. Section 9.4 considers the exploratory
measurements of the AMfEE model.
9.4 AMfEE – Exploratory Factor Analysis (EFA)
Validity of AMfEE was established by means of exploratory factor analysis (EFA). Literature
reveals that this method precedes latent variable modelling (Distefano, Zhu and Mîndrilă,
2009). Application of EFA occurs in many ways; trimming big quantities of questionnaire
items to reduced components; discovering latent perspectives in data sets, or investigating
strength of association between items and construct. EFA was applied to understand the latter.
EFA is also used as a tool to develop theory, particularly during definition of principle structure
of model variables. It is also used in the case of uncertainty of the association among question
items and respective latent constructs. Where there is no uncertainty, i.e. clear theory exists,
association between constructs and items is confirmed using CFA only (Kline, 2015). The links
among latent variables with question items are referred to as factor loadings both in EFA and
CFA. Factor loadings show the degree by which question items determine underlying
unobserved variables (Kline, 2015).
Although AMfEE is based on the validated UTAUT (Venkatesh , Morris , Davis, 2003) theory,
the modification of adopted items and variables dictated use of both EFA and CFA. Further,
additional variables which include Internet Access, and cultural moderators of spirituality,
communalism and respect for elders and authority were included. These modifications and
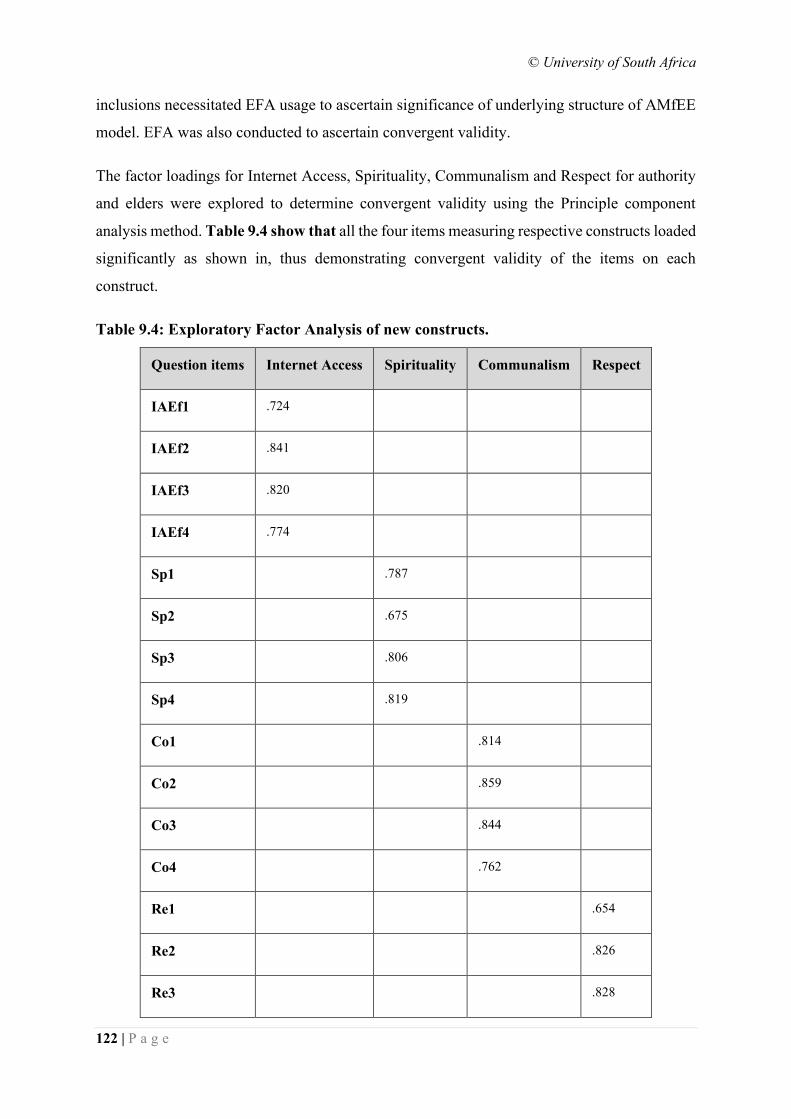
© University of South Africa
122 | P a g e
inclusions necessitated EFA usage to ascertain significance of underlying structure of AMfEE
model. EFA was also conducted to ascertain convergent validity.
The factor loadings for Internet Access, Spirituality, Communalism and Respect for authority
and elders were explored to determine convergent validity using the Principle component
analysis method. Table 9.4 show that all the four items measuring respective constructs loaded
significantly as shown in, thus demonstrating convergent validity of the items on each
construct.
Table 9.4: Exploratory Factor Analysis of new constructs.
Question items Internet Access Spirituality Communalism Respect
IAEf1 .724
IAEf2 .841
IAEf3 .820
IAEf4 .774
Sp1 .787
Sp2 .675
Sp3 .806
Sp4 .819
Co1 .814
Co2 .859
Co3 .844
Co4 .762
Re1 .654
Re2 .826
Re3 .828
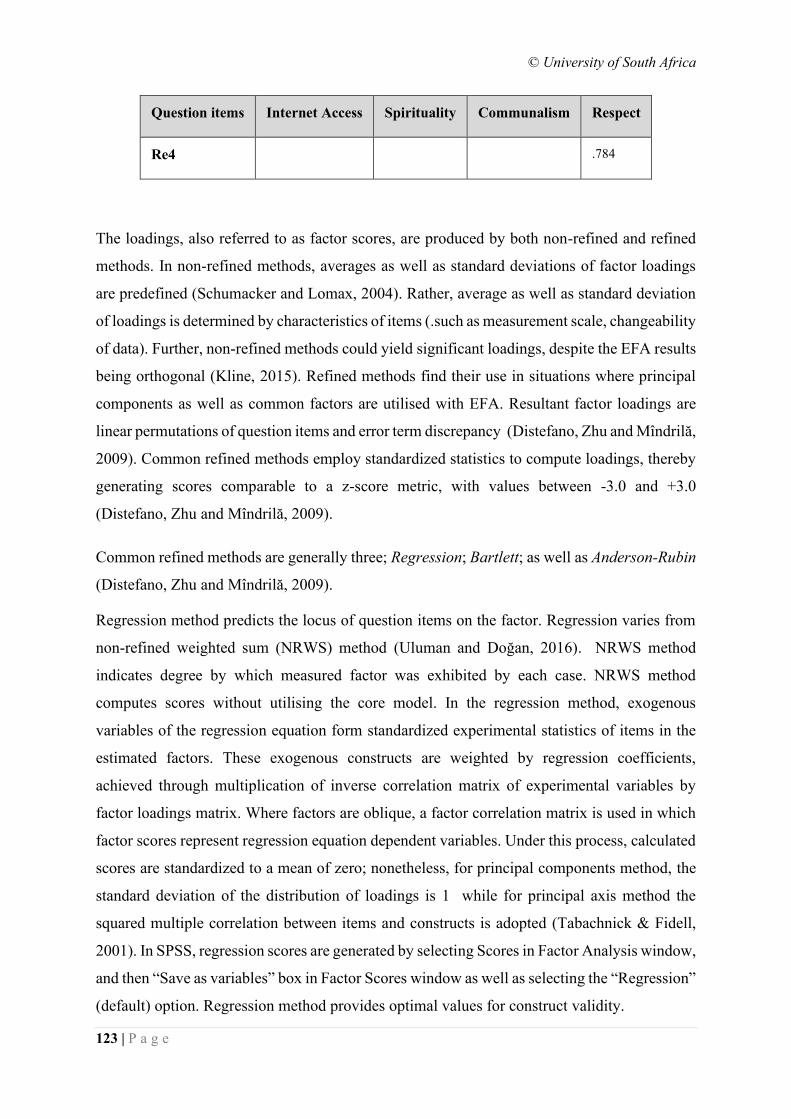
© University of South Africa
123 | P a g e
Question items Internet Access Spirituality Communalism Respect
Re4 .784
The loadings, also referred to as factor scores, are produced by both non-refined and refined
methods. In non-refined methods, averages as well as standard deviations of factor loadings
are predefined (Schumacker and Lomax, 2004). Rather, average as well as standard deviation
of loadings is determined by characteristics of items (.such as measurement scale, changeability
of data). Further, non-refined methods could yield significant loadings, despite the EFA results
being orthogonal (Kline, 2015). Refined methods find their use in situations where principal
components as well as common factors are utilised with EFA. Resultant factor loadings are
linear permutations of question items and error term discrepancy (Distefano, Zhu and Mîndrilă,
2009). Common refined methods employ standardized statistics to compute loadings, thereby
generating scores comparable to a z-score metric, with values between -3.0 and +3.0
(Distefano, Zhu and Mîndrilă, 2009).
Common refined methods are generally three; Regression; Bartlett; as well as Anderson-Rubin
(Distefano, Zhu and Mîndrilă, 2009).
Regression method predicts the locus of question items on the factor. Regression varies from
non-refined weighted sum (NRWS) method (Uluman and Doğan, 2016). NRWS method
indicates degree by which measured factor was exhibited by each case. NRWS method
computes scores without utilising the core model. In the regression method, exogenous
variables of the regression equation form standardized experimental statistics of items in the
estimated factors. These exogenous constructs are weighted by regression coefficients,
achieved through multiplication of inverse correlation matrix of experimental variables by
factor loadings matrix. Where factors are oblique, a factor correlation matrix is used in which
factor scores represent regression equation dependent variables. Under this process, calculated
scores are standardized to a mean of zero; nonetheless, for principal components method, the
standard deviation of the distribution of loadings is 1 while for principal axis method the
squared multiple correlation between items and constructs is adopted (Tabachnick & Fidell,
2001). In SPSS, regression scores are generated by selecting Scores in Factor Analysis window,
and then “Save as variables” box in Factor Scores window as well as selecting the “Regression”
(default) option. Regression method provides optimal values for construct validity.
© University of South Africa
124 | P a g e
With Bartlett’s approach (Ul Hadia, Abdullah and Sentosa, 2016), scores are based on factors
that are common. The sum of squared components for the “error” factors across the set of
variables is reduced, and resultant scores are greatly correlated only to their corresponding
factor but not with other factors. Bartlett factor scores are generated through multiplication of
row vector of observed variables by inverse of diagonal matrix of variances of the unique factor
scores, and the factor pattern matrix of loadings. Resultant values are then multiplied by the
inverse of the matrix product of the matrices of factor loadings and the inverse of the diagonal
matrix of variances of the unique factor scores. Bartlett method calculates scores while
maintaining factors orthogonal (i.e. uncorrelated) (Kline, 2015; Uluman and Doğan, 2016).
Anderson and Rubin (1956) propose a method which is a variant of Bartlett method, in which
the least squares formula is modified to generate uncorrelated factor scores, both with other
factors and with each other. Calculation techniques are more complicated than those of Bartlett
method. Theyrequire multiplication of the vector of exogenous variables by the inverse of a
diagonal matrix of the variances of the disturbance term factor scores, and the factor pattern
matrix of loadings for the exogenous variables. Results are then multiplied by the inversion of
the symmetric square root of the matrix product obtained by multiplying the matrices of
eigenvectors and eigenvalues. Eigenvalues and eigenvectors are utilised in matrix
decomposition factor analysis. Eigenvalues represent farction of variance attributed to
respective factor. An m x m (m being factor quantities) matrix possessing eigenvalues on the
diagonal with 0’s elsewhere is used in the computations. Eigenvectors comprise a single value
for every variable in the factor analysis. The product of eigenvectors and square root of
eigenvalues generates orthogonal factor loadings, possessing a mean of 0 and a standard
deviation of 1. SPSS employs Anderson and Rubin by selecting it in Factor Analysis: Factor
Scores window.
Structural Equation Modelling approach, adopted in this study, makes use of regression method
in which regression weights serve as standardised factor loadings for calculating scores. The
regression method is therefore purposely used in this study.
The items that load comprehensively or provide a clean load on a specific factor without cross-
loading on others exhibit convergent validity. Conversely, items that cross-load on other factors
demonstrate discriminant validity (Gefen, Rigdon and Straub, 2011).
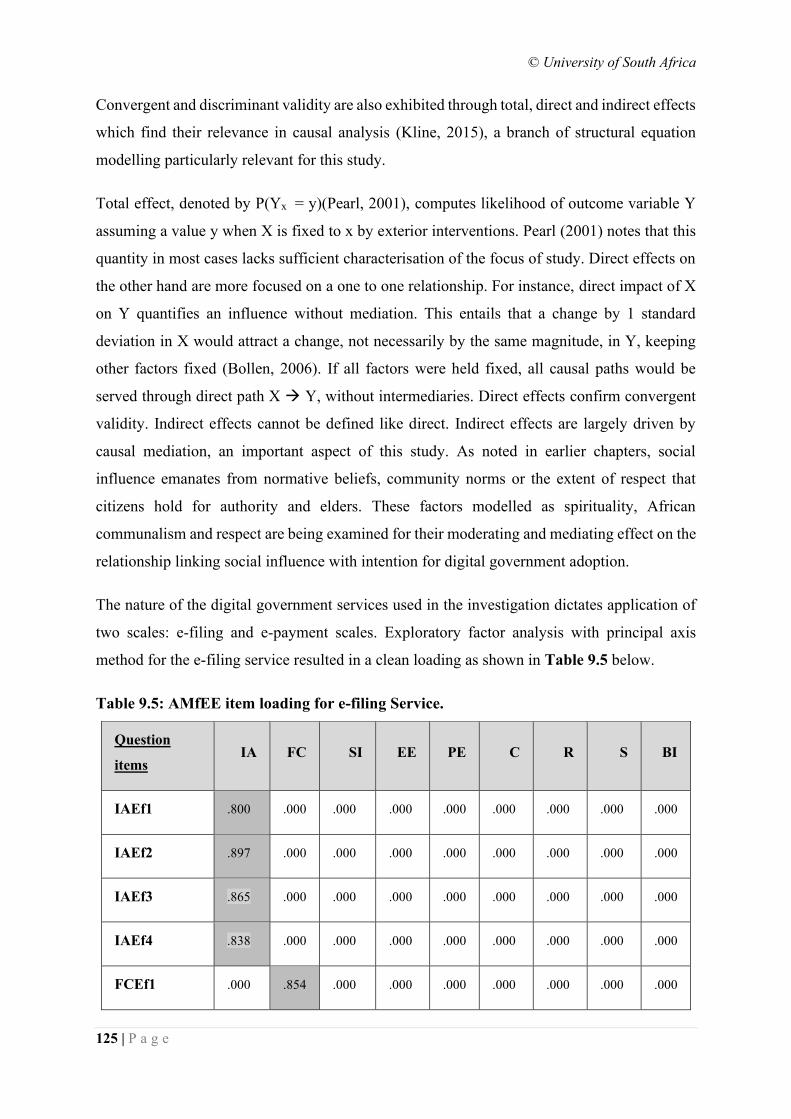
© University of South Africa
125 | P a g e
Convergent and discriminant validity are also exhibited through total, direct and indirect effects
which find their relevance in causal analysis (Kline, 2015), a branch of structural equation
modelling particularly relevant for this study.
Total effect, denoted by P(Yx = y)(Pearl, 2001), computes likelihood of outcome variable Y
assuming a value y when X is fixed to x by exterior interventions. Pearl (2001) notes that this
quantity in most cases lacks sufficient characterisation of the focus of study. Direct effects on
the other hand are more focused on a one to one relationship. For instance, direct impact of X
on Y quantifies an influence without mediation. This entails that a change by 1 standard
deviation in X would attract a change, not necessarily by the same magnitude, in Y, keeping
other factors fixed (Bollen, 2006). If all factors were held fixed, all causal paths would be
served through direct path X → Y, without intermediaries. Direct effects confirm convergent
validity. Indirect effects cannot be defined like direct. Indirect effects are largely driven by
causal mediation, an important aspect of this study. As noted in earlier chapters, social
influence emanates from normative beliefs, community norms or the extent of respect that
citizens hold for authority and elders. These factors modelled as spirituality, African
communalism and respect are being examined for their moderating and mediating effect on the
relationship linking social influence with intention for digital government adoption.
The nature of the digital government services used in the investigation dictates application of
two scales: e-filing and e-payment scales. Exploratory factor analysis with principal axis
method for the e-filing service resulted in a clean loading as shown in Table 9.5 below.
Table 9.5: AMfEE item loading for e-filing Service.
Question
items IA FC SI EE PE C R S BI
IAEf1 .800 .000 .000 .000 .000 .000 .000 .000 .000
IAEf2 .897 .000 .000 .000 .000 .000 .000 .000 .000
IAEf3 .865 .000 .000 .000 .000 .000 .000 .000 .000
IAEf4 .838 .000 .000 .000 .000 .000 .000 .000 .000
FCEf1 .000 .854 .000 .000 .000 .000 .000 .000 .000
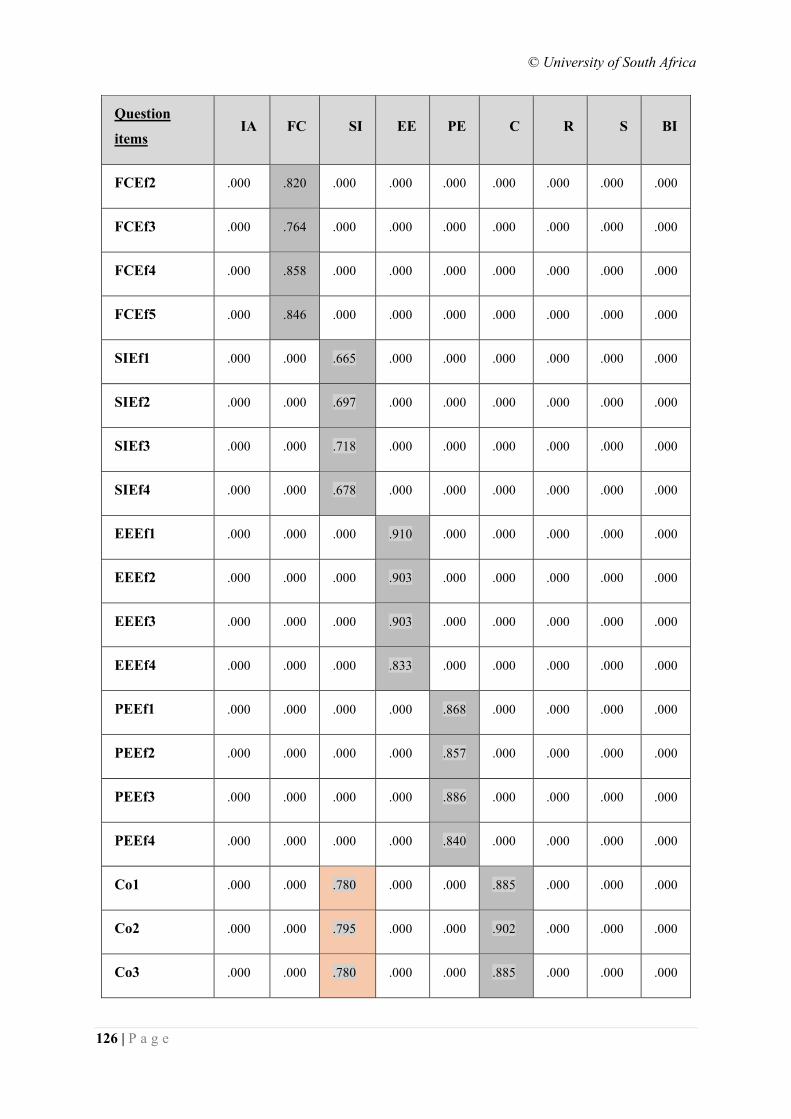
© University of South Africa
126 | P a g e
Question
items IA FC SI EE PE C R S BI
FCEf2 .000 .820 .000 .000 .000 .000 .000 .000 .000
FCEf3 .000 .764 .000 .000 .000 .000 .000 .000 .000
FCEf4 .000 .858 .000 .000 .000 .000 .000 .000 .000
FCEf5 .000 .846 .000 .000 .000 .000 .000 .000 .000
SIEf1 .000 .000 .665 .000 .000 .000 .000 .000 .000
SIEf2 .000 .000 .697 .000 .000 .000 .000 .000 .000
SIEf3 .000 .000 .718 .000 .000 .000 .000 .000 .000
SIEf4 .000 .000 .678 .000 .000 .000 .000 .000 .000
EEEf1 .000 .000 .000 .910 .000 .000 .000 .000 .000
EEEf2 .000 .000 .000 .903 .000 .000 .000 .000 .000
EEEf3 .000 .000 .000 .903 .000 .000 .000 .000 .000
EEEf4 .000 .000 .000 .833 .000 .000 .000 .000 .000
PEEf1 .000 .000 .000 .000 .868 .000 .000 .000 .000
PEEf2 .000 .000 .000 .000 .857 .000 .000 .000 .000
PEEf3 .000 .000 .000 .000 .886 .000 .000 .000 .000
PEEf4 .000 .000 .000 .000 .840 .000 .000 .000 .000
Co1 .000 .000 .780 .000 .000 .885 .000 .000 .000
Co2 .000 .000 .795 .000 .000 .902 .000 .000 .000
Co3 .000 .000 .780 .000 .000 .885 .000 .000 .000
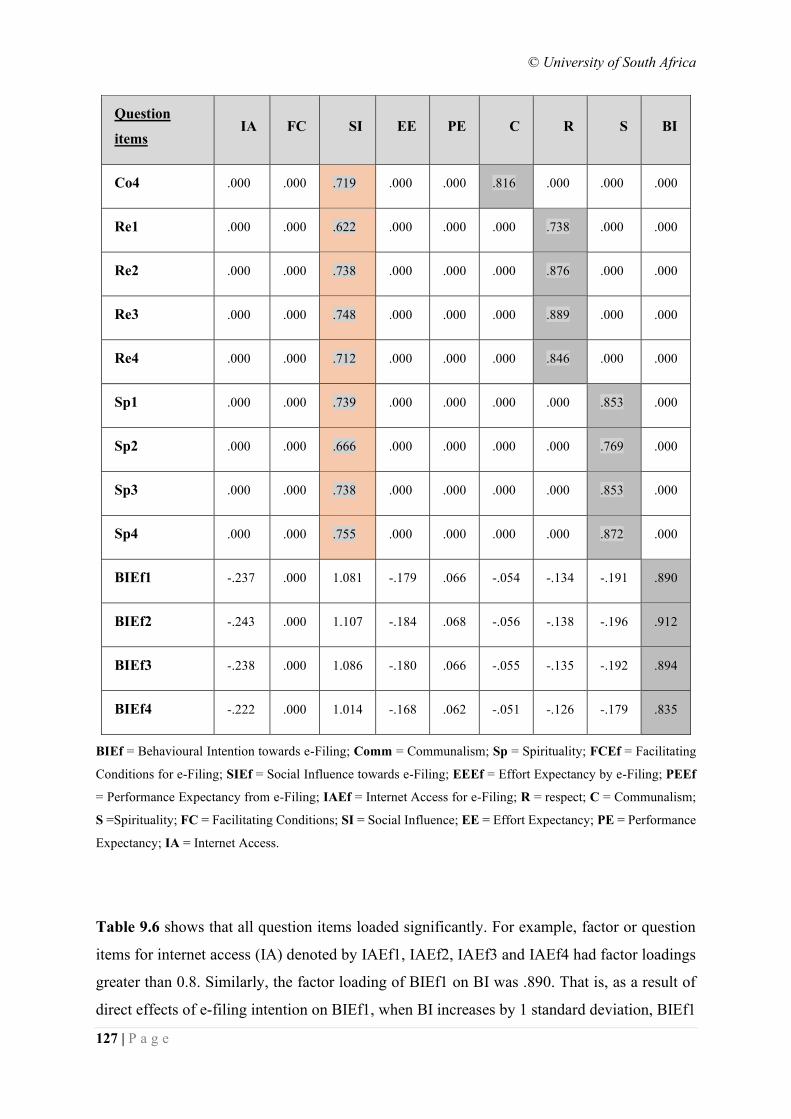
© University of South Africa
127 | P a g e
Question
items IA FC SI EE PE C R S BI
Co4 .000 .000 .719 .000 .000 .816 .000 .000 .000
Re1 .000 .000 .622 .000 .000 .000 .738 .000 .000
Re2 .000 .000 .738 .000 .000 .000 .876 .000 .000
Re3 .000 .000 .748 .000 .000 .000 .889 .000 .000
Re4 .000 .000 .712 .000 .000 .000 .846 .000 .000
Sp1 .000 .000 .739 .000 .000 .000 .000 .853 .000
Sp2 .000 .000 .666 .000 .000 .000 .000 .769 .000
Sp3 .000 .000 .738 .000 .000 .000 .000 .853 .000
Sp4 .000 .000 .755 .000 .000 .000 .000 .872 .000
BIEf1 -.237 .000 1.081 -.179 .066 -.054 -.134 -.191 .890
BIEf2 -.243 .000 1.107 -.184 .068 -.056 -.138 -.196 .912
BIEf3 -.238 .000 1.086 -.180 .066 -.055 -.135 -.192 .894
BIEf4 -.222 .000 1.014 -.168 .062 -.051 -.126 -.179 .835
BIEf = Behavioural Intention towards e-Filing; Comm = Communalism; Sp = Spirituality; FCEf = Facilitating
Conditions for e-Filing; SIEf = Social Influence towards e-Filing; EEEf = Effort Expectancy by e-Filing; PEEf
= Performance Expectancy from e-Filing; IAEf = Internet Access for e-Filing; R = respect; C = Communalism;
S =Spirituality; FC = Facilitating Conditions; SI = Social Influence; EE = Effort Expectancy; PE = Performance
Expectancy; IA = Internet Access.
Table 9.6 shows that all question items loaded significantly. For example, factor or question
items for internet access (IA) denoted by IAEf1, IAEf2, IAEf3 and IAEf4 had factor loadings
greater than 0.8. Similarly, the factor loading of BIEf1 on BI was .890. That is, as a result of
direct effects of e-filing intention on BIEf1, when BI increases by 1 standard deviation, BIEf1
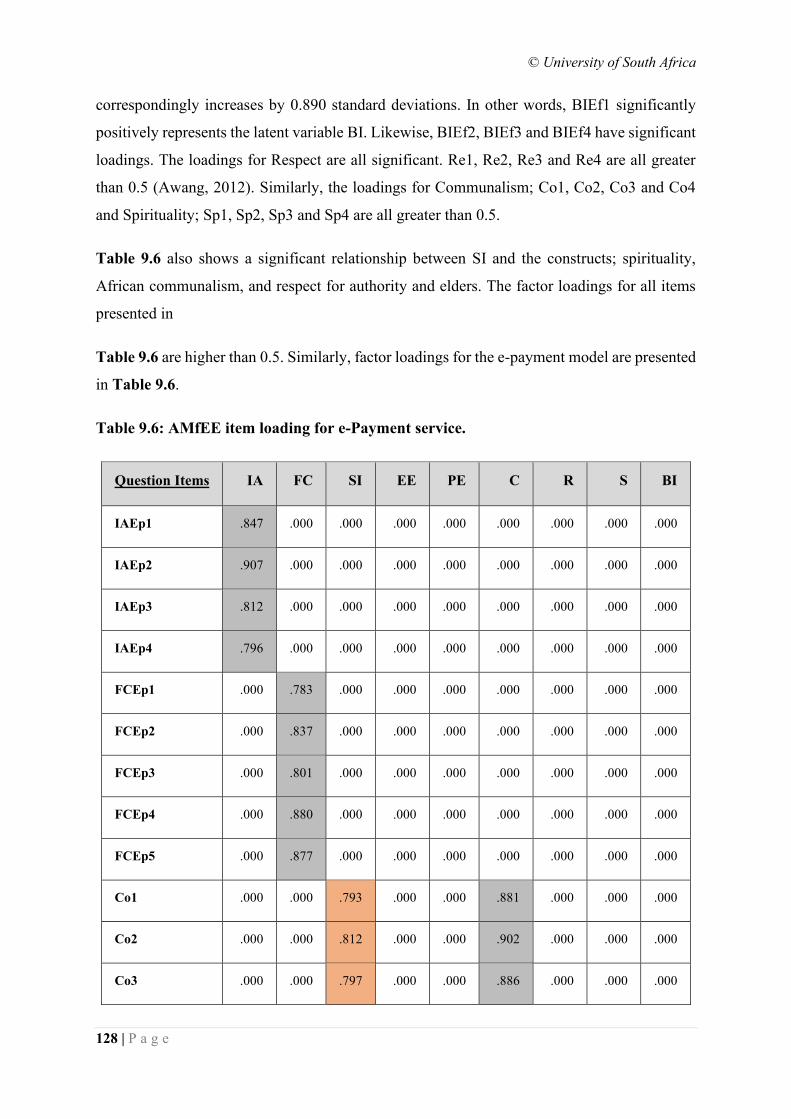
© University of South Africa
128 | P a g e
correspondingly increases by 0.890 standard deviations. In other words, BIEf1 significantly
positively represents the latent variable BI. Likewise, BIEf2, BIEf3 and BIEf4 have significant
loadings. The loadings for Respect are all significant. Re1, Re2, Re3 and Re4 are all greater
than 0.5 (Awang, 2012). Similarly, the loadings for Communalism; Co1, Co2, Co3 and Co4
and Spirituality; Sp1, Sp2, Sp3 and Sp4 are all greater than 0.5.
Table 9.6 also shows a significant relationship between SI and the constructs; spirituality,
African communalism, and respect for authority and elders. The factor loadings for all items
presented in
Table 9.6 are higher than 0.5. Similarly, factor loadings for the e-payment model are presented
in Table 9.6.
Table 9.6: AMfEE item loading for e-Payment service.
Question Items IA FC SI EE PE C R S BI
IAEp1 .847 .000 .000 .000 .000 .000 .000 .000 .000
IAEp2 .907 .000 .000 .000 .000 .000 .000 .000 .000
IAEp3 .812 .000 .000 .000 .000 .000 .000 .000 .000
IAEp4 .796 .000 .000 .000 .000 .000 .000 .000 .000
FCEp1 .000 .783 .000 .000 .000 .000 .000 .000 .000
FCEp2 .000 .837 .000 .000 .000 .000 .000 .000 .000
FCEp3 .000 .801 .000 .000 .000 .000 .000 .000 .000
FCEp4 .000 .880 .000 .000 .000 .000 .000 .000 .000
FCEp5 .000 .877 .000 .000 .000 .000 .000 .000 .000
Co1 .000 .000 .793 .000 .000 .881 .000 .000 .000
Co2 .000 .000 .812 .000 .000 .902 .000 .000 .000
Co3 .000 .000 .797 .000 .000 .886 .000 .000 .000
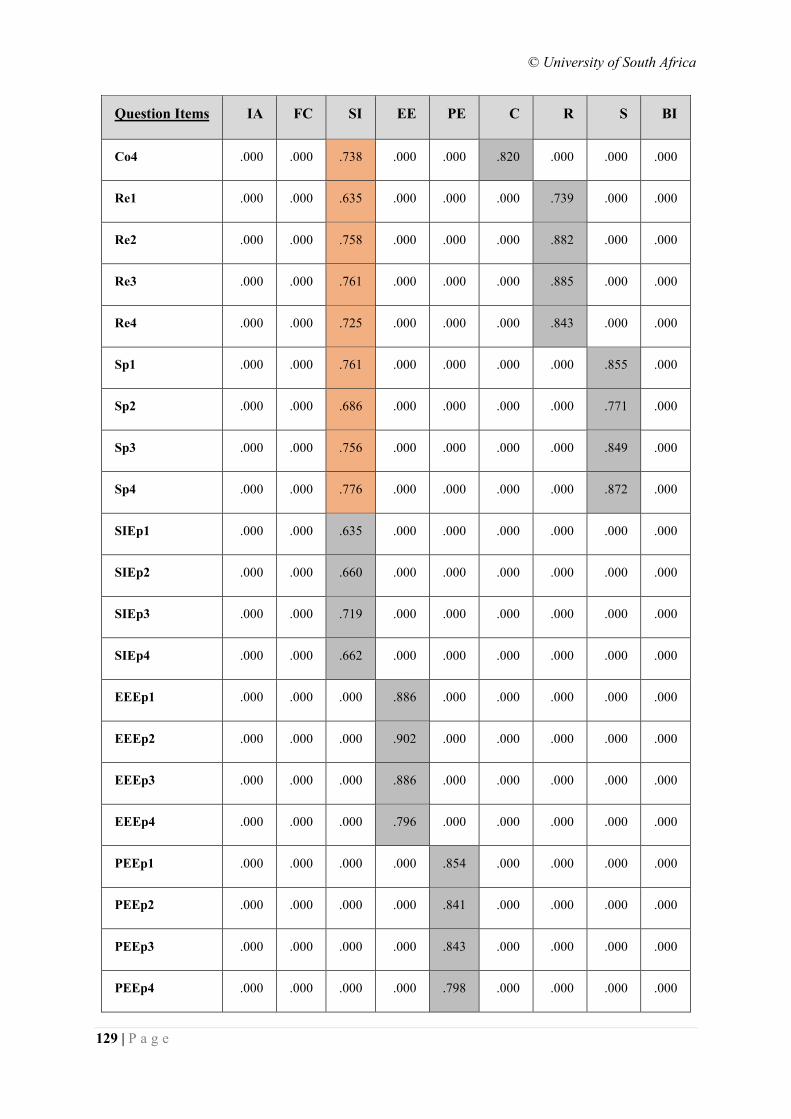
© University of South Africa
129 | P a g e
Question Items IA FC SI EE PE C R S BI
Co4 .000 .000 .738 .000 .000 .820 .000 .000 .000
Re1 .000 .000 .635 .000 .000 .000 .739 .000 .000
Re2 .000 .000 .758 .000 .000 .000 .882 .000 .000
Re3 .000 .000 .761 .000 .000 .000 .885 .000 .000
Re4 .000 .000 .725 .000 .000 .000 .843 .000 .000
Sp1 .000 .000 .761 .000 .000 .000 .000 .855 .000
Sp2 .000 .000 .686 .000 .000 .000 .000 .771 .000
Sp3 .000 .000 .756 .000 .000 .000 .000 .849 .000
Sp4 .000 .000 .776 .000 .000 .000 .000 .872 .000
SIEp1 .000 .000 .635 .000 .000 .000 .000 .000 .000
SIEp2 .000 .000 .660 .000 .000 .000 .000 .000 .000
SIEp3 .000 .000 .719 .000 .000 .000 .000 .000 .000
SIEp4 .000 .000 .662 .000 .000 .000 .000 .000 .000
EEEp1 .000 .000 .000 .886 .000 .000 .000 .000 .000
EEEp2 .000 .000 .000 .902 .000 .000 .000 .000 .000
EEEp3 .000 .000 .000 .886 .000 .000 .000 .000 .000
EEEp4 .000 .000 .000 .796 .000 .000 .000 .000 .000
PEEp1 .000 .000 .000 .000 .854 .000 .000 .000 .000
PEEp2 .000 .000 .000 .000 .841 .000 .000 .000 .000
PEEp3 .000 .000 .000 .000 .843 .000 .000 .000 .000
PEEp4 .000 .000 .000 .000 .798 .000 .000 .000 .000
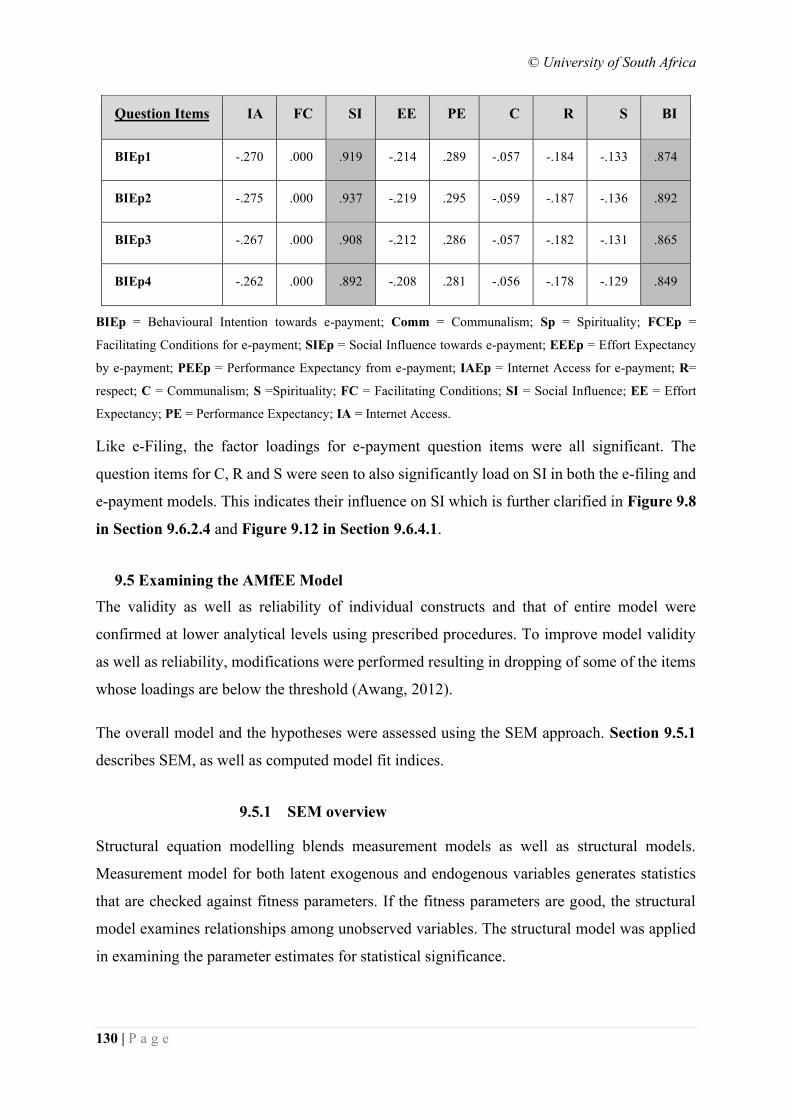
© University of South Africa
130 | P a g e
Question Items IA FC SI EE PE C R S BI
BIEp1 -.270 .000 .919 -.214 .289 -.057 -.184 -.133 .874
BIEp2 -.275 .000 .937 -.219 .295 -.059 -.187 -.136 .892
BIEp3 -.267 .000 .908 -.212 .286 -.057 -.182 -.131 .865
BIEp4 -.262 .000 .892 -.208 .281 -.056 -.178 -.129 .849
BIEp = Behavioural Intention towards e-payment; Comm = Communalism; Sp = Spirituality; FCEp =
Facilitating Conditions for e-payment; SIEp = Social Influence towards e-payment; EEEp = Effort Expectancy
by e-payment; PEEp = Performance Expectancy from e-payment; IAEp = Internet Access for e-payment; R=
respect; C = Communalism; S =Spirituality; FC = Facilitating Conditions; SI = Social Influence; EE = Effort
Expectancy; PE = Performance Expectancy; IA = Internet Access.
Like e-Filing, the factor loadings for e-payment question items were all significant. The
question items for C, R and S were seen to also significantly load on SI in both the e-filing and
e-payment models. This indicates their influence on SI which is further clarified in Figure 9.8
in Section 9.6.2.4 and Figure 9.12 in Section 9.6.4.1.
9.5 Examining the AMfEE Model
The validity as well as reliability of individual constructs and that of entire model were
confirmed at lower analytical levels using prescribed procedures. To improve model validity
as well as reliability, modifications were performed resulting in dropping of some of the items
whose loadings are below the threshold (Awang, 2012).
The overall model and the hypotheses were assessed using the SEM approach. Section 9.5.1
describes SEM, as well as computed model fit indices.
9.5.1 SEM overview
Structural equation modelling blends measurement models as well as structural models.
Measurement model for both latent exogenous and endogenous variables generates statistics
that are checked against fitness parameters. If the fitness parameters are good, the structural
model examines relationships among unobserved variables. The structural model was applied
in examining the parameter estimates for statistical significance.
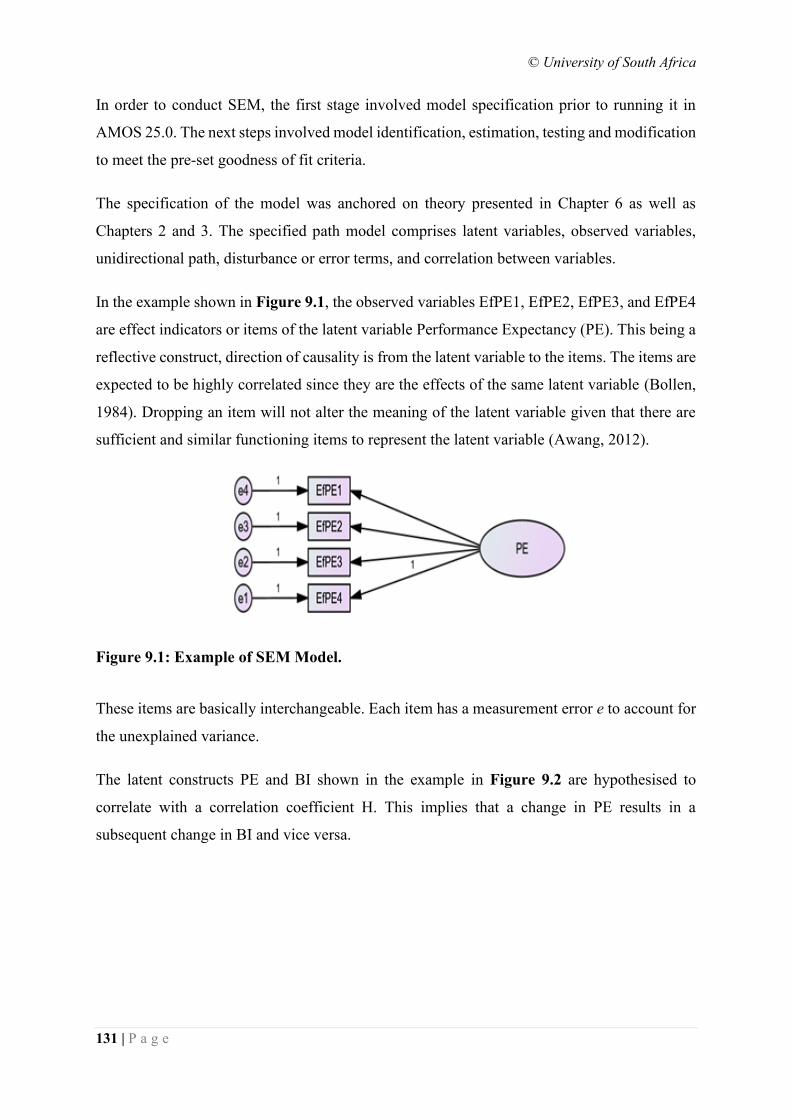
© University of South Africa
131 | P a g e
In order to conduct SEM, the first stage involved model specification prior to running it in
AMOS 25.0. The next steps involved model identification, estimation, testing and modification
to meet the pre-set goodness of fit criteria.
The specification of the model was anchored on theory presented in Chapter 6 as well as
Chapters 2 and 3. The specified path model comprises latent variables, observed variables,
unidirectional path, disturbance or error terms, and correlation between variables.
In the example shown in Figure 9.1, the observed variables EfPE1, EfPE2, EfPE3, and EfPE4
are effect indicators or items of the latent variable Performance Expectancy (PE). This being a
reflective construct, direction of causality is from the latent variable to the items. The items are
expected to be highly correlated since they are the effects of the same latent variable (Bollen,
1984). Dropping an item will not alter the meaning of the latent variable given that there are
sufficient and similar functioning items to represent the latent variable (Awang, 2012).
Figure 9.1: Example of SEM Model.
These items are basically interchangeable. Each item has a measurement error e to account for
the unexplained variance.
The latent constructs PE and BI shown in the example in Figure 9.2 are hypothesised to
correlate with a correlation coefficient H. This implies that a change in PE results in a
subsequent change in BI and vice versa.
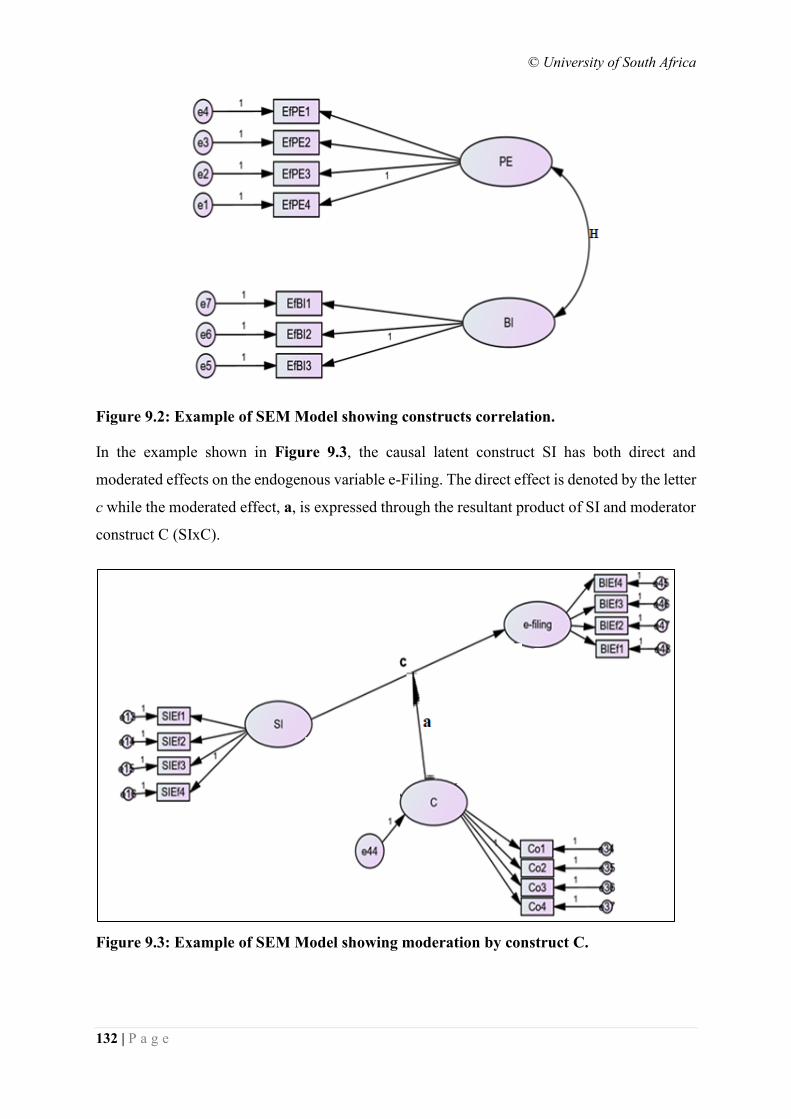
© University of South Africa
132 | P a g e
Figure 9.2: Example of SEM Model showing constructs correlation.
In the example shown in Figure 9.3, the causal latent construct SI has both direct and
moderated effects on the endogenous variable e-Filing. The direct effect is denoted by the letter
c while the moderated effect, a, is expressed through the resultant product of SI and moderator
construct C (SIxC).
Figure 9.3: Example of SEM Model showing moderation by construct C.
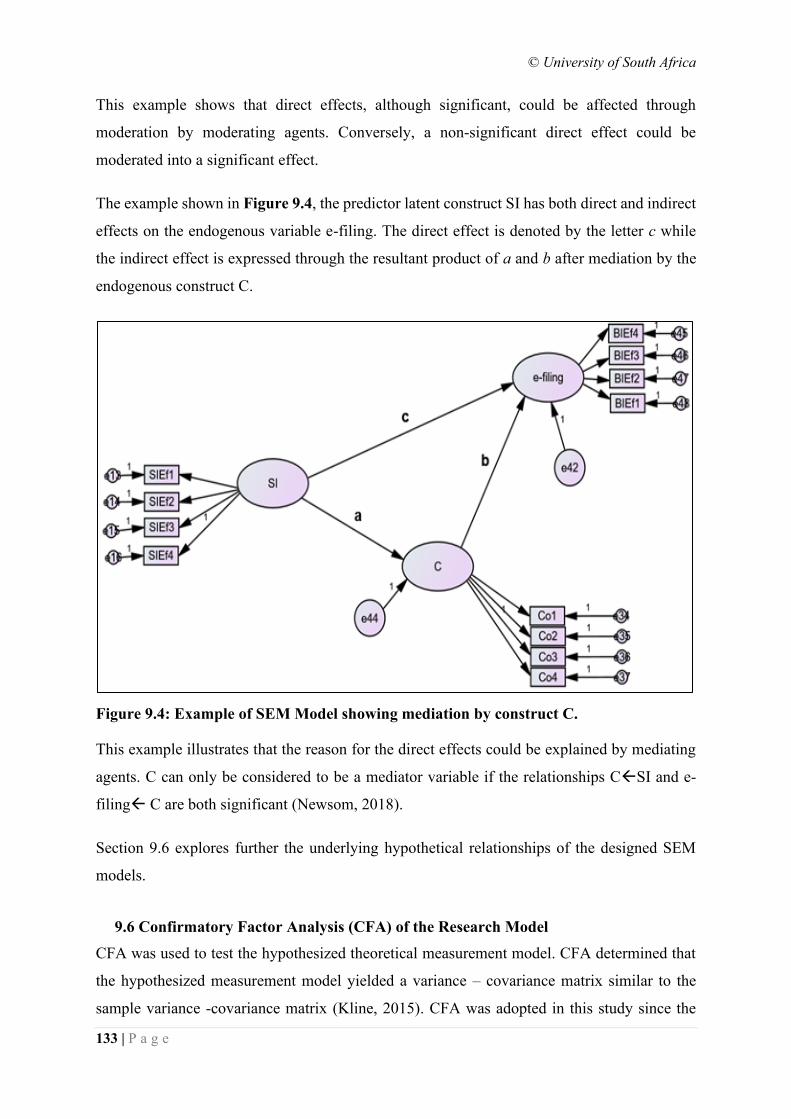
© University of South Africa
133 | P a g e
This example shows that direct effects, although significant, could be affected through
moderation by moderating agents. Conversely, a non-significant direct effect could be
moderated into a significant effect.
The example shown in Figure 9.4, the predictor latent construct SI has both direct and indirect
effects on the endogenous variable e-filing. The direct effect is denoted by the letter c while
the indirect effect is expressed through the resultant product of a and b after mediation by the
endogenous construct C.
Figure 9.4: Example of SEM Model showing mediation by construct C.
This example illustrates that the reason for the direct effects could be explained by mediating
agents. C can only be considered to be a mediator variable if the relationships CSI and e-
filing C are both significant (Newsom, 2018).
Section 9.6 explores further the underlying hypothetical relationships of the designed SEM
models.
9.6 Confirmatory Factor Analysis (CFA) of the Research Model
CFA was used to test the hypothesized theoretical measurement model. CFA determined that
the hypothesized measurement model yielded a variance – covariance matrix similar to the
sample variance -covariance matrix (Kline, 2015). CFA was adopted in this study since the
© University of South Africa
134 | P a g e
underpinning theory for the study is already established, UTAUT. The addition of IA to the
model and inclusion of new moderators necessitated the use of Exploratory Factor Analysis
(EFA). The analysis was done using the statistical Analysis of Moments Structure (AMOS)
software version 25.0 with Maximum Likelihood (ML) estimation parameter to confirm the
proposed relationships between constructs and also between their items.
The paths between the construct and items, and exogenous latent constructs and endogenous
constructs were assessed using standardised loading coefficients. Where a CFA model resulted
in a poor fit of the sample data, the proposed model was re-specified or modified and then re-
estimated. The basic steps that were applied to run the CFA model are listed in Table 9.7.
Table 9.7: Steps followed in running the CFA (Awang, 2012).
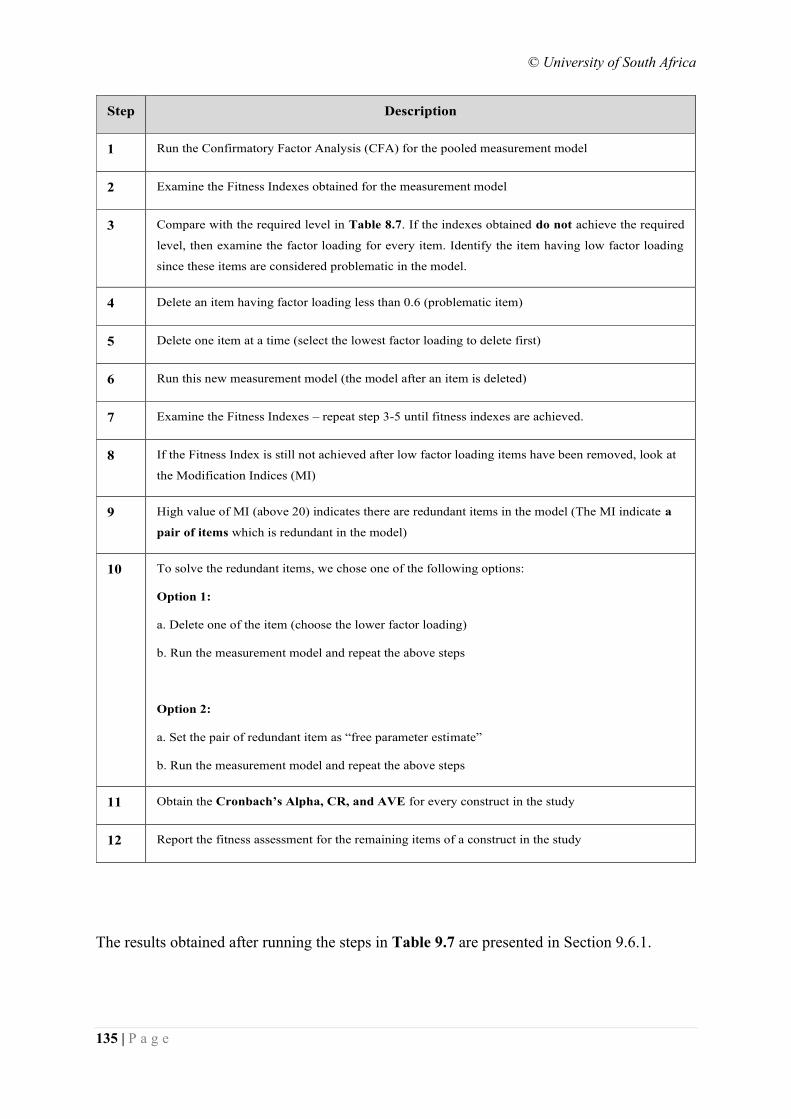
© University of South Africa
135 | P a g e
The results obtained after running the steps in Table 9.7 are presented in Section 9.6.1.
Step Description
1 Run the Confirmatory Factor Analysis (CFA) for the pooled measurement model
2 Examine the Fitness Indexes obtained for the measurement model
3 Compare with the required level in Table 8.7. If the indexes obtained do not achieve the required
level, then examine the factor loading for every item. Identify the item having low factor loading
since these items are considered problematic in the model.
4 Delete an item having factor loading less than 0.6 (problematic item)
5 Delete one item at a time (select the lowest factor loading to delete first)
6 Run this new measurement model (the model after an item is deleted)
7 Examine the Fitness Indexes – repeat step 3-5 until fitness indexes are achieved.
8 If the Fitness Index is still not achieved after low factor loading items have been removed, look at
the Modification Indices (MI)
9 High value of MI (above 20) indicates there are redundant items in the model (The MI indicate a
pair of items which is redundant in the model)
10 To solve the redundant items, we chose one of the following options:
Option 1:
a. Delete one of the item (choose the lower factor loading)
b. Run the measurement model and repeat the above steps
Option 2:
a. Set the pair of redundant item as “free parameter estimate”
b. Run the measurement model and repeat the above steps
11 Obtain the Cronbach’s Alpha, CR, and AVE for every construct in the study
12 Report the fitness assessment for the remaining items of a construct in the study
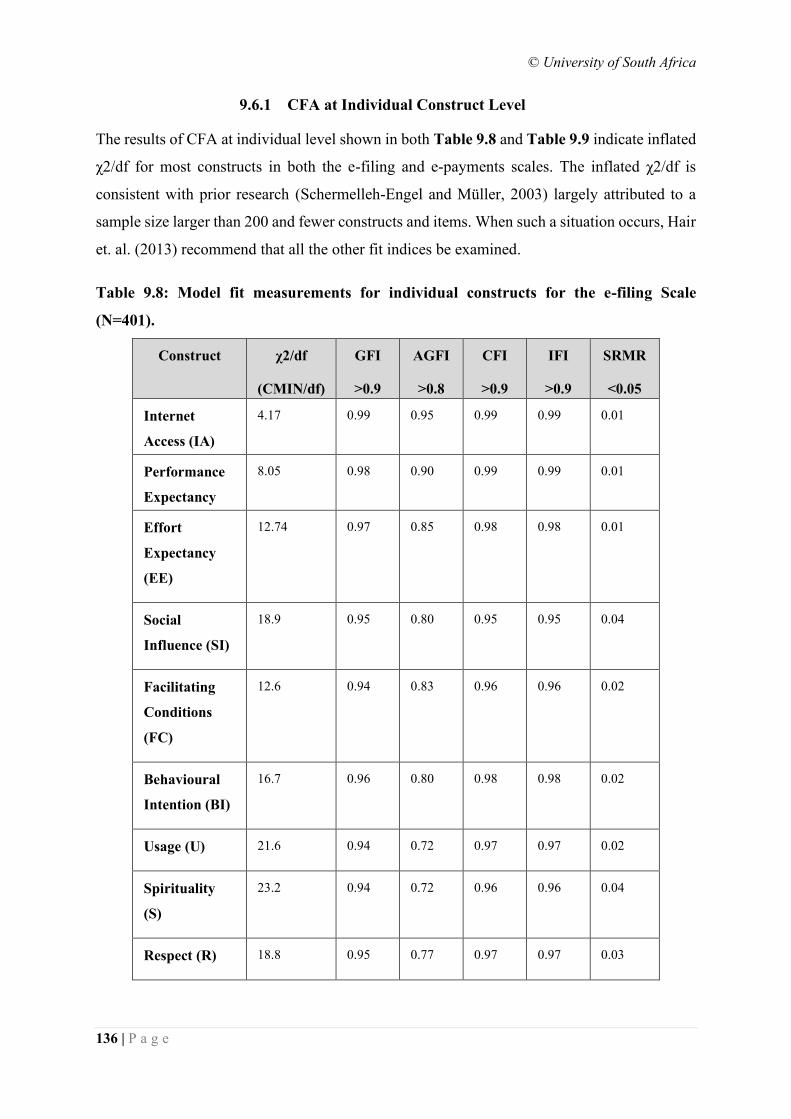
© University of South Africa
136 | P a g e
9.6.1 CFA at Individual Construct Level
The results of CFA at individual level shown in both Table 9.8 and Table 9.9 indicate inflated
χ2/df for most constructs in both the e-filing and e-payments scales. The inflated χ2/df is
consistent with prior research (Schermelleh-Engel and Müller, 2003) largely attributed to a
sample size larger than 200 and fewer constructs and items. When such a situation occurs, Hair
et. al. (2013) recommend that all the other fit indices be examined.
Table 9.8: Model fit measurements for individual constructs for the e-filing Scale
(N=401).
Construct χ2/df
(CMIN/df)
<5
GFI
>0.9
AGFI
>0.8
CFI
>0.9
IFI
>0.9
SRMR
<0.05
Internet
Access (IA)
4.17 0.99 0.95 0.99 0.99 0.01
Performance
Expectancy
(PE)
8.05 0.98 0.90 0.99 0.99 0.01
Effort
Expectancy
(EE)
12.74 0.97 0.85 0.98 0.98 0.01
Social
Influence (SI)
18.9 0.95 0.80 0.95 0.95 0.04
Facilitating
Conditions
(FC)
12.6 0.94 0.83 0.96 0.96 0.02
Behavioural
Intention (BI)
16.7 0.96 0.80 0.98 0.98 0.02
Usage (U) 21.6 0.94 0.72 0.97 0.97 0.02
Spirituality
(S)
23.2 0.94 0.72 0.96 0.96 0.04
Respect (R) 18.8 0.95 0.77 0.97 0.97 0.03
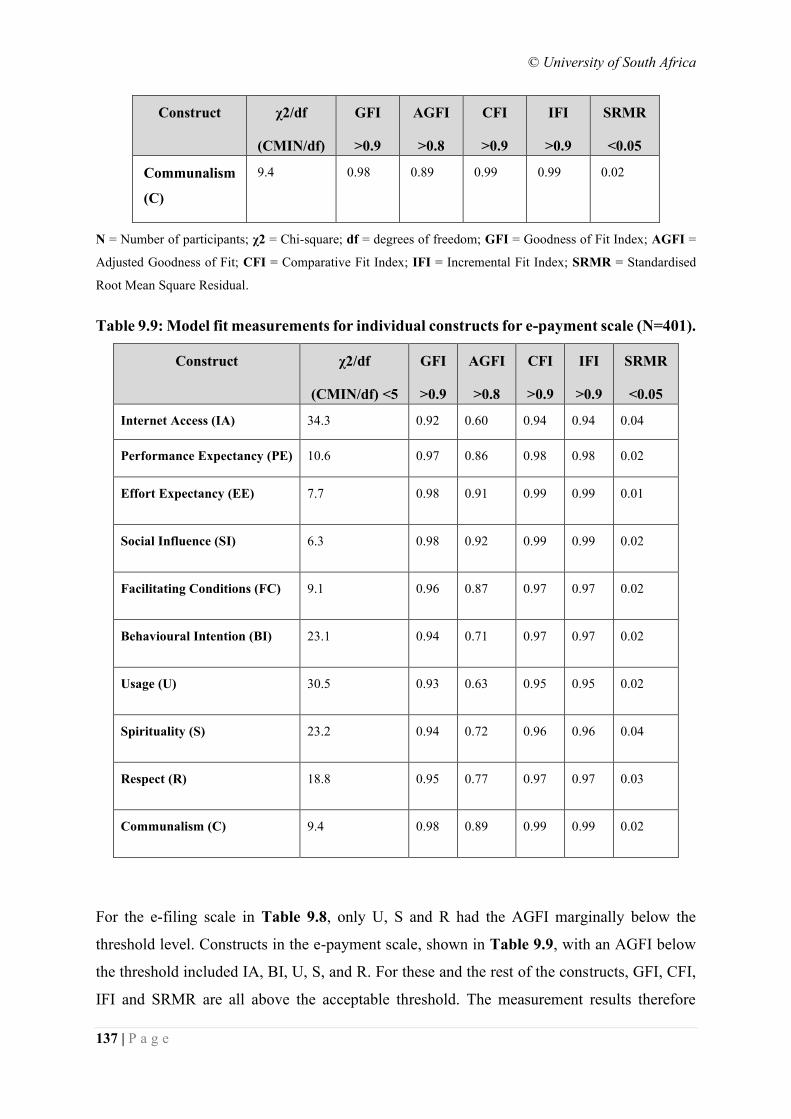
© University of South Africa
137 | P a g e
Construct χ2/df
(CMIN/df)
<5
GFI
>0.9
AGFI
>0.8
CFI
>0.9
IFI
>0.9
SRMR
<0.05
Communalism
(C)
9.4 0.98 0.89 0.99 0.99 0.02
N = Number of participants; χ2 = Chi-square; df = degrees of freedom; GFI = Goodness of Fit Index; AGFI =
Adjusted Goodness of Fit; CFI = Comparative Fit Index; IFI = Incremental Fit Index; SRMR = Standardised
Root Mean Square Residual.
Table 9.9: Model fit measurements for individual constructs for e-payment scale (N=401).
Construct χ2/df
(CMIN/df) <5
GFI
>0.9
AGFI
>0.8
CFI
>0.9
IFI
>0.9
SRMR
<0.05
Internet Access (IA) 34.3 0.92 0.60 0.94 0.94 0.04
Performance Expectancy (PE) 10.6 0.97 0.86 0.98 0.98 0.02
Effort Expectancy (EE) 7.7 0.98 0.91 0.99 0.99 0.01
Social Influence (SI) 6.3 0.98 0.92 0.99 0.99 0.02
Facilitating Conditions (FC) 9.1 0.96 0.87 0.97 0.97 0.02
Behavioural Intention (BI) 23.1 0.94 0.71 0.97 0.97 0.02
Usage (U) 30.5 0.93 0.63 0.95 0.95 0.02
Spirituality (S) 23.2 0.94 0.72 0.96 0.96 0.04
Respect (R) 18.8 0.95 0.77 0.97 0.97 0.03
Communalism (C) 9.4 0.98 0.89 0.99 0.99 0.02
For the e-filing scale in Table 9.8, only U, S and R had the AGFI marginally below the
threshold level. Constructs in the e-payment scale, shown in Table 9.9, with an AGFI below
the threshold included IA, BI, U, S, and R. For these and the rest of the constructs, GFI, CFI,
IFI and SRMR are all above the acceptable threshold. The measurement results therefore
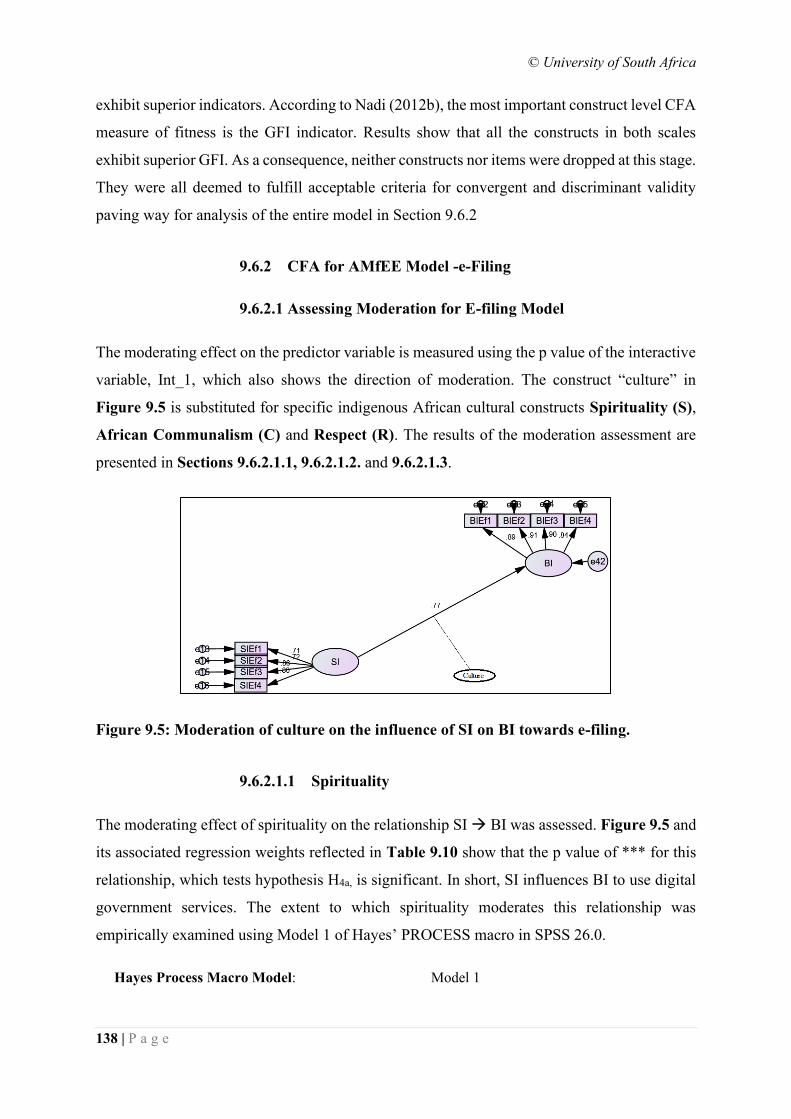
© University of South Africa
138 | P a g e
exhibit superior indicators. According to Nadi (2012b), the most important construct level CFA
measure of fitness is the GFI indicator. Results show that all the constructs in both scales
exhibit superior GFI. As a consequence, neither constructs nor items were dropped at this stage.
They were all deemed to fulfill acceptable criteria for convergent and discriminant validity
paving way for analysis of the entire model in Section 9.6.2
9.6.2 CFA for AMfEE Model -e-Filing
9.6.2.1 Assessing Moderation for E-filing Model
The moderating effect on the predictor variable is measured using the p value of the interactive
variable, Int_1, which also shows the direction of moderation. The construct “culture” in
Figure 9.5 is substituted for specific indigenous African cultural constructs Spirituality (S),
African Communalism (C) and Respect (R). The results of the moderation assessment are
presented in Sections 9.6.2.1.1, 9.6.2.1.2. and 9.6.2.1.3.
Figure 9.5: Moderation of culture on the influence of SI on BI towards e-filing.
9.6.2.1.1 Spirituality
The moderating effect of spirituality on the relationship SI → BI was assessed. Figure 9.5 and
its associated regression weights reflected in Table 9.10 show that the p value of *** for this
relationship, which tests hypothesis H4a, is significant. In short, SI influences BI to use digital
government services. The extent to which spirituality moderates this relationship was
empirically examined using Model 1 of Hayes’ PROCESS macro in SPSS 26.0.
Hayes Process Macro Model: Model 1
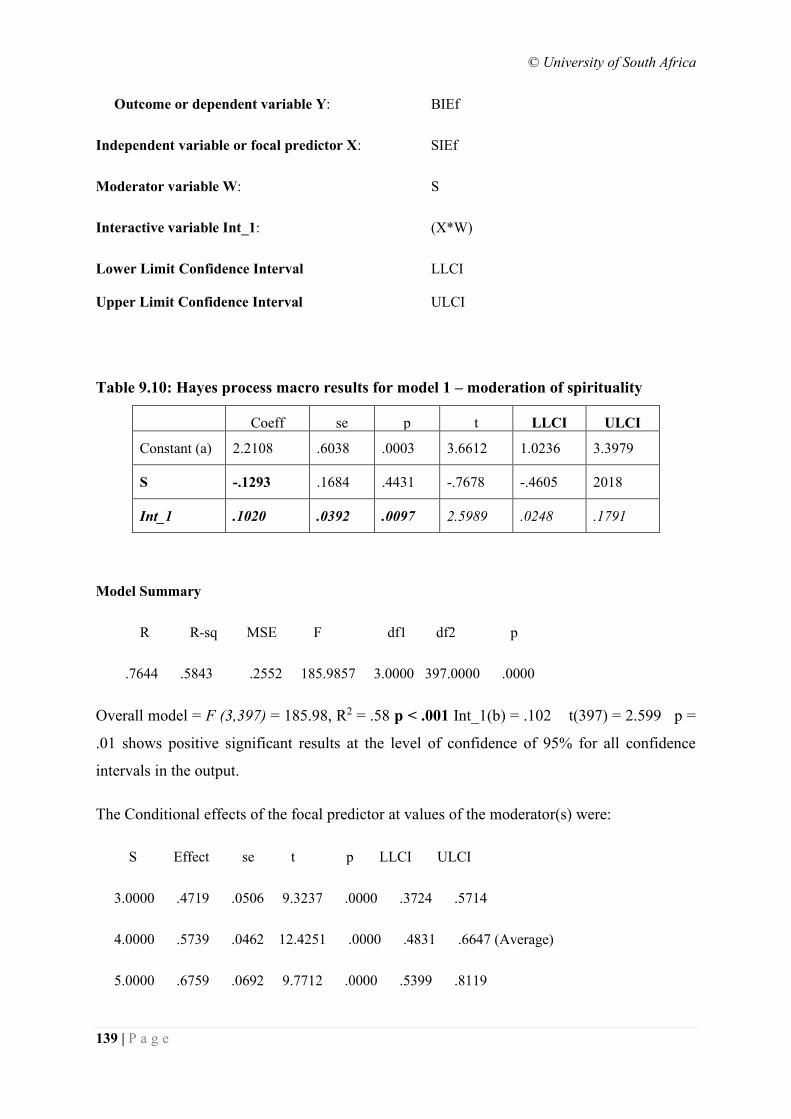
© University of South Africa
139 | P a g e
Outcome or dependent variable Y: BIEf
Independent variable or focal predictor X: SIEf
Moderator variable W: S
Interactive variable Int_1: (X*W)
Lower Limit Confidence Interval LLCI
Upper Limit Confidence Interval ULCI
Table 9.10: Hayes process macro results for model 1 – moderation of spirituality
Coeff se p t LLCI ULCI
Constant (a) 2.2108 .6038 .0003 3.6612 1.0236 3.3979
S -.1293 .1684 .4431 -.7678 -.4605 2018
Int_1 .1020 .0392 .0097 2.5989 .0248 .1791
Model Summary
R R-sq MSE F df1 df2 p
.7644 .5843 .2552 185.9857 3.0000 397.0000 .0000
Overall model = F (3,397) = 185.98, R2 = .58 p < .001 Int_1(b) = .102 t(397) = 2.599 p =
.01 shows positive significant results at the level of confidence of 95% for all confidence
intervals in the output.
The Conditional effects of the focal predictor at values of the moderator(s) were:
S Effect se t p LLCI ULCI
3.0000 .4719 .0506 9.3237 .0000 .3724 .5714
4.0000 .5739 .0462 12.4251 .0000 .4831 .6647 (Average)
5.0000 .6759 .0692 9.7712 .0000 .5399 .8119
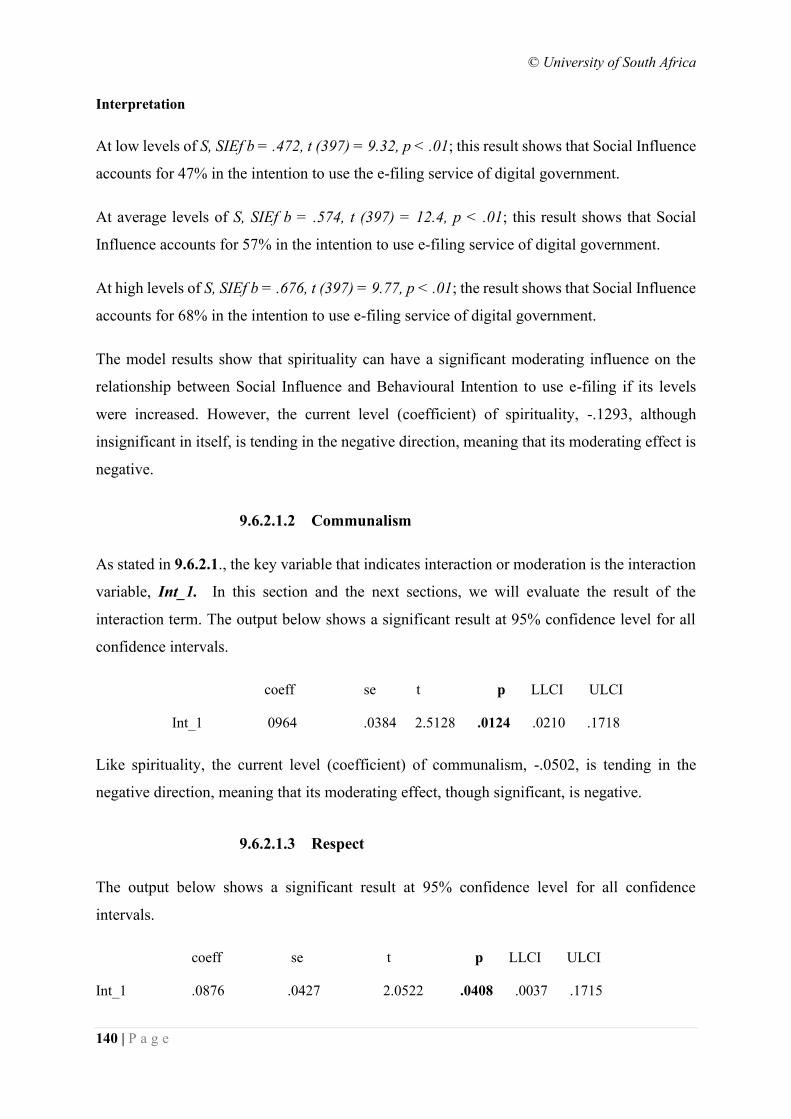
© University of South Africa
140 | P a g e
Interpretation
At low levels of S, SIEf b = .472, t (397) = 9.32, p < .01; this result shows that Social Influence
accounts for 47% in the intention to use the e-filing service of digital government.
At average levels of S, SIEf b = .574, t (397) = 12.4, p < .01; this result shows that Social
Influence accounts for 57% in the intention to use e-filing service of digital government.
At high levels of S, SIEf b = .676, t (397) = 9.77, p < .01; the result shows that Social Influence
accounts for 68% in the intention to use e-filing service of digital government.
The model results show that spirituality can have a significant moderating influence on the
relationship between Social Influence and Behavioural Intention to use e-filing if its levels
were increased. However, the current level (coefficient) of spirituality, -.1293, although
insignificant in itself, is tending in the negative direction, meaning that its moderating effect is
negative.
9.6.2.1.2 Communalism
As stated in 9.6.2.1., the key variable that indicates interaction or moderation is the interaction
variable, Int_1. In this section and the next sections, we will evaluate the result of the
interaction term. The output below shows a significant result at 95% confidence level for all
confidence intervals.
coeff se t p LLCI ULCI
Int_1 0964 .0384 2.5128 .0124 .0210 .1718
Like spirituality, the current level (coefficient) of communalism, -.0502, is tending in the
negative direction, meaning that its moderating effect, though significant, is negative.
9.6.2.1.3 Respect
The output below shows a significant result at 95% confidence level for all confidence
intervals.
coeff se t p LLCI ULCI
Int_1 .0876 .0427 2.0522 .0408 .0037 .1715
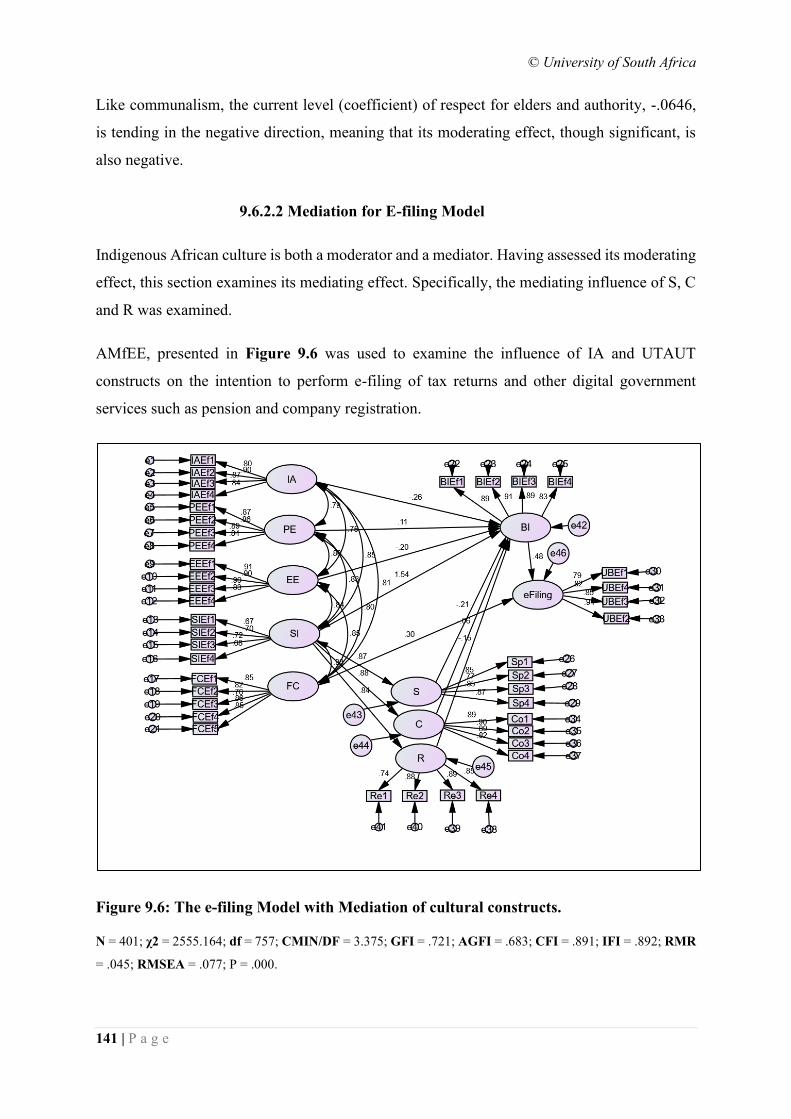
© University of South Africa
141 | P a g e
Like communalism, the current level (coefficient) of respect for elders and authority, -.0646,
is tending in the negative direction, meaning that its moderating effect, though significant, is
also negative.
9.6.2.2 Mediation for E-filing Model
Indigenous African culture is both a moderator and a mediator. Having assessed its moderating
effect, this section examines its mediating effect. Specifically, the mediating influence of S, C
and R was examined.
AMfEE, presented in Figure 9.6 was used to examine the influence of IA and UTAUT
constructs on the intention to perform e-filing of tax returns and other digital government
services such as pension and company registration.
Figure 9.6: The e-filing Model with Mediation of cultural constructs.
N = 401; χ2 = 2555.164; df = 757; CMIN/DF = 3.375; GFI = .721; AGFI = .683; CFI = .891; IFI = .892; RMR
= .045; RMSEA = .077; P = .000.
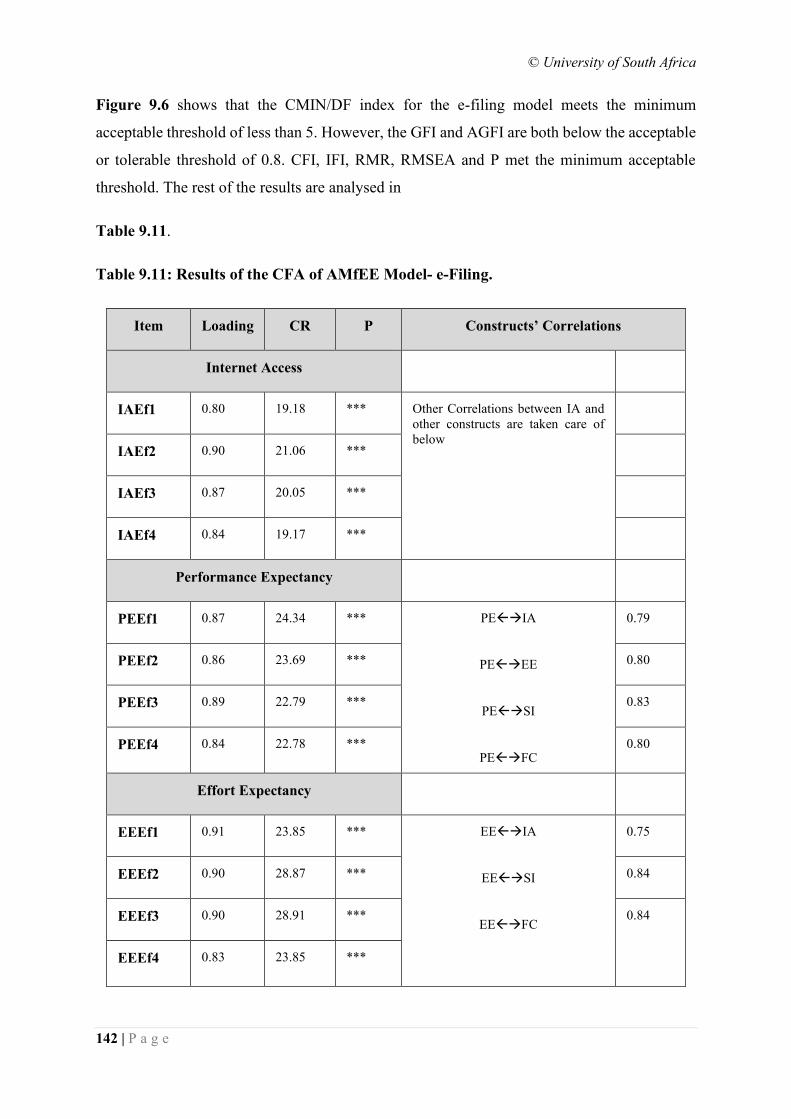
© University of South Africa
142 | P a g e
Figure 9.6 shows that the CMIN/DF index for the e-filing model meets the minimum
acceptable threshold of less than 5. However, the GFI and AGFI are both below the acceptable
or tolerable threshold of 0.8. CFI, IFI, RMR, RMSEA and P met the minimum acceptable
threshold. The rest of the results are analysed in
Table 9.11.
Table 9.11: Results of the CFA of AMfEE Model- e-Filing.
Item Loading CR P Constructs’ Correlations
Internet Access
IAEf1 0.80 19.18 *** Other Correlations between IA and
other constructs are taken care of
below
IAEf2 0.90 21.06 ***
IAEf3 0.87 20.05 ***
IAEf4 0.84 19.17 ***
Performance Expectancy
PEEf1 0.87 24.34 *** PE→IA
PE→EE
PE→SI
PE→FC
0.79
PEEf2 0.86 23.69 *** 0.80
PEEf3 0.89 22.79 *** 0.83
PEEf4 0.84 22.78 *** 0.80
Effort Expectancy
EEEf1 0.91 23.85 *** EE→IA
EE→SI
EE→FC
0.75
EEEf2 0.90 28.87 *** 0.84
EEEf3 0.90 28.91 *** 0.84
EEEf4 0.83 23.85 ***
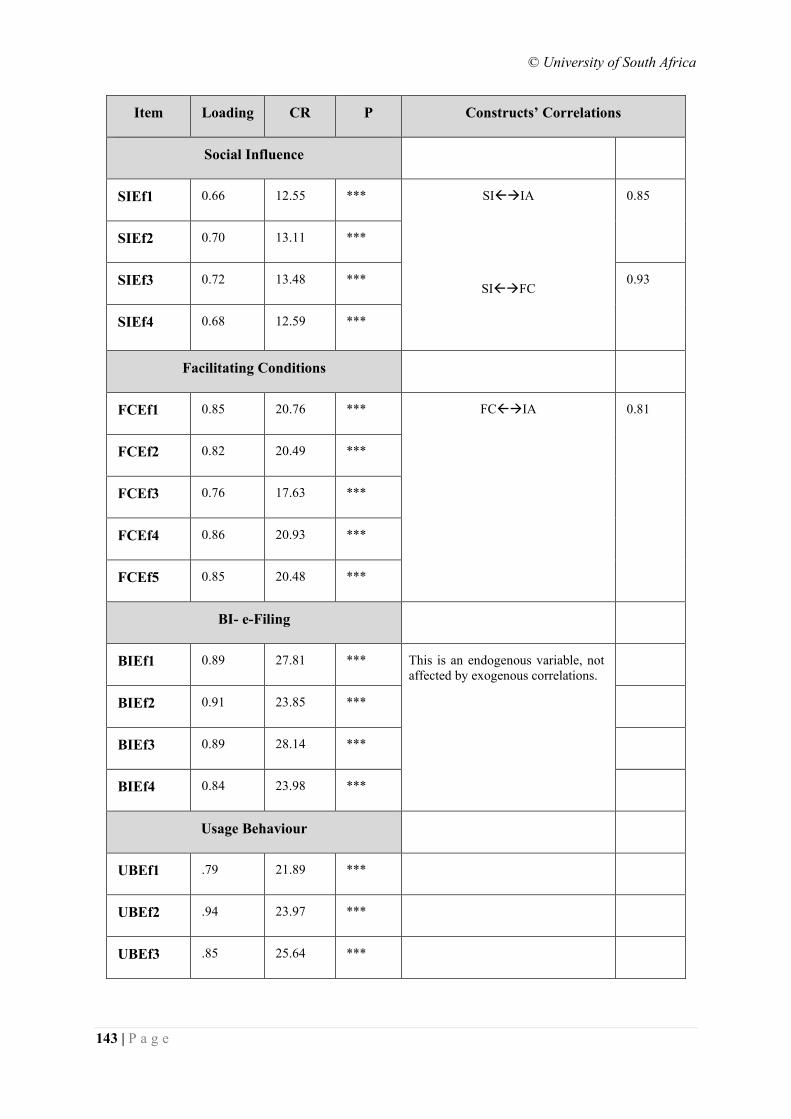
© University of South Africa
143 | P a g e
Item Loading CR P Constructs’ Correlations
Social Influence
SIEf1 0.66 12.55 *** SI→IA
SI→FC
0.85
SIEf2 0.70 13.11 ***
SIEf3 0.72 13.48 *** 0.93
SIEf4 0.68 12.59 ***
Facilitating Conditions
FCEf1 0.85 20.76 *** FC→IA
0.81
FCEf2 0.82 20.49 ***
FCEf3 0.76 17.63 ***
FCEf4 0.86 20.93 ***
FCEf5 0.85 20.48 ***
BI- e-Filing
BIEf1 0.89 27.81 *** This is an endogenous variable, not
affected by exogenous correlations.
BIEf2 0.91 23.85 ***
BIEf3 0.89 28.14 ***
BIEf4 0.84 23.98 ***
Usage Behaviour
UBEf1 .79 21.89 ***
UBEf2 .94 23.97 ***
UBEf3 .85 25.64 ***
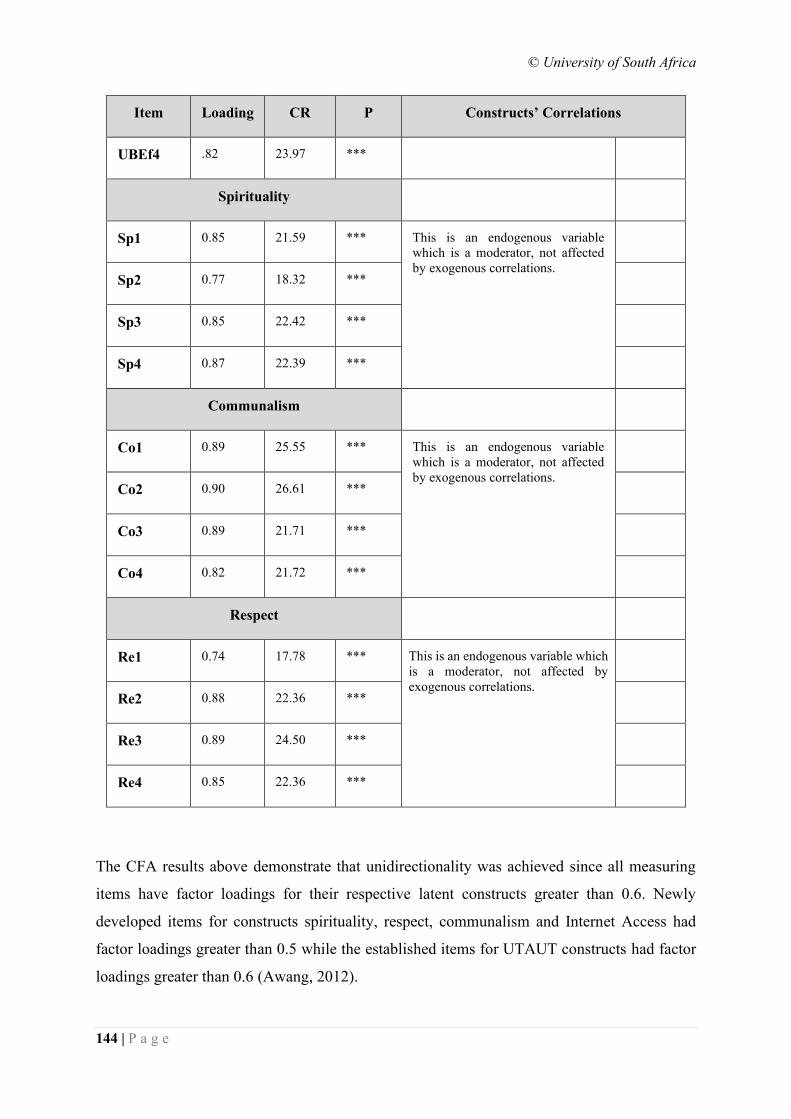
© University of South Africa
144 | P a g e
Item Loading CR P Constructs’ Correlations
UBEf4 .82 23.97 ***
Spirituality
Sp1 0.85 21.59 *** This is an endogenous variable
which is a moderator, not affected
by exogenous correlations.
Sp2 0.77 18.32 ***
Sp3 0.85 22.42 ***
Sp4 0.87 22.39 ***
Communalism
Co1 0.89 25.55 *** This is an endogenous variable
which is a moderator, not affected
by exogenous correlations.
Co2 0.90 26.61 ***
Co3 0.89 21.71 ***
Co4 0.82 21.72 ***
Respect
Re1 0.74 17.78 *** This is an endogenous variable which
is a moderator, not affected by
exogenous correlations.
Re2 0.88 22.36 ***
Re3 0.89 24.50 ***
Re4 0.85 22.36 ***
The CFA results above demonstrate that unidirectionality was achieved since all measuring
items have factor loadings for their respective latent constructs greater than 0.6. Newly
developed items for constructs spirituality, respect, communalism and Internet Access had
factor loadings greater than 0.5 while the established items for UTAUT constructs had factor
loadings greater than 0.6 (Awang, 2012).
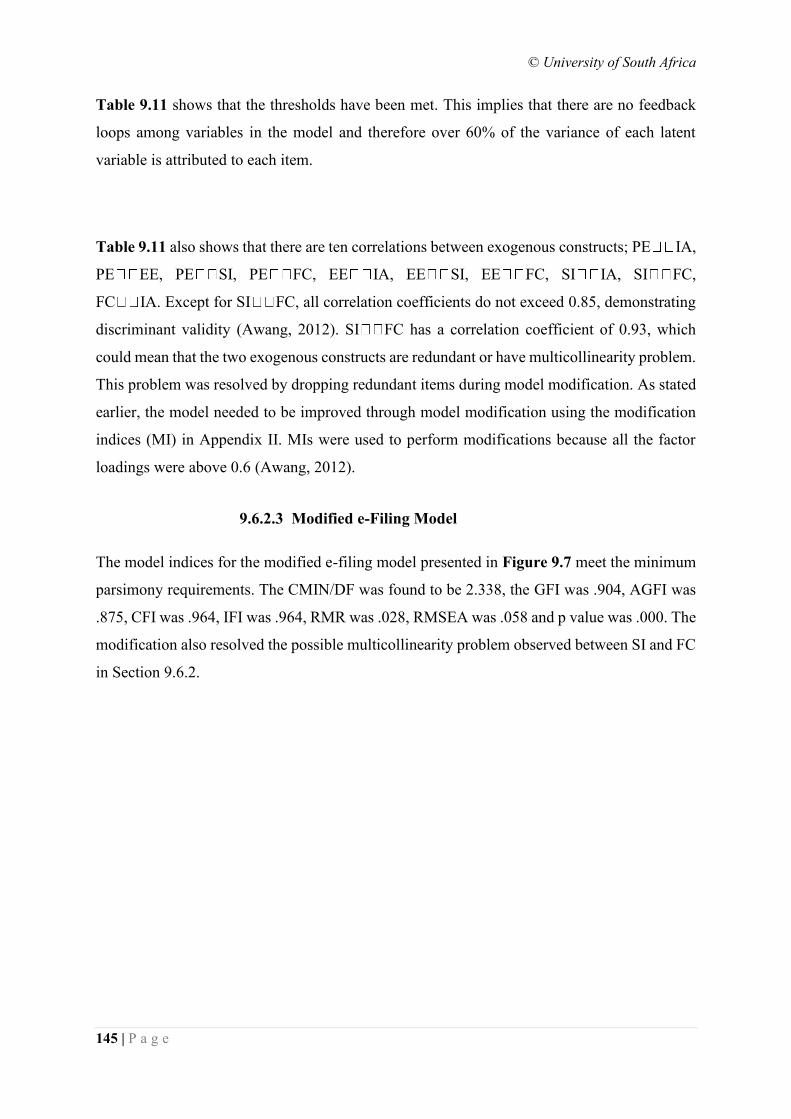
© University of South Africa
145 | P a g e
Table 9.11 shows that the thresholds have been met. This implies that there are no feedback
loops among variables in the model and therefore over 60% of the variance of each latent
variable is attributed to each item.
Table 9.11 also shows that there are ten correlations between exogenous constructs; PE IA,
PE EE, PE SI, PE FC, EE IA, EE SI, EE FC, SI IA, SI FC,
FC IA. Except for SI FC, all correlation coefficients do not exceed 0.85, demonstrating
discriminant validity (Awang, 2012). SI FC has a correlation coefficient of 0.93, which
could mean that the two exogenous constructs are redundant or have multicollinearity problem.
This problem was resolved by dropping redundant items during model modification. As stated
earlier, the model needed to be improved through model modification using the modification
indices (MI) in Appendix II. MIs were used to perform modifications because all the factor
loadings were above 0.6 (Awang, 2012).
9.6.2.3 Modified e-Filing Model
The model indices for the modified e-filing model presented in Figure 9.7 meet the minimum
parsimony requirements. The CMIN/DF was found to be 2.338, the GFI was .904, AGFI was
.875, CFI was .964, IFI was .964, RMR was .028, RMSEA was .058 and p value was .000. The
modification also resolved the possible multicollinearity problem observed between SI and FC
in Section 9.6.2.
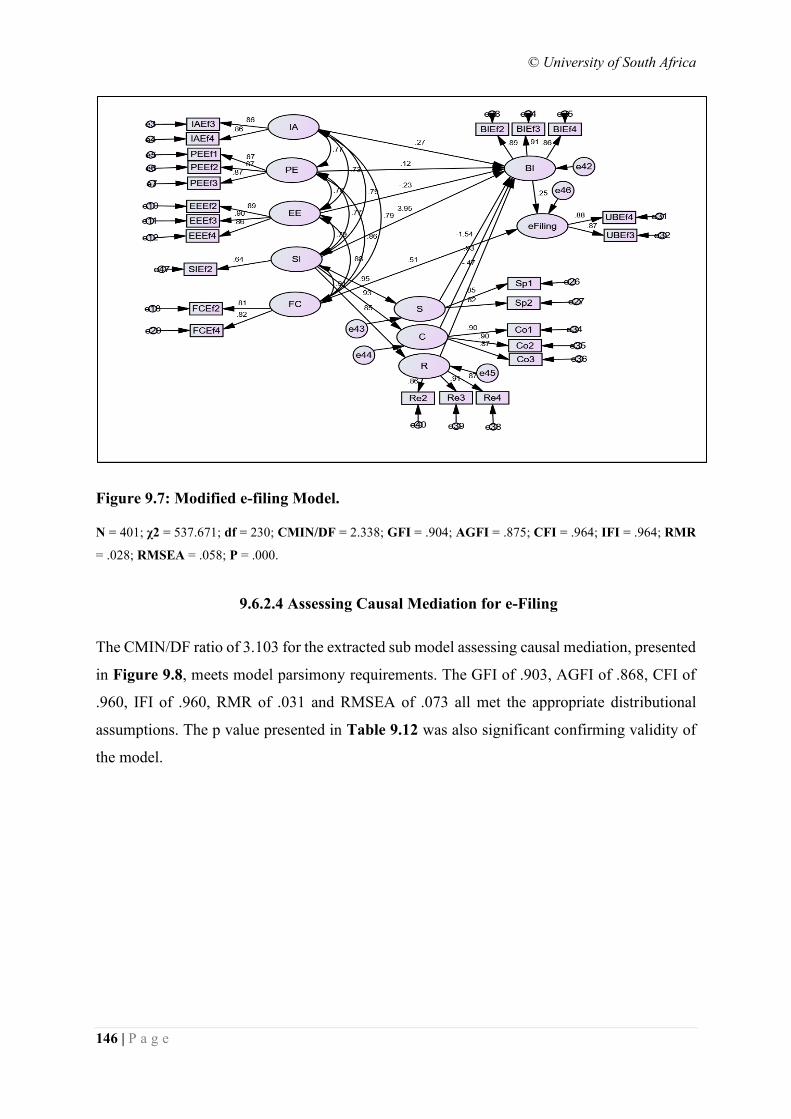
© University of South Africa
146 | P a g e
Figure 9.7: Modified e-filing Model.
N = 401; χ2 = 537.671; df = 230; CMIN/DF = 2.338; GFI = .904; AGFI = .875; CFI = .964; IFI = .964; RMR
= .028; RMSEA = .058; P = .000.
9.6.2.4 Assessing Causal Mediation for e-Filing
The CMIN/DF ratio of 3.103 for the extracted sub model assessing causal mediation, presented
in Figure 9.8, meets model parsimony requirements. The GFI of .903, AGFI of .868, CFI of
.960, IFI of .960, RMR of .031 and RMSEA of .073 all met the appropriate distributional
assumptions. The p value presented in Table 9.12 was also significant confirming validity of
the model.
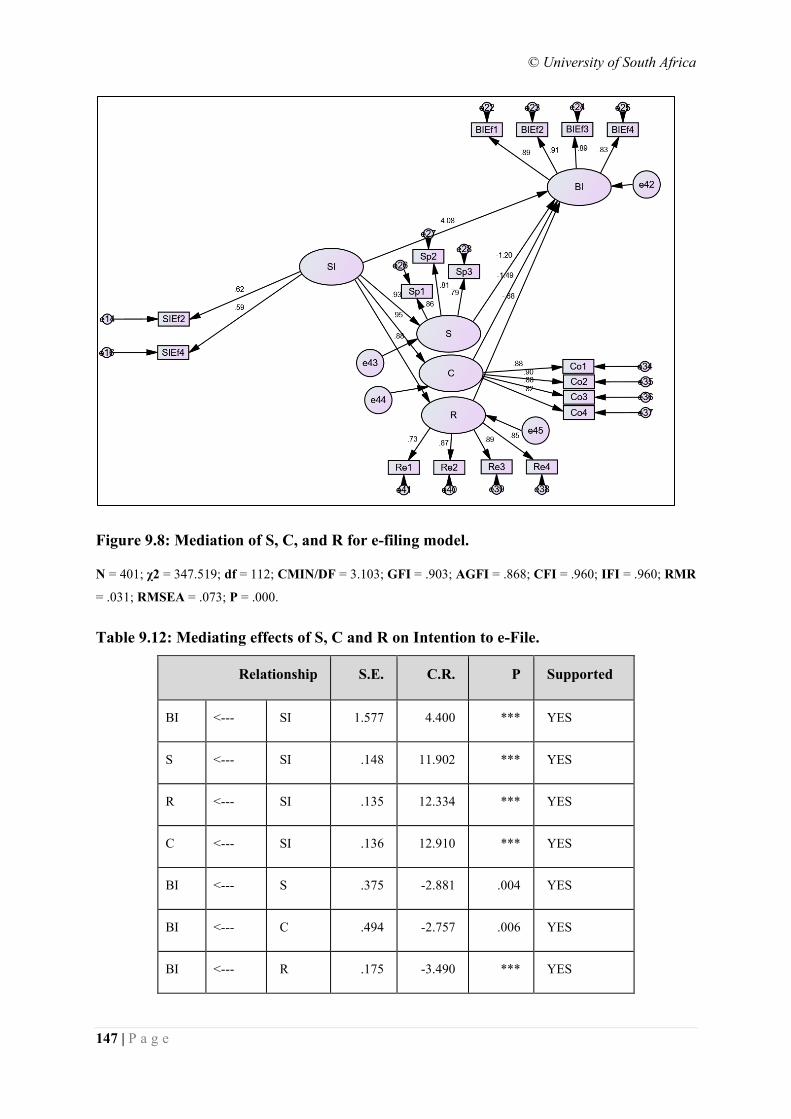
© University of South Africa
147 | P a g e
Figure 9.8: Mediation of S, C, and R for e-filing model.
N = 401; χ2 = 347.519; df = 112; CMIN/DF = 3.103; GFI = .903; AGFI = .868; CFI = .960; IFI = .960; RMR
= .031; RMSEA = .073; P = .000.
Table 9.12: Mediating effects of S, C and R on Intention to e-File.
Relationship S.E. C.R. P Supported
BI <--- SI 1.577 4.400 *** YES
S <--- SI .148 11.902 *** YES
R <--- SI .135 12.334 *** YES
C <--- SI .136 12.910 *** YES
BI <--- S .375 -2.881 .004 YES
BI <--- C .494 -2.757 .006 YES
BI <--- R .175 -3.490 *** YES
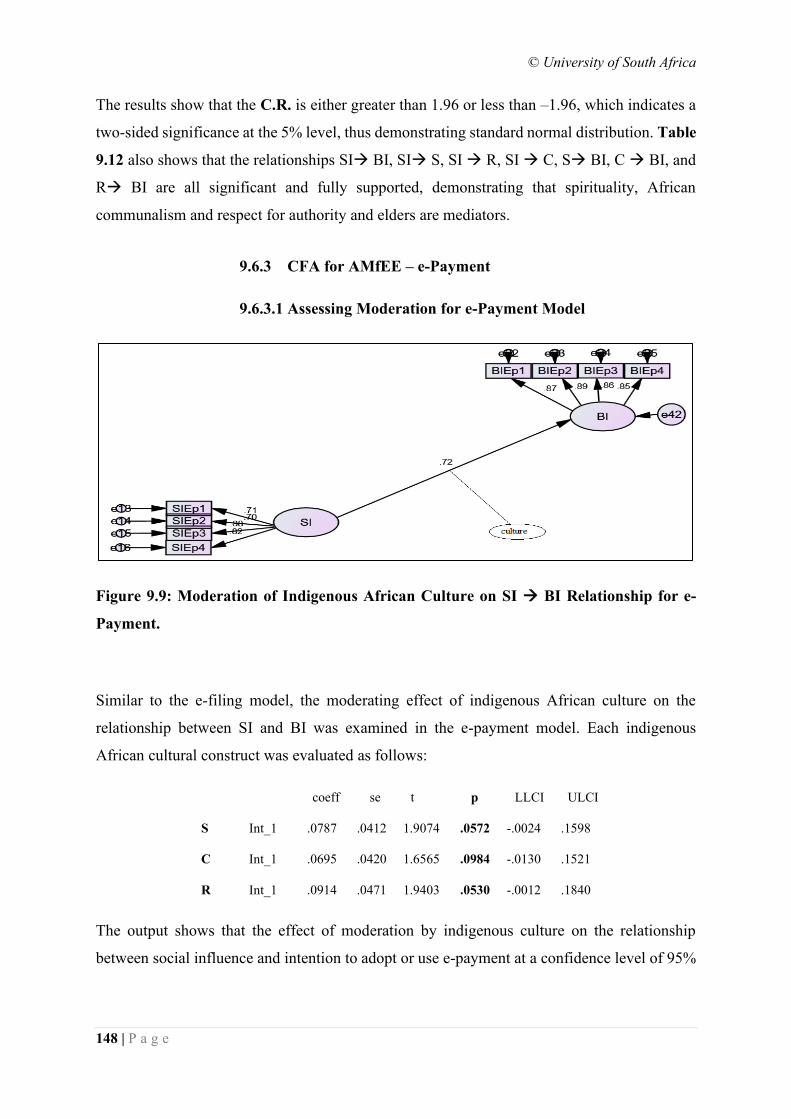
© University of South Africa
148 | P a g e
The results show that the C.R. is either greater than 1.96 or less than –1.96, which indicates a
two-sided significance at the 5% level, thus demonstrating standard normal distribution. Table
9.12 also shows that the relationships SI→ BI, SI→ S, SI → R, SI → C, S→ BI, C → BI, and
R→ BI are all significant and fully supported, demonstrating that spirituality, African
communalism and respect for authority and elders are mediators.
9.6.3 CFA for AMfEE – e-Payment
9.6.3.1 Assessing Moderation for e-Payment Model
Figure 9.9: Moderation of Indigenous African Culture on SI → BI Relationship for e-
Payment.
Similar to the e-filing model, the moderating effect of indigenous African culture on the
relationship between SI and BI was examined in the e-payment model. Each indigenous
African cultural construct was evaluated as follows:
coeff se t p LLCI ULCI
S Int_1 .0787 .0412 1.9074 .0572 -.0024 .1598
C Int_1 .0695 .0420 1.6565 .0984 -.0130 .1521
R Int_1 .0914 .0471 1.9403 .0530 -.0012 .1840
The output shows that the effect of moderation by indigenous culture on the relationship
between social influence and intention to adopt or use e-payment at a confidence level of 95%
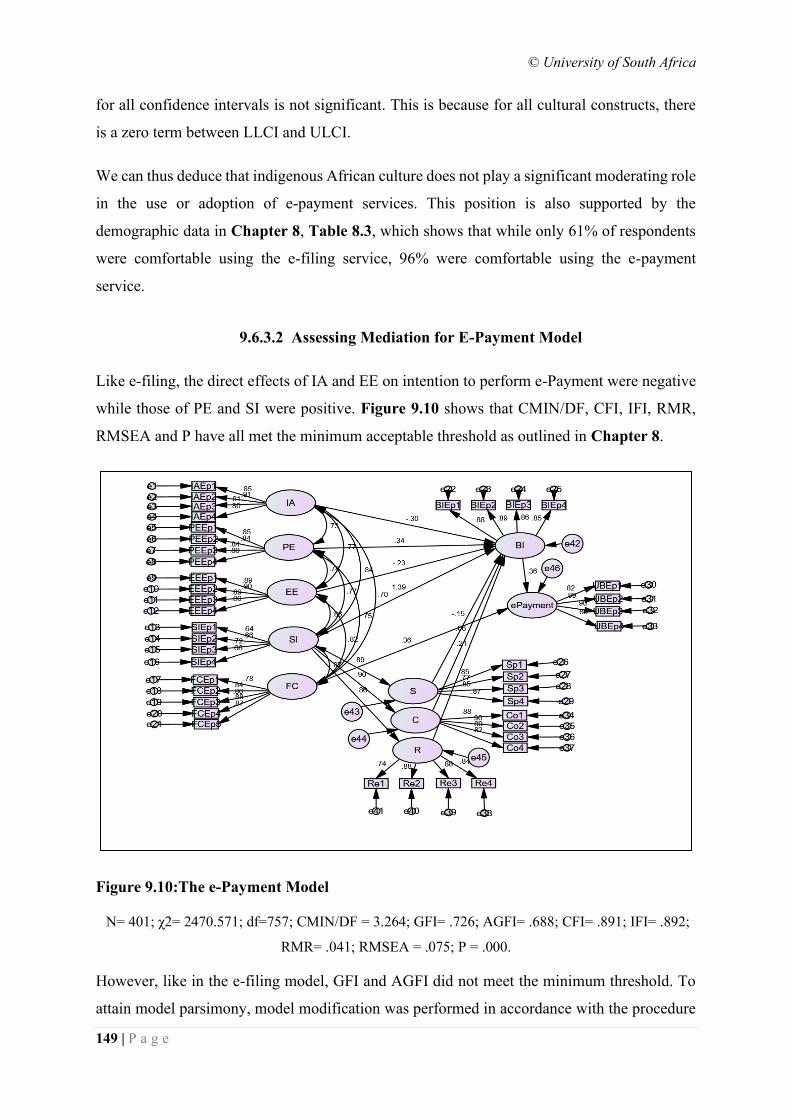
© University of South Africa
149 | P a g e
for all confidence intervals is not significant. This is because for all cultural constructs, there
is a zero term between LLCI and ULCI.
We can thus deduce that indigenous African culture does not play a significant moderating role
in the use or adoption of e-payment services. This position is also supported by the
demographic data in Chapter 8, Table 8.3, which shows that while only 61% of respondents
were comfortable using the e-filing service, 96% were comfortable using the e-payment
service.
9.6.3.2 Assessing Mediation for E-Payment Model
Like e-filing, the direct effects of IA and EE on intention to perform e-Payment were negative
while those of PE and SI were positive. Figure 9.10 shows that CMIN/DF, CFI, IFI, RMR,
RMSEA and P have all met the minimum acceptable threshold as outlined in Chapter 8.
Figure 9.10:The e-Payment Model
N= 401; χ2= 2470.571; df=757; CMIN/DF = 3.264; GFI= .726; AGFI= .688; CFI= .891; IFI= .892;
RMR= .041; RMSEA = .075; P = .000.
However, like in the e-filing model, GFI and AGFI did not meet the minimum threshold. To
attain model parsimony, model modification was performed in accordance with the procedure
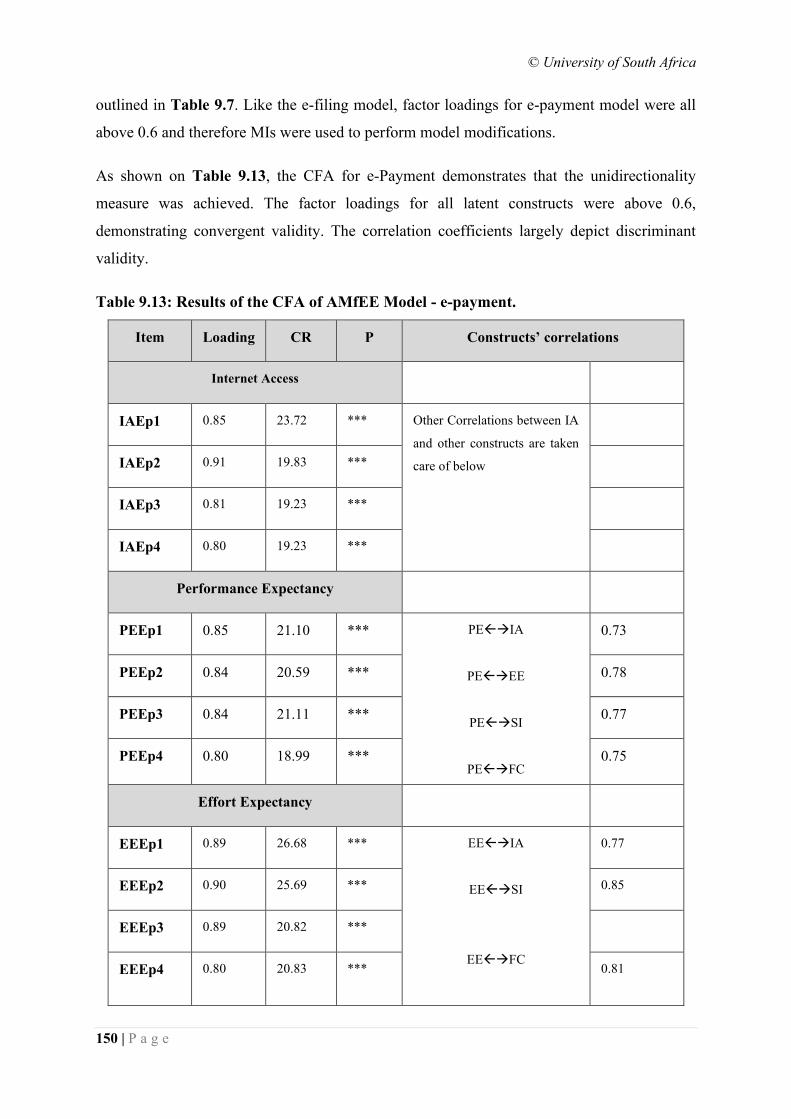
© University of South Africa
150 | P a g e
outlined in Table 9.7. Like the e-filing model, factor loadings for e-payment model were all
above 0.6 and therefore MIs were used to perform model modifications.
As shown on Table 9.13, the CFA for e-Payment demonstrates that the unidirectionality
measure was achieved. The factor loadings for all latent constructs were above 0.6,
demonstrating convergent validity. The correlation coefficients largely depict discriminant
validity.
Table 9.13: Results of the CFA of AMfEE Model - e-payment.
Item Loading CR P Constructs’ correlations
Internet Access
IAEp1 0.85 23.72 *** Other Correlations between IA
and other constructs are taken
care of below
IAEp2 0.91 19.83 ***
IAEp3 0.81 19.23 ***
IAEp4 0.80 19.23 ***
Performance Expectancy
PEEp1 0.85 21.10 *** PE→IA
PE→EE
PE→SI
PE→FC
0.73
PEEp2 0.84 20.59 *** 0.78
PEEp3 0.84 21.11 *** 0.77
PEEp4 0.80 18.99 *** 0.75
Effort Expectancy
EEEp1 0.89 26.68 *** EE→IA
EE→SI
EE→FC
0.77
EEEp2 0.90 25.69 *** 0.85
EEEp3 0.89 20.82 ***
EEEp4 0.80 20.83 *** 0.81
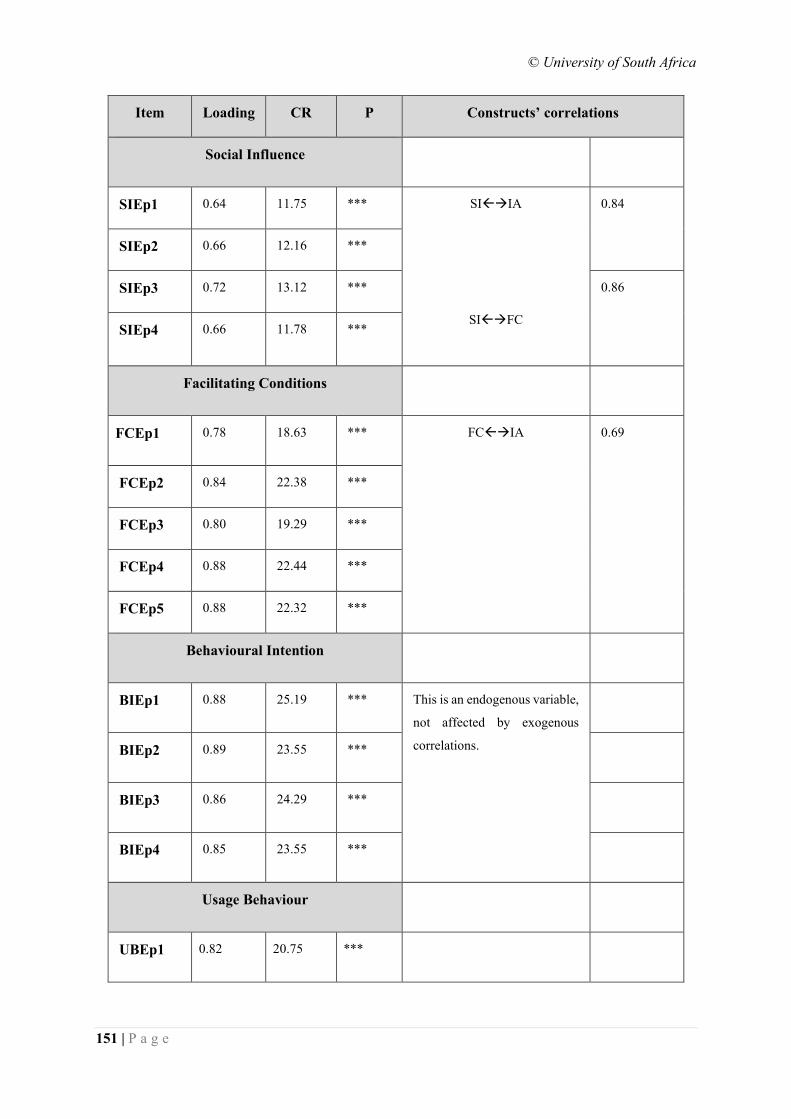
© University of South Africa
151 | P a g e
Item Loading CR P Constructs’ correlations
Social Influence
SIEp1 0.64 11.75 *** SI→IA
SI→FC
0.84
SIEp2 0.66 12.16 ***
SIEp3 0.72 13.12 *** 0.86
SIEp4 0.66 11.78 ***
Facilitating Conditions
FCEp1 0.78 18.63 *** FC→IA
0.69
FCEp2 0.84 22.38 ***
FCEp3 0.80 19.29 ***
FCEp4 0.88 22.44 ***
FCEp5 0.88 22.32 ***
Behavioural Intention
BIEp1 0.88 25.19 *** This is an endogenous variable,
not affected by exogenous
correlations.
BIEp2 0.89 23.55 ***
BIEp3 0.86 24.29 ***
BIEp4 0.85 23.55 ***
Usage Behaviour
UBEp1 0.82 20.75 ***
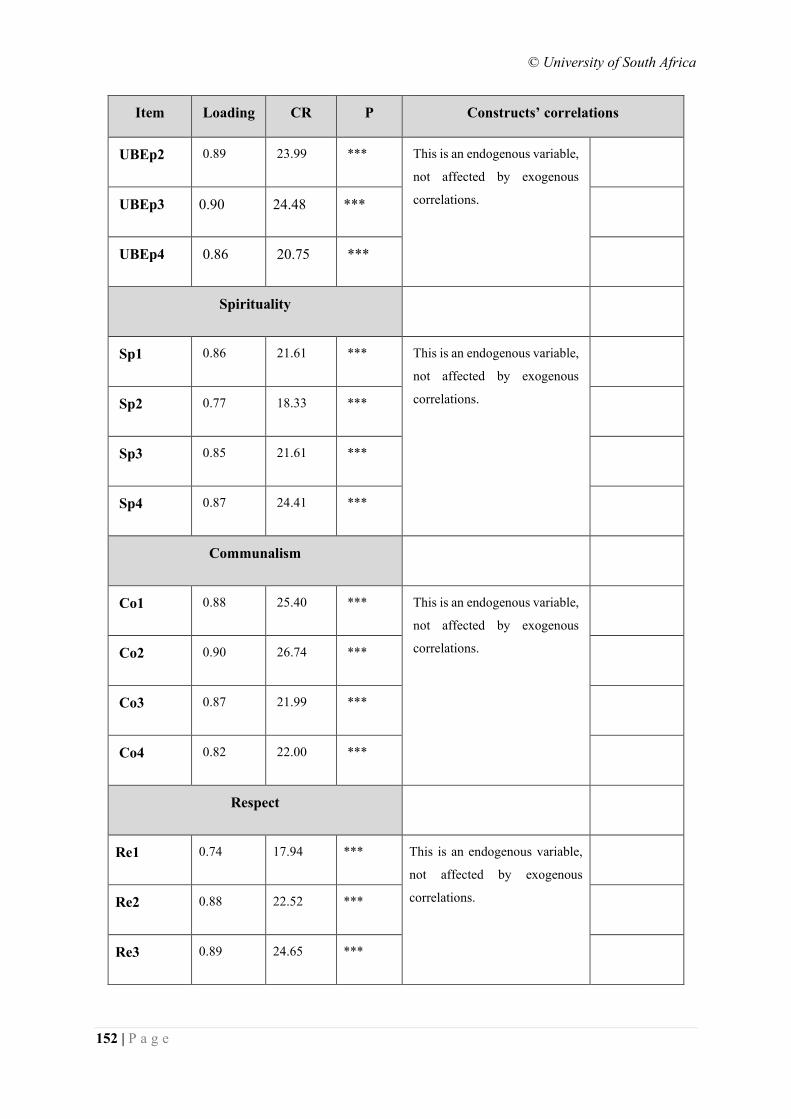
© University of South Africa
152 | P a g e
Item Loading CR P Constructs’ correlations
UBEp2 0.89 23.99 *** This is an endogenous variable,
not affected by exogenous
correlations.
UBEp3 0.90 24.48 ***
UBEp4 0.86 20.75 ***
Spirituality
Sp1 0.86 21.61 *** This is an endogenous variable,
not affected by exogenous
correlations.
Sp2 0.77 18.33 ***
Sp3 0.85 21.61 ***
Sp4 0.87 24.41 ***
Communalism
Co1 0.88 25.40 *** This is an endogenous variable,
not affected by exogenous
correlations.
Co2 0.90 26.74 ***
Co3 0.87 21.99 ***
Co4 0.82 22.00 ***
Respect
Re1 0.74 17.94 *** This is an endogenous variable,
not affected by exogenous
correlations.
Re2 0.88 22.52 ***
Re3 0.89 24.65 ***
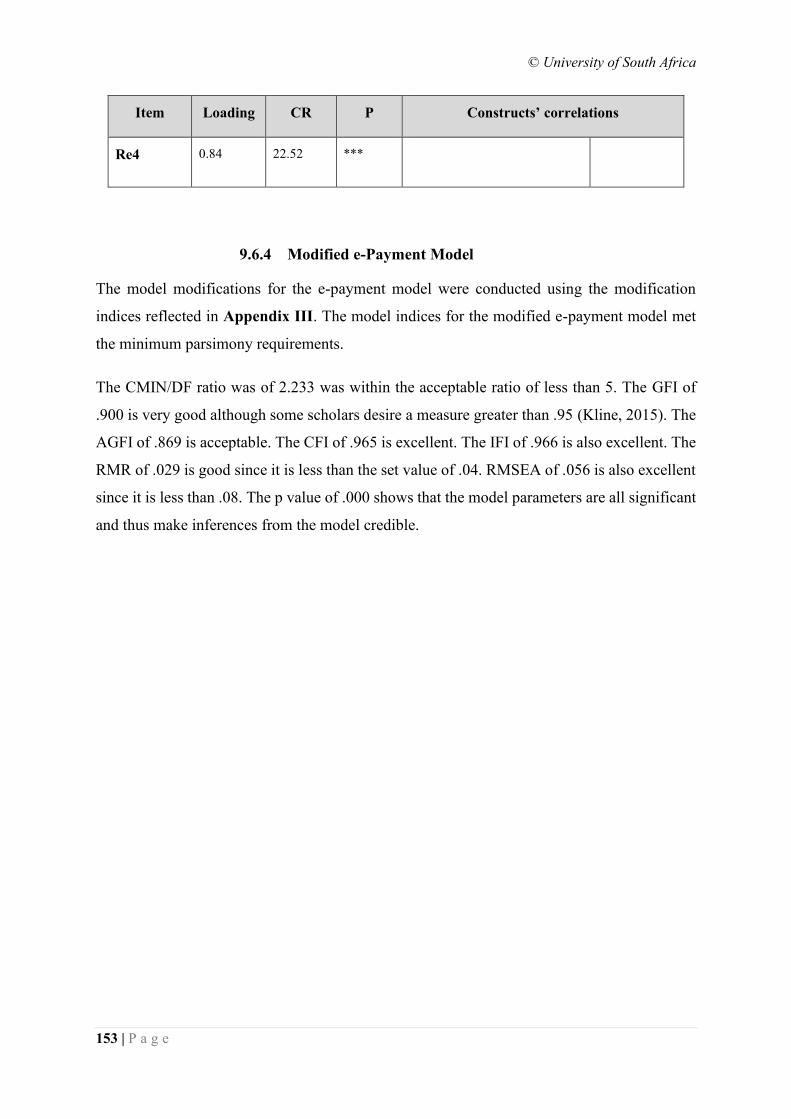
© University of South Africa
153 | P a g e
Item Loading CR P Constructs’ correlations
Re4 0.84 22.52 ***
9.6.4 Modified e-Payment Model
The model modifications for the e-payment model were conducted using the modification
indices reflected in Appendix III. The model indices for the modified e-payment model met
the minimum parsimony requirements.
The CMIN/DF ratio was of 2.233 was within the acceptable ratio of less than 5. The GFI of
.900 is very good although some scholars desire a measure greater than .95 (Kline, 2015). The
AGFI of .869 is acceptable. The CFI of .965 is excellent. The IFI of .966 is also excellent. The
RMR of .029 is good since it is less than the set value of .04. RMSEA of .056 is also excellent
since it is less than .08. The p value of .000 shows that the model parameters are all significant
and thus make inferences from the model credible.
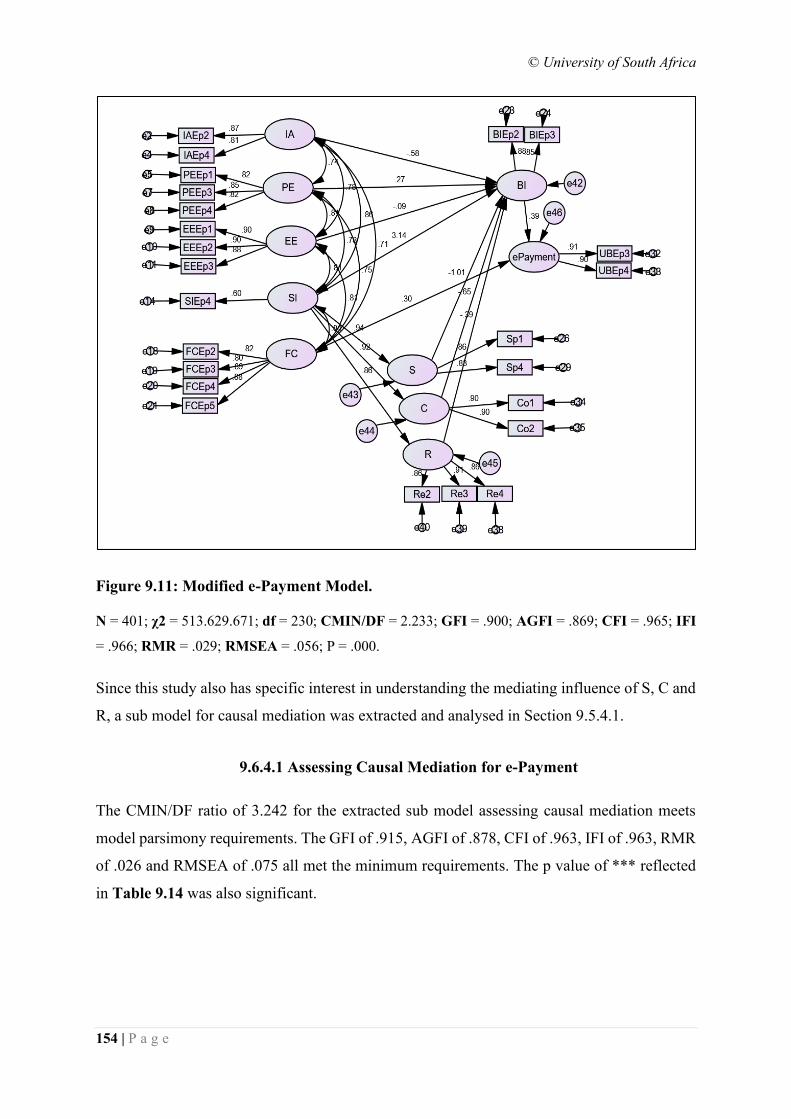
© University of South Africa
154 | P a g e
Figure 9.11: Modified e-Payment Model.
N = 401; χ2 = 513.629.671; df = 230; CMIN/DF = 2.233; GFI = .900; AGFI = .869; CFI = .965; IFI
= .966; RMR = .029; RMSEA = .056; P = .000.
Since this study also has specific interest in understanding the mediating influence of S, C and
R, a sub model for causal mediation was extracted and analysed in Section 9.5.4.1.
9.6.4.1 Assessing Causal Mediation for e-Payment
The CMIN/DF ratio of 3.242 for the extracted sub model assessing causal mediation meets
model parsimony requirements. The GFI of .915, AGFI of .878, CFI of .963, IFI of .963, RMR
of .026 and RMSEA of .075 all met the minimum requirements. The p value of *** reflected
in Table 9.14 was also significant.
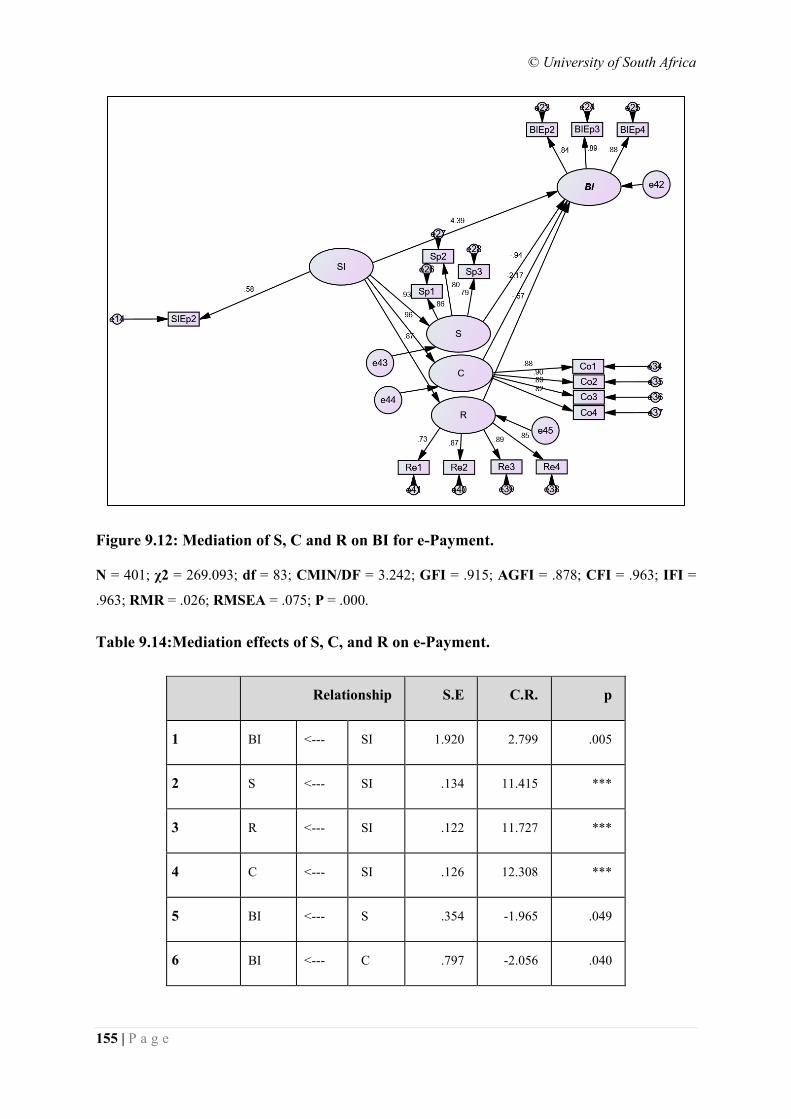
© University of South Africa
155 | P a g e
Figure 9.12: Mediation of S, C and R on BI for e-Payment.
N = 401; χ2 = 269.093; df = 83; CMIN/DF = 3.242; GFI = .915; AGFI = .878; CFI = .963; IFI =
.963; RMR = .026; RMSEA = .075; P = .000.
Table 9.14:Mediation effects of S, C, and R on e-Payment.
Relationship S.E C.R. p
1 BI <--- SI 1.920 2.799 .005
2 S <--- SI .134 11.415 ***
3 R <--- SI .122 11.727 ***
4 C <--- SI .126 12.308 ***
5 BI <--- S .354 -1.965 .049
6 BI <--- C .797 -2.056 .040
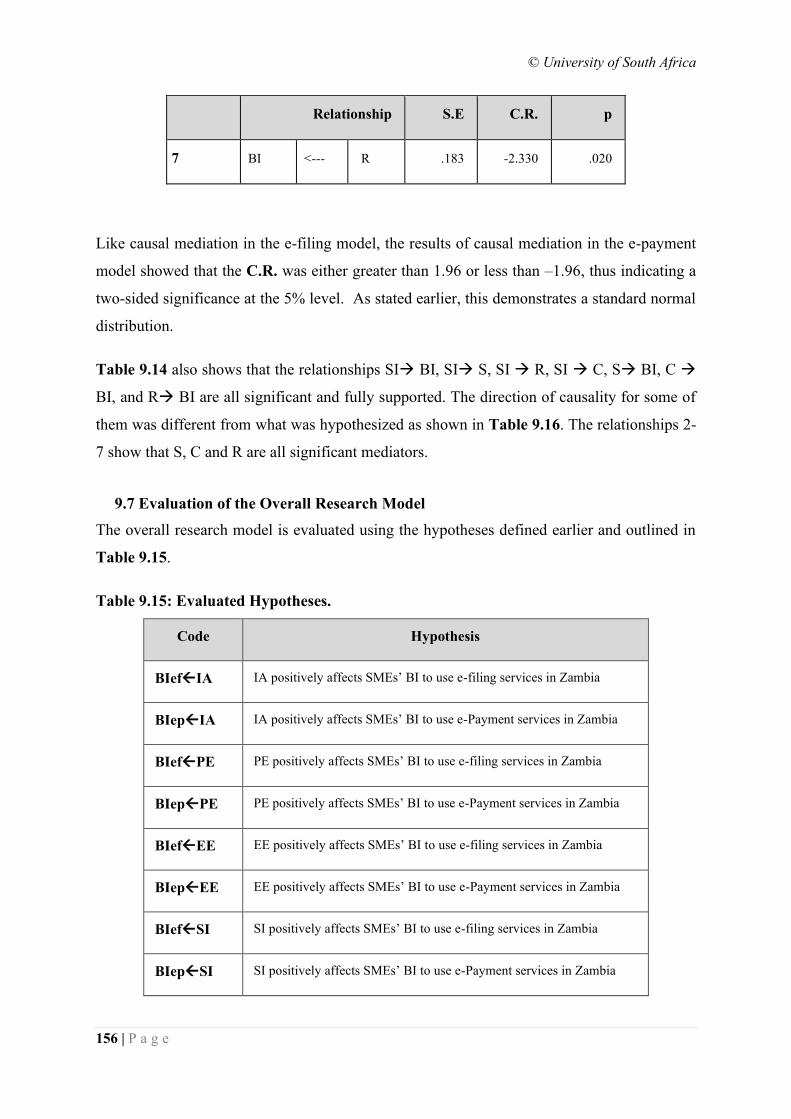
© University of South Africa
156 | P a g e
Relationship S.E C.R. p
7 BI <--- R .183 -2.330 .020
Like causal mediation in the e-filing model, the results of causal mediation in the e-payment
model showed that the C.R. was either greater than 1.96 or less than –1.96, thus indicating a
two-sided significance at the 5% level. As stated earlier, this demonstrates a standard normal
distribution.
Table 9.14 also shows that the relationships SI→ BI, SI→ S, SI → R, SI → C, S→ BI, C →
BI, and R→ BI are all significant and fully supported. The direction of causality for some of
them was different from what was hypothesized as shown in Table 9.16. The relationships 2-
7 show that S, C and R are all significant mediators.
9.7 Evaluation of the Overall Research Model
The overall research model is evaluated using the hypotheses defined earlier and outlined in
Table 9.15.
Table 9.15: Evaluated Hypotheses.
Code Hypothesis
BIefIA IA positively affects SMEs’ BI to use e-filing services in Zambia
BIepIA IA positively affects SMEs’ BI to use e-Payment services in Zambia
BIefPE PE positively affects SMEs’ BI to use e-filing services in Zambia
BIepPE PE positively affects SMEs’ BI to use e-Payment services in Zambia
BIefEE EE positively affects SMEs’ BI to use e-filing services in Zambia
BIepEE EE positively affects SMEs’ BI to use e-Payment services in Zambia
BIefSI SI positively affects SMEs’ BI to use e-filing services in Zambia
BIepSI SI positively affects SMEs’ BI to use e-Payment services in Zambia
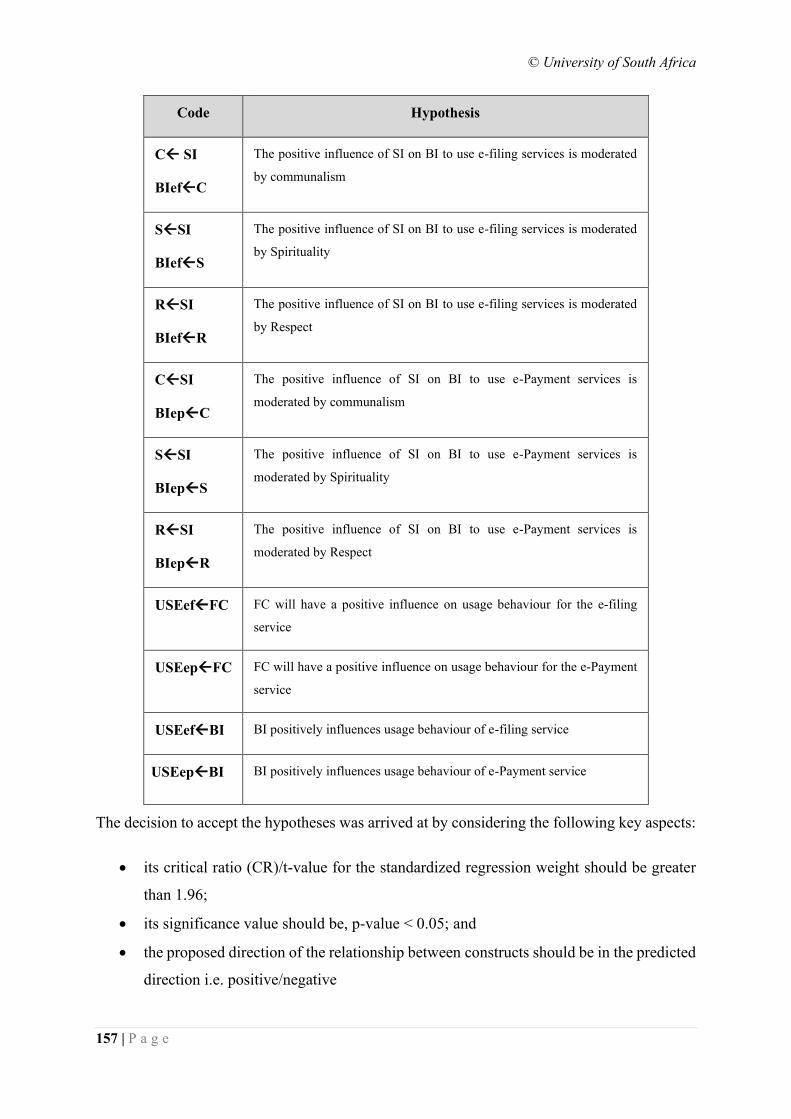
© University of South Africa
157 | P a g e
Code Hypothesis
C SI
BIefC
The positive influence of SI on BI to use e-filing services is moderated
by communalism
SSI
BIefS
The positive influence of SI on BI to use e-filing services is moderated
by Spirituality
RSI
BIefR
The positive influence of SI on BI to use e-filing services is moderated
by Respect
CSI
BIepC
The positive influence of SI on BI to use e-Payment services is
moderated by communalism
SSI
BIepS
The positive influence of SI on BI to use e-Payment services is
moderated by Spirituality
RSI
BIepR
The positive influence of SI on BI to use e-Payment services is
moderated by Respect
USEefFC FC will have a positive influence on usage behaviour for the e-filing
service
USEepFC FC will have a positive influence on usage behaviour for the e-Payment
service
USEefBI BI positively influences usage behaviour of e-filing service
USEepBI BI positively influences usage behaviour of e-Payment service
The decision to accept the hypotheses was arrived at by considering the following key aspects:
• its critical ratio (CR)/t-value for the standardized regression weight should be greater
than 1.96;
• its significance value should be, p-value < 0.05; and
• the proposed direction of the relationship between constructs should be in the predicted
direction i.e. positive/negative
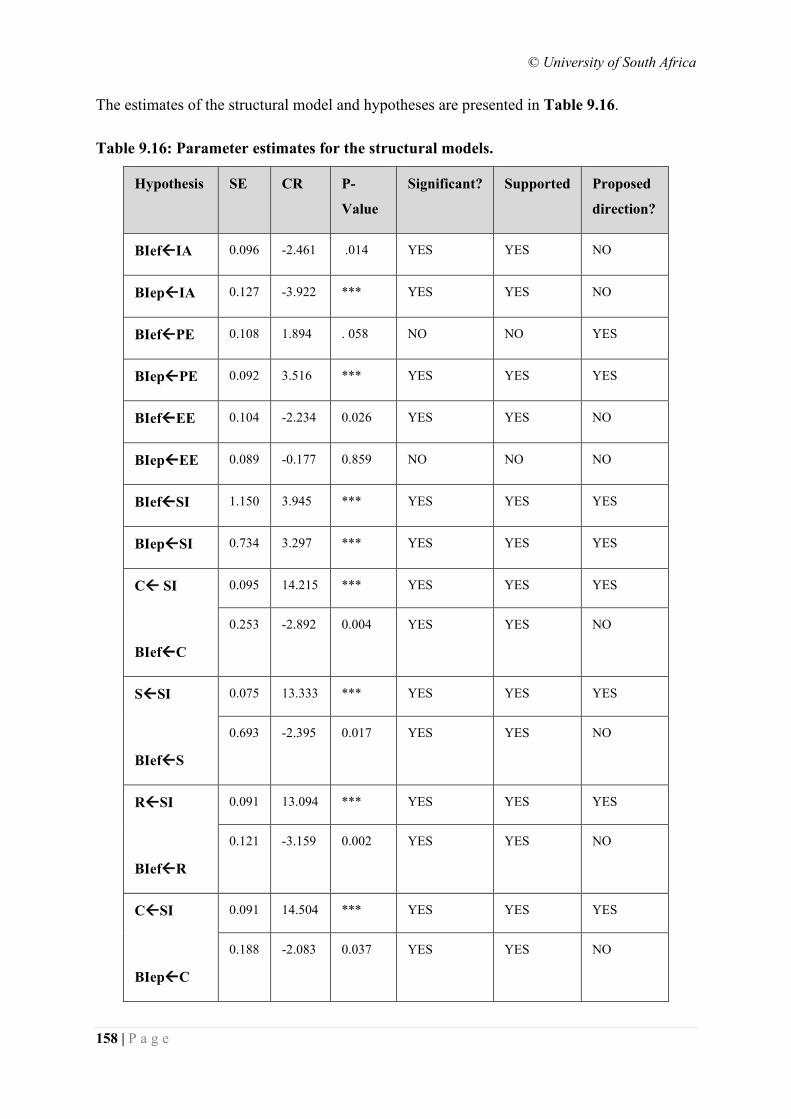
© University of South Africa
158 | P a g e
The estimates of the structural model and hypotheses are presented in Table 9.16.
Table 9.16: Parameter estimates for the structural models.
Hypothesis SE CR P-
Value
Significant? Supported Proposed
direction?
BIefIA 0.096 -2.461 .014 YES YES NO
BIepIA 0.127 -3.922 *** YES YES NO
BIefPE 0.108 1.894 . 058 NO NO YES
BIepPE 0.092 3.516 *** YES YES YES
BIefEE 0.104 -2.234 0.026 YES YES NO
BIepEE 0.089 -0.177 0.859 NO NO NO
BIefSI 1.150 3.945 *** YES YES YES
BIepSI 0.734 3.297 *** YES YES YES
C SI
BIefC
0.095 14.215 *** YES YES YES
0.253 -2.892 0.004 YES YES NO
SSI
BIefS
0.075 13.333 *** YES YES YES
0.693 -2.395 0.017 YES YES NO
RSI
BIefR
0.091 13.094 *** YES YES YES
0.121 -3.159 0.002 YES YES NO
CSI
BIepC
0.091 14.504 *** YES YES YES
0.188 -2.083 0.037 YES YES NO
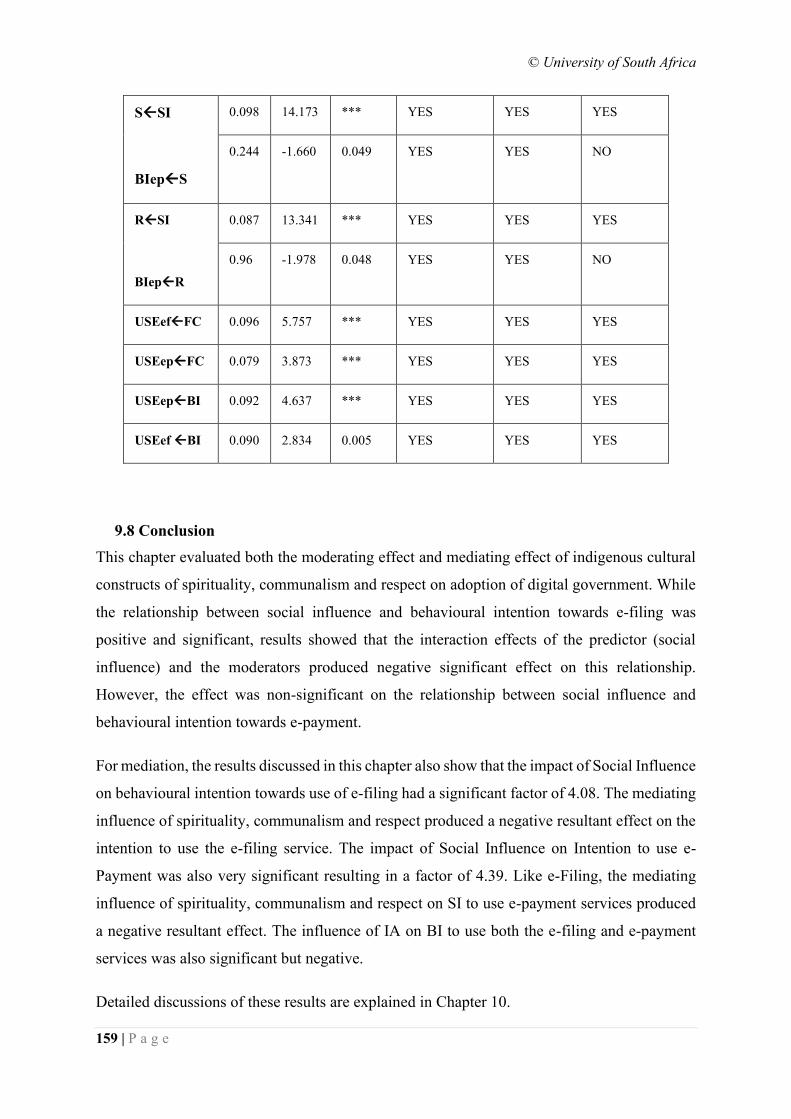
© University of South Africa
159 | P a g e
SSI
BIepS
0.098 14.173 *** YES YES YES
0.244 -1.660 0.049 YES YES NO
RSI
BIepR
0.087 13.341 *** YES YES YES
0.96 -1.978 0.048 YES YES NO
USEefFC 0.096 5.757 *** YES YES YES
USEepFC 0.079 3.873 *** YES YES YES
USEepBI 0.092 4.637 *** YES YES YES
USEef BI 0.090 2.834 0.005 YES YES YES
9.8 Conclusion
This chapter evaluated both the moderating effect and mediating effect of indigenous cultural
constructs of spirituality, communalism and respect on adoption of digital government. While
the relationship between social influence and behavioural intention towards e-filing was
positive and significant, results showed that the interaction effects of the predictor (social
influence) and the moderators produced negative significant effect on this relationship.
However, the effect was non-significant on the relationship between social influence and
behavioural intention towards e-payment.
For mediation, the results discussed in this chapter also show that the impact of Social Influence
on behavioural intention towards use of e-filing had a significant factor of 4.08. The mediating
influence of spirituality, communalism and respect produced a negative resultant effect on the
intention to use the e-filing service. The impact of Social Influence on Intention to use e-
Payment was also very significant resulting in a factor of 4.39. Like e-Filing, the mediating
influence of spirituality, communalism and respect on SI to use e-payment services produced
a negative resultant effect. The influence of IA on BI to use both the e-filing and e-payment
services was also significant but negative.
Detailed discussions of these results are explained in Chapter 10.
© University of South Africa
160 | P a g e
CHAPTER 10
10. DISCUSSION
10.1 Introduction
This research adds to extant knowledge by bringing to the fore the impact of African culture
as well as internet access on digital government adoption, in particular e-filing and e-payment
services in low-income countries such as Zambia.
The primary research question for this study was
To what extent does indigenous African culture influence digital government adoption by SMEs
in Zambia?
To add depth to this research, the primary research question was supported by secondary
questions itemised below;
a) To what extent does internet access influence digital government adoption in Zambia?
b) How is indigenous African culture exhibited in Zambia?
c) How does social influence impact digital government adoption, when moderated and mediated
by indigenous African culture?
In answering research questions, the UTAUT model was used. The data was subjected to
structural equations modelling using AMOS version 25.0 and SPSS version 26.0. Based on the
questions as well as literature review, seven (7) hypotheses were established, and were
empirically assessed for significance and direction of causality. The moderating and mediating
effect of cultural values of spirituality, communalism and respect were tested on current
association between social influence and intention to adopt e-filing and e-payment.
Both substantial and insignificant outcomes are deliberated in this chapter. The discourse
addresses primary research question elucidating the influence of indigenous culture as well as
internet access on digital government adoption.
© University of South Africa
161 | P a g e
10.2 Influence of Internet Access on Adoption of Digital Government Services
This section discusses significant outcomes associated with Secondary Research Question 1
and Hypothesis (H1).
Secondary Research Question 1: To what extent does internet access influence digital government
adoption in Zambia?
H1: IA positively affects SMEs’ BI to use e-filing and e-payment services in Zambia.
Internet access is an enabler for digital government adoption. Internet access in Zambia has
been provided to all provincial headquarters which are connected by optic fibre. Further,
Zambia has access through neighbouring countries to coastal undersea fibre cables that include
SAT3 or SAFE, MaIN OnE, GLO-1, WACS, ACE, SAex, WASACE, SEAS, TEAMs,
Seacom, Lion 2, Lion, EASSY, and BRICS. Due to these extensive ICT developments to the
extent that countrywide deployment of optic fiber has been undertaken in Zambia covering all
areas where this research was conducted and that mobile service providers reduced tariffs
following government’s provision of concessions and installation of microwave towers to
enable universal access, it was assumed that internet access would positively influence
intention to adopt digital government in Zambia. The results of the structural model revealed
that internet access had a negative but significant influence on behavioral intention to use
digital government services in Zambia. The relationships BIefIA for e-filing and BIepIA
for e-Payment were both significant but the direction of causality was negative. This result
reveals that internet access in Zambia is still perceived to be a hindrance or bottleneck to digital
government adoption, especially for the small and micro enterprises. These findings call for a
thorough review of internet access in Zambia with a view of developing regulations that enable
attainment of universal access by all citizens especially SMEs for the purpose of digital
government development and adoption. Internet access can also be seen as an important enabler
for attaining the United Nation’s Sustainable Development Goals number 8 (Decent work and
economic growth) and number 10 (Reduced inequalities). Such a review would be useful in
other low-income countries of similar social context.
10.3 Influence of Performance Expectancy on Adoption of Digital Government
Services
This section discusses significant and non-significant findings associated with the following
Hypothesis (H2);
© University of South Africa
162 | P a g e
H2: PE positively affects SMEs’ BI to use e-filing and e-payment services in Zambia
The expectation that using an information system would improve one’s performance is an
enabler to adopting digital government services. On the contrary, the SEM structural
assessment revealed that the relationship BIefPE for e-filing was non-significant although
the direction of causality was positive, consistent with the hypothesis. This is also consistent
with the general perception of the Zambian SMEs, particularly those in the informal sector,
who perceive the e-filing service to be complex. In recognition of this complexity, the Tax
Authority has embarked on a project to implement a simplified mobile e-filing process for the
informal sector. These results empirically validate the perceptions raised by taxpayers.
The relationship BIepPE for e-Payment was however seen to be significant and the direction
of causality was positive, also consistent with the hypothesis. This is consistent with the
demographic results shown in Chapter 8, Table 8.2 which revealed that 95.5% of the
respondents had experience in the use of the e-payment service. The finding also empirically
supports the general notion that the e-payment service is much simpler to use than the e-filing
service. Chapter 8, Table 8.2 shows that only 61.1% of the respondents had experience or were
comfortable with using the e-filing service. Almost 40% of the respondents thought that the e-
filing service did not improve their performance. This is a relatively large number of SMEs
that government cannot afford to ignore.
10.4 Influence of Effort Expectancy on Adoption of Digital Government Services
This section discusses significant and non-significant findings associated with the following
Hypothesis (H3);
H3: EE positively affects SMEs’ BI to use e-filing and e-payment services in Zambia
Using a digital innovation is perceived to reduce the effort required to complete a task. In this
vein, it was perceived that using the e-filing and e-payment services of digital government
would reduce the effort required to complete tax filing of returns and actual payment compared
to doing them manually. The SEM structural assessment revealed that the relationship
BIefEE for e-filing was significant. However, the direction of causality was negative,
meaning that using the e-filing service was not perceived to reduce effort to complete the filing
tasks. This empirically shows that the e-filing service is perceived to be complex. Complexity
can be a hindrance to technology adoption (Oliveira and Martins, 2011) and thus retard the rate
© University of South Africa
163 | P a g e
of technological development. This raises the need to review the current processes and
functionality of the e-filing service of the tax system in Zambia with a view to simplifying
them. A detailed training programme for these SME taxpayers can help mitigate the perception
of complexity.
On the contrary, the relationship BIepEE was found to be non-significant. Like e-Filing, the
direction of causality for e-payment was negative. This could be attributed to the number of
stages in completing e-payment process for each tax return. The process involves registering a
payment on the tax system and completing the actual payment either at a commercial bank or
on a mobile payment platform. Unlike e-filing, e-payment has been in use for a relatively longer
time for different services in Zambia. The non-significance of the relationship BIepEE could
be attributed to the extant knowledge among the taxpaying SME in Zambia.
10.5 Influence of Social Influence on Adoption of Digital Government Services
This section discusses significant findings associated with the Hypothesis H4.
H4: SI positively affects SMEs’ BI to use e-filing and e-Payment services in Zambia
In an African social context in general and Zambia in particular, social influence is driven by
normative coercive forces in business, work environment or neighbourhoods where SME
owners reside. Social Influence has strong effects in Zambia. This was exhibited by
relationships BIefSI and BIepSI, both of which were positively significant. The results
show that Social Influence positively influences behavioral intention to use both the e-filing
and e-payment services. The implication of this result is that government should target groups
of SME owners and civic leaders to serve as change agents for the digital government
development and adoption agenda while at the same time addressing the negative effects of
moderators and mediators discussed in Chapter 9.
10.6 Moderating and Mediating Influence of Indigenous African Culture on Social
Influence
Section 10.6 discusses significant findings associated with Secondary Research Questions 2
and 3 and Hypothesis H4a.
Secondary Research question 2: How is indigenous African culture exhibited in Zambia?
© University of South Africa
164 | P a g e
Secondary Research question 3: How does social influence impact digital government adoption, when
moderated and mediated by indigenous African culture?
H4a: The positive influence of SI on BI to use e-filing and e-payment services is both i)
moderated and ii) mediated by 1) spirituality, 2) African communalism, and 3) respect for
elders and authority.
Indigenous culture in Zambia as illustrated in Chapter 2 Section 2.6 endorses spirituality,
communalism and respect for elders and authority as key practises in Zambian tradition. These
indigenous cultural constructs have moderating and mediating influence on the adoption of e-
filing and e-payment services in Zambia. Their influence is shown by the hypothesis H4a whose
results are discussed below.
The results of the structural model assessment show that spirituality, communalism and respect
for elders and authority are positive and significant moderators of intention to adopt e-Filing.
The results are however insignificant for the e-payment service, which means that spirituality,
communalism and respect for elders and authority encapsulated as indigenous culture does not
moderate the relationship between social influence and intention to adopt e-payment. This
result is supported by the high percentage points for those comfortable with the e-payment
service.
The study has also revealed that the potential development brought about by the
implementation of digital government services is mediated by strands of African culture, which
are often ignored. The study has demonstrated the mediating effect of the three strands of
African culture in Zambia namely spirituality, communalism and respect for authority and
elders on the relationship between social influence and intention to adopt e-Filing. For the e-
payment service, all the cultural constructs were seen to be significant negative mediators.
These cultural strands are entrenched in communities and societies. For example, literature
shows that 99.3% of Zambians (United States Department of State, 2016), 99.7% of Nigerians
(Grim et al., 2017), 83.6% of South Africans (Schoeman, 2017) and 99.2% of Tunisians
(United States Department of State, 2011) practice some kind of spirituality; religious and
normative belief system.
Social influence which gives rise to social coercion arising from communal formations
especially in Zambian where most taxpaying SMEs reside in communal environments and also
© University of South Africa
165 | P a g e
their businesses are in communal environments brings to the fore effects of communalism,
which have been found to negatively affect digital government adoption.
Zambia, like most low-income countries in Africa, has a strong culture of respect for authority
and elders resulting in a social environment that potentially dictates the direction of behaviour
for individuals. If people in positions of authority in the community and elders hold a certain
view on a subject matter, such a view is likely to be adopted by subordinates. The results show
that although social influence has a strong positive influence, the subordination of one’s actions
to high authorities and to elders implies that they cannot take the actions they intended to take.
Such a behaviour does not promote development and can retard progress as the case has been
with digital government adoption in Zambia.
Chapter 9, Table 9.16 shows that social influence had a significant and positive influence on
the behavioural intention to use both e-filing and e-payment. This influence was negated by
the African cultural constructs of spirituality, communalism and respect, which previously
were assumed to be positive moderators and mediators. These findings help policy makers to
incorporate policies that address cultural issues during digital government implementation and
adoption.
10.7 Influence of Facilitating Conditions on Usage of Digital Government Services
H5a: FC will have a positive influence on e-filing service usage behaviour
H5b: FC will have a positive influence on e-payment service usage behaviour
Facilitating Conditions are key to technology adoption. In the absence of these, it is nearly
impossible to use any technology. For digital government in Zambia, facilitating conditions
include the network infrastructure, availability of computers, accessibility of digital
government services and availability of support. The results of the SEM structural assessment
revealed that the relationships e-FilingFC and e-PaymentFC showed significant and
positive influence on actual behaviour to use both the e-filing and e-Payment services.
© University of South Africa
166 | P a g e
CHAPTER 11
11. CONCLUSION
11.1 Introduction
The study investigated the moderating and mediating influence of indigenous African culture
as well as that of internet access on the adoption of digital government services (e-filing and e-
payment) among SMEs in Zambia. The study sought to examine the extent to which adoption
is influenced by indigenous African culture and internet access in low-income countries such
as Zambia, which have consistently lagged behind. The research has both theoretical and
practical significance. Theoretically, the research links indigenous African culture to adoption
of digital government, in particular e-filing as well as e-payment. There has been a knowledge
gap on the effect of indigenous African culture. Practically, the study offers leads into digital
government strategies that could help improve adoption levels in Zambia, and other low-
income countries that are contextually similar.
Through a systematic review, three constructs were identified as the indigenous African
cultures that influence digital government; spirituality, African communalism and respect for
elders and authority. The three constructs, as well as internet access, were investigated for the
moderating as well as mediating effect on digital government adoption using the Unified
Theory of Acceptance and Use of Technologies (UTAUT) as the theoretical model. The data
collected from 401 SMEs was analysed using Structural Equations Modelling (SEM). The
detailed conclusions of the study are discussed in subsequent sections.
11.2 Effect of Indigenous African Culture
The study reveals that the adoption of digital government initiatives by SMEs can be hindered
by indigenous Africa culture, particularly spirituality, communalism and respect for authority
and elders. The study therefore moves the conversation around the failure of digital innovations
beyond the mere mention of problematic “culture” by identifying specific cultural constructs.
The identification of such constructs should assist further research and investigation on how to
incorporate culture as part of digital innovation in the African context, especially in the context
of government. Deliberate policies and regulations, targeted at encouraging social as well as
cultural practices that inspire digital government adoption, and a strong change management
© University of South Africa
167 | P a g e
programme are key to assuring sustainable development in respect of ICT, especially in low-
income countries.
Spirituality, which should be understood beyond religion and encompasses beliefs, values,
traditions and ways of thinking, moderates SMEs’ intention to adopt digital government the
most. This means that spirituality, and its expression in religion, aspects which are strong in
Africa are some of the reasons. One suggestion is not to suppress spirituality but to find means
in which spirituality and religion might rather add to the adoption of digital innovations in
Africa. The integration of digital symbols and spiritual artefacts in the design of digital
government innovations could stir interest especially that an association would be made with
the meanings of such symbols and artefacts thereby negating the adverse effects of spirituality.
The practical implication is that the SMEs would be culturally associated with the innovations,
making adoption much easier. Change management strategies associated with major
implementations such as digital government should include spirituality messages, especially
those that support adoption.
African Communalism, sometimes also known as Ubuntu, has both negative moderating and
negative mediating influence on the relationship between social influence and behavioural
intention for both e-filing as well as e-payment. The more the SMEs exhibit communalism, the
less they adopt the digital government services. For e-payment services African communalism
was found to be only a significant mediator meaning that for e-payment, SMEs are more likely
to use digital means to pay because other SMEs are doing the same. The practical implication
is that more efforts can then be placed in encouraging more SMEs to pay using digital means
to create a cascading effect over time.
Respect for authority and elders was also found to have negative moderating and mediating
influence on the relationship between social influence and behavioural intention to use both e-
filing and e-payment services. Zambia, like most low-income countries in Africa, has a strong
culture of respect for authority and elders resulting in a social environment that strongly
influences behaviour for individuals. If people in positions of authority in the community and
elders hold a certain view on a subject matter, such a view is likely to be adopted by the
community members. The finding reveals that the subordination of SME owner behaviour to
those in authority and to elders implies that he or she will probably defer to what will please
those in authority rather than what would promote the business. Such choices therefore
© University of South Africa
168 | P a g e
influence digital government adoption. The practical implication is that digital innovations
therefore need to start with community elders and those in authority.
The above findings reveal important subtleties that suggest that the over focus on factors such
as infrastructure, software licences, skilled labour as well as financial resources should be
reconsidered when digital government implementation and adoption in low-income countries
is evaluated. It is equally important to measure the influence of context-specific softer cultural
issues such as spirituality that are deeply rooted in the indigenous cultures of African
communities and societies, African communalism and respect for elders and authority.
Implementers of digital government services, especially in low-income countries, should
undertake a thorough review of both hard and soft issues that potentially affects the
implementation and adoption of digital government services. While hard issues may be easier
to address, tackling soft issues takes longer. Therefore, knowledge of the existence of beliefs
and values such as indigenous African culture, in all its forms, is critical. The findings provide
insight into the more salient cultural aspects that influence digital government programmes in
low-income countries in Africa.
The results also emphasise the need for more thoughtful training programmes whenever a new
digital government artefact is released.
11.3 Practical effect of Internet Access and UTAUT Constructs
There has been extensive development in the ICT infrastructure with the a countrywide
deployment of optic fiber in Zambia. Mobile service providers further reduced tariffs following
government’s provision of concessions and installation of microwave towers to enable
universal access. It was therefore assumed that internet access would positively influence
behavioral intention to use digital government services in Zambia. The results of the structural
model revealed that, on the contrary, internet access had a negative significant influence on
behavioral intention to use digital government services. This result reveals that internet access
in Zambia is still perceived to be a hindrance to digital government adoption, especially for the
small and micro enterprises. These findings call for a review of internet access in Zambia with
a view of developing regulations that enable attainment of universal access by all citizens
especially SMEs for the purpose of digital government development and adoption. Such a
review would be useful in other low-income countries of similar social context.
© University of South Africa
169 | P a g e
The structural model also showed that the expectation that e-filing would improve performance
of filing tax returns was insignificant. Most SMEs found the e-filing service of digital
government to be relatively complex. There is therefore a need to improve the current processes
and functionality of the e-filing service of the tax system in Zambia with a view of simplifying
them. A detailed training programme can help mitigate the perception of complexity.
Facilitating conditions such as ICT infrastructure, if available and accessible, would positively
influence usage behavior of e-filing as well as e-payment. Behavioral intention also positively
influenced e-filing and e-payment usage.
11.4 Digital Government Usage
This study also revealed that digital government services are still under-utilised in Zambia. A
deliberate policy of implementing optic fibre links to households and business premises
coupled with measures to reduce tariffs would enhance usage of other digital government
services. Improving the network infrastructure to enhance internet access provides essential
means of encouraging digital government usage. Another option that encourages digital
government uptake or usage is the elimination of alternative ways of interacting with
government to obtain services. This could encourage SMEs to adopt digital means of engaging
government. The other option is to enact pro-digital government regulations and laws.
The formation of the Smart Zambia Institute aimed at implementing digital government in
Zambia provides a suitable platform to coordinate and regulate digital government activities.
The Institute should address aspects whereby digital government innovations are designed,
implemented and used in isolation. The Institute should also review the usability of digital
government initiatives in the lens of the consumer, SMEs with the aim of ensuring that
solutions are adapted to suit local needs.
11.5 Theoretical Implications of the Research
The study offers some important implication for research. First, the study broadens the
knowledge of the influence of culture on digital government adoption by offering
comprehensive and a systematic literature in contextualised aspects of culture and digital
government with key reflections on both information systems as well as cultural perspectives.
The findings show that indigenous African culture is a multidimensional factor comprising
among others, spirituality, African communalism and respect for elders and authority, which
influence relationships between exogenous constructs such as social influence and intention to
© University of South Africa
170 | P a g e
adopt information systems. This is largely due to the positioning of SMEs in social networks
(as explained in Chapter 3, Section 3.2.5) where cultural influences become osmotic. The
research further established a theoretical model to validate the moderation and mediation
effects of the indigenous African culture. The findings lay further opportunities to develop or
even strengthen existing theory in the field of digital government.
11.6 Research Contributions
Three principal contributions are key outcomes of this research. First, through a systematic
literature review, this study identifies the uniqueness of indigenous African culture in digital
government research. Of the 33 relevant scholarly articles reviewed, only one, in a pilot study,
attempted to investigate the influence of indigenous African culture. The E-Government
Development Index juxtaposed with the Human Development Index in Chapter 3 reveals a need for
contextualised solutions to address digital government adoption problems experienced by SMEs in
Africa in general and Zambia in particular. Second, the study introduces three aspects of
indigenous African cultural constructs that potentially influence SMEs’ adoption of digital
government: spirituality, African communalism and respect for authority and elders. As
highlighted in Chapter 2, these indigenous cultural constructs are deeply rooted in African
communities from which SMEs originate. Third, the study presents an adoption model that
could be extended to similar cultural contexts to validate the effect of indigenous cultural
constructs on digital government.
11.7 Recommendations and Future Work
This study makes a contribution to the literature on Information Systems, information and
communication technology for development (ICT4D) as well as digital government. The study
develops theoretical insight into digital government adoption and delves into cultural
constituents that provide context in appraising digital government models in African countries.
The researcher recommends that a similar study be undertaken in another African country or a
low-income country of a similar context. Other research designs such as interpretive studies
are recommended to elicit other indigenous social and cultural influences and to get deeper
insights into causal relationships.
In respect of practice and policy, the researcher recommends that policies and programmes
that address contextualized indigenous cultural dispensations be developed and implemented.
© University of South Africa
171 | P a g e
11.8 Research Limitation
Generalisability from a single study represents one limitation of the research. Qualitative
methods could also be triangulated with the research results to deepen insight into influence of
African indigenous culture on digital government adoption. The study purposely focused on
SMEs who actively use the internet. The time horizon considered was cross-sectional rather
than longitudinal. Collecting data over a period of time to synthesise behavioural patterns
regarding digital government adoption may reveal clear trends, which may provide more
insight. Use of a case study or a narrative inquiry applying an interpretivist philosophy could
be used in future studies to gain a deeper insight into African communalism and its effects on
digital government. The research could also benefit from the application of statistical
techniques to address common method biases.
© University of South Africa
172 | P a g e
12. REFERENCES
Abdullah, M. and Khanam, L. (2016) ‘The Influence of Website Quality on m-banking Services
Adoption in Bangladesh : applying the UTAUT2 model using PLS’, pp. 428–440.
Ada and Cukai (2014) ‘Factors Influencing E-Filing Usage Among Malaysian Taxpayers : Does Tax
Knowledge Matters ?’, Jurnal Pengurusan, 40, pp. 91–101.
Ada, P. and Cukai, P. (2014) ‘Factors Influencing E-Filing Usage Among Malaysian Taxpayers : Does
Tax Knowledge Matters ?’, 40, pp. 91–101.
Agbemenu, A. S. and Marfo, J. S. (2016) ‘Access to Internet Connectivity : the Major Bottleneck to the
Adoption of Technology-Enabled Education ( The Case of KNUST ) Access to Internet Connectivity :
the Major Bottleneck to the Adoption of Technology-Enabled Education ( The Case of KNUST )’,
Reaearchgate publication, (January), p. 8. Available at:
https://www.researchgate.net/publication/289128990%0AAccess.
Agulanna, C. (2010) ‘COMMUNITY AND HUMAN WELL-BEING’, 14, pp. 282–298. doi:
10.3176/tr.2010.3.05.
Ahmed, K. and Mansoori, A. (2017) ‘Use of a modified UTAUT model to investigate Emirati Citizens
’ adoption of e-Government in Abu Dhabi Use of a Modified UTAUT Model to Investigate Emirati
Faculty of Business’.
Aida, A. and Majdi, M. (2014) ‘National Culture and E-Government Services adoption Tunisian case’,
International Journal of Business & Economic Strategy, 1, pp. 1–5.
Ajzen, I. (1991a) ‘The theory of planned behavior’, Orgnizational Behavior and Human Decision
Processes, 50, pp. 179–211. doi: 10.1016/0749-5978(91)90020-T.
Ajzen, I. (1991b) ‘The Theory of Planned Behavior’.
Akkaya, C., Wolf, P. and Krcmar, H. (2012) ‘Factors Influencing Citizen Adoption of E-Government
Services : A cross-cultural comparison ( Research in Progress )’, in 2012 45th Hawaii International
Conference on System Sciences. doi: 10.1109/HICSS.2012.278.
Al-Hujran, O., Al-dalahmeh, M. and Aloudat, a (2011) ‘The Role of National Culture on Citizen
Adoption of eGovernment Services: An Empirical Study’, Electronic Journal of e-Government, 9(2),
pp. 93–106.
© University of South Africa
173 | P a g e
Al-Lamki, Z. S. (2018) The Influence of Culture on the Successful Implementation of ICT Projects in
Omani E-government An Explanatory Approach Using a Multiple Case Studies Strategy from an
Information Systems Perspective. Available at:
https://pdfs.semanticscholar.org/fda6/9a75dd138eea44c03d0628c9d859f5ec6030.pdf.
Al-mamary, Y. H. et al. (2016) ‘A critical review of models and theories in field of individual
acceptance of technology’, International Journal of Hybrid Information Technology Vol., 9(6), pp. 143–
158. doi: 10.14257/ijhit.2016.9.6.13.
Al-muftah, H. et al. (2018) ‘Factors in fl uencing e-diplomacy implementation : Exploring causal
relationships using interpretive structural modelling’, Government Information Quarterly. Elsevier,
(December 2017), pp. 1–13. doi: 10.1016/j.giq.2018.03.002.
AL-Shehry, A. et al. (2006) ‘the Motivations for Change Towards E- Government Adoption : Case
Studies From Saudi’, eGovernment Workshop ’06, 06. doi: 10.1.1.106.6960.
Aladwani, A. M. (2013) ‘A cross-cultural comparison of Kuwaiti and British citizens ’ views of e-
government interface quality’, Government Information Quarterly. Elsevier Inc., 30(1), pp. 74–86. doi:
10.1016/j.giq.2012.08.003.
AlAwadhi and Morris (2009) ‘Factors influencing the adoption of e-government services’, Journal of
Software, 4(6), pp. 584–590. doi: 10.4304/jsw.4.6.584-590.
Alawadhi, S. and Morris, A. (2008) ‘The use of the UTAUT model in the adoption of e-government
services in Kuwait’, Proceedings of the Annual Hawaii International Conference on System Sciences,
pp. 1–11. doi: 10.1109/HICSS.2008.452.
Alcaide–Muñoz, L. et al. (2017) ‘Analysing the scientific evolution of e-Government using a science
mapping approach’, Government Information Quarterly. Elsevier, 34(3), pp. 545–555. doi:
10.1016/j.giq.2017.05.002.
Alghamdi, I. A., Goodwin, R. and Rampersad, G. (2011) ‘E-Government Readiness Assessment for
Government Organizations in Developing Countries’, Computer and Information Science, 4(03).
Alharbi, N., Papadaki, M. and Dowland, P. (2014) ‘Security Challenges of E-Government Adoption
Based On End Users ’ Perspective’, in The 9th International Conference for Internet Technology and
Secured Transactions (ICITST-2014), pp. 78–82.
Ali, M., Weerakkody, V. and El-Haddadeh, R. (2009a) ‘The Impact of National Culture on E-
Government Implementation : A Comparison Case Study’, in Proceedings of the Fifteenth Americas
© University of South Africa
174 | P a g e
Conference on Information Systems, pp. 1–13.
Ali, M., Weerakkody, V. and El-Haddadeh, R. (2009b) ‘The Impact of National Culture on
eGovernment Implementation : A Comparison Case Study The Impact of National Culture on E-
Government Implementation : A Comparison Case Study’, AMCIS 2009 Proceedings., 137.
Alok, M. and Deepti, M. (2012) ‘E-government: exploring the different dimensions of challenges,
implementation, and success factors’, ACM SIGMIS Database, 42(4), pp. 23–38.
Alraja, M. N. (2016) ‘THE EFFECT OF SOCIAL INFLUENCE AND FACILITATING
CONDITIONS ON E-GOVERNMENT ACCEPTANCE FROM THE INDIVIDUAL EMPLOYEES ’
PERSPECTIVE’, Polish Journal of Management Studies, 14(2), pp. 18–27. doi:
10.17512/pjms.2016.14.2.02.
Alsaif, M. (2013) ‘Factors affecting citizens’ adoption of e-Government moderated by socio-cultural
values in Saudi Arabia’, Proceedings of the European Conference on e-Government, ECEG, pp. 578–
586. doi: 10.1179/204264411X12961227987886.
Alshehri, M. A. (2012) ‘Using the UTAUT Model to Determine Factors Affecting Acceptance and Use
of E-government Services in the Kingdom of Saudi Arabia’.
Alshehri, M. A. and Drew, S. (2010) ‘Implementation of e-Government: Advantages and Challenges’,
International Conference E-Activity and Leading Technologies 2010, pp. 79–86. Available at:
http://www98.griffith.edu.au/dspace/handle/10072/40620%5Cnpapers2://publication/uuid/09E5E6A6
-EC7D-4E17-84FB-677189A5AB74.
Alshehri, M. D. S. (2010) ‘E-Government Fundamentals’, Proceedings of the IADIS International
Conference ICT, Society and Human beings, pp. 35–42. Available at: http://www.iadisportal.org/ict-
2010-proceedings.
Alshehri, M. and Drew, S. (2010) ‘Implementation of e-Government: Advantages and Challenges’, pp.
79–86.
Alshehri, M. and Drew, S. J. (2011) ‘E-government principles : implementation , advantages and
challenges’, International Journal of Electronic Business, 9(3), pp. 255–270.
Ambali, A. R. (2009) ‘E-Government Policy : Ground Issues in E-Filing System’, 11(2), pp. 249–266.
Ami-narh, J. T. and Williams, P. A. H. (2012) ‘A revised UTAUT model to investigate E-health
acceptance of health professionals in Africa’, 3(10), pp. 1383–1391.
© University of South Africa
175 | P a g e
Amui, L. B. L. et al. (2017) ‘Sustainability as a dynamic organizational capability: a systematic review
and a future agenda toward a sustainable transition’, Journal of Cleaner Production. Elsevier Ltd, 142,
pp. 308–322. doi: 10.1016/j.jclepro.2016.07.103.
Andersen, K. V. and Henriksen, H. Z. (2006) ‘E-government maturity models: Extension of the Layne
and Lee model’, Government Information Quarterly, 23(2), pp. 236–248. doi:
10.1016/j.giq.2005.11.008.
Anderson, T. W. and Rubin, H. (1956) ‘Statistical inference in factor analysis’, Proceedings of the third
Berkeley Symposium on mathematical statistics and probability: contributions to the theory of statistics,
V, p. 111.
Andoh-Baidoo, F. K. (2017) ‘Context-specific theorizing in ICT4D research’, Information Technology
for Development. Routledge, 23(2), pp. 195–211. doi: 10.1080/02681102.2017.1356036.
Anthopoulos, L. and Reddick, C. G. (2016) ‘Smart City and Smart Government : Synonymous or
Complementary ?’, pp. 351–355.
Anza, F. A., Sensuse, D. I. and Ramadhan, A. (2017) ‘Developing e-government maturity framework
based on cobit 5 and implementing in city level: Case study depok city and south tangerang city’,
International Conference on Electrical Engineering, Computer Science and Informatics (EECSI),
4(September), pp. 713–718. doi: 10.11591/eecsi.4.1076.
Asianzu, E. and Maiga, G. (2012) ‘A Consumer Based Model for Adoption of E-Tax Services in
Uganda’, IST-Africa 2012 Conference Proceedings, pp. 1–15. Available at: www.IST-
Africa.org/Conference2012.
Aurick, M. et al. (2017) ‘Urban Informality and Small Scale Enterprise (SME) Development in Zambia:
An Exploration of Theory and Practice’, Journal of Behavioural Economics, Finance,
Entrepreneurship, Accounting and Transport, 5(1), pp. 19–29. doi: 10.12691/jbe-5-1-3.
Awang, Z. (2012) A Handbook on SEM.
AWAPSA (2018) ‘JOINT REPORT ON ARTICLE 16, MUSLIM FAMILY LAW AND MUSLIM
WOMEN’S RIGHTS IN KENYA’, in 68th CEDAW Session.
Azmi, Kamarulzaman and Hamid (2012a) ‘Perceived risk and the adoption of tax e-filing’, World
Applied Sciences Journal, 20(4), pp. 532–539. doi: 10.5829/idosi.wasj.2012.20.04.2403.
Azmi, Kamarulzaman and Hamid (2012b) ‘Perceived Risk and the Adoption of Tax E-Filing Inland
Revenue Board , Malaysia’, World Applied Sciences Journal, 20(4), pp. 532–539. doi:
© University of South Africa
176 | P a g e
10.5829/idosi.wasj.2012.20.04.2403.
Bagozzi, R. P., Yi, Y. and Phillips, L. W. (1991) ‘Assessing Construct Validity in Organizational
Research’, Administrative Science Quarterly, 36(3), p. 421. doi: 10.2307/2393203.
Banda, D. (2012) ‘Extract of dissertation on Zambia’s culture and cultural identity’, pp. 18–20.
Belachew, M. (2010) ‘e-government initiatives in Ethiopia’, Proceedings of the 4th International
Conference on Theory and Practice of Electronic Governance - ICEGOV ’10, p. 49. doi:
10.1145/1930321.1930332.
Blut, M. and Wang, C. (2020) ‘Technology readiness: a meta-analysis of conceptualizations of the
construct and its impact on technology usage’, Journal of the Academy of Marketing Science. Journal
of the Academy of Marketing Science, 48(4), pp. 649–669. doi: 10.1007/s11747-019-00680-8.
Bollen, K. A. (1984) ‘Multiple indicators: Internal consistency or no necessary relationship?’, Quality
and Quantity, 18(4), pp. 377–385. doi: 10.1007/BF00227593.
Bollen, K. A. (2006) ‘Total, Direct, and Indirect Effects in Structural Equation Models’, Sociological
Methodology, 17, p. 37. doi: 10.2307/271028.
Borras, J. (2004) ‘International Technical Standards for e-Government’, Electronic Journal of
eGovernment, 2, pp. 75–80. doi: 10.3109/14992020209090412.
Bregman, L. (2004) ‘Defining spirituality: multiple uses and murky meanings of an incredibly popular
term.’, The journal of pastoral care & counseling : JPCC, 58(3), pp. 157–167. doi:
10.1177/154230500405800301.
Buabeng-Andoh, C. (2012) ‘Factors influencing teachers ’ adoption and integration of information and
communication technology into teaching: A review of the literature’, International Journal of
Education and Development using Information and Communication Technology, 8(1), pp. 136–155.
Bwalya, K. J. (2009a) ‘Factors affecting Adoption of e-Government in Zambia’, Ejisdc, 38(4), pp. 1–
13. doi: .
Bwalya, K. J. (2009b) ‘Factors Affecting Adoption of e-Government in Zambia’, The Electronic
Journal of Information Systems in Developing Countries, 38(1), pp. 1–13. doi: 10.1002/j.1681-
4835.2009.tb00267.x.
Bwalya, K. J. and Healy, M. (2010) ‘Harnessing e-Government Adoption in the SADC Region: a
Conceptual Underpinning’, Electronic Journal of e-Government, 8(1), pp. 23–32. Available at:
© University of South Africa
177 | P a g e
www.ejeg.com.
c. p. siu, P. (1952) ‘the sojourner’, 58(6), pp. 34–44.
Cahlikova, T. (2014) ‘Significance of socio-cultural, political and historical factors for the introduction
of e-participation in Switzerland’, in Proceedings of the 8th International Conference on Theory and
Practice of Electronic Governance - ICEGOV ’14, pp. 524–527. doi: 10.1145/2691195.2691239.
Calma, T. (2010) ‘Respect, Tolerance and Reconciliation Rather than Opposition and Denial:
Indigenous Spirituality, Land, and the Future of Religion in Australia’, Sage Journal, 23(3), pp. 322–
336.
Cangur, S. and Ercan, I. (2017) ‘Comparison of Model Fit Indices Used in Structural Equation
Modeling Under Multivariate Normality’, Journal of Modern Applied Statistical Methods, 14(1), pp.
152–167. doi: 10.22237/jmasm/1430453580.
Central Statistics Office Zambia (2012) ‘Census of population and housing 2010, National Analytical
Report’, National Analytic Report.
Chandra, P. (2015) ‘QUALITY ON CONTINUANCE INTENTION TOWARD E-FILING SYSTEM’,
10(2), pp. 65–76.
Chen, C.-C. (2013) ‘The exploration on network behaviors by using the models of Theory of planned
behaviors (TPB), Technology acceptance model (TAM) and C-TAM-TPB’, African Journal of
Business Management, 7(30), pp. 2976–2984. doi: 10.5897/AJBM11.1966.
Chipeta, J. (2018) ‘A Review of E-government Development in Africa A case of Zambia’, Journal of
e-Government Studies and Best Practices, 2018, pp. 2155–4137. doi: 10.5171/2018.973845.
Choudrie, J. et al. (2017) ‘Implementing E-government in Lagos State: Understanding the impact of
cultural perceptions and working practices’, Government Information Quarterly. Elsevier, 34(4), pp.
646–657. doi: 10.1016/j.giq.2017.11.004.
Choudrie, J., Umeoji, E. and Forson, C. (2012) Diffusion of E-Government in Nigeria : A Qualitative
study of Culture and Gender Diffusion of E-Government in Nigeria : A Qualitative study of Culture and
Gender, University of Hertfordshire Business School Working Paper.
Chugunov, A. V., Kabanov, Y. and Misnikov, Y. (2017) ‘Citizens versus the Government or Citizens
with the Government: a Tale of Two e-Participation Portals in One City - a Case Study of St. Petersburg,
Russia’, ICEGOV ’17 Proceedings of the 10th International Conference on Theory and Practice of
Electronic Governance, pp. 70–77.
© University of South Africa
178 | P a g e
Chuttur, M. (2014) ‘Working Papers on Information Systems Overview of the Technology Acceptance
Model : Origins , Developments and Future Directions’, 9(2009).
Cilliers, J. (2009) ‘Formations and Movements of Christian Spirituality in African Contexts’, University
of Stellenbosch, pp. 1–21.
Collins, B. (2011) ‘Projections of Federal Tax Return Filings: Calendar Years 2011–2018’, (October
2011), pp. 2011–2018.
Compeau, D., Higgins, C. A. and Huff, S. (1999) ‘Social cognitive theory and individual reactions to
computing technology: A longitudinal study.’, MIS quarterly, 23(2), pp. 145–158.
Cronbach (1951) ‘Coefficient alpha and the internal s t r u c t u r e of tests*’, PSYCHOMETRIKA, 16(3),
pp. 297–334.
CSOl (2012) ‘2010 Census of Population and Housing; population Summary Report’, p. 142. Available
at: https://www.zamstats.gov.zm/phocadownload/Zambia Census Projection 2011 -
2035.pdf%0Ahttp://www.zamstats.gov.zm/phocadownload/Zambia Census Projection 2011 -
2035.pdf.
Cyr, D., Bonanni, C. and ilsever, J. (2004) ‘Design and e-loyalty across cultures in electronic
commerce’, Proceedings of the 6th international conference on Electronic commerce - ICEC ’04, p.
351. doi: 10.1145/1052220.1052265.
Daqing, Z. (2010) ‘Chinese E-government systems Adoption: from Institutional theory’, International
Conference on E-Business and E-Government, 3, pp. 622–627. doi: 10.1109/ICEE.2010.164.
Davis, F. D. (1986) ‘A technology acceptance model for empirically testing new end-user information
systems: Theory and results’, Management, Ph.D.(April), p. 291. doi: oclc/56932490.
Davis, F. D. (1993) ‘User acceptance of information technology: system characteristics, user
perceptions and behavioral impacts’, International Journal of ManMachine Studies, pp. 475–487. doi:
10.1006/imms.1993.1022.
Davison, R. M. and Martinsons, M. G. (2016) ‘Context is king! Considering particularism in research
design and reporting’, pp. 250–253. doi: 10.1057/s41265-016-0002-x.
Davison, R. M., Ou, C. X. J. and Martinsons, M. G. (2018) ‘Interpersonal knowledge exchange in
China: The impact of guanxi and social media’, Information and Management. Elsevier, 55(2), pp. 224–
234. doi: 10.1016/j.im.2017.05.008.
© University of South Africa
179 | P a g e
Davison, R. M., Wagner, C. and Ma, L. C. K. (2005) ‘From government to e‐government: a transition
model’, Information Technology & People, 18(3), pp. 280–299. doi: 10.1108/09593840510615888.
Dawes, J. (2008) ‘Do data characteristics change according to the number of scale points used? An
experiment using 5-point, 7-point and 10-point scales’, International Journal of Market Research,
50(1), pp. 61–77. doi: 10.1177/147078530805000106.
Dillon, R. S. (2007) ‘Respect: A philosophical perspective’, Gruppendynamik, 38, pp. 201–212. doi:
10.1007/s11612-007-0016-5.
Distefano, C., Zhu, M. and Mîndrilă, D. (2009) ‘Understanding and Using Factor Scores:
Considerations for the Applied Researcher - Practical Assessment, Research & Evaluation’, Practical
Assessment, Research & Evaluation, 14(20), pp. 1–11. doi: 10.1.1.460.8553.
Durmaz, Y. (2014) ‘The Influence of Cultural Factors on Consumer Buying Behaviour and an
Application in Turkey’, 14(1).
Dwivedi, Y. K. et al. (2017) ‘Re-examining the Unified Theory of Acceptance and Use of Technology
(UTAUT): Towards a Revised Theoretical Model’, Information Systems Frontiers. Information
Systems Frontiers, pp. 1–16. doi: 10.1007/s10796-017-9774-y.
El-Haddadeh, R. (2019) ‘Digital Innovation Dynamics Influence on Organisational Adoption: The Case
of Cloud Computing Services’, Information Systems Frontiers. Information Systems Frontiers. doi:
10.1007/s10796-019-09912-2.
Elaswad, O. and Jensen, C. D. (2016) ‘Introducing E-Government in Developing Countries Analysis of
Egyptian e-Government Services’, in www.IST-Africa.org/Conference2016, pp. 1–13.
Etta, E. E., Esowe, D. D. and Asukwo, O. O. (2016) ‘African communalism and globalization’, African
Research Review, 10(3), p. 302. doi: 10.4314/afrrev.v10i3.20.
Evans, D. and Yen, D. C. (2005) ‘E-government: An analysis for implementation: Framework for
understanding cultural and social impact’, Government Information Quarterly, 22(3), pp. 354–373. doi:
10.1016/j.giq.2005.05.007.
Ezenweke, E. O. and Nwadialor, L. K. (2013) ‘Understanding Human Relations in African Traditional
Religious Context in the Face of Globalization : Nigerian Perspectives’, American International
Journal of Contemporary Research, 3(2), pp. 61–70.
Fath-allah, A. et al. (2014) ‘E-Government Maturity Models: A Comparative Study’, International
Journal of Software Engineering & Applications (IJSEA), May 2014, 5(3), pp. 71–91. doi:
© University of South Africa
180 | P a g e
10.5121/ijsea.2014.5306.
Fisher, J. (2011) ‘The four domains model: Connecting spirituality, health and well-being’, Religions,
2(1), pp. 17–28. doi: 10.3390/rel2010017.
Fountain (2001) Prospects for the Virtual State. Washington DC: Brookings Institutional Press.
Friedkin, N. E. (1993) ‘Structural Bases of Interpersonal Influence in Groups: A Longitudinal Case
Study’, American Sociological Review, 58(6), pp. 861–872. doi: 10.2307/2095955.
Gallivan, M. and Srite, M. (2005) ‘Information technology and culture: Identifying fragmentary and
holistic perspectives of culture’, Information and Organization, 15(4), pp. 295–338. doi:
10.1016/j.infoandorg.2005.02.005.
Ganesh, N., Premkumar, B. and Priya, K. (2019) ‘Theoretical insights on e-government and global
trends in e-governance technologies & applications’, International Journal of Engineering and
Advanced Technology, 8(5), pp. 1843–1850.
Gefen, D., Rigdon, E. E. and Straub, D. (2011) ‘An Update and Extension to SEM Guidelines for
Administrative’, MIS Quarterly, 35(2), pp. iii-A7. doi: 10.1016/j.lrp.2013.01.001.
Ghalandari, K. (2012) ‘The Effect of Performance Expectancy , Effort Expectancy , Social Influence
and Facilitating Conditions on Acceptance of E-Banking Services in Iran : the Moderating Role of Age
and Gender’, 12(6), pp. 801–807. doi: 10.5829/idosi.mejsr.2012.12.6.2536.
Giacalone, R. A. and Jurkiewicz, C. L. (2003) ‘Right from Wrong : The Influence of Spirituality on
Perceptions of Unethical Business Activities’, pp. 85–97.
Gil-garcia, J. R. and Martinez-moyano, I. J. (2007) ‘Understanding the evolution of e-government : The
influence of systems of rules on public sector dynamics ☆’, Government Information Quarterly, 24, pp.
266–290. doi: 10.1016/j.giq.2006.04.005.
Gil-garcía, J. R. and Martinez-moyano, I. J. (2005) ‘“ Exploring E-Government Evolution : The
Influence of Systems of Rules on Organizational Action ”’, NCDG Working Paper No. 05-001, (05).
Gliem, J. A. and Gliem, R. R. (2003) ‘Calculating , Interpreting , and Reporting Cronbach ’ s Alpha
Reliability Coefficient for Likert-Type Scales’, Midwest Research to Practice Conference in Adult,
Continuing, and Community Education, (1992), pp. 82–88.
Greunen, D. van and Yeratziotis, A. (2008) ‘E-Government : living up to the challenge of culture
context’, in Annual Conference of the South African Institute of Computer Scientists and Information
© University of South Africa
181 | P a g e
Technologists on IT Research in Developing Countries, pp. 246–256.
Grim, B. J. et al. (2017) Yearbook of International Religious Demography.
Guiffrida, D. A. et al. (2013) ‘Do Reasons for Attending College Affect Academic Outcomes?: A Test
of a Motivational Model From a Self-Determination Theory Perspective’, Journal of College Student
Development, 54(2), pp. 121–139. doi: 10.1353/csd.2013.0019.
Guk, K. et al. (2019) ‘Evolution of wearable devices with real-time disease monitoring for personalized
healthcare’, Nanomaterials, 9(6), pp. 1–23. doi: 10.3390/nano9060813.
Gumo, S. et al. (2012) ‘Communicating African spirituality through ecology: Challenges and prospects
for the 21st century’, Religions, 3(2), pp. 523–543. doi: 10.3390/rel3020523.
Gupta, G., Udo, G. J., et al. (2015) ‘The Effect of Espoused Culture on Acceptance of Online Tax Filing
Services in an Emerging Economy’, ADVANCES IN BUSINESS RESEARCH, 6, pp. 14–31.
Gupta, G., Syed, Z. K., et al. (2015) ‘The Effect of Espoused Culture on Acceptance of Online Tax
Filing Services in an Emerging Economy’, Advances in Business Research, 6(1), pp. 14–31.
Gupta, Singh and Bhaskar (2016) ‘Citizen adoption of e-government: a literature review and conceptual
framework’, Electronic Government, an International Journal, 12(2). doi: Kriti Priya Gupta Related
information 1Symbiosis Centre for Management Studies (Constituent of Symbiosis International
University), Block A, Plot No. 47 and 48, Sector 62, Noida, 201301 Uttar Pradesh, India , Swati Singh
Related information 2Symbiosis Centre for Management Studies (Constituent of Symbiosis
International University), Block A, Plot No. 47 and 48, Sector 62, Noida, 201301 Uttar Pradesh, India
, Preeti Bhaskar Related information 3Symbiosis Centre for Management Studies (Constituent.
Hair, Black, Babin, A. (2013) Univariate Data Analysis, Exploratory Data Analysis in Business and
Economics. doi: 10.1007/978-3-319-01517-0_3.
Haldenwang, C. von (2004) ‘Electronic Government ( E-Government ) and Development’, The
European Journal of Development Research, 16, pp. 417–432.
Hall, E. T. (1976) ‘Beyond culture’, Contemporary Sociology, p. 298. doi: 10.2307/2064404.
Harris, J. D. et al. (2014) ‘How to write a systematic review’, American Journal of Sports Medicine,
42(11), pp. 2761–2768. doi: 10.1177/0363546513497567.
Heeks (2009) Development Informatics Where Next for ICTs and.
© University of South Africa
182 | P a g e
Heeks, R. (2002) ‘E-Government in Africa: Promise and practice’, Information Polity, 7(2–3), pp. 97–
114. doi: 10.3233/ip-2002-0008.
Heeks, R. and Bailur, S. (2007) ‘Philosophies , Theories , Methods and Practice’, ,Government
Information Quarterly, 24(2), pp. 243-265.
Heidhues, F. and Obare, G. (2011) ‘Lessons from structural adjustment programmes and their effects
in Africa’, Quarterly Journal of International Agriculture, 50(1), pp. 55–64.
Heimdall (2017) Standardisation Activities Report.
Henle, M. and Michael, M. (1956) ‘The Influence of Attitudes on Syllogistic Reasoning’, The Journal
of Social Psychology, 44(1), pp. 115–127. doi: 10.1080/00224545.1956.9921907.
Hofstede, G. (1980) Culture’s consequences, International Studies of Management & Organization.
Beverly Hills, CA,: Sage.
Hofstede, G. (2011) ‘Dimensionalizing Cultures : The Hofstede Model in Context’, Online Readings in
Psychology and Culture, 2(1), pp. 1–26. doi: http://dx.doi.org/10.9707/2307-0919.1014.
Hofstede, G. and Hofstede, G. J. (1980) Culture’s Consequences. Beverly Hills, CA,: Sage.
Hofstede, G. and Hofstede, G. J. (2005) Cultures and organizations: software of the mind, revised and
expanded (2nd ed.). New York: McGraw-Hill. doi: 10.1057/jibs.1992.23.
Hoogen, T. van den (2014) ‘Spirituality in the perspective of foundational theology’, HTS Teologiese
Studies/Theological Studies, pp. 1–6. doi: 10.4102/hts.v70i1.2085.
Hook, F. (2016) ‘Zambia Final Report 4th February 2015 v 9FH’.
Hooper, D., Coughlan, J. and Mullen, M. (2008) ‘Structural Equation Modelling : Guidelines for
Determining Model Fit Structural equation modelling : guidelines for determining model fit’, Electronic
Journal of Business Research Methods, 6(1), pp. 53–60.
Hovland, C., Niederriter, J. and Thoman, J. (2018) ‘Spirituality and Interprofessional Healthcare
Education: An Exploratory Study’, Journal of Christian nursing : a quarterly publication of Nurses
Christian Fellowship, 35(4), pp. E47–E52. doi: 10.1097/CNJ.0000000000000543.
Hu, W. and Khanam, L. (2016) ‘The Influence of Cultural Dimensions and Website Quality on m-
banking Services Adoption in Bangladesh : Applying the UTAUT2 Model Using PLS’, in WHICEB
2016 Proceedings, pp. 428–440.
© University of South Africa
183 | P a g e
Iacobucci, D. (2010) ‘Structural equations modeling: Fit Indices, sample size, and advanced topics’,
Journal of Consumer Psychology, 20(1), pp. 90–98. doi: 10.1016/j.jcps.2009.09.003.
Idang, G. E. (2015) ‘African culture and values’, 16(2), pp. 97–111.
International Trade Centre (2019) Promoting SME competitiveness in Zambia. Available at:
http://www.intracen.org/publication/SME-Competitiveness-Zambia/.
Irawati, I. R. A. and Munajat, E. (2018) ‘ELECTRONIC GOVERNMENT ASSESSMENT IN WEST
JAVA PROVINCE , INDONESIA’, Journal of Theoretical and Applied Information Technology,
96(2).
Ismail, A. (2008) ‘Citizens ’ Readiness for E-government in Developing Countries’.
Jackson, S. (2011) ‘Organizational culture and information systems adoption: A three-perspective
approach’, Information and Organization. Elsevier Ltd, 21(2), pp. 57–83. doi:
10.1016/j.infoandorg.2011.03.003.
Jackson, S. and Wong, M. S. (2017) ‘A cultural theory analysis of e-government: Insights from a local
government council in Malaysia’, Information Systems Frontiers. Information Systems Frontiers, 19(6),
pp. 1391–1405. doi: 10.1007/s10796-016-9652-z.
Janowski, T. (2015) ‘Digital government evolution: From transformation to contextualization’,
Government Information Quarterly, 32(3), pp. 221–236. doi: 10.1016/j.giq.2015.07.001.
Johnson, B. A. (2013) ‘The SOJOURNER’, (May).
Jung, S. (2013) Acculturation and Psychological Distress among First Generation Asian Americans:
The Roles of Acculturative Stress and Social-cultural Resources.
Kadar, J. L. et al. (2015) ‘Religion and spirituality: Unfuzzying the fuzzy’, Journal for the Scientific
Study of Religion, 36(4), pp. 549–564.
Kamal, M. and Qureshi, S. (2009) ‘An Approach to IT Adoption in Micro-enterprises : Insights into
Development’, MWAIS 2009 Proceedings, 36., 5. Available at: http://aisel.aisnet.org/mwais2009/36.
Kanu, M. A. (2010) ‘THE INDISPENSABILITY OF THE BASIC SOCIAL VALUES IN AFRICAN
TRADITION : A PHILOSOPHICAL’.
Kaplan, B. and Duchon, D. (1988) ‘Combining Qualitative and Quantitative Methods in lnformation
Systems’, 12(4), pp. 571–586.
© University of South Africa
184 | P a g e
Khalil (2011) ‘e-Government readiness: Does national culture matter?’, Government Information
Quarterly, 28(3), pp. 388–399. doi: https://doi.org/10.1016/j.giq.2010.06.011.
Khalil, I. (2012) Influence of Culture on e-Government Acceptance in Saudi Arabia, Phd Thesis -
http://arxiv.org/abs/1307.7141.
Khalil, I. and Nadi, A. (2012) ‘Influence of Culture on e-Government Acceptance in Saudi Arabia’,
(June).
Khamis and VanderWeide (2017) ‘Conceptual Diagram Development for Sustainable e‑Government
Implementation’, Electronic Journal of e-Government, 15(1), pp. 33–43.
Kitchenham, B. and Charters, S. (2007) Guidelines for performing Systematic Literature Reviews in
Software Engineering Executive summary.
Klievink, B. and Janssen, M. (2009) ‘Realizing joined-up government - Dynamic capabilities and stage
models for transformation’, Government Information Quarterly. Elsevier Inc., 26(2), pp. 275–284. doi:
10.1016/j.giq.2008.12.007.
Kline, R. B. (2015) Principles and Practice of Structural Equation Modeling, Fourth Edition. New
York: The Guilford Press. Available at: http://psychology.concordia.ca/fac/kline/books/nta.pdf.
Knox, C. and Janenova, S. (2019) ‘The e-government paradox in post-Soviet countries’, International
Journal of Public Sector Management, 32(6), pp. 600-615.
Kumar, R. and Sachan, A. (2017) ‘Empirical Study to Find Factors Influencing e-Filing Adoption in
India’, in Proceedings of the Special Collection on eGovernment Innovations in India. ACM, pp. 52–
57.
Kumar, S. (2017) ‘A STUDY ON INCOME TAX PAYERS PERCEPTION TOWARDS
ELECTRONIC FILING’, Special Issue Published in International Journal of Trend in Research and
Development (IJTRD), India, 22(2394–9333).
Kumar, V. et al. (2007) ‘Factors for Successful e-Government Adoption : a Conceptual Framework’,
The Electronic Journal of e- Government, 5(1), pp. 63–76.
Kupe, T. and Okello, D. (2012) ‘Perspective on a decade of e-government in Africa : editorial’, African
Journal of Information and Communication, 7205(12), pp. v–vi. Available at:
http://www.wits.ac.za/linkcentre/ajic/17669/the_african_journal_of_information_amp;_communicatio
n.html.
© University of South Africa
185 | P a g e
Kvasny, L. and Lee, R. (2011) ‘e-Government services for faith-based organizations : Bridging the
organizational divide’, Government Information Quarterly. Elsevier Inc., 28(1), pp. 66–73, P.71. doi:
10.1016/j.giq.2010.03.006.
Layne, K. and Lee, J. (2001) ‘Developing fully functional E- government: A four stage model’,
Government Information Quarterly, 18(2), pp. 122–136.
Lee, S. G., Trimi, S. and Kim, C. (2013) ‘The impact of cultural differences on technology adoption’,
Journal of World Business. Elsevier Inc., 48(1), pp. 20–29. doi: 10.1016/j.jwb.2012.06.003.
Leung, K. et al. (2005) ‘Culture and international business: Recent advances and their implications for
future research’, Journal of International Business Studies, 36(4), pp. 357–378. doi:
10.1057/palgrave.jibs.8400150.
Leung, T. K. P. (2001) ‘The ethics and positioning of gu a nx i in China’, pp. 55–64.
Li, F., Qi, Z. Y. and Ma, T. (2007) ‘Effect of administrative culture on performance of E-government’,
2007 International Conference on Wireless Communications, Networking and Mobile Computing,
WiCOM 2007, pp. 3564–3567. doi: 10.1109/WICOM.2007.883.
Likert, R. (1932) ‘Technique for the Measurement of Attitudes’, Archives of Psychology, 22(140), pp.
5–55. doi: 10.4135/9781412961288.n454.
Liu, W. et al. (2017) ‘Social Network Theory’, The International Encyclopedia of Media Effects,
(September), pp. 1–12. doi: 10.1002/9781118783764.wbieme0092.
Liu, Y. et al. (2007) ‘Amount of Chinese Provincial Government Portals’, IEEE Journal, 5, pp. 3771–
3774.
Livote, E. (2009) ‘Introduction to Structural Equation Modeling Using SPSS and AMOS. Niels J.
Blunch. Thousand Oaks, CA: Sage, 2008, 270 pages, $39.95.’, Structural Equation Modeling: A
Multidisciplinary Journal, 16(3), pp. 556–560. doi: 10.1080/10705510903008345.
Lopes, N. V. (2017) ‘Smart Governance Tutorial’, in ICEDEG 2018: 5th International Conference on
e-Democracy & e-Government.
M’Baye, B. and Ikuenobe, P. (2007) ‘Philosophical Perspectives on Communalism and Morality in
African Traditions’, African American Review, 41(4), p. 807. doi: 10.2307/25426992.
Madden, T. J., Ellen, P. S. and Ajzen, I. (1992) ‘A Comparison of the Theory of Planned Behavior and
the Theory of Reasoned Action’, Personality and Social Psychology Bulletin, 18(1), pp. 3–9. doi:
© University of South Africa
186 | P a g e
10.1177/0146167292181001.
Mamta, B. (2012) ‘Tax Payers’ Perception towards E-File Adoption: An Empirical Investigation’,
Journal of management and research, 5, pp. 1–16.
Massaro, A. et al. (2019) ‘Business Intelligence Improved by Data Mining Algorithms and Big Data
Systems: An Overview of Different Tools Applied in Industrial Research’, Computer Science and
Information Technology, 7(1), pp. 1–21. doi: 10.13189/csit.2019.070101.
Maumbe, B., Owei, V. and Alexander, H. (2008) ‘Questioning the pace and pathway of e-government
development in Africa: A case study of South Africa’s Cape Gateway project’, Government Information
Quarterly, 25(4), pp. 757–777. doi: 10.1016/j.giq.2007.08.007.
Mawela, T., Ochara, N. M. and Twinomurinzi, H. (2017) ‘E-government implementation: A reflection
on South African municipalities’, South African Computer Journal, 29(1), pp. 147–171. doi:
10.18489/sacj.v29i1.444.
Mbiti, J. (1969) ‘African Religions and Philosophy’, Concepts of God in Africa, London: Heinemann,.
Mboup, G. and Oyelaran-Oyeyinka, B. (2019) ‘Relevance of Smart Economy in Smart Cities in
Africa.’, in Smart Economy in Smart African Cities, Springer, Singapore., pp. 1–49.
Mensah, I. K., Mi, J. and Feng, C. (2017) ‘Determinants of E-Government Services Adoption from the
African Students ’ Perspective’, 11(10), pp. 2282–2285.
Mesquita, A. C. et al. (2018) ‘An Analytical Overview of Spirituality in NANDA-I Taxonomies’,
International Journal of Nursing Knowledge. Wiley-Blackwell Publishing, 29(3), pp. 200–205. doi:
10.1111/2047-3095.12172.
Mingqiang, Z. Y. Q. (2010) ‘The Analysis of Executive Ability Culture Construction in E-government
Zhu Mingqiang School of Civil Engineering and Architecture You Qiyong School of Civil Engineering
and Architecture B . Low Public Service Socialization Degree , Socialize A . Several R’, International
Conference on Networking and Digital Society, 6, pp. 451–454.
Mishra, S. K. and Varma, A. (2019) Spirituality in Management: Insights from India. India.
Misra, D. (2008) ‘Ten Guiding Principles for E-government’, United Nations publication, 2004(i), pp.
1–6. Available at: http://unpan1.un.org/intradoc/groups/public/documents/unpan/unpan031952.pdf.
Mkandawire, S. B. and Daka, H. (2018) ‘Cultural Preservation Literacy in Zambia: A Case Study of
the Lala People of Serenje District’, Multidisciplinary Journal of Language and Social Sciences
© University of South Africa
187 | P a g e
Education, 1(1).
Mkude, C. and Wimmer, M. (2013) ‘Strategic Framework for Designing E-Government in Developing
Countries’, International Conference on Electronic Government (EGOV), (12), pp. 148–162.
Mohamadi, M. and Ranjbaran, T. (2013) ‘Effective Factors on the Success or Failure ofthe Online
Payment Systems, Focusing on Human Factors’, in 7th International Conference on e-Commerce in
Developing Countries with focus on e-Security.
Moussaıd, M. et al. (2013) ‘Social Influence and the Collective Dynamics of Opinion Formation’, PLOS
ONE | www.plosone.org, 8(11). doi: 10.1371/journal.pone.0078433.
Mtebe, J. S. and Roope, R. (2014) ‘Investigating students’ behavioural intention to adopt and use mobile
learning in higher education in East Africa’, International Journal of Education and Development using
Information and Communication Technology, 10(3), pp. 4–20.
Mustapha, B., Normala, S. and Sheikh, B. (2015) ‘Tax Service Quality : The Mediating Effect of
Perceived Ease of Use of the Online Tax System’, Procedia - Social and Behavioral Sciences. Elsevier
B.V., 172, pp. 2–9. doi: 10.1016/j.sbspro.2015.01.328.
Mzyece, M. (2012a) ‘A Critical Analysis of e-Government in Zambia’, The African Journal of
Information and Communication, (12), pp. 110–127.
Mzyece, M. (2012b) ‘A CRITICAL ANALYSIS OF e GOVERNMENT IN ZAMBIA’, The African
Journal of Information and Communication, (12), pp. 110–127.
Nadi (2012a) Influence of Culture on e-Government Acceptance in Saudi Arabia, Phd Thesis -
http://arxiv.org/abs/1307.7141. Available at: http://arxiv.org/abs/1307.7141.
Nadi (2012b) Influence of Culture on e-Government Acceptance in Saudi Arabia, arXiv preprint
arXiv:1307.7141.
Nahardani, S. Z. et al. (2019) ‘Spirituality in medical education: a concept analysis’, Medicine, Health
Care and Philosophy. Springer Netherlands, 22(2), pp. 179–189. doi: 10.1007/s11019-018-9867-5.
Namafe, C. (2006) Envoronmental Education in Zambia: A Critical Approach to Change and
Transformation.
Narayan, A. (2014) ‘Universal Access to Broadband – Trends and Practices’, in Broadband
Development and Innovation using Internet. International Telecommunication Union, pp. 1–44.
© University of South Africa
188 | P a g e
Navarrete, C. (2010) ‘Trust in e-government transactional services: A study of citizens’ perceptions in
Mexico and the U.S’, Proceedings of the Annual Hawaii International Conference on System Sciences,
pp. 1–10. doi: 10.1109/HICSS.2010.487.
Newsom (2018) ‘Testing Mediation with Regression Analysis Mediation’, Psy, Structural(Spring), pp.
523–623.
Nguyen, N. A. (2016) ‘A Cross-Cultural Study on e-Government Services Delivery’, Electronic
Journal Information Systems Evaluation, 19(2), pp. 121–134.
Nhekairo, W. M. (2014) “ THE TAXATION SYSTEM IN ZAMBIA ” FINAL REPORT, JCTR.
Night, S. and Bananuka, J. (2019) ‘The mediating role of adoption of an electronic tax system in the
relationship between attitude towards electronic tax system and tax compliance’, Journal of Economics,
Finance and Administrative Science, 25(49), pp. 73–88. doi: 10.1108/JEFAS-07-2018-0066.
Nuwagaba, A. (2015) ‘Enterprises (SMEs) in Zambia’, International Journal of Economics, Finance
and Management, 4(4), pp. 146–153. Available at: http://www.ejournalofscience.org.
O’Reilly, T. (2010) ‘Government as a Platform’, Innovations: Technology, Governance, Globalization,
6(1).
Odongo, A. O. and Rono, G. C. (2016) ‘Kenya Digital and Cultural Divide’, in Proceedings of the 9th
International Conference on Theory and Practice of Electronic Governance - ICEGOV ’15-16, pp. 85–
94. doi: 10.1145/2910019.2910077.
Olaniyi, E. (2019) Digital Government: ICT and Public Sector Management in Africa, Munich Personal
RePEc Archive, MPRA Paper No. 91628,.
Oliveira, T. and Martins, M. (2011) ‘Literature Review of Information Technology Adoption Models
at Firm Level.’, Electronic Journal of Information …, 14(1), pp. 110–121. Available at:
http://search.ebscohost.com/login.aspx?direct=true&profile=ehost&scope=site&authtype=crawler&jr
nl=15666379&AN=65267826&h=+3mBLgsH44TuP+Md6aBOWR03issM0HLuIC10e2bYsd573AC
XyFRydASKNeJIVclRbeOPZqZtJv6cXzNTjE4tdA==&crl=c.
Oliver, O. ozoemena, Ezebui, H. C. and Ojiakor, C. C. T. (2016) ‘THE PLACE OF THE INDIVIDUAL
IN THE TRADITIONAL AFRICAN SOCIETY : A’, International Journal of Social Sciences and
Humanities Reviews, 6(3), pp. 225 – 229.
Oman, D. (2013) ‘Defining religion and spirituality.’, Handbook of the psychology of religion and
spirituality (2nd ed.)., pp. 23–47. doi: 10.1017/CBO9781107415324.004.
© University of South Africa
189 | P a g e
Omobola, O. C. (2013) ‘An Overview of Taboo and Superstition among the Yoruba of Southwest of
Nigeria’, 4(2), pp. 221–226. doi: 10.5901/mjss.2013.v4n2p221.
Otieno, O. C. et al. (2016) ‘Theory of Reasoned Action as an Underpinning to Technological Innovation
Adoption Studies’, 4(1), pp. 1–7. doi: 10.13189/wjcat.2016.040101.
Otto, F. et al. (2015) ‘Tax Avoidance, Tax Evasion and Tax Havens’, Arbeiterkammer, (May).
Available at: https://media.arbeiterkammer.at/wien/PDF/studien/Studie_tax_avoidance.pdf.
Patra, M. R. and Das, R. K. (2014) ‘Accessibility of e-Governance in Rural India: A Critical View
Point’, Proceedings of the 8th International Conference on Theory and Practice of Electronic
Governance. ACM, pp. 375–378. doi: 10.1145/2691195.2691218.
Pearl, J. (2001) ‘Direct and Indirect E ects 1 INTRODUCTION 2 CONCEPTUAL ANALYSIS’,
Policy.
Penoni, I. (2018) ‘CILENDE : THE MASK DANCE AT THE LUVALE CULTURE FESTIVAL’,
Masls, Saints and Fetishes (Africa-America), 3(1), pp. 218–257.
Peterson, R. A. (1994) ‘A Meta-Analysis of Cronbach’s Coefficient Alpha’, Journal of Consumer
Research, 21(2), p. 381. doi: 10.1086/209405.
Podsakoff, P. M. et al. (2003) ‘Common Method Biases in Behavioral Research: A Critical Review of
the Literature and Recommended Remedies’, Journal of Applied Psychology, 88(5), pp. 879–903. doi:
10.1037/0021-9010.88.5.879.
Podsakoff, P. M., MacKenzie, S. B. and Podsakoff, N. P. (2012) ‘Sources of method bias in social
science research and recommendations on how to control it’, Annual Review of Psychology, 63, pp.
539–569. doi: 10.1146/annurev-psych-120710-100452.
Principe, W. (1983) ‘Toward defining spirituality’, Studies in Religion/Sciences Religieuses, 12(2), pp.
127–141. doi: 10.1177/000842988301200201.
Puchalski, C. M. (2001) ‘The role of spirituality in health care’, Baylor University Medical Center,
14(4), pp. 352–357.
Qureshi, S. (2013) ‘Information and Communication Technologies in the Midst of Global Change: How
do we Know When Development Takes Place?’, Information Technology for Development. Routledge,
19(3), pp. 189–192. doi: 10.1080/02681102.2013.818827.
Reiff, J.-M. and Humbert, J.-P. (2019) STANDARDS ANALYSIS, SMART SECURE ICT. Version 2.
© University of South Africa
190 | P a g e
LUXEMBOURG: ILNAS.
Revilla, M. A., Saris, W. E. and Krosnick, J. A. (2014) ‘Choosing the Number of Categories in Agree-
Disagree Scales’, Sociological Methods and Research, 43(1), pp. 73–97. doi:
10.1177/0049124113509605.
Ripamonti, L. A. (2008) ‘MUVEs : a new opportunity to bridge ( global ) digital divide ?’, (January).
Rogers and Ashforth, B. E. (2017) ‘Respect in Organizations: Feeling Valued as “We” and “Me”’,
Journal of Management, 43(5), pp. 1578–1608. doi: 10.1177/0149206314557159.
Rogers, E. M. (1995) Diffusion of Innovations, Elements of Diffusion. doi: citeulike-article-id:126680.
Rogers, E. M. (2002) ‘Diffusion of preventive innovations’, Addictive Behaviors, 27(6), pp. 989–993.
doi: 10.1016/S0306-4603(02)00300-3.
Rorissa, A. and Demissie, D. (2010) ‘An analysis of African e-Government service websites ☆’,
Government Information Quarterly. Elsevier B.V., 27(2), pp. 161–169. doi: 10.1016/j.giq.2009.12.003.
sahoo, A. K. (2012) ‘E-governance : Initiatives and Implementations – A case study on Rayagada, a
Tribal District of Odisha’, Paripex - Indian Journal Of Research, 3(4), pp. 132–133. doi:
10.15373/22501991/apr2014/44.
Samaradiwakara, G. D. M. N. and Gunawardena, C. G. (2014) ‘Comparison of Existing Technology
Acceptance Theories and Models to Suggest a Well Improved Theory / Model’, International Technical
Sciences Journal, 1(1), pp. 21–36.
Samboma, T. A. (2019) ‘e-Government, A tool for service delivery in Botswana’s local authorities?’,
Global Journal of Human Social Science, 19(1). Available at:
https://socialscienceresearch.org/index.php/GJHSS.
Sandoval-Almazán, R. and Gil-Garcia, J. R. (2008) ‘Limitations of Evolutionary Approaches to E-
Government’, Handbook of Research on Public Information Technology, pp. 22–30. doi: 10.4018/978-
1-59904-857-4.ch003.
Saunders, M. and Tosey, P. (2012) ‘The layers of research design’, Rapport, 2012/2013(Winter), pp.
58–59. doi: 08 jun 2015.
Schaupp, L. C. and Hobbs, J. (2009) ‘E-File Adoption : A Study of U . S . Taxpayers � Intentions’,
Proceedings of the 42nd Hawaii International Conference on System Science, pp. 1–10.
© University of South Africa
191 | P a g e
Schein, E. (1984) ‘Comming to a new awareness of Organisational Culture’, Sloan Management
Review, 2, pp. 1–14.
Schermelleh-Engel, K. and Müller, H. (2003) ‘Evaluating the fit of structural equation models: Tests of
significance and descriptive goodness-of-fit measures’, Methods of Psychological Research, 8(2), pp.
28–74. Available at: http://www.cob.unt.edu/slides/Paswan../BUSI6280/Y-Muller_Erfurt_2003.pdf.
Schoeman, W. J. (2017) ‘South African religious demography: The 2013 General Household Survey’,
HTS Teologiese Studies / Theological Studies, 73(2), pp. 1–7. doi: 10.4102/hts.v73i2.3837.
Scholl, H. J. and Scholl, M. C. (2014) ‘Smart Governance : A Roadmap for Research and Practice’, in
iConference 2014, pp. 164–176. doi: 10.9776/14060.
Schumacker and Lomax (2004) A Beginner’s Guide to Structural Equation Modeling, Technometrics.
doi: 10.1198/tech.2005.s328.
Schuppan, T. (2009) ‘E-Government in developing countries: Experiences from sub-Saharan Africa’,
Government Information Quarterly. Elsevier Inc., 26(1), pp. 118–127. doi: 10.1016/j.giq.2008.01.006.
Sehli, H., Cooper, V. and Sarkar, P. (2016) ‘the Role of Culture in Developing the E- Government
Absorptive Capacity of Agencies in Saudi Arabia : a Conceptual Model’, Pacific Asia Conference on
Information System, (January).
Sein, M. K. et al. (2018) ‘A holistic perspective on the theoretical foundations for ICT4D research’,
Information Technology for Development. Routledge, pp. 1–19. doi: 10.1080/02681102.2018.1503589.
Shahkooh, K. A., Saghafi, F. and Abdollahi, A. (2008) ‘A proposed model for e-Government maturity’,
in Information and Communication Technologies: From Theory to Applications, 2008. ICTTA 2008.
3rd International Conference on, pp. 1–5. Available at: internal-pdf://196.11.173.252/Shahkooh_A
proposed model for eGov maturity.html.
Shemi, A. P. (2012) ‘Factors Affecting E-commerce Adoption in Small and Medium Enterprises : An
Interpretive Study of Botswana’, University of Salford, (December), pp. 124–256. doi: 255.
Simbao, R. (2014) ‘Cosmological Efficacy and the Politics of Sacred Place: Soli Rainmaking in
Contemporary Zambia’, African Arts, 47(3), pp. 40–57. doi: 10.1162/AFAR_a_00163.
Singh, R. (2016) ‘Small Enterprises Development’, Global Encyclopedia of Public Administration,
Public Policy, and Governance, pp. 1–6. doi: 10.1007/978-3-319-31816-5_2762-1.
Slack, F. and Walton, J. (2008) ‘Organizational Culture and Stakeholder Power : A Case Study of
© University of South Africa
192 | P a g e
Postgraduate Initiatives in e-Government’, in Proceedings of ICEGOV2008, December 1-4, 2008,
Cairo, Egypt, pp. 331–336. doi: 10.1145/1509096.1509165.
Straub, D. W. (1989) ‘Validating Instruments in MIS Research’, MIS Quarterly, 13(2), pp. 147–169.
Surendran, P. (2012) ‘Technology Acceptance Model : A Survey of Literature’, International Journal
of Business and Social Research, 2(4), pp. 175–178.
Swart, M. (2017) ‘Spirituality and healthcare’, Healthcare ethics for healthcare practitioners. doi:
10.18820/9781920382995.
Syed, Z., Henderson, K. R. and Gupta, G. (2017) ‘The moderating effect of culture on e-filing taxes:
evidence from India’, Journal of Accounting in Emerging Economies, 7(1), pp. 134–152. doi:
10.1108/JAEE-05-2015-0038.
Szalma, J. L. (2014) ‘On the Application of Motivation Theory to Human Factors/Ergonomics:
Motivational Design Principles for Human-Technology Interaction’, Human Factors: The Journal of
the Human Factors and Ergonomics Society, 56(8), pp. 1453–1471. doi: 10.1177/0018720814553471.
Tabachnick & Fidell (2001) Using Multivariate statistics.
Táíwò, O. (2016) ‘Against African Communalism’, Journal of French and Francophone Philosophy,
24(1), pp. 81–100. doi: 10.5195/jffp.2016.759.
Takavarasha, S. et al. (2012) ‘The influence of culture on e-Ieadership in developing countries ’:, IEEE
Journal, pp. 1–15.
Tanyi, R. A. (2002) ‘Towards clarification of the meaning of spirituality’, Journal of Advanced Nursing,
39(5), pp. 500–509.
Tarhini, A. et al. (2016) ‘Extending the UTAUT model to understand the customers ’ acceptance and
use of internet banking in Lebanon A structural equation modeling approach’, Information Technology
& People, (ISBN: 0959-3845), pp. 830–849.
Taylor, S. and Todd, P. A. (1995) ‘Understanding information technology usage: A test of competing
models’, Information Systems Research, pp. 144–176. doi: 10.1287/isre.6.2.144.
Tchombe (1995) Handbook of African Educational Theories and Practices A Generative Teacher
Education Curriculum.
Treiblmaier, H., Pinterits, A. and Floh, A. (2004) ‘Antecedents of the Adoption of E-Payment Services
© University of South Africa
193 | P a g e
in the Public Sector’, International Conference on Information Systems, (January 2004), pp. 65–75.
Ul Hadia, N., Abdullah, N. and Sentosa, I. (2016) ‘An Easy Approach to Exploratory Factor Analysis:
Marketing Perspective’, Journal of Educational and Social Research, 6(1), pp. 215–223. doi:
10.5901/jesr.2016.v6n1p215.
Uluman, M. and Doğan, C. D. (2016) ‘Pages: 143-151 To Cite This Article: Müge Uluman and C. Deha
Doğan., Comparison of Factor Score Computation Methods In Factor Analysis’, Australian Journal of
Basic and Applied Sciences, 10(18), pp. 143–151. Available at:
http://creativecommons.org/licenses/by/4.0/.
UN-OHRLLS, I. (2018) Achieving universal and affordable Internet in the least developed countries.
UNDESA (2016) United Nations E-government survey 2016, UN Department of Economic and Social
Affairs, New York, NY. New York. doi: 10.1016/S1369-7021(02)00629-6.
UNDESA (2018) E-GOVERNMENT SURVEY 2018, UNDESA. New York.
UNESCO (2010) ‘Convention on the protection and promotion of the diversity of cultural expressions
(2005)’, The Impact of Uniform Laws on the Protection of Cultural Heritage and the Preservation of
Cultural Heritage in the 21st Century, pp. 96–107. doi: 10.1163/ej.9789004180444.I-786.6.
United States Department of State (2011) International Religious Freedom Report for 2011.
United States Department of State (2016) Zambia 2016 International Religious Freedom Report.
Available at: https://www.state.gov/documents/organization/269174.pdf.
Venkatesh , Morris , Davis, D. (2003) ‘User acceptance of information technology: Toward a unified
view’, MIS Quarterly, 27(3), pp. 425–478. doi: 10.2307/30036540.
Venkatesh, V. et al. (2003) ‘User Acceptance of Information Technology: Toward a Unified View’,
Source: MIS Quarterly, 27(3), pp. 425–478. doi: 10.2307/30036540.
Viswanath, B. (2016) ‘A Descriptive Study on E-Governance’, International Journal of Computational
Science and Information Technology, 4(1), pp. 67–74. doi: 10.5121/ijcsity.2016.4107.
Viswanathan, M. and Kayande, U. (2012) ‘Commentary on “ Common Method Bias in Marketing:
Causes, Mechanisms, and Procedural Remedies”’, Journal of Retailing, 88(4), pp. 556–562. doi:
10.1016/j.jretai.2012.10.002.
Wachira, K. (2014) ‘Adoption of E-Business by Small and Medium Enterprises in Kenya: Barriers and
© University of South Africa
194 | P a g e
Facilitators’, International Journal of Academic Research in Business and Social Sciences, 4(11), pp.
177–187. doi: 10.6007/IJARBSS/v4-i11/1293.
Walsh, A. et al. (2018) ‘The role of the traditional leader in implementing maternal, newborn and child
health policy in Malawi’, Health Policy and Planning, (August), pp. 1–9. doi: 10.1093/heapol/czy059.
Walsham, G. (2017) ‘ICT4D research: reflections on history and future agenda’, Information
Technology for Development. Taylor & Francis, 23(1), pp. 18–41. doi:
10.1080/02681102.2016.1246406.
Wang, X., French, B. F. and Clay, P. F. (2017) ‘Convergent and Discriminant Validity with Formative
Measurement: A Mediator Perspective’, Journal of Modern Applied Statistical Methods, 14(1), pp. 83–
106. doi: 10.22237/jmasm/1430453400.
Weerakkody, V. et al. (2007) ‘E-government implementation in Zambia: contributing factors’,
Electronic Government, an International Journal, 4(4), pp. 484–508.
Weerakkody, V., Dwivedi, Y. K. and Kurunananda, A. (2009) ‘Implementing e-government in Sri
Lanka: Lessons from the UK’, Information Technology for Development, 15(3), pp. 171–192.
Williams, C. B., Gulati, G. J. ‘Jeff’ and Yates, D. J. (2013) ‘Predictors of On-line Services and e-
Participation: A Cross-national Comparison’, Proceedings of the 14th Annual International Conference
on Digital Government Research, pp. 190–197. Available at:
http://doi.acm.org/10.1145/2479724.2479752.
Wilson, D. (2017) ‘Maintaining “Respect for Spirituality” in a Secular Work Environment: A
Biographical Account of the Career-Life Journey of a Black Female Practitioner of Declared Faith’,
Nandram S., Bindlish P. (eds) Managing VUCA Through Integrative Self-Management. Management
for Professionals. Springer, Cham.
Wolf, E. J. et al. (2013) ‘Sample Size Requirements for Structural Equation Models: An Evaluation of
Power, Bias, and Solution Propriety’, Educational and Psychological Measurement, 73(6), pp. 913–
934. doi: 10.1177/0013164413495237.
Wolf, E. J. et al. (2015) ‘Sample Size Requirements for Structural Equation Models: An Evaluation of
Power, Bias, and Solution Propriety’, National Institutes of Health, 76(6), pp. 913–934. doi:
10.1177/0013164413495237.Sample.
Wood, R. and Bandura, A. (1989) ‘Social Cognitive Theory of Organizational Management’, Academy
of Management Review, pp. 361–384. doi: 10.5465/AMR.1989.4279067.
© University of South Africa
195 | P a g e
Woosley, J. M. (2011) ‘Comparison of Contemporary Technology Acceptance Models and Evaluation
of the Best Fit for Health Industry Organizations .’, International Journal of Computer Science
Engineering and Technology, 1(11), pp. 709–717.
Xia, S. (2017) ‘E-Governance and Political Modernization: An Empirical Study Based on Asia from
2003 to 2014’, Administrative Sciences, 7(3), p. 25. doi: 10.3390/admsci7030025.
Xiang, Z. F. et al. (2010) ‘Positive influence of traditional culture and socioeconomic activity on
conservation: a case study from the black-and-white snub-nosed monkey (Rhinopithecus bieti) in
Tibet.’, Dong wu xue yan jiu = Zoological research / ‘Dong wu xue yan jiu’ bian ji wei yuan hui bian
ji, 31(6), pp. 645–650. doi: 10.3724/SP.J.1141.2010.
Yavwa, Y. and Twinomurinzi, H. (2018) ‘Impact of culture on e-government adoption using UTAUT :
a case of Zambia.’, in 2018 International Conference on eDemocracy & eGovernment (ICEDEG), IEEE
Xplore, pp. 356–360.
YEZI Consulting (2013) Political governance study in Zambia. Available at:
http://www.diakonia.se/globalassets/documents/diakonia/where-we-work/africa/1303_zambia-
diakonia-political-governance-study.pdf.
ZambianGovernment (2009a) ‘Electronic Communications and Transactions Act number 21 of 2009’,
pp. 219–292.
ZambianGovernment (2009b) ‘Information and Communication Technologies Act number 15 of 2009’,
p. 53. doi: 76.
Zhao, Shen, K. N. and Collier, A. (2014) ‘Effects of national culture on e-government diffusion - A
global study of 55 countries’, Information and Management. Elsevier B.V., 51(8), pp. 1005–1016. doi:
10.1016/j.im.2014.06.004.
Zheng, Y. et al. (2018) ‘Conceptualizing development in information and communication technology
for development (ICT4D)’, Information Technology for Development. Routledge, 24(1), pp. 1–14. doi:
10.1080/02681102.2017.1396020.
ZICTA (2015) ‘ICT SURVEY REPORT - HOUSEHOLDS AND INDIVIDUALS’.
ZICTA (2018) ‘2018 National Survey on Access and Usage of ICTs by Households and Individuals
was. A Demand Side Assessment of Access and Usage of ICTs in Zambia’, pp. 1–33.
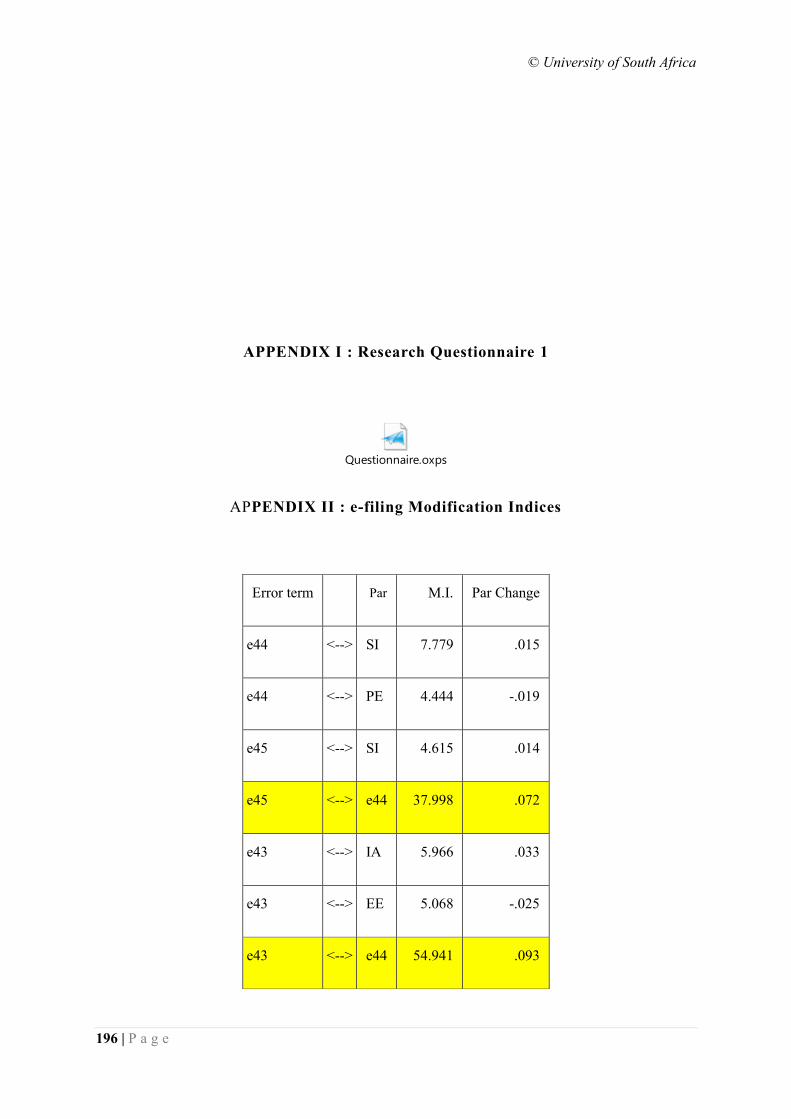
© University of South Africa
196 | P a g e
APPENDIX I : Research Questionnaire 1
Questionnaire.oxps
APPENDIX II : e-filing Modification Indices
Error term Par M.I. Par Change
e44 <--> SI 7.779 .015
e44 <--> PE 4.444 -.019
e45 <--> SI 4.615 .014
e45 <--> e44 37.998 .072
e43 <--> IA 5.966 .033
e43 <--> EE 5.068 -.025
e43 <--> e44 54.941 .093
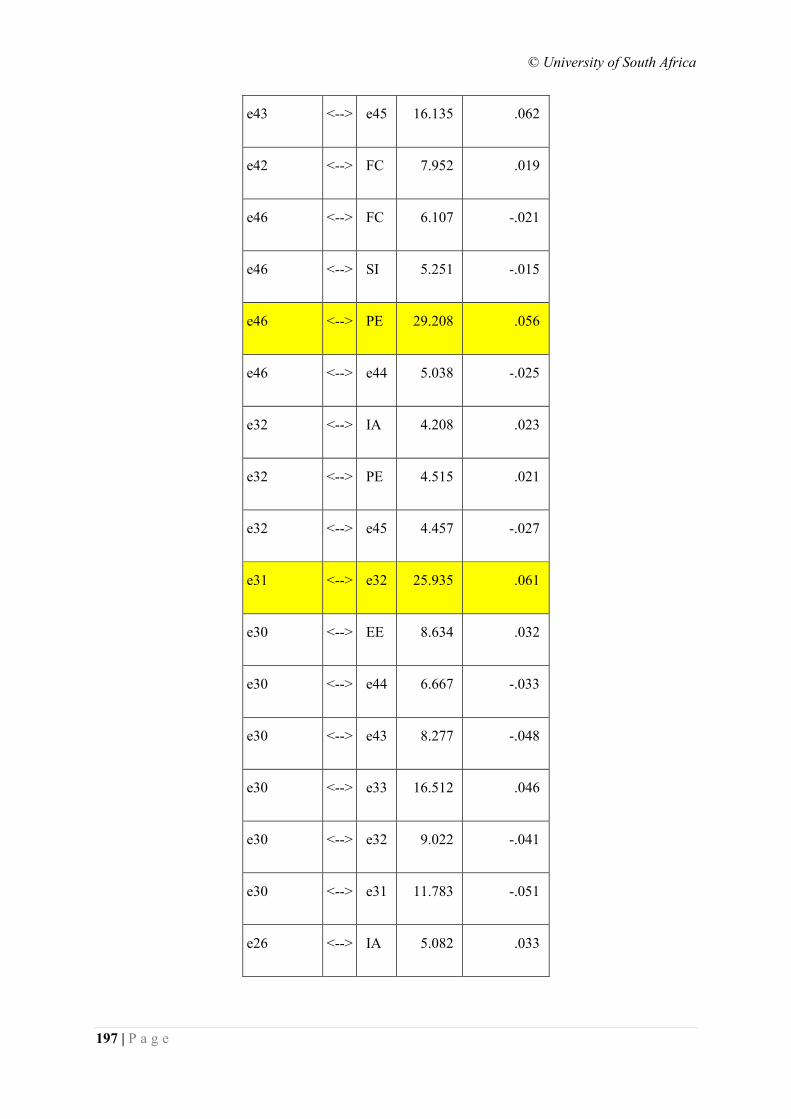
© University of South Africa
197 | P a g e
e43 <--> e45 16.135 .062
e42 <--> FC 7.952 .019
e46 <--> FC 6.107 -.021
e46 <--> SI 5.251 -.015
e46 <--> PE 29.208 .056
e46 <--> e44 5.038 -.025
e32 <--> IA 4.208 .023
e32 <--> PE 4.515 .021
e32 <--> e45 4.457 -.027
e31 <--> e32 25.935 .061
e30 <--> EE 8.634 .032
e30 <--> e44 6.667 -.033
e30 <--> e43 8.277 -.048
e30 <--> e33 16.512 .046
e30 <--> e32 9.022 -.041
e30 <--> e31 11.783 -.051
e26 <--> IA 5.082 .033
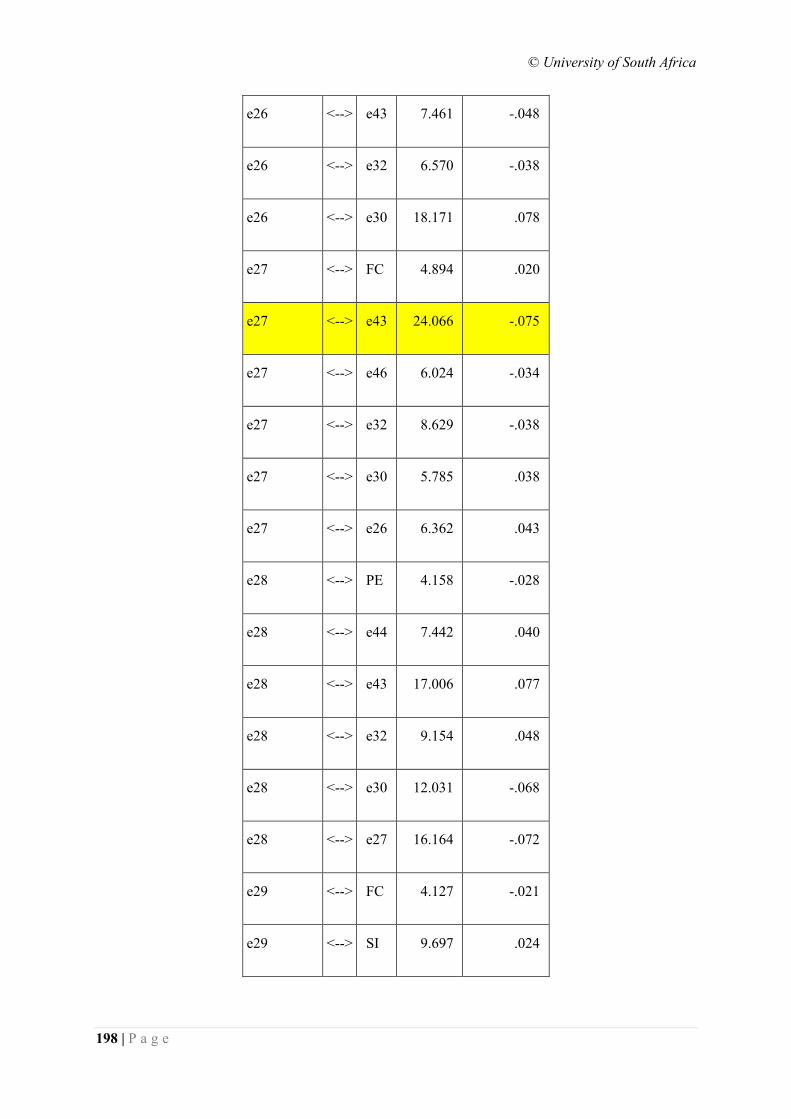
© University of South Africa
198 | P a g e
e26 <--> e43 7.461 -.048
e26 <--> e32 6.570 -.038
e26 <--> e30 18.171 .078
e27 <--> FC 4.894 .020
e27 <--> e43 24.066 -.075
e27 <--> e46 6.024 -.034
e27 <--> e32 8.629 -.038
e27 <--> e30 5.785 .038
e27 <--> e26 6.362 .043
e28 <--> PE 4.158 -.028
e28 <--> e44 7.442 .040
e28 <--> e43 17.006 .077
e28 <--> e32 9.154 .048
e28 <--> e30 12.031 -.068
e28 <--> e27 16.164 -.072
e29 <--> FC 4.127 -.021
e29 <--> SI 9.697 .024
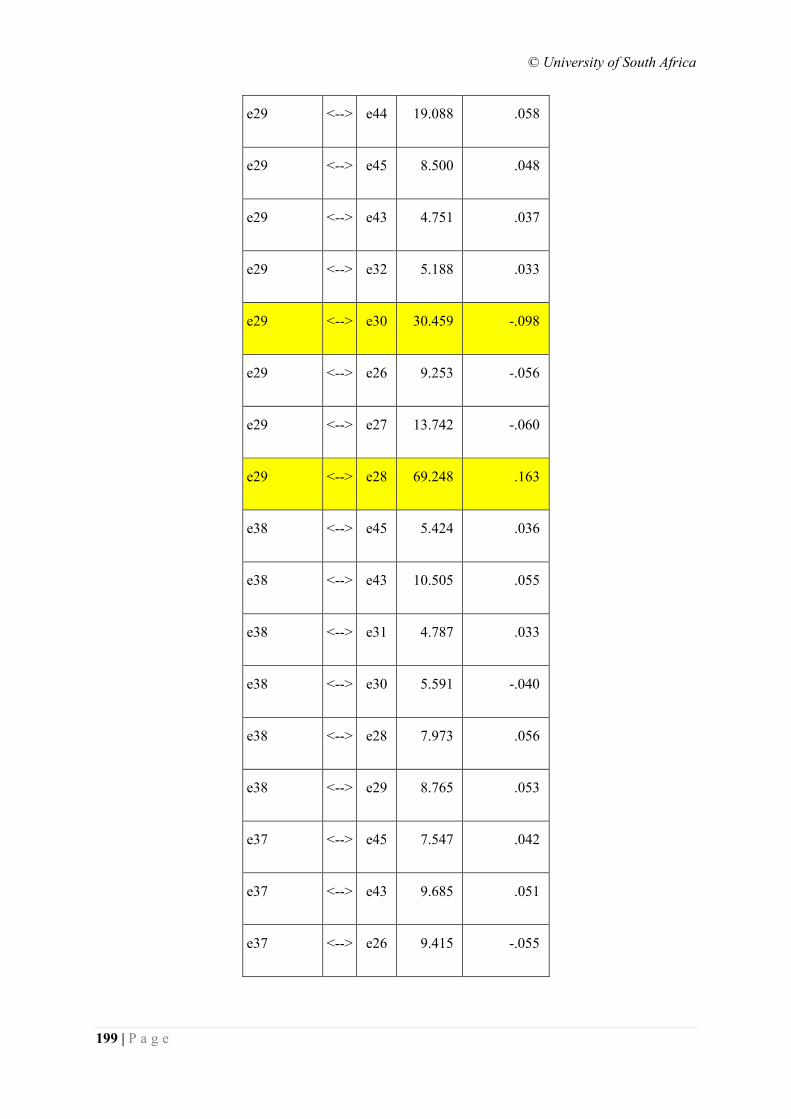
© University of South Africa
199 | P a g e
e29 <--> e44 19.088 .058
e29 <--> e45 8.500 .048
e29 <--> e43 4.751 .037
e29 <--> e32 5.188 .033
e29 <--> e30 30.459 -.098
e29 <--> e26 9.253 -.056
e29 <--> e27 13.742 -.060
e29 <--> e28 69.248 .163
e38 <--> e45 5.424 .036
e38 <--> e43 10.505 .055
e38 <--> e31 4.787 .033
e38 <--> e30 5.591 -.040
e38 <--> e28 7.973 .056
e38 <--> e29 8.765 .053
e37 <--> e45 7.547 .042
e37 <--> e43 9.685 .051
e37 <--> e26 9.415 -.055
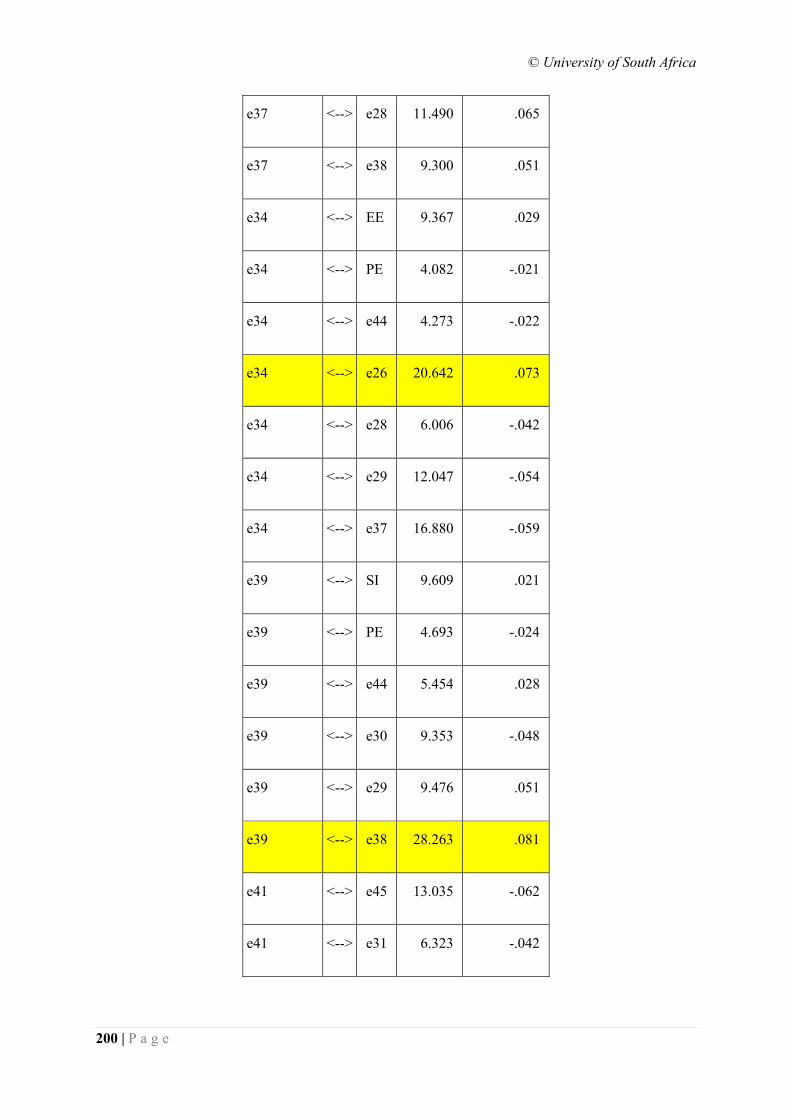
© University of South Africa
200 | P a g e
e37 <--> e28 11.490 .065
e37 <--> e38 9.300 .051
e34 <--> EE 9.367 .029
e34 <--> PE 4.082 -.021
e34 <--> e44 4.273 -.022
e34 <--> e26 20.642 .073
e34 <--> e28 6.006 -.042
e34 <--> e29 12.047 -.054
e34 <--> e37 16.880 -.059
e39 <--> SI 9.609 .021
e39 <--> PE 4.693 -.024
e39 <--> e44 5.454 .028
e39 <--> e30 9.353 -.048
e39 <--> e29 9.476 .051
e39 <--> e38 28.263 .081
e41 <--> e45 13.035 -.062
e41 <--> e31 6.323 -.042
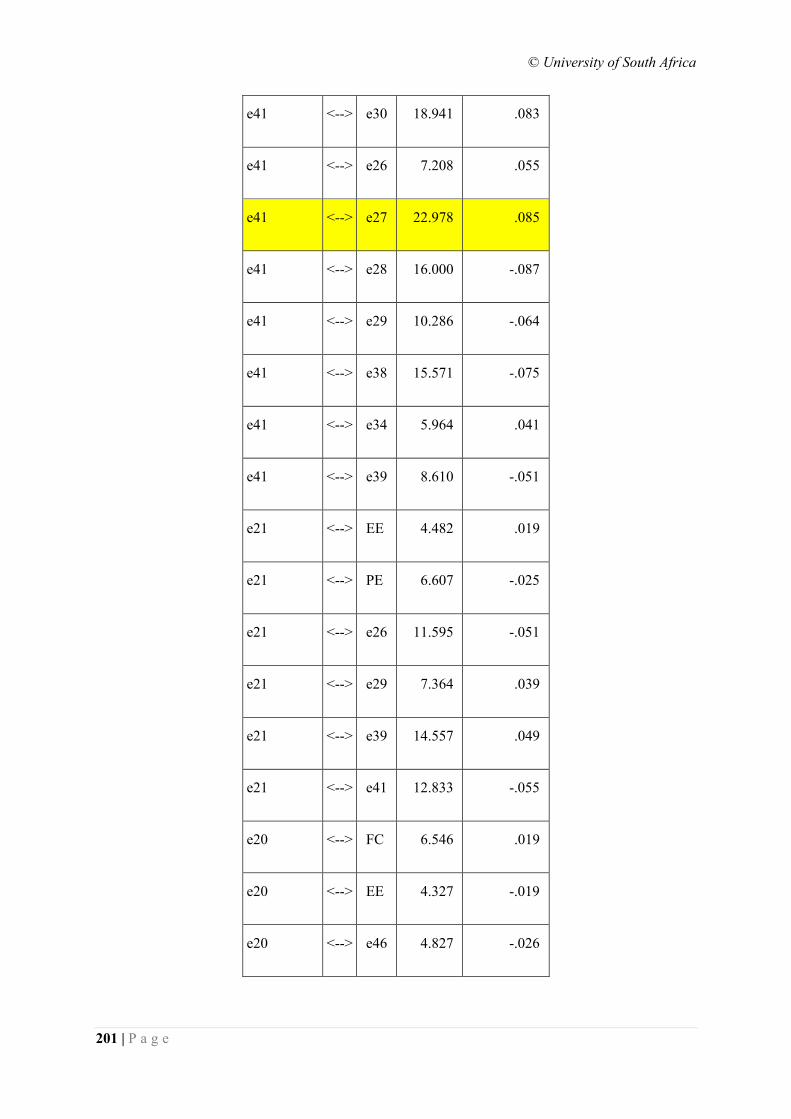
© University of South Africa
201 | P a g e
e41 <--> e30 18.941 .083
e41 <--> e26 7.208 .055
e41 <--> e27 22.978 .085
e41 <--> e28 16.000 -.087
e41 <--> e29 10.286 -.064
e41 <--> e38 15.571 -.075
e41 <--> e34 5.964 .041
e41 <--> e39 8.610 -.051
e21 <--> EE 4.482 .019
e21 <--> PE 6.607 -.025
e21 <--> e26 11.595 -.051
e21 <--> e29 7.364 .039
e21 <--> e39 14.557 .049
e21 <--> e41 12.833 -.055
e20 <--> FC 6.546 .019
e20 <--> EE 4.327 -.019
e20 <--> e46 4.827 -.026
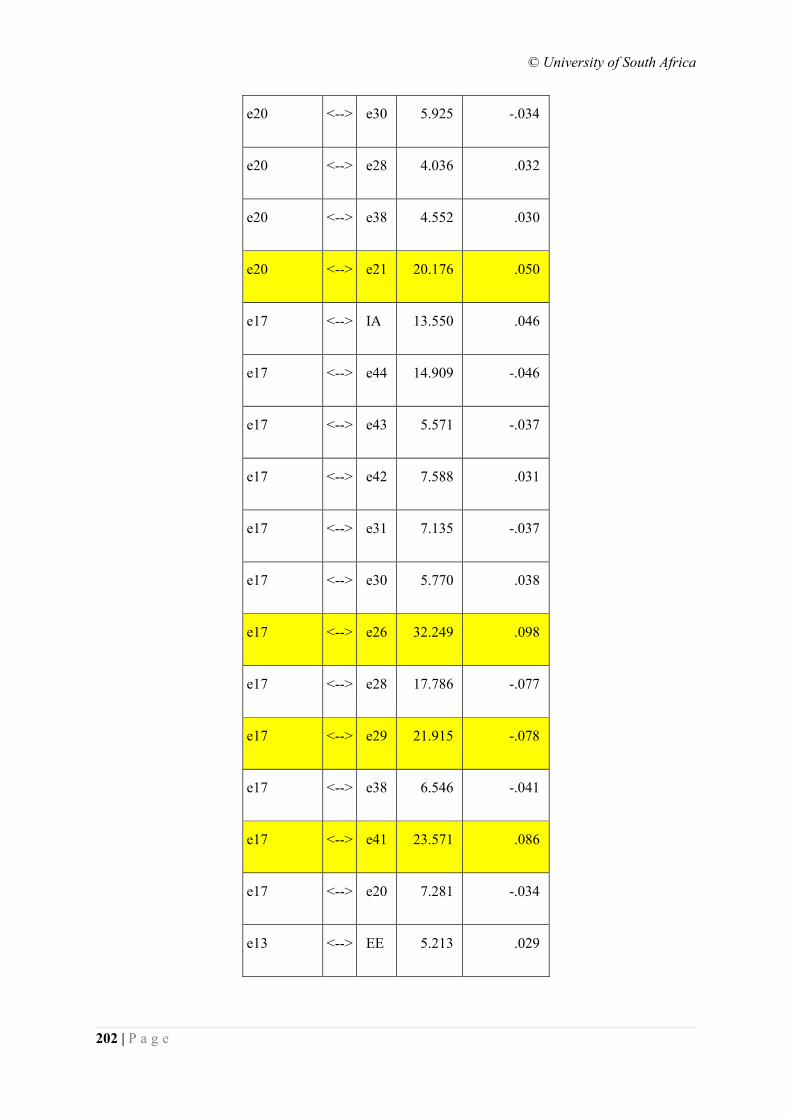
© University of South Africa
202 | P a g e
e20 <--> e30 5.925 -.034
e20 <--> e28 4.036 .032
e20 <--> e38 4.552 .030
e20 <--> e21 20.176 .050
e17 <--> IA 13.550 .046
e17 <--> e44 14.909 -.046
e17 <--> e43 5.571 -.037
e17 <--> e42 7.588 .031
e17 <--> e31 7.135 -.037
e17 <--> e30 5.770 .038
e17 <--> e26 32.249 .098
e17 <--> e28 17.786 -.077
e17 <--> e29 21.915 -.078
e17 <--> e38 6.546 -.041
e17 <--> e41 23.571 .086
e17 <--> e20 7.281 -.034
e13 <--> EE 5.213 .029
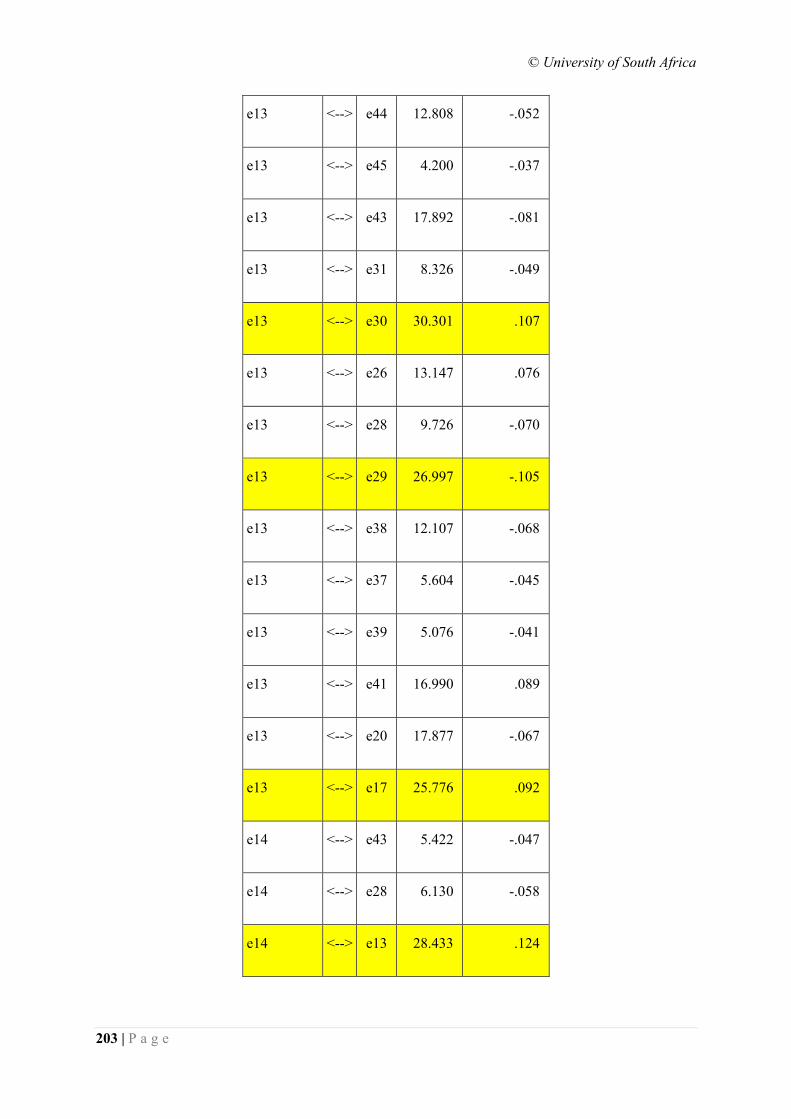
© University of South Africa
203 | P a g e
e13 <--> e44 12.808 -.052
e13 <--> e45 4.200 -.037
e13 <--> e43 17.892 -.081
e13 <--> e31 8.326 -.049
e13 <--> e30 30.301 .107
e13 <--> e26 13.147 .076
e13 <--> e28 9.726 -.070
e13 <--> e29 26.997 -.105
e13 <--> e38 12.107 -.068
e13 <--> e37 5.604 -.045
e13 <--> e39 5.076 -.041
e13 <--> e41 16.990 .089
e13 <--> e20 17.877 -.067
e13 <--> e17 25.776 .092
e14 <--> e43 5.422 -.047
e14 <--> e28 6.130 -.058
e14 <--> e13 28.433 .124
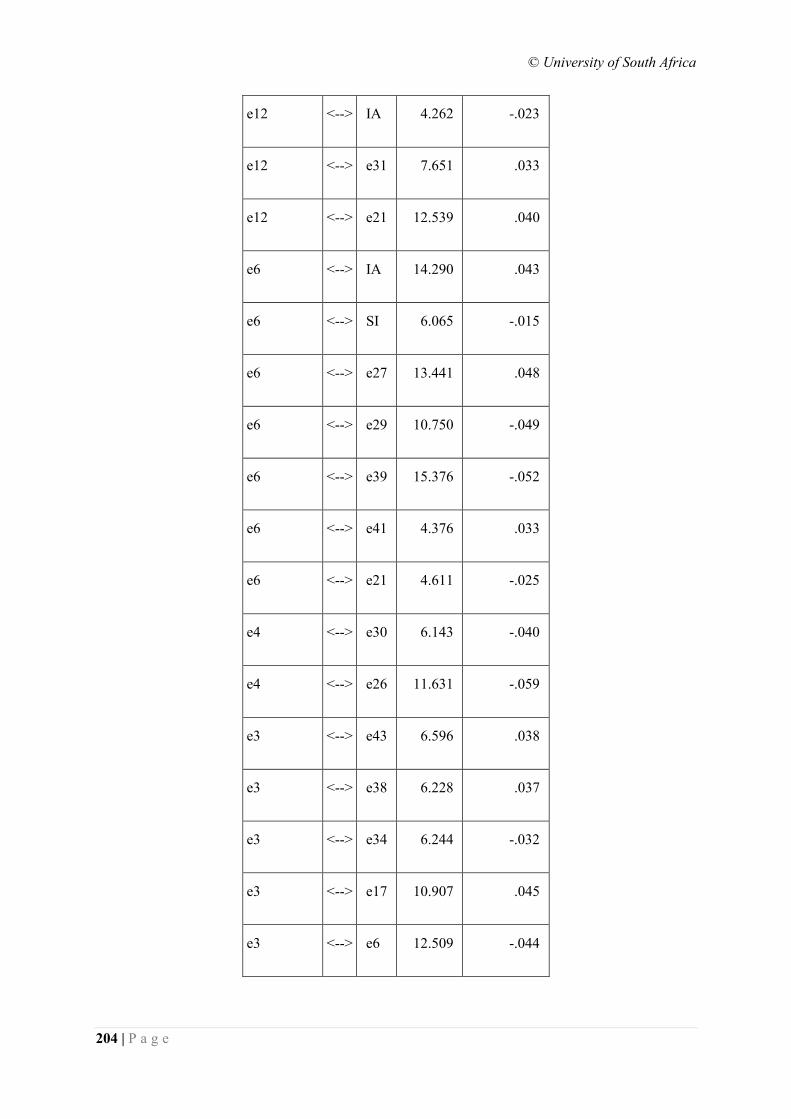
© University of South Africa
204 | P a g e
e12 <--> IA 4.262 -.023
e12 <--> e31 7.651 .033
e12 <--> e21 12.539 .040
e6 <--> IA 14.290 .043
e6 <--> SI 6.065 -.015
e6 <--> e27 13.441 .048
e6 <--> e29 10.750 -.049
e6 <--> e39 15.376 -.052
e6 <--> e41 4.376 .033
e6 <--> e21 4.611 -.025
e4 <--> e30 6.143 -.040
e4 <--> e26 11.631 -.059
e3 <--> e43 6.596 .038
e3 <--> e38 6.228 .037
e3 <--> e34 6.244 -.032
e3 <--> e17 10.907 .045
e3 <--> e6 12.509 -.044
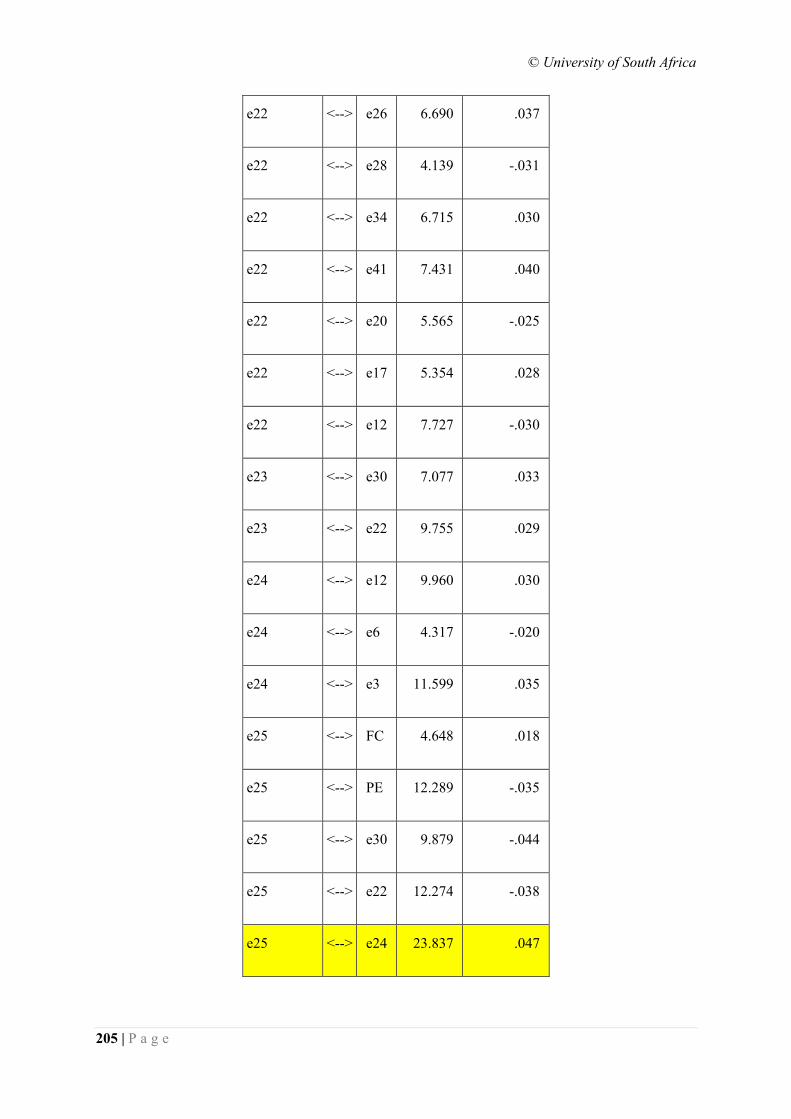
© University of South Africa
205 | P a g e
e22 <--> e26 6.690 .037
e22 <--> e28 4.139 -.031
e22 <--> e34 6.715 .030
e22 <--> e41 7.431 .040
e22 <--> e20 5.565 -.025
e22 <--> e17 5.354 .028
e22 <--> e12 7.727 -.030
e23 <--> e30 7.077 .033
e23 <--> e22 9.755 .029
e24 <--> e12 9.960 .030
e24 <--> e6 4.317 -.020
e24 <--> e3 11.599 .035
e25 <--> FC 4.648 .018
e25 <--> PE 12.289 -.035
e25 <--> e30 9.879 -.044
e25 <--> e22 12.274 -.038
e25 <--> e24 23.837 .047
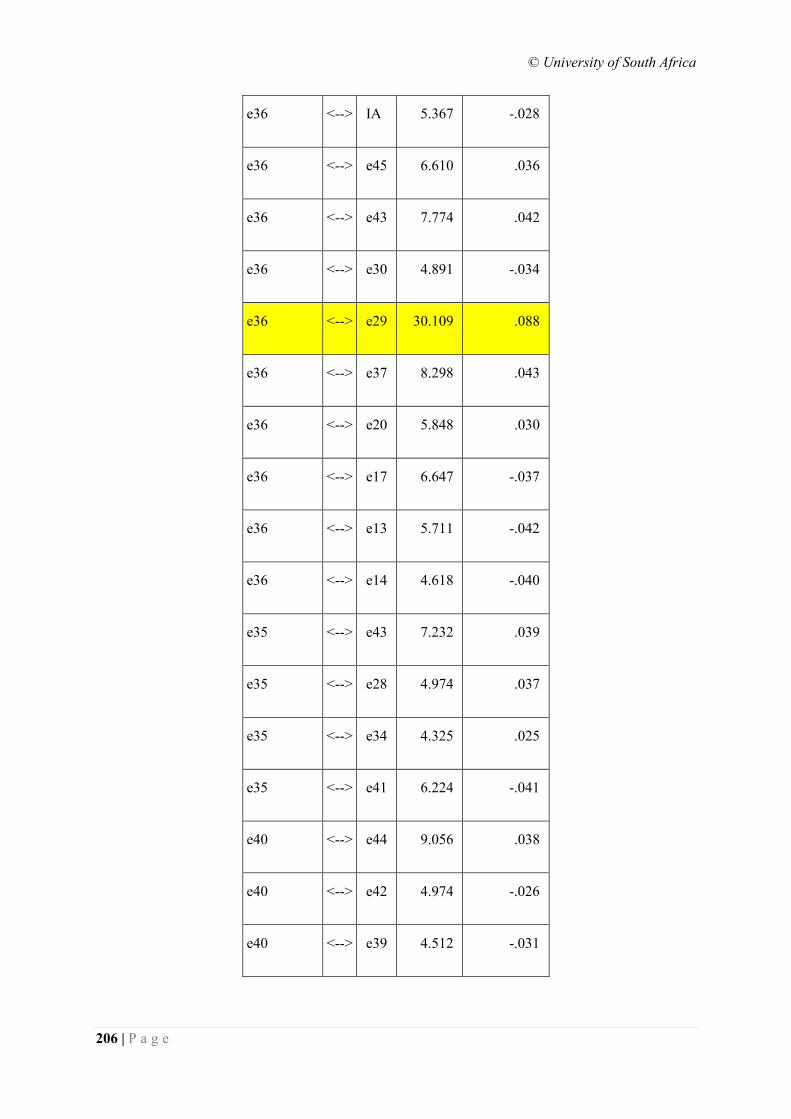
© University of South Africa
206 | P a g e
e36 <--> IA 5.367 -.028
e36 <--> e45 6.610 .036
e36 <--> e43 7.774 .042
e36 <--> e30 4.891 -.034
e36 <--> e29 30.109 .088
e36 <--> e37 8.298 .043
e36 <--> e20 5.848 .030
e36 <--> e17 6.647 -.037
e36 <--> e13 5.711 -.042
e36 <--> e14 4.618 -.040
e35 <--> e43 7.232 .039
e35 <--> e28 4.974 .037
e35 <--> e34 4.325 .025
e35 <--> e41 6.224 -.041
e40 <--> e44 9.056 .038
e40 <--> e42 4.974 -.026
e40 <--> e39 4.512 -.031
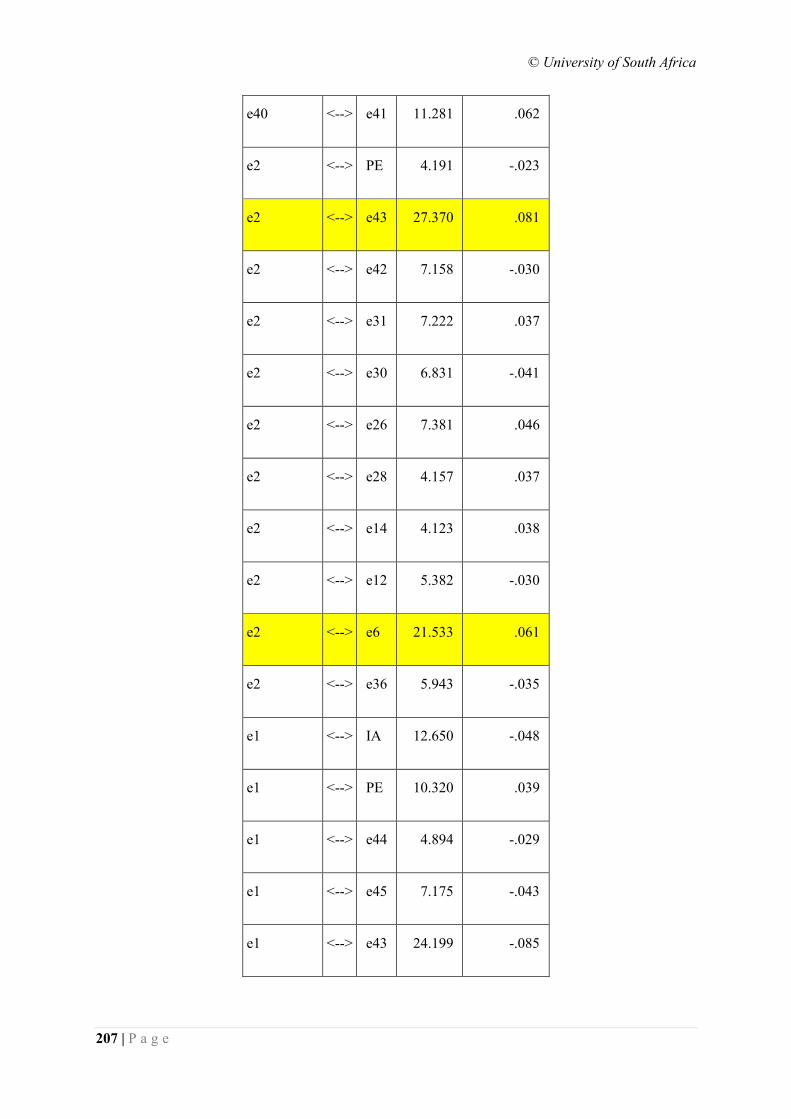
© University of South Africa
207 | P a g e
e40 <--> e41 11.281 .062
e2 <--> PE 4.191 -.023
e2 <--> e43 27.370 .081
e2 <--> e42 7.158 -.030
e2 <--> e31 7.222 .037
e2 <--> e30 6.831 -.041
e2 <--> e26 7.381 .046
e2 <--> e28 4.157 .037
e2 <--> e14 4.123 .038
e2 <--> e12 5.382 -.030
e2 <--> e6 21.533 .061
e2 <--> e36 5.943 -.035
e1 <--> IA 12.650 -.048
e1 <--> PE 10.320 .039
e1 <--> e44 4.894 -.029
e1 <--> e45 7.175 -.043
e1 <--> e43 24.199 -.085
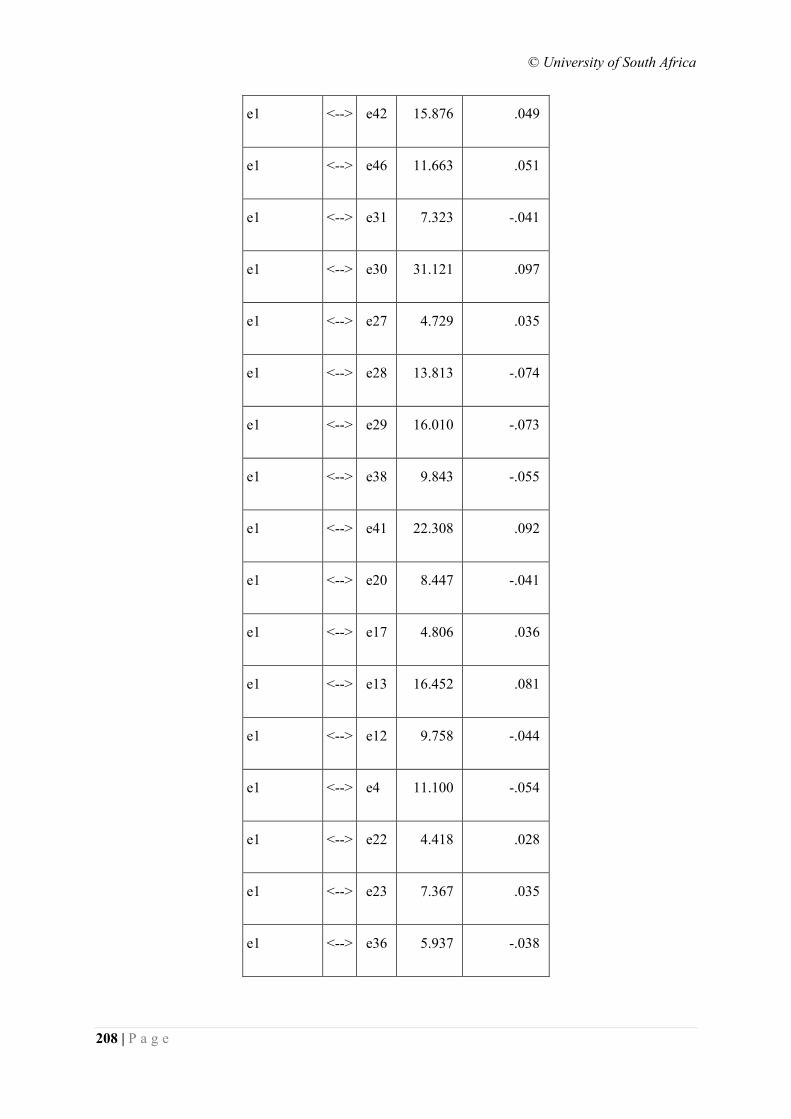
© University of South Africa
208 | P a g e
e1 <--> e42 15.876 .049
e1 <--> e46 11.663 .051
e1 <--> e31 7.323 -.041
e1 <--> e30 31.121 .097
e1 <--> e27 4.729 .035
e1 <--> e28 13.813 -.074
e1 <--> e29 16.010 -.073
e1 <--> e38 9.843 -.055
e1 <--> e41 22.308 .092
e1 <--> e20 8.447 -.041
e1 <--> e17 4.806 .036
e1 <--> e13 16.452 .081
e1 <--> e12 9.758 -.044
e1 <--> e4 11.100 -.054
e1 <--> e22 4.418 .028
e1 <--> e23 7.367 .035
e1 <--> e36 5.937 -.038
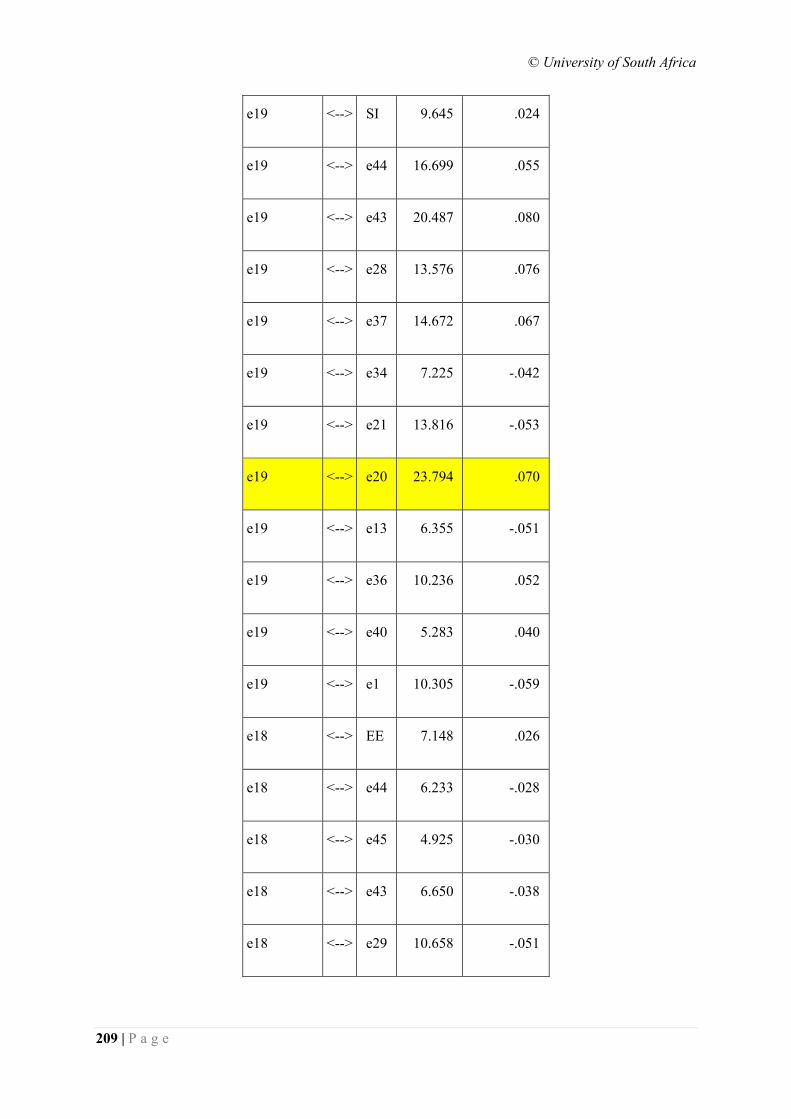
© University of South Africa
209 | P a g e
e19 <--> SI 9.645 .024
e19 <--> e44 16.699 .055
e19 <--> e43 20.487 .080
e19 <--> e28 13.576 .076
e19 <--> e37 14.672 .067
e19 <--> e34 7.225 -.042
e19 <--> e21 13.816 -.053
e19 <--> e20 23.794 .070
e19 <--> e13 6.355 -.051
e19 <--> e36 10.236 .052
e19 <--> e40 5.283 .040
e19 <--> e1 10.305 -.059
e18 <--> EE 7.148 .026
e18 <--> e44 6.233 -.028
e18 <--> e45 4.925 -.030
e18 <--> e43 6.650 -.038
e18 <--> e29 10.658 -.051

© University of South Africa
210 | P a g e
e18 <--> e41 4.898 .037
e18 <--> e17 7.231 .037
e18 <--> e13 6.029 .042
e18 <--> e6 4.846 .027
e18 <--> e1 6.508 .039
e18 <--> e19 5.772 -.037
e16 <--> PE 17.585 .052
e16 <--> e44 23.299 -.063
e16 <--> e45 9.526 -.050
e16 <--> e43 8.360 -.050
e16 <--> e46 8.795 .045
e16 <--> e26 8.259 -.055
e16 <--> e38 7.630 -.049
e16 <--> e34 5.812 -.037
e16 <--> e17 4.561 -.035
e16 <--> e12 5.936 .035
e16 <--> e3 5.179 .035
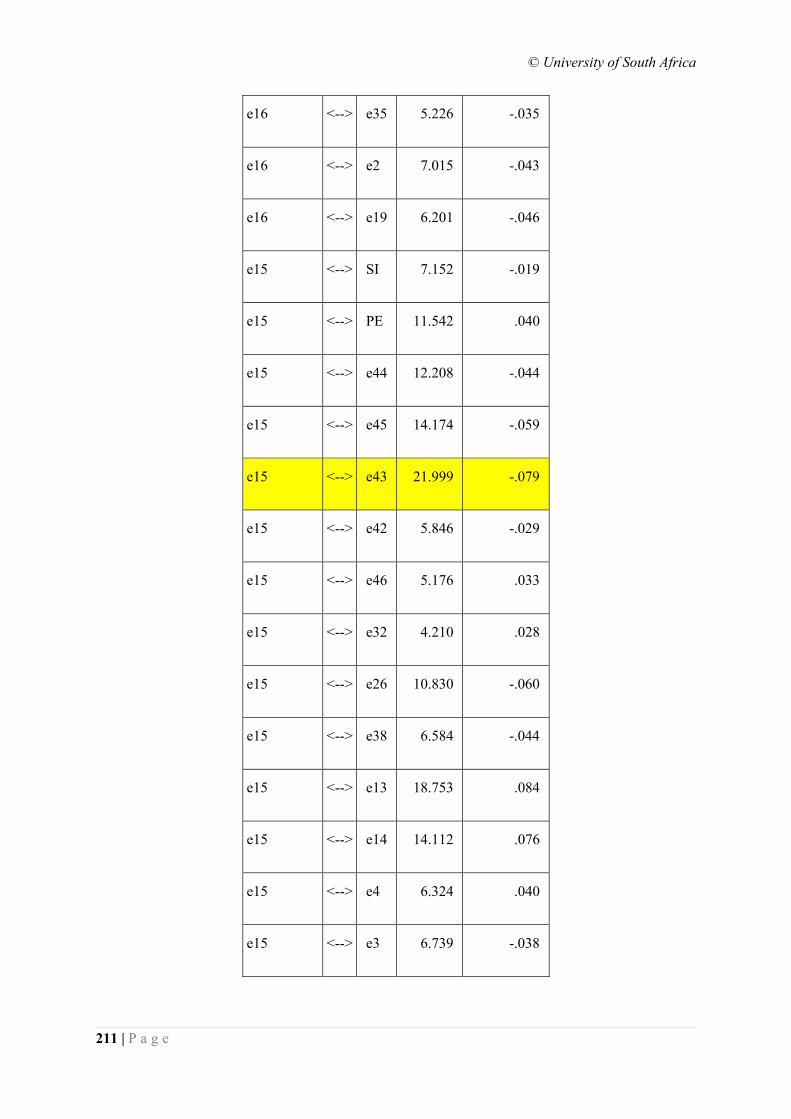
© University of South Africa
211 | P a g e
e16 <--> e35 5.226 -.035
e16 <--> e2 7.015 -.043
e16 <--> e19 6.201 -.046
e15 <--> SI 7.152 -.019
e15 <--> PE 11.542 .040
e15 <--> e44 12.208 -.044
e15 <--> e45 14.174 -.059
e15 <--> e43 21.999 -.079
e15 <--> e42 5.846 -.029
e15 <--> e46 5.176 .033
e15 <--> e32 4.210 .028
e15 <--> e26 10.830 -.060
e15 <--> e38 6.584 -.044
e15 <--> e13 18.753 .084
e15 <--> e14 14.112 .076
e15 <--> e4 6.324 .040
e15 <--> e3 6.739 -.038
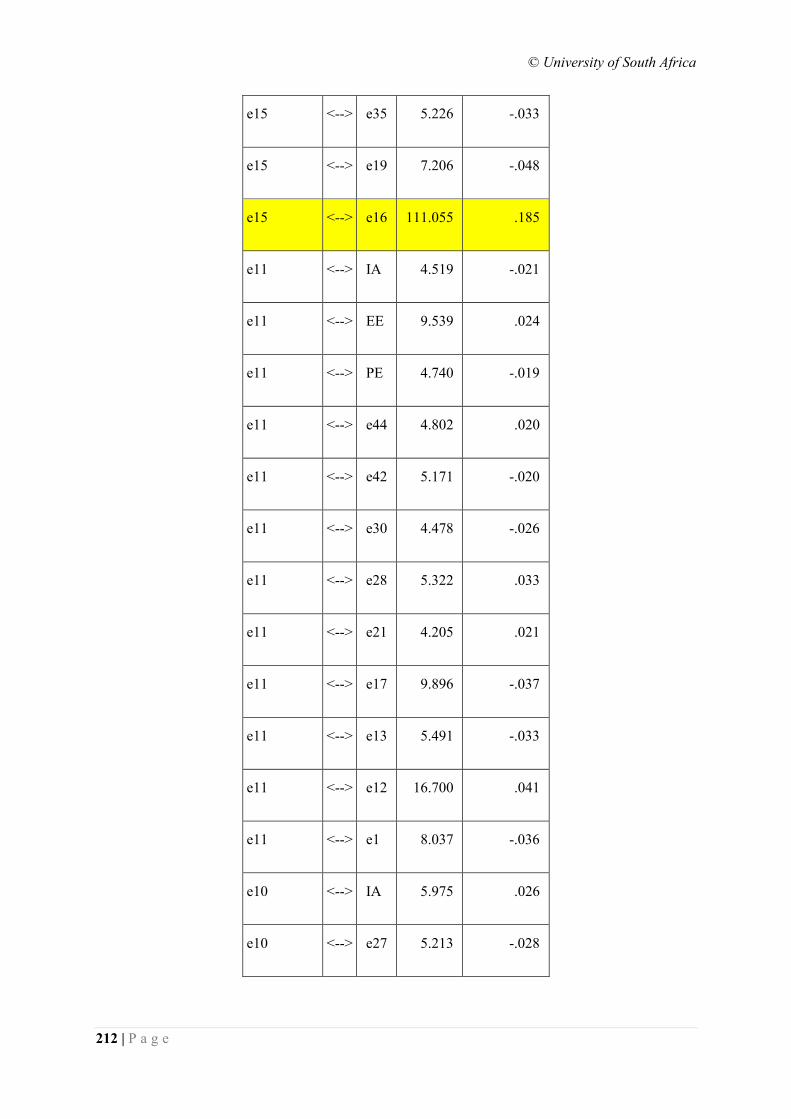
© University of South Africa
212 | P a g e
e15 <--> e35 5.226 -.033
e15 <--> e19 7.206 -.048
e15 <--> e16 111.055 .185
e11 <--> IA 4.519 -.021
e11 <--> EE 9.539 .024
e11 <--> PE 4.740 -.019
e11 <--> e44 4.802 .020
e11 <--> e42 5.171 -.020
e11 <--> e30 4.478 -.026
e11 <--> e28 5.322 .033
e11 <--> e21 4.205 .021
e11 <--> e17 9.896 -.037
e11 <--> e13 5.491 -.033
e11 <--> e12 16.700 .041
e11 <--> e1 8.037 -.036
e10 <--> IA 5.975 .026
e10 <--> e27 5.213 -.028
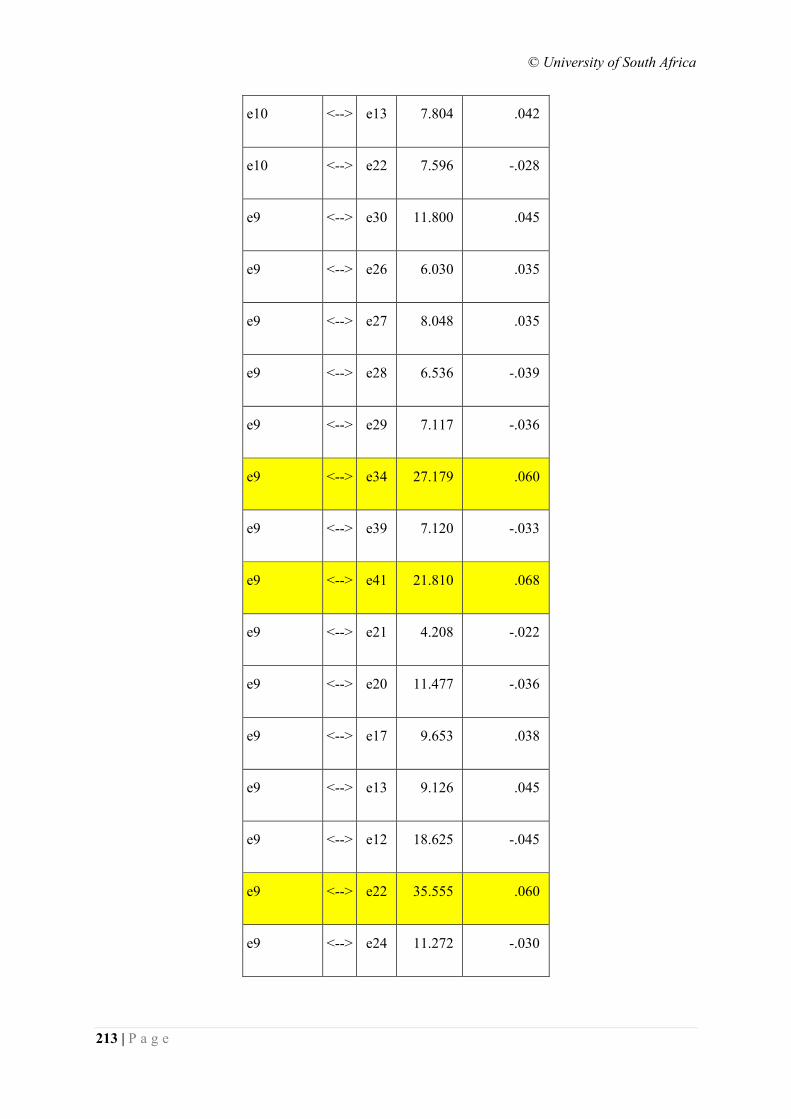
© University of South Africa
213 | P a g e
e10 <--> e13 7.804 .042
e10 <--> e22 7.596 -.028
e9 <--> e30 11.800 .045
e9 <--> e26 6.030 .035
e9 <--> e27 8.048 .035
e9 <--> e28 6.536 -.039
e9 <--> e29 7.117 -.036
e9 <--> e34 27.179 .060
e9 <--> e39 7.120 -.033
e9 <--> e41 21.810 .068
e9 <--> e21 4.208 -.022
e9 <--> e20 11.477 -.036
e9 <--> e17 9.653 .038
e9 <--> e13 9.126 .045
e9 <--> e12 18.625 -.045
e9 <--> e22 35.555 .060
e9 <--> e24 11.272 -.030
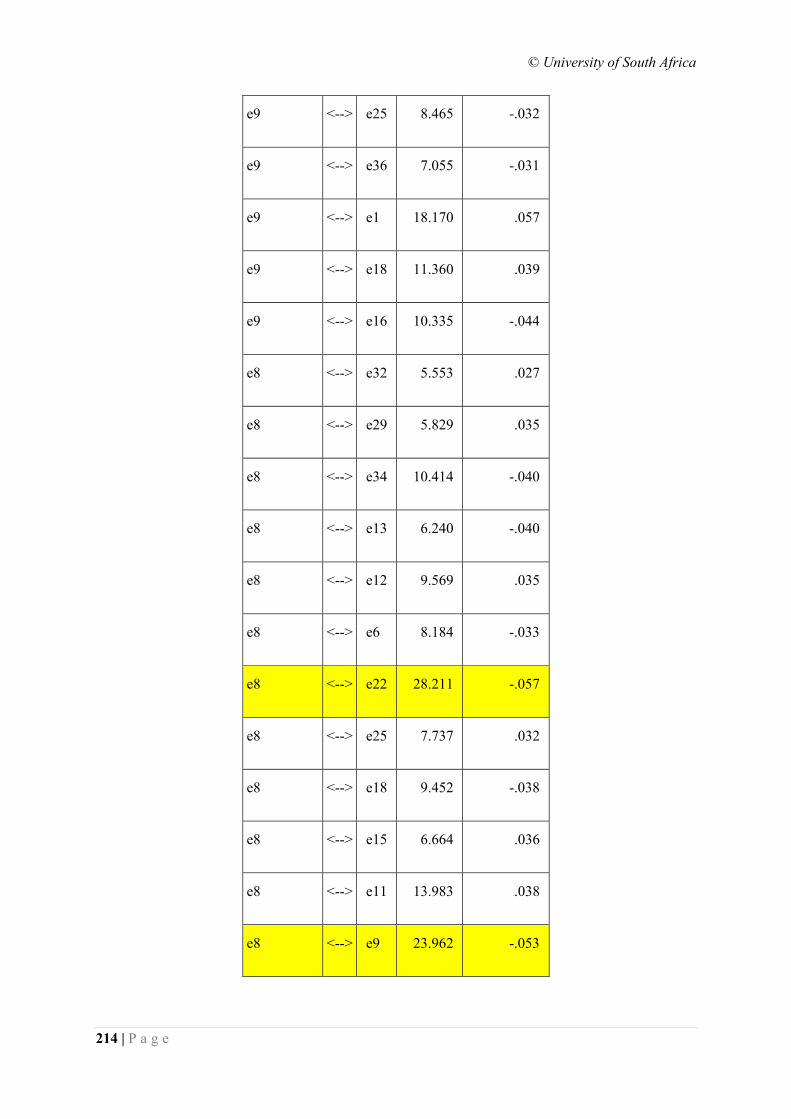
© University of South Africa
214 | P a g e
e9 <--> e25 8.465 -.032
e9 <--> e36 7.055 -.031
e9 <--> e1 18.170 .057
e9 <--> e18 11.360 .039
e9 <--> e16 10.335 -.044
e8 <--> e32 5.553 .027
e8 <--> e29 5.829 .035
e8 <--> e34 10.414 -.040
e8 <--> e13 6.240 -.040
e8 <--> e12 9.569 .035
e8 <--> e6 8.184 -.033
e8 <--> e22 28.211 -.057
e8 <--> e25 7.737 .032
e8 <--> e18 9.452 -.038
e8 <--> e15 6.664 .036
e8 <--> e11 13.983 .038
e8 <--> e9 23.962 -.053
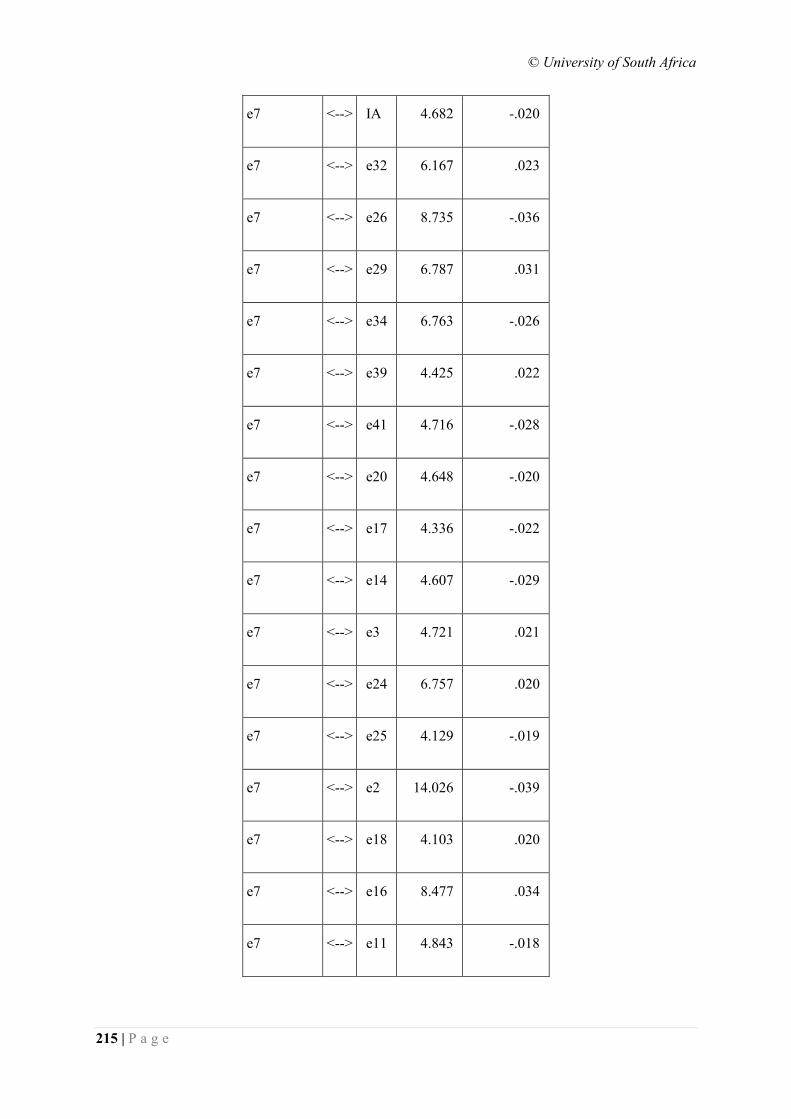
© University of South Africa
215 | P a g e
e7 <--> IA 4.682 -.020
e7 <--> e32 6.167 .023
e7 <--> e26 8.735 -.036
e7 <--> e29 6.787 .031
e7 <--> e34 6.763 -.026
e7 <--> e39 4.425 .022
e7 <--> e41 4.716 -.028
e7 <--> e20 4.648 -.020
e7 <--> e17 4.336 -.022
e7 <--> e14 4.607 -.029
e7 <--> e3 4.721 .021
e7 <--> e24 6.757 .020
e7 <--> e25 4.129 -.019
e7 <--> e2 14.026 -.039
e7 <--> e18 4.103 .020
e7 <--> e16 8.477 .034
e7 <--> e11 4.843 -.018
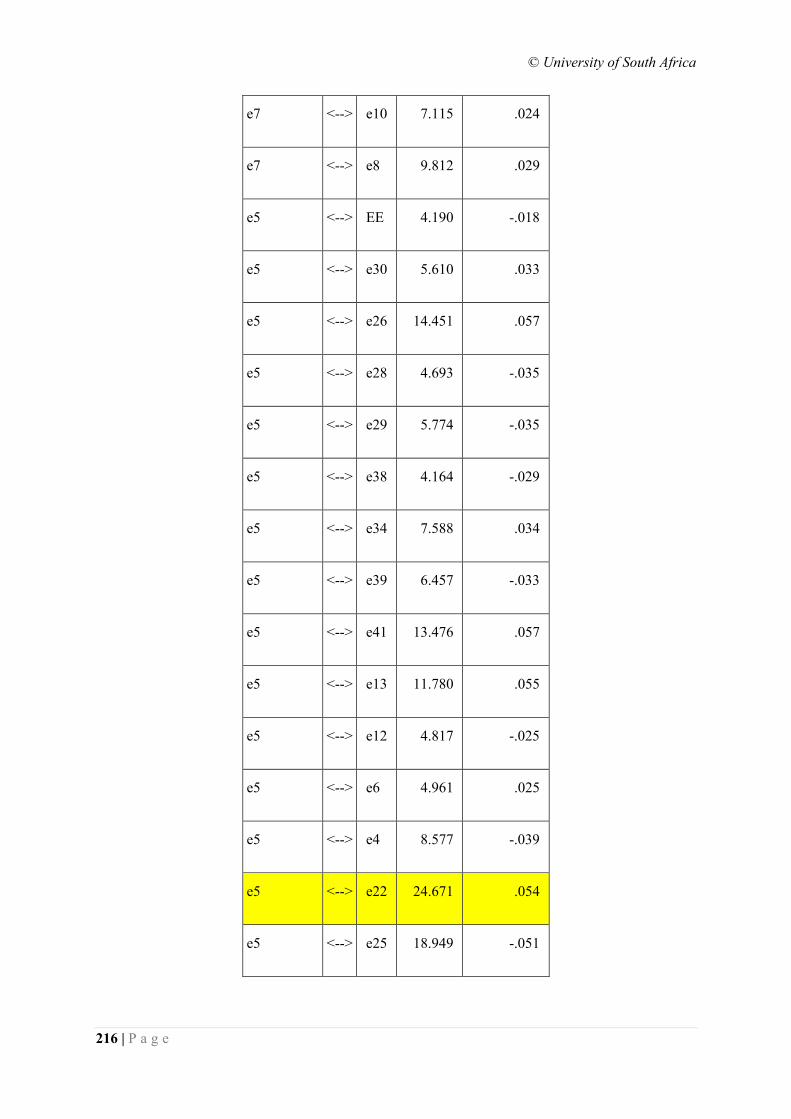
© University of South Africa
216 | P a g e
e7 <--> e10 7.115 .024
e7 <--> e8 9.812 .029
e5 <--> EE 4.190 -.018
e5 <--> e30 5.610 .033
e5 <--> e26 14.451 .057
e5 <--> e28 4.693 -.035
e5 <--> e29 5.774 -.035
e5 <--> e38 4.164 -.029
e5 <--> e34 7.588 .034
e5 <--> e39 6.457 -.033
e5 <--> e41 13.476 .057
e5 <--> e13 11.780 .055
e5 <--> e12 4.817 -.025
e5 <--> e6 4.961 .025
e5 <--> e4 8.577 -.039
e5 <--> e22 24.671 .054
e5 <--> e25 18.949 -.051
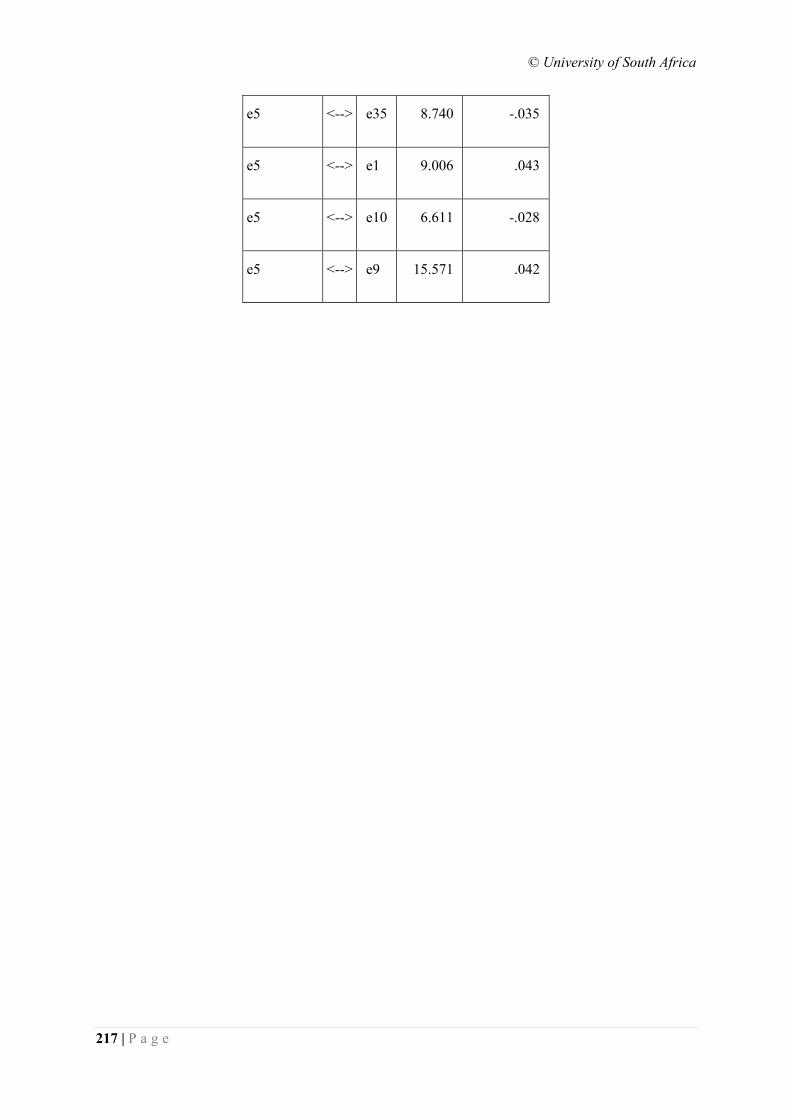
© University of South Africa
217 | P a g e
e5 <--> e35 8.740 -.035
e5 <--> e1 9.006 .043
e5 <--> e10 6.611 -.028
e5 <--> e9 15.571 .042
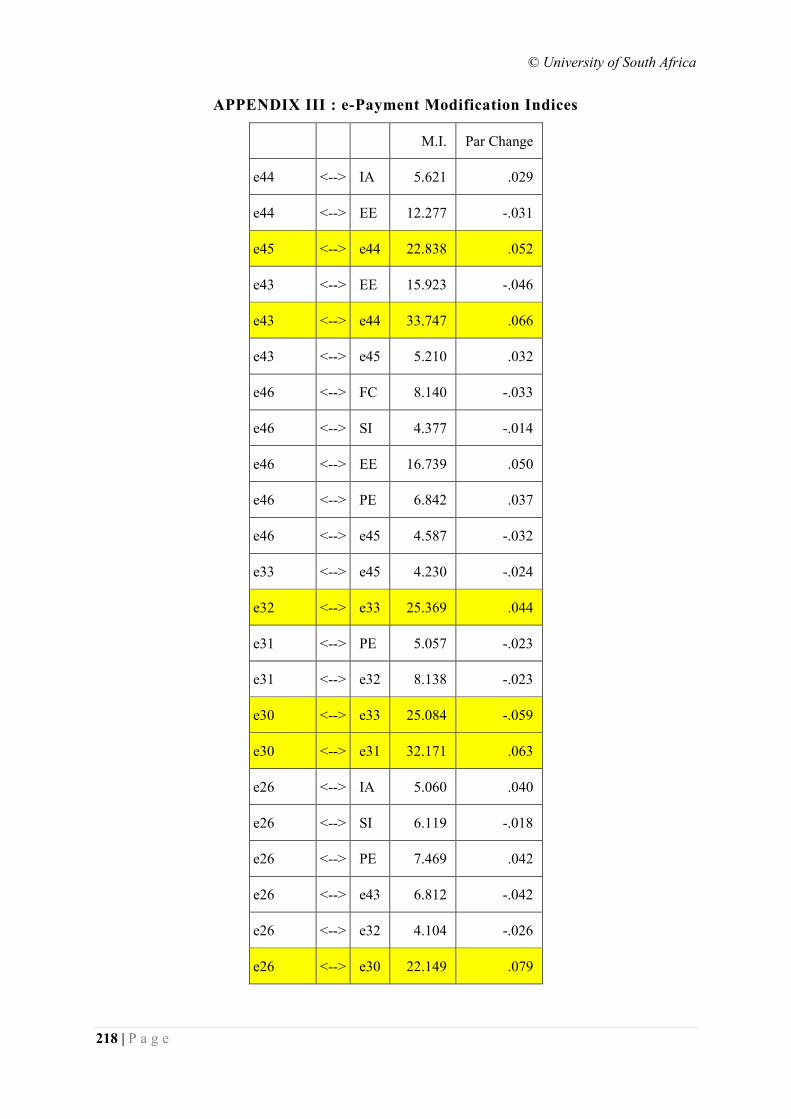
© University of South Africa
218 | P a g e
APPENDIX III : e-Payment Modification Indices
M.I. Par Change
e44 <--> IA 5.621 .029
e44 <--> EE 12.277 -.031
e45 <--> e44 22.838 .052
e43 <--> EE 15.923 -.046
e43 <--> e44 33.747 .066
e43 <--> e45 5.210 .032
e46 <--> FC 8.140 -.033
e46 <--> SI 4.377 -.014
e46 <--> EE 16.739 .050
e46 <--> PE 6.842 .037
e46 <--> e45 4.587 -.032
e33 <--> e45 4.230 -.024
e32 <--> e33 25.369 .044
e31 <--> PE 5.057 -.023
e31 <--> e32 8.138 -.023
e30 <--> e33 25.084 -.059
e30 <--> e31 32.171 .063
e26 <--> IA 5.060 .040
e26 <--> SI 6.119 -.018
e26 <--> PE 7.469 .042
e26 <--> e43 6.812 -.042
e26 <--> e32 4.104 -.026
e26 <--> e30 22.149 .079
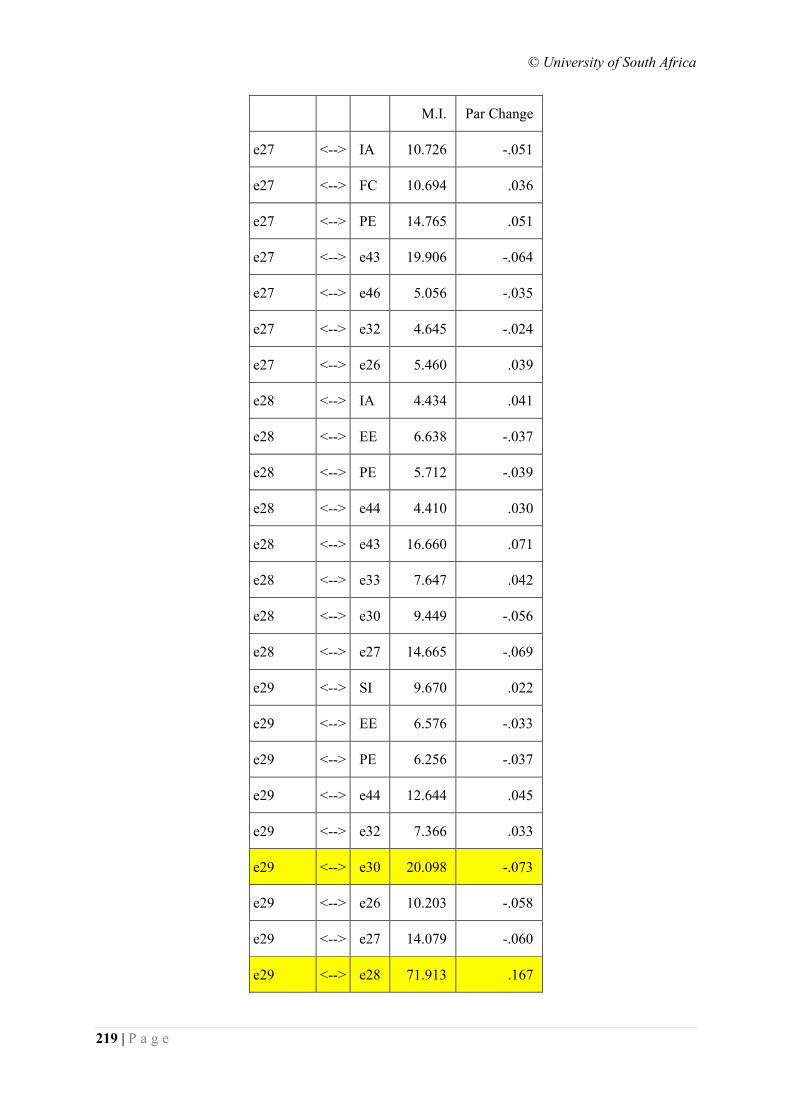
© University of South Africa
219 | P a g e
M.I. Par Change
e27 <--> IA 10.726 -.051
e27 <--> FC 10.694 .036
e27 <--> PE 14.765 .051
e27 <--> e43 19.906 -.064
e27 <--> e46 5.056 -.035
e27 <--> e32 4.645 -.024
e27 <--> e26 5.460 .039
e28 <--> IA 4.434 .041
e28 <--> EE 6.638 -.037
e28 <--> PE 5.712 -.039
e28 <--> e44 4.410 .030
e28 <--> e43 16.660 .071
e28 <--> e33 7.647 .042
e28 <--> e30 9.449 -.056
e28 <--> e27 14.665 -.069
e29 <--> SI 9.670 .022
e29 <--> EE 6.576 -.033
e29 <--> PE 6.256 -.037
e29 <--> e44 12.644 .045
e29 <--> e32 7.366 .033
e29 <--> e30 20.098 -.073
e29 <--> e26 10.203 -.058
e29 <--> e27 14.079 -.060
e29 <--> e28 71.913 .167
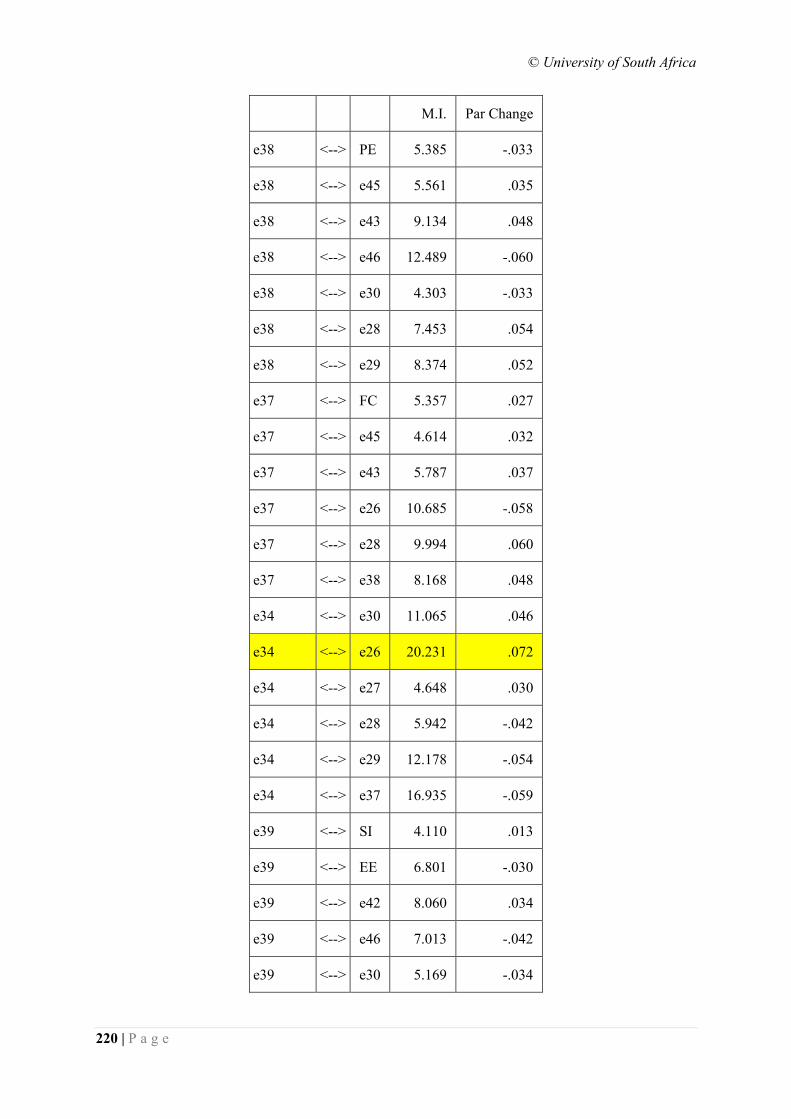
© University of South Africa
220 | P a g e
M.I. Par Change
e38 <--> PE 5.385 -.033
e38 <--> e45 5.561 .035
e38 <--> e43 9.134 .048
e38 <--> e46 12.489 -.060
e38 <--> e30 4.303 -.033
e38 <--> e28 7.453 .054
e38 <--> e29 8.374 .052
e37 <--> FC 5.357 .027
e37 <--> e45 4.614 .032
e37 <--> e43 5.787 .037
e37 <--> e26 10.685 -.058
e37 <--> e28 9.994 .060
e37 <--> e38 8.168 .048
e34 <--> e30 11.065 .046
e34 <--> e26 20.231 .072
e34 <--> e27 4.648 .030
e34 <--> e28 5.942 -.042
e34 <--> e29 12.178 -.054
e34 <--> e37 16.935 -.059
e39 <--> SI 4.110 .013
e39 <--> EE 6.801 -.030
e39 <--> e42 8.060 .034
e39 <--> e46 7.013 -.042
e39 <--> e30 5.169 -.034
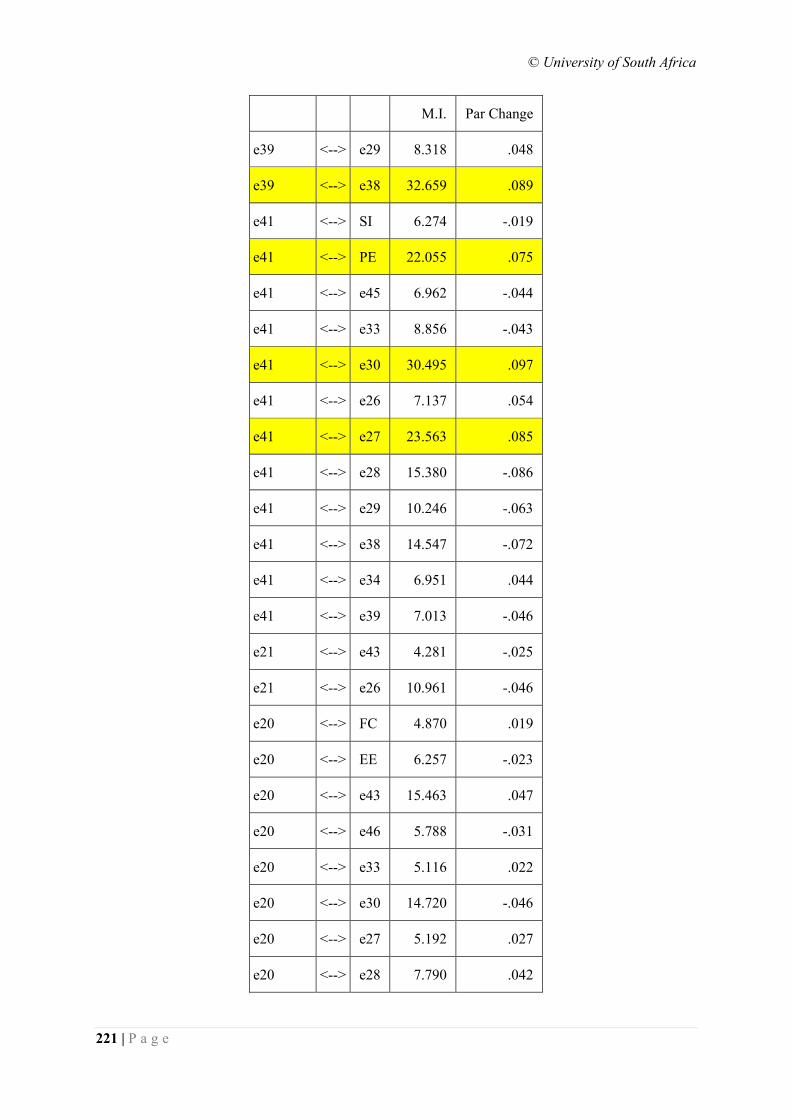
© University of South Africa
221 | P a g e
M.I. Par Change
e39 <--> e29 8.318 .048
e39 <--> e38 32.659 .089
e41 <--> SI 6.274 -.019
e41 <--> PE 22.055 .075
e41 <--> e45 6.962 -.044
e41 <--> e33 8.856 -.043
e41 <--> e30 30.495 .097
e41 <--> e26 7.137 .054
e41 <--> e27 23.563 .085
e41 <--> e28 15.380 -.086
e41 <--> e29 10.246 -.063
e41 <--> e38 14.547 -.072
e41 <--> e34 6.951 .044
e41 <--> e39 7.013 -.046
e21 <--> e43 4.281 -.025
e21 <--> e26 10.961 -.046
e20 <--> FC 4.870 .019
e20 <--> EE 6.257 -.023
e20 <--> e43 15.463 .047
e20 <--> e46 5.788 -.031
e20 <--> e33 5.116 .022
e20 <--> e30 14.720 -.046
e20 <--> e27 5.192 .027
e20 <--> e28 7.790 .042
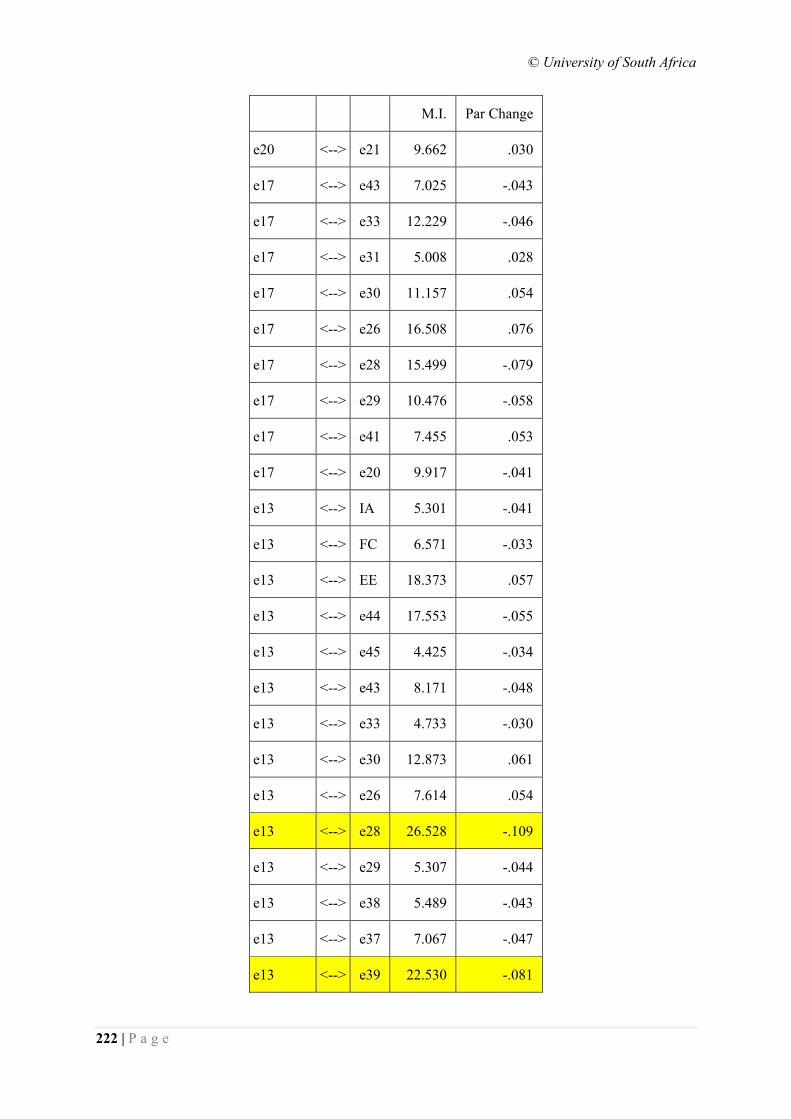
© University of South Africa
222 | P a g e
M.I. Par Change
e20 <--> e21 9.662 .030
e17 <--> e43 7.025 -.043
e17 <--> e33 12.229 -.046
e17 <--> e31 5.008 .028
e17 <--> e30 11.157 .054
e17 <--> e26 16.508 .076
e17 <--> e28 15.499 -.079
e17 <--> e29 10.476 -.058
e17 <--> e41 7.455 .053
e17 <--> e20 9.917 -.041
e13 <--> IA 5.301 -.041
e13 <--> FC 6.571 -.033
e13 <--> EE 18.373 .057
e13 <--> e44 17.553 -.055
e13 <--> e45 4.425 -.034
e13 <--> e43 8.171 -.048
e13 <--> e33 4.733 -.030
e13 <--> e30 12.873 .061
e13 <--> e26 7.614 .054
e13 <--> e28 26.528 -.109
e13 <--> e29 5.307 -.044
e13 <--> e38 5.489 -.043
e13 <--> e37 7.067 -.047
e13 <--> e39 22.530 -.081
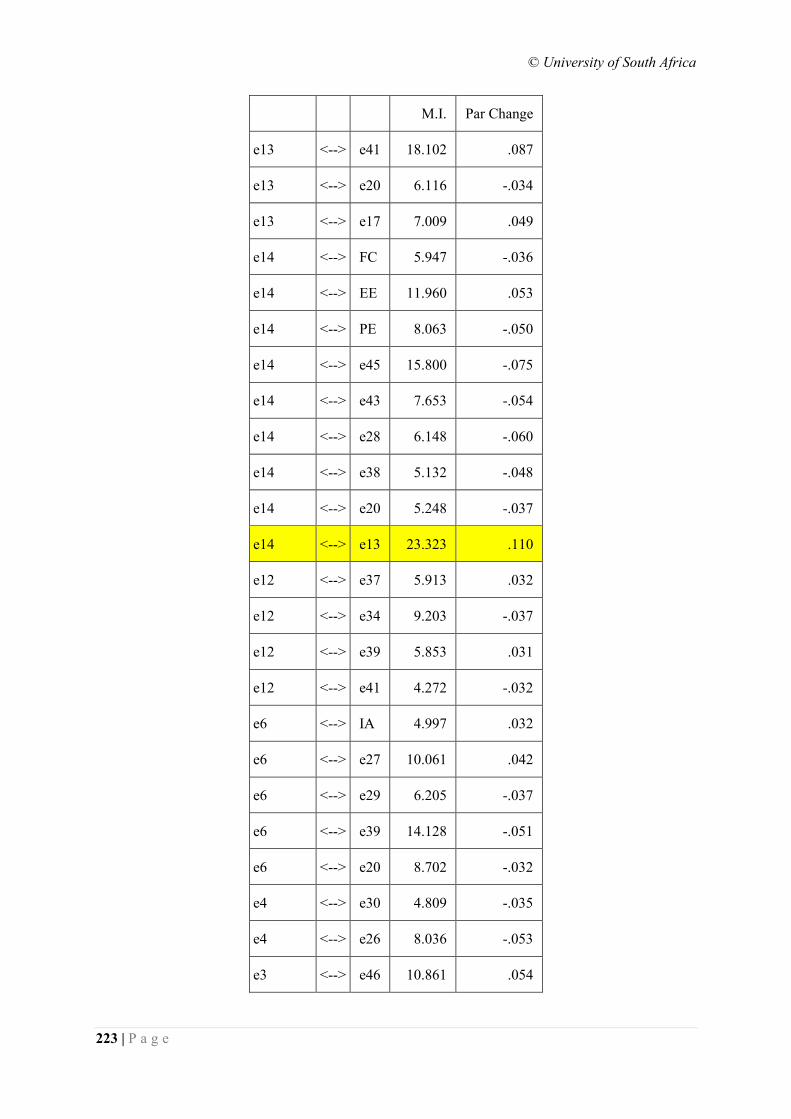
© University of South Africa
223 | P a g e
M.I. Par Change
e13 <--> e41 18.102 .087
e13 <--> e20 6.116 -.034
e13 <--> e17 7.009 .049
e14 <--> FC 5.947 -.036
e14 <--> EE 11.960 .053
e14 <--> PE 8.063 -.050
e14 <--> e45 15.800 -.075
e14 <--> e43 7.653 -.054
e14 <--> e28 6.148 -.060
e14 <--> e38 5.132 -.048
e14 <--> e20 5.248 -.037
e14 <--> e13 23.323 .110
e12 <--> e37 5.913 .032
e12 <--> e34 9.203 -.037
e12 <--> e39 5.853 .031
e12 <--> e41 4.272 -.032
e6 <--> IA 4.997 .032
e6 <--> e27 10.061 .042
e6 <--> e29 6.205 -.037
e6 <--> e39 14.128 -.051
e6 <--> e20 8.702 -.032
e4 <--> e30 4.809 -.035
e4 <--> e26 8.036 -.053
e3 <--> e46 10.861 .054
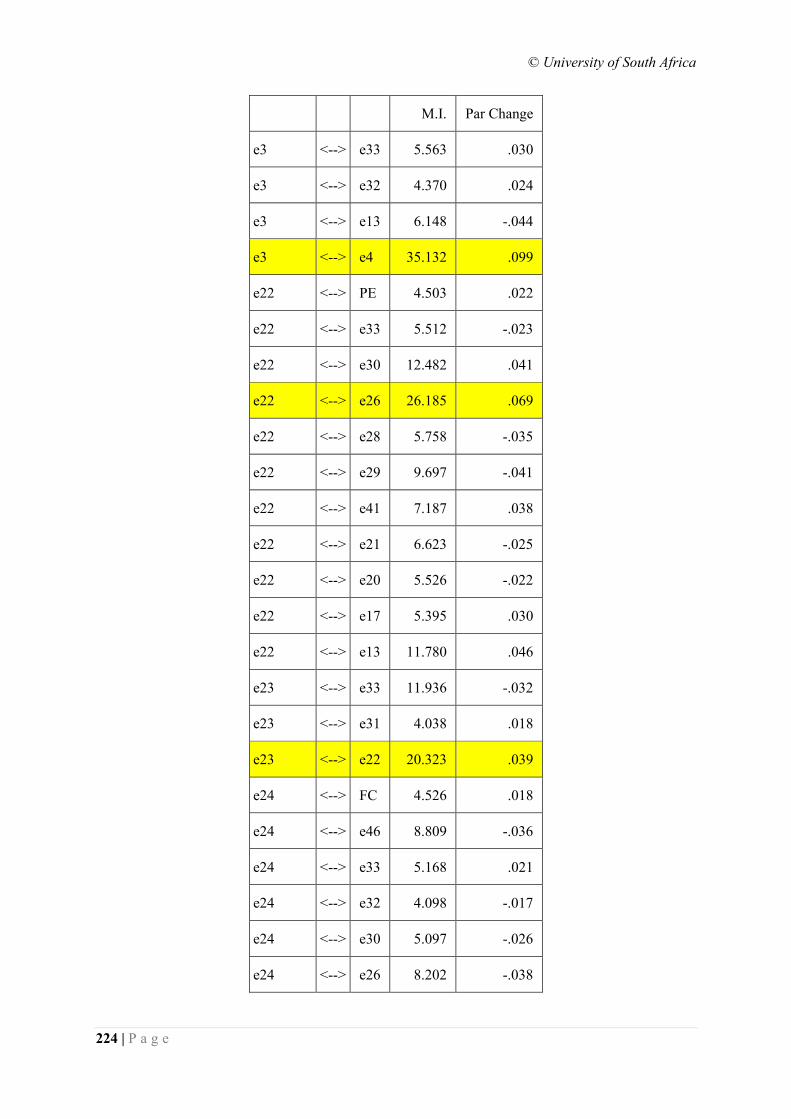
© University of South Africa
224 | P a g e
M.I. Par Change
e3 <--> e33 5.563 .030
e3 <--> e32 4.370 .024
e3 <--> e13 6.148 -.044
e3 <--> e4 35.132 .099
e22 <--> PE 4.503 .022
e22 <--> e33 5.512 -.023
e22 <--> e30 12.482 .041
e22 <--> e26 26.185 .069
e22 <--> e28 5.758 -.035
e22 <--> e29 9.697 -.041
e22 <--> e41 7.187 .038
e22 <--> e21 6.623 -.025
e22 <--> e20 5.526 -.022
e22 <--> e17 5.395 .030
e22 <--> e13 11.780 .046
e23 <--> e33 11.936 -.032
e23 <--> e31 4.038 .018
e23 <--> e22 20.323 .039
e24 <--> FC 4.526 .018
e24 <--> e46 8.809 -.036
e24 <--> e33 5.168 .021
e24 <--> e32 4.098 -.017
e24 <--> e30 5.097 -.026
e24 <--> e26 8.202 -.038
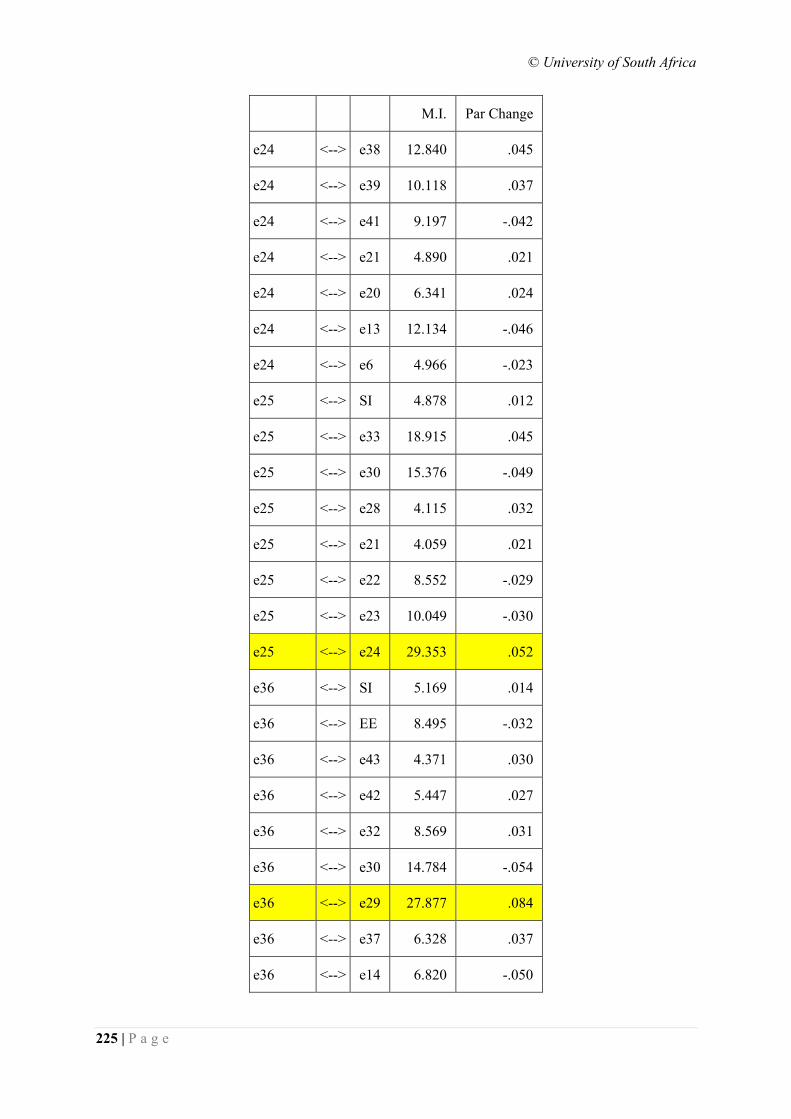
© University of South Africa
225 | P a g e
M.I. Par Change
e24 <--> e38 12.840 .045
e24 <--> e39 10.118 .037
e24 <--> e41 9.197 -.042
e24 <--> e21 4.890 .021
e24 <--> e20 6.341 .024
e24 <--> e13 12.134 -.046
e24 <--> e6 4.966 -.023
e25 <--> SI 4.878 .012
e25 <--> e33 18.915 .045
e25 <--> e30 15.376 -.049
e25 <--> e28 4.115 .032
e25 <--> e21 4.059 .021
e25 <--> e22 8.552 -.029
e25 <--> e23 10.049 -.030
e25 <--> e24 29.353 .052
e36 <--> SI 5.169 .014
e36 <--> EE 8.495 -.032
e36 <--> e43 4.371 .030
e36 <--> e42 5.447 .027
e36 <--> e32 8.569 .031
e36 <--> e30 14.784 -.054
e36 <--> e29 27.877 .084
e36 <--> e37 6.328 .037
e36 <--> e14 6.820 -.050
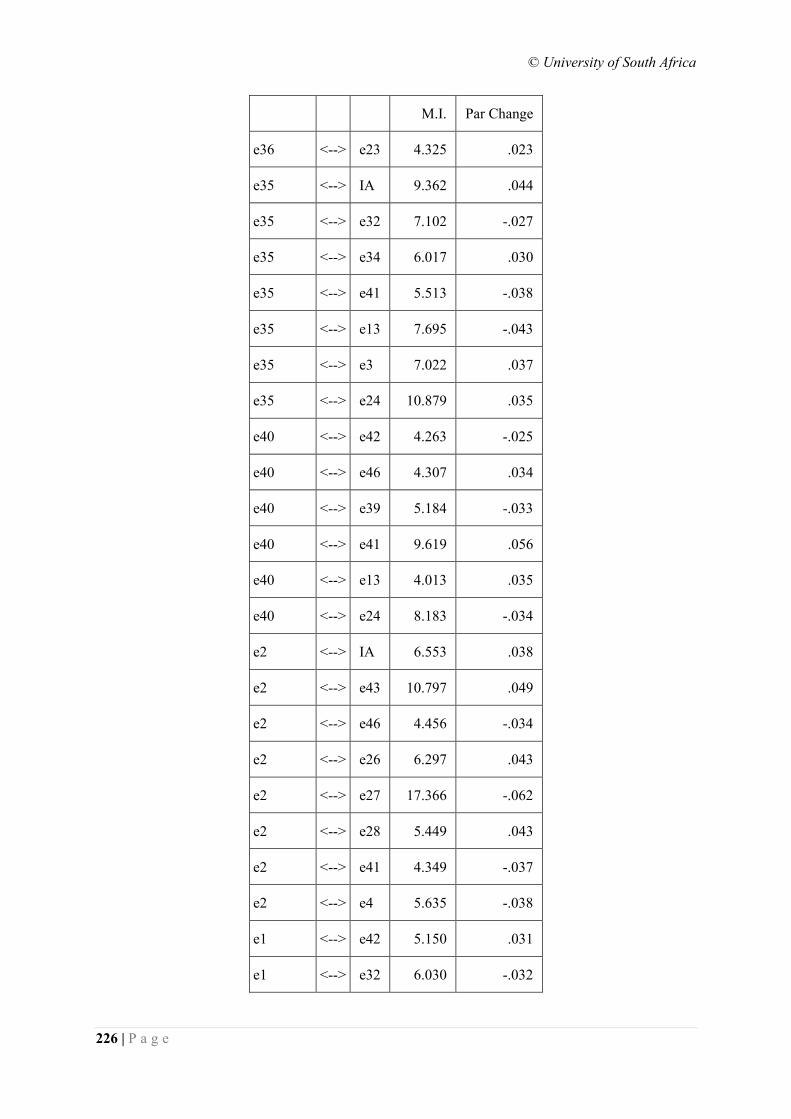
© University of South Africa
226 | P a g e
M.I. Par Change
e36 <--> e23 4.325 .023
e35 <--> IA 9.362 .044
e35 <--> e32 7.102 -.027
e35 <--> e34 6.017 .030
e35 <--> e41 5.513 -.038
e35 <--> e13 7.695 -.043
e35 <--> e3 7.022 .037
e35 <--> e24 10.879 .035
e40 <--> e42 4.263 -.025
e40 <--> e46 4.307 .034
e40 <--> e39 5.184 -.033
e40 <--> e41 9.619 .056
e40 <--> e13 4.013 .035
e40 <--> e24 8.183 -.034
e2 <--> IA 6.553 .038
e2 <--> e43 10.797 .049
e2 <--> e46 4.456 -.034
e2 <--> e26 6.297 .043
e2 <--> e27 17.366 -.062
e2 <--> e28 5.449 .043
e2 <--> e41 4.349 -.037
e2 <--> e4 5.635 -.038
e1 <--> e42 5.150 .031
e1 <--> e32 6.030 -.032
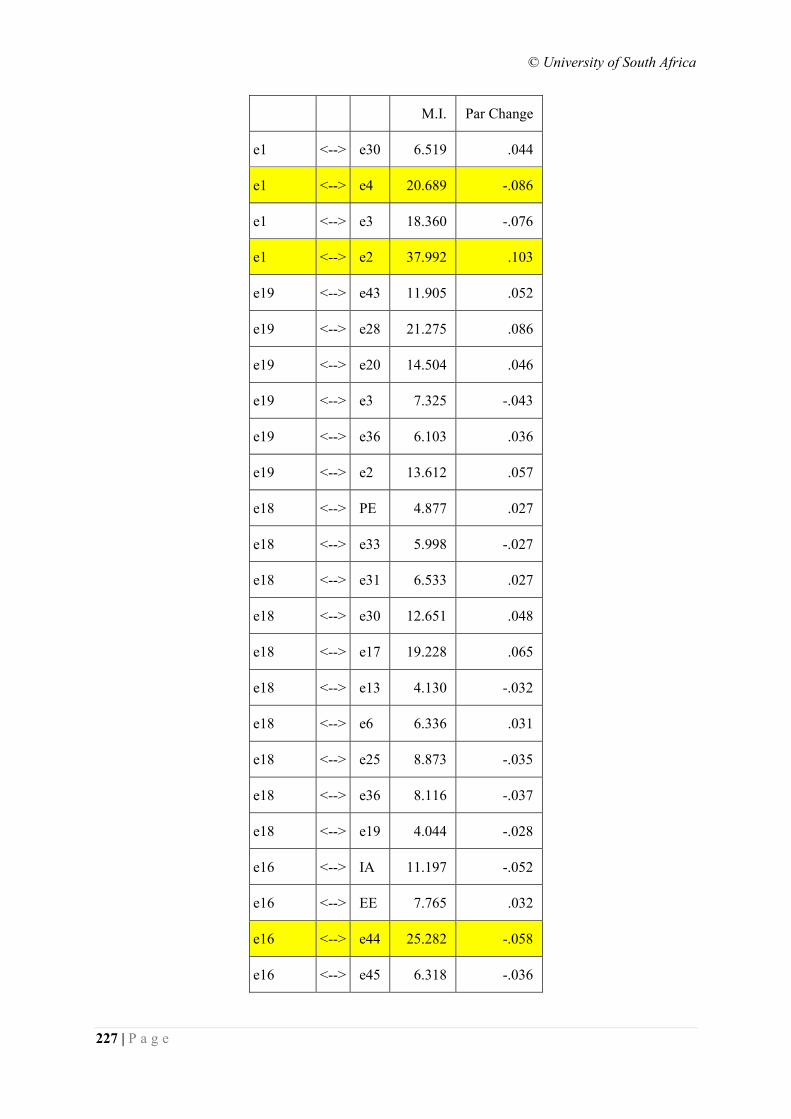
© University of South Africa
227 | P a g e
M.I. Par Change
e1 <--> e30 6.519 .044
e1 <--> e4 20.689 -.086
e1 <--> e3 18.360 -.076
e1 <--> e2 37.992 .103
e19 <--> e43 11.905 .052
e19 <--> e28 21.275 .086
e19 <--> e20 14.504 .046
e19 <--> e3 7.325 -.043
e19 <--> e36 6.103 .036
e19 <--> e2 13.612 .057
e18 <--> PE 4.877 .027
e18 <--> e33 5.998 -.027
e18 <--> e31 6.533 .027
e18 <--> e30 12.651 .048
e18 <--> e17 19.228 .065
e18 <--> e13 4.130 -.032
e18 <--> e6 6.336 .031
e18 <--> e25 8.873 -.035
e18 <--> e36 8.116 -.037
e18 <--> e19 4.044 -.028
e16 <--> IA 11.197 -.052
e16 <--> EE 7.765 .032
e16 <--> e44 25.282 -.058
e16 <--> e45 6.318 -.036
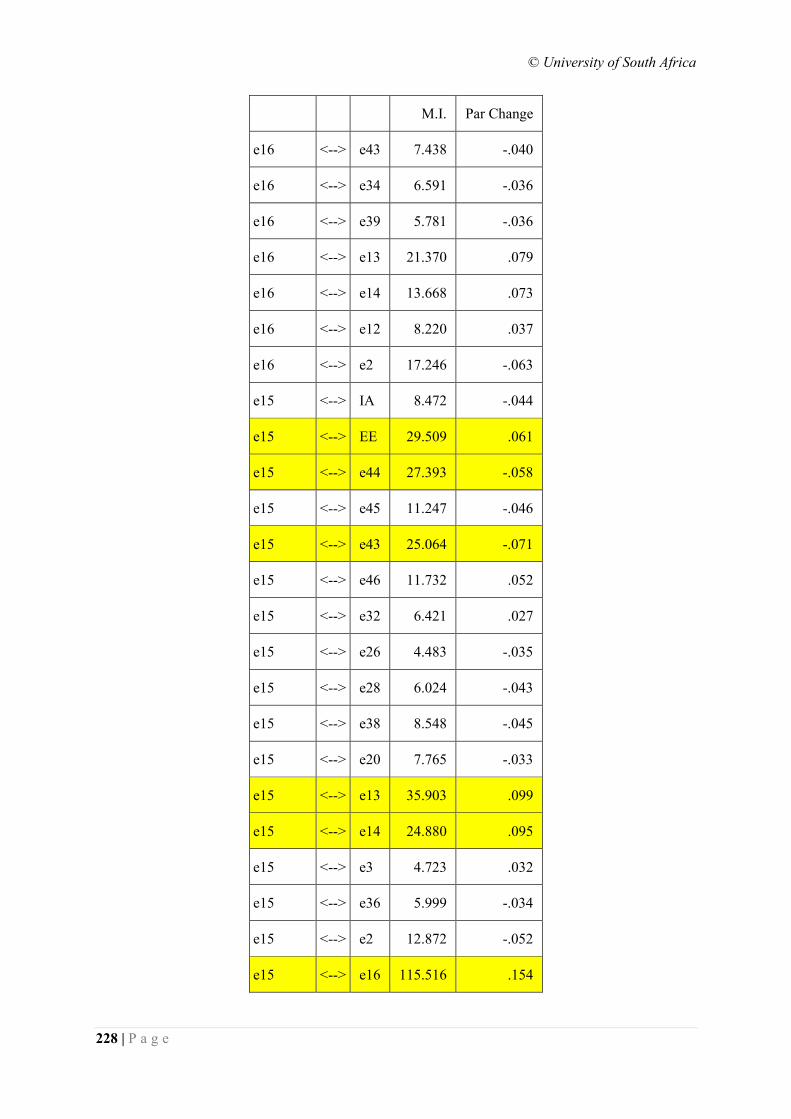
© University of South Africa
228 | P a g e
M.I. Par Change
e16 <--> e43 7.438 -.040
e16 <--> e34 6.591 -.036
e16 <--> e39 5.781 -.036
e16 <--> e13 21.370 .079
e16 <--> e14 13.668 .073
e16 <--> e12 8.220 .037
e16 <--> e2 17.246 -.063
e15 <--> IA 8.472 -.044
e15 <--> EE 29.509 .061
e15 <--> e44 27.393 -.058
e15 <--> e45 11.247 -.046
e15 <--> e43 25.064 -.071
e15 <--> e46 11.732 .052
e15 <--> e32 6.421 .027
e15 <--> e26 4.483 -.035
e15 <--> e28 6.024 -.043
e15 <--> e38 8.548 -.045
e15 <--> e20 7.765 -.033
e15 <--> e13 35.903 .099
e15 <--> e14 24.880 .095
e15 <--> e3 4.723 .032
e15 <--> e36 5.999 -.034
e15 <--> e2 12.872 -.052
e15 <--> e16 115.516 .154
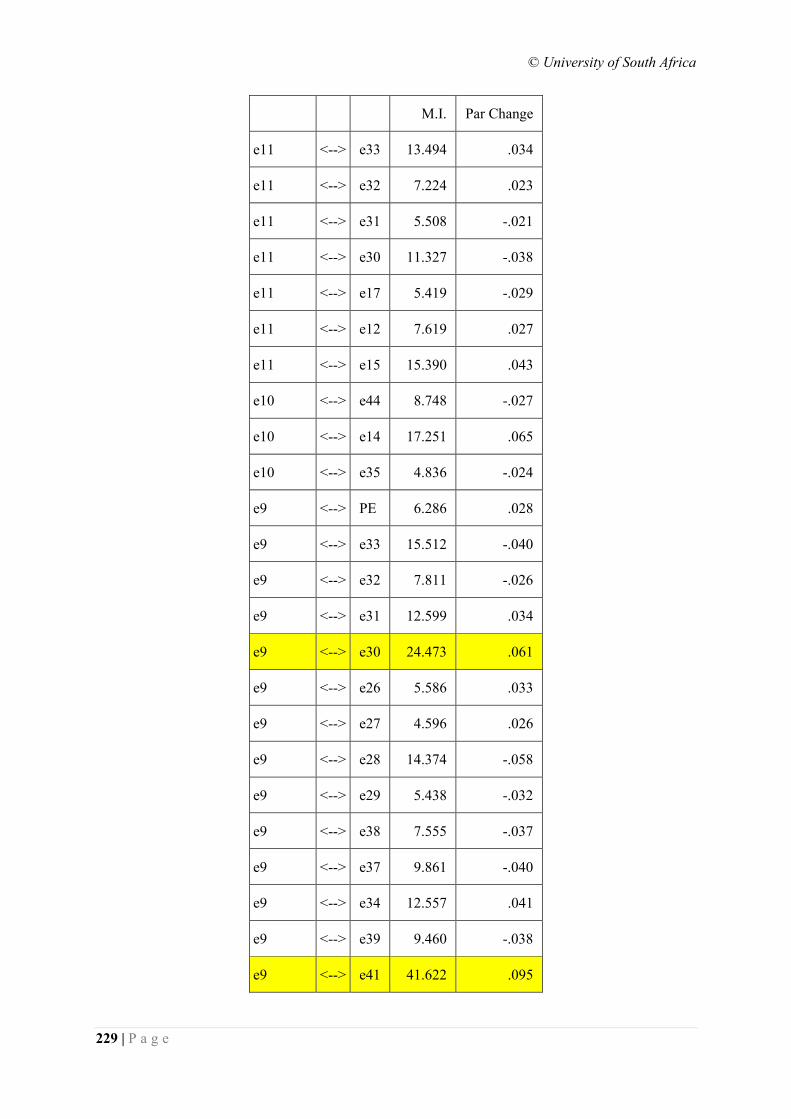
© University of South Africa
229 | P a g e
M.I. Par Change
e11 <--> e33 13.494 .034
e11 <--> e32 7.224 .023
e11 <--> e31 5.508 -.021
e11 <--> e30 11.327 -.038
e11 <--> e17 5.419 -.029
e11 <--> e12 7.619 .027
e11 <--> e15 15.390 .043
e10 <--> e44 8.748 -.027
e10 <--> e14 17.251 .065
e10 <--> e35 4.836 -.024
e9 <--> PE 6.286 .028
e9 <--> e33 15.512 -.040
e9 <--> e32 7.811 -.026
e9 <--> e31 12.599 .034
e9 <--> e30 24.473 .061
e9 <--> e26 5.586 .033
e9 <--> e27 4.596 .026
e9 <--> e28 14.374 -.058
e9 <--> e29 5.438 -.032
e9 <--> e38 7.555 -.037
e9 <--> e37 9.861 -.040
e9 <--> e34 12.557 .041
e9 <--> e39 9.460 -.038
e9 <--> e41 41.622 .095
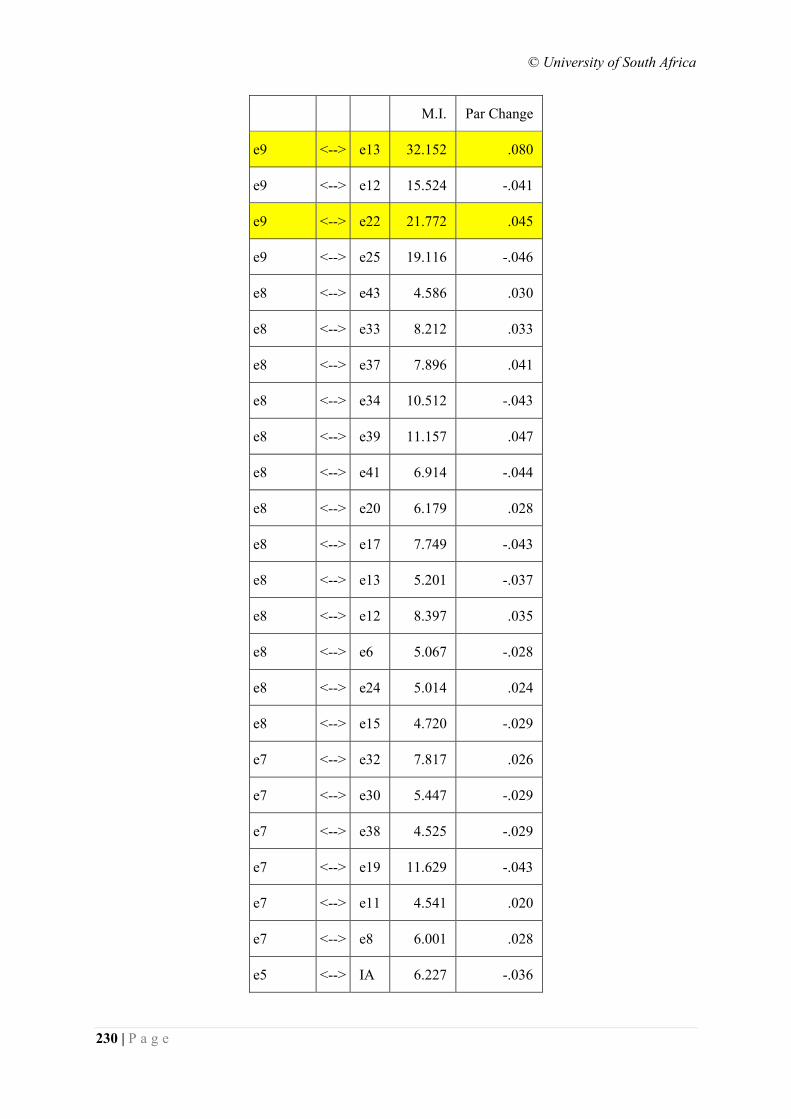
© University of South Africa
230 | P a g e
M.I. Par Change
e9 <--> e13 32.152 .080
e9 <--> e12 15.524 -.041
e9 <--> e22 21.772 .045
e9 <--> e25 19.116 -.046
e8 <--> e43 4.586 .030
e8 <--> e33 8.212 .033
e8 <--> e37 7.896 .041
e8 <--> e34 10.512 -.043
e8 <--> e39 11.157 .047
e8 <--> e41 6.914 -.044
e8 <--> e20 6.179 .028
e8 <--> e17 7.749 -.043
e8 <--> e13 5.201 -.037
e8 <--> e12 8.397 .035
e8 <--> e6 5.067 -.028
e8 <--> e24 5.014 .024
e8 <--> e15 4.720 -.029
e7 <--> e32 7.817 .026
e7 <--> e30 5.447 -.029
e7 <--> e38 4.525 -.029
e7 <--> e19 11.629 -.043
e7 <--> e11 4.541 .020
e7 <--> e8 6.001 .028
e5 <--> IA 6.227 -.036
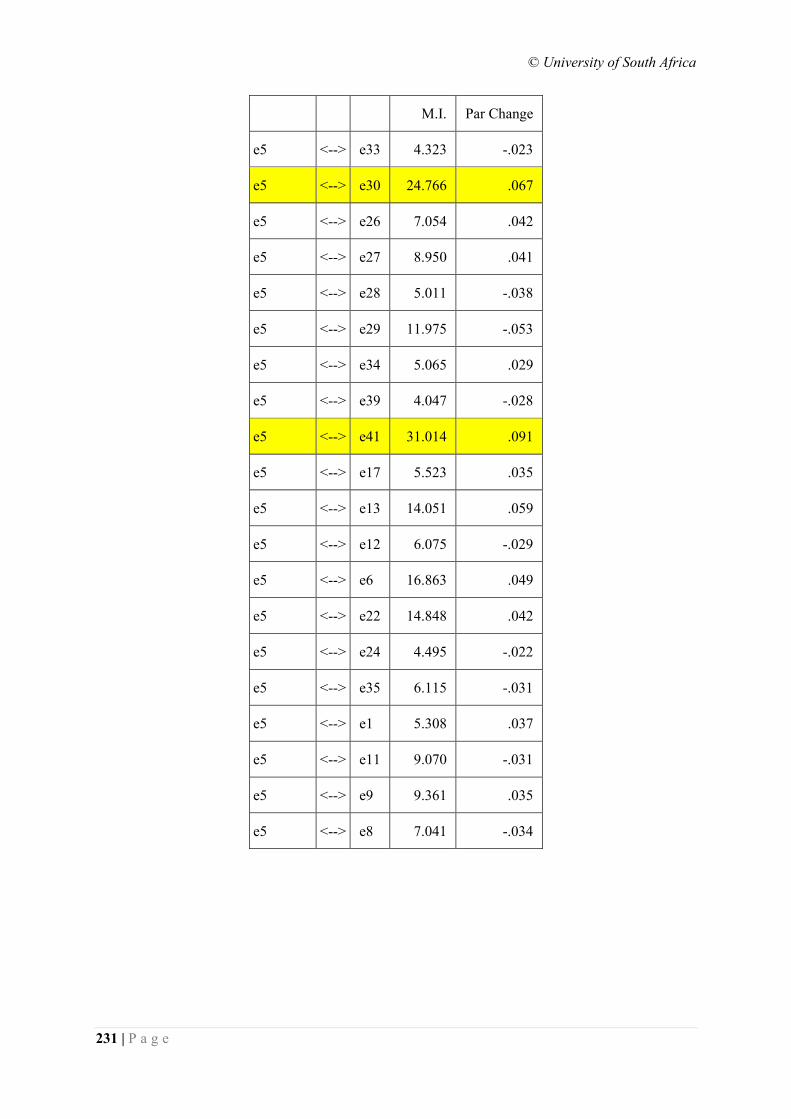
© University of South Africa
231 | P a g e
M.I. Par Change
e5 <--> e33 4.323 -.023
e5 <--> e30 24.766 .067
e5 <--> e26 7.054 .042
e5 <--> e27 8.950 .041
e5 <--> e28 5.011 -.038
e5 <--> e29 11.975 -.053
e5 <--> e34 5.065 .029
e5 <--> e39 4.047 -.028
e5 <--> e41 31.014 .091
e5 <--> e17 5.523 .035
e5 <--> e13 14.051 .059
e5 <--> e12 6.075 -.029
e5 <--> e6 16.863 .049
e5 <--> e22 14.848 .042
e5 <--> e24 4.495 -.022
e5 <--> e35 6.115 -.031
e5 <--> e1 5.308 .037
e5 <--> e11 9.070 -.031
e5 <--> e9 9.361 .035
e5 <--> e8 7.041 -.034
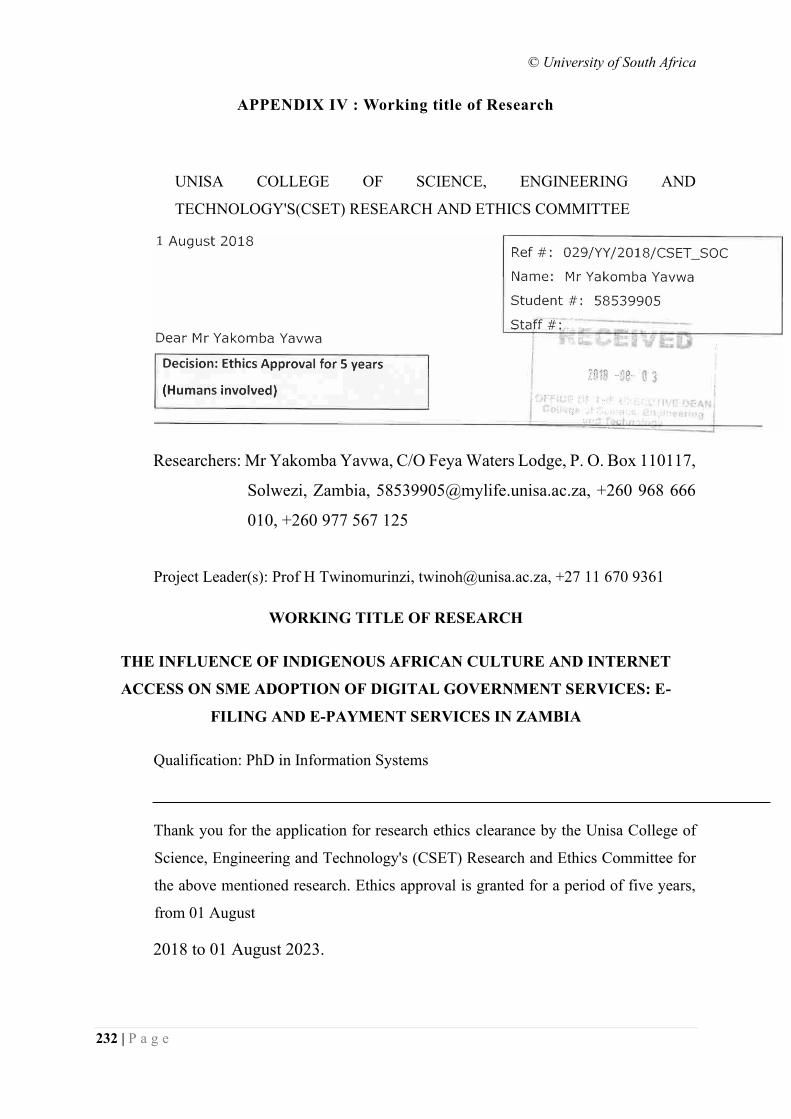
© University of South Africa
232 | P a g e
APPENDIX IV : Working title of Research
UNISA COLLEGE OF SCIENCE, ENGINEERING AND
TECHNOLOGY'S(CSET) RESEARCH AND ETHICS COMMITTEE
Researchers: Mr Yakomba Yavwa, C/O Feya Waters Lodge, P. O. Box 110117,
Solwezi, Zambia, [email protected], +260 968 666
010, +260 977 567 125
Project Leader(s): Prof H Twinomurinzi, [email protected], +27 11 670 9361
WORKING TITLE OF RESEARCH
THE INFLUENCE OF INDIGENOUS AFRICAN CULTURE AND INTERNET
ACCESS ON SME ADOPTION OF DIGITAL GOVERNMENT SERVICES: E-
FILING AND E-PAYMENT SERVICES IN ZAMBIA
Qualification: PhD in Information Systems
Thank you for the application for research ethics clearance by the Unisa College of
Science, Engineering and Technology's (CSET) Research and Ethics Committee for
the above mentioned research. Ethics approval is granted for a period of five years,
from 01 August
2018 to 01 August 2023.
© University of South Africa
233 | P a g e
1
.
2.
The researcher will ensure that the research project adheres to the values and principles
expressed in the UNISA Policy on Research Ethics.
Any adverse circumstance arising in the undertaking of the research project that is
relevant to the ethicality of the study, as well as changes in the methodology, should be
communicated in writing to the Unisa College of Science, Engineering and
Technology's (CSET) Research and Ethics Committee. An amended application could
be requested if there are substantial changes from the existing proposal, especially if
those changes affect any of the study-related risks for the research participants.
3. The researcher(s) will conduct the study according to the methods and procedures set
out in the approved application.
4. Any changes that can affect the study-related risks for the research participants,
particularly in terms of assurances made with regards to the protection of participants'
privacy and the confidentiality of the data, should be reported to the Committee in
writing, accompanied by a progress report.
5. The researcher will ensure that the research project adheres to any applicable national
legislation, professional codes of conduct, institutional guidelines and scientific
standards relevant to the specific field of study. Adherence to the following
South African legislation is important, if applicable: Protection of Personal Information
Act, no 4 of 2013; Children's act no 38 of 2005 and the National Health Act, no 61 of
2003.
6. Only de-identified research data may be used for secondary research purposes in future
on condition that the research objectives are similar to those of the original research.
Secondary use of identifiable human research data requires additional ethics clearance.
7. No field work activities may continue after the expiry date (01 August 2023).
Submission of a completed research ethics progress report will constitute an
application for renewal of Ethics Research Committee approval.
8. Field work activities may only commence from the date on this ethics certificate.
Note:
The reference number 029/YY/2018/CSET SOC should be clearly indicated on al/ forms of
communication with the intended research participants, as well as with the Unisa College of Science,
Engineering and Technology's (CSET) Research and Ethics Committee.
Yours sincerely
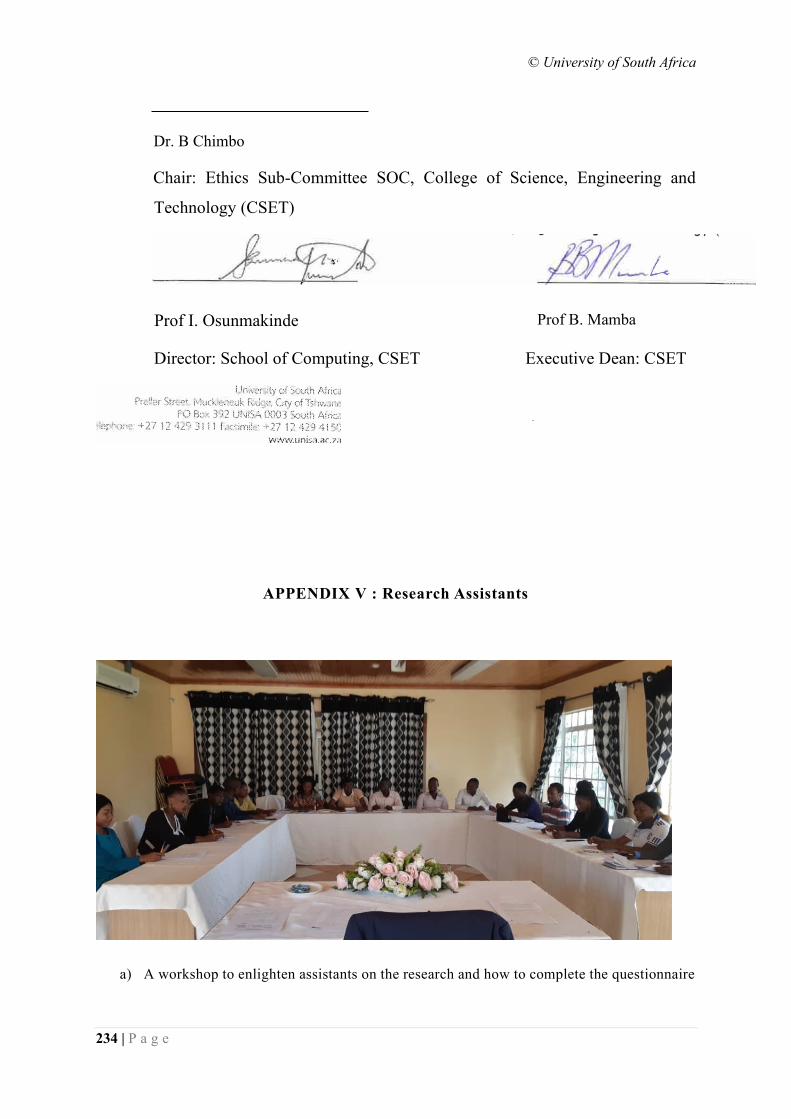
© University of South Africa
234 | P a g e
Dr. B Chimbo
Chair: Ethics Sub-Committee SOC, College of Science, Engineering and
Technology (CSET)
Prof I. Osunmakinde Prof B. Mamba
Director: School of Computing, CSET Executive Dean: CSET
APPENDIX V : Research Assistants
a) A workshop to enlighten assistants on the research and how to complete the questionnaire
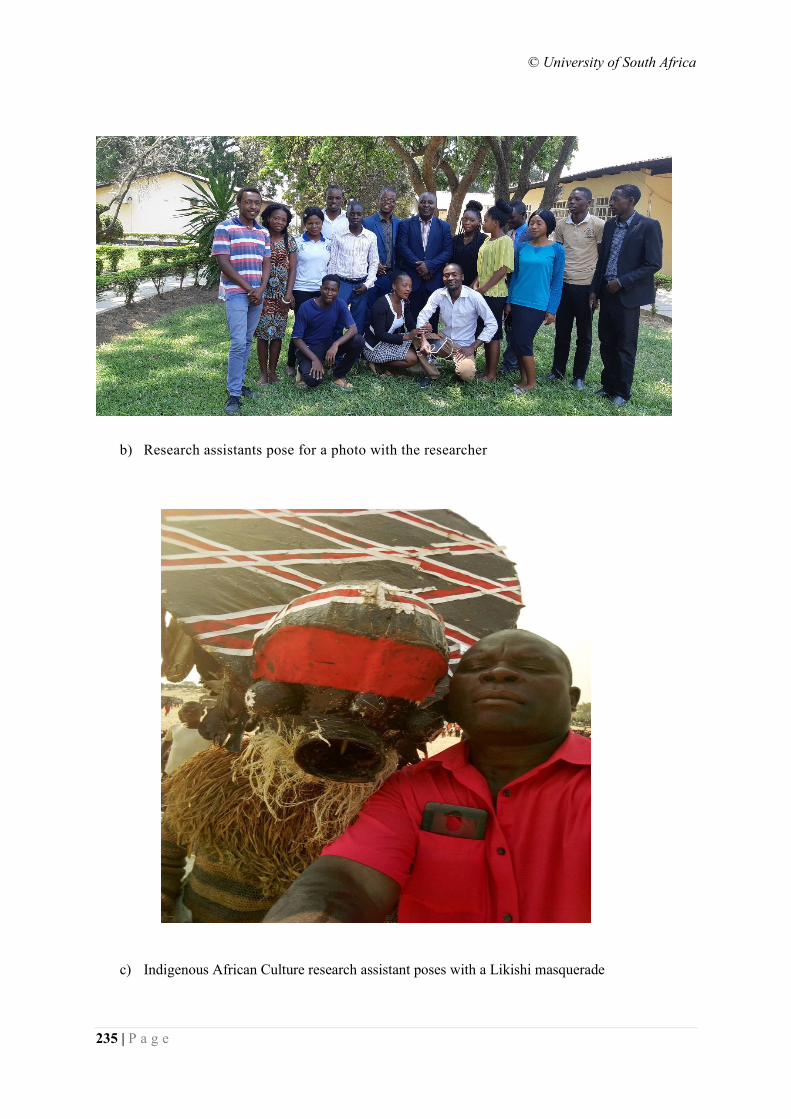
© University of South Africa
235 | P a g e
b) Research assistants pose for a photo with the researcher
c) Indigenous African Culture research assistant poses with a Likishi masquerade
© University of South Africa
236 | P a g e
APPENDIX VI : SLR Search Terms
The combination of search terms is outlined below.
[Unit of Analysis] AND [Technology Artefact] AND [Phenomenon of Interest]
1. Culture AND Digital government
2. Culture AND e-government
3. Culture AND egovernment
4. Culture AND e-gov
5. Culture AND e-governance
6. Culture AND Digital government AND Adoption
7. Culture AND e-government AND Adoption
8. Culture AND electronic government AND Adoption
9. Culture AND e-gov AND Adoption
10. Culture AND e-governance AND Adoption
11. Culture AND e government AND Adoption
12. Culture AND Digital government AND Acceptance
13. Culture AND e-government AND Acceptance
14. Culture AND electronic government AND Acceptance
15. Culture AND e-gov AND Acceptance
16. Culture AND e-governance AND Acceptance
17. Culture AND e government AND Acceptance
18. Culture AND Digital government AND Usage
19. Culture AND e-government AND Usage
20. Culture AND electronic government AND Usage
21. Culture AND e-gov AND Usage
22. Culture AND e-governance AND Usage
23. Culture AND e government AND Usage
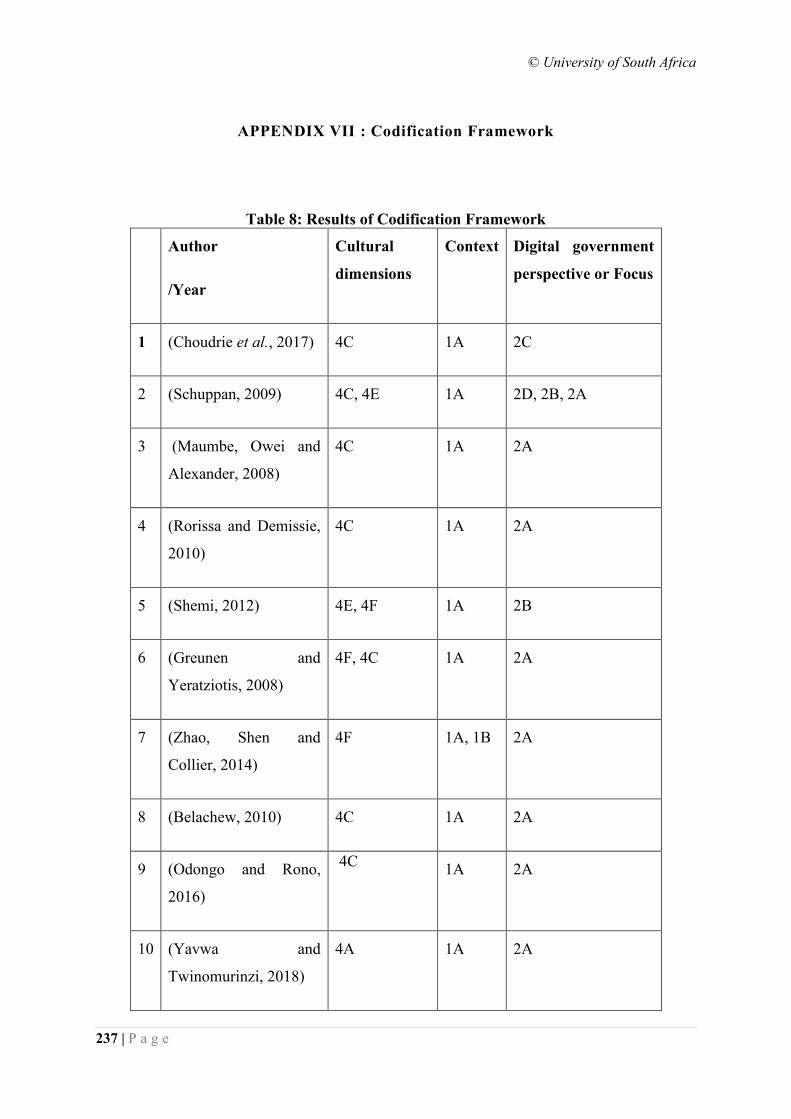
© University of South Africa
237 | P a g e
APPENDIX VII : Codification Framework
Table 8: Results of Codification Framework
Author
/Year
Cultural
dimensions
Context Digital government
perspective or Focus
1 (Choudrie et al., 2017) 4C 1A 2C
2 (Schuppan, 2009) 4C, 4E 1A 2D, 2B, 2A
3 (Maumbe, Owei and
Alexander, 2008)
4C 1A 2A
4 (Rorissa and Demissie,
2010)
4C 1A 2A
5 (Shemi, 2012) 4E, 4F 1A 2B
6 (Greunen and
Yeratziotis, 2008)
4F, 4C 1A 2A
7 (Zhao, Shen and
Collier, 2014)
4F 1A, 1B 2A
8 (Belachew, 2010) 4C 1A 2A
9 (Odongo and Rono,
2016)
4C 1A 2A
10 (Yavwa and
Twinomurinzi, 2018)
4A 1A 2A
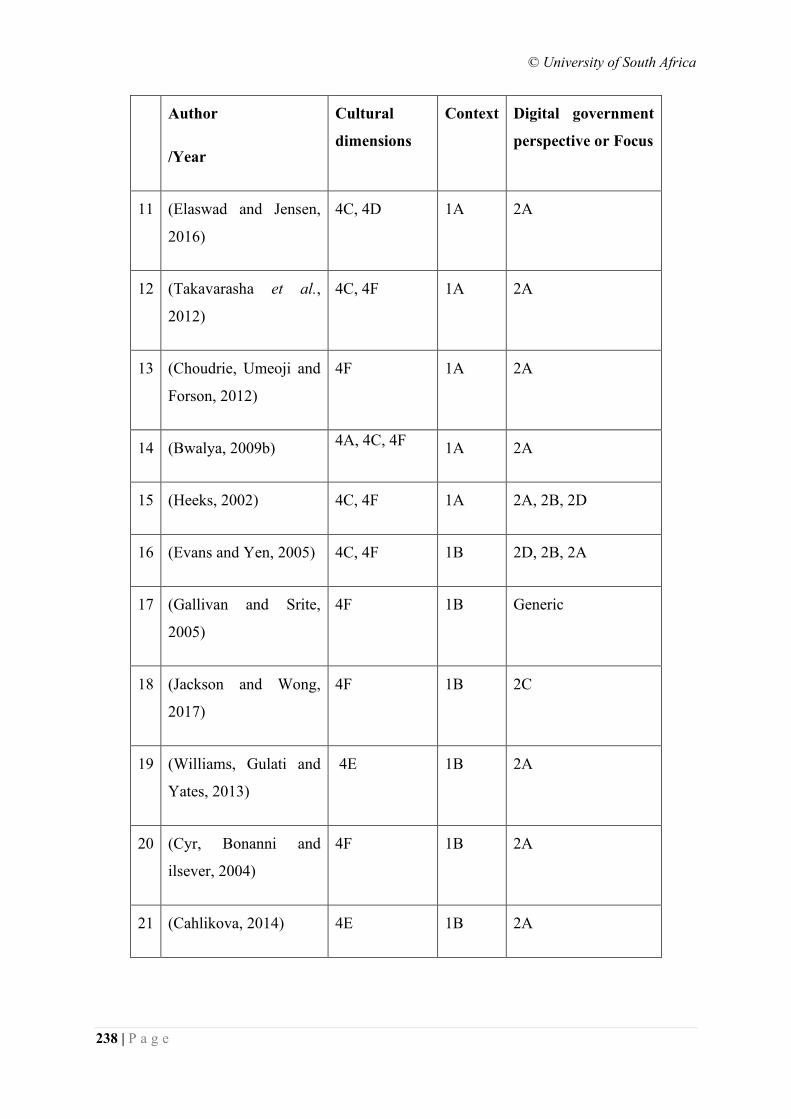
© University of South Africa
238 | P a g e
Author
/Year
Cultural
dimensions
Context Digital government
perspective or Focus
11 (Elaswad and Jensen,
2016)
4C, 4D 1A 2A
12 (Takavarasha et al.,
2012)
4C, 4F 1A 2A
13 (Choudrie, Umeoji and
Forson, 2012)
4F 1A 2A
14 (Bwalya, 2009b) 4A, 4C, 4F
1A 2A
15 (Heeks, 2002) 4C, 4F 1A 2A, 2B, 2D
16 (Evans and Yen, 2005) 4C, 4F 1B 2D, 2B, 2A
17 (Gallivan and Srite,
2005)
4F 1B Generic
18 (Jackson and Wong,
2017)
4F 1B 2C
19 (Williams, Gulati and
Yates, 2013)
4E 1B 2A
20 (Cyr, Bonanni and
ilsever, 2004)
4F 1B 2A
21 (Cahlikova, 2014) 4E 1B 2A
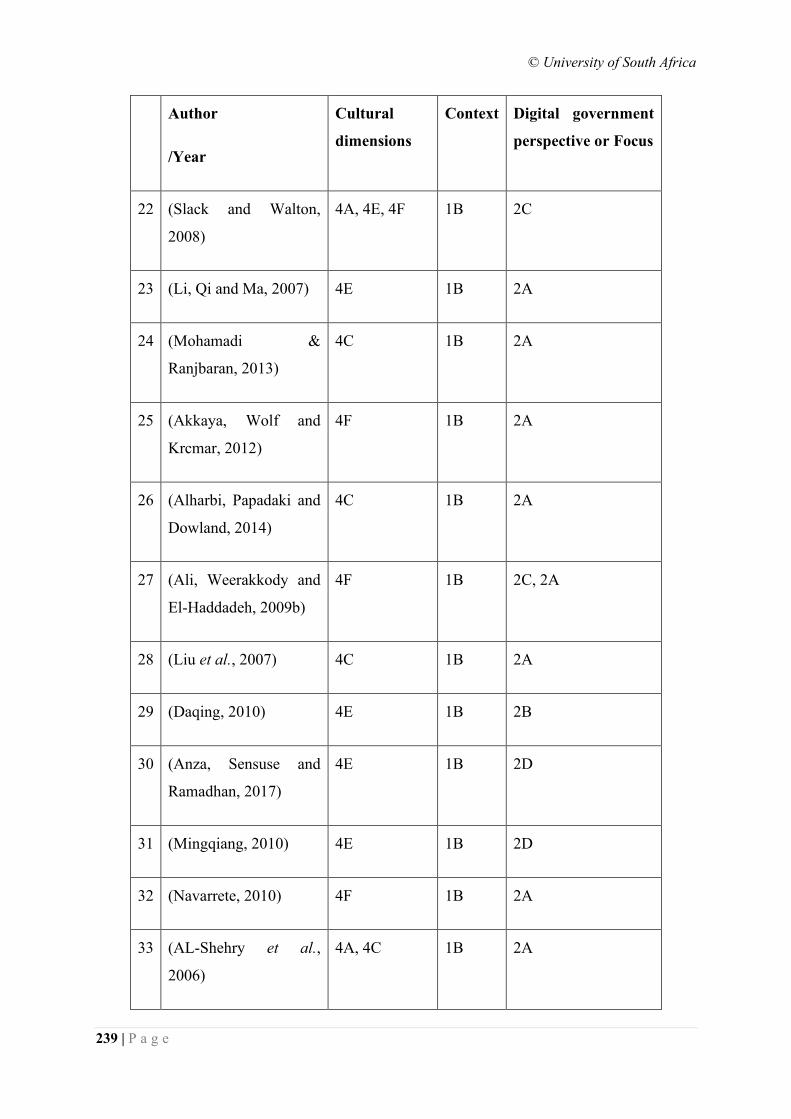
© University of South Africa
239 | P a g e
Author
/Year
Cultural
dimensions
Context Digital government
perspective or Focus
22 (Slack and Walton,
2008)
4A, 4E, 4F 1B 2C
23 (Li, Qi and Ma, 2007) 4E 1B 2A
24 (Mohamadi &
Ranjbaran, 2013)
4C 1B 2A
25 (Akkaya, Wolf and
Krcmar, 2012)
4F 1B 2A
26 (Alharbi, Papadaki and
Dowland, 2014)
4C 1B 2A
27 (Ali, Weerakkody and
El-Haddadeh, 2009b)
4F 1B 2C, 2A
28 (Liu et al., 2007) 4C 1B 2A
29 (Daqing, 2010) 4E 1B 2B
30 (Anza, Sensuse and
Ramadhan, 2017)
4E 1B 2D
31 (Mingqiang, 2010) 4E 1B 2D
32 (Navarrete, 2010) 4F 1B 2A
33 (AL-Shehry et al.,
2006)
4A, 4C 1B 2A
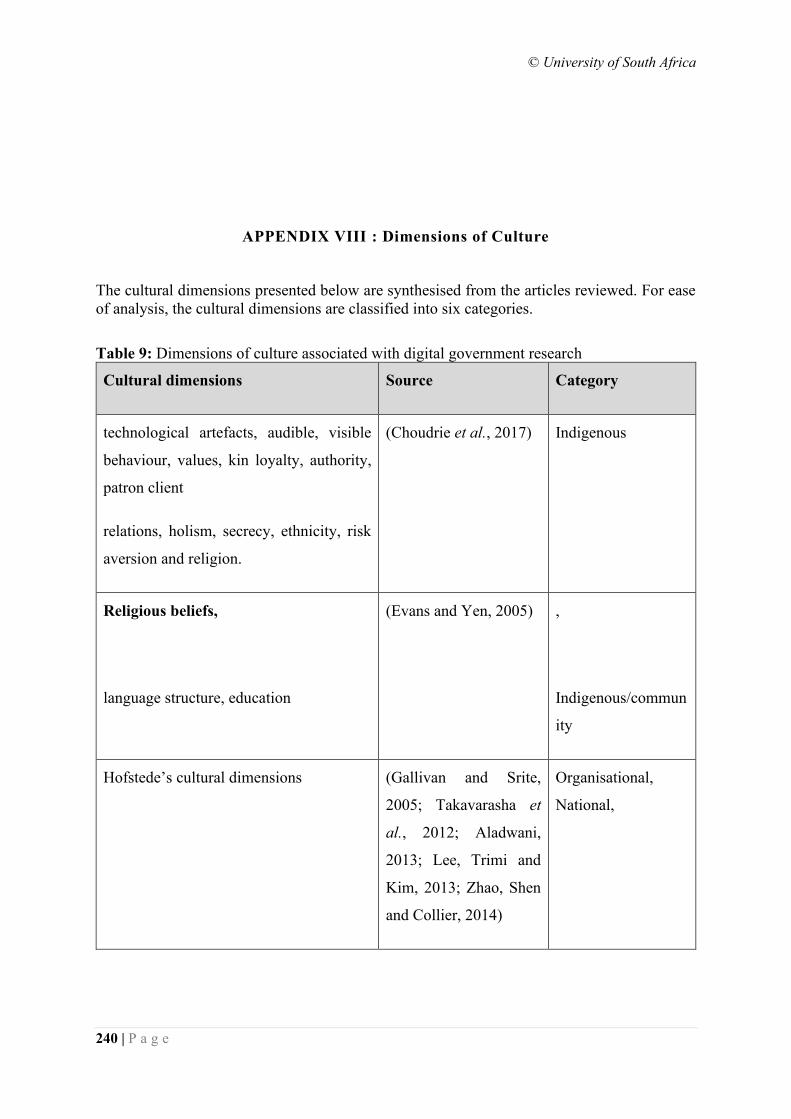
© University of South Africa
240 | P a g e
APPENDIX VIII : Dimensions of Culture
The cultural dimensions presented below are synthesised from the articles reviewed. For ease
of analysis, the cultural dimensions are classified into six categories.
Table 9: Dimensions of culture associated with digital government research
Cultural dimensions Source Category
technological artefacts, audible, visible
behaviour, values, kin loyalty, authority,
patron client
relations, holism, secrecy, ethnicity, risk
aversion and religion.
(Choudrie et al., 2017) Indigenous
Religious beliefs,
language structure, education
(Evans and Yen, 2005) ,
Indigenous/commun
ity
Hofstede’s cultural dimensions (Gallivan and Srite,
2005; Takavarasha et
al., 2012; Aladwani,
2013; Lee, Trimi and
Kim, 2013; Zhao, Shen
and Collier, 2014)
Organisational,
National,
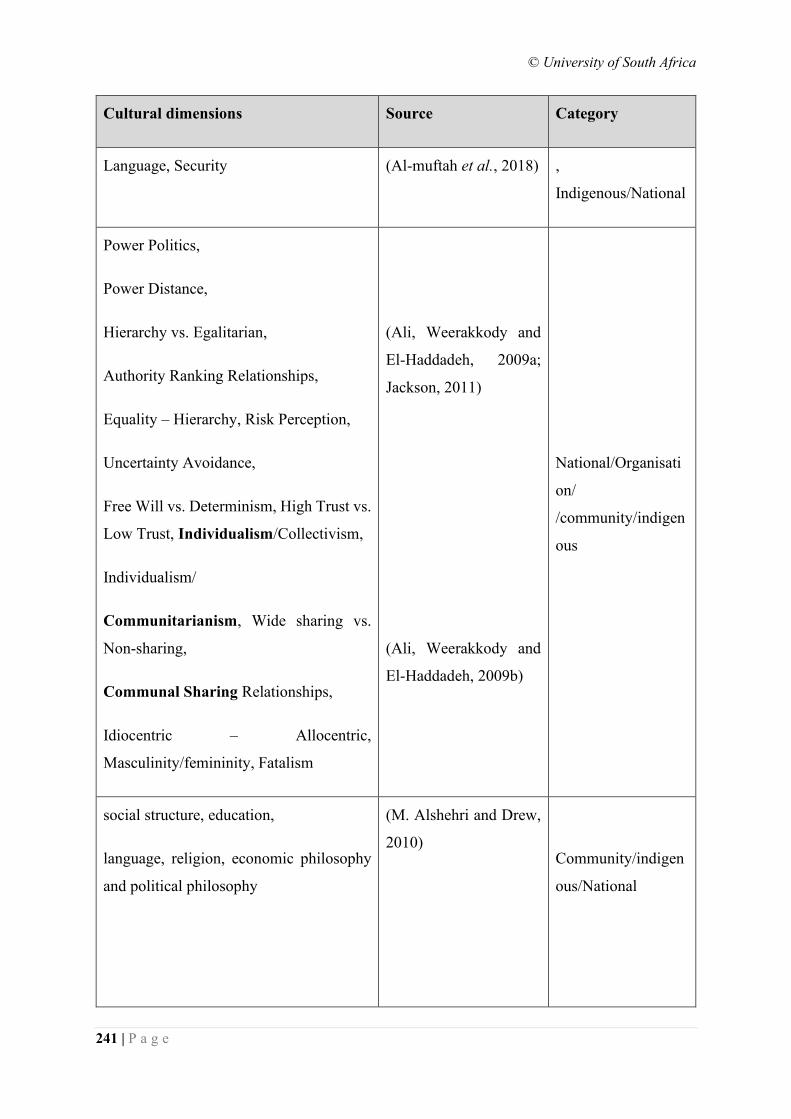
© University of South Africa
241 | P a g e
Cultural dimensions Source Category
Language, Security (Al-muftah et al., 2018) ,
Indigenous/National
Power Politics,
Power Distance,
Hierarchy vs. Egalitarian,
Authority Ranking Relationships,
Equality – Hierarchy, Risk Perception,
Uncertainty Avoidance,
Free Will vs. Determinism, High Trust vs.
Low Trust, Individualism/Collectivism,
Individualism/
Communitarianism, Wide sharing vs.
Non-sharing,
Communal Sharing Relationships,
Idiocentric – Allocentric,
Masculinity/femininity, Fatalism
(Ali, Weerakkody and
El-Haddadeh, 2009a;
Jackson, 2011)
(Ali, Weerakkody and
El-Haddadeh, 2009b)
National/Organisati
on/
/community/indigen
ous
social structure, education,
language, religion, economic philosophy
and political philosophy
(M. Alshehri and Drew,
2010)
Community/indigen
ous/National
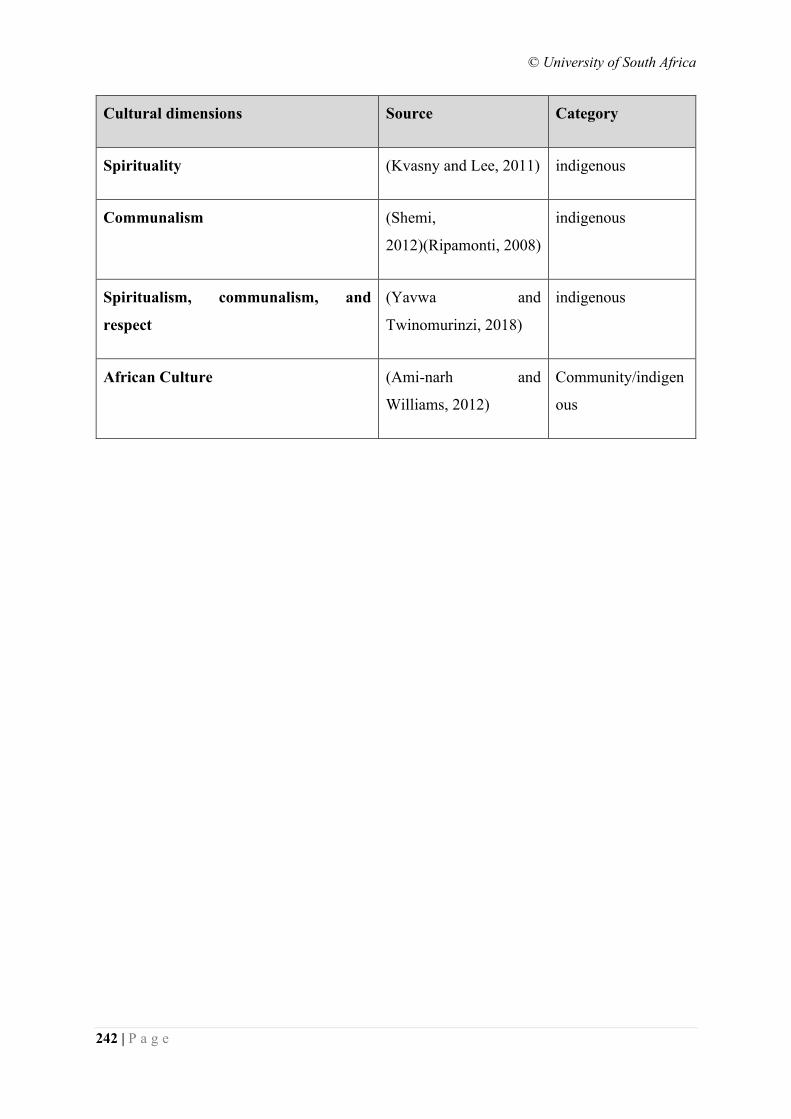
© University of South Africa
242 | P a g e
Cultural dimensions Source Category
Spirituality (Kvasny and Lee, 2011) indigenous
Communalism (Shemi,
2012)(Ripamonti, 2008)
indigenous
Spiritualism, communalism, and
respect
(Yavwa and
Twinomurinzi, 2018)
indigenous
African Culture (Ami-narh and
Williams, 2012)
Community/indigen
ous