© Institute for Fiscal Studies
LACEA-LAMES 2019Invited Session
Santiago Levy ChairRichard Blundell Inequality, Redistribution and the Labour Market
Orazio Attanasio Inequality and Human DevelopmentTim Besley Inequality: Some Political Economy Issues
First, a little background to the Review…….https://www.ifs.org.uk/inequality/
The IFS Deaton Review:Inequalities in the 21st Century

An ambitious 5-year study of inequality
Bringing together the best available evidence from across the social
sciences to answer the big questions:
• Which inequalities matter most?
• How are different kids of inequality related?
• What are the underlying forces that come together to create them?
• What is the right mix of policies to tackle adverse inequalities?
• For developed economies with the UK as the running example, but comparative in nature….
The IFS Deaton Review:Inequalities in the 21st Century
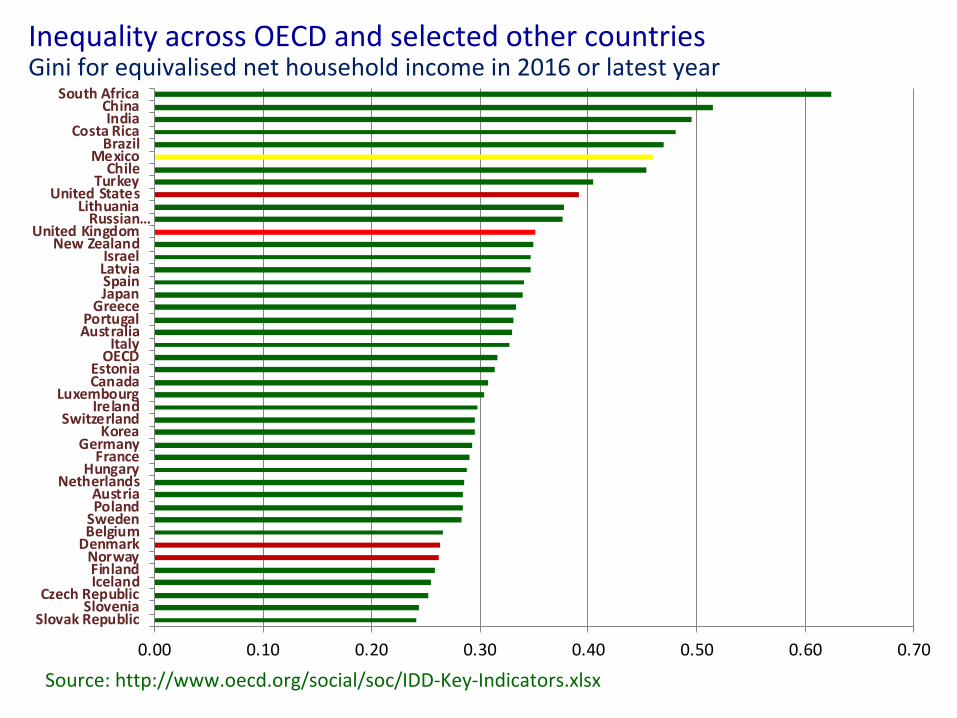
Inequality across OECD and selected other countries Gini for equivalised net household income in 2016 or latest year
0.00 0.10 0.20 0.30 0.40 0.50 0.60 0.70
Slovak RepublicSlovenia
Czech RepublicIcelandFinlandNorway
DenmarkBelgiumSwedenPolandAustria
NetherlandsHungary
FranceGermany
KoreaSwitzerland
IrelandLuxembourg
CanadaEstonia
OECDItaly
AustraliaPortugal
GreeceJapanSpainLatviaIsrael
New ZealandUnited Kingdom
Russian…Lithuania
United StatesTurkey
ChileMexico
BrazilCosta Rica
IndiaChina
South Africa
Source: http://www.oecd.org/social/soc/IDD-Key-Indicators.xlsx
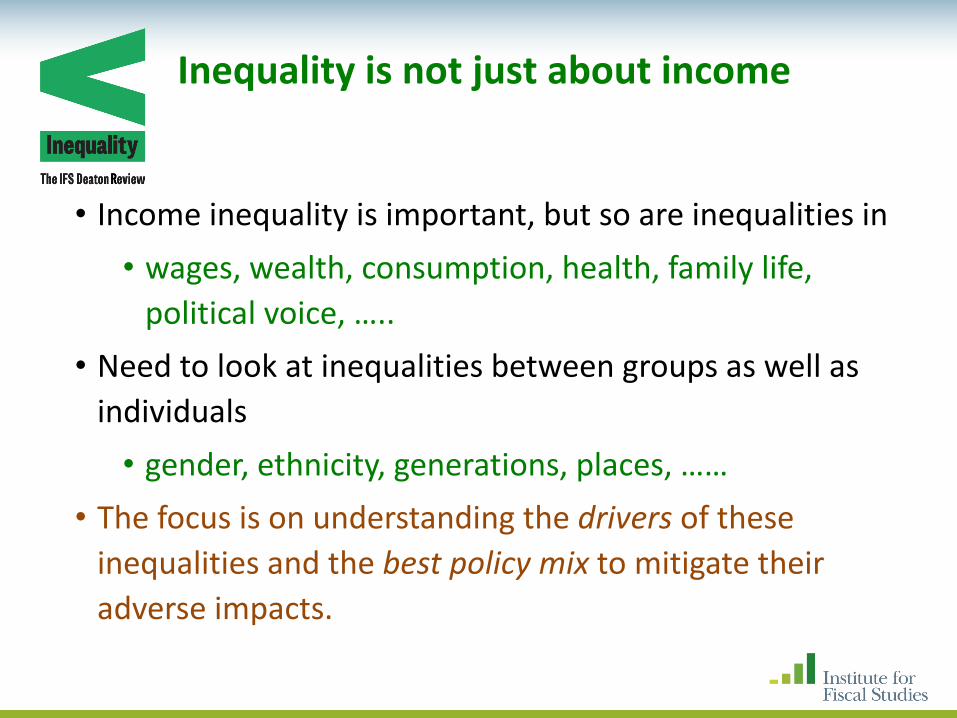
Inequality is not just about income
• Income inequality is important, but so are inequalities in • wages, wealth, consumption, health, family life,
political voice, …..• Need to look at inequalities between groups as well as
individuals• gender, ethnicity, generations, places, ……
• The focus is on understanding the drivers of these inequalities and the best policy mix to mitigate their adverse impacts.

Chair
Panel
Angus DeatonPrinceton University
Orazio AttanasioIFS & Yale
James BanksIFS & Manchester University
Lisa BerkmanHarvard University
Tim BesleyLondon School of Economics
Richard BlundellIFS & UCL
Pinelopi GoldbergYale University & World Bank
Paul JohnsonIFS & UCL
Robert JoyceIFS
Kathleen KiernanUniversity of York
Lucinda PlattLondon School of Economics
Debra SatzStanford University
Jean TiroleToulouse School of Economics
Imran RasulIUCL & IFS
The IFS Deaton Review: An International Panel

Format of the Review
Much like the Mirrlees Review, this Review will be published in two volumes:
I. A volume of commissioned studies and commentaries• detailed studies on different aspects of inequality, with
commentaries that offer complementary perspectives or alternative views.
II. A book written by the panel, aimed at the general public• sets out what has happened to inequality, why, and what can
be done.• With a sequence of workshops and public policy events…
Hopefully, joining with CORE economics curriculum too.
1. Why inequality, what inequality?
2. Political economy and political polarisation
3. Attitudes to inequality
4. Gender
5. Immigration
6. Health
7. Race and criminal justice
8. Geographical (im)mobility and spatial
inequality
9. Family dynamics and social mobility
10. Early child development
11. Education systems
12. Labour markets
13. Firms and market power
14. Trade and globalisation
15. Corporate, capital and top taxes
16. Transfers, tax and tax credits at the
bottom
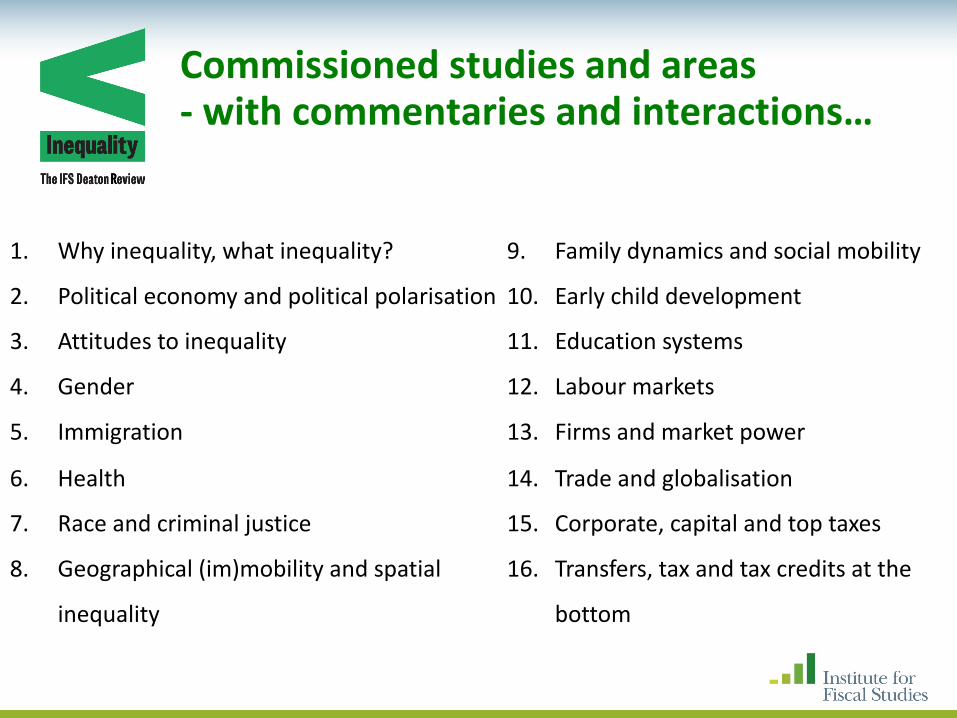
Commissioned studies and areas- with commentaries and interactions…
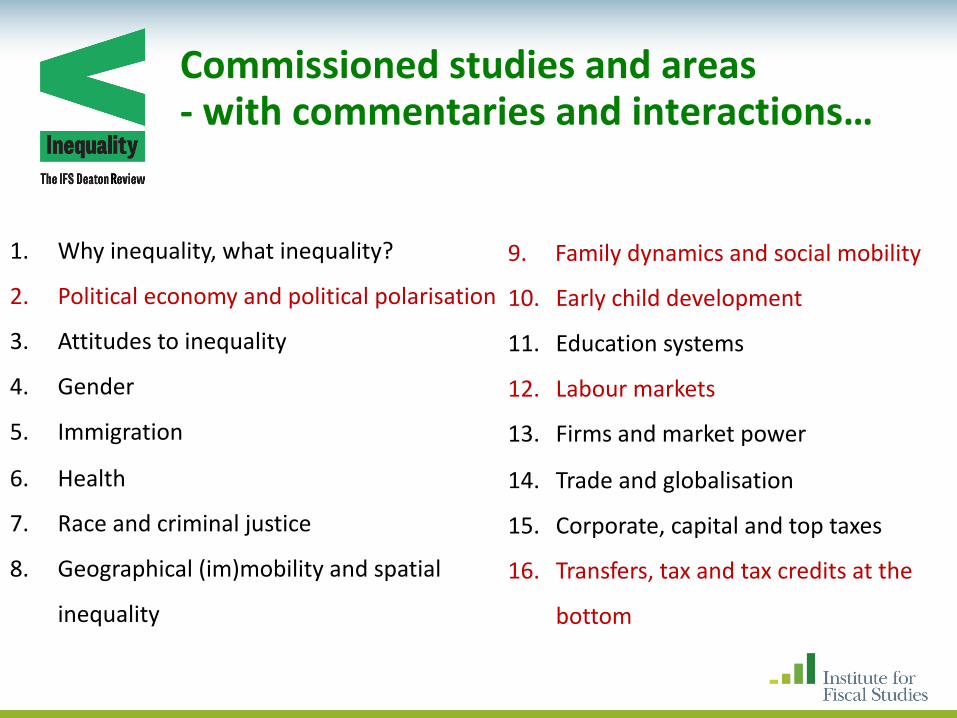
Commissioned studies and areas- with commentaries and interactions…
1. Why inequality, what inequality?
2. Political economy and political polarisation
3. Attitudes to inequality
4. Gender
5. Immigration
6. Health
7. Race and criminal justice
8. Geographical (im)mobility and spatial
inequality
9. Family dynamics and social mobility
10. Early child development
11. Education systems
12. Labour markets
13. Firms and market power
14. Trade and globalisation
15. Corporate, capital and top taxes
16. Transfers, tax and tax credits at the
bottom

© Institute for Fiscal Studies
Santiago Levy Chair
Richard Blundell Inequality, Redistribution and the Labour MarketOrazio Attanasio Inequality and Human Development
Tim Besley Inequality: Some Political Economy Issues
LACEA-LAMES 2019Invited Session
The IFS Deaton Review:Inequalities in the 21st Century
© Institute for Fiscal Studies
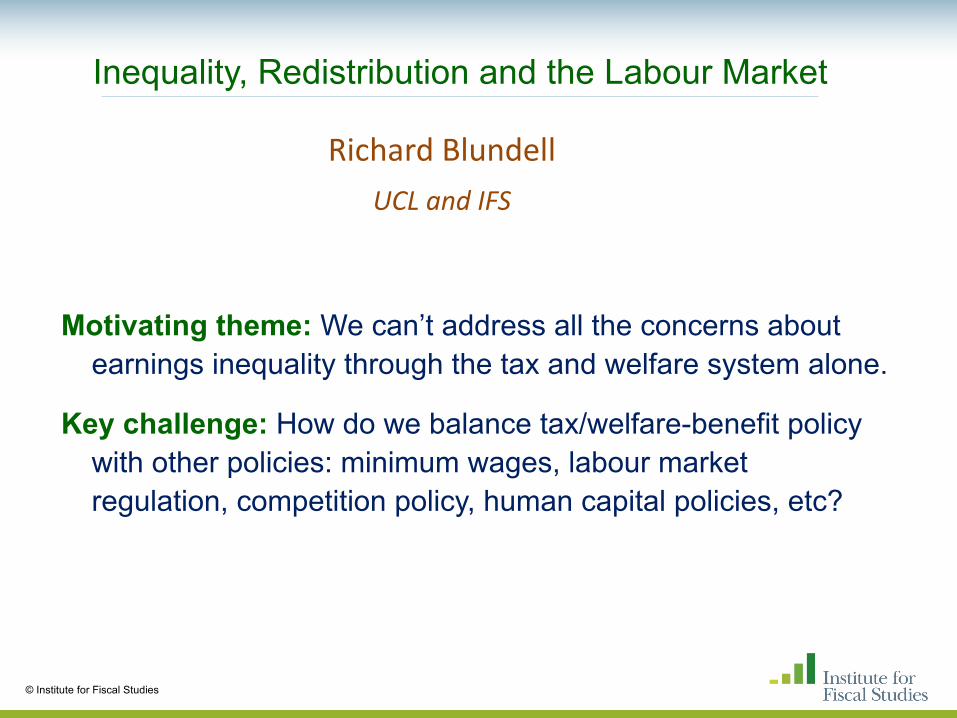
Inequality, Redistribution and the Labour Market
Motivating theme: We can’t address all the concerns about earnings inequality through the tax and welfare system alone.
Key challenge: How do we balance tax/welfare-benefit policy with other policies: minimum wages, labour market regulation, competition policy, human capital policies, etc?
Richard BlundellUCL and IFS
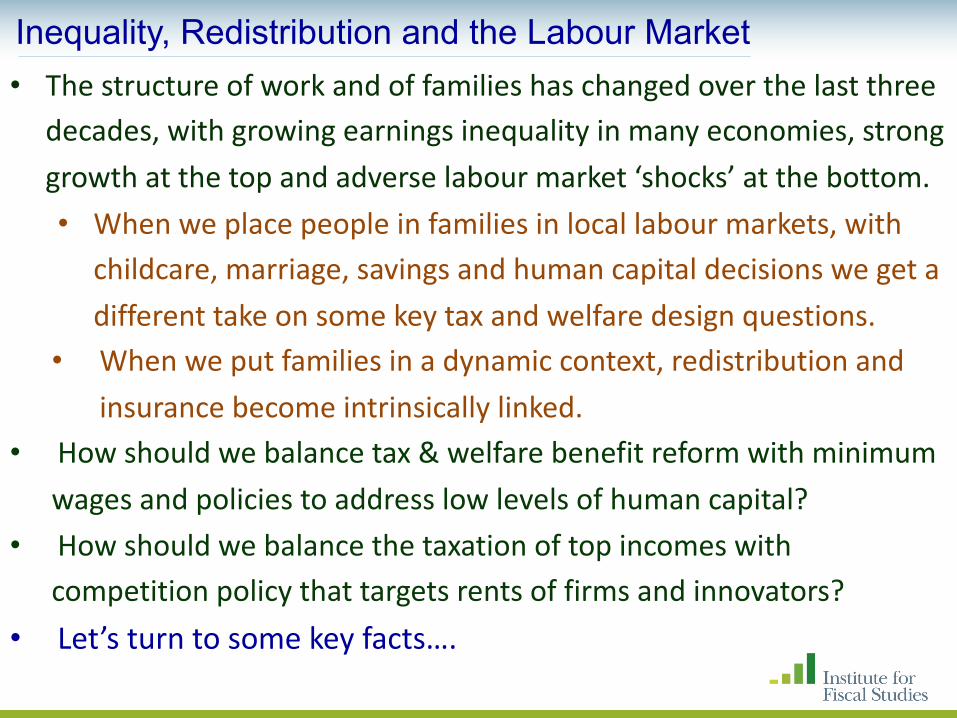
Inequality, Redistribution and the Labour Market• The structure of work and of families has changed over the last three
decades, with growing earnings inequality in many economies, strong growth at the top and adverse labour market ‘shocks’ at the bottom.• When we place people in families in local labour markets, with
childcare, marriage, savings and human capital decisions we get a different take on some key tax and welfare design questions.
• When we put families in a dynamic context, redistribution and insurance become intrinsically linked.
• How should we balance tax & welfare benefit reform with minimum wages and policies to address low levels of human capital?
• How should we balance the taxation of top incomes with competition policy that targets rents of firms and innovators?
• Let’s turn to some key facts….
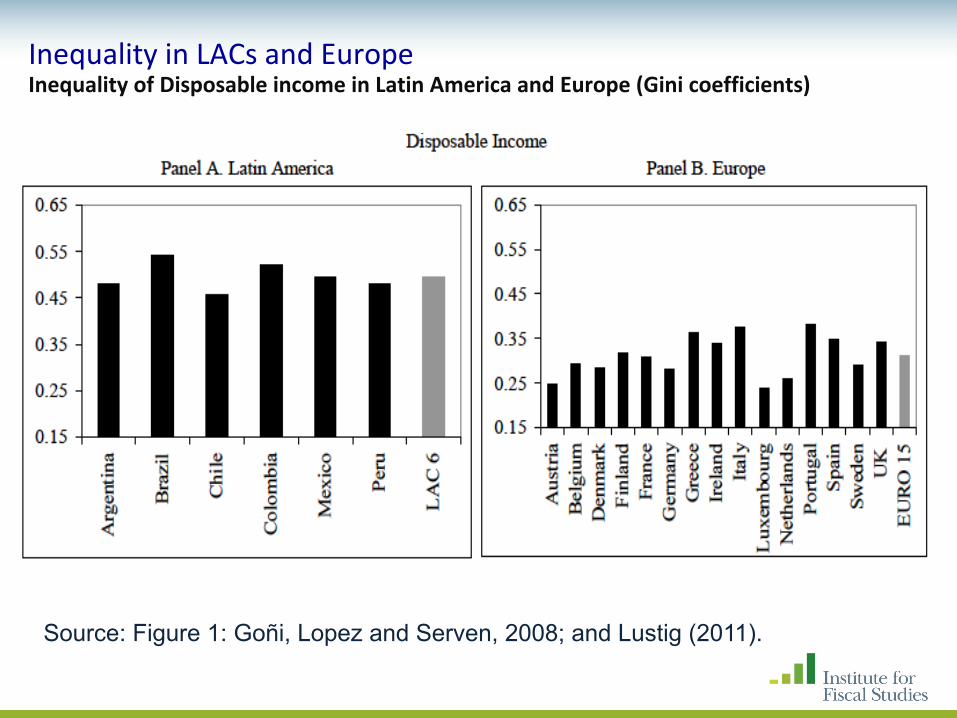
Source: Figure 1: Goñi, Lopez and Serven, 2008; and Lustig (2011).
Inequality in LACs and EuropeInequality of Disposable income in Latin America and Europe (Gini coefficients)
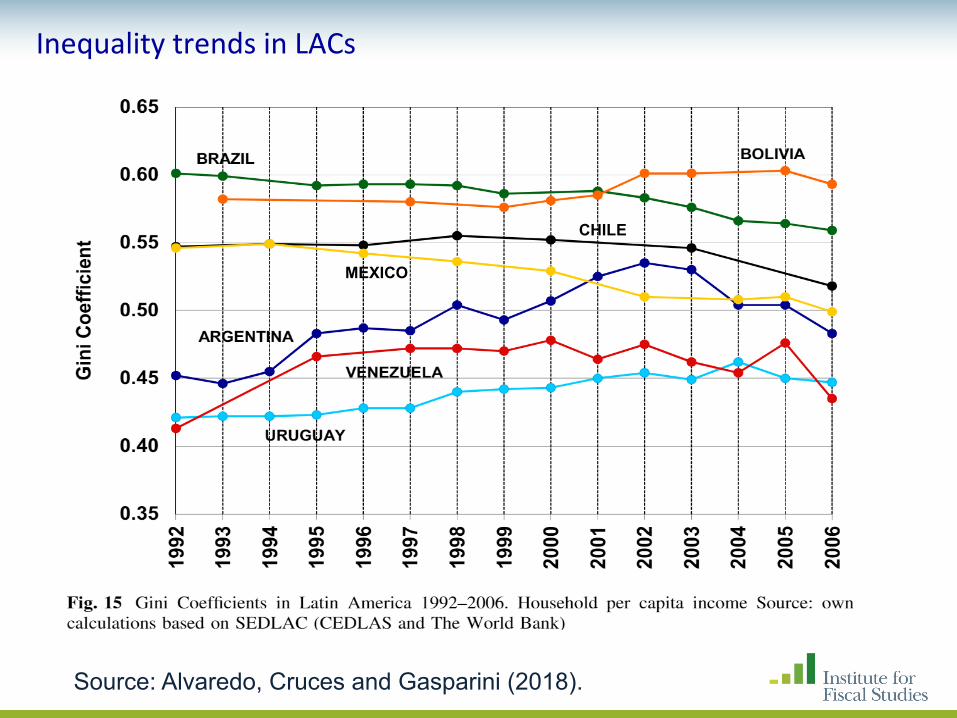
Source: Alvaredo, Cruces and Gasparini (2018).
Inequality trends in LACs
MEXICO
CHILE
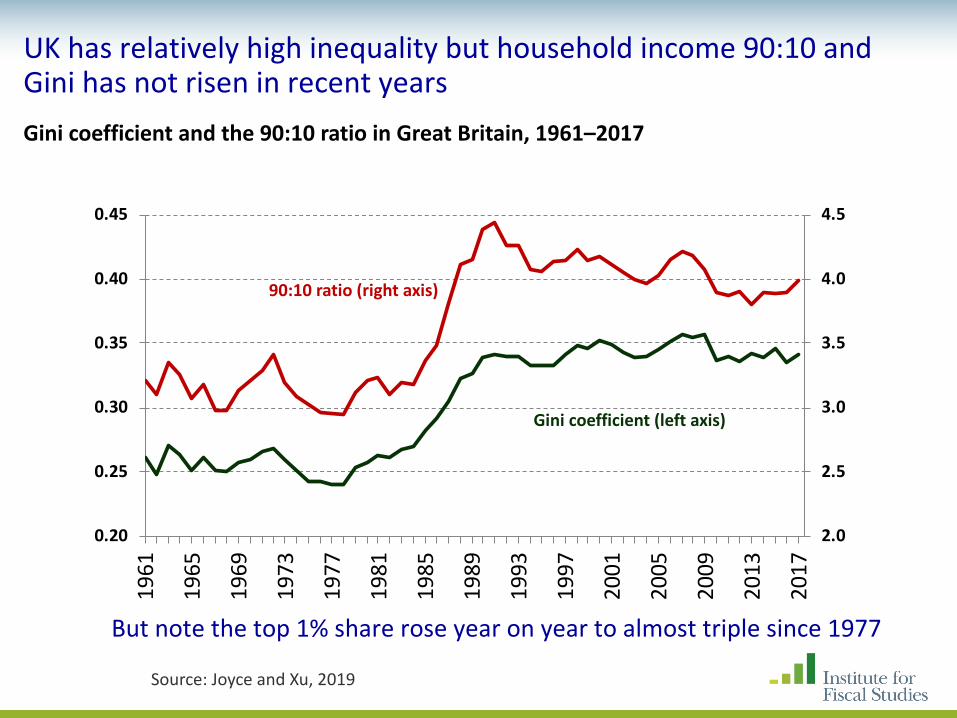
UK has relatively high inequality but household income 90:10 and Gini has not risen in recent yearsGini coefficient and the 90:10 ratio in Great Britain, 1961–2017
Source: Joyce and Xu, 2019
2.0
2.5
3.0
3.5
4.0
4.5
0.20
0.25
0.30
0.35
0.40
0.45
1961
1965
1969
1973
1977
1981
1985
1989
1993
1997
2001
2005
2009
2013
2017
90:10 ratio (right axis)
Gini coefficient (left axis)
But note the top 1% share rose year on year to almost triple since 1977
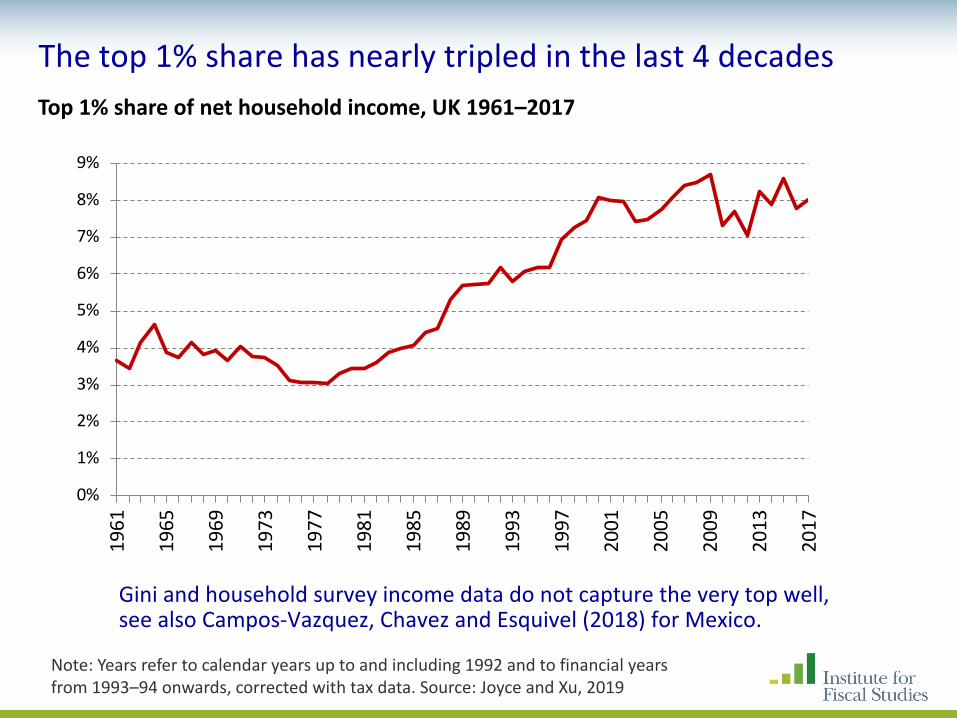
The top 1% share has nearly tripled in the last 4 decadesTop 1% share of net household income, UK 1961–2017
Note: Years refer to calendar years up to and including 1992 and to financial years from 1993–94 onwards, corrected with tax data. Source: Joyce and Xu, 2019
0%
1%
2%
3%
4%
5%
6%
7%
8%
9%
1961
1965
1969
1973
1977
1981
1985
1989
1993
1997
2001
2005
2009
2013
2017
Gini and household survey income data do not capture the very top well,see also Campos-Vazquez, Chavez and Esquivel (2018) for Mexico.

Growth in male weekly earnings: UK, 1994/95 – 2015/16
Source: Blundell, Joyce, Norris Keiller and Ziliak (2018): www.ifs.org.uk/publications/10031. Data used is UK FRS 1994-95 and 2015-16.
-1.5
-1.0
-0.5
0.0
0.5
1.0
1.5
2.0
2.5
5 10 15 20 25 30 35 40 45 50 55 60 65 70 75 80 85 90 95Annu
alis
ed a
vera
ge g
row
th
Percentile
Male weekly earnings
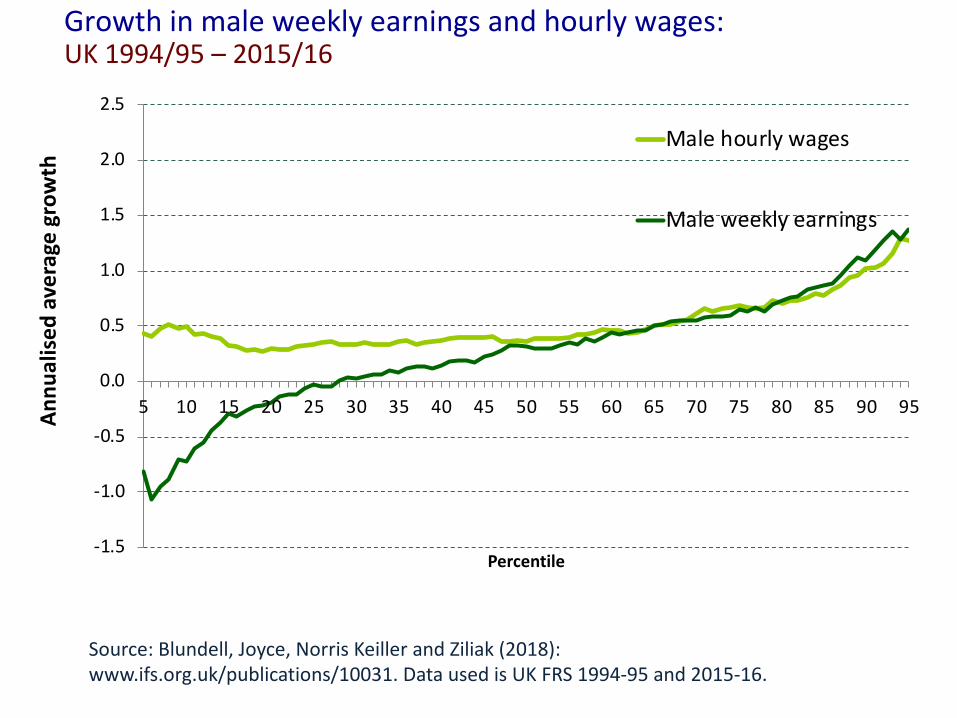
Growth in male weekly earnings and hourly wages:UK 1994/95 – 2015/16
Source: Blundell, Joyce, Norris Keiller and Ziliak (2018): www.ifs.org.uk/publications/10031. Data used is UK FRS 1994-95 and 2015-16.
-1.5
-1.0
-0.5
0.0
0.5
1.0
1.5
2.0
2.5
5 10 15 20 25 30 35 40 45 50 55 60 65 70 75 80 85 90 95Annu
alis
ed a
vera
ge g
row
th
Percentile
Male hourly wages
Male weekly earnings
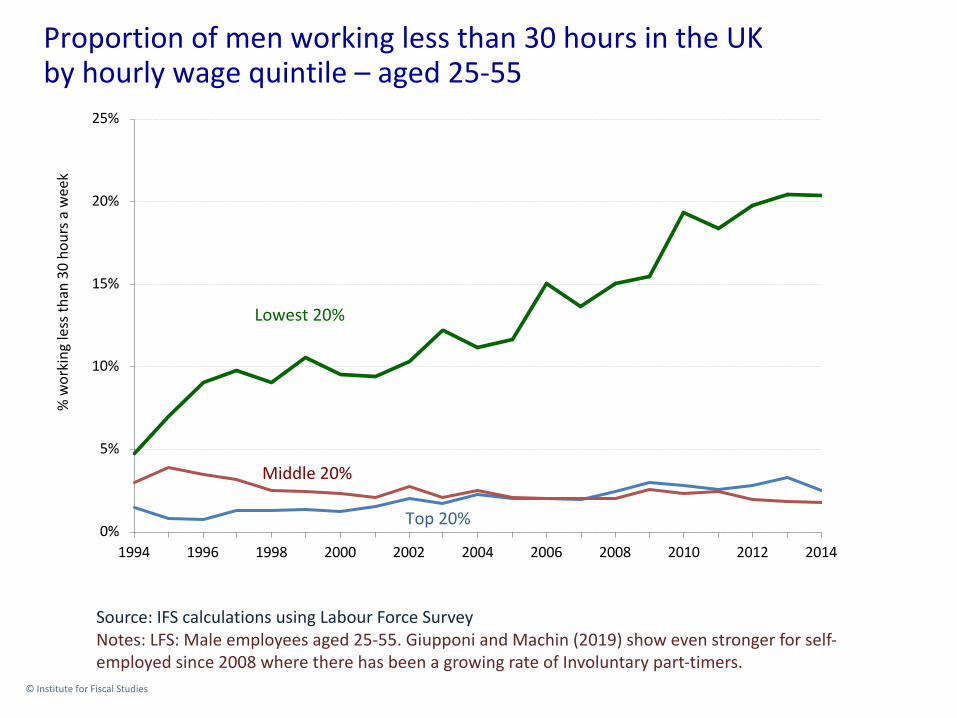
Proportion of men working less than 30 hours in the UKby hourly wage quintile – aged 25-55
© Institute for Fiscal Studies
Source: IFS calculations using Labour Force SurveyNotes: LFS: Male employees aged 25-55. Giupponi and Machin (2019) show even stronger for self-employed since 2008 where there has been a growing rate of Involuntary part-timers.
0%
5%
10%
15%
20%
25%
1994 1996 1998 2000 2002 2004 2006 2008 2010 2012 2014
% w
orki
ng le
ss th
an 3
0 ho
urs a
wee
k
Lowest 20%
Middle 20%
Top 20%
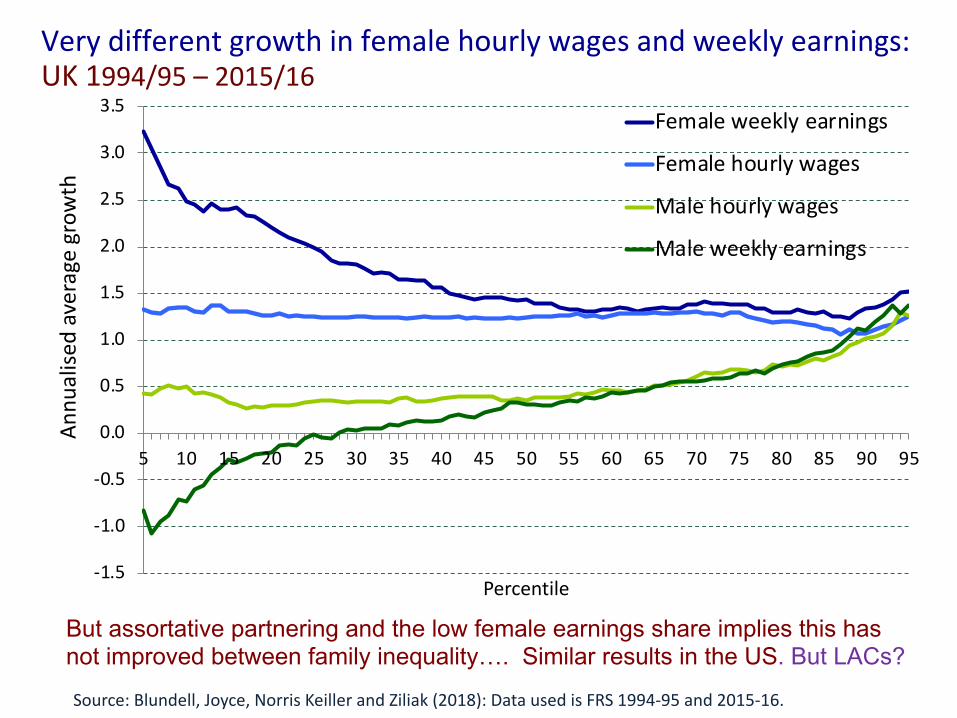
Very different growth in female hourly wages and weekly earnings: UK 1994/95 – 2015/16
Source: Blundell, Joyce, Norris Keiller and Ziliak (2018): Data used is FRS 1994-95 and 2015-16.
-1.5
-1.0
-0.5
0.0
0.5
1.0
1.5
2.0
2.5
3.0
3.5
5 10 15 20 25 30 35 40 45 50 55 60 65 70 75 80 85 90 95
Annu
alise
d av
erag
e gr
owth
Percentile
Female weekly earnings
Female hourly wages
Male hourly wages
Male weekly earnings
But assortative partnering and the low female earnings share implies this has not improved between family inequality…. Similar results in the US. But LACs?
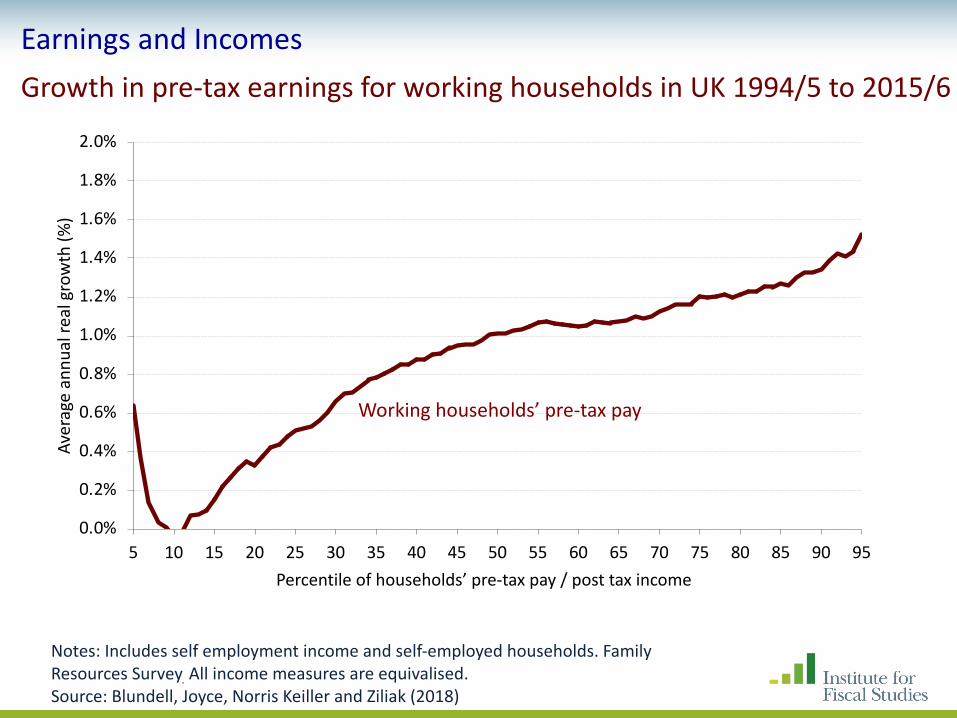
Notes: Includes self employment income and self-employed households. Family Resources Survey. All income measures are equivalised.Source: Blundell, Joyce, Norris Keiller and Ziliak (2018)
Earnings and IncomesGrowth in pre-tax earnings for working households in UK 1994/5 to 2015/6
0.0%
0.2%
0.4%
0.6%
0.8%
1.0%
1.2%
1.4%
1.6%
1.8%
2.0%
5 10 15 20 25 30 35 40 45 50 55 60 65 70 75 80 85 90 95
Aver
age
annu
al re
al g
row
th (%
)
Percentile of households’ pre-tax pay / post tax income
Working households’ pre-tax pay
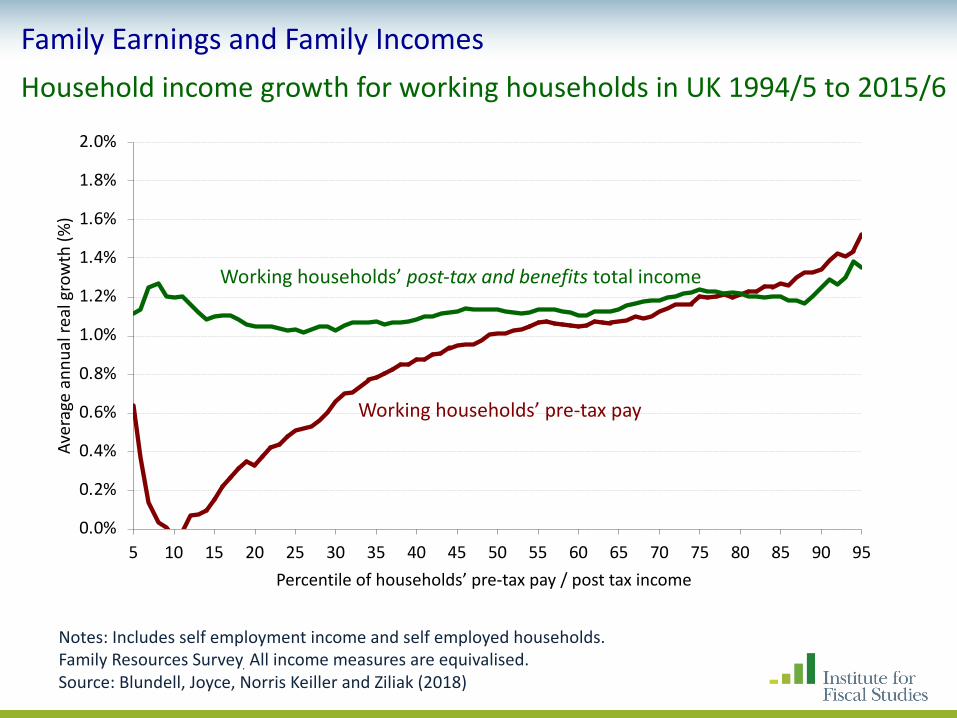
Notes: Includes self employment income and self employed households. Family Resources Survey. All income measures are equivalised.Source: Blundell, Joyce, Norris Keiller and Ziliak (2018)
Family Earnings and Family IncomesHousehold income growth for working households in UK 1994/5 to 2015/6
0.0%
0.2%
0.4%
0.6%
0.8%
1.0%
1.2%
1.4%
1.6%
1.8%
2.0%
5 10 15 20 25 30 35 40 45 50 55 60 65 70 75 80 85 90 95
Aver
age
annu
al re
al g
row
th (%
)
Percentile of households’ pre-tax pay / post tax income
Working households’ pre-tax pay
Working households’ post-tax and benefits total income

Source: Figure 1: Goñi, Lopez and Serven, 2008; and Lustig (2011).
Redistributive impact of taxes and transfers in LACs and EuropeInequality of Disposable and Market income in Latin America and Europe (Gini coefficients)
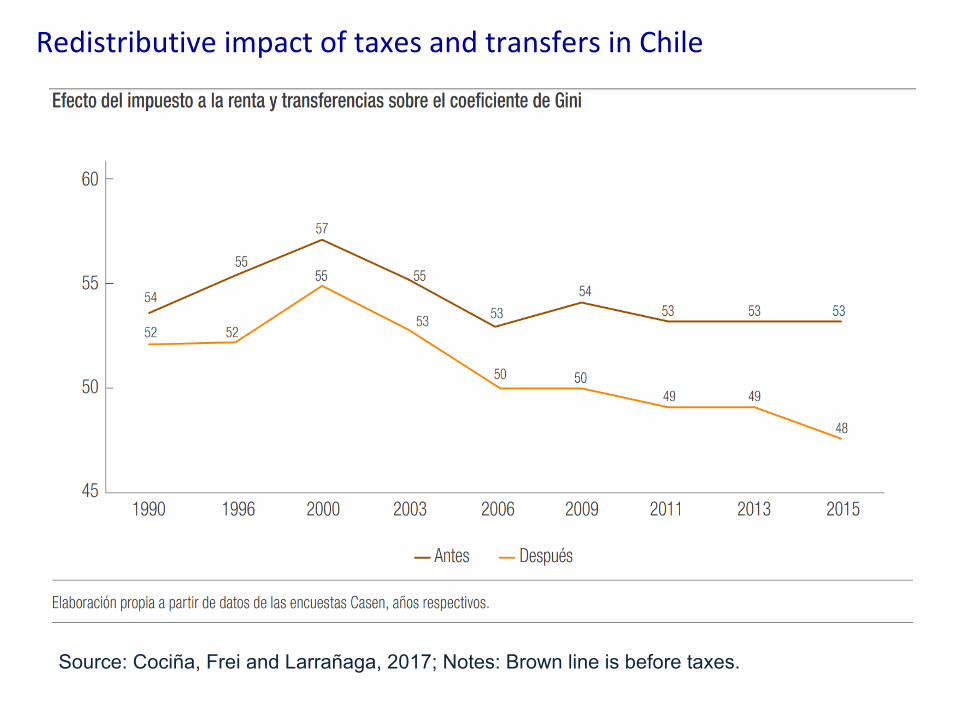
Source: Cociña, Frei and Larrañaga, 2017; Notes: Brown line is before taxes.
Redistributive impact of taxes and transfers in Chile

Source: IFS calculations from DWP (UK) benefit expenditure tables.
Real spending on tax credits and equivalents in the UK
0
5
10
15
20
25
30
35
1994 1996 1998 2000 2002 2004 2006 2008 2010 2012 2014 2016 2018 2020 2022
£ bi
llion
per
yea
r, 20
17-1
8 pr
ices
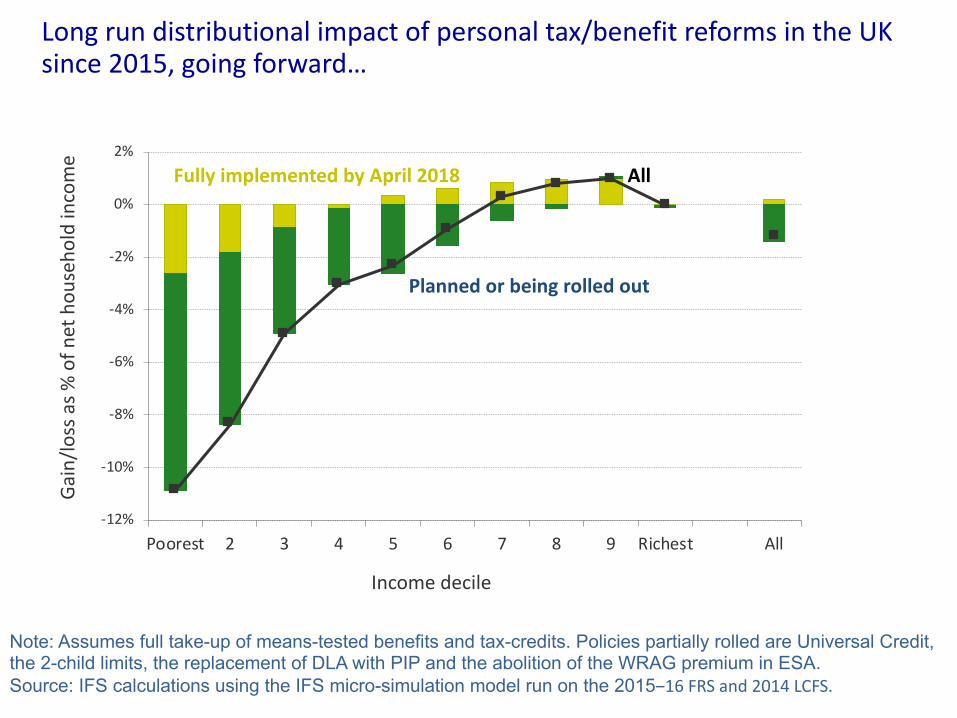
Long run distributional impact of personal tax/benefit reforms in the UK since 2015, going forward…
Note: Assumes full take-up of means-tested benefits and tax-credits. Policies partially rolled are Universal Credit, the 2-child limits, the replacement of DLA with PIP and the abolition of the WRAG premium in ESA. Source: IFS calculations using the IFS micro-simulation model run on the 2015‒16 FRS and 2014 LCFS.
-12%
-10%
-8%
-6%
-4%
-2%
0%
2%
Poorest 2 3 4 5 6 7 8 9 Richest All
Gain
/loss
as %
of n
et h
ouse
hold
inco
me
Income decile
Planned or being rolled out
Fully implemented by April 2018 All
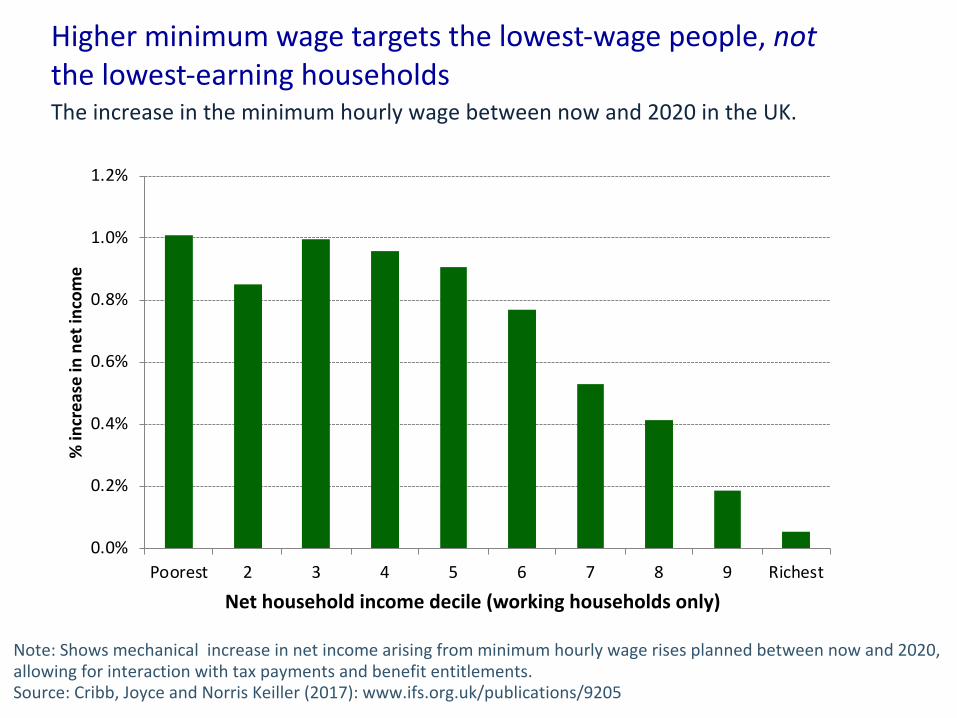
The increase in the minimum hourly wage between now and 2020 in the UK.
Note: Shows mechanical increase in net income arising from minimum hourly wage rises planned between now and 2020, allowing for interaction with tax payments and benefit entitlements.Source: Cribb, Joyce and Norris Keiller (2017): www.ifs.org.uk/publications/9205
Higher minimum wage targets the lowest-wage people, notthe lowest-earning households
0.0%
0.2%
0.4%
0.6%
0.8%
1.0%
1.2%
Poorest 2 3 4 5 6 7 8 9 Richest
% in
crea
se in
net
inco
me
Net household income decile (working households only)

Proportion of employees aged 25+ in the most “automatable” jobs (top 10% of routine task intensity”)
Source: Cribb, Joyce and Norris Keiller (2018): www.ifs.org.uk/publications/10287. Data used is ASHE, 2015.
Poverty and low pay in the UK
Jobs affected by higher minimum are not the same as those previously affected
0%
2%
4%
6%
8%
10%
12%
14%
16%
18%
0 5 10 15 20 25 30 35 40 45 50 55 60Percentile of hourly wages
2015 2020Now
Minimum wage if 25+:
© Institute for Fiscal Studies
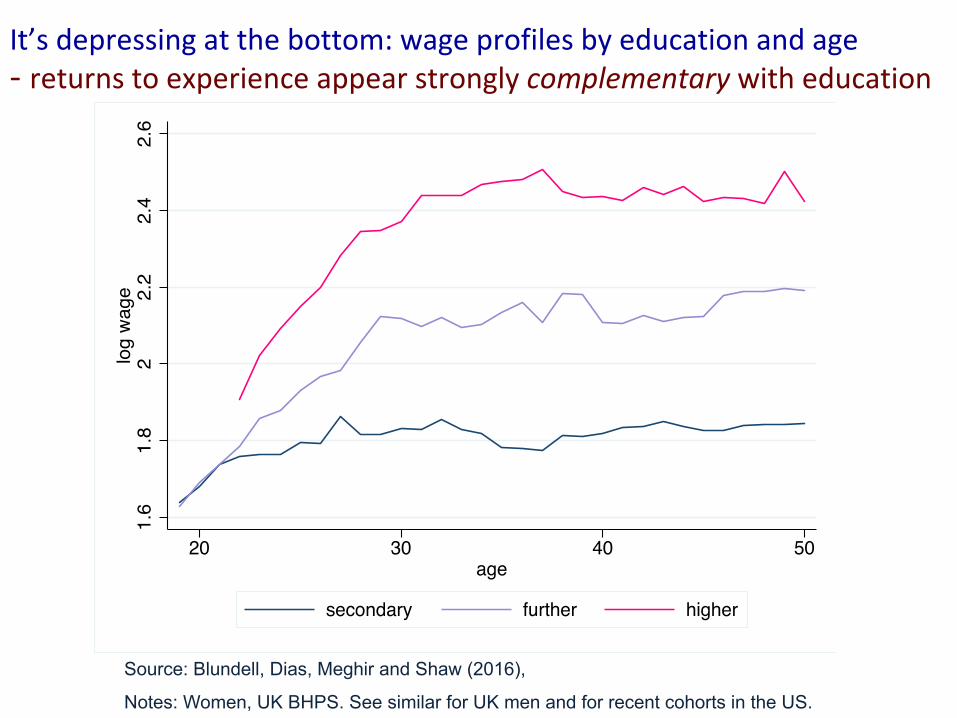
Source: Blundell, Dias, Meghir and Shaw (2016),
Notes: Women, UK BHPS. See similar for UK men and for recent cohorts in the US.
1.6
1.8
22.
22.
42.
6lo
g w
age
20 30 40 50age
secondary further higher
It’s depressing at the bottom: wage profiles by education and age- returns to experience appear strongly complementary with education
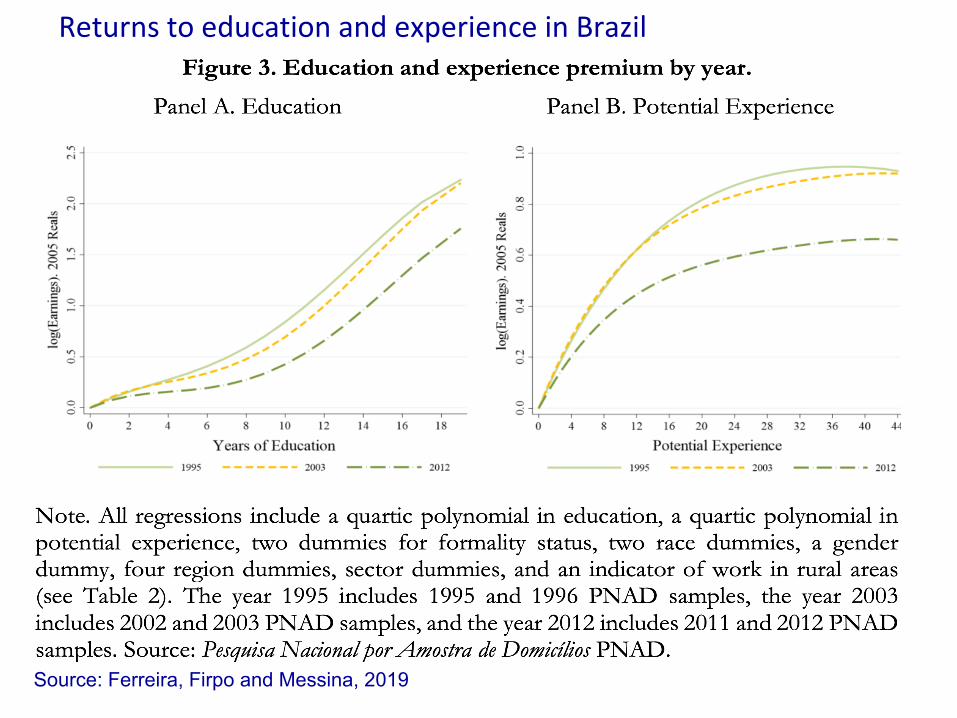
Source: Ferreira, Firpo and Messina, 2019
Returns to education and experience in Brazil
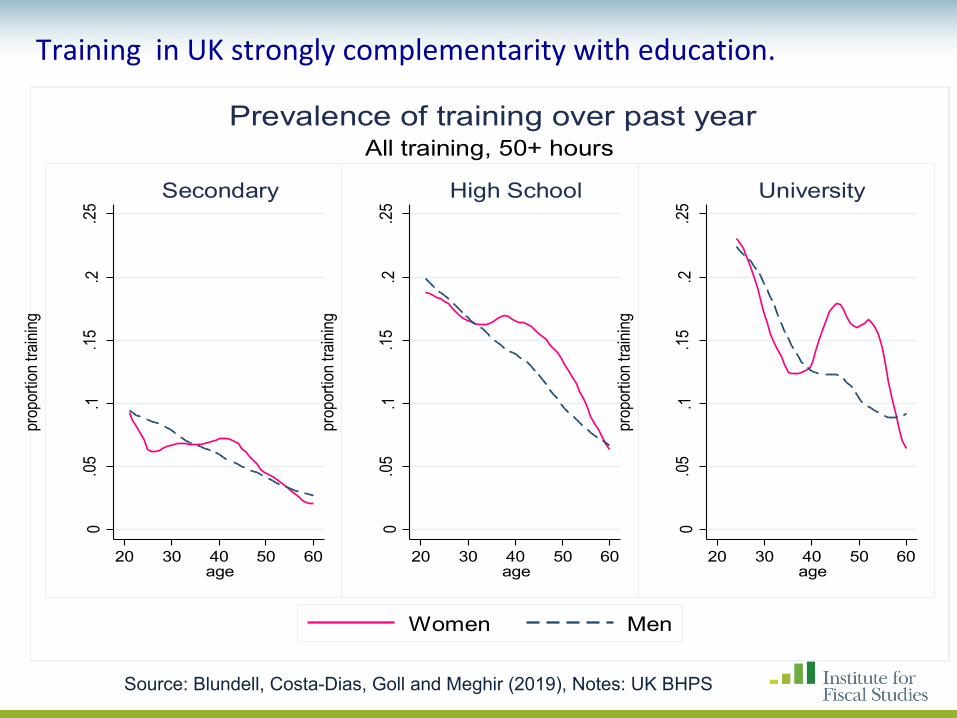
Source: Blundell, Costa-Dias, Goll and Meghir (2019), Notes: UK BHPS
Training in UK strongly complementarity with education.0
.05
.1.1
5.2
.25
prop
ortio
n tra
ining
20 30 40 50 60age
Secondary
0.0
5.1
.15
.2.2
5
prop
ortio
n tra
ining
20 30 40 50 60age
High School
0.0
5.1
.15
.2.2
5
prop
ortio
n tra
ining
20 30 40 50 60age
University
All training, 50+ hoursPrevalence of training over past year
Women Men
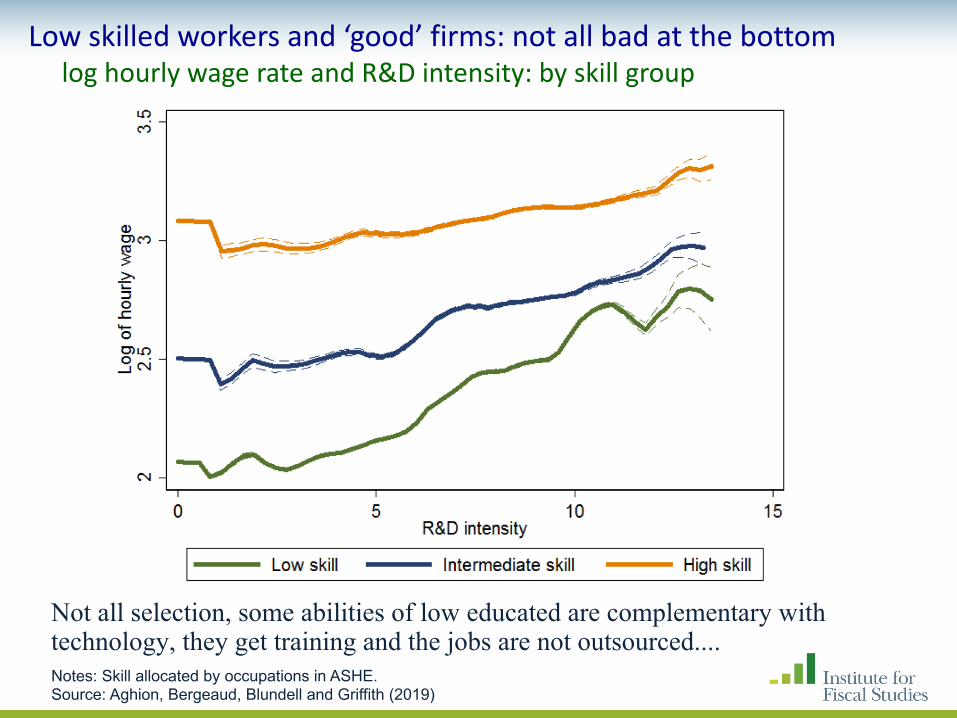
Low skilled workers and ‘good’ firms: not all bad at the bottomlog hourly wage rate and R&D intensity: by skill group
Notes: Skill allocated by occupations in ASHE. Source: Aghion, Bergeaud, Blundell and Griffith (2019)
Not all selection, some abilities of low educated are complementary with technology, they get training and the jobs are not outsourced....
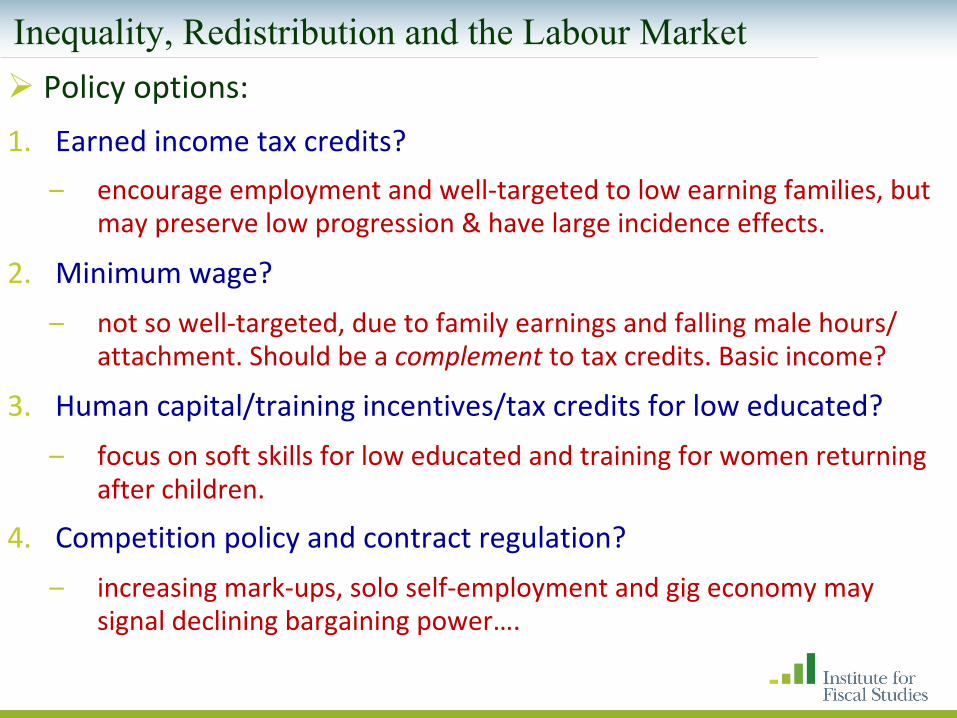
Ø Policy options:1. Earned income tax credits?
– encourage employment and well-targeted to low earning families, but may preserve low progression & have large incidence effects.
2. Minimum wage? – not so well-targeted, due to family earnings and falling male hours/
attachment. Should be a complement to tax credits. Basic income?
3. Human capital/training incentives/tax credits for low educated?– focus on soft skills for low educated and training for women returning
after children.
4. Competition policy and contract regulation?– increasing mark-ups, solo self-employment and gig economy may
signal declining bargaining power….
Inequality, Redistribution and the Labour Market
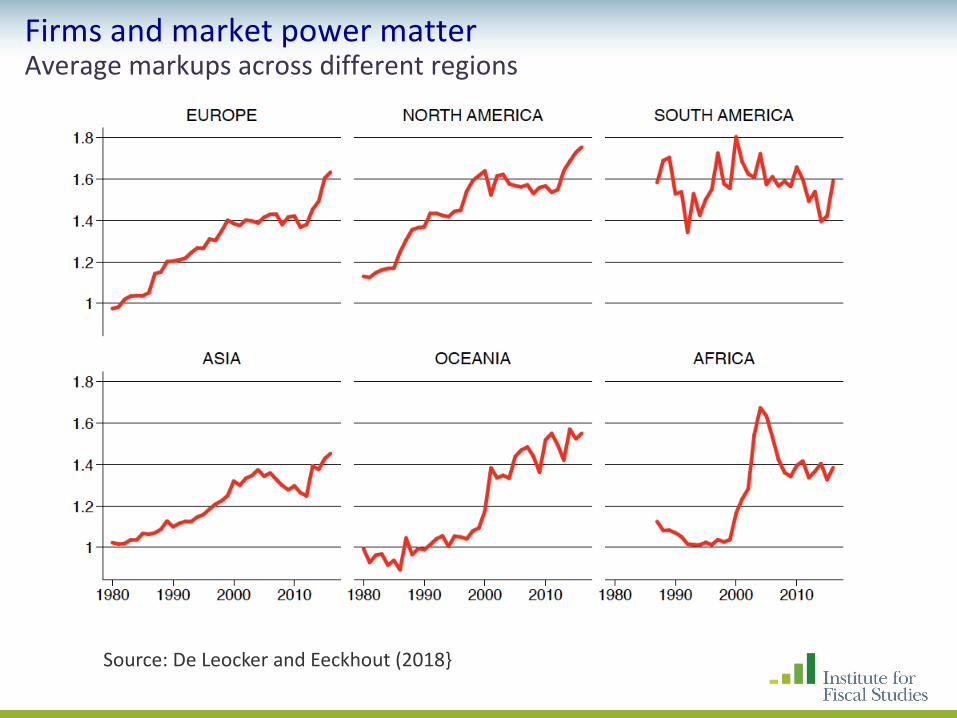
Firms and market power matterAverage markups across different regions
Source: De Leocker and Eeckhout (2018}
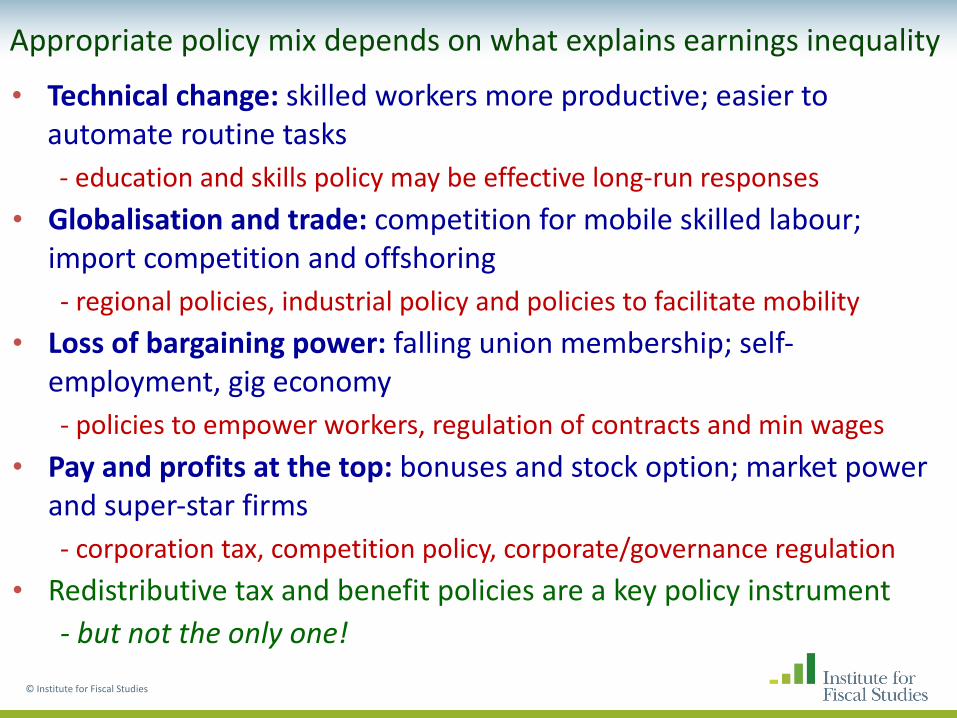
Appropriate policy mix depends on what explains earnings inequality
© Institute for Fiscal Studies
• Technical change: skilled workers more productive; easier to automate routine tasks- education and skills policy may be effective long-run responses
• Globalisation and trade: competition for mobile skilled labour; import competition and offshoring- regional policies, industrial policy and policies to facilitate mobility
• Loss of bargaining power: falling union membership; self-employment, gig economy- policies to empower workers, regulation of contracts and min wages
• Pay and profits at the top: bonuses and stock option; market power and super-star firms- corporation tax, competition policy, corporate/governance regulation
• Redistributive tax and benefit policies are a key policy instrument- but not the only one!

© Institute for Fiscal Studies
LACEA-LAMES 2019
Santiago Levy ChairRichard Blundell Inequality, Redistribution and the Labour Market
Orazio Attanasio Inequality and Human Development
Tim Besley Inequality: Some Political Economy Issues
The IFS Deaton Review:Inequalities in the 21st Century