The Horiba approach to on-board measurement
February 13th 2002
Karl Oestergaard
HORIBA, Engine Measurement Division

The Horiba approach to on-board measurements
nWhy use on board measurements
nPast experiences with on board systems
n2002 system configuration
nReview of some of the data collected
nWhere do we go from here ?

Why use on board measurements
• Some vehicles are too large to fit in the test cells or are notpractical for testing on a chassis dynamometer
• How does the engine behave on the road as opposed to apre defined simulation cycle on a dynamometer, whateffect does actual driving conditions (gear shift, braking etc)or weather, or with “in use” fuels
• Confirming simulated models of exhaust emissionsmigration, and actual emissions
• Comparing one mode of transportation with another withrespect to exhaust emissions or looking at traffic flowimprovements effect on exhaust emissions

Past experiences with on board systems
n 1998 Supplied on board dilution system for on board measurement of PMusing TEOM on project with VITO (Belgium)
n 1999 The first on-board measurement system was developed using “off theshelf” λ and NOx sensors combined with other sensors and a data recorder.The system could measure NOx mass emission, fuel consumption and thepower output of the engine during the on-road runs.
n 2000 System software was enhanced and considerable data was collectedresulting in the SAE paper 2000-01-1141
n 2001 HC and PM (smoke) measurement was added. Extensive tests onseveral exhaust flow measuring devices (Pitot tubes, Annubar etc..)compared to indirect exhaust flow measuring using the SAO technique

2000 System Configuration
10 Velocity
1NOxSensor
2 λ λ Sensor
3Karman VortexFlow Meter
11EngineRevolution
4.7.9PressureSensor
5.8.13Temp. Sensor
6HumiditySensor
12Air ConditionerON/OFF
9. Data Recorder
Pre-Muffler Main muffler
1,2
Engine
Transmission Air Filter Intake Duct
Radiator
Engine Injection Pump
Data recorder
3,4 5,6
10
9
11
12
13
7
8 Roof
Engine

Updates for 2001
Pre-muffler
MainMuffler 1,2
15,16
Engine
Transmission Air Filter Intake Duct
Radiator Injection Pump
Data Recorder
3,4 5,6 10
9
11
12
13
7
8,14 Roof
Engine
12Air ConditionerON/OFF
11EngineRevolution
10 Velocity
6Humidity Sensor
5,8,13Temp. Sensor
4,7,9Pressure Sensor
3Karman VortexFlow Meter
2λSensor
1NOxSensor
9Data Recorder
14 GPS
Analyzers
15 THC Analyzer
16 SmokeMeter
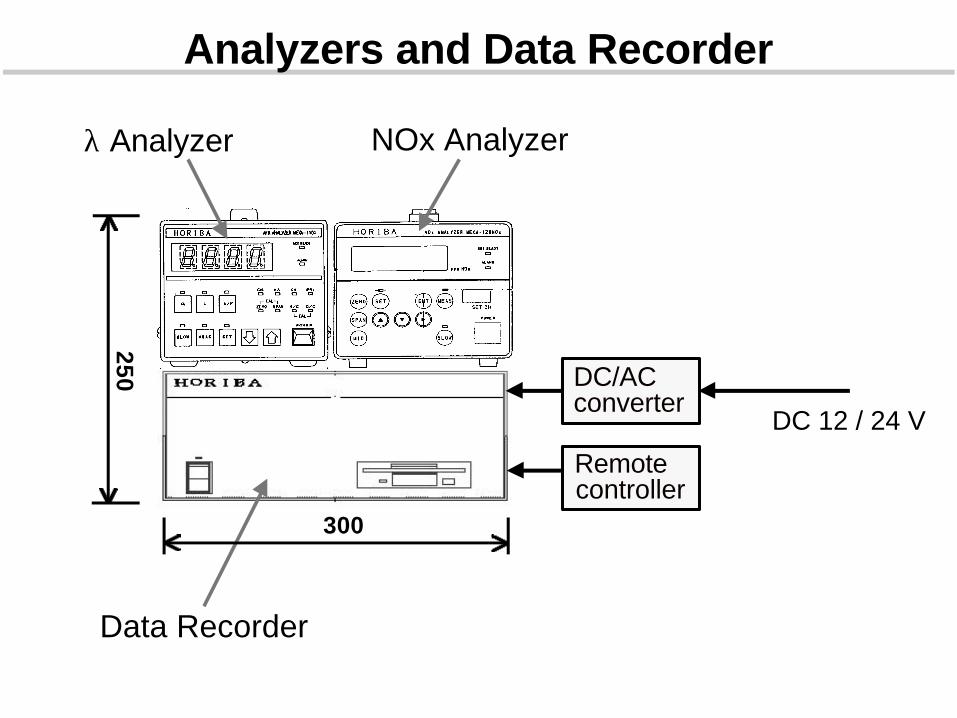
Analyzers and Data Recorder
NOx Analyzerλ Analyzer
Data Recorder
DC 12 / 24 V
300
250 DC/ACconverter
Remotecontroller

Installation
λ Sensor andNOx Sensor

Installation to a Light Duty Vehicle
Control Units of λ Analyzer and NOx Analyzer
Remote Controller
Data Recorder

Karman Vortex Flow Meter
Intake Air Flow Meter

Lambda and NOx Sensors
λ Sensor andNOx Sensor

2002 system configurationn CO, CO2 and HC can be measured wet using a heated-NDIR(MEXA-
1170HNDIR). Sample gas is introduced into the heated-NDIR without H2Oextraction, and H2O interference can be corrected using specialtechniques (Patent pending).
n NOx and AFR can be also measured under wet conditions by using aZrO2 sensor(MEXA-720NOx). The ZrO2 sensor is installed in the exhaustpipe directly. The NOx sensor has been improved and the AFR sensor isnow part of the Nox sensor no longer requiring two independent units.
n Resulting in smaller size (no cooler), fewer mechanical parts and no needfor wet/dry compensations
n Both the heated-NDIR(MEXA-1170HNDIR) and ZrO2 sensor(MEXA-720NOx) need no operation gases. Resulting in smaller size (no bottles),safer operation, easier maintenance, and a low operating cost.
n New software, enhancing user interface and improving data presentationand export (labview)

2002 system configuration…a modular system
GPS Longitude LatitudeAltitude
PITOT flow meterNOx/AFR sensor
Exhaust Attachment
MEXA-1170HNDIR
Data Integration UnitVehicleVelocityRevolution
CO, CO2, HC
AC100V
MEXA-720NOxNOxAFR
AmbientMonitorTemperature sensorHumidity sensorPressure sensor

2002 system specifications
MEXA-1170HNDIR
MEXA-720NOxItem Specification
Principal ZrO2 type sensorMeasured gases NOx, AFRRange NOx 0-3000ppm, AFR 9.5-200Response time(T63) NOx; within 0.5s, AFR; within 0.15sAccuracy NOx; ±30ppm or within ±3.0% of reading scale
AFR; ±0.1 at stoich regionOutputs Monitoring on LCD panel
Analog output 0-5VDigital in-outout (RS-232C)
Dimension 130(W) X 75(H) X 170(D) mm
Item SpecificationPrincipal Non-dispersive infrared absorptiometry
Measured gases CO, CO2, HC
Range CO; 0-12vol%, CO2; 0-20vol%, HC; 0-5000ppmC6
Response time(T90) Within 1.5sLinearity Within ±1.0% of full scaleDrift Within ±2.0% of full scale per 8 hoursRepeatability Within ±1.0% of full scaleOutputs Monitoring on LCD panel
Analog output 0-1V/0-10VDigital in-outout (RS-232C)
Dimension 464(W) X 185(H) X 652(D) mm

2002 system specifications
Data integration unit
Power supply unit Item Specification
Battery 12V 100Ah x 2pc.170(W) X 244(H) X 412(D) mm 32kg X 2pc.
Inverter Input DC-24V, Output AC-100V (1500W)275(W) X 103(H) X 390(D) mm 7kg
Charger Input AC90~260V, Output DC24V (30A)290(W) X 110(H) X 385(D) mm 4.5kg
Operation time More than 5 hours(opeate MEXA-1170HNDIR and Data integration unit)
Item Specification
Exhaust flow rate 0-6m 3/min, 0-15m3/min, 0-30m3/min.(3-type)Exhaust pressure 0-160kPa(absolute) [±0.2%FS]Exhaust temperature 0~350degC [±2%FS]Ambient pressure 0-160kPa(absolute) [±0.2%FS]Ambient temperature -10~80degC [±0.5degC]Ambient humidity 20~95%RH at 25degC [±3%RH]Vehicle velocity Analog input (0-10V)
Pulse input (0-12V, open collector, open emitter)Engine revolution Analog input (0-10V)
Pulse input (0-12V, open collector, open emitter)GPS Serial in-output (1Hz sampling)
Other input CO, CO2, HC (Analog input 0-10V from MEXA-1170HNDIR)
NOx, AFR(Analog input 0-5V from MEXA-720NOx)Optional input Analog input (0-10V), 3chDimension 464(W) X 140(H) X 652(D) mm

Data logger Software
Main screen
Graphical screen
The real time mass emission and thetotal mass emission are calculatedand can be indicated using the graphicalscreen in real time.
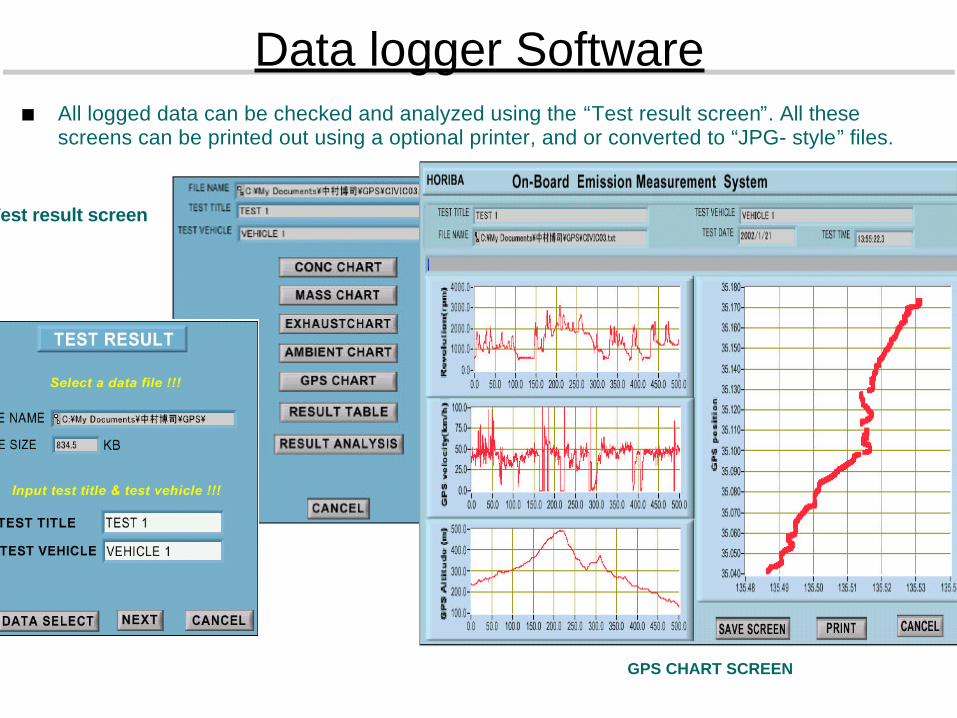
Data logger Software
Test result screen
GPS CHART SCREEN
n All logged data can be checked and analyzed using the “Test result screen”. All thesescreens can be printed out using a optional printer, and or converted to “JPG- style” files.

Data logger Software

Data logger Software

Data logger Software

nReview of some of the data collected
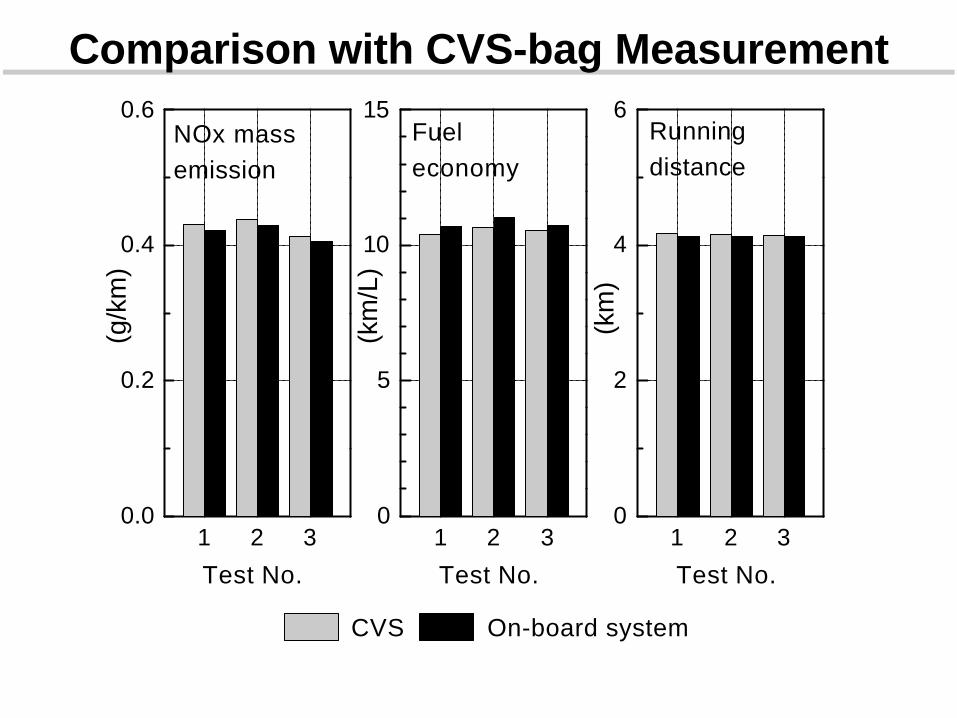
Comparison with CVS-bag Measurement
1 2 30.0
0.2
0.4
0.6NOx massemission
Test No.
CVS On-board system
(g/k
m)
1 2 30
5
10
15Fueleconomy
Test No.
(km
/L)
1 2 30
2
4
6Runningdistance
Test No.(k
m)

On-road Tests: Conditions
• Repeated tests through one yearperiod.
• Commuting between twolocations, A and B
Items Station wagonEngine type IDI diesel; with Inter-
cooler and turbochargerEGR WithGearshift 4 ATEngine displacement 1.998 [L]Vehicle weight 1500 [kg]Product date 1994 [year]
0 5 10 150
50
100
150
Location B
ALT
ITU
DE
(m
)
DISTANCE (km)
Location A

Seasonal Change 1
0
20
40
(deg
C)
8
10
12
Humidity
Temperature
Fueleconomy
Ambient temperature and humidity
Hot, Wet Cold, Wet Cold, Dry
(km
/L)
0.4
0.6
0.8NOx massemission
(g/k
m)
0 90 180 270 3600.0
1.5
3.0
DAYS
(H2O
vol
%)

Seasonal Change 2
1 2 3 4 5 60.0
0.5
1.0
0
15
30
TE
MP
ER
AT
UR
E(d
egC
)
Category No.
1: Uphill,Summer; 2: Uphill,Winter; 3: Uphill,Spring & Autumn4: Downhill,Summer; 5: Downhill,Winter; 6: Downhill,Spring & Autumn
Fuel economy NOx NOx (corrected)
NO
x E
MIS
SIO
N (
g/km
)
1 2 3 4 5 60
5
10
0.0
1.5
3.0
Temperature H2O partial pressure
H2O
PA
RT
IAL
PR
ES
SU
RE
(kP
a)
FU
EL
EC
ON
OM
Y(k
m/L
)

Comparison of two vehicles 1
Items Station wagon Microbus
Engine type IDI diesel; with Inter-cooler and turbocharger
DI diesel; with Inter-cooler and turbocharger
EGR With WithoutGearshift 4 AT 6 MTEngine displacement 1.998 [L] 3.907 [L]Vehicle weight 1500 [kg] 3450[kg] (total 4970[kg])Product date 1994 [year] 1990 [year]
0 10 20 30 400
200
400
600
Location C
Location B
DISTANCE (km)
ALT
ITU
DE
(m)
Two vehicles running at the same time
Between point B (south Kyoto) to point C(Kutsuki village)

Comparison of two vehicles 2
0
10
20NOx (g/km)
(g/k
m)
0
100
200
(m
g/s)
NOx (mg/s)
25 30 35
0
5
10
RUNNING DISTANCE(km)
Fuel Consumption
(g/s
)
0
10
20
0
100
200
25 30 35
0
5
10
(A) Station Wagon (B) Microbus
RUNNING DISTANCE(km)

Utilization of GPS: Route
International Conference hall
Golden Pavilion
Silver Pavilion
The Imperial Palace
Kyoto Station
A
BHORIBA,Ltd.
2km

Utilization of GPS: NOx
135o44' 135o46' 135o48'
2000/5/16NOx Mass: 7.86 g
Running Time: 33.8 min
EAST LONGITUDE
135o44' 135o46' 135o48'34o58'
35o00'
35o02'
35o04'
NO
RTH
LA
TITU
DE
NOx Mass EmissionRunning Distance: 15.2 km
2000/5/12
NOx Mass: 8.16 gRunning Time: 39.3 min
EAST LONGITUDE

Utilization of GPS: CO2
135o44' 135o46' 135o48'
CO2 Mass EmissionRunning Distance: 15.2 km
2000/5/16
CO2 Mass: 3.93 kgRunning Time: 33.8 min
EAST LONGITUDE
135o44' 135o46' 135o48'34o58'
35o00'
35o02'
35o04'
2000/5/12
CO2 Mass: 4.40 kgRunning Time: 39.3 min
NO
RT
H L
AT
ITU
DE
EAST LONGITUDE

Utilization of GPS: NOx and CO2
135o44' 135o46' 135o48'34o58'
35o00'
35o02'
35o04'
CO2 Mass Emission
Total: 4.40 kg
NO
RT
H L
AT
ITU
DE
EAST LONGITUDE
135o44' 135o46' 135o48'
Date: 2000/5/12
Running Distance: 15.2 km, Running Time: 39.3 min
NOx Mass Emission
Total: 8.16 g
EAST LONGITUDE

Where do we go from here ?n Sell some systems ?
n Present SAE paper 2002-01-0612 (wet based NDIR)
n Continue work with
EPA on potential CRADA or license
MOE (Ministry of Environment) in Japan on a Japanese OBS
Environment Canada on a OBS for agricultural farm implements
n Continue to improve sensors ? (HC and Nox)
n Continue to improve packaging and exhaust flow sensors depending onthe specific application
n Continue to collect data