1
Sustainable water management – modelling acceptability for decision support: a
methodology
Ward, S., Abdelmeguid, H., Farmani, R., Butler, D. and Memon, F. A.
Abstract
Previous research into the acceptability of S/IWM measures has focused on
characterising acceptability, which can differ if referring to water-saving micro-
components (appliances) or alternative water technologies (e.g. rainwater harvesting).
In contrast, limited research has focused on how to represent and integrate
acceptability within decision support tools (DST). This paper describes the
development of a methodology to represent the socio-cultural acceptability of micro-
components and alternative technologies within the ‘Acceptability Function’ (AF)
model, which links to the ‘Urban Water Optioneering Tool’ (UWOT?) DST.
Previously, acceptability was represented within UWOT? by a qualitative indicator
between 0 (unacceptable) and 5 (acceptable) selected by the DST user. In order to
provide a more comprehensive representation of acceptability, the model
distinguishes between different components of acceptability determined using
methods such as structural equation modelling and regression analysis. For alternative
water technologies components of acceptability include subjective norms (social
pressure to accept), fairness, health risks, system risks, trust and emotions.
Incorporation of these components within the AF model requires a number of
functionalities, such as weightings and scales and the development of a suitable
graphical user interface (GUI). In essence, this paper describes a methodology for
capturing ‘soft’ information in an essentially ‘hard’ modelling environment.
1. Introduction
Finding enough water and sanitation resources to meet people’s needs is still one of
the greatest challenges faced by politicians, engineers and planners. Climate change
will require water (and wastewater) infrastructure to be more resilient and adaptable,
as river and groundwater levels become increasingly harder to predict and demands
placed on them increase (Butler and Ward, In Press). Pressures of water availability
and flood risk, due to population growth and development encroaching into
vulnerable areas, mean conventional systems are being pushed to their limits. The
time has come for a shift in thinking – towards that of sustainable/integrated water
management (S/IWM). S/IWM involves thinking about meeting the water needs of
societies, the environment and the economy and considers water demand management
measures, as well as the potential interactions between water supply, wastewater and
stormwater. Alternative water technologies representing such interactions include
rainwater harvesting (RWH) and greywater reuse (GWR) systems (small scale),
stormwater and effluent reuse (large scale) and sustainable drainage systems (SuDS).
However, the uptake of these technologies is, at present, impeded by a number of
barriers (Ward, 2010).
One of the perceived main barriers to the implementation of alternative water
technologies is their socio-cultural acceptability by a range of stakeholders (Jeffrey
and Jefferson, 2003). These can include water service providers (WSPs), planning and
building control professionals and system/water resource end users. The topic of

2
public acceptance of water recycling is subject to a great deal of controversy and
rhetoric and it is widely used as a way to explain the lack of progress on recycling
(Stenekes et al., 2006). Over the last 10 years the volume of research undertaken into
community and individual attitudes towards S/IWM techniques has increased
substantially. However, Stenekes et al (2006) notes that most of the available social
research focuses on effluent reuse. This may be due to the fact it is generally
centralised (rather than decentralised) and consequently is an alternative option the
majority of water service providers are open to consider. WSPs are likely to view
large-scale, centralised recycling systems as less complicated (for both them and their
customers), because of the fragmented and contradictory arrangements relating to
other techniques. Additionally, WSPs may not easily invest in alternatives if they
detract from their market share or asset base.
It has been identified that public opposition has the potential to make or break
sustainable water management projects (Jeffrey and Jefferson, 2003; Friedler et al.,
2006). Consequently, the acceptability of an alternative water supply technology is
vital for its successful implementation. Bruvold et al. (1981) caution that projects
deemed appropriate by engineers and other technical personnel, may not be similarly
accepted by the community who may not share their opinion. Often techniques or
end-uses resulting in financial gain and minimal contact with the resulting water are
favoured (Friedler et al., 2006). However, the issue of acceptability is more complex
and cannot be fully explained by merely gain and contact. Analysing and
characterising acceptability depends very much on the framing of the problem.
Stenekes et al. (2006) assert that lack of acceptance is often (wrongly) attributed to
public misunderstandings based on ignorance due to a lack of information. This is
evidenced by Friedler et al. (2006), who highlight that a number of large-scale potable
wastewater reuse (WWR) schemes in the USA, were completed but did not operate,
due to public opposition resulting from insufficient and poorly managed information
dissemination schemes.
However, studies are divided on the value of information in predicting acceptability.
Stenekes et al. (2006) and Nancarrow et al. (2009), identified that knowledge (linked
to information) was not a predictor of acceptability of potable WWR and information
and education campaigns only had limited success in increasing acceptability. In
contrast, Domenech and Sauri (2010) and Hurlimann (2007a, b) for water reuse and
Lienert and Larsen (2009) for urine separation, identified that information positively
influenced acceptability (by reducing perception of risk) and that information or
communication should originate from expert, unbiased, non-sensationalising sources.
Studies are also divided over the importance of demographic, socio-economic and
biogeographical factors. Hurlimann (2007a) found that there was a correlation
between education and gender and perception of risk affecting the acceptability of
recycled water. On the contrary, two studies (Friedler et al., 2006; Lienert and Larsen,
2009) found that socio-economic and biogeographical factors were not good
predictors of acceptability. Stenekes et al. (2006) cautions that information and socio-
demographic ‘problem frames’ oversimplifies acceptance and does not account for
factors attached to the importance and variability of everyday water practices
(contextual circumstances, shared meanings attached to water).
3
Hartling (2001) asserts that being transparent, revealing all facts, using non-
professional terminology and encouraging participation in the decision making
process, will lead to greater acceptability of S/IWM schemes. Building on this,
Stenekes et al. (2006) recognise that values rather than facts underpin people’s
acceptance perspectives, as responsibility for a resource (water) required for their
everyday life is designated to an external organisation (WSPs) perceived to be beyond
their influence. Consequently, people’s beliefs about the trust, credibility, stability,
familiarity, transparency, accountability and legitimacy of organisations ‘in charge’ of
the water resource (potable or non-potable) are crucial parts of acceptability (Stenekes
et al., 2006; Menegaki et al, 2007). Furthermore, Nancarrow et al. (2009) identified
that crucial factors affecting acceptability were trust and emotion. Engaging in open
dialogue was more affective in increasing acceptability, as it resulted in increased
trust, which decreased negative perceptions of health and system risks. Emotion is
often overlooked, however, it is becoming increasingly recognised that practice-based
behaviour (such as water use) is deeply rooted in the emotions of everyday activities
(Shove, 2003).
Despite this plethora of studies characterising acceptability, limited research has
considered how to distil findings into an easily useable format for planners, water
managers and engineers. For example, limited focus has been placed on incorporating
complex social phenomena into decision support tools (DST). Mitchell et al. (2007)
highlight that issues not well covered by DSTs include social assessment and that
such issues are becoming increasingly important as S/IWM analysis increases in
complexity.
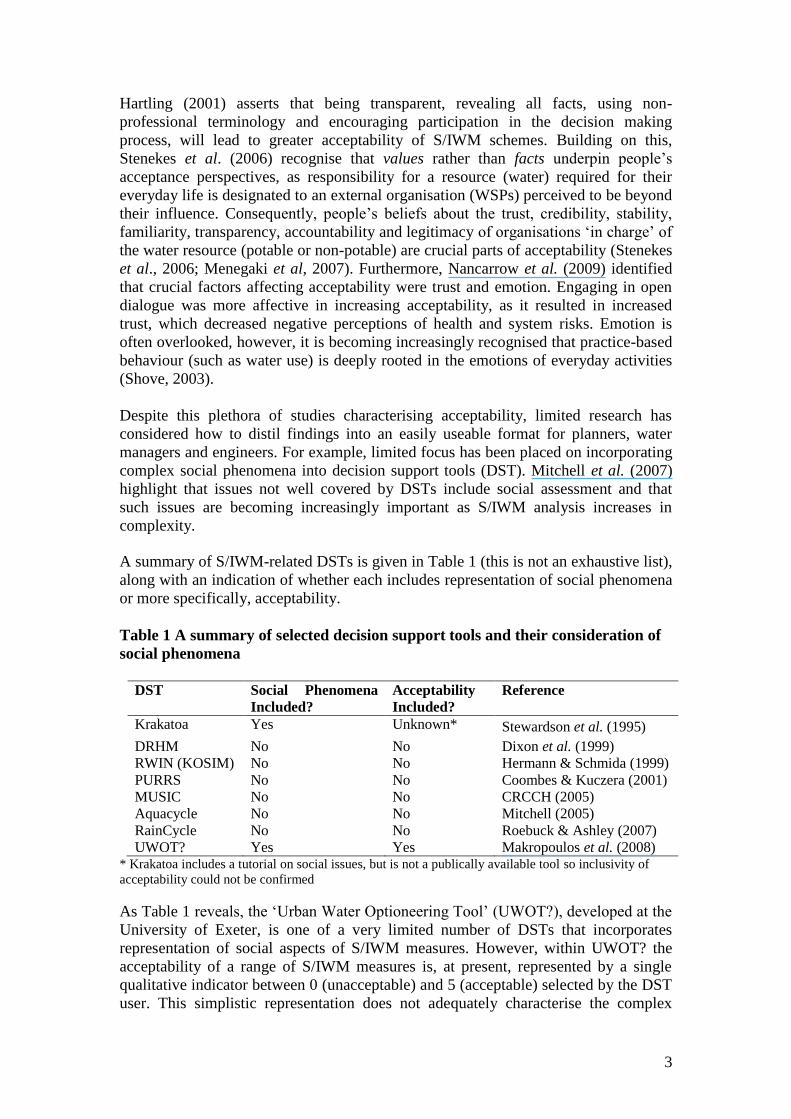
A summary of S/IWM-related DSTs is given in Table 1 (this is not an exhaustive list),
along with an indication of whether each includes representation of social phenomena
or more specifically, acceptability.
Table 1 A summary of selected decision support tools and their consideration of
social phenomena
DST Social Phenomena
Included?
Acceptability
Included?
Reference
Krakatoa Yes Unknown* Stewardson et al. (1995)
DRHM No No Dixon et al. (1999)
RWIN (KOSIM) No No Hermann & Schmida (1999)
PURRS No No Coombes & Kuczera (2001)
MUSIC No No CRCCH (2005)
Aquacycle No No Mitchell (2005)
RainCycle No No Roebuck & Ashley (2007)
UWOT? Yes Yes Makropoulos et al. (2008) * Krakatoa includes a tutorial on social issues, but is not a publically available tool so inclusivity of
acceptability could not be confirmed
As Table 1 reveals, the ‘Urban Water Optioneering Tool’ (UWOT?), developed at the
University of Exeter, is one of a very limited number of DSTs that incorporates
representation of social aspects of S/IWM measures. However, within UWOT? the
acceptability of a range of S/IWM measures is, at present, represented by a single
qualitative indicator between 0 (unacceptable) and 5 (acceptable) selected by the DST
user. This simplistic representation does not adequately characterise the complex
4
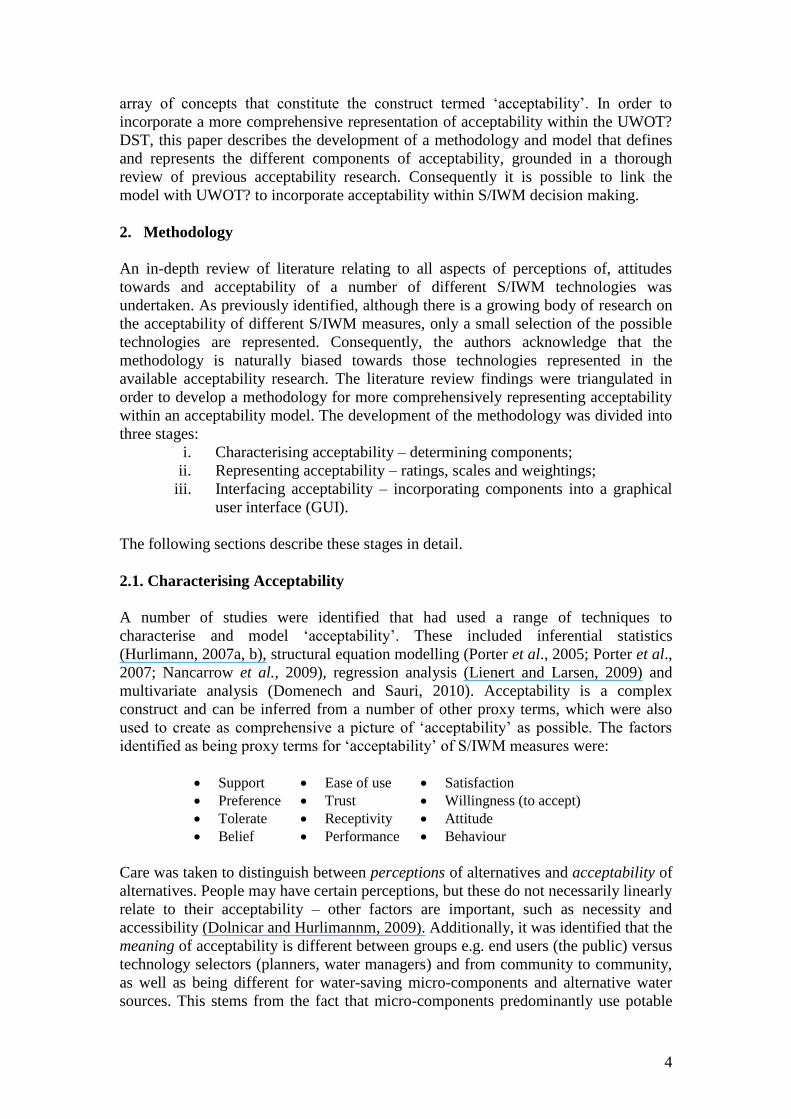
array of concepts that constitute the construct termed ‘acceptability’. In order to
incorporate a more comprehensive representation of acceptability within the UWOT?
DST, this paper describes the development of a methodology and model that defines
and represents the different components of acceptability, grounded in a thorough
review of previous acceptability research. Consequently it is possible to link the
model with UWOT? to incorporate acceptability within S/IWM decision making.
2. Methodology
An in-depth review of literature relating to all aspects of perceptions of, attitudes
towards and acceptability of a number of different S/IWM technologies was
undertaken. As previously identified, although there is a growing body of research on
the acceptability of different S/IWM measures, only a small selection of the possible
technologies are represented. Consequently, the authors acknowledge that the
methodology is naturally biased towards those technologies represented in the
available acceptability research. The literature review findings were triangulated in
order to develop a methodology for more comprehensively representing acceptability
within an acceptability model. The development of the methodology was divided into
three stages:
i. Characterising acceptability – determining components;
ii. Representing acceptability – ratings, scales and weightings;
iii. Interfacing acceptability – incorporating components into a graphical
user interface (GUI).
The following sections describe these stages in detail.
2.1. Characterising Acceptability
A number of studies were identified that had used a range of techniques to
characterise and model ‘acceptability’. These included inferential statistics
(Hurlimann, 2007a, b), structural equation modelling (Porter et al., 2005; Porter et al.,
2007; Nancarrow et al., 2009), regression analysis (Lienert and Larsen, 2009) and
multivariate analysis (Domenech and Sauri, 2010). Acceptability is a complex
construct and can be inferred from a number of other proxy terms, which were also
used to create as comprehensive a picture of ‘acceptability’ as possible. The factors
identified as being proxy terms for ‘acceptability’ of S/IWM measures were:
Support Ease of use Satisfaction
Preference Trust Willingness (to accept)
Tolerate Receptivity Attitude
Belief Performance Behaviour
Care was taken to distinguish between perceptions of alternatives and acceptability of
alternatives. People may have certain perceptions, but these do not necessarily linearly
relate to their acceptability – other factors are important, such as necessity and
accessibility (Dolnicar and Hurlimannm, 2009). Additionally, it was identified that the
meaning of acceptability is different between groups e.g. end users (the public) versus
technology selectors (planners, water managers) and from community to community,
as well as being different for water-saving micro-components and alternative water
sources. This stems from the fact that micro-components predominantly use potable

5
water, which is already ‘acceptable’, whereas alternatives may involve the use non-
potable water, which may be less ‘acceptable’. Issues such as trust, fairness and risk
are likely to be less crucial in acceptability of micro-components than alternatives as,
to a certain extent; individuals/communities already ‘trust’ the water used within the
former, but not necessarily the latter. For micro-components, value, quality and
performance may have a greater influence on acceptability (Hills and Birks, 2004).
Consequently, the acceptability of alternative water sources and water-saving micro-
components is considered separately.
2.1.1. Acceptability of Alternative Water Sources
A small core of factors emerged from the literature review as being crucial for
determining the acceptability of alternative water sources. These were most clearly
delineated by Hurlimann (2007a), Porter et al. (2007) and Nancarrow et al. (2009) as:
Trust Fairness Emotion*1
Subjective norms Health risk#1
System risk^1
Other (qualitative and quantitative) studies used terminology that resonated with or
could be deemed a proxy of these factors and these are summarised in Table 2 under
the ‘core’ component headings. Those factors that could not be categorised under one
of the core headings are shown under the ‘other’ heading.
Table 2 Summary of Components of Acceptability for Alternative Water Sources (compiled from Friedler et al., 2006; Stenekes et al., 2006; Hurlimann, 2007a, b; Porter et al.,
2005; Porter et al., 2007; Menegaki et al., 2007; Nancarrow et al., 2009; Dolnicar and
Hurlimann, 2009; Domenech and Sauri, 2010; Ward, 2010; Islam et al., 2010)
Trust Fairness Emotion Subjective Norm Other
Operational
regime
Cost
Financial gain
Belief
Attitude
Environmental
concern
Knowledge
Information
Integrity Price Motivation Awareness
Credibility Necessity Meaning Health Risk Communication
Stability Availability Value Quality Context
Familiarity Water scarcity Children Source Fact
Transparency Reliance on imports Use Prior experience
Commitment
(organisational)
Contact Socio-economics
Demographics
Accountability System Risk Biogeographics
Legitimacy Performance
Dialogue Satisfaction
Support Proximity
Failure
Hurlimann (2007b) explains the interaction of the components along the lines of:
quality leads to value, value leads to satisfaction, risk leads to dissatisfaction, trust
leads to low risk, trust leads to satisfaction, communication leads to trust, quality
1 *proxy terms included: mood; ^proxy terms included: performance, maintenance, comfort, design;
#proxy terms included: hygiene
6
leads to fairness, trust leads to fairness, fairness leads to satisfaction, fairness leads to
value, environmental concern leads to value.
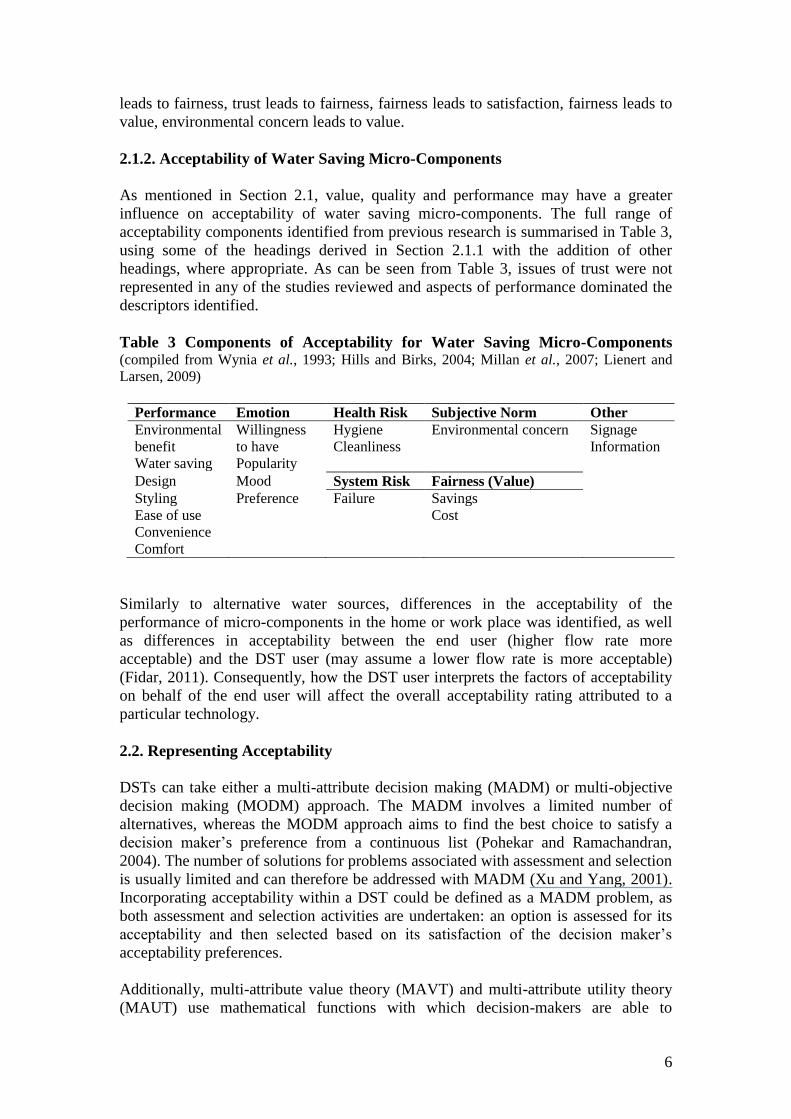
2.1.2. Acceptability of Water Saving Micro-Components
As mentioned in Section 2.1, value, quality and performance may have a greater
influence on acceptability of water saving micro-components. The full range of
acceptability components identified from previous research is summarised in Table 3,
using some of the headings derived in Section 2.1.1 with the addition of other
headings, where appropriate. As can be seen from Table 3, issues of trust were not
represented in any of the studies reviewed and aspects of performance dominated the
descriptors identified.
Table 3 Components of Acceptability for Water Saving Micro-Components (compiled from Wynia et al., 1993; Hills and Birks, 2004; Millan et al., 2007; Lienert and
Larsen, 2009)
Performance Emotion Health Risk Subjective Norm Other
Environmental
benefit
Willingness
to have
Hygiene
Cleanliness
Environmental concern Signage
Information
Water saving Popularity
Design Mood System Risk Fairness (Value)
Styling Preference Failure Savings
Ease of use Cost
Convenience
Comfort
Similarly to alternative water sources, differences in the acceptability of the
performance of micro-components in the home or work place was identified, as well
as differences in acceptability between the end user (higher flow rate more
acceptable) and the DST user (may assume a lower flow rate is more acceptable)
(Fidar, 2011). Consequently, how the DST user interprets the factors of acceptability
on behalf of the end user will affect the overall acceptability rating attributed to a
particular technology.
2.2. Representing Acceptability
DSTs can take either a multi-attribute decision making (MADM) or multi-objective
decision making (MODM) approach. The MADM involves a limited number of
alternatives, whereas the MODM approach aims to find the best choice to satisfy a
decision maker’s preference from a continuous list (Pohekar and Ramachandran,
2004). The number of solutions for problems associated with assessment and selection
is usually limited and can therefore be addressed with MADM (Xu and Yang, 2001).
Incorporating acceptability within a DST could be defined as a MADM problem, as
both assessment and selection activities are undertaken: an option is assessed for its
acceptability and then selected based on its satisfaction of the decision maker’s
acceptability preferences.
Additionally, multi-attribute value theory (MAVT) and multi-attribute utility theory
(MAUT) use mathematical functions with which decision-makers are able to
7
construct their preferences; the a priori preference weighted sum method being the
most commonly used approach (Fidar, 2011). Preferences may be articulated in terms
of goals or the relative importance of different objectives (Fidar, 2011). Most
preference methods incorporate parameters, such as coefficients, exponents or
constraints that reflect a decision maker‘s preferences. Therefore, using a MADM
approach with an a priori weighted sum method, the core components of acceptability
for alternative water sources and micro-components identified in Sections 2.1.1. and
2.1.2. were used as a set of acceptability attributes for incorporation within the model
to yield an overall ‘acceptability function’ for a number of technology options.
Subsequently, the model is referred to as the Acceptability Function (AF) model.
2.2.1. Representing Acceptability Components
Balancing the representation of ‘expert’ and community knowledge within a DST
requires a dialogue to be established and maintained between stakeholders, so that
public knowledge can find a place in water service planning. Therefore a DST should
not fully replace the thought-processes of the user, rather it should assist them in
utilising local information to make judgements in the decision making process.
In order to represent this interaction within the AF model, the DST user inputs certain
acceptability component values, based on their knowledge of community attitudes for
their area. DST users are thereby incentivised to maintain an interest in the
views/perceptions of their area. Judgements on the value to input could be estimated
from newspaper articles related to (supporting or rejecting) water schemes/initiatives
or popular pole surveys that are conducted from time to time. Therefore although the
representation of acceptance within the DST is largely numerical, the DST user still
has to ‘know’ their community and make inferences/judgements about their values.
Such knowledge can only be gained through consultation with the water end-user, in
order to make informed judgements on the rating used for each of the acceptability
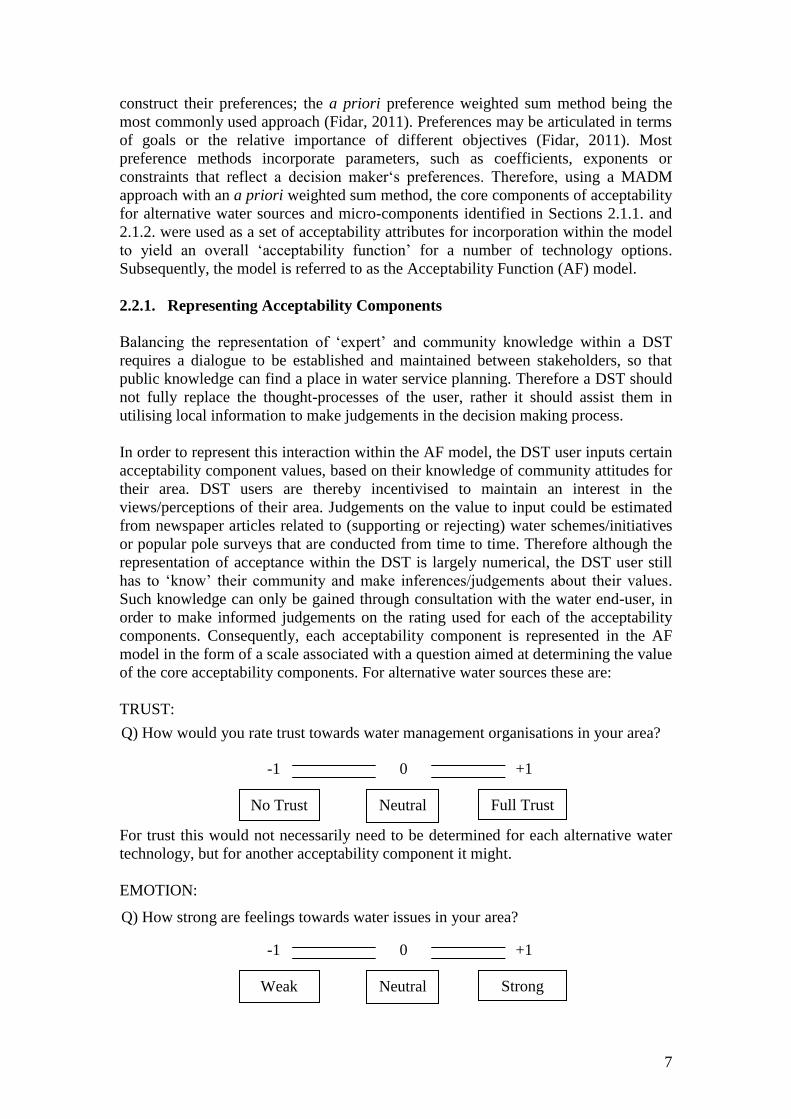
components. Consequently, each acceptability component is represented in the AF
model in the form of a scale associated with a question aimed at determining the value
of the core acceptability components. For alternative water sources these are:
TRUST:
For trust this would not necessarily need to be determined for each alternative water
technology, but for another acceptability component it might.
EMOTION:
-1 +1 0
Weak Strong Neutral
-1 +1 0
No Trust Full Trust Neutral
Q) How would you rate trust towards water management organisations in your area?
Q) How strong are feelings towards water issues in your area?
8
FAIRNESS:
SUBJECTIVE NORM:
The latter two components are technology specific and would need to be rated for
each technology option being considered by planners or water managers.
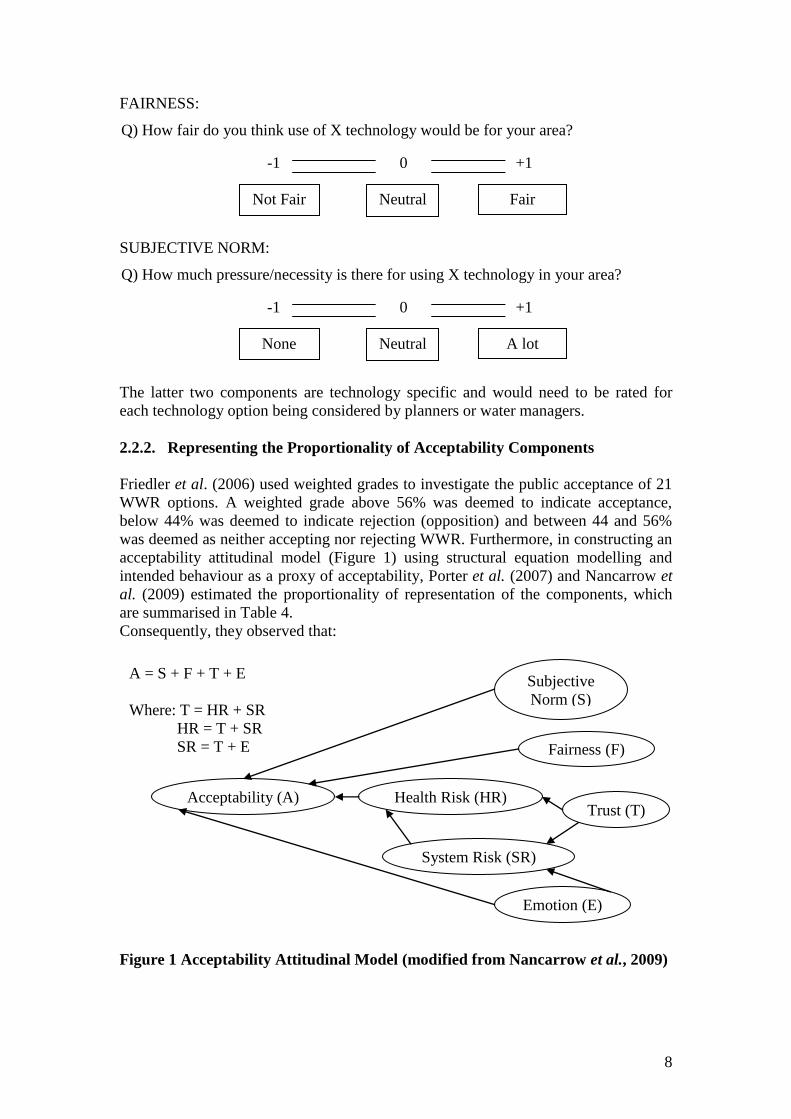
2.2.2. Representing the Proportionality of Acceptability Components
Friedler et al. (2006) used weighted grades to investigate the public acceptance of 21
WWR options. A weighted grade above 56% was deemed to indicate acceptance,
below 44% was deemed to indicate rejection (opposition) and between 44 and 56%
was deemed as neither accepting nor rejecting WWR. Furthermore, in constructing an
acceptability attitudinal model (Figure 1) using structural equation modelling and
intended behaviour as a proxy of acceptability, Porter et al. (2007) and Nancarrow et
al. (2009) estimated the proportionality of representation of the components, which
are summarised in Table 4.
Consequently, they observed that:
Figure 1 Acceptability Attitudinal Model (modified from Nancarrow et al., 2009)
A = S + F + T + E
Where: T = HR + SR
HR = T + SR
SR = T + E
Acceptability (A) Health Risk (HR)
Subjective
Norm (S)
Fairness (F)
Trust (T)
Emotion (E)
System Risk (SR)
-1 +1 0
None A lot Neutral
-1 +1 0
Not Fair Fair Neutral
Q) How fair do you think use of X technology would be for your area?
Q) How much pressure/necessity is there for using X technology in your area?
9
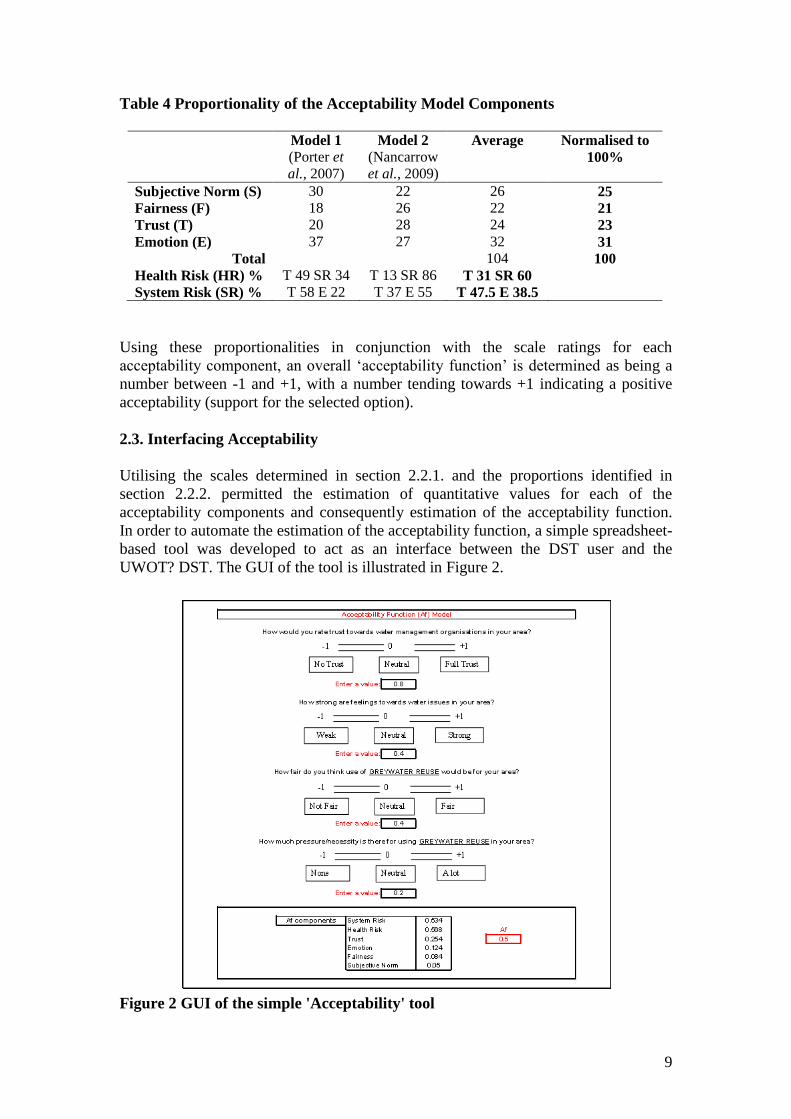
Table 4 Proportionality of the Acceptability Model Components
Model 1
(Porter et
al., 2007)
Model 2
(Nancarrow
et al., 2009)
Average Normalised to
100%
Subjective Norm (S) 30 22 26 25
Fairness (F) 18 26 22 21
Trust (T) 20 28 24 23
Emotion (E) 37 27 32 31
Total 104 100
Health Risk (HR) % T 49 SR 34 T 13 SR 86 T 31 SR 60
System Risk (SR) % T 58 E 22 T 37 E 55 T 47.5 E 38.5
Using these proportionalities in conjunction with the scale ratings for each
acceptability component, an overall ‘acceptability function’ is determined as being a
number between -1 and +1, with a number tending towards +1 indicating a positive
acceptability (support for the selected option).
2.3. Interfacing Acceptability
Utilising the scales determined in section 2.2.1. and the proportions identified in
section 2.2.2. permitted the estimation of quantitative values for each of the
acceptability components and consequently estimation of the acceptability function.
In order to automate the estimation of the acceptability function, a simple spreadsheet-
based tool was developed to act as an interface between the DST user and the
UWOT? DST. The GUI of the tool is illustrated in Figure 2.
Figure 2 GUI of the simple 'Acceptability' tool
10
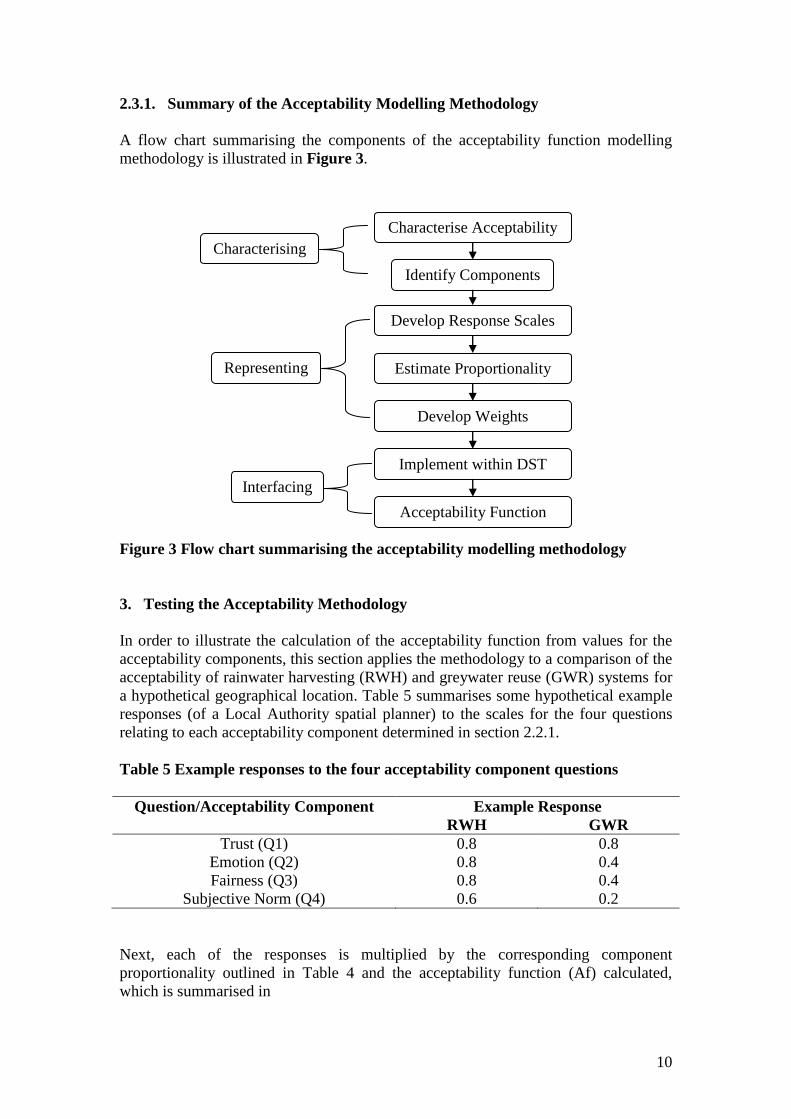
2.3.1. Summary of the Acceptability Modelling Methodology
A flow chart summarising the components of the acceptability function modelling
methodology is illustrated in Figure 3.
Figure 3 Flow chart summarising the acceptability modelling methodology
3. Testing the Acceptability Methodology
In order to illustrate the calculation of the acceptability function from values for the
acceptability components, this section applies the methodology to a comparison of the
acceptability of rainwater harvesting (RWH) and greywater reuse (GWR) systems for
a hypothetical geographical location. Table 5 summarises some hypothetical example
responses (of a Local Authority spatial planner) to the scales for the four questions
relating to each acceptability component determined in section 2.2.1.
Table 5 Example responses to the four acceptability component questions
Question/Acceptability Component Example Response
RWH GWR
Trust (Q1) 0.8 0.8
Emotion (Q2) 0.8 0.4
Fairness (Q3) 0.8 0.4
Subjective Norm (Q4) 0.6 0.2
Next, each of the responses is multiplied by the corresponding component
proportionality outlined in Table 4 and the acceptability function (Af) calculated,
which is summarised in
Characterise Acceptability
Identify Components
Develop Response Scales
Estimate Proportionality
Develop Weights
Implement within DST
GUI
Characterising
Representing
Interfacing
Acceptability Function

11
Table 6. As can be seen in Table 6, the Af of RWH is greater than GWR, indicating
that, for the hypothetical geographical location, RWH is more acceptable than GWR,
based on the judgements made by the DST user.
Table 6 Hypothetical example of calculating the acceptability function (Af) for
RWH and GWR
RWH GWR
SR = (0.8 x 0.475)+(0.8 x 0.385)
= 0.38+0.308 = 0.688
SR = (0.8 x 0.475)+(0.4 x 0.385)
= 0.38+0.154 = 0.534
HR = (0.8 x 0.31)+(0.6 x 0.688)
= 0.248+0.688 = 0.408
HR = (0.8 x 0.31)+(0.6 x 0.534)
= 0.248+0.320 = 0.568
T = 0.68+0.408 = 1.088 T = 0.568+0.534 = 1.102
T = 1.088 x 0.23 = 0.25 T = 1.102 x 0.23 = 0.254
E = 0.8 x 0.31 = 0.248 E = 0.4 x 0.31 = 0.124
F = 0.8 x 0.21 = 0.168 F = 0.4 x 0.21 = 0.084
S = 0.6 x 0.25 = 0.15 S = 0.2 x 0.25 = 0.05
Af = 0.25+0.248+0.168+0.15 Af = 0.254+0.124+0.084+0.05
Af 0.8 0.5
4. Conclusion
Finding enough water and sanitation resources to meet people’s needs is still one of
the greatest challenges faced by politicians, engineers and planners. Consequently,
new approaches to water management recommend the utilisation of sustainable and
integrated techniques, such as rainwater harvesting and greywater reuse. However, the
uptake of these technologies is, at present, impeded by a number of barriers. One of
the main perceived barriers is their socio-cultural acceptability by a range of
stakeholders. Despite the plethora of studies characterising acceptability, limited
research has considered how to distil findings into an easily useable format for
planners, water managers and engineers.
By undertaking a thorough literature review of acceptability research, the main
components of acceptability for alternative water systems and water saving
microcomponents have been established. Acceptability components for alternative
water systems include subjective norms, trust, emotion, system risk, health risk and
fairness. Using these components as a framework, a methodology and model to
estimate the ‘acceptability function’ of alternative water systems and water saving
microcomponents has been developed. A simple spreadsheet model has been
constructed, allowing the interface of the model with the Urban Water Optioneering
Tool (UWOT?), a decision support tool developed at the University of Exeter. Further
research is required to examine the efficacy of the developed methodology and model
in the ‘real world’ i.e. in use with Local Authority planners and water managers.
Acknowledgements
This work was carried out as part of the ‘Regional Visions of Integrated Sustainable
Infrastructure optimised for Neighbourhoods’ (ReVISIONS) project
12
(http://www.regionalvisions.ac.uk) funded under the UK Engineering and Physical
Science Research Council’s ‘Sustainable Urban Environment’ Programme.
References
Bruvold, W. H., Olson, B. H. & Rigby, M. (1981) Public policy for the use of
reclaimed water. Environmental Management, 5(2), 95–107.
Butler, D. and Ward, S. (In Press) Sustainable water management – making it happen!
Editorial, Water and Sewerage Journal (2011).
Coombes, P. & Kuczera, G. (2001) Rainwater tank design for water supply and
stormwater management. Stormwater Industry Association 2001 Regional
Conference. Port Stephens, NSW, Australia.
CRCCH (Cooperative Research Centre for Catchment Hydrology) (2005) MUSIC
User Guide. CRCCH website, www.toolkit.net.au/music, visited 11 September 2007.
Dixon, A., Butler, D. and Fewkes, A. (1999) Water saving potential of domestic water
recycling systems using greywater and rainwater in combination. Water Science and
Technology. 39(5), 25–32.
Dolnicar, S. and Hurlimann, A. (2009) Drinking water from alternative water sources:
differences in beliefs, social norms and factors perceived behavioural control across
eight Australian locations. Water Science and Technology, 60 (6), 1433-1444.
Domenech, L. and Sauri, D. (2010) Socio-technical transitions in water scarcity
contexts: public acceptance of greywater reuse technologies in the Metropolitan area
of Barcelona. Resources, Conservation and Recycling, 55 (1), 53-62.
Fidar, A. (2011) Environmental and economic implications of water efficiency
measures in buildings. PhD thesis, University of Exeter.
Friedler, E. Lahav, O., Jizhaki, H. and Lahav, T. (2006) Study of urban population
attitudes towards various wastewater reuse options: Israel as a case study. Journal of
Environmental Management, 81, 360-370.
Hartley, T. (2001) Public perception and participation in water reuse: literature
summary. Resolve Inc, Washington.
Herrmann, T. & Schmida, U. (1999) Rainwater utilisation in Germany: efficiency,
dimensioning, hydraulic and environmental aspects. Urban Water, 1, 307–316.
Hills, S. and Birks, R. (2004) Washroom behaviour and users’ perceptions of ‘novel’
water-efficient appliances. Water Science and Technology: Water Supply, 4 (3), 13-
23.
Hurlimann, A. (2007a) Is recycled water risky? An urban Australian community’s
perspective. Environmentalist, 27, 83-94.
Hurlimann, A. (2007b) Recycled water risk perception – a comparison of two case
studies. Efficient (conference) 2007, Korea.

13
Islam, M. M., Chou, F. N.-F. and Kabir, M. R. (2010) Acceptability of the rainwater
harvesting system to the slum dwellers of Dhaka City. Water Science and Technology,
61 (6), 1515-1523.
Jeffrey, P. and Jefferson, B. (2003) Pubic receptivity regarding in-house water
recycling: results from a UK survey. Water Science and Technology – Water Supply,
3 (3), 109-116.
Lienert, J. and Larsen, T. A. (2009) High acceptance of urine source separation in
seven European countries: a review. Environmental Science and Technology, 44 (2),
556-566.
Makropoulos, C. K., Natsis, K., Liu, S., Mittas, K. and Butler, D. (2008) Decision
support for sustainable option selection in integrated urban water management,
Environmental Modelling and Software, 23 (12), 1448-1460.
Menegaki, A. N., Hanley, N. and Tsagarakis, K. P. (2007) The social acceptability
and valuation of recycled water in Crete: a study of consumers’ and farmers’ attitudes.
Ecological Economics, 62, 7-18.
Millan, AM., Memon, F.A., Butler, D., Littlewood, K. (2007) User perceptions and
basic performance of an innovative WC. Water Management Challenges in Global
Change. CCWI2007 and SUWM2007 Conference. Leicester, UK.
Mitchell, V. G. (2005) Aquacycle - user guide. Catchment modelling toolkit website,
http://www.toolkit.net.au, visited 18 October 2007.
Mitchell, V. G., Duncan, H., Inman, M., Rahilly, M., Stewart, J., Vieritz, A., Holt, P.,
Grant, A., Fletcher, T., Coleman, J., Shiroma, M., Sharma, A., Delectic, A. and Breen,
P. (2007) Integrated urban water modelling - past, present and future. Proceedings of
the 13th
International Rainwater Catchment Systems Conference and 5th
International
Water Sensitive Urban Design Conference. Sydney, Australia.
Nancarrow, B. E., Leviston, Z. and Tucker, D. I. (2009) Measuring the predictors of
communities’ behavioural decisions for potable reuse of wastewater. Water Science
and Technology, 60 (12), 3199-3209.
Pohekar, S. and Ramachandran, M. (2004). Application of multi-criteria decision
making to sustainable energy planning—A review. European Journal of Operational
Research, 8 (4), 365 – 381.
Porter, N. B., Leviston, Z. and Nancarrow, B. E. (2007) Interpreting householder
preferences in the evaluation and acceptance of water supply systems. 7th
Urban
Drainage Modelling & 4th
Water Sensitive Urban Drainage Conference.
Porter, N. B., Leviston, Z. and Nancarrow, B. E., Po, M. and Syme, G.J. (2005)
Interpreting householder preferences to evaluate water supply systems: an attitudinal
model. CSIRO Report, ISBN 0 643 09252 8, Accessed 20th
December 2010
14
http://www.clw.csiro.au/publications/consultancy/2005/WfHC_water-supply-
preferences.pdf
Roebuck, R. M. and Ashley, R. M. (2007) Predicting the hydraulic and life-cycle
cost performance of rainwater harvesting systems using a computer based modelling
tool. Water Practice and Technology, 2 (2).
Shove, E. (2003) Comfort, cleanliness and convenience: the social organisation of
normality. Bergamon, Oxford.
Stenekes, N., Colebatch, H. K., Waite, T. D. and Ashbolt, N. J. (2006) Risk and
governance in water recycling: public acceptance revisited. Science, Technology and
Human Values, 31 (2), 107-134.
Stewardson, M., McMahon, T. and Spears, M. (1995) Krakatoa: a model to assist
integrated water resource management decision-making in urban areas. AWWA 16th
Federal Convention, Sydney.
Ward, S. (2010) Rainwater harvesting in the UK: a strategic framework to enable
transition from novel to mainstream. Published PhD thesis, University of Exeter.
Available at: http://hdl.handle.net/10036/106575.
Wynia, W., Sudar, A. and Jones, G. (1993) Recycling human waste: composting
toilets as a remedial action plan option for Hamilton Harbour. Water Pollution
Research Journal of Canada, 28 (2), 355-368.
Xu, L. and Yang, J. (2001). Introduction to multi-criteria decision making and the
evidential reasoning Approach. University of Manchester Institute of Science and
Technology. Working Paper No. 0106.