Surface characterization of Al2O3–SiO2 supported NiMo
catalysts: An effect of support composition
Carolina Leyva, Mohan S. Rana, Jorge Ancheyta *
Instituto Mexicano del Petroleo, Eje Central Lazaro Cardenas Norte 152, Col. San Bartolo Atepehuacan, D.F. 07730 Mexico
www.elsevier.com/locate/cattod
Available online at www.sciencedirect.com
Catalysis Today 130 (2008) 345–353
Abstract
Al2O3–SiO2 mixed oxide has been investigated as a support for hydrotreating catalyst with variation of its composition [Si/(Si + Al) = 0.06,
0.12, 0.31, 0.56, 0.78] and its interaction with the surface active metals (NiMo). The composition of support and surface species (NiMo) of catalysts
were characterized by specific surface area, atomic absorption, SEM-EDX, XRD, temperature programmed reduction (TPR), Raman analysis,
scanning electron microscopy (STEM) and transmission electron microscopy (TEM). Incorporation of SiO2 in Al2O3 promotes a weak interaction
between the active phases and particularly catalyst that predominated with SiO2 content. The oxide and sulfided catalysts characterization indicated
that the effect of support is responsible to form different catalytic sites. Crystallization of MoO3 phases and a relatively longer crystal of MoS2 in
the sulfided catalyst were attributed to an increasing SiO2 content in the support. The catalytic behavior of the NiMo supported catalysts is
explained in terms of structural changes on the surface due to the support and active metal interactions. The activity of the different catalysts
evaluated in the thiophene hydrodesulfurization reaction was higher for the catalyst having lower SiO2 content in the support.
# 2007 Elsevier B.V. All rights reserved.
Keywords: NiMo/SiO2–Al2O3; Support effect; STEM; Raman; XRD; TPR; HRTEM; Metal sulfides
1. Introduction
In order to prepare effective hydrotreating catalysts to meet
the challenge of environmental regulations to reduce sulfur,
several approaches are in vogue, among which variation of
support is an important one, which is responsible of the nature
and dispersion of catalytic sites. Generally, SiO2 supported
hydrotreating catalysts are known to be less active for
hydrotreating reactions compared with conventional Al2O3
supported catalysts, but they have better textural properties and
possess some acidity on the support [1]. Therefore, it is felt that
the combination of these two oxides as a support could have a
synergistic impact on hydrotreating and such properties make
them potentially attractive particularly as a support for
hydroprocessing of heavy oil catalysts [2]. However, silica
has been known for its poor dispersion of molybdenum phase
* Corresponding author at: Instituto Mexicano del Petroleo, Eje Central
Lazaro Cardenas 152, D.F. 07730 Mexico. Tel.: +52 55 9175 8443;
fax: +52 55 9175 8429.
E-mail address: [email protected] (J. Ancheyta).
0920-5861/$ – see front matter # 2007 Elsevier B.V. All rights reserved.
doi:10.1016/j.cattod.2007.10.113
[3]. That is the reason why alumina is used principally as a
commercial support because it is economically favorable and
has capability to acquire high dispersion of MoS2.
Silica–alumina supported NiMo catalysts have been used for
deep hydrodesulfurization of gas oil in which silica also favors
the hydrodenitrogenation [4,5]. Generally, the amorphous
SiO2–Al2O3 support is used for hydrocracking catalysts due to
its favorable acidity [6,7]. The major problem when using these
acid materials for hydroprocessing applications is their high
tendency to coke formation, which reduces catalyst activity
with time-on-stream. The effect of silica support on hydro-
treating catalyst has been reported using different composition,
methods of preparation, evaluation with different feeds, etc. in
the literature either alone or mixed with alumina [8–10]. The
combination of two oxides (Al2O3 and SiO2) has amorphous
nature and a wide assortment of Brønsted and Lewis acid sites,
which provide a greater acidity than that of individual alumina
or silica. Moreover, the low isoelectric point (IEP, i.e.,�2.5) of
SiO2 can be enhanced by adding alumina that improves
interaction between support and active metals [11]. The
interactions of active phases are further responsible of catalytic
activity. Since alumina has higher IEP (i.e., �8), thus, it is
C. Leyva et al. / Catalysis Today 130 (2008) 345–353346
necessary to find out the detailed effect of surface species that
are carried out by the SiO2–Al2O3 mixed oxide support. The
isoelectic point or zero point charge (ZPC) of Al2O3–SiO2 (50/
50, w/w) was reported in literature to be at around 6–7.5 [12–
14]. The structural information of supported (Ni and Mo)
phases can be obtained by XRD, Raman, temperature
programmed reduction (TPR) on oxide state while the
dispersion of supported MoS2 phases can be confirmed by
TEM [15].
The role of SiO2 in improving the performance of catalysts is
not clearly understood but it has been widely reported that
increased acidity of silica–alumina support improves catalyst
performance particularly for deep HDS of diesel fuel [16].
Moreover, it is also well known that hydrotreating catalyst
undergoes large structural changes during the sulfidation [17]
which depend on the nature of support as well as the preparation
method of the catalysts [18]. Particularly in the case of SiO2–
Al2O3, Makishima et al. [19] reported that increasing the silica
content in the support suppresses the growth of WS2 slabs.
Although the characterization and reactivity studies of
supported SiO2–Al2O3 catalysts have been the topic of several
papers [20–22], detailed studies on the Mo and Ni species
interaction with variation of support composition have been
scarce, which depends on the support IEP variation as well as
impregnation pH of the solution.
The aim of this study is to find out the nature of supported
species in oxide as well as sulfide state and support effect on the
dispersion of MoS2, Ni–S phases and thiophene hydrodesul-
furization. An increasing SiO2 content in the support promotes
the crystallization of MoO3 phases, and a relatively longer
crystal of MoS2 in the sulfided catalysts. In order to estimate the
interaction between support and active metals (Ni and Mo
species), the catalysts were characterized in oxide as well as
sulfide states.
2. Experimental
The support composition was varied by adjusting the
amounts of aluminum nitrate and sodium silicate solution
[Si/(Si + Al) = 0.06, 0.12, 0.31, 0.56, 0.78, w/w]. The SiO2–
Al2O3 supports were obtained by sol–gel homogeneous co-
precipitation method using NH4OH as precipitating agent.
The aqueous solutions were mixed together slowly with
controlled pH (2.5–9) and the precipitate was aged over night
at 60 8C (pH �8.5) and filtered with the required amount of
distilled water in order to wash Na+ ions. The solid was dried
at room temperature, 120 8C, and finally calcined at 550 8Cfor 4 h. These Al2O3–SiO2 (AS) supports are labeled as AS-
1(0.06), AS-2 (0.12), AS-3 (0.31), AS-4 (0.56), and AS-5
(0.78).
The nickel and molybdenum (NiMo) catalyst was prepared
by the incipient wetness co-impregnation method in aqueous
medium (pH�5.4) using appropriated amount of nickel nitrate
and ammonium heptamolybdate. The impregnated catalysts
were dried in air at 120 8C and calcined at 450 8C for 4 h. The
supported catalysts are hereafter known as NiMoAS-1,
NiMoAS-2, NiMoAS-3, NiMoAS-4, and NiMoAS-5.
The supports and catalysts were characterized by different
techniques. BET specific surface area (SSA), total pore
volume (TPV) and pore size distribution (PSD) were carried
out in a Quantochrome Nova 4000 equipment using nitrogen
gas at liquid nitrogen temperature (77 K). The composition
of catalysts was studied by means of elemental analysis with
an SEM-FIB analytical instrument xT Nova NanoLab 200,
using SEM-EDX analysis. The sample was deposited on a
carbon holder and evacuated at high vacuum (10�5 Torr)
before images were taken. The nickel and molybdenum
contents on catalysts were analyzed by atomic absorption
spectrometry (ASTM D5863). Raman spectroscopy was
applied for determining the nature of deposited species on
catalysts using the laser power at the source of 514.5 nm and
5 mW. X-ray diffraction was performed on SIEMENS D-500
equipped with rotating and Cu Ka (l = 0.15418 nm)
radiation.
For TPR analyses an Altamira AMI-3 was used. A 20 mg
sample of each promoted catalyst was reduced in a stream of
H2/Ar (10/90) at a flow rate of 30 ml/min, from 30 to 900 8C,
analyzing the off gas by a TCD. Prior to each measurement the
sample was preheated in a stream of Ar at 450 8C for 30 min to
remove adsorbed water.
The sulfided catalysts transmission electron microscopy
(TEM) was performed in JEM-2200FS transmission electron
microscope with accelerating voltage of 200 kV. The micro-
scope is equipped with a Schottky-type field emission gun and
an ultra high-resolution configuration (Cs = 0.5 mm;
Cc = 1.1 mm; point to point resolution, 0.19 nm) and in-
column energy filter omega-type. Local chemical analysis and
chemical mapping by energy dispersive X-ray spectrometry
(EDX) was carried out in an energy dispersive X-ray
spectroscope, NORAN, which is attached to the microscope
and using the STEM-EDX combination. The samples were
grounded, suspended in n-heptane at room temperature, and
dispersed with ultrasonic agitation; then, an aliquot of the
solution was dropped on a 3 mm diameter lacey carbon copper
grid. Five different zones were estimated for STEM analysis
and the selected size of zone was 50 nm. For TEM, at least 10
representative micrographs were taken for each catalyst in
high-resolution mode. While an average length (Lav) and
number of the stacks (Nav) of at least 120 slabs were measured
for each catalyst.
The thiophene HDS reaction was conducted in a fixed-
bed reactor operating at atmospheric pressure and inter-
faced with an online analysis at 400 8C with a flow of H2/
C4H4S mixture using a saturator temperature of 5 8C in order
to have 4.7 mole% thiophene at the entrance of the reactor.
Prior to HDS reaction, the catalyst was sulfided at 400 8C for
3 h in a flow of a CS2/H2 mixture. First-order rates were
calculated according to the equation [r = x(W/F)], where r
is the rate in mol h�1 g�1cat:, x the fractional conversion, W
the weight of the catalyst in g, and F the flow rate of the
reactant in mol h�1. The particle sizes of the catalysts were
20–40 mesh and the conversions were kept below 15% to
avoid diffusional limitations and operate under differential
regime.
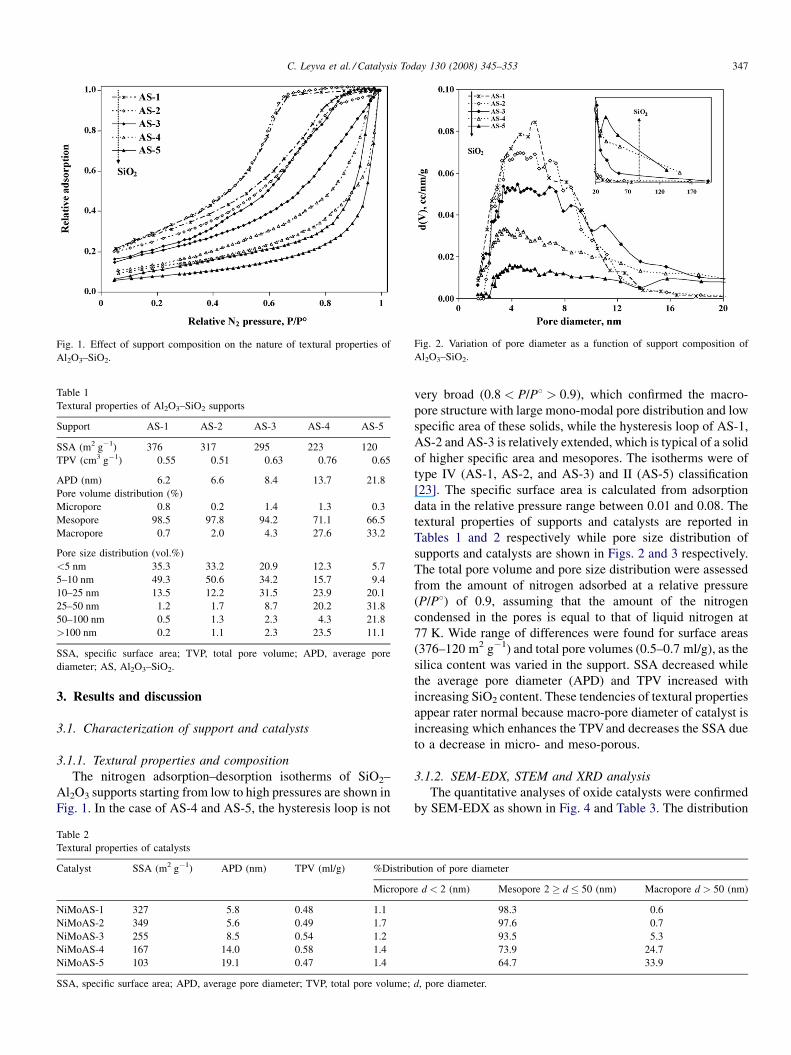
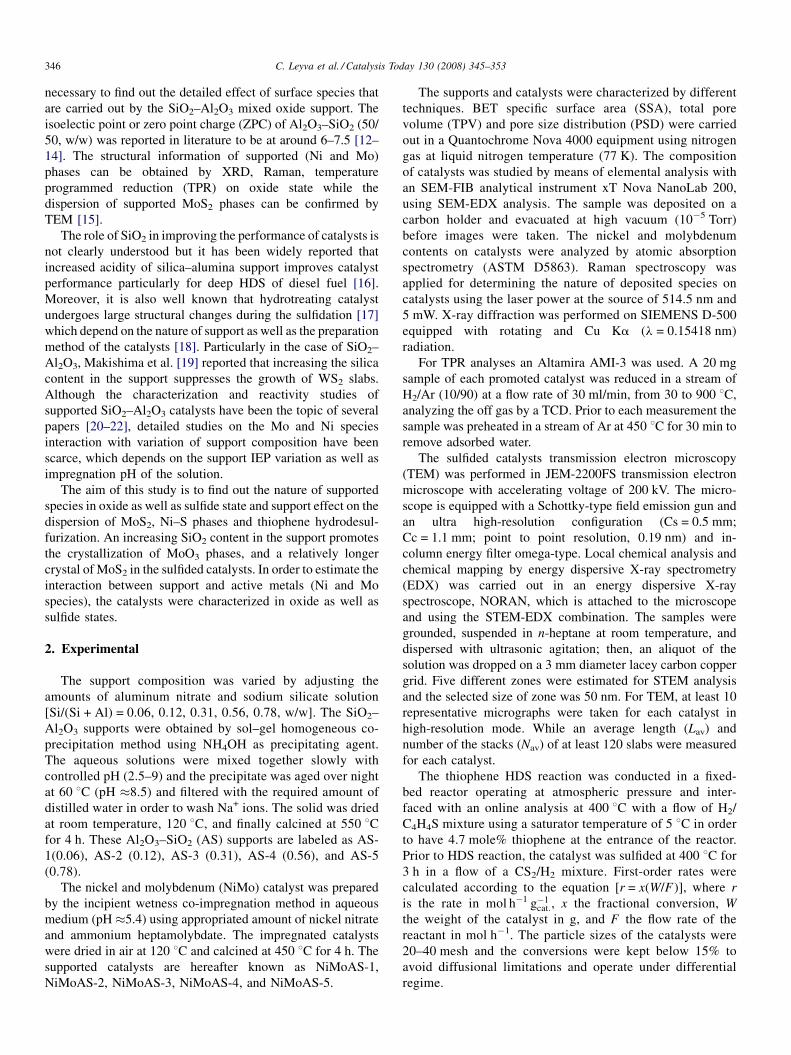
Fig. 2. Variation of pore diameter as a function of support composition of
Al2O3–SiO2.
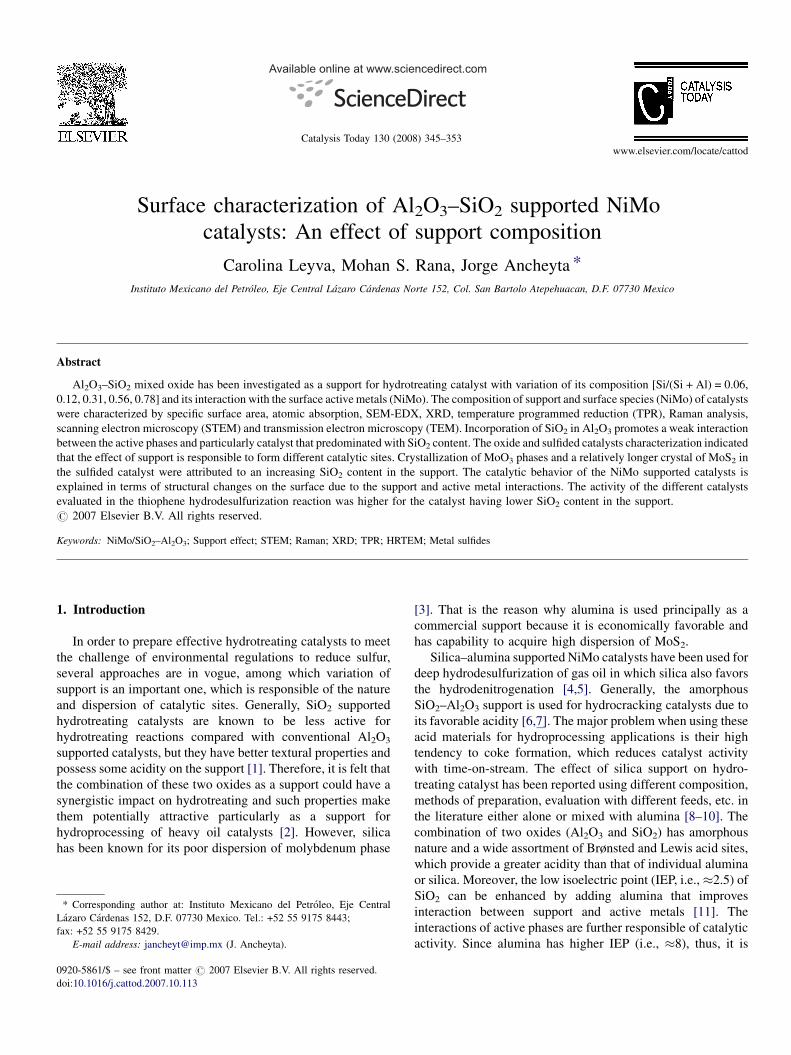
Fig. 1. Effect of support composition on the nature of textural properties of
Al2O3–SiO2.
Table 1
Textural properties of Al2O3–SiO2 supports
Support AS-1 AS-2 AS-3 AS-4 AS-5
SSA (m2 g�1) 376 317 295 223 120
TPV (cm3 g�1) 0.55 0.51 0.63 0.76 0.65
APD (nm) 6.2 6.6 8.4 13.7 21.8
Pore volume distribution (%)
Micropore 0.8 0.2 1.4 1.3 0.3
Mesopore 98.5 97.8 94.2 71.1 66.5
Macropore 0.7 2.0 4.3 27.6 33.2
Pore size distribution (vol.%)
<5 nm 35.3 33.2 20.9 12.3 5.7
5–10 nm 49.3 50.6 34.2 15.7 9.4
10–25 nm 13.5 12.2 31.5 23.9 20.1
25–50 nm 1.2 1.7 8.7 20.2 31.8
50–100 nm 0.5 1.3 2.3 4.3 21.8
>100 nm 0.2 1.1 2.3 23.5 11.1
SSA, specific surface area; TVP, total pore volume; APD, average pore
diameter; AS, Al2O3–SiO2.
C. Leyva et al. / Catalysis Today 130 (2008) 345–353 347
3. Results and discussion
3.1. Characterization of support and catalysts
3.1.1. Textural properties and composition
The nitrogen adsorption–desorption isotherms of SiO2–
Al2O3 supports starting from low to high pressures are shown in
Fig. 1. In the case of AS-4 and AS-5, the hysteresis loop is not
Table 2
Textural properties of catalysts
Catalyst SSA (m2 g�1) APD (nm) TPV (ml/g) %Distrib
Micropor
NiMoAS-1 327 5.8 0.48 1.1
NiMoAS-2 349 5.6 0.49 1.7
NiMoAS-3 255 8.5 0.54 1.2
NiMoAS-4 167 14.0 0.58 1.4
NiMoAS-5 103 19.1 0.47 1.4
SSA, specific surface area; APD, average pore diameter; TVP, total pore volume;
very broad (0.8 < P/P8 > 0.9), which confirmed the macro-
pore structure with large mono-modal pore distribution and low
specific area of these solids, while the hysteresis loop of AS-1,
AS-2 and AS-3 is relatively extended, which is typical of a solid
of higher specific area and mesopores. The isotherms were of
type IV (AS-1, AS-2, and AS-3) and II (AS-5) classification
[23]. The specific surface area is calculated from adsorption
data in the relative pressure range between 0.01 and 0.08. The
textural properties of supports and catalysts are reported in
Tables 1 and 2 respectively while pore size distribution of
supports and catalysts are shown in Figs. 2 and 3 respectively.
The total pore volume and pore size distribution were assessed
from the amount of nitrogen adsorbed at a relative pressure
(P/P8) of 0.9, assuming that the amount of the nitrogen
condensed in the pores is equal to that of liquid nitrogen at
77 K. Wide range of differences were found for surface areas
(376–120 m2 g�1) and total pore volumes (0.5–0.7 ml/g), as the
silica content was varied in the support. SSA decreased while
the average pore diameter (APD) and TPV increased with
increasing SiO2 content. These tendencies of textural properties
appear rater normal because macro-pore diameter of catalyst is
increasing which enhances the TPV and decreases the SSA due
to a decrease in micro- and meso-porous.
3.1.2. SEM-EDX, STEM and XRD analysis
The quantitative analyses of oxide catalysts were confirmed
by SEM-EDX as shown in Fig. 4 and Table 3. The distribution
ution of pore diameter
e d < 2 (nm) Mesopore 2 � d � 50 (nm) Macropore d > 50 (nm)
98.3 0.6
97.6 0.7
93.5 5.3
73.9 24.7
64.7 33.9
d, pore diameter.
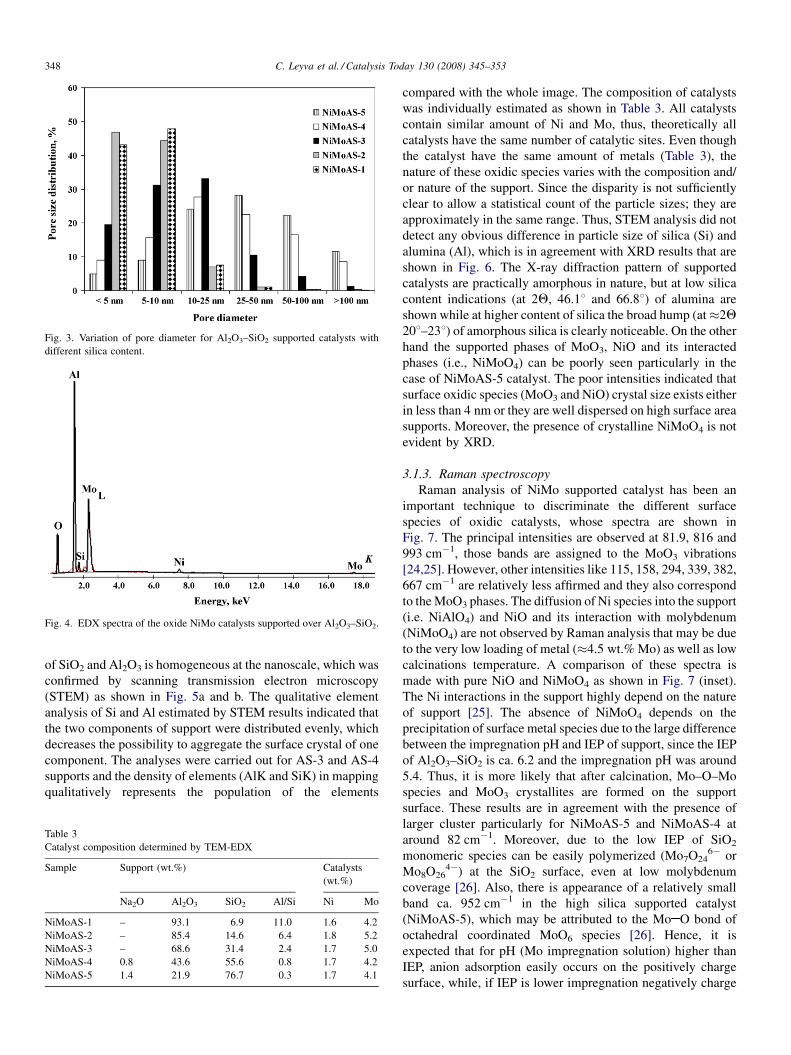
Fig. 3. Variation of pore diameter for Al2O3–SiO2 supported catalysts with
different silica content.
Fig. 4. EDX spectra of the oxide NiMo catalysts supported over Al2O3–SiO2.
C. Leyva et al. / Catalysis Today 130 (2008) 345–353348
of SiO2 and Al2O3 is homogeneous at the nanoscale, which was
confirmed by scanning transmission electron microscopy
(STEM) as shown in Fig. 5a and b. The qualitative element
analysis of Si and Al estimated by STEM results indicated that
the two components of support were distributed evenly, which
decreases the possibility to aggregate the surface crystal of one
component. The analyses were carried out for AS-3 and AS-4
supports and the density of elements (AlK and SiK) in mapping
qualitatively represents the population of the elements
Table 3
Catalyst composition determined by TEM-EDX
Sample Support (wt.%) Catalysts
(wt.%)
Na2O Al2O3 SiO2 Al/Si Ni Mo
NiMoAS-1 – 93.1 6.9 11.0 1.6 4.2
NiMoAS-2 – 85.4 14.6 6.4 1.8 5.2
NiMoAS-3 – 68.6 31.4 2.4 1.7 5.0
NiMoAS-4 0.8 43.6 55.6 0.8 1.7 4.2
NiMoAS-5 1.4 21.9 76.7 0.3 1.7 4.1
compared with the whole image. The composition of catalysts
was individually estimated as shown in Table 3. All catalysts
contain similar amount of Ni and Mo, thus, theoretically all
catalysts have the same number of catalytic sites. Even though
the catalyst have the same amount of metals (Table 3), the
nature of these oxidic species varies with the composition and/
or nature of the support. Since the disparity is not sufficiently
clear to allow a statistical count of the particle sizes; they are
approximately in the same range. Thus, STEM analysis did not
detect any obvious difference in particle size of silica (Si) and
alumina (Al), which is in agreement with XRD results that are
shown in Fig. 6. The X-ray diffraction pattern of supported
catalysts are practically amorphous in nature, but at low silica
content indications (at 2Q, 46.18 and 66.88) of alumina are
shown while at higher content of silica the broad hump (at�2Q
208–238) of amorphous silica is clearly noticeable. On the other
hand the supported phases of MoO3, NiO and its interacted
phases (i.e., NiMoO4) can be poorly seen particularly in the
case of NiMoAS-5 catalyst. The poor intensities indicated that
surface oxidic species (MoO3 and NiO) crystal size exists either
in less than 4 nm or they are well dispersed on high surface area
supports. Moreover, the presence of crystalline NiMoO4 is not
evident by XRD.
3.1.3. Raman spectroscopy
Raman analysis of NiMo supported catalyst has been an
important technique to discriminate the different surface
species of oxidic catalysts, whose spectra are shown in
Fig. 7. The principal intensities are observed at 81.9, 816 and
993 cm�1, those bands are assigned to the MoO3 vibrations
[24,25]. However, other intensities like 115, 158, 294, 339, 382,
667 cm�1 are relatively less affirmed and they also correspond
to the MoO3 phases. The diffusion of Ni species into the support
(i.e. NiAlO4) and NiO and its interaction with molybdenum
(NiMoO4) are not observed by Raman analysis that may be due
to the very low loading of metal (�4.5 wt.% Mo) as well as low
calcinations temperature. A comparison of these spectra is
made with pure NiO and NiMoO4 as shown in Fig. 7 (inset).
The Ni interactions in the support highly depend on the nature
of support [25]. The absence of NiMoO4 depends on the
precipitation of surface metal species due to the large difference
between the impregnation pH and IEP of support, since the IEP
of Al2O3–SiO2 is ca. 6.2 and the impregnation pH was around
5.4. Thus, it is more likely that after calcination, Mo–O–Mo
species and MoO3 crystallites are formed on the support
surface. These results are in agreement with the presence of
larger cluster particularly for NiMoAS-5 and NiMoAS-4 at
around 82 cm�1. Moreover, due to the low IEP of SiO2
monomeric species can be easily polymerized (Mo7O246� or
Mo8O264�) at the SiO2 surface, even at low molybdenum
coverage [26]. Also, there is appearance of a relatively small
band ca. 952 cm�1 in the high silica supported catalyst
(NiMoAS-5), which may be attributed to the Mo O bond of
octahedral coordinated MoO6 species [26]. Hence, it is
expected that for pH (Mo impregnation solution) higher than
IEP, anion adsorption easily occurs on the positively charge
surface, while, if IEP is lower impregnation negatively charge
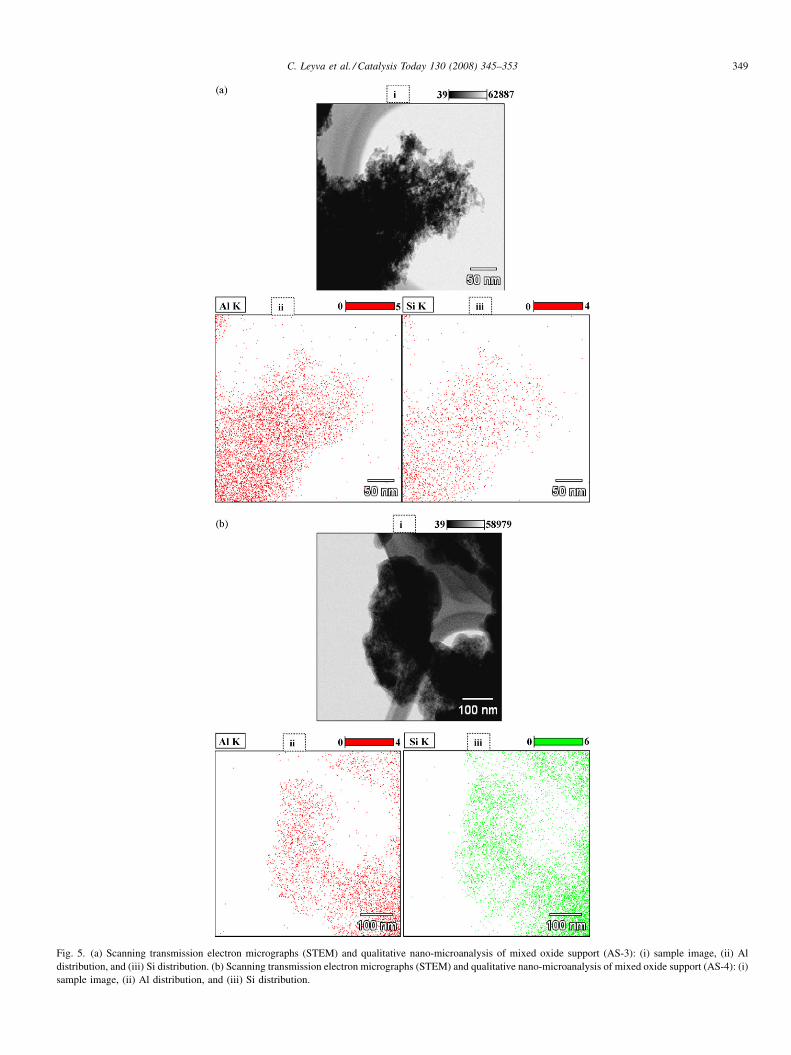
Fig. 5. (a) Scanning transmission electron micrographs (STEM) and qualitative nano-microanalysis of mixed oxide support (AS-3): (i) sample image, (ii) Al
distribution, and (iii) Si distribution. (b) Scanning transmission electron micrographs (STEM) and qualitative nano-microanalysis of mixed oxide support (AS-4): (i)
sample image, (ii) Al distribution, and (iii) Si distribution.
C. Leyva et al. / Catalysis Today 130 (2008) 345–353 349
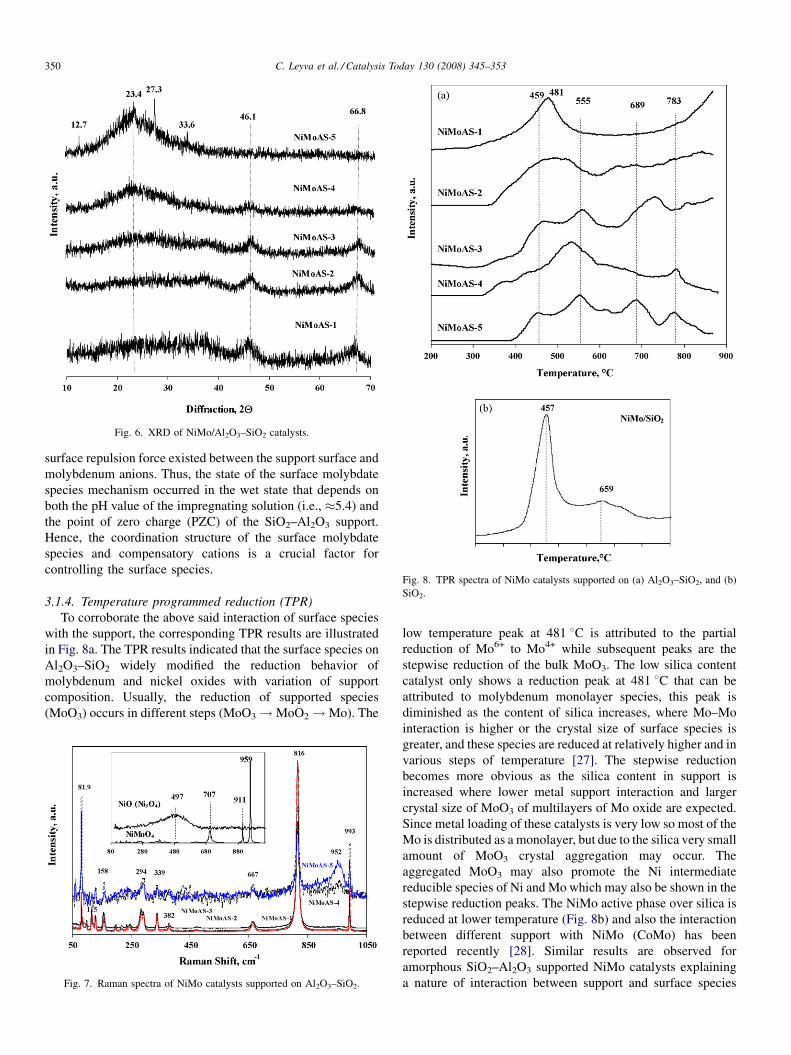
Fig. 6. XRD of NiMo/Al2O3–SiO2 catalysts.
Fig. 8. TPR spectra of NiMo catalysts supported on (a) Al2O3–SiO2, and (b)
SiO2.
C. Leyva et al. / Catalysis Today 130 (2008) 345–353350
surface repulsion force existed between the support surface and
molybdenum anions. Thus, the state of the surface molybdate
species mechanism occurred in the wet state that depends on
both the pH value of the impregnating solution (i.e., �5.4) and
the point of zero charge (PZC) of the SiO2–Al2O3 support.
Hence, the coordination structure of the surface molybdate
species and compensatory cations is a crucial factor for
controlling the surface species.
3.1.4. Temperature programmed reduction (TPR)
To corroborate the above said interaction of surface species
with the support, the corresponding TPR results are illustrated
in Fig. 8a. The TPR results indicated that the surface species on
Al2O3–SiO2 widely modified the reduction behavior of
molybdenum and nickel oxides with variation of support
composition. Usually, the reduction of supported species
(MoO3) occurs in different steps (MoO3!MoO2!Mo). The
Fig. 7. Raman spectra of NiMo catalysts supported on Al2O3–SiO2.
low temperature peak at 481 8C is attributed to the partial
reduction of Mo6+ to Mo4+ while subsequent peaks are the
stepwise reduction of the bulk MoO3. The low silica content
catalyst only shows a reduction peak at 481 8C that can be
attributed to molybdenum monolayer species, this peak is
diminished as the content of silica increases, where Mo–Mo
interaction is higher or the crystal size of surface species is
greater, and these species are reduced at relatively higher and in
various steps of temperature [27]. The stepwise reduction
becomes more obvious as the silica content in support is
increased where lower metal support interaction and larger
crystal size of MoO3 of multilayers of Mo oxide are expected.
Since metal loading of these catalysts is very low so most of the
Mo is distributed as a monolayer, but due to the silica very small
amount of MoO3 crystal aggregation may occur. The
aggregated MoO3 may also promote the Ni intermediate
reducible species of Ni and Mo which may also be shown in the
stepwise reduction peaks. The NiMo active phase over silica is
reduced at lower temperature (Fig. 8b) and also the interaction
between different support with NiMo (CoMo) has been
reported recently [28]. Similar results are observed for
amorphous SiO2–Al2O3 supported NiMo catalysts explaining
a nature of interaction between support and surface species
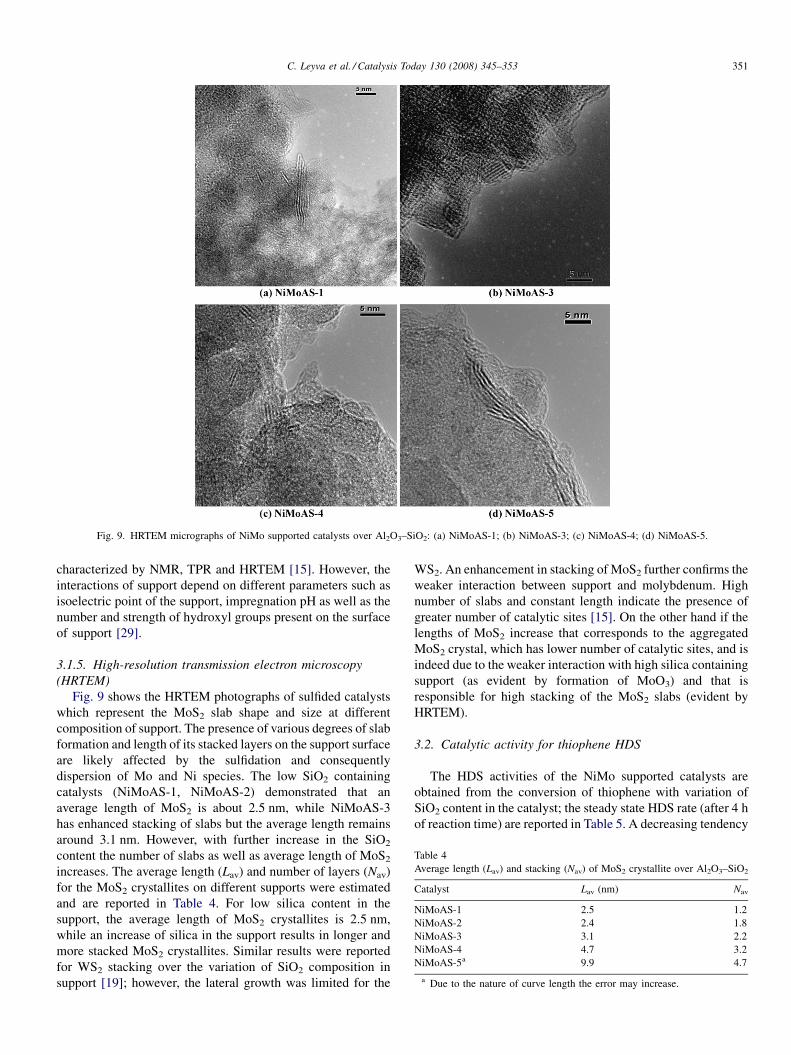
Fig. 9. HRTEM micrographs of NiMo supported catalysts over Al2O3–SiO2: (a) NiMoAS-1; (b) NiMoAS-3; (c) NiMoAS-4; (d) NiMoAS-5.
Table 4
Average length (Lav) and stacking (Nav) of MoS2 crystallite over Al2O3–SiO2
Catalyst Lav (nm) Nav
NiMoAS-1 2.5 1.2
NiMoAS-2 2.4 1.8
NiMoAS-3 3.1 2.2
NiMoAS-4 4.7 3.2
NiMoAS-5a 9.9 4.7
a Due to the nature of curve length the error may increase.
C. Leyva et al. / Catalysis Today 130 (2008) 345–353 351
characterized by NMR, TPR and HRTEM [15]. However, the
interactions of support depend on different parameters such as
isoelectric point of the support, impregnation pH as well as the
number and strength of hydroxyl groups present on the surface
of support [29].
3.1.5. High-resolution transmission electron microscopy
(HRTEM)
Fig. 9 shows the HRTEM photographs of sulfided catalysts
which represent the MoS2 slab shape and size at different
composition of support. The presence of various degrees of slab
formation and length of its stacked layers on the support surface
are likely affected by the sulfidation and consequently
dispersion of Mo and Ni species. The low SiO2 containing
catalysts (NiMoAS-1, NiMoAS-2) demonstrated that an
average length of MoS2 is about 2.5 nm, while NiMoAS-3
has enhanced stacking of slabs but the average length remains
around 3.1 nm. However, with further increase in the SiO2
content the number of slabs as well as average length of MoS2
increases. The average length (Lav) and number of layers (Nav)
for the MoS2 crystallites on different supports were estimated
and are reported in Table 4. For low silica content in the
support, the average length of MoS2 crystallites is 2.5 nm,
while an increase of silica in the support results in longer and
more stacked MoS2 crystallites. Similar results were reported
for WS2 stacking over the variation of SiO2 composition in
support [19]; however, the lateral growth was limited for the
WS2. An enhancement in stacking of MoS2 further confirms the
weaker interaction between support and molybdenum. High
number of slabs and constant length indicate the presence of
greater number of catalytic sites [15]. On the other hand if the
lengths of MoS2 increase that corresponds to the aggregated
MoS2 crystal, which has lower number of catalytic sites, and is
indeed due to the weaker interaction with high silica containing
support (as evident by formation of MoO3) and that is
responsible for high stacking of the MoS2 slabs (evident by
HRTEM).
3.2. Catalytic activity for thiophene HDS
The HDS activities of the NiMo supported catalysts are
obtained from the conversion of thiophene with variation of
SiO2 content in the catalyst; the steady state HDS rate (after 4 h
of reaction time) are reported in Table 5. A decreasing tendency
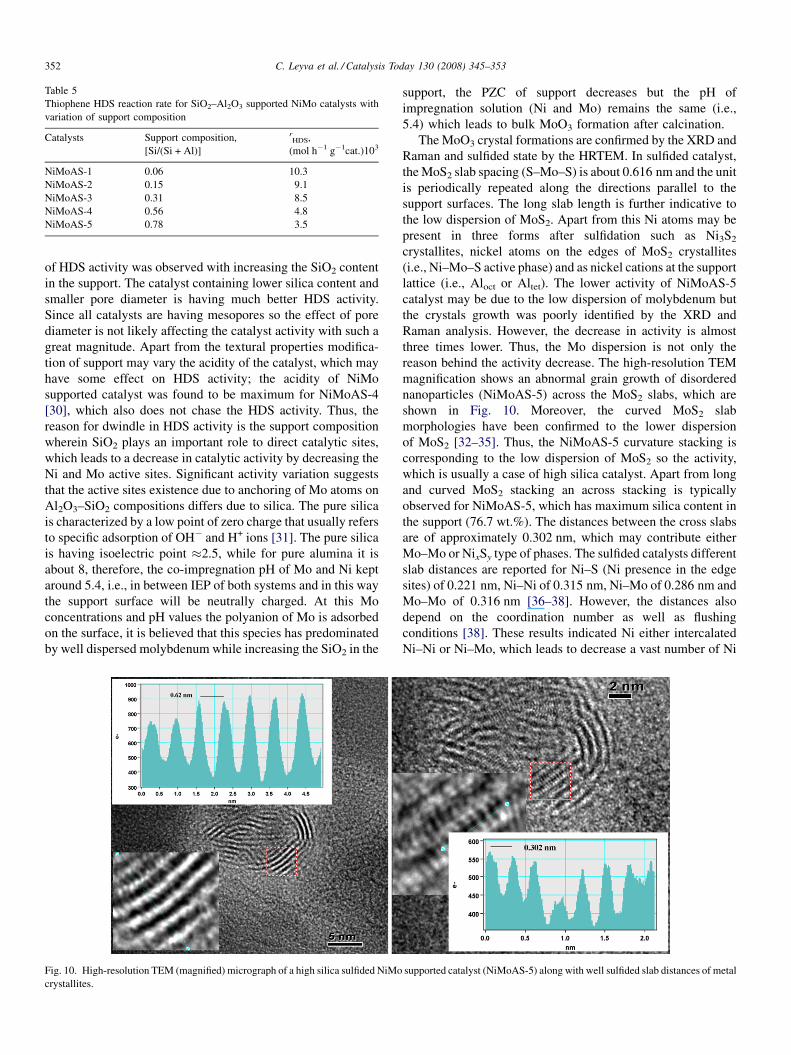
Table 5
Thiophene HDS reaction rate for SiO2–Al2O3 supported NiMo catalysts with
variation of support composition
Catalysts Support composition,
[Si/(Si + Al)]
rHDS,
(mol h�1 g�1cat.)103
NiMoAS-1 0.06 10.3
NiMoAS-2 0.15 9.1
NiMoAS-3 0.31 8.5
NiMoAS-4 0.56 4.8
NiMoAS-5 0.78 3.5
C. Leyva et al. / Catalysis Today 130 (2008) 345–353352
of HDS activity was observed with increasing the SiO2 content
in the support. The catalyst containing lower silica content and
smaller pore diameter is having much better HDS activity.
Since all catalysts are having mesopores so the effect of pore
diameter is not likely affecting the catalyst activity with such a
great magnitude. Apart from the textural properties modifica-
tion of support may vary the acidity of the catalyst, which may
have some effect on HDS activity; the acidity of NiMo
supported catalyst was found to be maximum for NiMoAS-4
[30], which also does not chase the HDS activity. Thus, the
reason for dwindle in HDS activity is the support composition
wherein SiO2 plays an important role to direct catalytic sites,
which leads to a decrease in catalytic activity by decreasing the
Ni and Mo active sites. Significant activity variation suggests
that the active sites existence due to anchoring of Mo atoms on
Al2O3–SiO2 compositions differs due to silica. The pure silica
is characterized by a low point of zero charge that usually refers
to specific adsorption of OH� and H+ ions [31]. The pure silica
is having isoelectric point �2.5, while for pure alumina it is
about 8, therefore, the co-impregnation pH of Mo and Ni kept
around 5.4, i.e., in between IEP of both systems and in this way
the support surface will be neutrally charged. At this Mo
concentrations and pH values the polyanion of Mo is adsorbed
on the surface, it is believed that this species has predominated
by well dispersed molybdenum while increasing the SiO2 in the
Fig. 10. High-resolution TEM (magnified) micrograph of a high silica sulfided NiMo
crystallites.
support, the PZC of support decreases but the pH of
impregnation solution (Ni and Mo) remains the same (i.e.,
5.4) which leads to bulk MoO3 formation after calcination.
The MoO3 crystal formations are confirmed by the XRD and
Raman and sulfided state by the HRTEM. In sulfided catalyst,
the MoS2 slab spacing (S–Mo–S) is about 0.616 nm and the unit
is periodically repeated along the directions parallel to the
support surfaces. The long slab length is further indicative to
the low dispersion of MoS2. Apart from this Ni atoms may be
present in three forms after sulfidation such as Ni3S2
crystallites, nickel atoms on the edges of MoS2 crystallites
(i.e., Ni–Mo–S active phase) and as nickel cations at the support
lattice (i.e., Aloct or Altet). The lower activity of NiMoAS-5
catalyst may be due to the low dispersion of molybdenum but
the crystals growth was poorly identified by the XRD and
Raman analysis. However, the decrease in activity is almost
three times lower. Thus, the Mo dispersion is not only the
reason behind the activity decrease. The high-resolution TEM
magnification shows an abnormal grain growth of disordered
nanoparticles (NiMoAS-5) across the MoS2 slabs, which are
shown in Fig. 10. Moreover, the curved MoS2 slab
morphologies have been confirmed to the lower dispersion
of MoS2 [32–35]. Thus, the NiMoAS-5 curvature stacking is
corresponding to the low dispersion of MoS2 so the activity,
which is usually a case of high silica catalyst. Apart from long
and curved MoS2 stacking an across stacking is typically
observed for NiMoAS-5, which has maximum silica content in
the support (76.7 wt.%). The distances between the cross slabs
are of approximately 0.302 nm, which may contribute either
Mo–Mo or NixSy type of phases. The sulfided catalysts different
slab distances are reported for Ni–S (Ni presence in the edge
sites) of 0.221 nm, Ni–Ni of 0.315 nm, Ni–Mo of 0.286 nm and
Mo–Mo of 0.316 nm [36–38]. However, the distances also
depend on the coordination number as well as flushing
conditions [38]. These results indicated Ni either intercalated
Ni–Ni or Ni–Mo, which leads to decrease a vast number of Ni
supported catalyst (NiMoAS-5) along with well sulfided slab distances of metal
C. Leyva et al. / Catalysis Today 130 (2008) 345–353 353
edges sites (Ni–S, 0.221 nm) so the HDS activity. Thus, the
aggregation of MoS2 is not only the cause for the decrease in
HDS activity but also decrease in the edge sites of the MoS2 is
also responsible. The crystallographic distances from Fig. 10
have been corroborated to the Ni–Ni, Mo–Mo or even Ni–Mo
metal–metal interaction. Such slabs are characteristically
observed for high SiO2 supported catalysts which further
specify that silica promotes weak interaction between metal-
support or crystal growth of active phases.
4. Conclusion
High specific surface area, mesoporous Al2O3–SiO2 mixed
oxide supports were prepared by sol–gel homogeneous co-
precipitation method at a nanoscale level of distribution of Al
and Si elements. The mixing of SiO2 with Al2O3 modifies the
textural properties and interaction behavior towards MoS2
phases and consequently affects the catalyst activity. The
activity results on supported catalysts indicated that introduc-
tion of SiO2 into Al2O3 modifies the metal support interaction
of sulfided active metals species, which varies the catalytic
activity. The characterization results showed that the effect of
support is responsible to form different catalytic sites. An
increase of SiO2 content in the support promotes the
crystallization of MoO3 phases and a relatively longer crystal
of MoS2 in the sulfided catalysts. The decrease in activity is not
only due to the molybdenum crystallization but also to a
decrease in the edge sites (promoted sites) of the MoS2.
Acknowledgements
One of us C. Leyva thanks to IMP for master and doctorate
fellowships. We also express our gratitude to Dr. C. Angeles
Chavez for HRTEM analysis.
References
[1] M.S. Thompson, European Patent 0181035, assigned to Shell Int. Res.
(1986).
[2] E. Lecrenary, K. Sakanishi, I. Mochida, T. Suzuka, Appl. Catal. A: Gen.
175 (1998) 237–243.
[3] M.S. Rana, S.K. Maity, J. Ancheyta, G. Murali Dhar, T.S.R. Prasada Rao,
Appl. Catal. A: Gen. 253 (2003) 165–176.
[4] N. Kunisada, K.-H. Choi, Y. Korai, I. Mochida, K. Nakano, Appl. Catal. A:
Gen. 273 (2004) 287–294.
[5] N. Kunisada, K.-H. Choi, Y. Korai, I. Mochida, K. Nakano, Appl. Catal. A:
Gen. 279 (2005) 235–239.
[6] J. Scherzer, A.J. Gruia, Hydrocracking Science and Technology, Marcel
Dekker, New York, 1996.
[7] A. Nishijima, H. Shimada, T. Sato, Y. Yoshimura, J. Hiraishi, Polyhedron 5
(1986) 243–247.
[8] Y. Okamoto, M. Breysse, G. Murali Dhar, C. Song, Catal. Today 86 (2003)
1–3.
[9] M. Breysse, J.L. Portefaix, M. Vrinat, Catal. Today 10 (1991) 489–505.
[10] G. Muralidhar, F.F. Massoth, J. Shabtai, J. Catal. 85 (1984) 44–52.
[11] G.A. Parks, Chem. Rev. 65 (1965) 177–198.
[12] M. Kosmulski, J. Colloid Interface Sci. 298 (2006) 730–741.
[13] N. Ushifusa, M.J. Cima, J. Am. Ceram. Soc. 74 (1991) 2443–2447.
[14] V.M. Gunko, V.I. Zarko, V.V. Turov, R. Leboda, E. Chibowski, E.M.
Pakhlow, E.V. Goncharuk, M. Marciniak, E.F. Voronin, A.A. Chuiko, J.
Colloid Interface Sci. 220 (1999) 302–323.
[15] L. Qu, W. Zhang, P.J. Kooyman, R. Prins, J. Catal. 215 (2003) 7–13.
[16] B. Pawelec, R.M. Navarro, J.M. Campos-Martin, A. Lopez Agudo, P.T.
Vasudevan, J.L.G. Fierro, Catal. Today 86 (2003) 73–85.
[17] O. Weisser, S. Landa, Slphide Catalyst—Their Properties and Application,
Programon Press, Oxford, New York, 1971.
[18] M.S. Rana, J. Ramırez, A.G. Alejandre, J. Ancheyta, L. Cedeno, S.K.
Maity, J. Catal. 246 (2007) 100–108.
[19] H. Makishima, Y. Tanaka, Y. Kato, S. Kure, H. Shimada, N. Matsubayashi,
A. Nishijima, M. Nombra, Catal. Today 29 (1996) 267–271.
[20] M.A. Ali, T. Tatsumi, T. Musada, Appl. Catal. A: Gen. 233 (2002) 77–90.
[21] V. La Parola, G. Deganello, A.M. Venezia, Appl. Catal. A: Gen. 260
(2004) 237–247.
[22] V. La Parola, G. Deganello, C.R. Tewell, A.M. Venezia, Appl. Catal. A:
Gen. 235 (2002) 171–180.
[23] S.J. Gregg, K.S.W. Sing, Adsorption, Surface Area and Porosity, Aca-
demic Press, London, 1991.
[24] H. Jeziorowski, H. Knozinger, P. Grange, P. Gajardo, J. Phys. Chem. 84
(1980) 1825–1829.
[25] P. Dufresne, E. Payen, J. Grimbolt, J.P. Bonnelle, J. Phys. Chem. 85 (1992)
2344–2351.
[26] H. Hu, I.E. Wachs, J. Phys. Chem. 99 (1995) 10897–10910.
[27] S. Rajagopal, H.J. Marini, J.A. Marzari, R. Miranda, J. Catal. 147 (1994)
417–428.
[28] M.S. Rana, M.L. Huidobro, J. Ancheyta, M.T. Gomez, Catal. Today 107/
108 (2005) 346–354.
[29] R. Prins, in: I.E. Wachs, L.E. Fitzpatrick (Eds.), Characterization of
Catalytic materials, Butterworth-Heinemann, USA, 1992, , Chapt. 6.
[30] C. Leyva, M.S. Rana, F. Trejo, J. Ancheyta, Catal. Today, communicated.
[31] K. Bourikas, C. Kordulis, A. Lycourghiotis, Catal. Rev. Sci. & Eng. 48
(2006) 363–444.
[32] S. Eijsbouts, Appl. Catal. A 158 (1997) 53–92.
[33] Y. Sakashita, Y. Araki, K. Honna, H. Shimada, Appl. Catal. A: Gen. 197
(2000) 247–253.
[34] S. Srinivasan, A.K. Datye, C.H.F. Peden, J. Catal. 137 (1992) 513–522.
[35] S. Eijsbouts, L.C.A. van den Oetelaar, R.R. van Puijenbroek, J. Catal. 229
(2005) 352–346¤.
[36] H. Topsøe, B.S. Clausen, F.E. Massoth, Hydrotreating Catalysis Science
and Technology, Springer-Verlag, New York, 1996.
[37] P.L. Hansen, H. Topsøe, J.-D. Malm, Proc. ICEM 13, Paris, (1994), p.
1077.
[38] S.P.A. Louwers, R. Prins, J. Catal. 133 (1992) 94–111.