Sulfur resistance enhancement by grafted TiO 2 in SiO 2 -supported Pd catalysts: Role of grafted TiO 2 and genesis of Pd clusters Hwo-Shuenn Sheu a , Jyh-Fu Lee a , Shin-Guang Shyu b , Wha-Wen Chou c , Jen-Ray Chang c, * a National Synchrotron Radiation Research Center, Hsinchu, Taiwan b Institute of Chemistry, Academia Sinica, Nankang, Taipei, Taiwan c Department of Chemical Engineering, National Chung Cheng University, Chia-Yi, Taiwan article info Article history: Received 23 January 2009 Revised 27 April 2009 Accepted 10 May 2009 Available online 9 June 2009 Keywords: Pd catalysts Sulfur poisoning Deactivation X-ray absorption spectroscopy IR Grafted TiO 2 abstract Pd clusters on TiO 2 -grafted SiO 2 (TiO 2 –SiO 2 ), SiO 2 , and TiO 2 particles were prepared via impregnation with palladium (II) acetate followed by air calcination and hydrogen reduction. The prepared catalysts were tested by tetralin hydrogenation with sulfur-poisoning reaction. The results show that Pd/TiO 2 – SiO 2 presents the highest activity maintenance. To investigate the role of the grafted TiO 2 in improving the activity maintenance, the catalyst samples were characterized by FT-IR, EXAFS, and XRD. The results indicated that layer-like TiO 2 clusters formed on SiO 2 help anchoring palladium oxides during air calci- nation. This anchoring leads to the formation of relatively small Pd clusters having less electronic density as opposed to the other two catalysts. Combining structural characterization with kinetic study results, we concluded that the superior catalytic performance for Pd/TiO 2 –SiO 2 could arise from the decrease of the affinity of Pd for H 2 S and the increase of hydrogen reducibility for PdS 2 . Ó 2009 Elsevier Inc. All rights reserved. 1. Introduction The interactions between noble-metal clusters and non-reduc- ible metal–oxide carriers are highly important for supported metal catalysts [1–3]. The interactions and the catalytic properties of these materials could be modified by the addition of TiO 2 [4,5]. However, little is known about the role of TiO 2 in changing the catalytic prop- erties because of the difficulty in characterizing metal–support interface. In this research, the genesis of the Pd clusters on TiO 2 - grafted SiO 2 was explored by the unique use of X-ray absorption spectroscopy [3,6,7]. The results indicated that TiO 2 helps anchoring PdO x during air calcination and maintaining it in small ensembles during H 2 reduction. This observation is expected to illuminate how TiO 2 on the catalyst support influences the structure and cata- lytic properties, specifically sulfur resistance of the catalysts. To facilitate this study, a material system was carefully designed. In the system, Pd was the metal of choice because it is used widely as the active site for catalytic reactions [1,8–11]. Palladium (II) ace- tate was chosen because the Pd precursors readily undergo cleavage on metal–oxide carriers offering opportunities to prepare highly dispersed Pd catalysts [9,12]. TiO 2 -grafted silica was chosen as the support (or carrier) because it presents a high surface area and a higher thermal stability than pure TiO 2 toward sintering at a high temperature. Higher dose of Pd precursor and, in turn, Pd clusters can be expected to bond to TiO 2 on this composite support. Hence, the EXAF (Extended X-ray absorption fine structure) measurement can be performed in the transmission mode, which presents a much higher signal-to-noise ratio than the fluorescence mode; thus the contribution of TiO 2 –PdO x interaction in EXAFS spectrum would not be affected significantly by noise. Moreover, since the catalyst samples are air and moisture sensitive, EXAFS measurements were carried out in an in-situ EXAFS cell, which is free of air and moisture. In order to illustrate the merit of the grafted TiO 2 in catalysis, sensitivity to sulfur poisoning was tested because (1) supported Pd catalysts are very sensitive to sulfur compound [13], (2) main- taining the required level of sulfur to avoid deactivation in com- mercial operation is very expensive and millions of dollars are lost every year in chemical and oil industries as a consequence of sulfur poisoning [14], and (3) several methods including the use of acidic supports [15–17], the addition of a second metal [17– 20], and the exchange of NaY support with polyvalent cations [21,22] have been used to enhance the sulfur resistance of sup- ported metal catalysts, whereas no information regarding the use of TiO 2 –SiO 2 supports has been reported. 2. Experimental 2.1. Preparation of TiO 2 –SiO 2 The samples were prepared by incipient-wetness impregnation technique. Silica (MN Kieselgel 60, surface area of 400 m 2 /g, particle 0021-9517/$ - see front matter Ó 2009 Elsevier Inc. All rights reserved. doi:10.1016/j.jcat.2009.05.008 * Corresponding author. Fax: +886 5 2721206. E-mail addresses: [email protected], [email protected] (J.-R. Chang). Journal of Catalysis 266 (2009) 15–25 Contents lists available at ScienceDirect Journal of Catalysis journal homepage: www.elsevier.com/locate/jcat

Welcome message from author
This document is posted to help you gain knowledge. Please leave a comment to let me know what you think about it! Share it to your friends and learn new things together.
Transcript
Journal of Catalysis 266 (2009) 15–25
Contents lists available at ScienceDirect
Journal of Catalysis
journal homepage: www.elsevier .com/locate / jcat
Sulfur resistance enhancement by grafted TiO2 in SiO2-supported Pd catalysts:Role of grafted TiO2 and genesis of Pd clusters
Hwo-Shuenn Sheu a, Jyh-Fu Lee a, Shin-Guang Shyu b, Wha-Wen Chou c, Jen-Ray Chang c,*
a National Synchrotron Radiation Research Center, Hsinchu, Taiwanb Institute of Chemistry, Academia Sinica, Nankang, Taipei, Taiwanc Department of Chemical Engineering, National Chung Cheng University, Chia-Yi, Taiwan
a r t i c l e i n f o
Article history:Received 23 January 2009Revised 27 April 2009Accepted 10 May 2009Available online 9 June 2009
Keywords:Pd catalystsSulfur poisoningDeactivationX-ray absorption spectroscopyIRGrafted TiO2
0021-9517/$ - see front matter � 2009 Elsevier Inc. Adoi:10.1016/j.jcat.2009.05.008
* Corresponding author. Fax: +886 5 2721206.E-mail addresses: [email protected], chmjrc@ccu
a b s t r a c t
Pd clusters on TiO2-grafted SiO2 (TiO2–SiO2), SiO2, and TiO2 particles were prepared via impregnationwith palladium (II) acetate followed by air calcination and hydrogen reduction. The prepared catalystswere tested by tetralin hydrogenation with sulfur-poisoning reaction. The results show that Pd/TiO2–SiO2 presents the highest activity maintenance. To investigate the role of the grafted TiO2 in improvingthe activity maintenance, the catalyst samples were characterized by FT-IR, EXAFS, and XRD. The resultsindicated that layer-like TiO2 clusters formed on SiO2 help anchoring palladium oxides during air calci-nation. This anchoring leads to the formation of relatively small Pd clusters having less electronic densityas opposed to the other two catalysts. Combining structural characterization with kinetic study results,we concluded that the superior catalytic performance for Pd/TiO2–SiO2 could arise from the decreaseof the affinity of Pd for H2S and the increase of hydrogen reducibility for PdS2.
� 2009 Elsevier Inc. All rights reserved.
1. Introduction
The interactions between noble-metal clusters and non-reduc-ible metal–oxide carriers are highly important for supported metalcatalysts [1–3]. The interactions and the catalytic properties of thesematerials could be modified by the addition of TiO2 [4,5]. However,little is known about the role of TiO2 in changing the catalytic prop-erties because of the difficulty in characterizing metal–supportinterface. In this research, the genesis of the Pd clusters on TiO2-grafted SiO2 was explored by the unique use of X-ray absorptionspectroscopy [3,6,7]. The results indicated that TiO2 helps anchoringPdOx during air calcination and maintaining it in small ensemblesduring H2 reduction. This observation is expected to illuminatehow TiO2 on the catalyst support influences the structure and cata-lytic properties, specifically sulfur resistance of the catalysts.
To facilitate this study, a material system was carefully designed.In the system, Pd was the metal of choice because it is used widelyas the active site for catalytic reactions [1,8–11]. Palladium (II) ace-tate was chosen because the Pd precursors readily undergo cleavageon metal–oxide carriers offering opportunities to prepare highlydispersed Pd catalysts [9,12]. TiO2-grafted silica was chosen as thesupport (or carrier) because it presents a high surface area and ahigher thermal stability than pure TiO2 toward sintering at a hightemperature. Higher dose of Pd precursor and, in turn, Pd clusters
ll rights reserved.
nix.ccu.edu.tw (J.-R. Chang).
can be expected to bond to TiO2 on this composite support. Hence,the EXAF (Extended X-ray absorption fine structure) measurementcan be performed in the transmission mode, which presents a muchhigher signal-to-noise ratio than the fluorescence mode; thus thecontribution of TiO2–PdOx interaction in EXAFS spectrum wouldnot be affected significantly by noise. Moreover, since the catalystsamples are air and moisture sensitive, EXAFS measurements werecarried out in an in-situ EXAFS cell, which is free of air and moisture.
In order to illustrate the merit of the grafted TiO2 in catalysis,sensitivity to sulfur poisoning was tested because (1) supportedPd catalysts are very sensitive to sulfur compound [13], (2) main-taining the required level of sulfur to avoid deactivation in com-mercial operation is very expensive and millions of dollars arelost every year in chemical and oil industries as a consequence ofsulfur poisoning [14], and (3) several methods including the useof acidic supports [15–17], the addition of a second metal [17–20], and the exchange of NaY support with polyvalent cations[21,22] have been used to enhance the sulfur resistance of sup-ported metal catalysts, whereas no information regarding the useof TiO2–SiO2 supports has been reported.
2. Experimental
2.1. Preparation of TiO2–SiO2
The samples were prepared by incipient-wetness impregnationtechnique. Silica (MN Kieselgel 60, surface area of 400 m2/g, particle
16 H.-S. Sheu et al. / Journal of Catalysis 266 (2009) 15–25
size of 0.2–0.5 mm, MACHEREY-NAGEL) was pre-dried in an oven at120 �C for 24 h in order to remove the water. The silica was broughtin contact with a toluene solution of titanium isopropylateTi(OCH(CH3)2)4 (Acros) in a glove box. The amount of titanium iso-propylate added to silica was such that the resulting solid contained7 wt% TiO2. The toluene solvent was removed by evacuation for 4 hat room temperature, and the resulting solid was calcined under airat 450 �C for 4 h. The sample after the calcination was denoted asTiO2–SiO2.
2.2. Preparation of Pd/TiO2, Pd/TiO2–SiO2, and Pd/SiO2
Pd/TiO2–SiO2 and Pd/SiO2 were prepared according to the meth-od reported by Lin and Chou and our previous paper [9,23]. Palla-dium acetate, Pd(Ac)2, of 0.64 g was dissolved in 200 mL oftoluene with stirring for 3 h, and 15 g of TiO2–SiO2, SiO2, or TiO2
(Merck, surface area of 40 m2/g, average crystal grain size<100 nm) support was then added. The toluene was removed by fil-tration followed by evacuation. The resulting samples were denotedas Pd(Ac)2/TiO2–SiO2, Pd(Ac)2/SiO2, and Pd(Ac)2/TiO2 for TiO2–SiO2,SiO2, and TiO2 supports, respectively. After calcinations at 450 �C inflowing air for 3 h, the samples were denoted as PdOx/TiO2–SiO2,PdOx/SiO2, and PdOx/TiO2. All samples were stored in a nitrogen-filled glove box before FT-IR and X-ray absorption characterization.
For measuring Pd content, 0.2 g ground catalyst sample wastransferred to a crucible, wetted with 1 mL water, and mixed with10 mL UA-1 (HCl- and HF-containing acid-dissolution reagent,Inorganic Ventures Inc.) and 1 mL 12 N HNO3. The slurry was stir-red and heated to just below the boiling point until the catalyst hadcompletely dissolved. After the solution was cooled to room tem-perature, 50 mL UNS-1 (Inorganic Ventures Inc.) was added, andthe solution was transferred to a 100-mL flask. After allowing thesolution to stand for 5 min, the solution was further diluted withwater to 100 mL. Pd loading was then measured by inductivelyplasma optical emission measurement (Perkin Elmer PE Optima4300), and the results are summarized in Table 2.
2.3. Characterization of catalyst samples by infrared spectroscopy
FT-IR (Fourier-transform infrared) spectroscopy characterizingCO adsorbed on the Pd catalysts was performed with a ShimadzuIR Prestige-21 equipped with a MCT detector. The wafer sampleswere prepared and loaded into an IR cell in a N2-filled glove box.The cell was connected to a vacuum/gas-handling manifold forin-situ treatment. The reduction of the samples was carried outby flowing H2 at 200 �C for 1 h. After the reduction, the samplewas cooled to room temperature, and CO (flowing at 50 mL/minat 1 atm) was introduced into the cell and was maintained forabout 20 min. After the CO treatment, the cell was evacuated to apressure of approximately 10�2 to 10�3 Torr, and IR spectra havinga 2 cm�1 spectral resolution were recorded.
2.4. Transmission electron microscopy
The reduced Pd catalyst samples were carefully pulverized, dis-persed in ethanol, fetched on Cu grids, and then dried for later TEM(Transmission electron microscopy) analysis. The TEM (Philips,TECNAI 20) is typically operated at 200 KeV.
2.5. X-ray absorption spectroscopy
The X-ray absorption measurements of Pd K-edge (24,350 eV)were performed on the super-conducting wavelength shifter(SWLS) beamline BL01C1 at the National Synchrotron Radiation Re-search Center (NSRRC) in Hsinchu, Taiwan, with an energy from 5 to33 KeV. The monochromator employs double Si(111) crystals for
energy selection with a resolution (DE/E) better than 2.5 � 10�4. Itwas detuned 20% at E0 + 50 eV to suppress a higher harmonic radi-ation. The monochromator was scanned at an energy from 200 eVbelow the palladium K absorption edge (24,350 eV) to 1000 eVabove the edge. Each sample was pressed into a self-supporting wa-fer in a N2-filled glove box and was then placed into an EXAFS cell.The cell was connected to a vacuum/gas-handling manifold for in-situ treatment. All samples were measured in a transmission modeat room temperature. The transmission measurement geometrywas arranged using gas-filled ionization chambers to monitor theintensities of the incident and transmitted X-rays. To gain the prop-er absorption ratio for the incoming X-rays, the gas compositions inthe ionization chambers were selected at an argon to nitrogen moleratio of 1/1 for the first chamber and as pure argon for the secondchamber, respectively. After the measurement of the supportedPdOx sample, the temperature was increased from room tempera-ture at about 10 �C/min to 200 �C with the flow of hydrogen. Afterthe temperature reached the setting temperature, it was main-tained for 0.5 h. Then the cell was allowed to cool in liquid nitrogento room temperature, and the EXAFS spectrum was measured again.The samples after the reduction were denoted as Pd/TiO2–SiO2, Pd/SiO2, and Pd/TiO2. To investigate the effects of Pd morphology onsulfur poisoning and hydrogen reactivation, the hydrogen-reducedPd/TiO2–SiO2 and Pd/SiO2 samples were first treated by flowing10,000 ppm H2S containing N2 for 30 min. After data collection,the sulfur-poisoned samples were reactivated by flowing hydrogenat 200 �C for 30 min. After the cell was cooled to room temperature,the EXAFS spectrum was measured again.
X-ray absorption spectra of Ti K-edge (4966 eV) were recordedon the wiggler beamline BL17C at NSRRC. Two Rh-coated mirrors(mainly for the purpose of collimating and focusing the synchro-tron beam) were used to eliminate the high energy components.However, the cut-off energy was set to 15 keV for both mirrorsso that the third harmonics from Si(111)-crystal monochromatormay not be completely rejected by the mirrors when the fundamen-tal photon energy was scanned around Ti K-edge (�5 keV). Accord-ingly, the higher X-ray harmonics were minimized by detuning atE0 + 50 eV. The ion chambers used for measuring the incident (I0)and transmitted (I) synchrotron beam intensities were filled witha mixture of N2 and He gases and a pure N2 gas, respectively.
Ti(OCH(CH3)2)4, Ti(OCH(CH3)2)4 adsorbed on SiO2, and TiO2–SiO2
samples were mixed with some powders of boron nitride (which isalmost transparent to X-ray) before being pressed into wafers witha uniform thickness. The TiO2 content in our Pd/TiO2–SiO2 samplewas about 7 wt%, which was just high enough for the transmissionmeasurements to be possible.
2.6. Synchrotron XRD
Powder X-ray diffraction (PXRD) was performed at the BL01C2beamline of the NSRRC with the wavelength of 0.9537 Å(13 keV). Two-dimensional diffraction patterns were recorded bya Mar345 imaging plate system with a sample-to-detector distanceof 300 mm. Diffraction angle was calibrated with Si powders(NBS640b) and silver behenate. One-dimensional XRD profileswere integrated from selected fan-like areas of the symmetrical2-D powder rings using the Fit2D program [24]. The crystallinegrain sizes were obtained from the commonly used Scherrer’sequation: t = kk/(Bcosh), with the crystal grain size t, shape correc-tion constant k = 0.9 for spherical particle, and FWHM of the re-lated Bragg peaks B [25].
2.7. Data analysis
Data reduction and data analysis were performed with the XDAPcode developed by Vaarkamp et al. [26]. Standard procedures were
H.-S. Sheu et al. / Journal of Catalysis 266 (2009) 15–25 17
followed to extract the EXAFS data from the measured absorptionspectra. The pre-edge was approximated by a modified Victoreencurve [7], and the post-edge background was subtracted using cu-bic spline routines [7]. Normalization was performed by dividingthe data by the height of the absorption edge at 50 eV above theedge. For Pd samples, a k2-weighted Fourier transformation withoutcorrection was performed on the EXAFS function over the range3.5 < k < 14 Å�1. The major contributions were isolated by inverseFourier transformation of the data in the range 1.0 < R < 3.8 Å. Thecoarse structural parameters characteristic of the Pd–Pd contribu-tion were determined by fitting the k2-weighted Fourier-isolatedEXAFS function in the range 7.0 < k < 13.0 Å�1; the Pd–O, Pd–Ti,and Pd–S contributions in this region were small. An EXAFS func-tion calculated from these parameters was then subtracted fromthe raw data (Fourier-isolated EXAFS function). Such a residualspectrum was expected to represent the contributions of metal–support interactions, palladium oxides, and palladium sulfides.The main peaks of the residual spectrum were isolated by Fourierfiltering, and the backscatter atoms characterizing the isolated EX-AFS spectra were identified by comparing the amplitude function ofthe EXAFS spectra with that of Pd–X calculated from FEFF [27],where X is the possible backscatter atoms. The structural parame-ters characteristic of the contributions of the metal–support inter-face (Pd–Ti), Pd–O, and Pd–S were then estimated by fitting theresulting spectrum obtained from the subtraction of the Pd–Pd con-tributions from the raw data. The structural parameters obtainedfrom the recursive iteration method were then used as the initialguess for the nonlinear least-square multiple-shell fitting routine.
Data analysis procedure for the Ti samples is similar to that forthe Pd samples. The structural parameters of Ti–O and Ti–Ti contri-butions were first estimated by calculating the EXAFS function thatagrees as closely as possible with the experimental EXAFS resultsin r space ranging from 1.0 to 3.5 Å. Contributions of TiO2–SiO2
interaction (Ti–Si) were then estimated by fitting the resultingspectrum obtained from the subtraction of the Ti–O and Ti–Ti con-tributions from the raw data. The obtained parameters were thenused as the initial guess for the nonlinear least-square multiple-shell fitting routine.
The EXAFS contributions for Pd–Pd were analyzed with phaseshifts and backscattering amplitudes obtained from the EXAFS datafor Pd foil. The Ti–Ti, Ti–O, Ti–Si, Pd–S, Pd–O, and Pd–Ti were ana-lyzed with phase shifts and backscattering amplitudes calculatedfrom FEFF.
2.8. Tests of sulfur-poisoning catalyst deactivation
Catalyst deactivation tests were carried out in a continuousdownflow fixed-bed reactor. The reactor was a stainless-steel tubewith an inner diameter of 1.2 cm. It was heated electrically, and thetemperature was controlled by a PID temperature controller with athermocouple at the outer wall of the reactor. The temperature dif-ference between the outer wall of the reactor and the center of thecatalyst bed was about 10 �C. The upstream part of the reactor wasfilled with particles of a catalytically inactive ceramic material forpreheating and inhibition of channeling effects. The reaction sys-tem was first purged with dry nitrogen gas (Sun-Fu, 99.99%) for2 h. Catalyst samples (sphere of 200–500 lm diameter) of 1.5 g(about 2 mL) were diluted with inert ceramic (sphere of about500–1000 lm diameter) in a ratio of 1:5, and were then reducedat 200 �C with the flow of pure hydrogen for 0.5 h. After reduction,the test was carried out under the following conditions: weighthourly space velocity (WHSV), 12.0 g of feed/h * g of catalyst; H2/tetralin mole ratio, 7.0; and pressure, 3.24 MPa. Tetralin with200 ppm of sulfur was used as the feed. Tetralin (Merck) was driedwith particles of activated 4 A molecular sieve, and was then mixedwith a certain amount of benzothiophene to prepare the feed. Li-
quid products were trapped by a condenser at �5 �C. Samples werecollected periodically and were analyzed by GC and GC/mass spec-trometry. The product gas stream was analyzed by gas chromatog-raphy. The GC/mass spectrometry system used for feed andproduct analysis was a Shimadzu Model GC-17A-GCMS:QP5050(A) equipped with a BP1 (100% dimethyl polysiloxane) cap-illary column. The column was operated at 40–200 �C with a ramp-ing rate of 10 �C/min and a flow rate of 50 mL/min of dry He. TheGC system used for analysis was Shimadzu Model GC-14B with aFID detector. The column and operating conditions were the sameas those for GC/mass spectrometry.
Ninety-eight percent of the feed was recovered as the reactionproducts, as estimated by the material balance calculations. Carbonbalance was performed based on the material balance and GC re-sults, and the results indicated that 98 ± 1% of carbon balancewas reached. The 2% loss was attributed to the hydrocarbon depos-ited on the wall of the reaction system, on the catalyst, and on thesurface of the ceramic reactor packing.
In order to remove the sulfur contamination from the reactionapparatus, the reactor was treated by heating at 600 �C for 8 h inflowing air. Since the reactor is made of stainless steel 316, sulfur,or more precisely, hydrogen sulfide formed during the reactioncauses the formation of iron sulfide according to the balancedreaction:
H2Sþ Fe! FeSþH2
When the apparatus was treated at 600 �C in flowing air, theferrous sulfide was oxidized into ferric sulfate and then decom-posed into ferric oxide Fe2O3 and sulfur oxides (SO2 and SO3).The sulfur oxides thus formed were removed by NaOH scrubbing,and the red ferric oxide was removed by brushing.
3. Results and discussion
3.1. Accelerated sulfur-poisoning catalyst deactivation
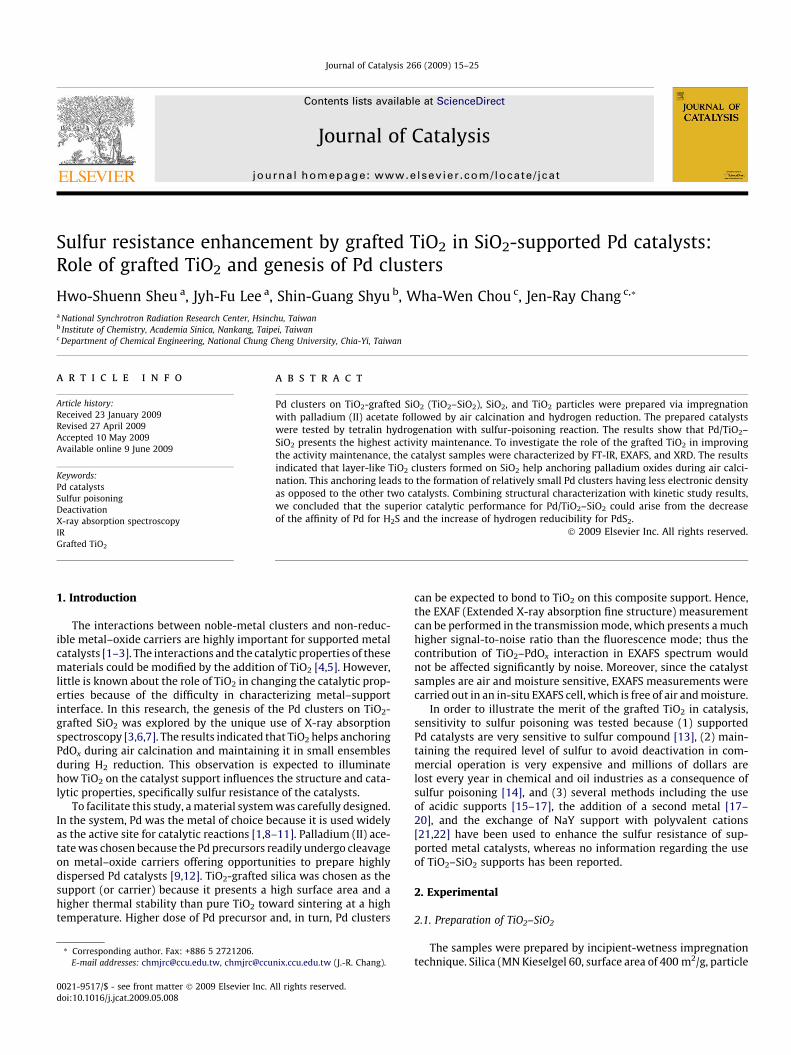
Total tetralin conversion for the sulfur-containing feed is shownas a function of time on stream in the flow reactor (Fig. 1). The con-version of Pd/TiO2 dropped rapidly right after the test began, andthe catalyst lost all its activity at about the third hour of the run.Different from Pd/TiO2, two stages of deactivation were observedfor Pd/TiO2–SiO2 and Pd/SiO2 catalysts. The first stage started rightafter the introduction of feed into the reaction system, and ex-tended until the time on stream at which the deactivation rate be-comes lower.
The second stage began when the deactivation rate increasedagain with time on stream, which was about 3 and 5 h on streamfor Pd/SiO2 and Pd/TiO2–SiO2, respectively. Compared with Pd/SiO2, the first-stage deactivation for Pd/TiO2–SiO2 extended longer,and in the nearly steady state (about 10 h on stream) the catalystmaintained a higher activity.
In the characterization of the reaction products, cis- and trans-naphthalene were detected by GC/mass spectrometry indicatingthat tetralin was converted to decahydronaphthalene
TetralinþH2 $ trans-decahydronaphthalene
þ cis-decahydronaphthalene
Our previous works reported that 90% of benzothiophene is cat-alytically converted to ethylbenzene, styrene, and H2S over Pt/Al2O3 catalyst at 270 �C and at 32 atm, and that the conversion isinsensitive with time on stream after the induction period [28].In the experiment described here, besides ethylbenzene, ethylcy-clohexane was detected in liquid products suggesting that ethyl-benzene is further hydrogenated to ethylcyclohexane
0 100 200 300 400 500 600 700 800-10
0
10
20
30
40
50
60
70
80
90
100
Con
vers
ion,
%
Time on stream, min
Fig. 1. Aging tests for Pd catalysts run at WHSV of 12.0, 200 �C, and 32 atm with200 ppm of sulfur-containing tetralin feed: j, Pd/TiO2–SiO2; d, Pd/SiO2; N, Pd/TiO2; solid line, data calculated from proposed model; ., pure tetralin feedcatalyzed by Pd/TiO2–SiO2 for comparison.
0 1 2 3 4 5 60
1
2
3
4
5
6
7
8
9
10
11
12
13
14
Four
ier
Tra
nsfo
rm
R, 0.1nm
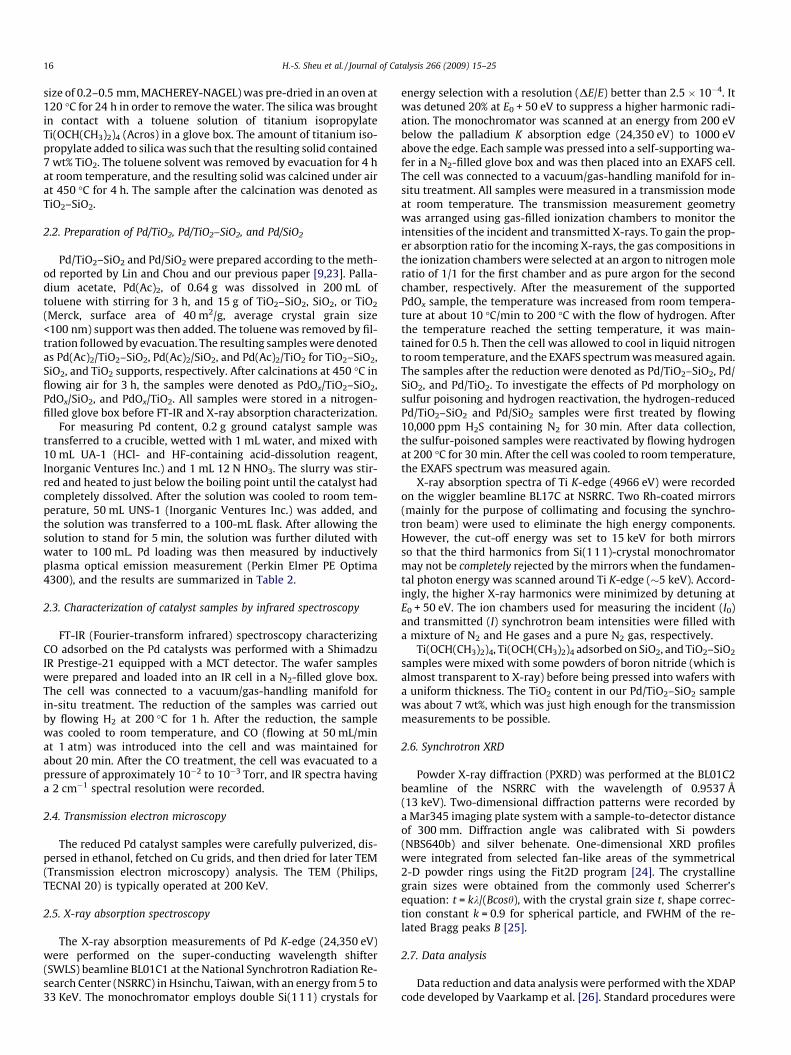
Fig. 2. Magnitude of the EXAFS Fourier transform (3.5 < k2 < 12.0, Pd–Pd phase andamplitude corrected) for Pd/TiO2 (solid line), Pd/SiO2 (dashed line), and Pd/TiO2–SiO2 (dotted line).
18 H.-S. Sheu et al. / Journal of Catalysis 266 (2009) 15–25
Benzothiopheneþ 5=2H2 ! ethylbenzeneþH2SEthylbenzeneþ 5=2H2 ! ethylcyclohexane
Since only a trace of styrene was detected and no significantcatalyst deactivation was observed for pure tetralin feed (Fig. 1),sulfur poisoning was suggested to be the main factor of the catalystdeactivation.
3.2. Structure of Pd/TiO2–SiO2, Pd/SiO2, and Pd/TiO2
Fourier-transformed EXAFS functions at the Pd K-edge providethe qualitative information on the structure of Pd clusters. Asshown in Fig. 2, the Pd–Pd phase- and amplitude-corrected Fou-rier- transformed EXAFS functions inr space of the three hydro-gen-reduced samples show that the peak corresponding to thefirst Pd–Pd shell (at about 2.7 Å) for the Pd/TiO2–SiO2 was muchlower than that for Pd/SiO2 and for Pd/TiO2. Since the intensity ofthe Fourier-transformed EXAFS functions is proportional to thecoordination number [7], this result indicates that much smallerPd clusters were formed on TiO2–SiO2. The detailed analysis ofthe EXAFS data confirmed this result (Table 1). The coordinationnumbers of the first Pd–Pd shell were 5.7, 7.8, and 10.2 forPd/TiO2–SiO2, Pd/SiO2, and Pd/TiO2, respectively.
The higher-shell data provide a basis for the determination ofPd morphology. The Fourier transforms indicated the presence ofa peak at approximately 3.8 Å. The distance is consistent withthe second shell of bulk fcc Pd, as reflected by the crystallographicdata, and is an indication of the Pd clusters of three-dimensionalcharacter [29]. The results suggest that Pd clusters with structuresresembling spheres (sphere-like clusters) formed on the support,and that the morphology of Pd clusters on the support TiO2–SiO2
can thus be determined by the first shell Pd–Pd coordination num-ber. For Pd/TiO2–SiO2 catalyst, the Pd–Pd coordination number of5.7 suggests that the average diameter of the Pd clusters is about11 Å, and that the fraction of atoms on the surface is about 85%.If Pd clusters are bounded by a (111) face in the metal–supportinterface, a (111) interface only allows up to three Pd–O bondsper Pd interface atoms. The Pd–Osupport coordination of 0.7 suggeststhat about 20% of Pd atoms existed at the interface between Pdclusters and TiO2–SiO2; if Pd clusters are bounded by a (100) face,the fraction of Pd atoms at interface is about 17%.
The Pd/SiO2 and Pd/TiO2 samples were characterized by a firstshell Pd–Pd contribution with coordination numbers of 7.8 and
10.2, respectively. These values with the evidence provided by thepresence of the second shell Pd–Pd contribution suggest that theaverage cluster size and fraction of atoms on surface are about22 Å and 64%, respectively, for Pd/SiO2, and are about 100 Å and24%, respectively, for Pd/TiO2. Moreover, no significant peak charac-terizing Pd–Osupport contributions was observed, suggesting that themetal–support interactions for these two catalysts are rather small.
A meaningful cluster size distribution of the three samples wascharacterized by TEM, and their micrographs which can representthe cluster size distribution are shown in Fig. 3. The average Pdclusters are about 150, 25, and 15 Å for Pd/TiO2, Pd/SiO2, andPd/TiO2–SiO2, respectively. The results are qualitatively consistentwith EXAFS results, whereas they are higher than those estimatedby EXAFS because our TEM facility was unable to characterize Pdclusters with a diameter less than 10 Å.
CO volumetric experiments were performed in micromeriticsASAP 2010, and the results showed that 1.8, 1.4, and 0.7 mL/g ofCO adsorbed on the Pd/TiO2–SiO2, Pd/SiO2, and Pd/TiO2, respec-tively. The values combined with the ratio of the bridged to termi-nal CO intensity characterized by FT-IR indicate that the fraction ofatoms on the surface can roughly be estimated. If we assume thatthe terminal CO bonded to one Pd atom while the bridged CObonded to two Pd atoms, the calculated results are slightly higherthan those estimated from EXAFS and TEM (Table 2), whereas if weassume that only one CO bonded to one surface atom, the resultsare much lower than those estimated by EXAFS and TEM.
3.3. Thermal stability of TiO2 nanoparticles and TiO2–SiO2: XRD results
PXRD patterns of anatase TiO2 were measured at various calci-nation temperatures as shown in Fig. 4a. TiO2 nanoparticles wereprepared by hydrolysis of titanium (IV) butoxides in water at70 �C [30]. The particles were aggregated during calcination. Thecrystal grain sizes of TiO2 calculated according to Scherrer’s equa-tion were 16, 19, 24, 36, and 80 nm for the sample calcined at 300,350, 450, 550, and 650 �C in air for 2 h, respectively. Moreover,PXRD patterns clearly indicate that the material undergoes phasechange at about 550 �C.
In contrast to the laboratory-prepared TiO2, no significant TiO2
aggregation was observed for the commercial anatase (surface areaof 40 m2/g, average grain size <100 nm) during calcination up to550 �C (Fig. 4b). Since this temperature (550 �C) is well above the
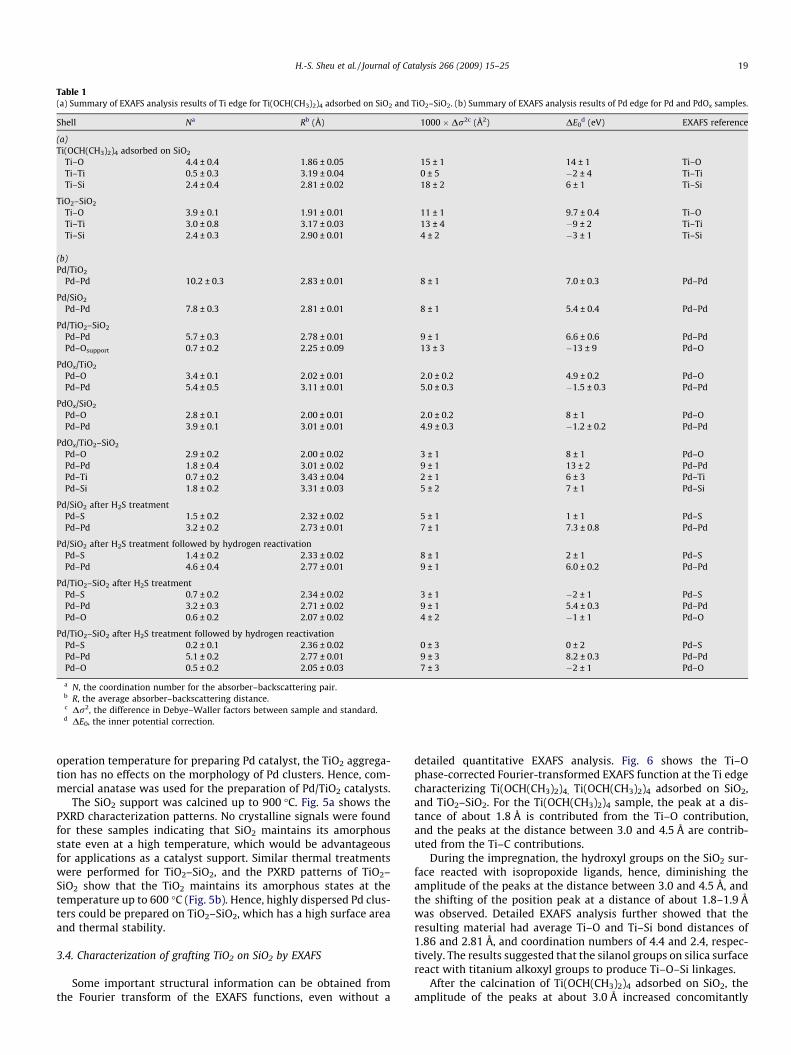
Table 1(a) Summary of EXAFS analysis results of Ti edge for Ti(OCH(CH3)2)4 adsorbed on SiO2 and TiO2–SiO2. (b) Summary of EXAFS analysis results of Pd edge for Pd and PdOx samples.
Shell Na Rb (Å) 1000 � Dr2c (Å2) DE0d (eV) EXAFS reference
(a)Ti(OCH(CH3)2)4 adsorbed on SiO2
Ti–O 4.4 ± 0.4 1.86 ± 0.05 15 ± 1 14 ± 1 Ti–OTi–Ti 0.5 ± 0.3 3.19 ± 0.04 0 ± 5 �2 ± 4 Ti–TiTi–Si 2.4 ± 0.4 2.81 ± 0.02 18 ± 2 6 ± 1 Ti–Si
TiO2–SiO2
Ti–O 3.9 ± 0.1 1.91 ± 0.01 11 ± 1 9.7 ± 0.4 Ti–OTi–Ti 3.0 ± 0.8 3.17 ± 0.03 13 ± 4 �9 ± 2 Ti–TiTi–Si 2.4 ± 0.3 2.90 ± 0.01 4 ± 2 �3 ± 1 Ti–Si
(b)Pd/TiO2
Pd–Pd 10.2 ± 0.3 2.83 ± 0.01 8 ± 1 7.0 ± 0.3 Pd–Pd
Pd/SiO2
Pd–Pd 7.8 ± 0.3 2.81 ± 0.01 8 ± 1 5.4 ± 0.4 Pd–Pd
Pd/TiO2–SiO2
Pd–Pd 5.7 ± 0.3 2.78 ± 0.01 9 ± 1 6.6 ± 0.6 Pd–PdPd–Osupport 0.7 ± 0.2 2.25 ± 0.09 13 ± 3 �13 ± 9 Pd–O
PdOx/TiO2
Pd–O 3.4 ± 0.1 2.02 ± 0.01 2.0 ± 0.2 4.9 ± 0.2 Pd–OPd–Pd 5.4 ± 0.5 3.11 ± 0.01 5.0 ± 0.3 �1.5 ± 0.3 Pd–Pd
PdOx/SiO2
Pd–O 2.8 ± 0.1 2.00 ± 0.01 2.0 ± 0.2 8 ± 1 Pd–OPd–Pd 3.9 ± 0.1 3.01 ± 0.01 4.9 ± 0.3 �1.2 ± 0.2 Pd–Pd
PdOx/TiO2–SiO2
Pd–O 2.9 ± 0.2 2.00 ± 0.02 3 ± 1 8 ± 1 Pd–OPd–Pd 1.8 ± 0.4 3.01 ± 0.02 9 ± 1 13 ± 2 Pd–PdPd–Ti 0.7 ± 0.2 3.43 ± 0.04 2 ± 1 6 ± 3 Pd–TiPd–Si 1.8 ± 0.2 3.31 ± 0.03 5 ± 2 7 ± 1 Pd–Si
Pd/SiO2 after H2S treatmentPd–S 1.5 ± 0.2 2.32 ± 0.02 5 ± 1 1 ± 1 Pd–SPd–Pd 3.2 ± 0.2 2.73 ± 0.01 7 ± 1 7.3 ± 0.8 Pd–Pd
Pd/SiO2 after H2S treatment followed by hydrogen reactivationPd–S 1.4 ± 0.2 2.33 ± 0.02 8 ± 1 2 ± 1 Pd–SPd–Pd 4.6 ± 0.4 2.77 ± 0.01 9 ± 1 6.0 ± 0.2 Pd–Pd
Pd/TiO2–SiO2 after H2S treatmentPd–S 0.7 ± 0.2 2.34 ± 0.02 3 ± 1 �2 ± 1 Pd–SPd–Pd 3.2 ± 0.3 2.71 ± 0.02 9 ± 1 5.4 ± 0.3 Pd–PdPd–O 0.6 ± 0.2 2.07 ± 0.02 4 ± 2 �1 ± 1 Pd–O
Pd/TiO2–SiO2 after H2S treatment followed by hydrogen reactivationPd–S 0.2 ± 0.1 2.36 ± 0.02 0 ± 3 0 ± 2 Pd–SPd–Pd 5.1 ± 0.2 2.77 ± 0.01 9 ± 3 8.2 ± 0.3 Pd–PdPd–O 0.5 ± 0.2 2.05 ± 0.03 7 ± 3 �2 ± 1 Pd–O
a N, the coordination number for the absorber–backscattering pair.b R, the average absorber–backscattering distance.c Dr2, the difference in Debye–Waller factors between sample and standard.d DE0, the inner potential correction.
H.-S. Sheu et al. / Journal of Catalysis 266 (2009) 15–25 19
operation temperature for preparing Pd catalyst, the TiO2 aggrega-tion has no effects on the morphology of Pd clusters. Hence, com-mercial anatase was used for the preparation of Pd/TiO2 catalysts.
The SiO2 support was calcined up to 900 �C. Fig. 5a shows thePXRD characterization patterns. No crystalline signals were foundfor these samples indicating that SiO2 maintains its amorphousstate even at a high temperature, which would be advantageousfor applications as a catalyst support. Similar thermal treatmentswere performed for TiO2–SiO2, and the PXRD patterns of TiO2–SiO2 show that the TiO2 maintains its amorphous states at thetemperature up to 600 �C (Fig. 5b). Hence, highly dispersed Pd clus-ters could be prepared on TiO2–SiO2, which has a high surface areaand thermal stability.
3.4. Characterization of grafting TiO2 on SiO2 by EXAFS
Some important structural information can be obtained fromthe Fourier transform of the EXAFS functions, even without a
detailed quantitative EXAFS analysis. Fig. 6 shows the Ti–Ophase-corrected Fourier-transformed EXAFS function at the Ti edgecharacterizing Ti(OCH(CH3)2)4, Ti(OCH(CH3)2)4 adsorbed on SiO2,and TiO2–SiO2. For the Ti(OCH(CH3)2)4 sample, the peak at a dis-tance of about 1.8 Å is contributed from the Ti–O contribution,and the peaks at the distance between 3.0 and 4.5 Å are contrib-uted from the Ti–C contributions.
During the impregnation, the hydroxyl groups on the SiO2 sur-face reacted with isopropoxide ligands, hence, diminishing theamplitude of the peaks at the distance between 3.0 and 4.5 Å, andthe shifting of the position peak at a distance of about 1.8–1.9 Åwas observed. Detailed EXAFS analysis further showed that theresulting material had average Ti–O and Ti–Si bond distances of1.86 and 2.81 Å, and coordination numbers of 4.4 and 2.4, respec-tively. The results suggested that the silanol groups on silica surfacereact with titanium alkoxyl groups to produce Ti–O–Si linkages.
After the calcination of Ti(OCH(CH3)2)4 adsorbed on SiO2, theamplitude of the peaks at about 3.0 Å increased concomitantly
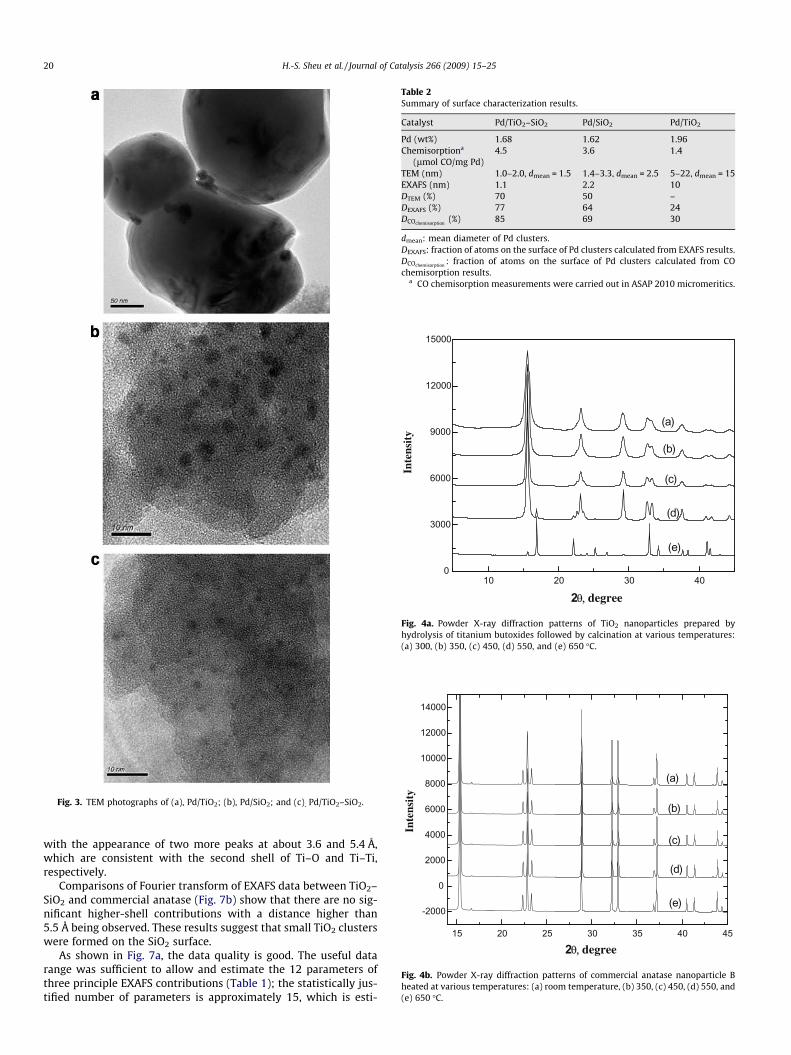
Fig. 3. TEM photographs of (a), Pd/TiO2; (b), Pd/SiO2; and (c), Pd/TiO2–SiO2.
Table 2Summary of surface characterization results.
Catalyst Pd/TiO2–SiO2 Pd/SiO2 Pd/TiO2
Pd (wt%) 1.68 1.62 1.96Chemisorptiona
(lmol CO/mg Pd)4.5 3.6 1.4
TEM (nm) 1.0–2.0, dmean = 1.5 1.4–3.3, dmean = 2.5 5–22, dmean = 15EXAFS (nm) 1.1 2.2 10DTEM (%) 70 50 –DEXAFS (%) 77 64 24DCOchemisorption
(%) 85 69 30
dmean: mean diameter of Pd clusters.DEXAFS: fraction of atoms on the surface of Pd clusters calculated from EXAFS results.DCOchemisorption
: fraction of atoms on the surface of Pd clusters calculated from COchemisorption results.
a CO chemisorption measurements were carried out in ASAP 2010 micromeritics.
10 20 30 400
3000
6000
9000
12000
15000
Inte
nsit
y(a)
(b)
(c)
(d)
(e)
2θ, degree
Fig. 4a. Powder X-ray diffraction patterns of TiO2 nanoparticles prepared byhydrolysis of titanium butoxides followed by calcination at various temperatures:(a) 300, (b) 350, (c) 450, (d) 550, and (e) 650 �C.
15 20 25 30 35 40 45
-2000
0
2000
4000
6000
8000
10000
12000
14000
Inte
nsit
y
2θ, degree
(a)
(b)
(c)
(d)
(e)
Fig. 4b. Powder X-ray diffraction patterns of commercial anatase nanoparticle Bheated at various temperatures: (a) room temperature, (b) 350, (c) 450, (d) 550, and(e) 650 �C.
20 H.-S. Sheu et al. / Journal of Catalysis 266 (2009) 15–25
with the appearance of two more peaks at about 3.6 and 5.4 Å,which are consistent with the second shell of Ti–O and Ti–Ti,respectively.
Comparisons of Fourier transform of EXAFS data between TiO2–SiO2 and commercial anatase (Fig. 7b) show that there are no sig-nificant higher-shell contributions with a distance higher than5.5 Å being observed. These results suggest that small TiO2 clusterswere formed on the SiO2 surface.
As shown in Fig. 7a, the data quality is good. The useful datarange was sufficient to allow and estimate the 12 parameters ofthree principle EXAFS contributions (Table 1); the statistically jus-tified number of parameters is approximately 15, which is esti-

10 20 30 40 50 60 70
500
1000
1500
2000
2500
3000
3500
4000
Inte
nsit
y
2θ, degree
(a)
(b)
(c)
(d)
Fig. 5a. Powder X-ray diffraction patterns of SiO2 heated at various temperatures:(a) room temperature, (b) 450, (c) 600, and (d) 900 �C.
2θθ, degree20 40 60
0
900
1800
2700
Inte
nsit
y (a)
(b)
(c)
Fig. 5b. Powder X-ray diffraction patterns of anatase TiO2 in TiO2–SiO2 heated atvarious temperatures: (a) 450, (b) 600, and (c) 900 �C.
0 2 4 6 8
-6
-4
-2
0
2
4
6
Fou
rier
Tra
nsfo
rm
R, 0.1nm
Fig. 7b. Comparison of the imaginary and magnitude of Fourier transform(3.5 < k3 < 14.0, Ti–O phase corrected) of EXAFS data between commercial anatasewith crystal grain size less than 100 nm (solid line) and TiO2–SiO2 (dashed line).
2 4 6 8 10 12 14
-10
-8
-6
-4
-2
0
2
4
6
8
10C
hi
k, 0.1nm-1
Fig. 7a. Raw EXAFS data (k3 weighting) for commercial anatase with crystal grainsize less than 100 nm (solid line) and TiO2–SiO2 (dashed line).
1 2 3 4 5 6-4
-3
-2
-1
0
1
2
3
4
Fou
rier
Tra
nsfo
rm
R, 0.1nm
Fig. 6. Magnitude and imaginary part of the EXAFS Fourier transform(3.5 < k3 < 14.0, Ti–O phase corrected) for Ti(OCH(CH3)2)4 (dashed line),Ti(OCH(CH3)2)4 adsorbed on SiO2 (dotted line), and TiO2–SiO2 (solid line).
H.-S. Sheu et al. / Journal of Catalysis 266 (2009) 15–25 21
mated from Nyquist theorem [7]: n = (2DkDr/p) + 1, where Dk andDr, respectively, are the k range and r range used in the forwardand inverse Fourier transforms (Dk = 9 Å�1 and Dr = 2.5 Å). Thecoordination number characterizing the TiO2–SiO2 interface (Ti–Si), namely 2.4, suggests that at least 60% of TiO2 existed at theinterface between TiO2 clusters and SiO2. The Ti–Ti coordinationnumber of 3.0 further suggests that layer-like clusters of averagediameter less than 25 Å were formed on SiO2 support. The pro-posed structure model is consistent with PXRD characterizing themorphology of species with crystal grain sizes less than 40 Å; nocharacteristic peaks were observed in PXRD (Fig. 5b).
3.5. Role of grafted TiO2 in improving Pd dispersion
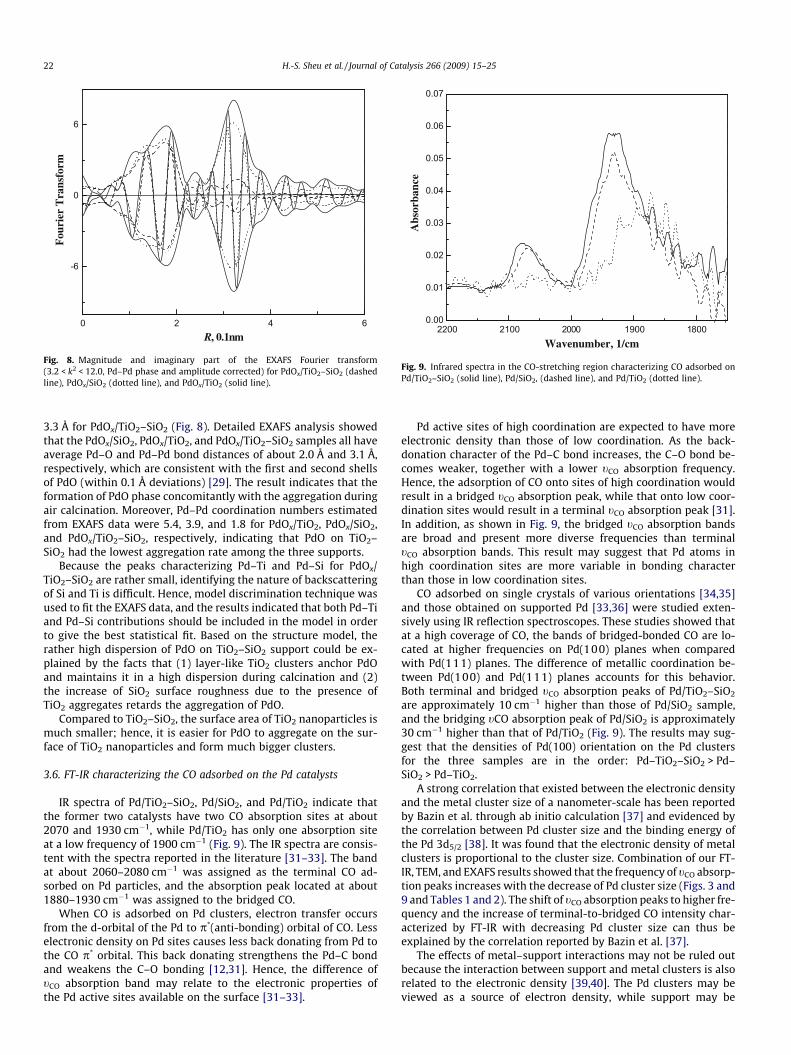
EXAFS data of PdOx/TiO2–SiO2, PdOx/TiO2, and PdOx/SiO2 sam-ples before reduction are shown in Fig. 8. After Pd–Pd phase-cor-rected Fourier transformation was performed on the spectra, apeak at about 3.2 Å was observed for the PdOx/SiO2 and PdOx/TiO2
samples. In contrast, two small peaks appeared at about 3.0 and
0 2 4 6
-6
0
6
Fou
rier
Tra
nsfo
rm
R, 0.1nm
Fig. 8. Magnitude and imaginary part of the EXAFS Fourier transform(3.2 < k2 < 12.0, Pd–Pd phase and amplitude corrected) for PdOx/TiO2–SiO2 (dashedline), PdOx/SiO2 (dotted line), and PdOx/TiO2 (solid line).
2200 2100 2000 1900 18000.00
0.01
0.02
0.03
0.04
0.05
0.06
0.07
Abs
orba
nce
Wavenumber, 1/cm
Fig. 9. Infrared spectra in the CO-stretching region characterizing CO adsorbed onPd/TiO2–SiO2 (solid line), Pd/SiO2, (dashed line), and Pd/TiO2 (dotted line).
22 H.-S. Sheu et al. / Journal of Catalysis 266 (2009) 15–25
3.3 Å for PdOx/TiO2–SiO2 (Fig. 8). Detailed EXAFS analysis showedthat the PdOx/SiO2, PdOx/TiO2, and PdOx/TiO2–SiO2 samples all haveaverage Pd–O and Pd–Pd bond distances of about 2.0 Å and 3.1 Å,respectively, which are consistent with the first and second shellsof PdO (within 0.1 Å deviations) [29]. The result indicates that theformation of PdO phase concomitantly with the aggregation duringair calcination. Moreover, Pd–Pd coordination numbers estimatedfrom EXAFS data were 5.4, 3.9, and 1.8 for PdOx/TiO2, PdOx/SiO2,and PdOx/TiO2–SiO2, respectively, indicating that PdO on TiO2–SiO2 had the lowest aggregation rate among the three supports.
Because the peaks characterizing Pd–Ti and Pd–Si for PdOx/TiO2–SiO2 are rather small, identifying the nature of backscatteringof Si and Ti is difficult. Hence, model discrimination technique wasused to fit the EXAFS data, and the results indicated that both Pd–Tiand Pd–Si contributions should be included in the model in orderto give the best statistical fit. Based on the structure model, therather high dispersion of PdO on TiO2–SiO2 support could be ex-plained by the facts that (1) layer-like TiO2 clusters anchor PdOand maintains it in a high dispersion during calcination and (2)the increase of SiO2 surface roughness due to the presence ofTiO2 aggregates retards the aggregation of PdO.
Compared to TiO2–SiO2, the surface area of TiO2 nanoparticles ismuch smaller; hence, it is easier for PdO to aggregate on the sur-face of TiO2 nanoparticles and form much bigger clusters.
3.6. FT-IR characterizing the CO adsorbed on the Pd catalysts
IR spectra of Pd/TiO2–SiO2, Pd/SiO2, and Pd/TiO2 indicate thatthe former two catalysts have two CO absorption sites at about2070 and 1930 cm�1, while Pd/TiO2 has only one absorption siteat a low frequency of 1900 cm�1 (Fig. 9). The IR spectra are consis-tent with the spectra reported in the literature [31–33]. The bandat about 2060–2080 cm�1 was assigned as the terminal CO ad-sorbed on Pd particles, and the absorption peak located at about1880–1930 cm�1 was assigned to the bridged CO.
When CO is adsorbed on Pd clusters, electron transfer occursfrom the d-orbital of the Pd to p*(anti-bonding) orbital of CO. Lesselectronic density on Pd sites causes less back donating from Pd tothe CO p* orbital. This back donating strengthens the Pd–C bondand weakens the C–O bonding [12,31]. Hence, the difference oftCO absorption band may relate to the electronic properties ofthe Pd active sites available on the surface [31–33].
Pd active sites of high coordination are expected to have moreelectronic density than those of low coordination. As the back-donation character of the Pd–C bond increases, the C–O bond be-comes weaker, together with a lower tCO absorption frequency.Hence, the adsorption of CO onto sites of high coordination wouldresult in a bridged tCO absorption peak, while that onto low coor-dination sites would result in a terminal tCO absorption peak [31].In addition, as shown in Fig. 9, the bridged tCO absorption bandsare broad and present more diverse frequencies than terminaltCO absorption bands. This result may suggest that Pd atoms inhigh coordination sites are more variable in bonding characterthan those in low coordination sites.
CO adsorbed on single crystals of various orientations [34,35]and those obtained on supported Pd [33,36] were studied exten-sively using IR reflection spectroscopes. These studies showed thatat a high coverage of CO, the bands of bridged-bonded CO are lo-cated at higher frequencies on Pd(100) planes when comparedwith Pd(111) planes. The difference of metallic coordination be-tween Pd(100) and Pd(111) planes accounts for this behavior.Both terminal and bridged tCO absorption peaks of Pd/TiO2–SiO2
are approximately 10 cm�1 higher than those of Pd/SiO2 sample,and the bridging tCO absorption peak of Pd/SiO2 is approximately30 cm�1 higher than that of Pd/TiO2 (Fig. 9). The results may sug-gest that the densities of Pd(100) orientation on the Pd clustersfor the three samples are in the order: Pd–TiO2–SiO2 > Pd–SiO2 > Pd–TiO2.
A strong correlation that existed between the electronic densityand the metal cluster size of a nanometer-scale has been reportedby Bazin et al. through ab initio calculation [37] and evidenced bythe correlation between Pd cluster size and the binding energy ofthe Pd 3d5/2 [38]. It was found that the electronic density of metalclusters is proportional to the cluster size. Combination of our FT-IR, TEM, and EXAFS results showed that the frequency of tCO absorp-tion peaks increases with the decrease of Pd cluster size (Figs. 3 and9 and Tables 1 and 2). The shift of tCO absorption peaks to higher fre-quency and the increase of terminal-to-bridged CO intensity char-acterized by FT-IR with decreasing Pd cluster size can thus beexplained by the correlation reported by Bazin et al. [37].
The effects of metal–support interactions may not be ruled outbecause the interaction between support and metal clusters is alsorelated to the electronic density [39,40]. The Pd clusters may beviewed as a source of electron density, while support may be
H.-S. Sheu et al. / Journal of Catalysis 266 (2009) 15–25 23
viewed as an electron acceptor. The increase of metal–supportinteraction may deplete the electronic density of Pd clusters result-ing in a decrease of bridged tCO absorption peak intensity; asshown in Fig. 9, terminal-to-bridged CO intensities for the threecatalyst samples are in the order: Pd/TiO2–SiO2 > Pd/SiO2 > Pd/TiO2.
3.7. Effects of Pd morphology on sulfur poisoning and hydrogenreactivation
As shown in Figs. 1 and 9, two deactivation stages and two tCO
absorption bands were observed for Pd/TiO2–SiO2 and Pd/SiO2
samples, while only one was observed for Pd/TiO2. Accordingly,we proposed that there are two different types of active sites onSiO2 and TiO2–SiO2 supports, whereas there is only one type onTiO2. These two active sites were denoted as Pdl and Pdh, wherethe subscripts l and h are represented as active sites with low coor-dination and high coordination, respectively.
Active sites of high coordination may present a higher basicitytoward the acidic hydrogen of H2S. Thus the affiliation of H2S onPdh site is higher than that on Pdl site due to the difference of elec-tronic density. This may result in a higher poisoning effect on thePdh site.
Sulfur poisoning of these two active sites could thus be formu-lated as:
Pdl þH2S$ Pdl �H2S$ PdlSþH2 ð1ÞPdh þH2S$ Pdh �H2S$ PdhSþH2 ð2Þ
Since Pd/TiO2 exhibits only bridged tCO absorption band and noactivity was left after 5-h poisoning, irreversible reaction was sug-gested for the sulfur-poisoning reaction. Eq. (2) was simplified as
Pdh þH2S! PdhSþH2 ð3Þ
In the case of Pd/TiO2–SiO2 and Pd/SiO2 samples, we expectedthat the first-stage deactivation resulted from the formation of PdhSand the second stage resulted from the adsorption of H2S on Pdl andthe formation of PdlS. However, inferring from the findings of Kimet al. that the formation of Pt–S bond induces Pt migration leadingto a sintering of Pt clusters [41], we might expect that affinity ofthese two Pd sites for H2S and their respective poisoning ratesmight be varied with the sintering effects. Because of the complex-ity of the sulfur-poisoning mechanism, rather than attempting todevelop a rigorous model, we proposed an empirical model basedon the observation of test reactions. In the model, rate expressionfor the competition adsorption was formulated by assuming thatthe adsorption rate of H2S on Pdl sites is inversely proportional tothe number of vacant Pdh. For simplification, the model also lumpsthe effects of Pd migration into deactivation constants.
In order to examine external mass transfer limitation, Pd/SiO2
catalyst was tested at a constant WHSV (12 h�1) with variablesuperficial mass flow velocities, us, ranging from 25 to 80 g/cm2 h�1; where us = (mass flow rate, g/h)/(inside cross section ofthe reactor, cm2) (porosity of catalyst bed). The experimental re-sults indicated that tetralin conversion did not vary (within exper-imental error) with superficial velocities; the tetralin conversionswere 0.91, 0.94, and 0.92 for superficial mass velocities of 28, 42,and 84 g/cm2 h�1, respectively. The results suggested that theexternal mass transfer limitation is insignificant [42].
Since the particle sizes of Pd/TiO2, Pd/SiO2, and Pd/TiO2–SiO2 arerather small, examination of the diffusion resistance of these israther difficult. Hence, a model Pd/SiO2 catalyst having a 4 mmdiameter was purposely prepared by the use of pellet SiO2 support(CARiACT Q10, SA = 300 m2). When the catalyst was crushed from4 mm to about 1 mm tetralin conversion increased from 0.68 to0.91 for the superficial mass velocity of 42 g/cm2 h�1. When the
catalyst was further pulverized to about 0.2 mm, the conversion in-creased to 0.93. Since the diameters of Pd/SiO2 and Pd/TiO2–SiO2
catalysts are of 0.2–0.5 mm and the pore diameters of these cata-lysts are close to that of the model catalyst, the internal-mass-transfer testing results suggested that the tests for the comparisonof the stability of Pd/SiO2 and Pd/TiO2–SiO2 should be operated inthe regimes of combination of chemical and diffusion control,whereas the effectiveness factor g was greater than 0.9; g wasestimated by the use of the correlation between g and generalizedThiele modulus [42].
Combined with the definition of activity function [42], the de-cay rate law [43], and the rate expression for tetralin hydrogena-tion proposed by Boudalt [44], a model for the sulfur-poisoningcatalyst deactivation was formulated as follows:
dCT
ds¼ � khCH2 CT
1þ KTCTgasum � k0hCTasum; when KT � 1 ð4Þ
dah
dt¼ �k1f ah ð5Þ
dal
dt¼ � k2f al
1þ Kbahþ k2raI ð6Þ
daI
dt¼ k2f al
1þ Kbah� k2raI � ðk3f aI � k3ralsÞ ð7Þ
asum ¼ ah þ al; at start of run; a0sum ¼ a0
h þ a0l ¼ 1 ð8Þ
a0l ¼ al þ als þ aI ð9Þ
In Eq. (4) (design equation), s (1/WHSV) is the space time; g isthe overall effectiveness factor indicating the relative importanceof mass transfer and reaction limitation; CT and CH2 are the concen-trations of tetralin and hydrogen, respectively; KT is the adsorptionequilibrium constant of tetralin; kh is the intrinsic hydrogenationreaction constant; and asum is the normalized total activity coeffi-cient and is equal to the summation of activity coefficient of highcoordination sites, ah, and low coordination sites, al. Since hydro-gen concentration in the liquid phase is dependent on the reactionpressure and temperature, which assure constants during the tests,kh can thus be lumped with CH2 and g, and it becomes kh0 . When KT
is much less than 1, the design equation can be simplified as apseudo-first-order rate expression, which is consistent with themodel reported by Castano et al. [45].
Eq. (5) was derived based on Eq. (3), where ah is the catalyticactivity contributed from high coordination sites, and k1f is a rateconstant for describing the loss of catalyst activity due to the for-mation of PdhS.
Eqs. (6), (7) and (9) were derived based on Eq. (1), where al isthe catalytic activity contributed from low coordination sites, aI
is the activity loss due to the adsorption of H2S on low coordinationsites, and als is the activity loss caused by the formation of PdlS. Thekinetic constants k2f and k2r are the forward and reverse rate con-stants of H2S adsorbed on the low coordination sites, respectively,and k3f and k3r are the forward and reverse rate constants for theformation of PdlS, respectively; where Kb is a parameter for assess-ing the importance of Pdh in retarding H2S adsorbed on Pdl. Theaccelerated deactivation data (Fig. 1) were fitted by the proposedmodel with the least-square criteria, and the results are summa-rized in Table 3.
It is worthy to note that the activity improvement contributedby the grafted TiO2 as assessed by the ratio of observed rate con-stants, k0hðPd=TiO2—SiO2Þ=k0hðPd=SiO2Þ, will be underestimated. In testingPd/SiO2 and Pd/TiO2–SiO2 catalysts, the geometry of the catalystpellets and the operating conditions are the same for these twocatalysts tested, while the pore radius of the Pd/TiO2–SiO2 catalystis slightly smaller than that of Pd/SiO2. Thus, the effective diffusiv-ity and the corresponding overall effectiveness factor g for Pd/TiO2–SiO2 are slightly smaller than those for Pd/SiO2. Based on
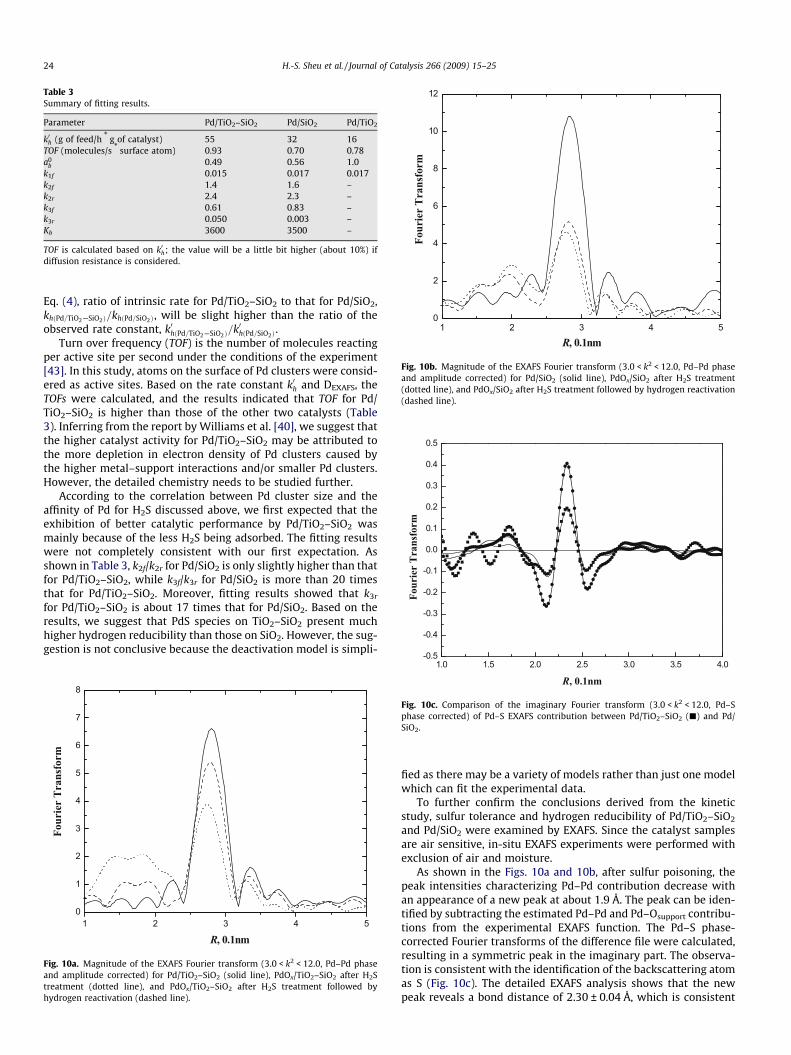
Table 3Summary of fitting results.
Parameter Pd/TiO2–SiO2 Pd/SiO2 Pd/TiO2
k0h (g of feed/h * g of catalyst) 55 32 16TOF (molecules/s * surface atom) 0.93 0.70 0.78a0
b 0.49 0.56 1.0k1f 0.015 0.017 0.017k2f 1.4 1.6 –k2r 2.4 2.3 –k3f 0.61 0.83 –k3r 0.050 0.003 –Kb 3600 3500 –
TOF is calculated based on k0h; the value will be a little bit higher (about 10%) ifdiffusion resistance is considered.
1 2 3 4 50
2
4
6
8
10
12
Four
ier
Tra
nsfo
rm
R, 0.1nm
Fig. 10b. Magnitude of the EXAFS Fourier transform (3.0 < k2 < 12.0, Pd–Pd phaseand amplitude corrected) for Pd/SiO2 (solid line), PdOx/SiO2 after H2S treatment(dotted line), and PdOx/SiO2 after H2S treatment followed by hydrogen reactivation(dashed line).
-0.5
-0.4
-0.3
-0.2
-0.1
0.0
0.1
0.2
0.3
0.4
0.5
Four
ier
Tra
nsfo
rm
24 H.-S. Sheu et al. / Journal of Catalysis 266 (2009) 15–25
Eq. (4), ratio of intrinsic rate for Pd/TiO2–SiO2 to that for Pd/SiO2,khðPd=TiO2—SiO2Þ=khðPd=SiO2Þ, will be slight higher than the ratio of theobserved rate constant, k0hðPd=TiO2—SiO2Þ=k0hðPd=SiO2Þ.
Turn over frequency (TOF) is the number of molecules reactingper active site per second under the conditions of the experiment[43]. In this study, atoms on the surface of Pd clusters were consid-ered as active sites. Based on the rate constant k0h and DEXAFS, theTOFs were calculated, and the results indicated that TOF for Pd/TiO2–SiO2 is higher than those of the other two catalysts (Table3). Inferring from the report by Williams et al. [40], we suggest thatthe higher catalyst activity for Pd/TiO2–SiO2 may be attributed tothe more depletion in electron density of Pd clusters caused bythe higher metal–support interactions and/or smaller Pd clusters.However, the detailed chemistry needs to be studied further.
According to the correlation between Pd cluster size and theaffinity of Pd for H2S discussed above, we first expected that theexhibition of better catalytic performance by Pd/TiO2–SiO2 wasmainly because of the less H2S being adsorbed. The fitting resultswere not completely consistent with our first expectation. Asshown in Table 3, k2f/k2r for Pd/SiO2 is only slightly higher than thatfor Pd/TiO2–SiO2, while k3f/k3r for Pd/SiO2 is more than 20 timesthat for Pd/TiO2–SiO2. Moreover, fitting results showed that k3r
for Pd/TiO2–SiO2 is about 17 times that for Pd/SiO2. Based on theresults, we suggest that PdS species on TiO2–SiO2 present muchhigher hydrogen reducibility than those on SiO2. However, the sug-gestion is not conclusive because the deactivation model is simpli-
1 2 3 4 50
1
2
3
4
5
6
7
8
Four
ier
Tra
nsfo
rm
R, 0.1nm
Fig. 10a. Magnitude of the EXAFS Fourier transform (3.0 < k2 < 12.0, Pd–Pd phaseand amplitude corrected) for Pd/TiO2–SiO2 (solid line), PdOx/TiO2–SiO2 after H2Streatment (dotted line), and PdOx/TiO2–SiO2 after H2S treatment followed byhydrogen reactivation (dashed line).
1.0 1.5 2.0 2.5 3.0 3.5 4.0
R, 0.1nm
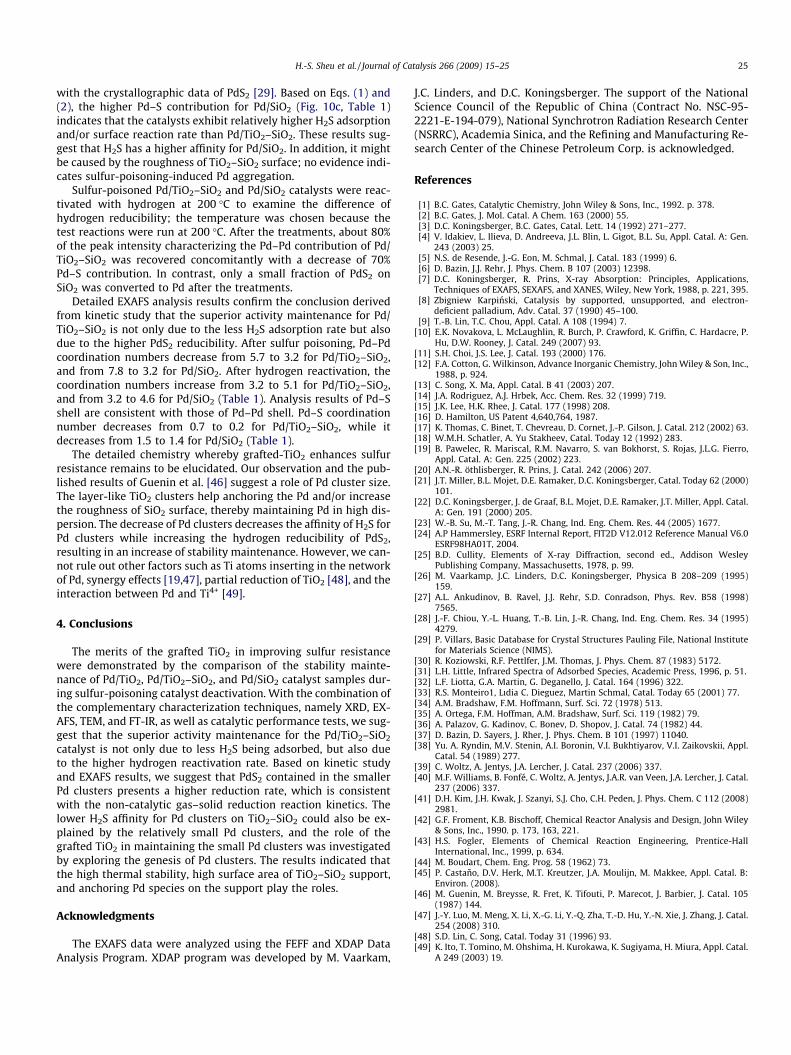
Fig. 10c. Comparison of the imaginary Fourier transform (3.0 < k2 < 12.0, Pd–Sphase corrected) of Pd–S EXAFS contribution between Pd/TiO2–SiO2 (j) and Pd/SiO2.
fied as there may be a variety of models rather than just one modelwhich can fit the experimental data.
To further confirm the conclusions derived from the kineticstudy, sulfur tolerance and hydrogen reducibility of Pd/TiO2–SiO2
and Pd/SiO2 were examined by EXAFS. Since the catalyst samplesare air sensitive, in-situ EXAFS experiments were performed withexclusion of air and moisture.
As shown in the Figs. 10a and 10b, after sulfur poisoning, thepeak intensities characterizing Pd–Pd contribution decrease withan appearance of a new peak at about 1.9 Å. The peak can be iden-tified by subtracting the estimated Pd–Pd and Pd–Osupport contribu-tions from the experimental EXAFS function. The Pd–S phase-corrected Fourier transforms of the difference file were calculated,resulting in a symmetric peak in the imaginary part. The observa-tion is consistent with the identification of the backscattering atomas S (Fig. 10c). The detailed EXAFS analysis shows that the newpeak reveals a bond distance of 2.30 ± 0.04 Å, which is consistent
H.-S. Sheu et al. / Journal of Catalysis 266 (2009) 15–25 25
with the crystallographic data of PdS2 [29]. Based on Eqs. (1) and(2), the higher Pd–S contribution for Pd/SiO2 (Fig. 10c, Table 1)indicates that the catalysts exhibit relatively higher H2S adsorptionand/or surface reaction rate than Pd/TiO2–SiO2. These results sug-gest that H2S has a higher affinity for Pd/SiO2. In addition, it mightbe caused by the roughness of TiO2–SiO2 surface; no evidence indi-cates sulfur-poisoning-induced Pd aggregation.
Sulfur-poisoned Pd/TiO2–SiO2 and Pd/SiO2 catalysts were reac-tivated with hydrogen at 200 �C to examine the difference ofhydrogen reducibility; the temperature was chosen because thetest reactions were run at 200 �C. After the treatments, about 80%of the peak intensity characterizing the Pd–Pd contribution of Pd/TiO2–SiO2 was recovered concomitantly with a decrease of 70%Pd–S contribution. In contrast, only a small fraction of PdS2 onSiO2 was converted to Pd after the treatments.
Detailed EXAFS analysis results confirm the conclusion derivedfrom kinetic study that the superior activity maintenance for Pd/TiO2–SiO2 is not only due to the less H2S adsorption rate but alsodue to the higher PdS2 reducibility. After sulfur poisoning, Pd–Pdcoordination numbers decrease from 5.7 to 3.2 for Pd/TiO2–SiO2,and from 7.8 to 3.2 for Pd/SiO2. After hydrogen reactivation, thecoordination numbers increase from 3.2 to 5.1 for Pd/TiO2–SiO2,and from 3.2 to 4.6 for Pd/SiO2 (Table 1). Analysis results of Pd–Sshell are consistent with those of Pd–Pd shell. Pd–S coordinationnumber decreases from 0.7 to 0.2 for Pd/TiO2–SiO2, while itdecreases from 1.5 to 1.4 for Pd/SiO2 (Table 1).
The detailed chemistry whereby grafted-TiO2 enhances sulfurresistance remains to be elucidated. Our observation and the pub-lished results of Guenin et al. [46] suggest a role of Pd cluster size.The layer-like TiO2 clusters help anchoring the Pd and/or increasethe roughness of SiO2 surface, thereby maintaining Pd in high dis-persion. The decrease of Pd clusters decreases the affinity of H2S forPd clusters while increasing the hydrogen reducibility of PdS2,resulting in an increase of stability maintenance. However, we can-not rule out other factors such as Ti atoms inserting in the networkof Pd, synergy effects [19,47], partial reduction of TiO2 [48], and theinteraction between Pd and Ti4+ [49].
4. Conclusions
The merits of the grafted TiO2 in improving sulfur resistancewere demonstrated by the comparison of the stability mainte-nance of Pd/TiO2, Pd/TiO2–SiO2, and Pd/SiO2 catalyst samples dur-ing sulfur-poisoning catalyst deactivation. With the combination ofthe complementary characterization techniques, namely XRD, EX-AFS, TEM, and FT-IR, as well as catalytic performance tests, we sug-gest that the superior activity maintenance for the Pd/TiO2–SiO2
catalyst is not only due to less H2S being adsorbed, but also dueto the higher hydrogen reactivation rate. Based on kinetic studyand EXAFS results, we suggest that PdS2 contained in the smallerPd clusters presents a higher reduction rate, which is consistentwith the non-catalytic gas–solid reduction reaction kinetics. Thelower H2S affinity for Pd clusters on TiO2–SiO2 could also be ex-plained by the relatively small Pd clusters, and the role of thegrafted TiO2 in maintaining the small Pd clusters was investigatedby exploring the genesis of Pd clusters. The results indicated thatthe high thermal stability, high surface area of TiO2–SiO2 support,and anchoring Pd species on the support play the roles.
Acknowledgments
The EXAFS data were analyzed using the FEFF and XDAP DataAnalysis Program. XDAP program was developed by M. Vaarkam,
J.C. Linders, and D.C. Koningsberger. The support of the NationalScience Council of the Republic of China (Contract No. NSC-95-2221-E-194-079), National Synchrotron Radiation Research Center(NSRRC), Academia Sinica, and the Refining and Manufacturing Re-search Center of the Chinese Petroleum Corp. is acknowledged.
References
[1] B.C. Gates, Catalytic Chemistry, John Wiley & Sons, Inc., 1992. p. 378.[2] B.C. Gates, J. Mol. Catal. A Chem. 163 (2000) 55.[3] D.C. Koningsberger, B.C. Gates, Catal. Lett. 14 (1992) 271–277.[4] V. Idakiev, L. Ilieva, D. Andreeva, J.L. Blin, L. Gigot, B.L. Su, Appl. Catal. A: Gen.
243 (2003) 25.[5] N.S. de Resende, J.-G. Eon, M. Schmal, J. Catal. 183 (1999) 6.[6] D. Bazin, J.J. Rehr, J. Phys. Chem. B 107 (2003) 12398.[7] D.C. Koningsberger, R. Prins, X-ray Absorption: Principles, Applications,
Techniques of EXAFS, SEXAFS, and XANES, Wiley, New York, 1988, p. 221, 395.[8] Zbigniew Karpinski, Catalysis by supported, unsupported, and electron-
deficient palladium, Adv. Catal. 37 (1990) 45–100.[9] T.-B. Lin, T.C. Chou, Appl. Catal. A 108 (1994) 7.
[10] E.K. Novakova, L. McLaughlin, R. Burch, P. Crawford, K. Griffin, C. Hardacre, P.Hu, D.W. Rooney, J. Catal. 249 (2007) 93.
[11] S.H. Choi, J.S. Lee, J. Catal. 193 (2000) 176.[12] F.A. Cotton, G. Wilkinson, Advance Inorganic Chemistry, John Wiley & Son, Inc.,
1988, p. 924.[13] C. Song, X. Ma, Appl. Catal. B 41 (2003) 207.[14] J.A. Rodriguez, A.J. Hrbek, Acc. Chem. Res. 32 (1999) 719.[15] J.K. Lee, H.K. Rhee, J. Catal. 177 (1998) 208.[16] D. Hamilton, US Patent 4,640,764, 1987.[17] K. Thomas, C. Binet, T. Chevreau, D. Cornet, J.-P. Gilson, J. Catal. 212 (2002) 63.[18] W.M.H. Schatler, A. Yu Stakheev, Catal. Today 12 (1992) 283.[19] B. Pawelec, R. Mariscal, R.M. Navarro, S. van Bokhorst, S. Rojas, J.L.G. Fierro,
Appl. Catal. A: Gen. 225 (2002) 223.[20] A.N.-R. öthlisberger, R. Prins, J. Catal. 242 (2006) 207.[21] J.T. Miller, B.L. Mojet, D.E. Ramaker, D.C. Koningsberger, Catal. Today 62 (2000)
101.[22] D.C. Koningsberger, J. de Graaf, B.L. Mojet, D.E. Ramaker, J.T. Miller, Appl. Catal.
A: Gen. 191 (2000) 205.[23] W.-B. Su, M.-T. Tang, J.-R. Chang, Ind. Eng. Chem. Res. 44 (2005) 1677.[24] A.P Hammersley, ESRF Internal Report, FIT2D V12.012 Reference Manual V6.0
ESRF98HA01T, 2004.[25] B.D. Cullity, Elements of X-ray Diffraction, second ed., Addison Wesley
Publishing Company, Massachusetts, 1978, p. 99.[26] M. Vaarkamp, J.C. Linders, D.C. Koningsberger, Physica B 208–209 (1995)
159.[27] A.L. Ankudinov, B. Ravel, J.J. Rehr, S.D. Conradson, Phys. Rev. B58 (1998)
7565.[28] J.-F. Chiou, Y.-L. Huang, T.-B. Lin, J.-R. Chang, Ind. Eng. Chem. Res. 34 (1995)
4279.[29] P. Villars, Basic Database for Crystal Structures Pauling File, National Institute
for Materials Science (NIMS).[30] R. Koziowski, R.F. Pettlfer, J.M. Thomas, J. Phys. Chem. 87 (1983) 5172.[31] L.H. Little, Infrared Spectra of Adsorbed Species, Academic Press, 1996, p. 51.[32] L.F. Liotta, G.A. Martin, G. Deganello, J. Catal. 164 (1996) 322.[33] R.S. Monteiro1, Lıdia C. Dieguez, Martin Schmal, Catal. Today 65 (2001) 77.[34] A.M. Bradshaw, F.M. Hoffmann, Surf. Sci. 72 (1978) 513.[35] A. Ortega, F.M. Hoffman, A.M. Bradshaw, Surf. Sci. 119 (1982) 79.[36] A. Palazov, G. Kadinov, C. Bonev, D. Shopov, J. Catal. 74 (1982) 44.[37] D. Bazin, D. Sayers, J. Rher, J. Phys. Chem. B 101 (1997) 11040.[38] Yu. A. Ryndin, M.V. Stenin, A.I. Boronin, V.I. Bukhtiyarov, V.I. Zaikovskii, Appl.
Catal. 54 (1989) 277.[39] C. Woltz, A. Jentys, J.A. Lercher, J. Catal. 237 (2006) 337.[40] M.F. Williams, B. Fonfé, C. Woltz, A. Jentys, J.A.R. van Veen, J.A. Lercher, J. Catal.
237 (2006) 337.[41] D.H. Kim, J.H. Kwak, J. Szanyi, S.J. Cho, C.H. Peden, J. Phys. Chem. C 112 (2008)
2981.[42] G.F. Froment, K.B. Bischoff, Chemical Reactor Analysis and Design, John Wiley
& Sons, Inc., 1990. p. 173, 163, 221.[43] H.S. Fogler, Elements of Chemical Reaction Engineering, Prentice-Hall
International, Inc., 1999, p. 634.[44] M. Boudart, Chem. Eng. Prog. 58 (1962) 73.[45] P. Castano, D.V. Herk, M.T. Kreutzer, J.A. Moulijn, M. Makkee, Appl. Catal. B:
Environ. (2008).[46] M. Guenin, M. Breysse, R. Fret, K. Tifouti, P. Marecot, J. Barbier, J. Catal. 105
(1987) 144.[47] J.-Y. Luo, M. Meng, X. Li, X.-G. Li, Y.-Q. Zha, T.-D. Hu, Y.-N. Xie, J. Zhang, J. Catal.
254 (2008) 310.[48] S.D. Lin, C. Song, Catal. Today 31 (1996) 93.[49] K. Ito, T. Tomino, M. Ohshima, H. Kurokawa, K. Sugiyama, H. Miura, Appl. Catal.
A 249 (2003) 19.
Related Documents