Super liquid-repellent surfaces –
Interactions and gas capillaries
Mimmi Eriksson
Academic Dissertation which, with due permission of the KTH Royal Institute of
Technology, is submitted for public defense for the Degree of Doctor of Philosophy
on Friday 9 October 2020, at 10:00 a.m. in Kollegiesalen, Brinellvägen 8, Stockholm.
Doctoral Thesis in Chemistry
KTH Royal Institute of Technology
Stockholm, Sweden 2020


i
Abstract
Super liquid-repellent surfaces have attracted a lot of interest in recent
years. In addition to the large scientific interest there are many potential
technological applications ranging from self-cleaning materials to
microfluidic devices. In this thesis, interactions between liquid-repellent
surfaces in liquids were studied, with the aim to investigate the detailed
mechanisms of super liquid-repellence, such as superhydrophobicity and
superamphiphobicity. An atomic force microscope (AFM) was used to
measure the interaction forces between super liquid-repellent surfaces and
a microsphere in different liquids. Additionally, a setup combining AFM
with laser scanning confocal microscopy (LSCM) was used, which enabled
simultaneous imaging in order to capture the microscopic events between
the sphere and the surface during a force measurement. The confocal
images successfully visualized how the strongly attractive forces measured
between liquid-repellent surfaces are due to the formation of a gaseous
capillary bridge between the two surfaces. Similar long-ranged forces with
capillary formation and growth were observed both in water and in lower
surface tension liquids. Additionally, the confocal images enabled
determination of the capillary shape and volume, and the data showed an
increase of the capillary volume during the major part of the process of
separating the surfaces. A gaseous layer underneath the liquid at super
liquid-repellent surfaces was also visualized with LSCM, and it was
concluded that this gaseous layer is responsible for the formation and
growth of large gas capillaries. It was found that an increased amount of
available gas in the gaseous layer influenced the interactions and allowed
the capillary to grow larger during separation. Further, theoretical
calculations based on the size and shape of the capillary suggested that a
small under pressure in the capillary drives the gas to flow from the
gaseous surface layer into the capillary, facilitating growth during
separation.
Keywords: superhydrophobicity, superamphiphobicity, wetting, capillary
forces, AFM, LSCM.

ii
Sammanfattning
Extremt vätskeavvisande ytor har väckt stort intresse de senaste åren.
Förutom det stora vetenskapliga intresset finns det många potentiella
tekniska tillämpningar, allt från självrengörande material till mikrofluidala
system. I denna avhandling studerades hur vätskeavvisande ytor
interagerar i vätskor, detta i syfte att undersöka de detaljerade
mekanismerna bakom extrem vätskeavvisning. Ett atomkraftmikroskop
(AFM) användes för att mäta interaktionskrafterna mellan vätskeavvisande
ytor och en mikrosfär i olika vätskor. En uppställning som kombinerade
AFM med laserkonfokalmikroskopi (LSCM) möjliggjorde samtidig
avbildning för att fånga de mikroskopiska händelserna mellan partikeln
och ytan under en kraftmätning. Konfokalbilderna visualiserade
framgångsrikt hur de starkt attraktiva krafterna mellan vätskeavvisande
ytor orsakas av bildandet av en gasformig kapillär mellan de två ytorna.
Liknande långväga krafter med kapillärbildning observerades både i vatten
och i vätskor med lägre ytspänning. Dessutom möjliggjorde
konfokalbilderna beräkning av kapillärens form och volym och detta
visade en ökning av kapillärvolymen under huvuddelen av
separationsprocessen. En gasformig film under vätskan vid extremt
vätskeavvisande ytor visualiserades med LSCM och slutsatsen drogs att
denna gasfilm är ansvarig för bildandet och tillväxten av stora
gaskapillärer. Det visade sig att en ökad mängd gas i denna gasfilm
påverkade interaktionerna och tillät kapillären att växa sig större under
separationen. Vidare visade teoretiska beräkningar utifrån kapillärens
storlek och form att ett litet undertryck i kapillären driver gasen att
strömma från den gasformiga ytfilmen in i kapillären och detta bidrar till
tillväxten under separationen.
Nyckelord: superhydrofobicitet, superamfifobicitet, vätning, kapillär-
krafter, AFM, LSCM.

iii
List of publications
This thesis is based on the following papers:
I Mimmi Eriksson, Mikko Tuominen, Mikael Järn, Per M. Claesson,
Viveca Wallqvist, Hans-Jürgen Butt, Doris Vollmer, Michael Kappl,
Patrick A.C. Gane, Joachim Schoelkopf, Hannu Teisala and Agne
Swerin. Direct Observation of Gas Meniscus Formation on a
Superhydrophobic Surface. ACS Nano, 2019, 13, 2246-2252.
II Mimmi Eriksson, Per M. Claesson, Mikael Järn, Mikko Tuominen,
Viveca Wallqvist, Joachim Schoelkopf, Patrick A.C. Gane and Agne
Swerin. Wetting Transition on Liquid-Repellent Surfaces Probed by
Surface Force Measurements and Confocal Imaging. Langmuir,
2019, 35, 13275-13285.
III Mimmi Eriksson, Per M. Claesson, Mikael Järn, Viveca Wallqvist,
Mikko Tuominen, Michael Kappl, Hannu Teisala, Doris Vollmer,
Joachim Schoelkopf, Patrick A.C. Gane, Jyrki M. Mäkelä and Agne
Swerin. Gas capillaries and capillary forces at superamphiphobic
surfaces: Effects of liquid surface tension. Submitted, 2020.
IV Mimmi Eriksson, Per M. Claesson, Mikael Järn, Viveca Wallqvist,
Mikko Tuominen, Michael Kappl, Hannu Teisala, Doris Vollmer,
Joachim Schoelkopf, Patrick A.C. Gane, Jyrki M. Mäkelä and Agne
Swerin. Superhydrophobic surfaces: Effects of gas layer thickness on
capillary interactions. Manuscript.
The papers are referred to in the text by their Roman numerals and the full
versions are appended at the end of the thesis.
iv
Contributions to the included publications
Paper I All experimental work and data analysis. Major part of
manuscript preparation.
Paper II All experimental work and data analysis. Major part of
manuscript preparation.
Paper III Major part of experimental work (except LFS-coating, cross-
sectional SEM and XPS) and data analysis. Major part of
manuscript preparation.
Paper IV Major part of experimental work (except LFS-coating and
cross-sectional SEM) and data analysis. Major part of
manuscript preparation.
Related work not included in this thesis
V Mimmi Eriksson and Agne Swerin. Forces at Superhydrophobic
and Superamphiphobic Surfaces. Current Opinion in Colloid &
Interface Science, 2020, 47, 46-57.
VI Haiyan Yin, Maziar Sedighi Moghaddam, Mikko Tuominen,
Mimmi Eriksson, Mikael Järn, Andra Dédinaité, Magnus Wålinder
and Agne Swerin. Superamphiphobic Plastrons on Wood and their
Effects on Liquid Repellence. Materials & Design, 2020, 195,
108974.

v
Summary of included publications
Paper I
Laser scanning confocal microscopy was combined with colloidal probe
atomic force microscopy to obtain microscopic images of gas capillaries
during force measurements between a superhydrophobic surface and a
hydrophobic microsphere in water. The confocal images provided visual
proof that the long-range attractive interactions acting on separation are
due to capillary formation and volume growth. The capillary shape and size
were extracted from confocal images allowing direct calculations of the
Young-Laplace capillary pressure. It was concluded that the pre-existing
gaseous layer at the superhydrophobic surface facilitates the formation and
growth of the capillary, and that an under pressure in the capillary drives
the gas flow from this gaseous layer into the capillary allowing the volume
to increase during separation.
Paper II
The relation between wettability and interaction forces of a nanostructured
superhydrophobic and a smooth hydrophobic surface was studied by
adding ethanol to water at different concentrations. Colloidal probe atomic
force microscopy measurements between a hydrophobic microsphere and
the superhydrophobic surface showed attractive interactions consistent
with the formation of a large and growing gas capillary in water and when
ethanol was introduced at 20 vol%. Laser scanning confocal microscopy
confirmed the presence of a gaseous layer at the superhydrophobic surface
consistent with a Cassie-Baxter type wetting state for both water and 20
vol% ethanol. For the ethanol concentration 40 vol% where no force curves
related to a growing capillary were observed, confocal images indicated
that the surface structure was wetted by the liquid with no or small amounts

vi
of trapped gas. This indicates that a gaseous layer at the surface is needed
for large gas capillaries to form and grow. Additionally, no force curves
with attractions in the micrometer range were observed between the
hydrophobic microsphere and a smooth hydrophobic surface. However, in
this case, interactions consistent with the formation of a small gas capillary
with constant volume during separation were observed in water and 20
vol% ethanol, where the macroscopic contact angles were larger than 90°.
Paper III
The setup combining colloidal probe atomic force microscopy and laser
scanning confocal microscopy utilized in Paper I, was used to study
interactions involving a superamphiphobic surface and to investigate
whether and how surface interactions and gas capillary formation were
affected by the surface tension of the liquid. Force measurements between
a hydrophobic microsphere and a superamphiphobic were performed in
three liquids with different surface tensions: water (73 mN m-1), ethylene
glycol (48 mN m-1) and hexadecane (27 mN m-1). Attractive interactions
due to bridging gas capillaries were observed in all three liquids, and the
range and magnitude of the forces as well as the capillary size decreased
with decreasing liquid surface tension. While the wetting properties were
similar on the superamphiphobic surface for all three liquids, it was found
that the wettability of the probe particle highly influenced the interactions.
When this contact angle was below 90°, a repulsion due to deformation of
the liquid-gas interface at the superamphiphobic surface was observed
prior to capillary formation. Calculations of the free energy due to capillary
formation from the shape of the capillary meniscus and comparing with
force measurements, suggested a small under pressure in the capillary
during the dynamic measurements.

vii
Paper IV
In this paper, it was investigated how the coating thickness and the
thickness of the gaseous layer on superhydrophobic coatings influence the
interactions and gas capillary size and shape. Superhydrophobic samples
with different coating thicknesses were prepared by applying an increased
number of liquid flame spray coating cycles. With laser scanning confocal
microscopy, it was confirmed that the thickness of the gaseous layer
increased with increasing coating thickness. During colloidal probe atomic
force microscopy measurements between the superhydrophobic samples
and a hydrophobic microsphere, attractive capillary forces with the
formation of bridging gas capillaries were observed for all five coatings. It
was found that the range of the attractive force and the capillary size
increased with increasing coating thickness. The results indicated that the
amount of available gas in the gaseous layer is influencing the capillary
formation and growth.

viii

ix
Acknowledgements
I want to express my sincere gratitude to all people who in any way have
helped and supported me during this thesis work.
First, I would like to thank my supervisors, Agne Swerin and Per Claesson,
for giving me the opportunity to join this project and for your valuable
support, engagement and scientific guidance. To my co-supervising-team,
Mikael Järn, Mikko Tuominen and Viveca Wallqvist, thank you all for
your encouragement and support as well as contributions to interesting
discussions during our project meetings.
To all my co-authors on the papers, without you this thesis would be a
completely different story. Thank you all for great collaborations.
Joachim Schoelkopf and Patrick Gane, thank you for always showing such
great engagement and enthusiasm in the project. Hans-Jürgen Butt, Doris
Vollmer, Michael Kappl and Hannu Teisala, thank you for inviting me to
Mainz and for sharing your knowledge. Thanks to Jyrki Mäkelä for
inviting us to Tampere and to Janne Haapanen and Paxton Juuti for
preparing excellent coatings.
I would also like to thank everyone at the Max Planck Institute for Polymer
Research for making me feel welcomed and for all help and technical
support during my stays.
To all colleagues (past and present) at RISE, thanks for all help, support
and stimulating discussions (both scientific and non-research-related) as
well as contributing to a nice working atmosphere. Thanks to everyone at
the Division of Surface and Corrosion Science at KTH for help, nice
discussions and a friendly environment.
Thanks to all my friends and family for your love and support, and Lisa,
thank you for being my greatest support during this work and in life.

x
Finally, I would like to acknowledge the Swedish Foundation for Strategic
Research and Omya International AG for funding this project, as well as
Knut and Alice Wallenbergs stiftelse for travel grants supporting my
attendance at an international conference.

xi
Abbreviations
2D Two dimensional
3D Three dimensional
ACA Advancing contact angle
AFM Atomic force microscopy
CA Contact angle
CAH Contact angle hysteresis
CB Cassie-Baxter
CVD Chemical vapor deposition
LFS Liquid flame spray
LSCM Laser scanning confocal microscopy
LV-SEM Low vacuum scanning electron microscopy
FOTES 1H,1H,2H,2H-perfluorooctyl-trietoxysilane
FOTCS 1H,1H,2H,2H-perfluorooctyl-trichlorosilane
PMI N-(2,6-diisopropylphenyl)-3,4-perylene dicarboxylic
acid mono imide
RA Roll-off angle
RCA Receding contact angle
SEM Scanning electron microscopy
TEOS Tetraethyl orthosilicate
TPCL Three-phase contact line
TTIP Titanium tetraisopropoxide
XPS X-ray photoelectron spectroscopy

xii
xiii
Contents
Introduction 1
Theoretical background 3
Wetting ................................................................................................. 3
Surface forces ..................................................................................... 12
Experimental methods 23
Super liquid-repellent coatings ........................................................... 23
Force measurements ........................................................................... 31
Imaging ............................................................................................... 37
Results and discussion 43
Superhydrophobic and superamphiphobic surfaces ............................ 43
Interactions involving superhydrophobic surfaces and observations of
gas capillaries ...................................................................................... 48
Interactions involving superamphiphobic surfaces and the effect of
liquid surface tension .......................................................................... 57
Capillary growth and the effect of the amount of available gas ......... 65
Calculations of capillary forces and comparison to measurements .... 69
Concluding remarks and future perspectives 79
References 83

xiv

1
Chapter 1
Introduction
Extremely non-wetting or liquid-repellent surfaces have been a known
phenomenon for centuries [1, 2]. Although water-repellence has been a
well-known property in nature [3, 4], the interest in liquid-repellent
surfaces was rather limited before 1997 when the origin of the water-
repellent and self-cleaning properties of the lotus (Nelumbo nucifera) leaf
was explained [5]. Researchers and scientists have always found
inspiration from nature, which through billions of years of evolution has
found its way of developing smart and creative solutions. Just like many
other technological advances have been developed by mimicking the
brilliant solutions already found in nature, the design of artificial water-
repellent surfaces was originally inspired by the many natural surfaces with
special wettability [6]. In recent years, scientists have also succeeded to
produce surfaces which can repel other liquids such as oils [7, 8]. To create
super liquid-repellent surfaces, the detailed surface topography and
chemistry are important. So far, the successful approach has been to
combine a specific microstructure with a low surface energy material [9].
Since the late 1990s, the research interest in liquid-repellent surfaces has
increased rapidly. In addition to a large scientific interest in extreme liquid-
repellence there are many potential technological applications such as self-
cleaning materials, corrosion protection and prevention of ice-formation or
bacterial growth [10, 11]. However, there are still challenges that need to

2
be addressed in order to bring super liquid-repellent surfaces into real-
world applications. First, the complex surface structures are highly
susceptible to mechanical wear, and abrasion can lead to loss of the liquid-
repellent properties [12]. A good mechanical durability is therefor of prime
importance for any practical applications [13]. Second, fluorinated
chemicals are commonly used to achieve the low surface energy [14], and
many of these substances have been shown to have majors concerns for
both the environment and human health [15]. To solve these challenges,
there is a need for more research in the area of liquid-repellence in order to
understand the underlying mechanisms. In particular, an extended
fundamental understanding of the interplay between microscopic and
macroscopic wetting properties and the interactions between surfaces and
liquids is needed. With a complete fundamental understanding, the
appropriate surface structure and chemistry can be combined in the
optimization of future super liquid-repellent surfaces. Most importantly,
with these insights, unwanted chemicals (such as perfluorinated
compounds) can be avoided, and mechanical durable materials and
coatings can be developed by safe and environmentally friendly processes.
Thus, the work in this thesis may contribute to the UN sustainable
development goals and in particular to goal number 6, clean water and
sanitation and goal number 12, responsible consumption and production.
This thesis work elucidated the detailed mechanisms of super liquid-
repellence with the focus on how such surfaces interact in liquids. The
outline of the thesis is structured as follows: The following chapter,
Chapter 2, provides the reader with a theoretical background of the
wettability of super liquid-repellent surfaces and the relevant surface forces
needed to understand interactions between such surfaces. The most
important instrumental techniques and procedures that were employed
during the work are described in Chapter 3. In Chapter 4, the key results
and findings are summarized and discussed. Finally, Chapter 5 presents the
main conclusions and implications of the presented work together with
suggestions for further studies.
3
Chapter 2
Theoretical background
Wetting
Wetting on smooth and rough surfaces
Wetting of ideal surfaces – the Young equation
The wettability of a solid surface is defined by the shape of a liquid droplet
resting on the surface. The contact angle (CA) θ, where the liquid, solid and
vapor meets in the three-phase contact line (TPCL), is most often used for
characterization of wettability. On an ideal (perfectly smooth, inert and
chemically heterogeneous) surface the thermodynamic equilibrium contact
angle can be described by Young’s equation [16]:
𝛾LV cos 𝜃Y = 𝛾SV − 𝛾SL (1)
Here, θY is the Young contact angle and SV, SL and LV are the interfacial
tensions of the solid-vapor, solid-liquid and liquid-vapor interfaces,
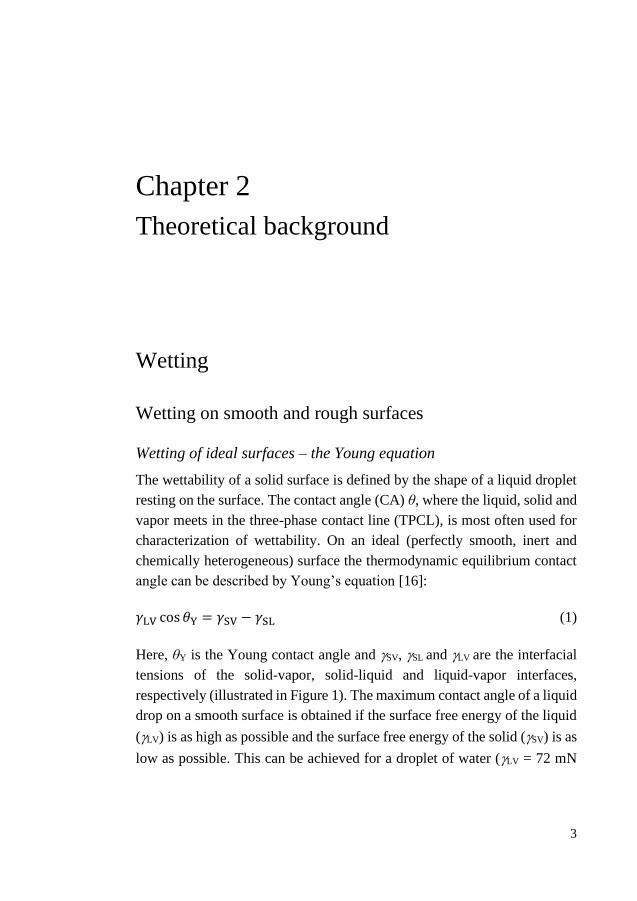
respectively (illustrated in Figure 1). The maximum contact angle of a liquid
drop on a smooth surface is obtained if the surface free energy of the liquid
(LV) is as high as possible and the surface free energy of the solid (SV) is as
low as possible. This can be achieved for a droplet of water (LV = 72 mN

4
m-1) on a surface of hexagonally packed -CF3 groups (SV = 6.7 mN m-1),
resulting in a contact angle in the order of 120° [17]. This value can be seen
as the chemical upper limit of contact angles for a liquid drop on a smooth
surface.
Figure 1. A liquid droplet on an ideal surface.
Real surfaces are not ideal
It is important to know that Young’s equation (Eq. 1) is generally not
applicable for real surfaces. First, the condition of thermodynamic
equilibrium is generally not fulfilled in practice. For instance, evaporation
of the droplet can take place even if the atmosphere is saturated [18].
Second, most real surfaces are not ideal and generally display both chemical
heterogeneity and surface roughness. Even if a surface may appear
macroscopically smooth, it typically exhibits micro-, nano- or even
molecular scale roughness. It is well-known that surface roughness may
enhance (or reduce) wettability, and contact angles on real surfaces can
exceed the upper limit (120°) predicted by Young’s equation [19, 20]. When
considering real surfaces, it is also important to distinguish between the
macroscopic apparent contact angle and the microscopic contact angle. The
apparent contact angle θapp, is obtained from the macroscopic shape of the
drop and is typically the angle measured experimentally by goniometry and
the sessile drop method. The measured angle typically describes an average
of the contact angles along the three-phase contact line. On the microscale,
the contact angle may deviate from the apparent contact angle, e.g. due to
surface roughness or chemical heterogeneity. The microscopic contact angle
is equal to the contact angle measured on a smooth and homogeneous flat
surface of the same material. The microscopic contact angle can vary along

5
the contact line and cannot be easily measured. On an ideal surface the
microscopic contact angle equals the Young contact angle.
Wetting of rough surfaces – the Wenzel and Cassie-Baxter models
Wetting of rough surfaces is often described by the two opposing wetting
models by Wenzel [19] and Cassie and Baxter [20]. When a liquid is
described to be in the Wenzel wetting state, the liquid penetrates the surface
depressions and fully wets the structure (Figure 2).
Figure 2. Liquid droplets in the Wenzel and Cassie-Baxter states.
The Wenzel equation relates the apparent contact angle of a droplet in the
Wenzel state (𝜃appW ) to the Young contact angle:
cos 𝜃appW = 𝑟 cos 𝜃Y (2)
The roughness factor r is defined as the ratio between the real surface area
and the projected surface area of a flat surface. According to the Wenzel
equation, surface roughness will enhance the hydrophilicity or
hydrophobicity. A hydrophilic material (θY < 90°) will be even more wetted
when surface roughness is increased. Similarly, for a hydrophobic material
(θY > 90°) the apparent contact angle will increase with increasing
roughness.
In opposite to the Wenzel state, a liquid droplet can be suspended on top of
the surface features with pockets of air (or vapor) trapped underneath

6
(Figure 2). A liquid taking this configuration is described to be in the Cassie-
Baxter (CB) wetting state. In the CB state, the droplet rests on a composite
interface (in this case consisting of patches of air and solid) and the apparent
contact angle (𝜃appCB ) relates to the Young contact angle according to the CB
equation [20]:
cos 𝜃appCB = 𝑓s cos 𝜃Y + 𝑓s − 1 (3)
Here, fs is the liquid-solid area fraction, i.e. the ratio between the area where
the liquid is in contact with the solid and the projected composite area. In
contrast to the Wenzel equation, the CB equation predicts that high apparent
contact angles (θapp >> 90°) can be achieved not only if θY > 90° but also if
θY < 90°, provided that the liquid-solid area fraction is small enough.
Validity of the Wenzel and Cassie-Baxter equations
The Wenzel and CB equations (Eqs. 2 and 3) are often used in the literature
to determine the present wetting state of textured surfaces, and good
agreement between experimentally measured contact angles and
theoretically calculated values using the Wenzel or CB equations are often
reported. However, the validity of the equations is debated and it has been
especially emphasized whether the apparent contact angle can actually be
predicted by interactions within the contact area beneath the droplet or at the
three-phase contact line [21]. The validity of the Wenzel and CB equations
was early questioned [22-24] and later experiments designed to test the
validity have disproved them [25, 26]. A debate on the topic was started
after Gao and McCarthy published their paper with the provocative title
“How Wenzel and Cassie were wrong” in 2007, where they stated that
contact angles is only determined by interactions at the TPCL and that the
interfacial area within the contact perimeter is irrelevant [26]. In an
extensive review by Erbil, both views of the TPCL and interfacial contact
area were presented [21]. Several important points from published papers
supporting the two sides were summarized, and it was concluded that most
data found in the literature are inconsistent with the Wenzel and CB theories.

7
However, while the use of the Wenzel and CB equations is questioned and
in general should be avoided, the Wenzel and CB wetting states (Figure 2)
are well established concepts and can still be valid as visual descriptions of
wetting states on textured surfaces.
Contact angle hysteresis
From the models described above it appears as wettability of a liquid on a
solid surface can be described by one (equilibrium) contact angle.
Experimentally, this sole value of the contact angle is often referred to as
the “static” or “equilibrium” contact angle of a drop “as placed”. In reality,
however, the situation is more complicated and there is rarely a single
“static” contact angle. In fact, when a liquid droplet is placed on a solid
surface the contact angle can take any value between an upper and a lower
limit, depending on how the droplet was placed on the surface. The
minimum value is given by the receding contact angle (RCA) θrec, measured
when the liquid front is receding over the solid surface. Similarly, the
maximum value is determined by the advancing contact angle (ACA) θadv
as measured when the liquid advances over the surface. The advancing
contact angle is larger than the receding one, and the difference between
ACA and RCA is called the contact angle hysteresis (CAH). Contact angle
hysteresis arises from chemical and/or topographical heterogeneities in the
surface and on an ideal surface the CAH is zero. The contact angle hysteresis
may be a rough measure on the drop adhesion to the surface, as a larger
CAH suggests that the drop adheres stronger to the surface.
Figure 3. Measuring advancing and receding contact angles.

8
The advancing and receding contact angles (and thus also the contact angle
hysteresis) may be measured by either increasing (liquid advancing) and
decreasing (liquid receding) the volume of a sessile drop or by tilting the
surface so that the drop starts moving downhill (Figure 3). By tilting the
surface, the roll-off (or sliding) angle (RA), that is the tilt angle at which the
drop starts moving, can also be measured. The lower roll-off angle the lower
liquid adhesion to the surface.
Super liquid-repellent surfaces
Definitions and terminology
Super liquid-repellence is still a relatively new research field and the
terminology is not very well-defined. In the vast and increasing number of
publications on super liquid-repellence over the last decades, many terms
have been created and used to describe different surfaces of special
wettability. Although there have been attempts to create a common and
accurate terminology [27], the use of different definitions and terms are still
found. A surface which exhibit extreme water-repellence is commonly
called superhydrophobic. A water droplet on a superhydrophobic surface
will take an almost spherical shape. In addition, the droplet will not adhere
to the surface and easily rolls off, leaving a completely dry surface behind.
The commonly used definition of a superhydrophobic surface is a high
apparent water contact angle of ≥ 150° with a low contact angle hysteresis
and roll-off angle of ≤ 5-10° [13, 28-31]. This definition is, however, not
entirely unambiguous. As mentioned, “static” contact angles depend on how
the droplet is placed on the surface and can in principle take any value
between the receding and advancing contact angles. The roll-off angle on
the other hand depends on the droplet volume. Therefore, other definitions
have been proposed and one suggestion is to use a single criteria of a high
apparent receding contact angle (≥150°) [32]. The advantage with this
definition is that the receding contact angle determines the roll-off angle and
it does not, when accurately measured, depend on droplet size [33].

9
Superamphiphobic is commonly used to describe a surface which is super
repellent to both water and oily liquids (or other polar or nonpolar lower
surface tension liquids) [34, 35]. The commonly used definition for
superamphiphobicity is generally the same as for superhydrophobicity, i.e.
a high apparent contact angle and a low roll-off angle, with the extension to
include also liquids with lower surface tension in addition to water. Another
frequently used term to describe such surfaces exhibiting both water- and
oil-repellence is superomniphobic [9, 36] and other less frequently used
terms includes superhygrophobic [37, 38] and superlyophobic [39, 40].
Surface design
When designing super liquid-repellent surfaces there are two key aspects to
take into consideration: surface chemistry and surface structure. From the
point of surface chemistry, the strategy has been to achieve a surface energy
as low as possible in order to maximize the non-wettability. As mentioned,
the lowest known surface energy is achieved by using fluorine chemistry
and perfluorinated compounds are still typically used in the literature [14,
41, 42]. However, there have been recent attempts towards fabricating
fluorine-free super liquid-repellent surfaces [43, 44]. For instance, Liu and
Kim reported that using a specific surface morphology, any material can be
made super-repellent even to the lowest known surface tension liquids
(fluorinated alkanes) regardless of the surface chemistry [44]. For future
sustainable and fluorine-free super liquid-repellence it is highly interesting
to find surfaces of special wettability in nature, as nature cannot synthesize
perfluorinated chains. Examples like the springtail (Collembola) skin [45]
proves that it is possible to obtain surfaces with oleophobic properties
without using fluorinated materials. Another interesting observation from
nature, indicating that the surface chemistry might not be the decisive
parameter, is a study suggesting that the wax on the lotus leaf is actually
moderately hydrophilic [46]. The water contact angle on a smooth carnauba
wax (assumed to be similar to the wax on the lotus leaf) surface was found
to be 74°.

10
As for surface structure, the goal is to minimize the contact between the
liquid droplet and the solid substrate and to maintain a CB wetting state.
Once the liquid penetrates the surface depressions and a transition to the
fully wetted Wenzel state occurs, the droplet is pinned, and the super liquid-
repellent property is lost. This wetting transition is typically a reversible
process [47]; thus, it is critical that the surface design can maintain a stable
CB wetting state. For water it is considerably easier to design a structure
which can maintain the CB state than for low surface tension liquids. For
instance, a simple microstructure of cylindrical pillars can be sufficient for
water. A liquid drop is placed on the structured surface, resting on top of the
pillars with air trapped underneath, i.e. CB state (cross-section in Figure 4).
Figure 4. Wetting on model structures.
The liquid-air interface between the pillars will be curved and the curvature
depends on the pressure difference across the interface, P. If the
microscopic contact angle between the liquid and the pillar θm (Figure 4), is
smaller than the advancing contact angle of the material θadv the TPCL is
pinned and the CB state is maintained; this, of course, provided the pillars
being high enough so that the curved interface does not touch the surface
between the pillars. In this case the fully wetted Wenzel state will occur even
if θm < θadv. In contrast, if θm > θadv, the TPCL will slide down the pillar walls
as the liquid wets the material until the structure is fully wetted. Following
the argument above, we see that for simple pillar structures the liquid can be
maintained in the CB state if θadv > 90°. In the case where the liquid is water,
this simple structure is sufficient if using a hydrophobic material. However,
for oils this is not sufficient due to the fact that θadv < 90° for oils on all
known materials. To repel liquids when θadv < 90° it is necessary to design
the surface structure with a re-entrant or overhang morphology (Figure 4).

11
With this type of structure, it is possible to maintain the CB state for liquids
with θadv ≈ 30° [44]. For a liquid which will completely wet the material (θadv
≈ 0°), a doubly re-entrant structure is needed in order to maintain the CB
state (Figure 4). This type of microstructure has been shown to repel all
liquids (even liquids with very low surface tension < 20 mN m-1) regardless
of the surface energy of the material [44]. Again, we note that with the right
surface design, the surface chemistry is not decisive for achieving super
liquid-repellent properties. The model structures shown in Figure 4, have
been proven to show super liquid-repellence both experimentally (e.g. [8,
44]) and using computer simulations (e.g. [48, 49]). These ordered and well-
defined structures can be fabricated by using e.g. photolithographic
techniques [8, 44, 50] or 3D printing technology [51-53].
In addition to using well-defined model structures, re-entrant morphology
can also be realized by randomly ordered structures. One drawback of using
random structures is that it is more challenging to achieve a surface design
with doubly re-entrant structures. Hence, surface chemistry is important for
achieving superamphiphobicity for random structures and fluorine
chemistry is still most often used. A major advantage, on the other hand, is
that random structures often form a hierarchical structure which is
advantageous for designing robust superamphiphobic surfaces [54]. A
hierarchical structure exhibits topography variation in two (or more) length
scales. For hierarchical superamphiphobic surfaces, typically one is in the
micrometer scale and one in sub-micrometer scale. Hierarchical structures
are commonly found in nature to achieve robust and mechanical durable
water-repellence. One example of a natural hierarchical structure is the well-
known lotus leaf [5]. Its surface is covered by micron-sized protrusions of
epidermal cells which are further covered by epicuticular wax tubules of 200
nm in diameters. Hierarchical surface designs can also enhance the
mechanical robustness. Low mechanical robustness is still the main issue
for liquid-repellent surfaces to be used in real applications [12, 13].
Microscale (and macroscale) structures are more mechanical robust and can
protect the weaker submicron structures in between, with retained
antiwetting properties [55-57].

12
Random structures are typically fabricated by bottom-up processes e.g.
deposition of nanoparticles [58-61] or nanofilaments [62, 63]. This is
typically advantageous as these processes can be applied on a variety of
substrates and materials and can be easy up scalable. It is also possible to
utilize the underlying microstructure of the substrate in order to create
overhanging re-entrant morphologies on e.g. wood [64], textile [65, 66] or
paper [67, 68]. Another approach is to combine top-down fabricated
microstructures with bottom-up randomly deposited nanostructures [69, 70].
Randomly ordered structures can also be realized using top-down processes
such as laser texturing [71, 72] or different etching techniques [73-76].
Surface forces
In this section, the most relevant surface forces for this work will be
presented: van der Waals interactions, interactions between hydrophobic
surfaces and capillary forces.
van der Waals interactions
The van der Waals force is a result of interactions of electromagnetic nature
between molecules and typically includes contributions from dipole-dipole
(Keesom orientation interactions), dipole-induced dipole (Debye inductive
interactions) and instantaneous dipoles due to fluctuations in the distribution
of electronic charge (London dispersive interactions). The van der Waals
force is always attractive between identical materials but can in some cases
be repulsive for dissimilar materials. A simple expression for the van der
Waals force (FvdW) between macroscopic bodies can be obtained by a pair-
wise summation of the interactions between the molecules in the two bodies
via integration. For interactions between a sphere (radius R) and a flat
surface at a distance D the expression is given by [77]:
𝐹vdW = −𝐴𝑅
6𝐷2 (4)

13
Here, A is called the Hamaker constant and depends on the materials and
interacting media involved. The Hamaker constant can be calculated from
the dielectric properties of the two surfaces and the intervening medium
using the Lifshitz theory. An interesting feature of the Lifshitz theory is that
it, unlike the earlier Hamaker approach, ignores the atomistic nature of the
interacting bodies and the separating medium. Instead it just considers the
fluctuating electromagnetic fields that extend from every surface and can be
related to their frequency-dependent dielectric properties. For two identical
materials “1” interacting across a medium “3”, the equation is given as [77]:
𝐴 = 3
4𝑘𝑇 (
𝜀1−𝜀3
𝜀1+𝜀3)
2+
3ℎe
16√2
(𝑛12−𝑛3
2)2
(𝑛12+𝑛3
2)3 2⁄ (5)
where i is the dielectric constant, ni the refractive index for medium i, e
the electronic absorption frequency in the UV region (typically assumed to
be the same in all media, 3 1015 s-1), T the absolute temperature, k the
Boltzmann’s constant and h the Planck’s constant. In Eqs. 4 and 5
retardation effects due to the finite speed of light have been ignored, which
does not introduce any significant error at small separations (below a few
tens of nanometers).
Interactions between hydrophobic surfaces
Smooth hydrophobic surfaces
The first measurements of interactions between hydrophobic surfaces in
aqueous solution was reported almost 40 years ago by Israelachvili and
Pashley [78]. The measured interactions showed a long-range attractive
force, much stronger than the expected van der Waals force and it decayed
exponentially with separation distance. This first report was soon followed
by many others observing similar long-range (in the tens to hundreds of
nanometers range) interactions [79-89]. The mechanisms of this long-range
“hydrophobic force” puzzled scientists for many years and the suggestions
explaining the origin of the attraction were several. Some suggested
14
explanations include water structural effects [79, 90, 91], hydrodynamic
forces [92, 93] or contamination from hydrophobic species [94, 95].
However, the formation of bridging air or vapor capillaries has become the
most widely accepted explanation [80, 96-100]. The theory of a bridging gas
capillary (also called cavity, bridge, bubble or meniscus) is supported by e.g.
direct visual observations [80, 101], effects of de-gassing the water [102-
105] and by the similarity to liquid capillary bridges between hydrophilic
surfaces in humid atmosphere [100]. The theory of capillary forces will be
further explained in the following section.
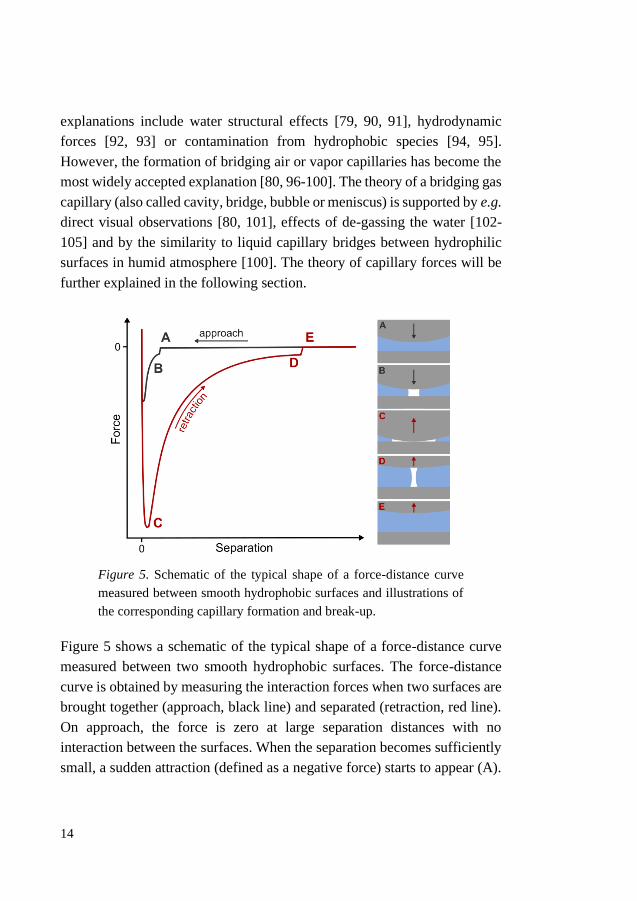
Figure 5. Schematic of the typical shape of a force-distance curve
measured between smooth hydrophobic surfaces and illustrations of
the corresponding capillary formation and break-up.
Figure 5 shows a schematic of the typical shape of a force-distance curve
measured between two smooth hydrophobic surfaces. The force-distance
curve is obtained by measuring the interaction forces when two surfaces are
brought together (approach, black line) and separated (retraction, red line).
On approach, the force is zero at large separation distances with no
interaction between the surfaces. When the separation becomes sufficiently
small, a sudden attraction (defined as a negative force) starts to appear (A).

15
This attraction is assigned to the formation of a bridging air/vapor capillary
between the two surfaces (B). After the surfaces make contact at zero
distance, the separation is again increased upon retraction and the attractive
force is decreasing due to elongation of the capillary while keeping a (close
to) constant capillary volume (C-D). At a certain separation, the capillary
ruptures and the force returns to zero (E).
Rough hydrophobic and superhydrophobic surfaces
While interactions between smooth hydrophobic surfaces have been widely
studied over the last decades, studies on interactions between
superhydrophobic or topographically structured hydrophobic surfaces are
few. Singh et al. reported the first measurements on interactions between
superhydrophobic surfaces in 2006 [106]. They observed interactions
extending into the micrometer range, i.e. much longer in range than
previously observed on smooth surfaces. Optical imaging revealed a
bridging capillary between the two surfaces giving rise to the strong
attraction, and the authors argued the capillary formation being caused by
capillary evaporation of confined water. Furthermore, the shape of the force
curve was distinctly different from what was previously seen on smooth
hydrophobic surfaces. The same kind of shape, which clearly did not follow
the assumption of a constant capillary volume, was later observed on
topographically structured hydrophobic surfaces [107]. It was suggested that
the capillary would grow due to an inflow of air from the reservoir trapped
in the rough surface during separation. The theory was supported by more
detailed studies on superhydrophobic surfaces, which also showed that
capillary growth type of force curve increased in frequency going from
interactions between hydrophobic-hydrophobic to superhydrophobic-
hydrophobic to superhydrophobic-superhydrophobic surfaces [108, 109].
Figure 6 shows a schematic of force-distance curves measured between two
topographically structured (super)hydrophobic surfaces. As in the case for
smooth hydrophobic surfaces, a sudden attraction is observed at a certain
separation distance on approach (A) and assigned to the formation of a

16
bridging gas capillary (B). However, the striking difference in the shape as
compared to the case of smooth hydrophobic surfaces is seen on retraction.
Rather than decreasing right after contact (C), the attractive force is
increasing due to a growing capillary caused by an inflow of gas from the
reservoir of trapped gas in the structures of the superhydrophobic surfaces
(D). After the attraction reaches a maximum value the force starts to
decrease before the capillary finally ruptures whereby the attraction
disappears (E).
Figure 6. Schematic of the typical shape of a force-distance curve
measured between two topographically structured
(super)hydrophobic surfaces and illustrations of the corresponding
capillary formation, growth and break-up.
Capillary forces
It is well-known that hydrophilic particles can adhere to each other due to
an attractive force caused by a liquid capillary bridge. The capillary can form
by capillary condensation or by accumulation of adsorbed liquid. However,
a capillary bridge can also form as a liquid bridge in another immiscible
liquid or, as mentioned in the previous section, as a gas/vapor bridge in a

17
non-wetting liquid. Most literature on capillary forces is focused on liquid
capillary bridges [110-116], however the theory describes the shape of the
capillary and is analog with the case of a gas capillary [117, 118]. In this
thesis, if nothing else is specifically stated, the capillary is assumed to be a
gas bridge surrounded by liquid.
Figure 7 shows the schematic of an axisymmetric capillary bridge between
a sphere (radius R) and a plane separated by a distance D. The capillary
position is described by the contact radius rs on the flat surface and the angle
on the sphere. The contact angles p and s are the contact angles of the
capillary on the spherical particle and the flat surface, respectively, and by
convention, the contact angles are on the liquid side of the interface.
Figure 7. Illustration of a bridging capillary between a spherical
particle and a flat surface.
The capillary (sometimes called meniscus or pendular ring) causes an
attractive force between the two surfaces, a capillary force. The capillary
force in the normal (vertical) direction, includes two contributions. The first
one (F) is due to the surface tension acting on the wetted perimeter:
𝐹𝛾 = 2π𝑟c 𝛾 sin 𝜃 (6)
The second contribution (FΔP) is caused by the capillary pressure P:
𝐹Δ𝑃 = π𝑟c2Δ𝑃 (7)

18
The total capillary force Fcap is calculated as:
𝐹cap = 𝐹Δ𝑃 − 𝐹𝛾 (8)
The capillary force can be evaluated on either the sphere or the flat surface,
and the magnitude should be the same under equilibrium conditions. On the
flat surface the contact radius rc is equal to rs and for the sphere the contact
radius is given by rp = R sin (Figure 7). Similarly, the contact angle is the
contact angle on the flat surface s or particle p, respectively. If the contact
radius, contact angle and capillary pressure are known, the capillary force
can be directly calculated using Eqs. 6-8. The capillary pressure can be
calculated from the shape of the capillary liquid-gas interface using the
Young-Laplace equation.
Young-Laplace capillary pressure
The Young-Laplace equation relates the curvature of a liquid interface to
the pressure change across the interface, i.e. the difference in pressure P
between the two phases. In the absence of gravitation, or when gravity is
negligible, the Young-Laplace equation is given by:
Δ𝑃 = 𝛾 (1
𝑟1+
1
𝑟2) (9)
Here, r1 and r2 are the principal radii of curvature of the interface. There are
two principal curvatures at any given point on a 2D surface. The two
principal radii of curvature are given by the radius of the curved surface in
two perpendicular normal planes at that point. For instance, for a spherical
drop (or bubble) of radius rd, the two radii are r1 = r2 = rd and the curvature
is 2/rd. In the case of a capillary bridge, the two principal radii are given by
the radius in the vertical plane (r1) and radius in the horizontal plane (r2),
illustrated in Figure 7. In this case, r1 describes the concave curvature of the
interface and is defined as negative, while r2 is positive since it describes the
convex curvature. The form of the Young-Laplace equation as given in Eq.
9, uses an important approximation, called the circular (or toroidal)

19
approximation. Using the circular approximation, it is assumed that the
shape of the interface in the vertical plane (the meridional profile) can be
described by a circle of radius r1. In many cases, the exact shape of the gas-
liquid interface is rather described by other classes of geometrical curves
e.g. nodoids or unduloids [110, 119]. However, for small capillaries, the
difference between numerical calculations of the exact shape and the
circular approximation are generally small and can be neglected [113].
When the circular approximation is not applicable, the full Young-Laplace
equation needs to be solved in order to obtain the exact shape of the gas-
liquid interface. For an axisymmetric capillary bridge and when the gravity
effect is negligible, the following form of the Young-Laplace equation is
valid [110, 119, 120]:
2�̃� =ℎ′′
(1+ℎ′2)
3 2⁄ +ℎ′
𝑟(1+ℎ′2)
1 2⁄ (10)
where �̃� is the constant mean curvature of the liquid-gas interface and
2�̃� ≡∆𝑃
𝛾 , ℎ′ ≡
𝑑ℎ
𝑑𝑟 , ℎ′′ ≡
𝑑2ℎ
𝑑𝑟2 (11)
Here, h is the height of the interface and r the distance from the central axis.
The full Eq. 10 is difficult to solve analytically, however it has been solved
in the limit of 𝑟 ≪ 𝜅, where 𝜅 = √𝛾 𝜌𝑔⁄ is the capillary length; the liquid
surface tension, the density of the liquid and g = 9.82 m s-2 the gravitational
acceleration. In this limit several approximate analytical formulas to
describe the meniscus shape have been derived [121-124]. An approximate
formula to describe the shape of a liquid meniscus around a spherical
microparticle have been proposed by Schellenberger et al. [125]:
ℎ(𝑟) = 𝑟p sin 𝛼 [ln (4𝜅
𝑟+√𝑟2−𝑟02 sin2 𝛼
) − 0.577] + 𝑏 (12)

20
Here, rp = R sin is the contact radius on the particle, α = p – the angle of
the gas-liquid interface with the horizontal and 0.577 the Euler-Mascheroni
constant. The constant b has no physical meaning and is added as the
equation otherwise diverges for large r. Eq. 12 is valid for 𝑟 ≪ 𝜅 and Bond
number Bo ≪ 1 (Bo ≡ 𝑅 𝜅⁄ ).
Constant capillary volume
An explicit expression for the capillary force of a bridging capillary of
constant volume V between a sphere and a plane (as illustrated in Figure 7)
has been derived by Butt and Kappl [113]:
𝐹cap = 4π𝛾𝑐𝑅 (1 −𝐷
√𝑉
π𝑅+𝐷2
) (13)
where
𝑐 =cos(𝜃p+𝛽)+cos 𝜃s
2 (14)
In the derivation of Eq. 13, it is assumed that the circular approximation is
applicable and that r2 >> r1 (which is valid if R >> r1). Fitting of Eq. 13 have
been shown to agree with measurements between smooth hydrophobic
surfaces (force curve as illustrated in Figure 5) [107, 126, 127]. However,
as Eq. 13 is only valid for constant capillary volume, force curves measured
between rough (super)hydrophobic surfaces (force curve as illustrated in
Figure 6) often cannot be fitted to Eq. 13 [107-109, 126].
Free energy approach
Another approach to determine capillary interactions is to calculate the free
energy change due to capillary formation [96, 128]. The total free energy
change Gcap includes contributions from the surface tension GA and the
capillary pressure GPV:

21
Δ𝐺cap = Δ𝐺𝛾𝐴 − Δ𝐺𝑃𝑉 (15)
The surface tension contribution is calculated from the free energy cost of
creating the gas-liquid interface and the change in free energy due to de-
wetting of the sphere and flat surface:
Δ𝐺𝛾A = 𝛾(𝐴i + 𝐴p cos 𝜃p + 𝐴s cos 𝜃s) (16)
Here, Ai is the capillary surface area of the gas-liquid interface, Ap and As
are the capillary surface areas on the sphere and the flat surface,
respectively. The free energy contribution from capillary pressure GPV is
calculated from the pressure difference across the gas-liquid interface P
and the capillary volume V:
Δ𝐺𝑃𝑉 = Δ𝑃𝑉 (17)
Contributions from three-phase contact lines
Other contributions may also influence the capillary force, such as
properties at the three-phase contact line (TPCL), e.g. line tension. The line
tension is the energy required to form one length unit of a TPCL and enters
the picture through a distortion of the contact angle due to a highly curved
TPCL [129, 130]. Line tension is expressed from the difference between
the macroscopic ∞ and the microscopic m contact angles by the modified
Young’s equation [131]:
𝜏 =𝛾LV
𝜅g(cos 𝜃∞ − cos 𝜃m) (18)
Here, 𝜅g =cos 𝜑
𝑟 is the geodesic curvature of the TPCL; the angle between
the surface and the plane containing the wetting perimeter and r the radius
of curvature of the TPCL. For a circular contact line of radius r on a flat
surface 𝜅g =1
𝑟 and on a spherical surface (of radius R) 𝜅g =
1
𝑅 tan 𝛽, where
is the angle describing the position of the TPCL (see Figure 7) [132]. The

22
line tension contribution becomes important for a highly curved TPCL, i.e.
for a radius of a few micrometers or less [133]. Even though the concept of
line tension is well defined and understood, its magnitude and sign are still
disputed. Values of several orders of magnitude difference have been
reported and even of different signs [129]. Second, when surface roughness
is introduced, the situation will be even more complex as roughness may
cause pinning (and de-pinning) of the TPCLs. Pinning forces may be
estimated from the change in contact angle from an initial quasi-equilibrium
contact angle e [134-136]:
𝐹pin = 𝛾LV(cos 𝜃m − cos 𝜃e) (19)

23
Chapter 3
Experimental methods
Super liquid-repellent coatings
The superhydrophobic and superamphiphobic coatings used in this work
were prepared using the following general approach: first, surface
roughness was created by applying a micro-/nanostructured coating on a
flat substrate and second, the surface energy was lowered by surface
modification with a fluorosilane.
Micro-/nanostructured coatings
I utilized two different types of micro-/nanostructured coatings during this
thesis work. In Papers I and II, a nanoparticle coating was applied using a
dip coating process. In Papers III and IV, a nanostructured coating was
applied by using a thermal aerosol-assisted deposition technique. One
advantage of using both types of coatings is that they can be applied on
different substrates, which was specifically advantageous for confocal
imaging which requires the substrate to be a thin cover glass.
Dip coated nanoparticle coating
The silica (SiO2) nanoparticle coatings used in Papers I and II were
prepared using a simple dip coating method as described previously [108,

24
109, 137]. Dip coating is a fast and easy approach to induce randomly
ordered surface roughness. High-precision (No. 1.5H, thickness 170 ± 5
μm) thin microscope cover glasses (Paper I) and silicon wafers (Paper II)
were used as substrates for the coatings. In the coating procedure, the
substrate was dip coated in a dispersion containing 0.5 wt% silica
nanoparticles, 12.5 wt% perfluoroalkyl copolymer and 87 wt%
hydrofluoroether solvent. The substrate was vertically dipped in the
dispersion 3 times and between each dipping cycle the solvent was allowed
to evaporate, leaving a rough composite coating of silica nanoparticles and
fluoropolymer. In order to increase the mechanical durability, the coated
sample was heat treated at 450-500 °C for 2 hours. During the calcination
process the fluoropolymer decomposes and evaporates and a rough coating
of silica nanoparticles is left on the substrate. This coating is then
fluorosilanized to achieve a low surface energy.
Liquid flame spray coating
In Papers III and IV, a nanostructured titanium dioxide–silicon dioxide
(TiO2/SiO2) coating was prepared using a thermal aerosol-assisted
deposition called the liquid flame spray (LFS) technique. In LFS, a liquid
solution containing organometallic precursor molecules is injected though
a hydrogen-oxygen turbulent, high-temperature (>2500 °C) flame [138].
After exiting the burner spray nozzle, the precursor solution is atomized
into small (micrometer-size) droplets. The droplets evaporate in the hot
flame and the precursor organometallic molecules react and form
nanoparticles. The nanoparticles aggregate and finally deposit on the
substrate that is moving through the flame. As a result, a nanostructured
coating layer is formed. The final coating composition and morphology
can be controlled by adjusting process parameters such as flow rate of the
combustion gases (hydrogen and oxygen), composition, concentration and
feed rate of the precursor solution, distance between burner and substrate,
and sample moving velocity. The working principle of LFS is shown in
Figure 8.

25
LFS has been proven to be a highly suitable coating technique for
achieving super liquid-repellence as it produces coatings with a highly
porous surface structure with high level hierarchical roughness [58, 64,
139]. One of the greatest advantages of using LFS is that it is a fast coating
process and can be applied in a continuous process, e.g. in high-speed roll-
to-roll processes [138-140]. In addition, it is suitable for coating of a wide
range of substrates and different materials. Since the coating velocity
through the high temperature flame is fast, even cellulose-based materials
such as wood or paper can be coated using LFS [64, 141].
Figure 8. Schematic illustration showing the working principle of
LFS.
In this work, LFS coatings were prepared following a method previously
described by Teisala et al. [58]. High-precision (No. 1.5H, thickness 170
± 5 μm) thin microscope cover glasses were used as substrates. In order to

26
achieve the turbulent, high temperature flame, the combustion gases were
fed into the LFS burner at flow rates of 50 L min-1 (hydrogen) and 15 L
min-1 (oxygen), respectively. The precursor solution consisted of tetraethyl
orthosilicate (TEOS) and titanium tetraisopropoxide (TTIP) dissolved in
isopropanol and was injected at a rate of 12 mL min-1. The total Ti+Si
concentration in the precursor solution was 50 g L-1 with a Ti/Si weight
ratio of 99/1. The coatings were applied by passing the substrate through
the flame spray with a velocity of 0.8 m s-1 at a distance of 6 cm away from
the burner face. In Paper III, the final coating was achieved by
subsequently passing the substrate 5 times through the flame spray. In
Paper IV, different coating thicknesses were prepared by passing the
substrates through the flame spray different number of times (1, 2, 3, 4 and
5 coating cycles).
Surface modification
Growth of thin silica layer to protect from photodegradation
Titanium dioxide is well-known for its photocatalytic activity and can
break down organic compounds when exposed to irradiation with energy
corresponding to its band gap [142, 143]. In order to prevent photocatalytic
degradation of the fluorosilane, a thin passivating silicon oxide layer was
grown on the TiO2/SiO2 nanostructured coatings prior to silanization. The
silica layer was applied via a gas-phase reaction, where the samples were
placed in a desiccator together with TEOS and ammonia in two open vials
at atmospheric pressure and room temperature for 4 hours. This process
results in the growth of a few nanometers thick silica shell covering the
nanostructured coating, and such a thin layer will not alter the coating
morphology and the liquid-repellent properties of the final coating and is
sufficient to diminish photodegradation [58].

27
Fluorosilanization
In order to lower the surface energy of the micro-/nanostructured coatings,
the samples were surface modified with fluorosilanes.
Perfluoroalkylsilanes are the frequently used for decreasing the surface
energy when preparing superhydrophobic and superamphiphobic surfaces
[14]. One advantage of using deposition of silanes is that they may form a
very thin coating layer, and hence it will not change the morphology of the
surface structures. In this work, two similar tri-functional silanes with a
fluorinated tail was used: 1H,1H,2H,2H-perfluorooctyl-trietoxy-silane,
FOTES (Papers I and II) and 1H,1H,2H,2H-perfluorooctyl-trichlorosilane,
FOTCS (Papers III and IV). The small difference between the two silanes
is their functional groups: ethoxy groups in FOTES and chloride in FOTCS
(Figure 9).
Figure 9. Chemical structure of silanes used in this work.
Substrates suitable for silanization include silicon, glass and metal oxides,
since their surfaces are covered by hydroxyl groups that can react with the
functional group of the silane, forming a covalent bond. To increase the
number of hydroxyl groups on the surface and hence maximize the
reactivity, the substrate is often activated prior the silanization process. In
this work, air (Papers I and II) or oxygen (Papers III and IV) plasma were
used for activation. The silanes can be applied via solvent deposition or
chemical vapor deposition (CVD). In this work, surface modification by
CVD was applied by using two different approaches: at elevated
temperature (70 °C for 24 hours at P = 1 atm) and at reduced pressure (100
mbar for 2 hours at room temperature).

28
Surface characterization
The superhydrophobic and superamphiphobic coatings were characterized
mainly in terms of wettability, which will be described in more detail in
this section. Additionally, techniques used to characterize surface
topography/morphology and surface chemistry of the coatings will be
briefly described.
Wettability
The most common way to characterize wettability of a surface is to
measure contact angles by goniometry using the sessile drop method.
Typically, a microliter-sized drop is gently placed on the surface using a
motorized syringe and a thin needle. The profile of the sessile drop is
captured using a high-resolution camera and the shape of the profile is
analyzed by the software to determine the contact angle. A schematic
image of a contact angle goniometer setup is shown in Figure 10.
Figure 10. Schematic of a contact angle goniometer setup and an
optical image of a sessile water droplet on a superhydrophobic
surface.
Advancing and receding contact angles can generally be measured by two
different approaches. The first is by increasing and decreasing the drop
volume by slowly pumping liquid in and out with the needle placed inside
the liquid drop close to the sample surface. A video is recorded during the
pumping and each image is analyzed to obtain the contact angles when the
liquid is advancing and receding over the surface. To avoid effects of the

29
needle distorting the drop shape, the contact angles should be determined
using sufficiently large drop volumes depending on the contact angle
hysteresis (about 10-15 µL is in most cases adequate for a hysteresis of less
than 10°) [33]. Alternatively, the advancing and receding angles can be
determined by tilting the sample so that the drop is rolling or sliding down-
hill. When the drop is in motion, the advancing contact angle is determined
from the downhill side and the receding one from the uphill side [144]. The
main advantages of using contact angle goniometry are that it is a relatively
fast, simple and straight-forward technique. However, there are some
issues to be aware of in order to obtain meaningful, reliable and
reproducible results. For instance, operational procedures such as
illumination, camera settings, baseline position and fitting method can
highly influence the results [145]. Additionally, for surfaces displaying
very high contact angles (such as super liquid-repellent surfaces), contact
angle measurements by sessile drop goniometry has been identified to
involve large errors [29, 146, 147]. Since the gap between the solid and the
liquid close to the contact point is small, it is difficult to accurately
determine the drop shape and the position of the baseline. In fact, for
contact angles over 150°, the error will increase drastically if the baseline
is misplaced by only one pixel. For highly liquid-repellent surfaces (CA
close to 180°), the error can even be larger than 10° [146, 148].
An alternative technique for wettability characterization of structured and
super liquid-repellent surfaces is laser scanning confocal microscopy
(LSCM) [32, 149-151]. The use of an inverted LCSM to image a sessile
droplet allows observation of the three-phase phase contact line at high
resolution (often < 1 µm) [149]. From the high-resolution confocal image,
the contact angles can be determined at a higher precision than using
optical goniometry. In addition, confocal imaging can provide insight on
the wetting state on super liquid-repellent surfaces. LSCM is described in
more detail in a following section.

30
Topography
The surface topography of the superhydrophobic and superamphiphobic
coatings was investigated using atomic force microscopy (AFM) and
scanning electron microscopy (SEM).
In AFM (described in more detail in the following section), a topography
image is generated by scanning a sharp tip attached to a cantilever across
the surface. The tip can either be in direct contact with, close above or
tapping the surface. Interactions between the tip and the surface due to
height variations are detected by deflection or changes in the oscillation
amplitude of the cantilever. Using a feed-back loop to the piezoelectric
scanner the height variations are measured and a 3D image of the surface
topography is created. In this work, AFM images were recorded by gently
tapping the surface.
In SEM, a focused electron beam is used to scan across the surface to
render an image of the sample. Compared to optical microscopy (which is
limited by the wavelength of light), SEM imaging provides much higher
resolution and depth of focus. Most commonly, an image is created by
detecting low-energy secondary electrons. Secondary electrons are
electrons ejected from the sample surface by the high energy of the electron
beam. Due to their low kinetic energy, only the electrons close to the
surface will reach the detector. In the detector, the electrons are converted
into an electrical signal and displayed as a two-dimensional intensity map,
which can be viewed as an image. The intensity in the signal depends on
the number of electrons reaching the detector. On surfaces tilted towards
the detector, the escape path is typically shorter, and a larger number of
electrons will reach the detector as compared to perpendicular surfaces.
This gives SEM images a perceived three-dimensional appearance with a
good perspective and sense of surface topography. Normally, a SEM
operates under high vacuum conditions (< 10-4 Pa) and samples needs to
be conductive to avoid surface charging. In order to produce good images
of electrically insulating materials, the samples need to be coated with a
thin layer of a conductive metal (e.g. gold or platinum). Alternatively, non-

31
conductive materials can be imaged using low vacuum SEM (LV-SEM)
without the use of any surface pre-coating. In LV-SEM, the pressure in the
specimen chamber is typically 1-2000 Pa and since a gas is present, the gas
molecules will ionize and neutralize any charge that may build up on a non-
conductive sample. In this thesis work, the nanostructured coatings were
sputter coated with a thin layer of gold prior SEM imaging. Additionally,
LV-SEM was used to image colloidal probes without surface pre-coating.
Surface chemistry
X-ray photoelectron spectroscopy (XPS) is a highly surface sensitive
method (analysis depth of typically 2-10 nm) which provides quantitative
information of surface chemical composition. In XPS, the sample is
irradiated with a beam of well-defined X-rays under ultra-high vacuum
conditions. When the X-ray photons interact with the atoms in the surface
region, photoelectrons are emitted. The kinetic energy of the
photoelectrons depends on the characteristic binding energy of the
element. XPS can provide both elemental composition and quantitative
information, as the number of detected electrons in each peak is directly
related to the amount of that element within the sampling volume. In
addition, since the characteristic binding energy of an atom is influenced
by the chemical environment, qualitative information of different chemical
states of an element (different functional groups, chemical bonding,
oxidation state etc.) can be obtained with XPS.
Force measurements
Atomic force microscopy
The atomic force microscope (AFM) was invented in 1986 [152] and has
developed into a very versatile tool for materials and surface
characterization. The main use of AFM is for topographical imaging and a

32
wide range of materials and surfaces can be imaged at high resolution, even
down to atomic resolution. Another great capability of AFM is to measure
interaction forces between different surfaces, which also is the main use of
AFM in this thesis work.
Figure 11. Schematic illustration showing the working principle of
AFM.
The working principle of AFM is illustrated in Figure 11. The sensing part
in an AFM is a cantilever spring with a probe attached to its free end. The
probe is usually a sharp tip but can be an object with other geometry, e.g.
a sphere as illustrated in Figure 11 and described later in this section. A
laser is focused on the back side of the end of the cantilever and the
reflected laser beam is directed to a detector. The detector is often a split
photodiode consisting of four sectors, which very sensitively monitors the
position of the reflected laser beam in the horizontal and vertical direction.
Movement of the reflected laser spot corresponds to deflection of the
cantilever (bending or twisting). A piezoelectric scanner is used to move
the sample relative to the cantilever in xyz directions. The scanner can
either move the sample (as illustrated in Figure 11) or the cantilever
(including the whole laser-detector system), and this generally depends on
the manufacturer of the instrument. Whether the sample or the cantilever
is moved, the principle is the same. The piezoelectric material enables very

33
precise movement and the position of the sample (or cantilever) can be
determined with high precision.
Normal force measurements using AFM
The AFM can be used for normal force measurements where the
interaction forces between the tip and the sample are measured [153-155].
During a force measurement, the cantilever is moved towards
(approaching) the sample in the normal (vertical) direction and back up
again (retracting or separating). The deflection of the cantilever (the
electrical signal from the photodiode in voltage) and the vertical position
of the cantilever (piezo scanner z-displacement) are recorded. The recorded
raw data can then be converted into a force-distance curve (in short “force
curve”), illustrated in Figure 12.
Figure 12. Schematic of set-up and raw data obtained during a
normal force measurement and corresponding force-distance curve
obtained using the deflection sensitivity and cantilever spring
constant.
The cantilever deflection is directly proportional to the interaction force
between the tip and the sample. In order to convert the photodetector signal
(VPSD) into force (F), first, the deflection sensitivity (s) needs to be
determined. The deflection sensitivity is the conversion factor (usually in
nm/V) of how much the cantilever deflects in units of distance for a certain
measured change in photodetector voltage. It is found by identifying the
constant compliance region where the tip and the sample are in “hard wall”
contact. The constant compliance region is linear for a hard surface/tip,
which means that the change in cantilever deflection is equal to the change

34
in piezo displacement. Hence, the deflection sensitivity is given as the
slope of the constant compliance region. For soft or fragile samples where
it is difficult to reach hard wall contact without destroying the sample, the
deflection sensitivity can be measured before or after the measurement on
e.g. a glass or mica surface. Once the deflection of the cantilever (x) is
known, the force can be calculated by multiplying the deflection with the
normal cantilever spring constant (kz) using Hooke’s law: F = kzx. Finally,
the distance between the sample and the tip (D) is calculated by adding the
cantilever deflection to the piezo position (Z).
Cantilever spring constant calibration
For quantitative force measurements, it is highly important to know the
spring constant of the cantilever as otherwise it is not possible to convert
the cantilever bending into force. Several different methods have been
proposed for calibrating the spring constant of cantilevers. For instance, by
measuring the change in resonance frequency when attaching a known
mass to the end of the cantilever the spring constant can be calculated
[156], or by using a reference cantilever with known spring constant the
spring constant of a unknown cantilever can be determined [157]. In this
work, the method proposed by Sader et al. [158] was used to determine the
spring constants. The Sader method is based on the principle that a viscous
fluid damps the thermal motion of an object. During calibration, the
cantilever is allowed to freely vibrate due to thermal motion in air (or other
fluid). The resonance frequency and the quality factor of the vibration are
measured and by knowing the width and length of the (rectangular)
cantilever, the normal spring constant kz is calculated from these values
and the density and viscosity of air.
Colloidal probe AFM
An important development for measurements of surface forces using AFM
is the colloidal probe technique introduced in 1991 [159, 160]. Typically,

35
a micron-sized spherical particle is glued to the cantilever (Figure 13) and
the interactions between the particle and the surface are measured. The
advantages of using spherical particles is a well-defined radius and the
force can be analyzed more quantitatively and with better sensitivity (since
the total force is higher than for a small tip). Different materials of the
microsphere can be used such as polymers, metals or metal oxides, but
most commonly silica or glass since such particles are available at different
sizes and typically have a very smooth surface. Glass or silica surfaces also
offer the advantage of easy chemical modification of the microsphere
surface by e.g. CVD. The colloidal probes can be attached by different
methods such as melting or sintering the particle onto the cantilever or by
using thermoplastics or two-component epoxy glue.
Figure 13. SEM image of a silica microsphere glued to the end of a
tipless AFM cantilever.
In this work, silica (typical radius 6 µm) and glass (typical radius 10-40
µm) microspheres were used as colloidal probes. The microspheres were
attached to tipless cantilevers by a two-component glue using a
micromanipulator under an optical microscope. The colloidal probes were
then surface modified by CVD fluorosilanization as previously described
for the super liquid-repellent coatings.

36
Measurements in liquid
AFM measurements can be performed in different environments such as
air, different gases, vacuum and liquid. For measurements in liquids a
liquid cell is typically used (Figure 14). A liquid cell is commonly made of
glass and includes a cantilever holder and a silicone O-ring sealing the cell
against the sample surface. The liquid cell used in Paper II can hold a few
mL of liquid and includes an inlet and outlet, which enables easy addition
and removal of liquid. In some AFM instruments it is possible to simply
trap a liquid drop between the AFM head cantilever holder and the sample,
and in this case a liquid cell is not needed. This approach was used for
combined force and imaging measurements in Papers I, III and IV.
Figure 14. Measurements in liquid using a liquid cell (left) or a
trapped liquid droplet (right).
External piezo setup
For force measurements using AFM, the range of the forces that can be
measured is limited by the z-range of the AFM piezo scanner (typically <
10-15 µm). In order to record full force curves where the interaction forces
would exceed the range of the AFM piezo scanner, an external piezo was
used in Papers III and IV. Here, the AFM was placed on an external piezo
which was used to move the AFM head towards and away from the surface.
During a measurement, the cantilever deflection was recorded by the AFM
as usual, and the tip position was determined from the external piezo
displacement.

37
Imaging
In order to image the events taking place during a force measurement, laser
scanning confocal microscopy was used in Papers I, III and IV.
Laser scanning confocal microscopy
Laser scanning confocal microscopy (LSCM) is widely used in the
biomedical sciences for three-dimensional imaging of fixed or living cells
and tissue [161]. The capabilities of LSCM have also been realized in
material and surface science [162, 163]. The basic concept of scanning
confocal microscopy was developed in the 1950’s [164], but it was not
until the late 1980’s, after important advances in computer and laser
technology, the interest for confocal microscopy was broadly increased
and LSCM along with the first commercial instruments were introduced
[165-167]. The major advantages of confocal microscopy over
conventional wide field optical microscopy are considered to be the
controllable depth of field, elimination of background out-of-focus
information and the capability to collect optical sections from thick
samples.
The basic working principle of LSCM is illustrated in Figure 15. An image
is created by scanning one (or more) focused laser beam(s) across a defined
area of the sample in a raster pattern controlled by scanning mirrors. After
the laser beam hits the target sample, the reflected light (and any
fluorescently emitted light) will follow the same path and pass through the
dichroic mirror. A pinhole aperture is situated in front of the photodetector
and the optics is designed so that the laser light focused on the sample is
“confocal” (having the same focus) with the point of light on the pinhole.
This means that only light from the focal plane of interest will pass through
the pinhole and reach the photodetector while all out-of-focus information
is eliminated. This makes it possible to image optical sections at high
resolution. Optical sectioning is a non-destructive method which is both

38
faster and simpler than sectioning the sample by physical means (i.e.
preparing thin slices) before imaging.
Figure 15. Schematic illustration of the working principle of laser
scanning confocal microscope (LSCM).
Different imaging modes can be utilized in LSCM. Fluorescence confocal
microscopy is most commonly used in biomedical science since it offers
high degree of sensitivity, combined with the ability to specially target and
label different components. Imaging in fluorescence mode typically
requires the sample being labelled by a fluorophore. The fluorophore is
excited by the high intensity light from the scanning laser (of a certain
wavelength) and will emit fluorescent light (of a certain wavelength). The
fluorescence wavelengths are then registered by the detector. The laser
source (exciting wavelength), type of fluorophore and detector
wavelengths are commonly adjusted for a specific system. In addition to
detect the fluorescence, another option is to detect reflected (backscattered)
laser light. By using reflection light imaging, also unstained samples can

39
be imaged. Reflection mode imaging is especially advantageous in
studying wetting and interfacial phenomena, as light will be reflected on
interfaces, allowing interfaces to be directly observed. By using several
photodetectors, which detect different wavelengths, both fluorescence and
reflected light can be detected simultaneously. Similarly, it is also possible
to collect images from multiple-labelled samples, i.e. simultaneously
collect several optical sections collected at different excitation
wavelengths. The basic image unit in LSCM is to collect single two-
dimensional optical sections in the xy-plane of a specific focal plane (z-
axis). By collecting a sequence of optical sections at stepwise changes in
focus, so-called z-series or z-stacks, can be combined and viewed as a
three-dimensional image. Additionally, by scanning along one line in the
x- or y-direction at different z-depths, a two-dimensional cross-section or
vertical slice can be obtained.
LSCM for studying wetting
In recent years, LSCM has been proven to be a powerful tool to study
wetting phenomena and super liquid-repellence [32, 125, 149-151, 168-
170]. The use of an inverted LSCM (sample is imaged from below) is
highly suitable for studying surface wetting as it allows observation of
interfaces and three-phase contact lines at high resolution (often < 1 µm).
The liquid phase can be visualized by adding a fluorescent dye, and
interfaces can be directly observed due to the reflected light. It is possible
to directly observe the wetting state below the droplet. Figure 16 shows an
example of an LSCM image of a water drop resting on a superhydrophobic
surface.
Figure 16. LSCM image of a fluorescently labelled water droplet
resting on a superhydrophobic surface.

40
Some limitations of using LSCM imaging for studying super liquid-
repellent surfaces include that the sample needs to be transparent and the
substrate cover glass of high precision (170 ± 5 µm in thickness). In
addition, thick and highly rough or void samples causes a high degree of
scattering and the signal reaching the detector will be reduced.
Fluorescent dyes
To fluorescently label the liquids, two different fluorescent dyes were used
in this work, ATTO 488 and N-(2,6-diisopropylphenyl)-3,4-perylene
dicarboxylic acid mono imide (PMI). The molecular structures of ATTO
488 and PMI are shown in Figure 17.
Figure 17. Molecular structures of fluorescent dyes used in this
work.
ATTO 488 is a polar commercial dye (ATTO-TEC GmbH) with a
maximum spectroscopic absorption wavelength at 500 nm and emission at
520 nm, and it was used to label water (Papers I, III and IV) and ethylene
glycol (Paper III). The non-polar dye PMI has a maximum spectroscopic
absorption wavelength around 505 nm and emission around 525 nm [149]
and was used to label hexadecane (Paper III).
LSCM combined with AFM setup
In this work, a home built inverted LSCM at Max Planck Institute for
Polymer Research in Mainz, Germany, was used for imaging during force

41
measurements in Papers I, III and IV. The main advantage of using this
setup in my thesis work was that it can be coupled with an AFM, which
makes it possible to collect images of the events taking place between the
tip and the sample during a force measurement [125, 171]. The confocal
microscope uses a 473 nm laser and a 40×/0.95 dry objective. The
fluorescence from the dyed liquid and the reflected light from the interfaces
were detected simultaneously with two different detectors. Typically, 2D
cross-sectional images were recorded by scanning the laser along one line
in the x-direction at different heights in the z-direction at an acquisition rate
of 1 frame s-1.
Image processing and analysis
The confocal images collected during force measurements in Papers I, III
and IV, were processed and analyzed in an automated manner using the
ImageJ software (see an example in Figure 18). The shape of the liquid-
gas interface was obtained from the fluorescence image (cyan). After
thresholding and binarization, the shape of the interface was extracted, and
a circle was fitted to the position of the spherical colloidal probe. The
reflection image (red) was used to extract the positions of the liquid-air and
glass-air reflections, which was used to identify the capillary base on the
super liquid-repellent surface.

42
Figure 18. Image processing and analysis of a confocal image with
light reflected from the interfaces in red and the liquid with
fluorescent dye in cyan. First, the fluorescence and reflection
images were converted to binary images, from where the shape of
the liquid-air interface (cyan symbols), positions of the liquid-air,
glass-air reflections (dashed red lines) and colloidal probe (black
circle) were extracted.
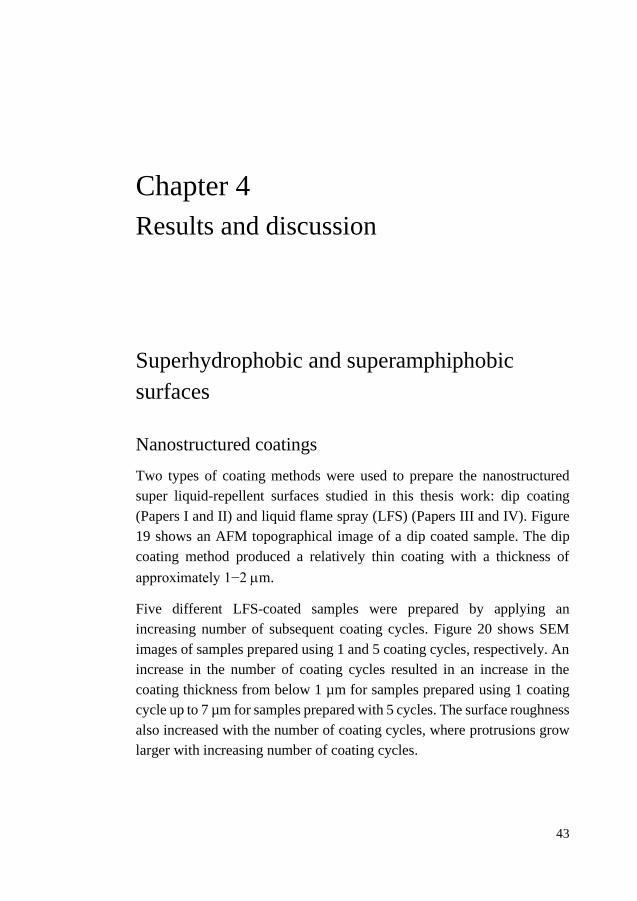
43
Chapter 4
Results and discussion
Superhydrophobic and superamphiphobic
surfaces
Nanostructured coatings
Two types of coating methods were used to prepare the nanostructured
super liquid-repellent surfaces studied in this thesis work: dip coating
(Papers I and II) and liquid flame spray (LFS) (Papers III and IV). Figure
19 shows an AFM topographical image of a dip coated sample. The dip
coating method produced a relatively thin coating with a thickness of
approximately 1−2 m.
Five different LFS-coated samples were prepared by applying an
increasing number of subsequent coating cycles. Figure 20 shows SEM
images of samples prepared using 1 and 5 coating cycles, respectively. An
increase in the number of coating cycles resulted in an increase in the
coating thickness from below 1 µm for samples prepared using 1 coating
cycle up to 7 µm for samples prepared with 5 cycles. The surface roughness
also increased with the number of coating cycles, where protrusions grow
larger with increasing number of coating cycles.

44
Figure 19. AFM topographical image (10 × 10 m2) of a dip coated
sample with height profile along the horizontal dashed line in the
center of the image.
Figure 20. SEM images of LFS-coatings: (a) 1 coating cycle and (b)
5 coating cycles. Scale bars 5 µm.

45
Wettability measured with contact angle goniometry
After surface modification with fluorosilane, all coatings studied in this
thesis work were superhydrophobic as water droplets were seen to adopt
an almost spherical shape with high contact angles (≳ 150°) and low roll-
off angles (≲ 5°) as measured by goniometry (Table 1). LFS-coatings
prepared by 2-5 coating cycles, showed excellent water-repellence as
droplets would roll away as soon as the goniometer needle was detached
resulting in non-measurable roll-off angles for these surfaces (< 1°). In
addition, the LFS-coating prepared by 5 coating cycles was
superamphiphobic as contact angles for hexadecane ( = 27 mN m-1) was
measured to be θadv = 160 ± 2°, θrec = 150 ± 5°, and roll-off angles RA = 2
± 1°.
Table 1. Summary of water contact angles measured by goniometry.
RA for 10 µL droplets.
Sample θadv (°) θrec (°) RA (°)
Dip coating 158 ± 1 148 ± 2 5 ± 1
LFS - 1 coating cycle 163 ± 1 154 ± 4 3 ± 2
LFS - 2 coating cycles 162 ± 1 156 ± 8 < 1
LFS - 3 coating cycles 161 ± 1 159 ± 2 < 1
LFS - 4 coating cycles 162 ± 1 160 ± 1 < 1
LFS - 5 coating cycles 161 ± 1 159 ± 1 < 1
The wettability of the dip coated superhydrophobic surface was further
studied by adding ethanol to water in order to lower the surface tension of
the liquid (Paper II). A wetting transition from super liquid-repellence (θ
> 150°) to complete wetting (θ < 5°) was observed (Figure 21). For an
ethanol content of ≤ 20 vol% ( ≥ 40 mN m-1), both the advancing and
receding contact angles were high (≳ 140°) and roll-off angles were low
(≲ 10°), while 30-40 vol% ethanol ( = 35-32 mN m-1) showed high
advancing contact angles (≳ 150°) and low receding contact angles (< 20°).
In this case, the droplets were pinned even when the samples were tilted

46
by 90°. This indicated that a transition from a low adhesive CB type of
wetting state to a high adhesive Wenzel state occurred between 20 and 30
vol% ethanol.
Figure 21. Advancing and receding contact angles for different
water/ethanol mixtures on the dip coated superhydrophobic surface.
Error bars show the standard deviation and for some data points they
are smaller than the symbols.
Surface wettability studied with LSCM
As mentioned in Chapter 3, contact angle measurements performed with
optical goniometry and drop shape analysis involve a large uncertainty for
high apparent contact angles, as the gap between the liquid and the solid
close to the contact line is small and can be difficult to identify in an optical
image. By LSCM imaging of sessile droplets, a more detailed insight into
the wettability of the super liquid-repellent surfaces was obtained in this
work. LSCM images revealed higher contact angles as compared to those
measured with optical goniometry. Water contact angles were determined
to approximately 165° for dip coated samples and approximately 170° for
the LFS-coated samples. It is worth noting that contact angles determined

47
by LSCM are measured for a sessile droplet “as placed” and the measured
values should be in between the ACA and RCA.
Figure 22. Laser scanning confocal microscopy images of liquid
droplets on a dip coated superhydrophobic surface: (a) a
fluorescently labelled water droplet in cyan with the light reflected
from interfaces in red, (b) an undyed water droplet, (c) droplet of
20 vol % ethanol, and (d) droplet of 40 vol % ethanol. The insets in
(b-d) show optical images of 5 L drops of respective liquids resting
on the surface (scale bar 1 mm). The dotted white line in (d) is added
as a guide to the eye to enhance the interface underneath the liquid.
Another great advantage of using LSCM to study the wettability of the
liquid-repellent surfaces, is that different wetting states can be visualized.
In Figure 22b, the two horizontal red lines underneath the water droplet are
from light being reflected at the interfaces. The lower reflection arises from

48
the interface between the glass substrate and gas and the upper reflection
from the interface between the liquid and gas. This demonstrates the
presence of a gaseous (air-vapor) layer between the liquid and the coated
substrate. Generally, the thickness of this gaseous layer was found to be of
the same order as the thickness of the nanostructured coatings, indicating
that the liquid was suspended on top of the protrusions of the coatings,
consistent with a CB type of wetting state. In contrast, if light only was
reflected from one interface underneath the droplet, as was the case for a
40 vol% ethanol droplet on the dip coated sample (Figure 22d), this
indicated that the surface structure was penetrated by the liquid with no or
a small amount of trapped gas.
Interactions involving superhydrophobic
surfaces and observations of gas capillaries
Force measurements between hydrophobic and super-
hydrophobic surfaces in water
Hydrophobic colloidal probes
Hydrophobized microspheres were used as colloidal probes in all force
measurements during this thesis work. Two types of microspheres were
utilized (silica and glass) and fluorosilanized in order to make the surface
hydrophobic. Figure 23 shows SEM images of colloidal probes with one
glass and one silica sphere. The silica spheres had a low polydispersity
with a typical radius of R = 3 µm and a somewhat smoother surface (Ra =
6 nm, Rq = 8 nm) as compared to the glass spheres (Ra = 39 nm, Rq = 49
nm). The glass spheres were mainly chosen because of their larger size (R
= 10-20 µm) in order to make sure the colloidal probe was visible during
confocal imaging.

49
Figure 23. SEM images of colloidal probes: (a) glass sphere (R = 16
m) and (b) silica sphere (R = 3 m). Scale bars 10 m.
Interactions between smooth hydrophobic surfaces
For comparison, the results of force measurements between smooth
hydrophobic surfaces in water will first be briefly described. Figure 24
shows an example of a force curve between a fluorosilanized silicon wafer
and a fluorosilanized silica microsphere (R = 3 µm). The shape of the force
curve has the characteristic features as described in Chapter 2.
Figure 24. Example of force measurement recorded on approach
(black) and retraction (red) between a hydrophobic microsphere (R
= 3 µm) and a hydrophobic flat surface. The dashed black line is the
theoretical van der Waals force (Eq. 4) and the solid black line is
fitting of the capillary force equation for constant capillary volume
(Eq. 13).

50
The dashed black line is the theoretical van der Waals force calculated
using Eq. 4. The non-retarded Hamaker constant A = 2.8 × 10⁻²¹ J was
calculated using Eq. 5 and dielectric data for water ( = 80, n = 1.333) and
fluorocarbon ( = 2.1, n = 1.359) [77]. As can be seen in Figure 24, the
measured forces are clearly inconsistent with the expected van der Waals
force, and the attraction is more likely caused by the formation of a
bridging gas capillary. Fitting of the theoretical capillary force equation for
constant capillary volume (Eq. 13) to the experimental data measured on
retraction, shows that the equation provided a good representation at large
separation (Figure 24, solid black line). The capillary volume extracted
from this fit was found to be V = 2 × 10-22 m3 (= 0.2 aL).
Interactions between hydrophobic and superhydrophobic surfaces
Force measurements between a hydrophobic microsphere and a
superhydrophobic surface performed in this thesis, frequently showed
strong attractive interactions ranging into the micrometer scale. The range
and magnitude of the measured forces varied depending on the specific
system. However, the measured force curves shared the main
characteristics as explained in Chapter 2. Figure 25 shows examples of
force curves measured on a dip coated and an LFS-coated
superhydrophobic surface, respectively. The force curves in Figure 25
cannot be fitted by assuming a gas capillary of constant volume, and rather
the shape suggests an increase in capillary volume during the major part of
the separation process. This type of force curve was observed in the
majority of cases on the dip coated superhydrophobic sample. In Paper II
it was concluded that 84% of the measurements resulted in capillary
volume increase type of force curves in water and in Paper I they were
observed in 90% of the cases. In contrast, for measurements on an LFS-
coating prepared with 5 coating cycles, this kind of force curves were
observed every time. Even though the total number of measurements was
fewer and no statistical analysis was made in this case. This indicates that
while how frequently the interactions showing increasing capillary volume
characteristics occur are likely related to local wetting characteristics (e.g.
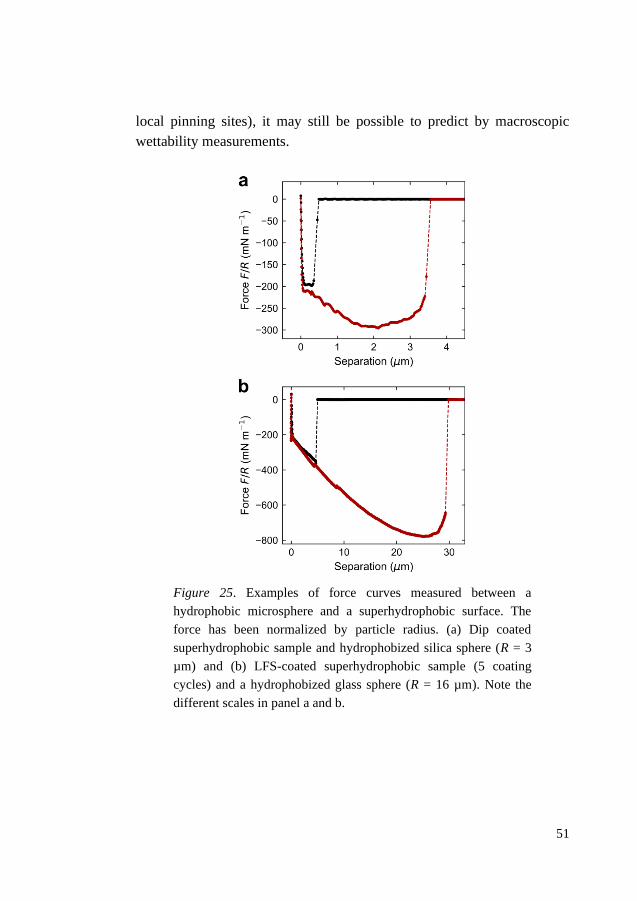
51
local pinning sites), it may still be possible to predict by macroscopic
wettability measurements.
Figure 25. Examples of force curves measured between a
hydrophobic microsphere and a superhydrophobic surface. The
force has been normalized by particle radius. (a) Dip coated
superhydrophobic sample and hydrophobized silica sphere (R = 3
µm) and (b) LFS-coated superhydrophobic sample (5 coating
cycles) and a hydrophobized glass sphere (R = 16 µm). Note the
different scales in panel a and b.

52
Gas capillary imaging and development during force
measurements
Capillary imaging during force measurements
LSCM was used to record microscopic images of gas capillaries during the
AFM force measurements. The capillary images could be connected to the
corresponding observations in the force curves and previously proposed
events, such as capillary formation, growth and rupture, was now
visualized.
Figure 26. Examples of confocal images of gas capillary formation,
development and rupture. Scale bar 10 µm.
Figure 26 shows an example of a force measurement with corresponding
LSCM images. At the start of the measurement, when the force is zero, the
particle and the superhydrophobic surface are seen to be well-separated in
the corresponding confocal image (Point 1). When a strongly attractive
force is appearing, the confocal images demonstrate the formation of a gas
capillary between the two surfaces (Point 2-3). During the retraction of the
cantilever, the gas capillary persists as the attractive force is increasing

53
(Point 4-6), and at the point when the force returns to zero, capillary rupture
is observed (Point 6-7).
Capillary shape and development during separation
The confocal images did not only offer visualization of gas capillaries, but
also allowed us to quantify and monitor the development of the capillary
shape and size during separation. From the shape of the capillary obtained
from confocal images, capillary characteristics such as the capillary
diameter on the superhydrophobic surface d, the angle describing the de-
wetted area on the particle , and the microscopic contact angles at the
liquid−gas interface of the particle p, and superhydrophobic surface s,
were determined (Figure 27).
Figure 27. Illustration of a gas capillary (volume V) between a
spherical particle (radius R) and a flat surface at separation distance
D, with the diameter of the capillary on the flat surface d, the angle
defining the de-wetted area on the sphere β and the contact angles
at the gas-liquid interface of the flat surface θs and particle θp,
respectively.
To determine the gas capillary volume, it was assumed that the cross-
sectional confocal image was recorded at the center of the capillary and
that the capillary was axisymmetric. The capillary volume Vcap was then
calculated by:
𝑉cap = ∫ π(𝑟(𝑧))2
d𝑧ℎ
0− 𝑉p (20)

54
where r is the capillary radius at each pixel in the z-direction and h is the
height of the capillary gas-liquid interface. Vp is given by the volume
occupied by the spherical cap of the particle and calculated by:
𝑉p =π𝑏(3𝑎2+𝑏2)
6 (21)
where 𝑏 = 𝑅(1 − cos 𝛽) is the height of the cap and 𝑎 = 𝑅 sin 𝛽 its radius.
Gas capillaries observed at superhydrophobic surfaces during this thesis
work, were typically determined to be in the order of Vcap ≈ 10-15 – 10-13 m3
(= 1 – 100 pL). It is worth noting that this is several orders of magnitude
larger than the volumes determined by fittings of the capillary force
equation in the case of the smooth hydrophobic surfaces (Vcap ≈ 10-22 m3).
By calculating the capillary volumes during the retraction of the particle,
it was observed that capillaries (initially) grow in volume during separation
(Figure 28b). Calculations of the Young-Laplace capillary pressure P
from the capillary shape (Eq. 9) suggested that an under pressure in the
capillary drives the inflow of gas from the pre-existing gaseous layer into
the capillary and this allows the volume to increase during separation
(Paper I).
In addition to visualize the capillary growth, the capillary development was
monitored by the change in positions of the capillary TPCLs and the
contact angles at the liquid-gas interface during separation. Figure 28
shows an example of capillary characteristics development during
retraction for a dip coated superhydrophobic surface. In general, when the
attraction increased during retraction (D < 6 µm in Figure 28), capillaries
were observed to spread on the superhydrophobic surface as observed by
an increase in d (Figure 28c). Different degrees of pinning to the surface
were observed for the different superhydrophobic surfaces. On the dip
coated samples, capillaries were observed to be either pinned to the surface
during the retraction, or intermittently pinned and spreading (as in Figure
28) reaching maximum values of d ≈ 30 µm. Whereas on the LFS-coated
samples a very low degree of pinning was observed, and capillaries were

55
observed to spread over the surface during the main part of the retraction.
Capillary widths reaching maximum values as high as d = 170 µm was
observed on an LFS-coated sample prepared using 5 coating cycles.
Figure 28. Example of gas capillary development during retraction
for a measurement on a dip coated superhydrophobic surface in
water.
The capillary TPCL on the particle surface was typically pinned when the
attractive force increased as observed by a relatively constant (Figure

56
28e). With the TPCL pinned to the particle surface, the contact angle
increased with separation until reaching a maximum value (Figure 28f) at
the distance where the attractive force was largest (D ≈ 6 µm in Figure 28).
Then, as the attractive force decreased, the TPCL would start to move over
the particle surface as observed by a decrease in and the particle slowly
became wetted again before the capillary finally ruptured.
Steps in force curves due to pinning/de-pinning of TPCLs
Small steps (a sudden reduction of the attractive force) were often observed
in the force curves recorded on separation. These steps in the attractive
force were identified as being due to pinning/de-pinning of the TPCLs on
either the superhydrophobic surface or hydrophobic particle. De-pinning
of the TPCLs was observed by a change in d or , and in many cases
directly observed in the confocal images.
Figure 29. Example of steps in a force curve measured on retraction
(a) with corresponding capillary menisci shapes before (c) and after
(b) the step. De-pinning of the TPCL is highlighted by the black and
gray arrows in (b) and (c).
Figure 29 shows an example where de-pinning of the TPCL was observed
on an LFS-coated superhydrophobic sample (5 coating cycles). In cases

57
where a step in the attractive force could not be linked with a distinct jump
of the TPCL, it is likely that de-pinning would occur outside the 2D plane
of the cross-sectional confocal image or it was too small to be resolved.
Interactions involving superamphiphobic
surfaces and the effect of liquid surface tension
Water-ethanol mixtures
In order to study the effect of liquid surface tension and the relation
between wettability and interaction forces on a dip coated
superhydrophobic surface, force measurements were recorded in
water/ethanol mixtures in Paper II. Figure 30 shows how the liquid surface
tension decreases when adding ethanol to water.
Figure 30. Surface tension of water/ethanol mixtures at 25°C.
Plotted using data from [172].
The effect of adding ethanol on the interactions measured on a dip coated
superhydrophobic surface was compared to those measured on a smooth

58
hydrophobic surface (a fluorosilanized silicon wafer). Typical force curves
recorded in different water/ethanol mixtures for the smooth hydrophobic
surface are presented in Figure 31.
Figure 31. Typical force curves recorded on (a) approach and (b)
retraction between a smooth hydrophobic surface and a
hydrophobic particle in different water/ethanol mixtures. The inset
in (a) shows the theoretical van der Waals force in water (dashed
black line) and ethanol (solid gray line), and the solid black lines in
(b) are the theoretical fits to the capillary force equation for constant
capillary volume (Eq. 13).

59
As seen in Figure 31, the magnitude of the attractive force was found to
decrease when the ethanol concentration was increased. A gas capillary
bridge connecting the two surfaces is expected to form if the contact angle
is > 90° [173, 174]. When ethanol was added at 20 vol%, the macroscopic
contact angles on the hydrophobic surface were adv = 96 ± 3°, rec = 86 ±
2°. Indeed, attractive interactions suggesting gas capillary formation were
typically observed, and interactions measured during retraction were
consistent with those expected due to a bridging gas capillary with a
constant volume. When the ethanol concentration was further increased to
40 vol%, the macroscopic contact angles were well below 90° (adv = 78 ±
2°, rec = 71 ± 2°) and a gas capillary connecting the two surfaces were not
expected in this case. However, attractive interactions were still typically
observed. There is no clear explanation for the observed attraction, but it
may be due to preferential adsorption of ethanol over water at the
hydrophobic surface [108, 175]. This may cause the formation of a
capillary bridge consisting of a liquid phase more concentrated in ethanol
than the bulk liquid, giving rise to the attractive interactions.
Force measurements between a dip coated superhydrophobic surface and
the hydrophobic particle showed that the presence of ethanol strongly
affected the interaction forces also in this case. As discussed in the previous
section, force measurements in water frequently show interactions
consistent with a capillary volume increase during separation. Such force
curves were also observed in 20 vol% ethanol (Figure 32) but the range
and magnitude of the attractive interactions decreased as compared to in
pure water. These observations are consistent with capillary growth being
facilitated by the pre-existing gaseous layer at the superhydrophobic
surface as such gaseous layer was visualized by LSCM for 20 vol% ethanol
(Figure 22). Additionally, at the ethanol concentration of 40 vol%, where
confocal images indicated that the surface structure was wetted by the
liquid with no or small amounts of trapped gas, no force curves consistent
with a large and growing capillary were observed. Hence, these results
support the view that the pre-existing gaseous layer is responsible for the
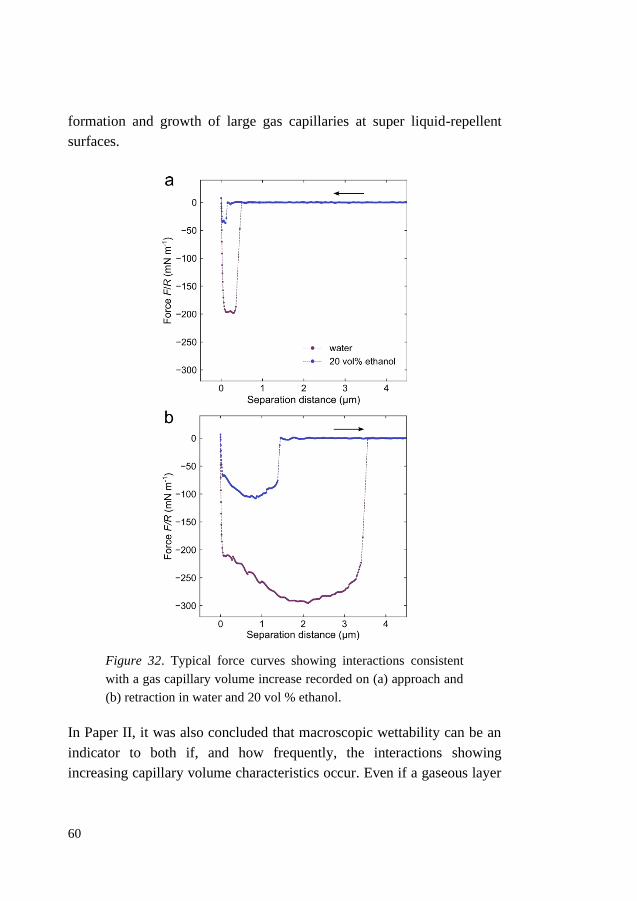
60
formation and growth of large gas capillaries at super liquid-repellent
surfaces.
Figure 32. Typical force curves showing interactions consistent
with a gas capillary volume increase recorded on (a) approach and
(b) retraction in water and 20 vol % ethanol.
In Paper II, it was also concluded that macroscopic wettability can be an
indicator to both if, and how frequently, the interactions showing
increasing capillary volume characteristics occur. Even if a gaseous layer

61
is present at the surface, it is likely that chemical or topographical
irregularities and pinning points can locally prevent the formation of large
capillaries. For an increased number of such pinning points, the formation
of a large gas capillary with increasing volume during separation will likely
occur less frequently. The number of such pinning points is reflected in the
macroscopic wettability by CAH. This may explain why interactions
consistent with capillary growth were observed only in 29% of the cases in
20 vol% ethanol where the CAH was larger (θadv = 155 ± 1°, θrec = 138 ±
8°) as compared to water (θadv = 158 ± 1°, θrec = 148 ± 2°), where such
interactions were observed in the majority of the measurements (84%).
Lower surface tension liquids
In Paper III, the interactions involving a superamphiphobic surface (LFS 5
coating cycles) in lower surface tension liquids were studied in order to
further investigate whether, and how, gas capillary formation was affected
by the surface tension of the liquid. Using LSCM imaging during force
measurements between the superamphiphobic surface and a hydrophobic
microsphere, it was found that bridging gas capillaries occurred also in the
lower surface tension liquids ethylene glycol ( = 48 mN m-1) and
hexadecane ( = 27 mN m-1), see Figure 33 for examples.
Figure 33. LSCM images of gas capillaries observed in (a) ethylene
glycol and (b) hexadecane.

62
Typical force curves with corresponding capillary menisci shapes recorded
in each liquid are shown in Figure 34. As seen, both the range and
magnitude of the attractive forces, as well as the capillary size, decreased
as the surface tension of the liquid was reduced.
On approach, a weak repulsion was observed prior to capillary formation
in hexadecane and in some cases in ethylene glycol. A repulsion was never
observed in water. It was concluded that the observed repulsion resulted
from deformation of the liquid-gas interface, and it was observed in the
confocal images by a compression of the gaseous layer at the
superamphiphobic surface. It was found that the ratio of the slopes of the
repulsion in ethylene glycol and hexadecane (≈ 1.7-1.8) was close to the
ratio of their surface tensions (1.8). This observation was supported by the
fact that the energy required to deform the gas-liquid interface is expected
to scale with the surface tension. It was suggested that the contact angle on
the particle was responsible for this effect as the lower the contact angle on
the particle the higher energy barrier for de-wetting. The contact angles on
the probe particle just after formation of the gas capillary were on average
found to be p = 87°, p = 73° and p = 50° for water, ethylene glycol and
hexadecane, respectively. These values were found to agree with receding
contact angles on a chemically similar flat surface (water rec = 84°,
ethylene glycol rec = 66° and hexadecane rec = 51°). These results show
that due to the large amount of gas in the gaseous layer on the
superamphiphobic surface, a gas capillary bridge can form even if the
particle is wetted by the liquid ( < 90°).
During separation, gas capillaries observed in ethylene glycol and
hexadecane followed a similar general evolution as described for water in
the previous section (Figure 28). That is, in the beginning, when the
attractive force increased, the capillary spread on the superamphiphobic
surface (increasing d) while the TPCL on the particle was pinned (constant
). Then, after the maximum attractive force was reached and the force
decreased, the TPCL position was moving over the particle surface

63
(decreasing ) while being close to constant on the superamphiphobic
surface (constant d).
Figure 34. Typical force curves recorded in water, ethylene glycol
and hexadecane with the corresponding shape of the capillaries.
Note the different scales in panels a, c and e.

64
Initial capillary growth was also observed in ethylene glycol and
hexadecane, however the volumes were much smaller, both initially and at
maximum size, as compared to those observed in water (Figure 35).
Capillaries grew up to maximum volumes on average 2.5 × 10⁻¹⁴ and 1.0 ×
10-14 m3 in ethylene glycol and hexadecane, respectively, compared to 1.2
×10-13 m3 observed in water. Similarly, the capillary diameter on the
superamphiphobic surface was smaller in the lower surface tension liquids,
maximum values were of on average d = 170 m, d = 100 m and d = 85
m in water, ethylene glycol and hexadecane, respectively.
Figure 35. Maximum capillary (a) volume and (b) width on a
superamphiphobic surface observed in water, ethylene glycol and
hexadecane.
Also on retraction it was observed that the wettability of the particle is
highly influencing the interactions. First, the TPCL on the particle is
pinned during separation, the contact angle on the particle is increasing
until a maximum value is reached. Then the TPCL is moving over the
particle surface and the de-wetted area becomes wetted again until the
capillary finally ruptures. As the liquid is advancing over the particle
surface, the contact angle is expected to be the advancing contact angle.
The largest observed contact angles on the particle in each liquid (p =
116°, p = 98° and p = 78° in water, ethylene glycol and hexadecane,
respectively) were indeed found to agree with the advancing contact angles
65
on a chemically similar flat surface (water adv = 116°, ethylene glycol adv
= 99° and hexadecane adv = 74°).
Capillary growth and the effect of the amount
of available gas
For the capillary to form and grow during separation it requires an inflow
of gas. The gas can enter the capillary by the means of two contributions:
due to gas dissolved in the liquid diffusing into the capillary or by gas being
transported from the pre-existing gaseous layer at the surface. The
individual contributions cannot be easily evaluated, but their effects will
be discussed in this section.
Influence of dissolved gasses
For measurements between smooth hydrophobic surfaces, dissolved gasses
have been shown to strongly influence the interactions in water [102, 104,
176-178]. As the range of the attractive interactions have been observed to
decrease for de-gassed water, it is likely that the capillary formation is due
to diffusion of the dissolved gassed. In the case of super liquid-repellent
surfaces with a pre-existing gaseous layer, however, it is expected that the
majority of gas enters the capillary by means of this layer. However, this
does not preclude the possibility that dissolved gas also may diffuse from
the bulk liquid, contributing to the capillary growth.
During this thesis work, force measurements have been performed in both
de-gassed (Paper II) and normal aerated (Papers I, III and IV) liquids.
However, the effect of de-gassing was not investigated per se, mainly due
to experimental challenges. First, as the air diffusion coefficient in water
is relatively high (2 × 10⁻⁹ m2 s-1) [179] and small amount of liquid is used
in the experiments, it is likely that the water will be rapidly saturated.
Second, and especially if a closed liquid cell is used in order to eliminate

66
the surrounding air to contribute in saturating the liquid, the gas initially
trapped in the rough surface structure will diffuse into the liquid. It has
been shown that this diffusion process can be very fast and that the gaseous
layer may even be completely dissolved within seconds or minutes
depending on the surface structure of the superhydrophobic surface [180].
Even if the gaseous layer is not completely dissolved, this diffusion process
will reduce the amount of gas present in the gaseous layer at the surface.
Hence, any differences in capillary volume and growth may be due to the
amount of accessible gas in the surface layer being reduced, and any effect
of dissolved gasses diffusing into the capillary cannot be evaluated in a
straightforward manner.
A further aspect of interactions involving superamphiphobic surfaces is
that gas is readily dissolved in different amounts in different liquids, and
the gas solubility is expected to increase with decreasing liquid surface
tension [181]. In Paper III, it was observed that gas capillaries were
smallest in hexadecane where the gas solubility was the highest and largest
in water with the lowest gas solubility. These results suggested that, while
gas diffusion from bulk liquid into the capillary might be more important
in hexadecane, most of the gas is however likely entering from the pre-
existing gaseous layer.
Influence of gaseous layer thickness
In Paper IV it was investigated how the thickness of the gaseous layer (and
thus the amount of available gas) influence the interactions and the
capillary size and shape. Superhydrophobic samples with different coating
thicknesses were prepared by applying an increased number of LFS
coating cycles, and LSCM confirmed that an increase in coating layer
thickness led to an increase in the thickness of the gaseous layer. The
thickness of the homogeneous part of the coatings and the height of the
highest protrusions determined from SEM images, and the gas layer
thickness below a sessile water droplet and when water is trapped between
the surface and the AFM, are summarized in Table 2.

67
In the force measurements, the range of the attractive forces and the size
of the capillaries were observed to increase with increasing coating
thickness (number of coating cycles), indicating that the amount of
accessible gas in the gaseous layer is influencing capillary formation and
growth. Gas capillaries at the sample prepared by 1 coating cycle were
observed to be considerably smaller both at the initial and final state as
compared to the other four coatings, suggesting that the amount of
available gas was a limiting factor for a coating that thin. For samples
prepared by 2, 3 and 4 coating cycles, only a small difference was observed
in capillary size and attractive force, which may be explained by the fact
that the gas layers at these coatings were of similar thickness. On the
sample prepared using 5 coating layers, gas capillaries were observed to
grow considerably larger, resulting in higher attractive forces.
Table 2. Approximate coating thicknesses and corresponding
gaseous layer thicknesses.
Coating layer Gaseous layer
Sample
Homo-
geneous
part
Pro-
trusions
Sessile
droplet
In
AFM
1 coating cycle 0.6 µm 1.2 µm 1 µm < 1 µm
2 coating cycles 1.2 µm 3.4 µm 3 µm 2 µm
3 coating cycles 1.9 µm 3.8 µm 4 µm 3 µm
4 coating cycles 2.3 µm 4.8 µm 5 µm 3 µm
5 coating cycles 3.9 µm 7.1 µm 7 µm 4 µm
The results suggested that, while the amount of available gas in the pre-
existing gaseous layer seems to influence the interactions, evaluating the
effect may not be only related to the increased layer thickness. That is
because the total amount of accessible gas is not only determined by the
layer thickness, but also the surface roughness and porosity of the coating
layer. If surface roughness and/or porosity is increased for a fixed layer
thickness, the volume ratio of gas to solid in the coating will be increased.

68
An increased surface roughness is likely to explain why, even though the
gas layer at the sample with 5 coating cycles are just slightly thicker as
compared to the sample prepared using 4 coating cycles, gas capillaries can
still grow considerably larger.
Figure 36. (a) Maximum attractive force encountered on approach
and retraction and (b) the range of attraction obtained from force
measurements, and (c) maximum capillary width on the
superhydrophobic surface dmax, and (d) maximum capillary volume
Vmax obtained from capillary images. Error bars show the standard
deviations.

69
Calculations of capillary forces and comparison
to measurements
Capillary pressure from meniscus shape and calculation of
the theoretical capillary force
For capillaries observed on the dip coated superhydrophobic sample, the
capillary pressure was determined using Eq. 9 (Paper I). The two principal
radii (r1 and r2) of curvature of the capillary gas-liquid interface were
determined from the confocal images. Once the capillary pressure was
determined, the theoretical capillary force was calculated using Eqs. 6-8
and compared to the maximum attractive force observed on separation. It
was found that theoretically calculated forces (Fcap = -4.1 N) were slightly
lower but in the same order of magnitude as the experimentally measured
values (F = -8.4 N). The observed difference may be explained by the
fact that force measurements are dynamic while the theoretical equation
describes an equilibrium situation.
In contrast, for gas capillaries observed on the LFS-coated samples (Papers
III and IV), the shape of the liquid-gas interface clearly could not be fitted
assuming the circular approximation, hence Eq. 9 cannot be used to
determine the capillary pressure in these cases. Instead, an attempt was
made to calculate the capillary pressure using Eqs. 10-11 from fittings of
Eq. 12 to the experimental data of the meniscus shape. Calculations were
performed using data from Paper III for capillaries observed in water,
ethylene glycol and hexadecane. The capillary lengths at 25°C for water,
ethylene glycol and hexadecane are = 2.7, = 2.1 and = 1.9 mm,
respectively. The Bond numbers in the experiments were in the range of
Bo ≈ 0.006-0.007. This means that the requirements for Eq. 12 to be valid
holds (𝑟 ≪ 𝜅 and 𝐵𝑜 ≪ 1) and the experimental data of the meniscus
shape could be fitted to Eq. 12. Figure 37 shows that fittings to Eq. 12 can
describe the meniscus shape well in all three liquids.

70
Using the fitted functions, P was estimated using Eqs. 10-11 for the three
cases and calculations arrived at values of P in the orders of ± 10-6 – 10-5
Pa. It was however noted that the result of these calculations, both values
and sign, sensitively depended on details of the fit, and likely included
large errors. The results show that the pressure difference clearly is very
small, however due to the errors likely being large, the calculated values
were not used in further calculations of the capillary forces.
Figure 37. Examples of capillary experimental data (cyan symbols)
with fit to Eq. 12 (red lines) in (a) water (fitting parameters rp = 13.8
m, = 69° and b = -50.5 m), (b) ethylene glycol (fitting
parameters rp = 10.7 m, = 41° and b = -26.5 m) and (c)
hexadecane (fitting parameters rp = 6.9 m, = 45° and b = -20.5
m).

71
Calculating capillary interactions using a free energy
approach
Integration of force curves
In order to compare calculations of the free energy of capillary formation
(Eq. 15) with measured values, the force curve needs to be integrated:
∆𝐺 = − ∫ 𝐹d𝐷𝑏
𝑎 (22)
In our case we want to compare the integral of the force curve measured
on retraction to the free energy calculated from capillary images during
separation. We need to account for the energy at zero distance by adding
the integral of the force curve measured on approach, and arrive at the final
equation for the energy integral:
∫ 𝐹d𝐷 = − ∫ 𝐹approachd𝐷0
𝐷a+ ∫ 𝐹retractd𝐷
𝐷r
0 (23)
Here, Da is the separation distance when an attractive force is first observed
on approach (when the capillary is formed) and Dr the separation when the
attraction disappears on retraction (when the capillary ruptures).
Figure 38. Example of integral of force curve recorded on an LFS-
coated superhydrophobic surface (5 coating cycles) in water.

72
Figure 38 shows an example of the integrated force curve ∫FdD for a
measurement on an LFS-coated sample (5 coating cycles) in water. The
capillary is only thermodynamically stable when the ∆G < 0, which is only
the case for small separations (D ≲ 4 µm in the example in Figure 38).
When ∆G > 0 at large separations, the capillary is in a metastable state but
remains due to a high energy barrier for rupturing [118]. Only at
sufficiently large separations the energy barrier is overcome and the
capillary ruptures.
Calculation of the surface tension contribution from the capillary
shape
From the capillary shape evaluated from the confocal images, the surface
tension contribution to the free energy change due to capillary formation
GA could be calculated using Eq. 16. The three surface areas of the
capillary were determined from capillary images. The capillary surface
area on the particle Ap was estimated from the particle radius R and the
angle describing the position of the three-phase line :
𝐴p = 2π𝑅2(1 − cos 𝛽) (24)
The capillary surface area on the super liquid-repellent surface As was
estimated from the capillary diameter on the surface d:
𝐴s =π𝑑2
4 (25)
Finally, the capillary surface area of the gas-liquid interface Ai was
calculated as:
𝐴m = 2π ∫ 𝑟(𝑧)ℎ
0√1 + (
d𝑟
d𝑧)
2d𝑧 (26)
where r is the capillary radius at each pixel in the z-direction and h is the
height of the capillary gas-liquid interface.

73
Figure 39. Calculations of GA (blue symbols) and comparisons to
the integral of the force curve ∫FdD (solid black line) measured on
retraction for measurements in (a) water, (b) ethylene glycol and (c)
hexadecane.

74
Figure 39 shows examples of GA calculated during separation and it is
compared to the integral of the force curve ∫FdD for measurements in
water, ethylene glycol and hexadecane (Paper III). A deviation between
measurements and calculations at large D was observed in water and
ethylene glycol, while in hexadecane there was a reasonably good
agreement. The observed difference suggests that the force measured in
water and ethylene glycol, cannot be described by the surface tension
contribution alone and likely includes contributions from the pressure-
volume work VΔP and/or properties at the TPCLs. However in
hexadecane, the surface tension term likely provides the major contribution
and the other contributions are insignificant.
Estimating the capillary pressure from the difference between
measured and calculated free energy values
Even for a small capillary pressure, there may still be a significant
contribution from a V∆P term to the measured forces because of large
capillary volumes. If the difference in free energy between the force curve
integral ∫FdD and calculations of GA are accounted for by only a VΔP
term, we can estimate the capillary pressure from:
Δ𝑃 = −∫ 𝐹d𝐷−Δ𝐺𝛾𝐴
𝑉 (27)
In Paper III it was found that, when estimating the capillary pressure using
Eq. 27, only a small under pressure in the capillary (< 0.02 atm) was needed
to account for the observed differences in water and ethylene glycol.
Additionally, similar results were obtained in water for LFS-coated
superhydrophobic surfaces prepared by 2, 3 and 4 coating cycles (Paper
IV). Such a small under pressure in the capillary was judged to be
reasonable during our dynamic measurements and it provides a mechanism
for gas flow into the capillary that facilitates capillary growth.
Figure 40 shows an example of P calculated using Eq. 27 for a
measurement at an LFS-coated sample (5 coating cycles) in water. As seen

75
in Figure 40, calculations suggest that the under pressure is increasing at
large separations when the capillary is stretched out and the volume
decreases before rupture. However, this is not a reasonable scenario as it
would indicate that gas flows from a lower pressure region to a higher
pressure region. This observation instead indicates that additional free
energy contributions arising from TPCL effects need to be accounted for
to describe the measured force. The results also suggest that these effects
are particularly important at large separations when the capillary decrease
in size just before rupture (at D ≳ 25 m in Figure 40). This is further
supported by calculations for the LFS-coating prepared by 1 coating cycle,
suggesting an even larger increase in under pressure (up to 0.1 atm) with
increasing separation. In this particular case the contact angle hysteresis on
this coating is larger than for the other LFS-coatings, suggesting that TPCL
effects may play an even larger role for gas capillaries observed on this
surface.
Figure 40. Example of the capillary pressure P calculated from the
difference between ∫FdD and GA for a measurement in water.
Effects from three-phase contact lines
The results presented here suggest that effects from TPCLs may be
important when theoretically describing the total measured forces
involving super liquid-repellent surfaces. It was found that TPCL effects

76
seem to be more important for measurements involving the dip coated
superhydrophobic surface and the LFS-coating prepared with 1 coating
cycle. These observations are in line with the fact that these two surfaces
exhibit macroscopically more pinning of water, as measured by a larger
CAH (and smaller RA), as compared to the other four LFS-coatings.
During this thesis work, and in a related work [182], attempts were made
to estimate contributions from TPCLs as in pinning force and line tension.
However, it was found that while TPCL effects most likely do play a role,
calculations are challenging. One issue is to determine which contact angle
that should be used for calculations using Eqs. 18-19. When calculating the
pinning force, it could be argued that the advancing contact angle should
be used. This is because as long as the contact angle is less than the ACA,
the TPCL is pinned to the surface. As the contact angle becomes equal to
the ACA, the TPCL is moving over the surface as the capillary contracts
and the pinning force is zero. For the line tension, one approach may be to
use the receding contact angle in this case. Line tension usually manifests
as a difference between the microscopic and macroscopic (or
“equilibrium”) contact angles caused by a highly curved TPCL. However,
in this case, when the capillary is stretched out, the contact angle is forced
to change from its “equilibrium” (the contact angle when the capillary was
formed, i.e. RCA) and this change causes the tension in the TPCL. It was
found that results highly depended on the values of the macroscopic
contact angles and even small differences (sometimes only 1°) could lead
to large differences in the calculated values. Thus, I had to leave it by
concluding that TPCL effects likely are important, but calculations to
prove the point could not be done with sufficient accuracy.
Error analysis
Calculations of the theoretical forces from capillary shape may involve
errors, particularly since 2D images are used to estimate properties of a 3D
situation. First, the assumption that the capillary is perfectly axisymmetric
and that the image is recorded in the exact center, likely leads to errors in
determining e.g. capillary volume and surface areas. Additionally, due to

77
error propagation, even small errors in determining capillary
characteristics from the confocal image can lead to relatively large errors
in the calculated values. As an example, the error in calculating GA was
estimated using propagation of error analysis in Paper III. It was found that
for absolute errors as low as d = 1 µm and s = p = = 1°, will lead
to errors in GA in the order of 1 – 3 × 10-11 J for a measurement in water.
If the errors were increased to d = 2 µm and s = p = = 2°, the total
errors in GA increased to 3 – 6 × 10-11 J. In Figure 41 it can be seen how
large these errors are in relative terms.
Figure 41. Example of calculations of GA with estimation of
errors for a measurement in water. The shaded areas represent
GA+(GA) and GA-(GA) and the inner (darker) area is
calculated from errors d = 1 µm and s = p = = 1° and the
outer (lighter) from d = 2 µm and s = p = = 2°.

78

79
Chapter 5
Concluding remarks and future
perspectives
This thesis aimed to elucidate how super liquid-repellent surfaces interact
across a non-wetting liquid in order to get a more detailed understanding
of super liquid-repellence. The use of LSCM imaging in this work offered
the opportunity to study wetting characteristics at the microscale and was
essential for reaching many of the main conclusions. First, confocal
imaging successfully captured the microscopic events during AFM force
measurements between a superhydrophobic surface and a hydrophobic
microsphere in water, clearly visualizing the previously proposed events
of gas capillary formation, growth and rupture. Attractive interactions due
to capillary growth were confirmed by quantifying the capillary volume
from the shape of the capillary obtained from confocal images. Moreover,
LSCM was used to show the presence of a gaseous layer underneath the
liquid consistent with a Cassie-Baxter type of wetting state. The results
presented in this thesis support the view that this pre-existing gaseous layer
is responsible for the formation and growth of large gas capillaries at super
liquid-repellent surfaces. That the gaseous layer facilitates capillary
formation and growth was further supported by studying superhydrophobic
surfaces with different coating thicknesses. It was found that an increased
amount of available gas in the gaseous layer influenced the interactions
and allowed the capillary to grow larger during separation. In addition,

80
similarly shaped long-range capillary forces were observed in lower
surface tension liquids, provided that a gas layer was present at the surface.
Further, it was found that, due to the large amount of gas present in the
surface layer, a large capillary can form and grow even if the liquid wets
the particle surface. Finally, the capillary images allowed theoretical
calculations of the capillary interaction from the meniscus size and shape.
It was found that theoretical calculated forces can be consistent with the
measured forces. However, it was concluded that several contributions
need to be considered including effects from the three-phase contact lines.
Further, the calculations suggested an under pressure in the capillary and
this drives the gas to flow from the gaseous surface layer into the capillary,
facilitating growth during separation.
While the work presented in this thesis can hopefully contribute to the
general understanding of super liquid-repellent surfaces and how such
surfaces interacts with liquids, it also acts as a groundwork for further
studies on interactions involving super liquid-repellent surfaces. These
findings demonstrate the use of experimental techniques to visualize the
microscopic events of gas capillary formation and how the shape can be
further used for theoretical calculations. Yet, several questions need to be
further investigated in order to increase the knowledge of super liquid-
repellence and to aid future design and development of sustainable super
liquid-repellent materials. The next steps could be to perform more
systematic studies including different types of coatings, particles and
liquids. By systematically vary the contact angles of both the super liquid-
repellent surface and the colloidal probe, as well as the surface tension of
the liquid, more details on how the interactions and capillaries are affected
by the wettability of the two surfaces and the surface tension can be
investigated. It would be interesting to include studies involving model
surfaces with ordered structures such as pillars or re-entrant structures. A
challenge might be to fabricate complex structures on thin cover glass
which is necessary in order to use LSCM for visualization. However, the
use of ordered structures offers the possibility to vary different geometric
parameters such as height, spacing and liquid contact area, which can

81
contribute to the understanding of how local wetting characteristics
influence the interactions. Additionally, knowing the exact geometry
enables determination of the amount of gas present in the gaseous layer.
Finally, more studies including different systems allows for continued
investigations in theoretically describing the measured forces and the
contributions from TPCLs can be further elucidated. With these insights it
might be even possible to predict interactions between liquid-repellent
surfaces from theoretical calculations.

82

83
References
[1] H. Ollivier, "Recherches sur la capillarité," J. Phys. Theor. Appl.,
vol. 6, no. 1, pp. 757-782, 1907.
[2] C. V. Boys, Soap-bubbles: Their colors and the forces which mold
them. 1912.
[3] A. B. D. Cassie and S. Baxter, "Large contact angles of plant and
animal surfaces," Nature, vol. 155, no. 3923, pp. 21-22, 1945.
[4] G. E. Fogg, "Diurnal fluctuation in a physical property of leaf
cuticle," Nature, vol. 154, no. 3912, pp. 515-515, 1944.
[5] W. Barthlott and C. Neinhuis, "Purity of the sacred lotus, or escape
from contamination in biological surfaces," Planta, vol. 202, no.
1, pp. 1-8, 1997.
[6] T. Darmanin and F. Guittard, "Superhydrophobic and
superoleophobic properties in nature," Mater. Today, vol. 18, no.
5, pp. 273-285, 2015.
[7] K. Tsujii, T. Yamamoto, T. Onda, and S. Shibuichi, "Super oil-
repellent surfaces," Angewandte Chemie International Edition in
English, vol. 36, no. 9, pp. 1011-1012, 1997.
[8] A. Tuteja et al., "Designing superoleophobic surfaces," Science,
vol. 318, no. 5856, pp. 1618-1622, 2007.
[9] A. K. Kota, G. Kwon, and A. Tuteja, "The design and applications
of superomniphobic surfaces," NPG Asia Materials, vol. 6, no. 7,
p. e109, 2014.
[10] J. Jeevahan, M. Chandrasekaran, G. Britto Joseph, R. B. Durairaj,
and G. Mageshwaran, "Superhydrophobic surfaces: A review on
fundamentals, applications, and challenges," Journal of Coatings
Technology and Research, vol. 15, no. 2, pp. 231-250, 2018.
[11] K. Ellinas, A. Tserepi, and E. Gogolides, "Durable
superhydrophobic and superamphiphobic polymeric surfaces and
their applications: A review," Adv. Colloid Interface Sci., vol. 250,
pp. 132-157, 2017.

84
[12] X. Tian, T. Verho, and R. H. A. Ras, "Moving superhydrophobic
surfaces toward real-world applications," Science, vol. 352, no.
6282, p. 142, 2016.
[13] H. Y. Erbil, "Practical applications of superhydrophobic materials
and coatings: Problems and perspectives," Langmuir, vol. 36, no.
10, pp. 2493-2509, 2020.
[14] L. Li, B. Li, J. Dong, and J. Zhang, "Roles of silanes and silicones
in forming superhydrophobic and superoleophobic materials," J.
Mater. Chem. A, vol. 4, no. 36, pp. 13677-13725, 2016.
[15] R. C. Buck et al., "Perfluoroalkyl and polyfluoroalkyl substances
in the environment: Terminology, classification, and origins,"
Integr. Environ. Assess. Manage., vol. 7, no. 4, pp. 513-541, 2011.
[16] T. Young, "An essay on the cohesion of fluids," Philos. Trans. R.
Soc. London, vol. 95, pp. 65-87, 1805.
[17] T. Nishino, M. Meguro, K. Nakamae, M. Matsushita, and Y. Ueda,
"The lowest surface free energy based on −cf3 alignment,"
Langmuir, vol. 15, no. 13, pp. 4321-4323, 1999.
[18] H.-J. Butt, D. S. Golovko, and E. Bonaccurso, "On the derivation
of young's equation for sessile drops: Nonequilibrium effects due
to evaporation," The Journal of Physical Chemistry B, vol. 111,
no. 19, pp. 5277-5283, 2007.
[19] R. N. Wenzel, "Resistance of solid surfaces to wetting by water,"
Ind. Eng. Chem., vol. 28, no. 8, pp. 988-994, 1936.
[20] A. B. D. Cassie and S. Baxter, "Wettability of porous surfaces,"
Trans. Faraday Society, vol. 40, no. 0, pp. 546-551, 1944.
[21] H. Y. Erbil, "The debate on the dependence of apparent contact
angles on drop contact area or three-phase contact line: A review,"
Surf. Sci. Rep., vol. 69, no. 4, pp. 325-365, 2014.
[22] D. C. Pease, "The significance of the contact angle in relation to
the solid surface," J. Phys. Chem., vol. 49, no. 2, pp. 107-110,
1945.
[23] F. E. Bartell and J. W. Shepard, "The effect of surface roughness
on apparent contact angles and on contact angle hysteresis. I. The
system paraffin–water–air," J. Phys. Chem., vol. 57, no. 2, pp. 211-
215, 1953.
[24] F. E. Bartell and J. W. Shepard, "Surface roughness as related to
hysteresis of contact angles. Ii. The systems paraffin–3 molar
calcium chloride solution–air and paraffin–glycerol–air," J. Phys.
Chem., vol. 57, no. 4, pp. 455-458, 1953.

85
[25] C. W. Extrand, "Contact angles and hysteresis on surfaces with
chemically heterogeneous islands," Langmuir, vol. 19, no. 9, pp.
3793-3796, 2003.
[26] L. Gao and T. J. McCarthy, "How wenzel and cassie were wrong,"
Langmuir, vol. 23, no. 7, pp. 3762-3765, 2007.
[27] A. Marmur, C. Della Volpe, S. Siboni, A. Amirfazli, and J. W.
Drelich, "Contact angles and wettability: Towards common and
accurate terminology," Surface Innovations, vol. 5, no. 1, pp. 3-8,
2017.
[28] M. Ma and R. M. Hill, "Superhydrophobic surfaces," Curr. Opin.
Colloid Interface Sci., vol. 11, no. 4, pp. 193-202, 2006.
[29] C. Dorrer and J. Rühe, "Some thoughts on superhydrophobic
wetting," Soft Matter, vol. 5, no. 1, pp. 51-61, 2009.
[30] P. Roach, N. J. Shirtcliffe, and M. I. Newton, "Progess in
superhydrophobic surface development," Soft Matter, vol. 4, no.
2, pp. 224-240, 2008.
[31] H. J. Butt, I. V. Roisman, M. Brinkmann, P. Papadopoulos, D.
Vollmer, and C. Semprebon, "Characterization of super liquid-
repellent surfaces," Curr. Opin. Colloid Interface Sci., vol. 19, no.
4, pp. 343-354, 2014.
[32] F. Schellenberger, N. Encinas, D. Vollmer, and H.-J. Butt, "How
water advances on superhydrophobic surfaces," Phys. Rev. Lett.,
vol. 116, no. 9, p. 096101, 2016.
[33] J. T. Korhonen, T. Huhtamäki, O. Ikkala, and R. H. A. Ras,
"Reliable measurement of the receding contact angle," Langmuir,
vol. 29, no. 12, pp. 3858-3863, 2013.
[34] X. J. Feng and L. Jiang, "Design and creation of
superwetting/antiwetting surfaces," Adv. Mater., vol. 18, no. 23,
pp. 3063-3078, 2006.
[35] Z. Chu and S. Seeger, "Superamphiphobic surfaces," Chem. Soc.
Rev., vol. 43, no. 8, pp. 2784-2798, 2014.
[36] A. Tuteja, W. Choi, J. M. Mabry, G. H. McKinley, and R. E.
Cohen, "Robust omniphobic surfaces," Proc. Natl. Acad. Sci.
U.S.A., vol. 105, no. 47, pp. 18200-18205, 2008.
[37] A. Marmur, "From hygrophilic to superhygrophobic: Theoretical
conditions for making high-contact-angle surfaces from low-
contact-angle materials," Langmuir, vol. 24, no. 14, pp. 7573-
7579, 2008.

86
[38] A. Marmur, "Hydro- hygro- oleo- omni-phobic? Terminology of
wettability classification," Soft Matter, vol. 8, no. 26, pp. 6867-
6870, 2012.
[39] A. Ahuja et al., "Nanonails: A simple geometrical approach to
electrically tunable superlyophobic surfaces," Langmuir, vol. 24,
no. 1, pp. 9-14, 2008.
[40] Z. Wang, L. Yuan, L. Wang, and T. Wu, "Stretchable
superlyophobic surfaces for nearly- lossless droplet transfer,"
Sensors Actuators B: Chem., vol. 244, pp. 649-654, 2017.
[41] X. Gou and Z. Guo, "Surface topographies of biomimetic
superamphiphobic materials: Design criteria, fabrication and
performance," Adv. Colloid Interface Sci., vol. 269, pp. 87-121,
2019.
[42] J. Yong, F. Chen, Q. Yang, J. Huo, and X. Hou, "Superoleophobic
surfaces," Chem. Soc. Rev., vol. 46, no. 14, pp. 4168-4217, 2017.
[43] H. Kim, H. Han, S. Lee, J. Woo, J. Seo, and T. Lee,
"Nonfluorinated superomniphobic surfaces through shape-tunable
mushroom-like polymeric micropillar arrays," ACS Appl. Mater.
Interfaces, vol. 11, no. 5, pp. 5484-5491, 2019.
[44] T. L. Liu and C.-J. C. Kim, "Turning a surface superrepellent even
to completely wetting liquids," Science, vol. 346, no. 6213, pp.
1096-1100, 2014.
[45] R. Helbig, J. Nickerl, C. Neinhuis, and C. Werner, "Smart skin
patterns protect springtails," PLOS ONE, vol. 6, no. 9, p. e25105,
2011.
[46] Y. T. Cheng, D. E. Rodak, C. A. Wong, and C. A. Hayden, "Effects
of micro- and nano-structures on the self-cleaning behaviour of
lotus leaves," Nanotechnology, vol. 17, no. 5, pp. 1359-1362,
2006.
[47] A. Lafuma and D. Quéré, "Superhydrophobic states," Nature
Materials, vol. 2, p. 457, 2003.
[48] R. Hensel et al., "Wetting resistance at its topographical limit: The
benefit of mushroom and serif t structures," Langmuir, vol. 29, no.
4, pp. 1100-1112, 2013.
[49] J. R. Panter, Y. Gizaw, and H. Kusumaatmaja, "Multifaceted
design optimization for superomniphobic surfaces," Science
Advances, vol. 5, no. 6, p. 11, 2019.
[50] H. Zhao, K.-Y. Law, and V. Sambhy, "Fabrication, surface
properties, and origin of superoleophobicity for a model textured
surface," Langmuir, vol. 27, no. 10, pp. 5927-5935, 2011.

87
[51] C. Y. Yan, P. Jiang, X. Jia, and X. L. Wang, "3d printing of
bioinspired textured surfaces with superamphiphobicity,"
Nanoscale, vol. 12, no. 5, pp. 2924-2938, 2020.
[52] X. Liu et al., "3d printing of bioinspired liquid superrepellent
structures," Adv. Mater., vol. 30, no. 22, p. e1800103, 2018.
[53] R. Das, Z. Ahmad, J. Nauruzbayeva, and H. Mishra, "Biomimetic
coating-free superomniphobicity," Scientific Reports, vol. 10, no.
1, p. 12, 2020.
[54] H. Teisala and H.-J. Butt, "Hierarchical structures for
superhydrophobic and superoleophobic surfaces," Langmuir, vol.
35, no. 33, pp. 10689-10703, 2019.
[55] J. Groten and J. Rühe, "Surfaces with combined microscale and
nanoscale structures: A route to mechanically stable
superhydrophobic surfaces?," Langmuir, vol. 29, no. 11, pp. 3765-
3772, 2013.
[56] D. Wang et al., "Design of robust superhydrophobic surfaces,"
Nature, vol. 582, no. 7810, pp. 55-59, 2020.
[57] T. Verho, C. Bower, P. Andrew, S. Franssila, O. Ikkala, and R. H.
A. Ras, "Mechanically durable superhydrophobic surfaces," Adv.
Mater., vol. 23, no. 5, pp. 673-678, 2011.
[58] H. Teisala et al., "Ultrafast processing of hierarchical nanotexture
for a transparent superamphiphobic coating with extremely low
roll-off angle and high impalement pressure," Adv. Mater., p.
1706529, 2018.
[59] K. Golovin, D. H. Lee, J. M. Mabry, and A. Tuteja, "Transparent,
flexible, superomniphobic surfaces with ultra-low contact angle
hysteresis," Angew. Chem. Int. Ed. Engl., vol. 52, no. 49, pp.
13007-11, 2013.
[60] X. Deng, L. Mammen, H.-J. Butt, and D. Vollmer, "Candle soot as
a template for a transparent robust superamphiphobic coating,"
Science, vol. 335, no. 6064, pp. 67-70, 2012.
[61] H. Vahabi, W. Wang, S. Movafaghi, and A. K. Kota, "Free-
standing, flexible, superomniphobic films," ACS Appl. Mater.
Interfaces, vol. 8, no. 34, pp. 21962-7, 2016.
[62] J. Zhang and S. Seeger, "Superoleophobic coatings with ultralow
sliding angles based on silicone nanofilaments," Angew. Chem.
Int. Ed. Engl., vol. 50, no. 29, pp. 6652-6, 2011.
[63] F. Geyer, C. Schönecker, H. J. Butt, and D. Vollmer, "Enhancing
co2 capture using robust superomniphobic membranes," Adv.
Mater., vol. 29, no. 5, p. 1603524, 2017.

88
[64] M. Tuominen et al., "Superamphiphobic overhang structured
coating on a biobased material," Appl. Surf. Sci., vol. 389, pp. 135-
143, 2016.
[65] H. Zhou, H. Wang, H. Niu, A. Gestos, and T. Lin, "Robust, self-
healing superamphiphobic fabrics prepared by two-step coating of
fluoro-containing polymer, fluoroalkyl silane, and modified silica
nanoparticles," Adv. Funct. Mater., vol. 23, no. 13, pp. 1664-1670,
2013.
[66] W. Wang, R. Liu, H. Chi, T. Zhang, Z. Xu, and Y. Zhao, "Durable
superamphiphobic and photocatalytic fabrics: Tackling the loss of
super-non-wettability due to surface organic contamination," ACS
Appl. Mater. Interfaces, vol. 11, no. 38, pp. 35327-35332, 2019.
[67] S. Movafaghi et al., "Superomniphobic papers for on-paper ph
sensors," Advanced Materials Interfaces, vol. 6, no. 13, p.
1900232, 2019.
[68] L. Jiang, Z. Tang, R. M. Clinton, V. Breedveld, and D. W. Hess,
"Two-step process to create “roll-off” superamphiphobic paper
surfaces," ACS Appl. Mater. Interfaces, vol. 9, no. 10, pp. 9195-
9203, 2017.
[69] T. P. Nguyen, R. Boukherroub, V. Thomy, and Y. Coffinier,
"Micro-and nanostructured silicon-based superomniphobic
surfaces," J. Colloid Interface Sci., vol. 416, pp. 280-8, 2014.
[70] X. Li, D. Wang, Y. Tan, J. Yang, and X. Deng, "Designing
transparent micro/nano re-entrant-coordinated superamphiphobic
surfaces with ultralow solid/liquid adhesion," ACS Appl. Mater.
Interfaces, vol. 11, no. 32, pp. 29458-29465, 2019.
[71] A. Pendurthi, S. Movafaghi, W. Wang, S. Shadman, A. P. Yalin,
and A. K. Kota, "Fabrication of nanostructured omniphobic and
superomniphobic surfaces with inexpensive co2 laser engraver,"
ACS Appl. Mater. Interfaces, vol. 9, no. 31, pp. 25656-25661,
2017.
[72] W. Fan, J. Qian, F. Bai, Y. Li, C. Wang, and Q.-Z. Zhao, "A facile
method to fabricate superamphiphobic polytetrafluoroethylene
surface by femtosecond laser pulses," Chem. Phys. Lett., vol. 644,
pp. 261-266, 2016.
[73] L. Cao, T. P. Price, M. Weiss, and D. Gao, "Super water- and oil-
repellent surfaces on intrinsically hydrophilic and oleophilic
porous silicon films," Langmuir, vol. 24, no. 5, pp. 1640-3, 2008.
[74] R. T. Rajendra Kumar, K. B. Mogensen, and P. Bøggild, "Simple
approach to superamphiphobic overhanging silicon
89
nanostructures," The Journal of Physical Chemistry C, vol. 114,
no. 7, pp. 2936-2940, 2010.
[75] S. Movafaghi, W. Wang, A. Metzger, D. D. Williams, J. D.
Williams, and A. K. Kota, "Tunable superomniphobic surfaces for
sorting droplets by surface tension," Lab on a Chip -
Miniaturisation for Chemistry and Biology, vol. 16, no. 17, pp.
3204-3209, 2016.
[76] S. Barthwal, Y. S. Kim, and S.-H. Lim, "Mechanically robust
superamphiphobic aluminum surface with nanopore-embedded
microtexture," Langmuir, vol. 29, no. 38, pp. 11966-11974, 2013.
[77] J. N. Israelachvili, Intermolecular and surface forces, third ed.
Academic Press, 2011.
[78] J. Israelachvili and R. Pashley, "The hydrophobic interaction is
long range, decaying exponentially with distance," Nature, vol.
300, no. 5890, pp. 341-342, 1982.
[79] J. N. Israelachvili and R. M. Pashley, "Measurement of the
hydrophobic interaction between two hydrophobic surfaces in
aqueous electrolyte solutions," J. Colloid Interface Sci., vol. 98,
no. 2, pp. 500-514, 1984.
[80] H. K. Christenson and P. M. Claesson, "Cavitation and the
interaction between macroscopic hydrophobic surfaces," Science,
vol. 239, no. 4838, pp. 390-392, 1988.
[81] P. M. Claesson, C. E. Blom, P. C. Herder, and B. W. Ninham,
"Interactions between water—stable hydrophobic langmuir—
blodgett monolayers on mica," J. Colloid Interface Sci., vol. 114,
no. 1, pp. 234-242, 1986.
[82] P. M. Claesson and H. K. Christenson, "Very long range attractive
forces between uncharged hydrocarbon and fluorocarbon surfaces
in water," J. Phys. Chem., vol. 92, no. 6, pp. 1650-1655, 1988.
[83] R. M. Pashley, P. M. McGuiggan, B. W. Ninham, and D. F. Evans,
"Attractive forces between uncharged hydrophobic surfaces:
Direct measurements in aqueous solution," Science, vol. 229, no.
4718, p. 1088, 1985.
[84] Y. I. Rabinovich and B. V. Derjaguin, "Interaction of
hydrophobized filaments in aqueous electrolyte solutions," ColSu,
vol. 30, no. 3, pp. 243-251, 1988.
[85] J. L. Parker and P. M. Claesson, "Forces between hydrophobic
silanated glass surfaces," Langmuir, vol. 10, no. 3, pp. 635-639,
1994.

90
[86] H. K. Christenson, P. M. Claesson, J. Berg, and P. C. Herder,
"Forces between fluorocarbon surfactant monolayers: Salt effects
on the hydrophobic interaction," J. Phys. Chem., vol. 93, no. 4, pp.
1472-1478, 1989.
[87] H. K. Christenson, J. Fang, B. W. Ninham, and J. L. Parker, "Effect
of divalent electrolyte on the hydrophobic attraction," J. Phys.
Chem., vol. 94, no. 21, pp. 8004-8006, 1990.
[88] K. Kurihara and T. Kunitake, "Submicron-range attraction
between hydrophobic surfaces of monolayer-modified mica in
water," J. Am. Chem. Soc., vol. 114, no. 27, pp. 10927-10933,
1992.
[89] Y. H. Tsao, S. X. Yang, D. F. Evans, and H. Wennerstroem,
"Interactions between hydrophobic surfaces. Dependence on
temperature and alkyl chain length," Langmuir, vol. 7, no. 12, pp.
3154-3159, 1991.
[90] B. V. Derjaguin and N. V. Churaev, "The current state of the
theory of long-range surface forces," Prog. Surf. Sci., vol. 40, no.
1, pp. 272-285, 1992.
[91] J. C. Eriksson, S. Ljunggren, and P. M. Claesson, "A
phenomenological theory of long-range hydrophobic attraction
forces based on a square-gradient variational approach," Journal
of the Chemical Society, Faraday Transactions 2: Molecular and
Chemical Physics, vol. 85, no. 3, pp. 163-176, 1989.
[92] O. I. Vinogradova, "Drainage of a thin liquid film confined
between hydrophobic surfaces," Langmuir, vol. 11, no. 6, pp.
2213-2220, 1995.
[93] E. Ruckenstein, "The instability of the solid–liquid interface and
the hydrophobic force," J. Colloid Interface Sci., vol. 188, no. 1,
pp. 218-223, 1997.
[94] V. V. Yaminsky, B. W. Ninham, H. K. Christenson, and R. M.
Pashley, "Adsorption forces between hydrophobic monolayers,"
Langmuir, vol. 12, no. 8, pp. 1936-1943, 1996.
[95] D. R. Evans, V. S. J. Craig, and T. J. Senden, "The hydrophobic
force: Nanobubbles or polymeric contaminant?," Physica A:
Statistical Mechanics and its Applications, vol. 339, no. 1, pp. 101-
105, 2004.
[96] J. L. Parker, P. M. Claesson, and P. Attard, "Bubbles, cavities, and
the long-ranged attraction between hydrophobic surfaces," J. Phys.
Chem., vol. 98, no. 34, pp. 8468-8480, 1994.

91
[97] A. Carambassis, L. C. Jonker, P. Attard, and M. W. Rutland,
"Forces measured between hydrophobic surfaces due to a
submicroscopic bridging bubble," Phys. Rev. Lett., vol. 80, no. 24,
pp. 5357-5360, 1998.
[98] H. K. Christenson and P. M. Claesson, "Direct measurements of
the force between hydrophobic surfaces in water," Adv. Colloid
Interface Sci., vol. 91, no. 3, pp. 391-436, 2001.
[99] E. E. Meyer, K. J. Rosenberg, and J. Israelachvili, "Recent
progress in understanding hydrophobic interactions," Proc. Natl.
Acad. Sci. U.S.A., vol. 103, no. 43, pp. 15739-15746, 2006.
[100] E. Thormann, A. C. Simonsen, P. L. Hansen, and O. G. Mouritsen,
"Force trace hysteresis and temperature dependence of bridging
nanobubble induced forces between hydrophobic surfaces," ACS
Nano, vol. 2, no. 9, pp. 1817-24, 2008.
[101] N. Ishida, M. Sakamoto, M. Miyahara, and K. Higashitani,
"Optical observation of gas bridging between hydrophobic
surfaces in water," J. Colloid Interface Sci., vol. 253, no. 1, pp.
112-6, 2002.
[102] H. Stevens, R. F. Considine, C. J. Drummond, R. A. Hayes, and P.
Attard, "Effects of degassing on the long-range attractive force
between hydrophobic surfaces in water," Langmuir, vol. 21, no.
14, pp. 6399-405, 2005.
[103] L. Meagher and V. S. J. Craig, "Effect of dissolved gas and salt on
the hydrophobic force between polypropylene surfaces,"
Langmuir, vol. 10, no. 8, pp. 2736-2742, 1994.
[104] E. E. Meyer, Q. Lin, and J. N. Israelachvili, "Effects of dissolved
gas on the hydrophobic attraction between surfactant-coated
surfaces," Langmuir, vol. 21, no. 1, pp. 256-259, 2005.
[105] M. Azadi, A. V. Nguyen, and G. E. Yakubov, "Attractive forces
between hydrophobic solid surfaces measured by afm on the first
approach in salt solutions and in the presence of dissolved gases,"
Langmuir, vol. 31, no. 6, pp. 1941-1949, 2015.
[106] S. Singh, J. Houston, F. van Swol, and C. J. Brinker,
"Superhydrophobicity: Drying transition of confined water,"
Nature, vol. 442, no. 7102, pp. 526-526, 2006.
[107] P. M. Hansson, A. Swerin, J. Schoelkopf, P. A. C. Gane, and E.
Thormann, "Influence of surface topography on the interactions
between nanostructured hydrophobic surfaces," Langmuir, vol. 28,
no. 21, pp. 8026-8034, 2012.

92
[108] B. D. Brandner et al., "Solvent segregation and capillary
evaporation at a superhydrophobic surface investigated by
confocal raman microscopy and force measurements," Soft Matter,
vol. 7, no. 3, pp. 1045-1052, 2011.
[109] M. Wåhlander, P. M. Hansson-Mille, and A. Swerin,
"Superhydrophobicity: Cavity growth and wetting transition," J.
Colloid Interface Sci., vol. 448, pp. 482-491, 2015.
[110] F. M. Orr, L. E. Scriven, and A. P. Rivas, "Pendular rings between
solids: Meniscus properties and capillary force," J. Fluid Mech.,
vol. 67, no. 4, pp. 723-742, 1975.
[111] L. R. Fisher and J. N. Israelachvili, "Direct measurement of the
effect of meniscus forces on adhesion: A study of the applicability
of macroscopic thermodynamics to microscopic liquid interfaces,"
ColSu, vol. 3, no. 4, pp. 303-319, 1981.
[112] E. J. De Souza, L. Gao, T. J. McCarthy, E. Arzt, and A. J. Crosby,
"Effect of contact angle hysteresis on the measurement of capillary
forces," Langmuir, vol. 24, no. 4, pp. 1391-1396, 2008.
[113] H.-J. Butt and M. Kappl, "Normal capillary forces," Adv. Colloid
Interface Sci., vol. 146, no. 1, pp. 48-60, 2009.
[114] H. Chen, A. Amirfazli, and T. Tang, "Modeling liquid bridge
between surfaces with contact angle hysteresis," Langmuir, vol.
29, no. 10, pp. 3310-3319, 2013.
[115] M. Dörmann and H.-J. Schmid, "Simulation of capillary bridges
between particles," Procedia Engineering, vol. 102, pp. 14-23,
2015.
[116] N. P. Kruyt and O. Millet, "An analytical theory for the capillary
bridge force between spheres," J. Fluid Mech., vol. 812, pp. 129-
151, 2016.
[117] V. V. Yaminsky, V. S. Yushchenko, E. A. Amelina, and E. D.
Shchukin, "Cavity formation due to a contact between particles in
a nonwetting liquid," J. Colloid Interface Sci., vol. 96, no. 2, pp.
301-306, 1983.
[118] V. S. Yushchenko, V. V. Yaminsky, and E. D. Shchukin,
"Interaction between particles in a nonwetting liquid," J. Colloid
Interface Sci., vol. 96, no. 2, pp. 307-314, 1983.
[119] B. Y. Rubinstein and L. G. Fel, "Theory of axisymmetric pendular
rings," J. Colloid Interface Sci., vol. 417, pp. 37-50, 2014.
[120] Y. Tang and S. Cheng, "The meniscus on the outside of a circular
cylinder: From microscopic to macroscopic scales," J. Colloid
Interface Sci., vol. 533, pp. 401-408, 2019.

93
[121] D. F. James, "The meniscus on the outside of a small circular
cylinder," J. Fluid Mech., vol. 63, no. 4, pp. 657-664, 1974.
[122] L. L. Lo, "The meniscus on a needle – a lesson in matching," J.
Fluid Mech., vol. 132, pp. 65-78, 1983.
[123] P. A. Kralchevsky, I. B. Ivanov, and A. D. Nikolov, "Film and line
tension effects on the attachment of particles to an interface: Ii.
Shapes of the bubble (drop) and the external meniscus," J. Colloid
Interface Sci., vol. 112, no. 1, pp. 108-121, 1986.
[124] B. V. Derjaguin, "Theory of the distortion of a plane surface of a
liquid by small objects and its application to the measurement of
the contact angle of thin filaments and fibres," Dokl. Akad. Nauk
SSSR, vol. 51, p. 517, 1946.
[125] F. Schellenberger, P. Papadopoulos, M. Kappl, S. A. L. Weber, D.
Vollmer, and H.-J. Butt, "Detaching microparticles from a liquid
surface," Phys. Rev. Lett., vol. 121, no. 4, p. 048002, 2018.
[126] E. Thormann, "Surface forces between rough and topographically
structured interfaces," Curr. Opin. Colloid Interface Sci., vol. 27,
pp. 18-24, 2017.
[127] P. M. Hansson et al., "Effect of surface depressions on wetting and
interactions between hydrophobic pore array surfaces," Langmuir,
vol. 28, no. 30, pp. 11121-11130, 2012.
[128] P. Petrov, U. Olsson, and H. Wennerström, "Surface forces in
bicontinuous microemulsions: Water capillary condensation and
lamellae formation," Langmuir, vol. 13, no. 13, pp. 3331-3337,
1997.
[129] A. Amirfazli and A. W. Neumann, "Status of the three-phase line
tension: A review," Adv. Colloid Interface Sci., vol. 110, no. 3, pp.
121-141, 2004.
[130] B. M. Law et al., "Line tension and its influence on droplets and
particles at surfaces," Prog. Surf. Sci., vol. 92, no. 1, pp. 1-39,
2017.
[131] L. Boruvka and A. W. Neumann, "Generalization of the classical
theory of capillarity," The Journal of Chemical Physics, vol. 66,
no. 12, pp. 5464-5476, 1977.
[132] P. M. Winkler, R. L. McGraw, P. S. Bauer, C. Rentenberger, and
P. E. Wagner, "Direct determination of three-phase contact line
properties on nearly molecular scale," Scientific Reports, vol. 6,
no. 1, p. 26111, 2016.

94
[133] J. Drelich, "The significance and magnitude of the line tension in
three-phase (solid-liquid-fluid) systems," Colloids Surf.
Physicochem. Eng. Aspects, vol. 116, no. 1, pp. 43-54, 1996.
[134] M. A. Sarshar, Y. Jiang, W. Xu, and C.-H. Choi, "Depinning force
of a receding droplet on pillared superhydrophobic surfaces:
Analytical models," J. Colloid Interface Sci., vol. 543, pp. 122-
129, 2019.
[135] W. Xu and C.-H. Choi, "From sticky to slippery droplets:
Dynamics of contact line depinning on superhydrophobic
surfaces," Phys. Rev. Lett., vol. 109, no. 2, p. 024504, 2012.
[136] H. Zhang, S. Chen, Z. Guo, Y. Liu, F. Bresme, and X. Zhang,
"Contact line pinning effects influence determination of the line
tension of droplets adsorbed on substrates," The Journal of
Physical Chemistry C, vol. 122, no. 30, pp. 17184-17189, 2018.
[137] G. Heydari, E. Thormann, M. Järn, E. Tyrode, and P. M. Claesson,
"Hydrophobic surfaces: Topography effects on wetting by
supercooled water and freezing delay," J. Phys. Chem. C, vol. 117,
no. 42, pp. 21752-21762, 2013.
[138] J. M. Mäkelä et al., "Nanoparticle deposition from liquid flame
spray onto moving roll-to-roll paperboard material," Aerosol Sci.
Technol., vol. 45, no. 7, pp. 827-837, 2011.
[139] H. Teisala et al., "Development of superhydrophobic coating on
paperboard surface using the liquid flame spray," Surf. Coat.
Technol., vol. 205, no. 2, pp. 436-445, 2010.
[140] J. Haapanen et al., "Binary tio2/sio2 nanoparticle coating for
controlling the wetting properties of paperboard," Mater. Chem.
Phys., vol. 149-150, pp. 230-237, 2015.
[141] H. Teisala et al., "Nanostructures increase water droplet adhesion
on hierarchically rough superhydrophobic surfaces," Langmuir,
vol. 28, no. 6, pp. 3138-45, 2012.
[142] A. Fujishima, T. N. Rao, and D. A. Tryk, "Titanium dioxide
photocatalysis," Journal of Photochemistry and Photobiology C:
Photochemistry Reviews, vol. 1, no. 1, pp. 1-21, 2000.
[143] K. Nakata and A. Fujishima, "Tio2 photocatalysis: Design and
applications," Journal of Photochemistry and Photobiology C:
Photochemistry Reviews, vol. 13, no. 3, pp. 169-189, 2012.
[144] L. Gao and T. J. McCarthy, "Contact angle hysteresis explained,"
Langmuir, vol. 22, no. 14, pp. 6234-6237, 2006.
[145] T. Huhtamäki, X. Tian, J. T. Korhonen, and R. H. A. Ras,
"Surface-wetting characterization using contact-angle

95
measurements," Nature Protocols, vol. 13, no. 7, pp. 1521-1538,
2018.
[146] M. Vuckovac, M. Latikka, K. Liu, T. Huhtamäki, and R. H. A.
Ras, "Uncertainties in contact angle goniometry," Soft Matter, vol.
15, no. 35, pp. 7089-7096, 2019.
[147] S. Srinivasan, G. H. McKinley, and R. E. Cohen, "Assessing the
accuracy of contact angle measurements for sessile drops on
liquid-repellent surfaces," Langmuir, vol. 27, no. 22, pp. 13582-
13589, 2011.
[148] K. Liu, M. Vuckovac, M. Latikka, T. Huhtamäki, and R. H. A.
Ras, "Improving surface-wetting characterization," Science, vol.
363, no. 6432, pp. 1147-1148, 2019.
[149] P. Papadopoulos et al., "Wetting on the microscale: Shape of a
liquid drop on a microstructured surface at different length scales,"
Langmuir, vol. 28, no. 22, pp. 8392-8398, 2012.
[150] P. Papadopoulos, L. Mammen, X. Deng, D. Vollmer, and H.-J.
Butt, "How superhydrophobicity breaks down," Proc. Natl. Acad.
Sci. U.S.A., vol. 110, no. 9, pp. 3254-3258, 2013.
[151] C. Luo et al., "Direct three-dimensional imaging of the buried
interfaces between water and superhydrophobic surfaces," Angew.
Chem. Int. Ed. Engl., vol. 49, no. 48, pp. 9145-8, 2010.
[152] G. Binnig, C. F. Quate, and C. Gerber, "Atomic force microscope,"
Phys. Rev. Lett., vol. 56, no. 9, pp. 930-933, 1986.
[153] B. Cappella and G. Dietler, "Force-distance curves by atomic force
microscopy," Surf. Sci. Rep., vol. 34, no. 1, pp. 1-104, 1999.
[154] T. J. Senden, "Force microscopy and surface interactions," Curr.
Opin. Colloid Interface Sci., vol. 6, no. 2, pp. 95-101, 2001.
[155] H. J. Butt, B. Cappella, and M. Kappl, "Force measurements with
the atomic force microscope: Technique, interpretation and
applications," Surf. Sci. Rep., vol. 59, no. 1-6, pp. 1-152, 2005.
[156] J. P. Cleveland, S. Manne, D. Bocek, and P. K. Hansma, "A
nondestructive method for determining the spring constant of
cantilevers for scanning force microscopy," Rev. Sci. Instrum., vol.
64, no. 2, pp. 403-405, 1993.
[157] C. T. Gibson, G. S. Watson, and S. Myhra, "Determination of the
spring constants of probes for force microscopy/spectroscopy,"
Nanotechnology, vol. 7, no. 3, pp. 259-262, 1996.
[158] J. E. Sader, J. W. M. Chon, and P. Mulvaney, "Calibration of
rectangular atomic force microscope cantilevers," Rev. Sci.
Instrum., vol. 70, no. 10, pp. 3967-3969, 1999.
96
[159] W. A. Ducker, T. J. Senden, and R. M. Pashley, "Direct
measurement of colloidal forces using an atomic force
microscope," Nature, vol. 353, no. 6341, pp. 239-241, 1991.
[160] H. J. Butt, "Measuring electrostatic, van der waals, and hydration
forces in electrolyte solutions with an atomic force microscope,"
Biophys. J., vol. 60, no. 6, pp. 1438-1444, 1991.
[161] J. Pawley, Handbook of biological confocal microscopy. Springer
Science & Business Media, 2006.
[162] D. B. Hovis and A. H. Heuer, "The use of laser scanning confocal
microscopy (lscm) in materials science," JMic, vol. 240, no. 3, pp.
173-180, 2010.
[163] X. Teng, F. Li, and C. Lu, "Visualization of materials using the
confocal laser scanning microscopy technique," Chem. Soc. Rev.,
vol. 49, no. 8, pp. 2408-2425, 2020.
[164] M. Minsky, "Memoir on inventing the confocal scanning
microscope," Scanning, vol. 10, no. 4, pp. 128-138, 1988.
[165] K. Carlsson, P. E. Danielsson, R. Lenz, A. Liljeborg, L. Majlöf,
and N. Åslund, "Three-dimensional microscopy using a confocal
laser scanning microscope," Opt. Lett., vol. 10, no. 2, pp. 53-55,
1985.
[166] J. G. White and W. B. Amos, "Confocal microscopy comes of
age," Nature, vol. 328, no. 6126, pp. 183-184, 1987.
[167] W. B. Amos and J. G. White, "How the confocal laser scanning
microscope entered biological research," Biol. Cell, vol. 95, no. 6,
pp. 335-342, 2003.
[168] F. Schellenberger et al., "Direct observation of drops on slippery
lubricant-infused surfaces," Soft Matter, vol. 11, no. 38, pp. 7617-
7626, 2015.
[169] F. Geyer et al., "When and how self-cleaning of superhydrophobic
surfaces works," Science Advances, vol. 6, no. 3, p. eaaw9727,
2020.
[170] W. S. Y. Wong et al., "Microdroplet contaminants: When and why
superamphiphobic surfaces are not self-cleaning," ACS Nano, vol.
14, no. 4, pp. 3836-3846, 2020.
[171] J. T. Pham, F. Schellenberger, M. Kappl, and H.-J. Butt, "From
elasticity to capillarity in soft materials indentation," Phys. Rev.
Mater., vol. 1, no. 1, p. 015602, 2017.
[172] G. Vazquez, E. Alvarez, and J. M. Navaza, "Surface tension of
alcohol + water from 20 to 50 °c," J. Chem. Eng. Data, vol. 40, no.
3, pp. 611-614, 1995.

97
[173] T. Ederth and B. Liedberg, "Influence of wetting properties on the
long-range “hydrophobic” interaction between self-assembled
alkylthiolate monolayers," Langmuir, vol. 16, no. 5, pp. 2177-
2184, 2000.
[174] Y. Soga, H. Imanaka, K. Imamura, and N. Ishida, "Effect of
surface hydrophobicity on short-range hydrophobic attraction
between silanated silica surfaces," Adv. Powder Technol., vol. 26,
no. 6, pp. 1729-1733, 2015.
[175] P. M. Hansson et al., "Hydrophobic pore array surfaces: Wetting
and interaction forces in water/ethanol mixtures," J. Colloid
Interface Sci., vol. 396, pp. 278-286, 2013.
[176] N. Ishida, M. Sakamoto, M. Miyahara, and K. Higashitani,
"Attraction between hydrophobic surfaces with and without gas
phase," Langmuir, vol. 16, no. 13, pp. 5681-5687, 2000.
[177] M. A. Hampton and A. V. Nguyen, "Nanobubbles and the
nanobubble bridging capillary force," Adv. Colloid Interface Sci.,
vol. 154, no. 1, pp. 30-55, 2010.
[178] H. Wennerström, "Influence of dissolved gas on the interaction
between hydrophobic surfaces in water," The Journal of Physical
Chemistry B, vol. 107, no. 50, pp. 13772-13773, 2003.
[179] D. L. Wise and G. Houghton, "The diffusion coefficients of ten
slightly soluble gases in water at 10–60°c," Chem. Eng. Sci., vol.
21, no. 11, pp. 999-1010, 1966.
[180] C. Lee and C. Kim, "Wetting and active dewetting processes of
hierarchically constructed superhydrophobic surfaces fully
immersed in water," JMemS, vol. 21, no. 3, pp. 712-720, 2012.
[181] H. H. Uhlig, "The solubilities of gases and surface tension," J.
Phys. Chem., vol. 41, no. 9, pp. 1215-1226, 1937.
[182] M. Eriksson and A. Swerin, "Forces at superhydrophobic and
superamphiphobic surfaces," Curr. Opin. Colloid Interface Sci.,
vol. 47, pp. 46-57, 2020.