Southwark
Housing Requirements Study 2008
Sub-area Report: Nunhead and Peckham Rye
June 2009
Southwark Housing Requirements Study 2008
Page 2
Opinion Research Services The Strand, Swansea SA1 1AF
Jonathan Lee
Nigel Moore · Catherine Nock · Hugo Marchant · Lucas Daly
enquiries 01792 535300 · [email protected] · www.ors.org.uk
© Copyright June 2009
London Borough of Southwark Regeneration & Neighbourhoods, 9 Larcom Street,
London SE6 4SW
Linda Green (Policy Adviser) [email protected]
enquiries 020 7525 7786
Page 3
Contents
Chapter 1: The Study Context ................................................................................................................. 5
Chapter 2: Housing Market Drivers ......................................................................................................... 7
Local Population .................................................................................................................................... 7
Incomes and Earnings............................................................................................................................ 9
Health .................................................................................................................................................. 10
Car and Bicycle Ownership .................................................................................................................. 11
Chapter 3: Existing Housing Stock ......................................................................................................... 13
Property Type and Age ........................................................................................................................ 13
Problems with Condition of Stock ....................................................................................................... 14
Housing Tenure ................................................................................................................................... 16
Overcrowding and Under-occupation ................................................................................................. 17
Satisfaction with Home ....................................................................................................................... 18
Want to Move ..................................................................................................................................... 19
Chapter 4: Unsuitably Housed Existing Households ............................................................................... 21
Identifying Unsuitably Housed Households ........................................................................................ 21
Established Households Living in Unsuitable Housing ........................................................................ 22

Page 5
Chapter 1: The Study Context
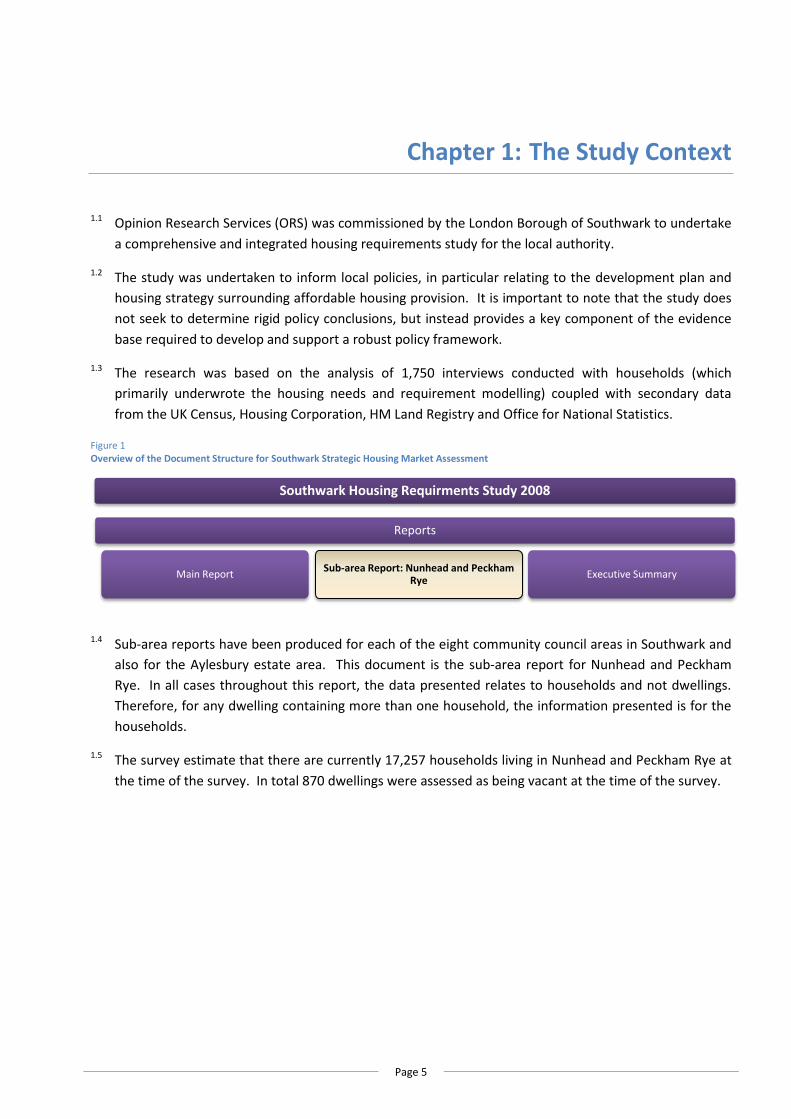
1.1 Opinion Research Services (ORS) was commissioned by the London Borough of Southwark to undertake
a comprehensive and integrated housing requirements study for the local authority.
1.2 The study was undertaken to inform local policies, in particular relating to the development plan and
housing strategy surrounding affordable housing provision. It is important to note that the study does
not seek to determine rigid policy conclusions, but instead provides a key component of the evidence
base required to develop and support a robust policy framework.
1.3 The research was based on the analysis of 1,750 interviews conducted with households (which
primarily underwrote the housing needs and requirement modelling) coupled with secondary data
from the UK Census, Housing Corporation, HM Land Registry and Office for National Statistics.
Figure 1 Overview of the Document Structure for Southwark Strategic Housing Market Assessment
1.4 Sub-area reports have been produced for each of the eight community council areas in Southwark and
also for the Aylesbury estate area. This document is the sub-area report for Nunhead and Peckham
Rye. In all cases throughout this report, the data presented relates to households and not dwellings.
Therefore, for any dwelling containing more than one household, the information presented is for the
households.
1.5 The survey estimate that there are currently 17,257 households living in Nunhead and Peckham Rye at
the time of the survey. In total 870 dwellings were assessed as being vacant at the time of the survey.
Southwark Housing Requirments Study 2008
Reports
Sub-area Report: Nunhead and Peckham Rye
Main Report Executive Summary

Page 7
Chapter 2: Housing Market Drivers
Local Population
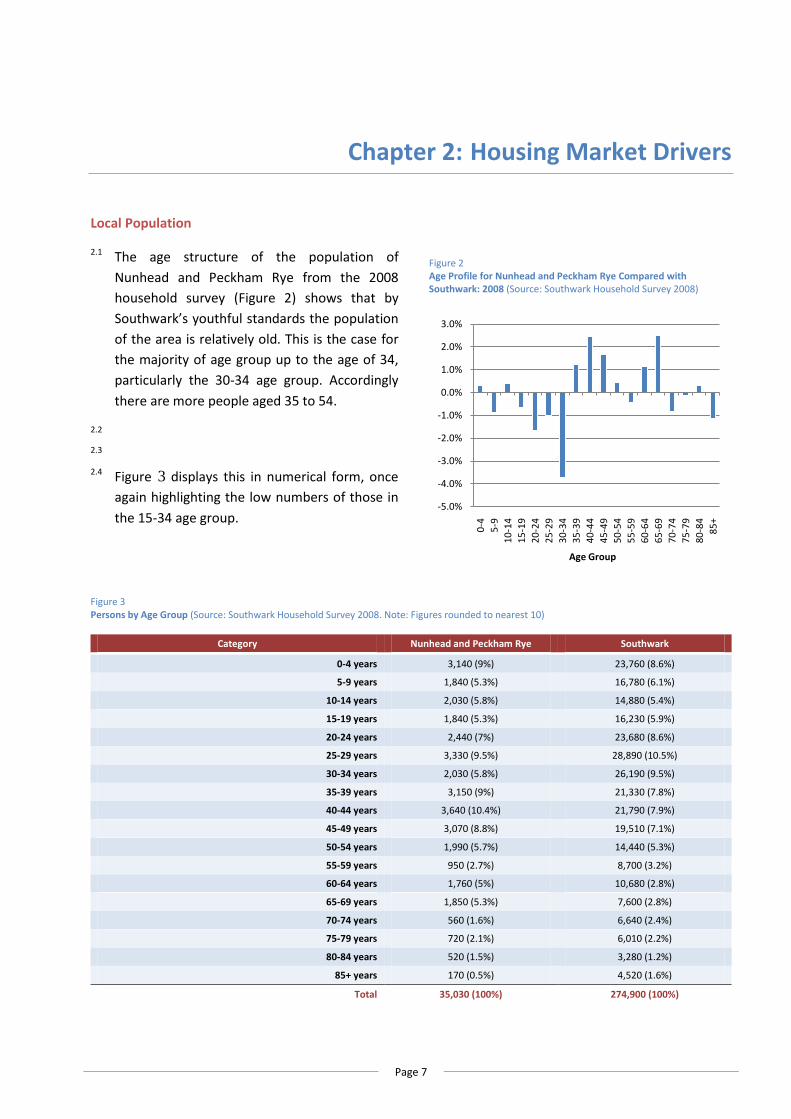
2.1 The age structure of the population of
Nunhead and Peckham Rye from the 2008
household survey (Figure 2) shows that by
Southwark’s youthful standards the population
of the area is relatively old. This is the case for
the majority of age group up to the age of 34,
particularly the 30-34 age group. Accordingly
there are more people aged 35 to 54.
2.2 2.3 2.4 Figure 3 displays this in numerical form, once
again highlighting the low numbers of those in
the 15-34 age group.
Figure 3 Persons by Age Group (Source: Southwark Household Survey 2008. Note: Figures rounded to nearest 10)
Category Nunhead and Peckham Rye Southwark
0-4 years 3,140 (9%) 23,760 (8.6%)
5-9 years 1,840 (5.3%) 16,780 (6.1%)
10-14 years 2,030 (5.8%) 14,880 (5.4%)
15-19 years 1,840 (5.3%) 16,230 (5.9%)
20-24 years 2,440 (7%) 23,680 (8.6%)
25-29 years 3,330 (9.5%) 28,890 (10.5%)
30-34 years 2,030 (5.8%) 26,190 (9.5%)
35-39 years 3,150 (9%) 21,330 (7.8%)
40-44 years 3,640 (10.4%) 21,790 (7.9%)
45-49 years 3,070 (8.8%) 19,510 (7.1%)
50-54 years 1,990 (5.7%) 14,440 (5.3%)
55-59 years 950 (2.7%) 8,700 (3.2%)
60-64 years 1,760 (5%) 10,680 (2.8%)
65-69 years 1,850 (5.3%) 7,600 (2.8%)
70-74 years 560 (1.6%) 6,640 (2.4%)
75-79 years 720 (2.1%) 6,010 (2.2%)
80-84 years 520 (1.5%) 3,280 (1.2%)
85+ years 170 (0.5%) 4,520 (1.6%)
Total 35,030 (100%) 274,900 (100%)
Figure 2 Age Profile for Nunhead and Peckham Rye Compared with Southwark: 2008 (Source: Southwark Household Survey 2008)
-5.0%
-4.0%
-3.0%
-2.0%
-1.0%
0.0%
1.0%
2.0%
3.0%
0-4
5-9
10
-14
15
-19
20
-24
25
-29
30
-34
35
-39
40
-44
45
-49
50
-54
55
-59
60
-64
65
-69
70
-74
75
-79
80
-84
85
+
Age Group
Southwark Housing Requirements Study 2008
Page 8
Chapter 2: Housing Market Drivers
Page 9
Household Structure
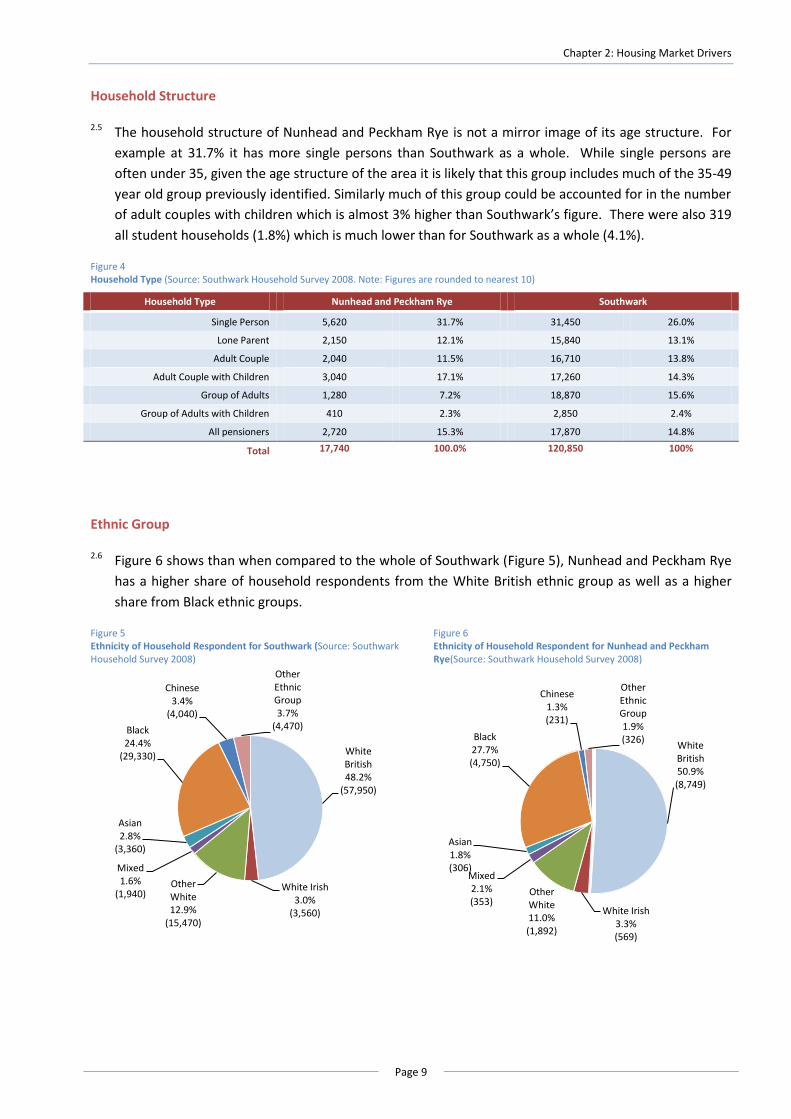
2.5 The household structure of Nunhead and Peckham Rye is not a mirror image of its age structure. For
example at 31.7% it has more single persons than Southwark as a whole. While single persons are
often under 35, given the age structure of the area it is likely that this group includes much of the 35-49
year old group previously identified. Similarly much of this group could be accounted for in the number
of adult couples with children which is almost 3% higher than Southwark’s figure. There were also 319
all student households (1.8%) which is much lower than for Southwark as a whole (4.1%).
Figure 4 Household Type (Source: Southwark Household Survey 2008. Note: Figures are rounded to nearest 10)
Household Type Nunhead and Peckham Rye Southwark
Single Person 5,620 31.7% 31,450 26.0%
Lone Parent 2,150 12.1% 15,840 13.1%
Adult Couple 2,040 11.5% 16,710 13.8%
Adult Couple with Children 3,040 17.1% 17,260 14.3%
Group of Adults 1,280 7.2% 18,870 15.6%
Group of Adults with Children 410 2.3% 2,850 2.4%
All pensioners 2,720 15.3% 17,870 14.8%
Total 17,740 100.0% 120,850 100%
Ethnic Group
2.6 Figure 6 shows than when compared to the whole of Southwark (Figure 5), Nunhead and Peckham Rye
has a higher share of household respondents from the White British ethnic group as well as a higher
share from Black ethnic groups.
Figure 5 Ethnicity of Household Respondent for Southwark (Source: Southwark Household Survey 2008)
Figure 6 Ethnicity of Household Respondent for Nunhead and Peckham Rye(Source: Southwark Household Survey 2008)
White British48.2%
(57,950)
White Irish3.0%
(3,560)
Other White 12.9%
(15,470)
Mixed1.6%
(1,940)
Asian2.8%
(3,360)
Black24.4%
(29,330)
Chinese3.4%
(4,040)
Other Ethnic Group3.7%
(4,470)
White British50.9%(8,749)
White Irish3.3%(569)
Other White 11.0%(1,892)
Mixed2.1%(353)
Asian1.8%(306)
Black27.7%(4,750)
Chinese1.3%(231)
Other Ethnic Group1.9%(326)
Southwark Housing Requirements Study 2008
Page 10
Incomes and Earnings
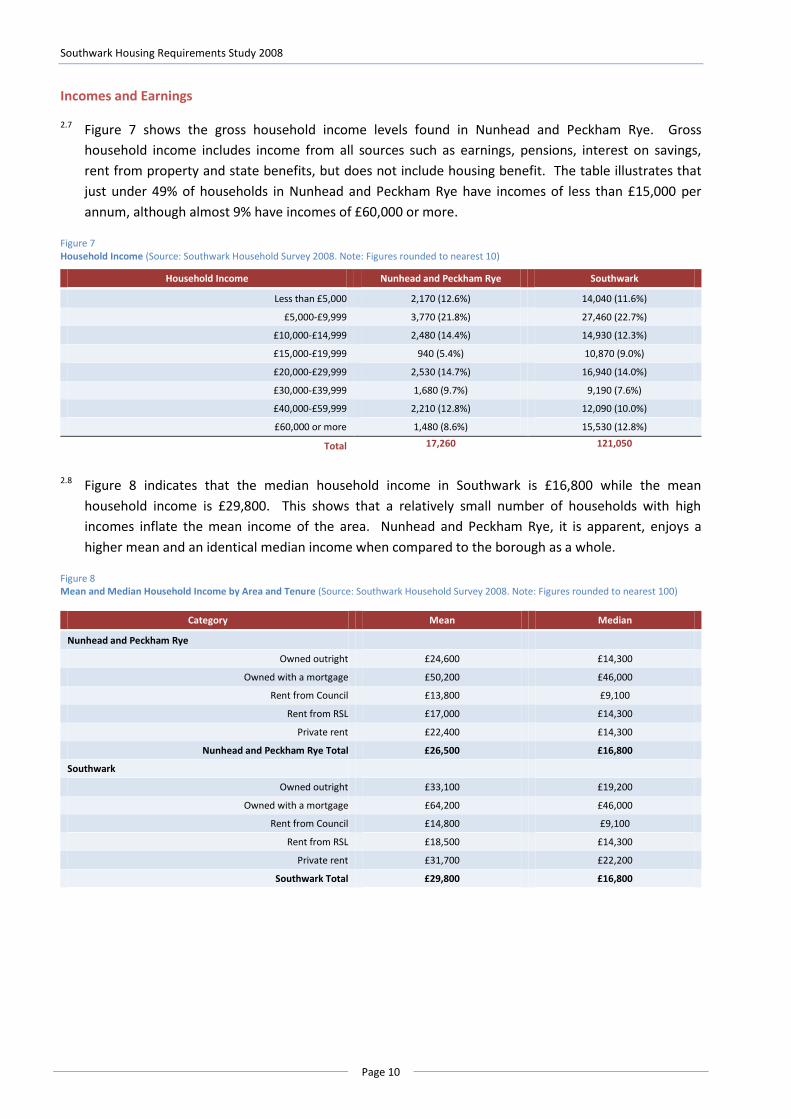
2.7 Figure 7 shows the gross household income levels found in Nunhead and Peckham Rye. Gross
household income includes income from all sources such as earnings, pensions, interest on savings,
rent from property and state benefits, but does not include housing benefit. The table illustrates that
just under 49% of households in Nunhead and Peckham Rye have incomes of less than £15,000 per
annum, although almost 9% have incomes of £60,000 or more.
Figure 7 Household Income (Source: Southwark Household Survey 2008. Note: Figures rounded to nearest 10)
Household Income Nunhead and Peckham Rye Southwark
Less than £5,000 2,170 (12.6%) 14,040 (11.6%)
£5,000-£9,999 3,770 (21.8%) 27,460 (22.7%)
£10,000-£14,999 2,480 (14.4%) 14,930 (12.3%)
£15,000-£19,999 940 (5.4%) 10,870 (9.0%)
£20,000-£29,999 2,530 (14.7%) 16,940 (14.0%)
£30,000-£39,999 1,680 (9.7%) 9,190 (7.6%)
£40,000-£59,999 2,210 (12.8%) 12,090 (10.0%)
£60,000 or more 1,480 (8.6%) 15,530 (12.8%)
Total 17,260 121,050
2.8 Figure 8 indicates that the median household income in Southwark is £16,800 while the mean
household income is £29,800. This shows that a relatively small number of households with high
incomes inflate the mean income of the area. Nunhead and Peckham Rye, it is apparent, enjoys a
higher mean and an identical median income when compared to the borough as a whole.
Figure 8 Mean and Median Household Income by Area and Tenure (Source: Southwark Household Survey 2008. Note: Figures rounded to nearest 100)
Category Mean Median
Nunhead and Peckham Rye
Owned outright £24,600 £14,300
Owned with a mortgage £50,200 £46,000
Rent from Council £13,800 £9,100
Rent from RSL £17,000 £14,300
Private rent £22,400 £14,300
Nunhead and Peckham Rye Total £26,500 £16,800
Southwark
Owned outright £33,100 £19,200
Owned with a mortgage £64,200 £46,000
Rent from Council £14,800 £9,100
Rent from RSL £18,500 £14,300
Private rent £31,700 £22,200
Southwark Total £29,800 £16,800
Chapter 2: Housing Market Drivers
Page 11
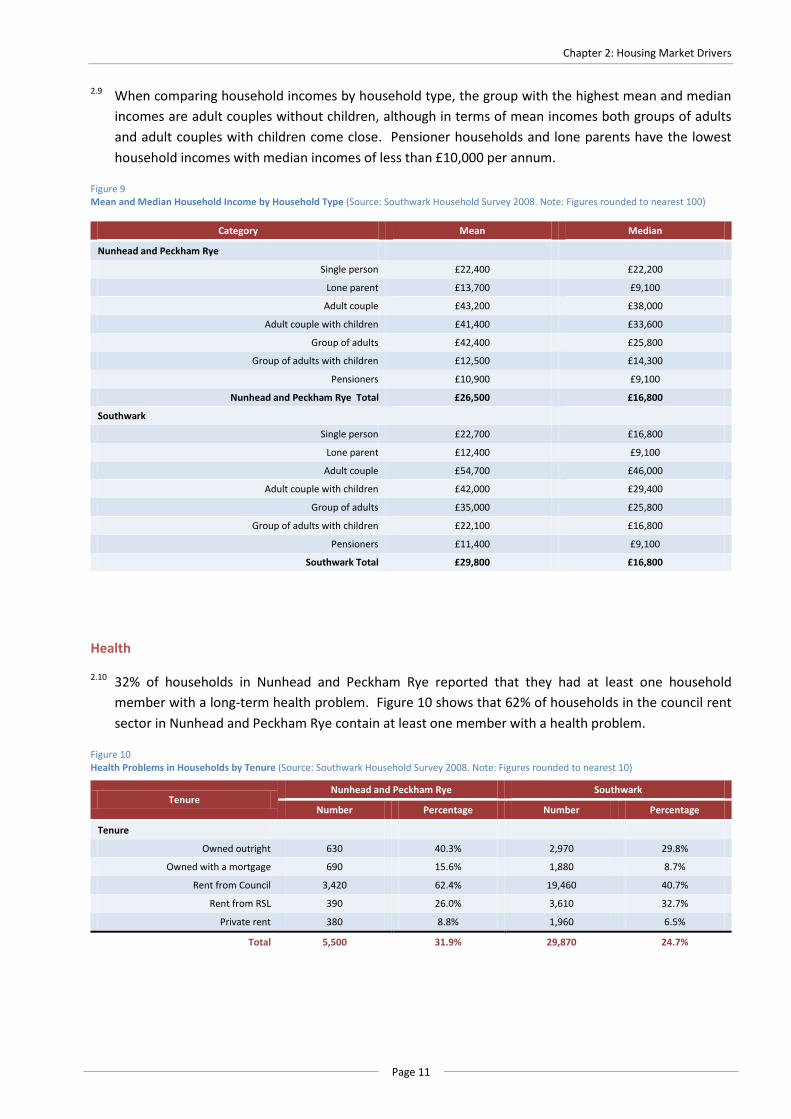
2.9 When comparing household incomes by household type, the group with the highest mean and median
incomes are adult couples without children, although in terms of mean incomes both groups of adults
and adult couples with children come close. Pensioner households and lone parents have the lowest
household incomes with median incomes of less than £10,000 per annum.
Figure 9 Mean and Median Household Income by Household Type (Source: Southwark Household Survey 2008. Note: Figures rounded to nearest 100)
Category Mean Median
Nunhead and Peckham Rye
Single person £22,400 £22,200
Lone parent £13,700 £9,100
Adult couple £43,200 £38,000
Adult couple with children £41,400 £33,600
Group of adults £42,400 £25,800
Group of adults with children £12,500 £14,300
Pensioners £10,900 £9,100
Nunhead and Peckham Rye Total £26,500 £16,800
Southwark
Single person £22,700 £16,800
Lone parent £12,400 £9,100
Adult couple £54,700 £46,000
Adult couple with children £42,000 £29,400
Group of adults £35,000 £25,800
Group of adults with children £22,100 £16,800
Pensioners £11,400 £9,100
Southwark Total £29,800 £16,800
Health
2.10 32% of households in Nunhead and Peckham Rye reported that they had at least one household
member with a long-term health problem. Figure 10 shows that 62% of households in the council rent
sector in Nunhead and Peckham Rye contain at least one member with a health problem.
Figure 10 Health Problems in Households by Tenure (Source: Southwark Household Survey 2008. Note: Figures rounded to nearest 10)
Tenure Nunhead and Peckham Rye Southwark
Number Percentage Number Percentage
Tenure Owned outright 630 40.3% 2,970 29.8%
Owned with a mortgage 690 15.6% 1,880 8.7%
Rent from Council 3,420 62.4% 19,460 40.7%
Rent from RSL 390 26.0% 3,610 32.7%
Private rent 380 8.8% 1,960 6.5%
Total 5,500 31.9% 29,870
24.7%
Southwark Housing Requirements Study 2008
Page 12
Car and Bicycle Ownership
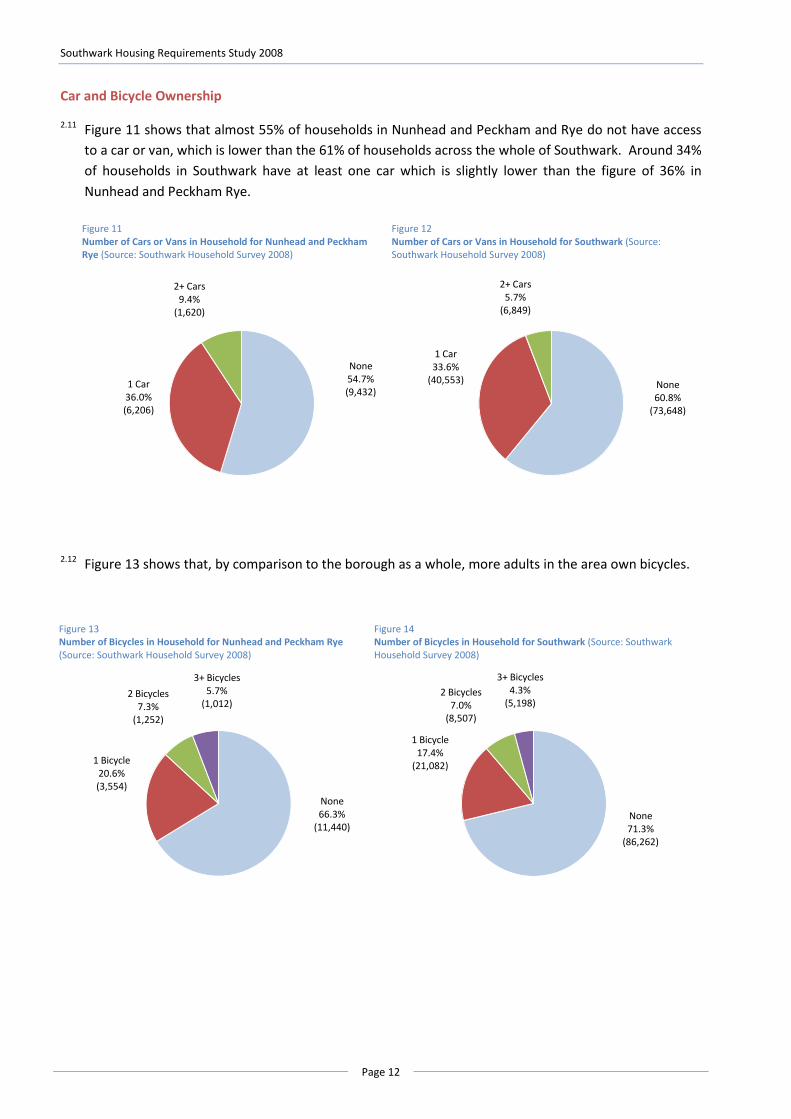
2.11 Figure 11 shows that almost 55% of households in Nunhead and Peckham and Rye do not have access
to a car or van, which is lower than the 61% of households across the whole of Southwark. Around 34%
of households in Southwark have at least one car which is slightly lower than the figure of 36% in
Nunhead and Peckham Rye.
2.12 Figure 13 shows that, by comparison to the borough as a whole, more adults in the area own bicycles.
Figure 11 Number of Cars or Vans in Household for Nunhead and Peckham Rye (Source: Southwark Household Survey 2008)
None54.7%(9,432)
1 Car36.0%(6,206)
2+ Cars9.4%
(1,620)
Figure 12 Number of Cars or Vans in Household for Southwark (Source: Southwark Household Survey 2008)
None60.8%
(73,648)
1 Car33.6%
(40,553)
2+ Cars5.7%
(6,849)
Figure 13 Number of Bicycles in Household for Nunhead and Peckham Rye (Source: Southwark Household Survey 2008)
None66.3%
(11,440)
1 Bicycle20.6%(3,554)
2 Bicycles7.3%
(1,252)
3+ Bicycles5.7%
(1,012)
Figure 14 Number of Bicycles in Household for Southwark (Source: Southwark Household Survey 2008)
None71.3%
(86,262)
1 Bicycle17.4%
(21,082)
2 Bicycles7.0%
(8,507)
3+ Bicycles4.3%
(5,198)
Chapter 2: Housing Market Drivers
Page 13
Access to Services
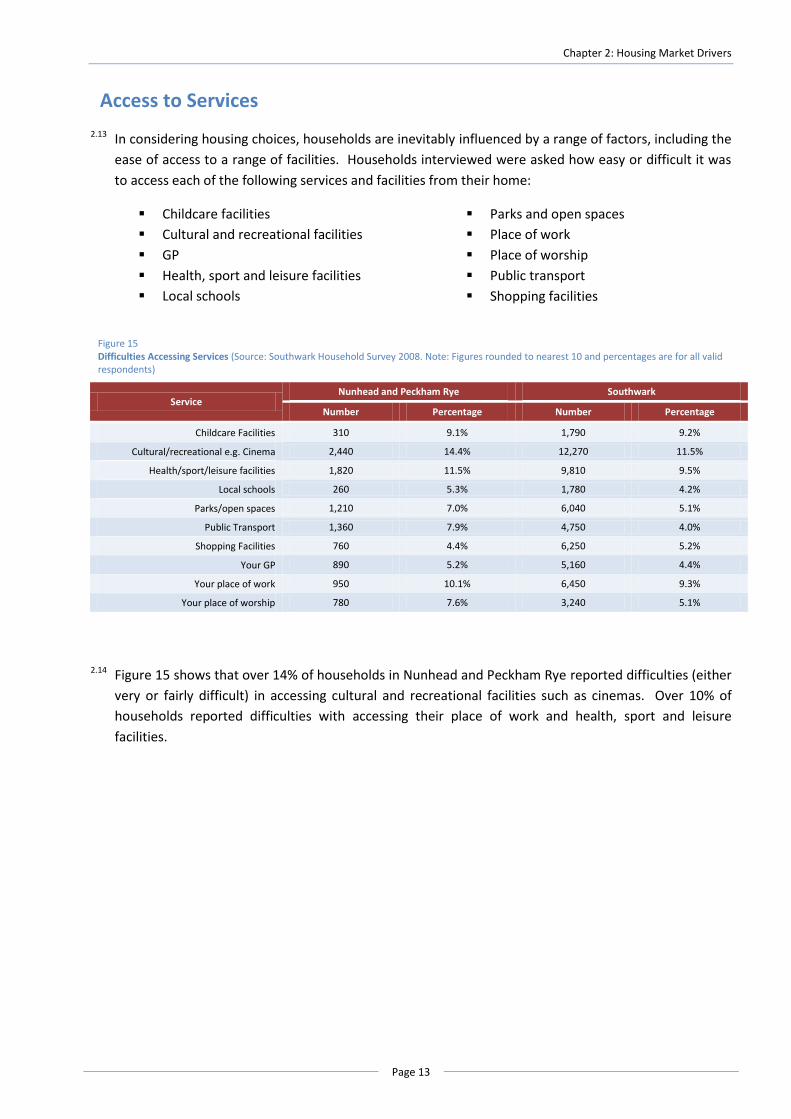
2.13 In considering housing choices, households are inevitably influenced by a range of factors, including the
ease of access to a range of facilities. Households interviewed were asked how easy or difficult it was
to access each of the following services and facilities from their home:
Childcare facilities
Cultural and recreational facilities
GP
Health, sport and leisure facilities
Local schools
Parks and open spaces
Place of work
Place of worship
Public transport
Shopping facilities
2.14 Figure 15 shows that over 14% of households in Nunhead and Peckham Rye reported difficulties (either
very or fairly difficult) in accessing cultural and recreational facilities such as cinemas. Over 10% of
households reported difficulties with accessing their place of work and health, sport and leisure
facilities.
Figure 15 Difficulties Accessing Services (Source: Southwark Household Survey 2008. Note: Figures rounded to nearest 10 and percentages are for all valid respondents)
Service Nunhead and Peckham Rye Southwark
Number Percentage Number Percentage
Childcare Facilities 310 9.1% 1,790 9.2%
Cultural/recreational e.g. Cinema 2,440 14.4% 12,270 11.5%
Health/sport/leisure facilities 1,820 11.5% 9,810 9.5%
Local schools 260 5.3% 1,780 4.2%
Parks/open spaces 1,210 7.0% 6,040 5.1%
Public Transport 1,360 7.9% 4,750 4.0%
Shopping Facilities 760 4.4% 6,250 5.2%
Your GP 890 5.2% 5,160 4.4%
Your place of work 950 10.1% 6,450 9.3%
Your place of worship 780 7.6% 3,240 5.1%

Page 15
Chapter 3: Existing Housing Stock
Property Type and Age
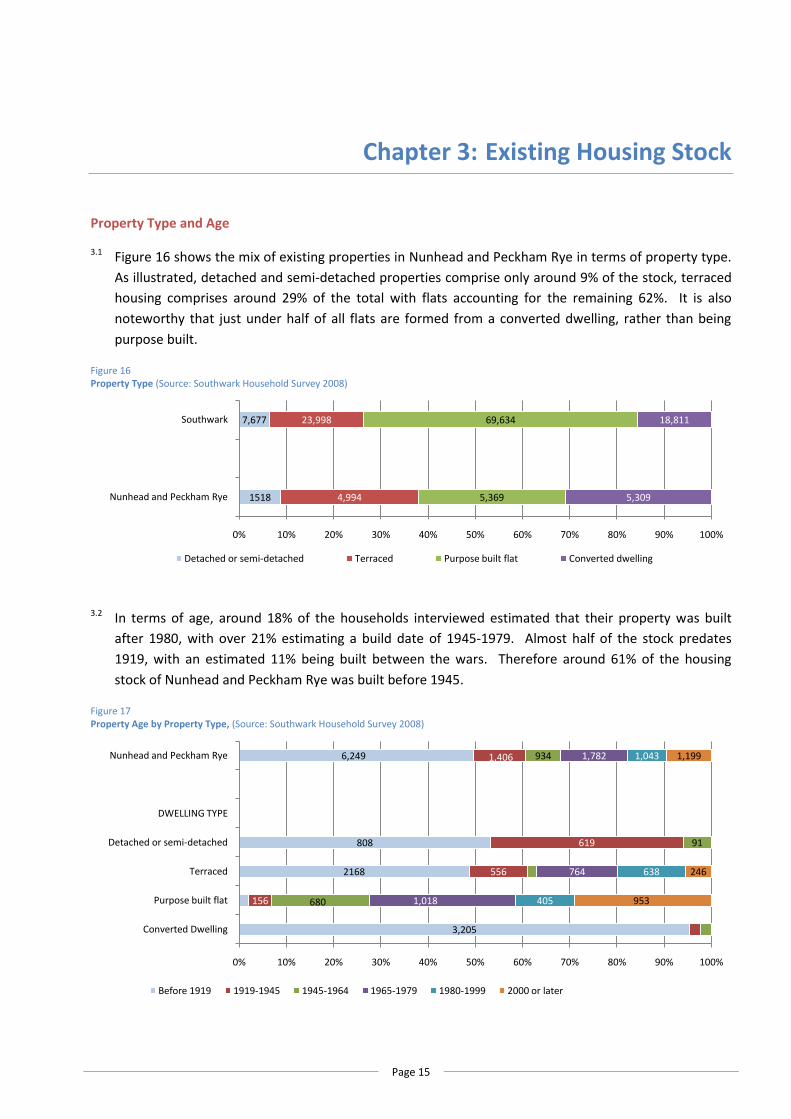
3.1 Figure 16 shows the mix of existing properties in Nunhead and Peckham Rye in terms of property type.
As illustrated, detached and semi-detached properties comprise only around 9% of the stock, terraced
housing comprises around 29% of the total with flats accounting for the remaining 62%. It is also
noteworthy that just under half of all flats are formed from a converted dwelling, rather than being
purpose built.
Figure 16 Property Type (Source: Southwark Household Survey 2008)
3.2 In terms of age, around 18% of the households interviewed estimated that their property was built
after 1980, with over 21% estimating a build date of 1945-1979. Almost half of the stock predates
1919, with an estimated 11% being built between the wars. Therefore around 61% of the housing
stock of Nunhead and Peckham Rye was built before 1945.
Figure 17 Property Age by Property Type, (Source: Southwark Household Survey 2008)
6,249
808
2168
3,205
1,406
619
556
156
934
91
680
1,782
764
1,018
1,043
638
405
1,199
246
953
0% 10% 20% 30% 40% 50% 60% 70% 80% 90% 100%
Nunhead and Peckham Rye
DWELLING TYPE
Detached or semi-detached
Terraced
Purpose built flat
Converted Dwelling
Before 1919 1919-1945 1945-1964 1965-1979 1980-1999 2000 or later
7,677
1518
23,998
4,994
69,634
5,369
18,811
5,309
0% 10% 20% 30% 40% 50% 60% 70% 80% 90% 100%
Southwark
Nunhead and Peckham Rye
Detached or semi-detached Terraced Purpose built flat Converted dwelling
Southwark Housing Requirements Study 2008
Page 16
3.3 The converted properties are dominated by properties built before 1919. Therefore, many older
properties in Nunhead and Peckham Rye have been sub-divided to form smaller units, with a total of
3,205 converted dwellings being contained within pre-1919 buildings.
Problems with Condition of Stock
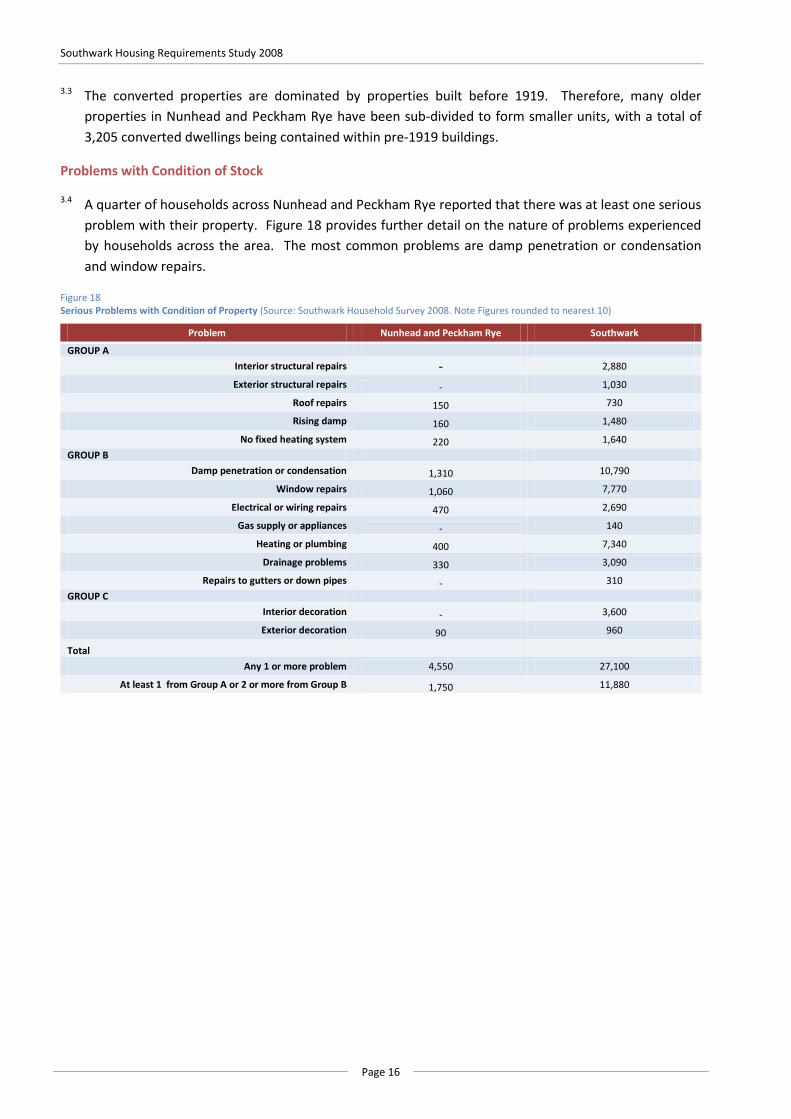
3.4 A quarter of households across Nunhead and Peckham Rye reported that there was at least one serious
problem with their property. Figure 18 provides further detail on the nature of problems experienced
by households across the area. The most common problems are damp penetration or condensation
and window repairs.
Figure 18 Serious Problems with Condition of Property (Source: Southwark Household Survey 2008. Note Figures rounded to nearest 10)
Problem Nunhead and Peckham Rye Southwark
GROUP A
Interior structural repairs - 2,880
Exterior structural repairs - 1,030
Roof repairs 150 730
Rising damp 160 1,480
No fixed heating system 220 1,640
GROUP B
Damp penetration or condensation 1,310 10,790
Window repairs 1,060 7,770
Electrical or wiring repairs 470 2,690
Gas supply or appliances - 140
Heating or plumbing 400 7,340
Drainage problems 330 3,090
Repairs to gutters or down pipes - 310
GROUP C
Interior decoration - 3,600
Exterior decoration 90 960
Total
Any 1 or more problem 4,550 27,100
At least 1 from Group A or 2 or more from Group B 1,750 11,880
Chapter 3: Existing Housing Stock
Page 17
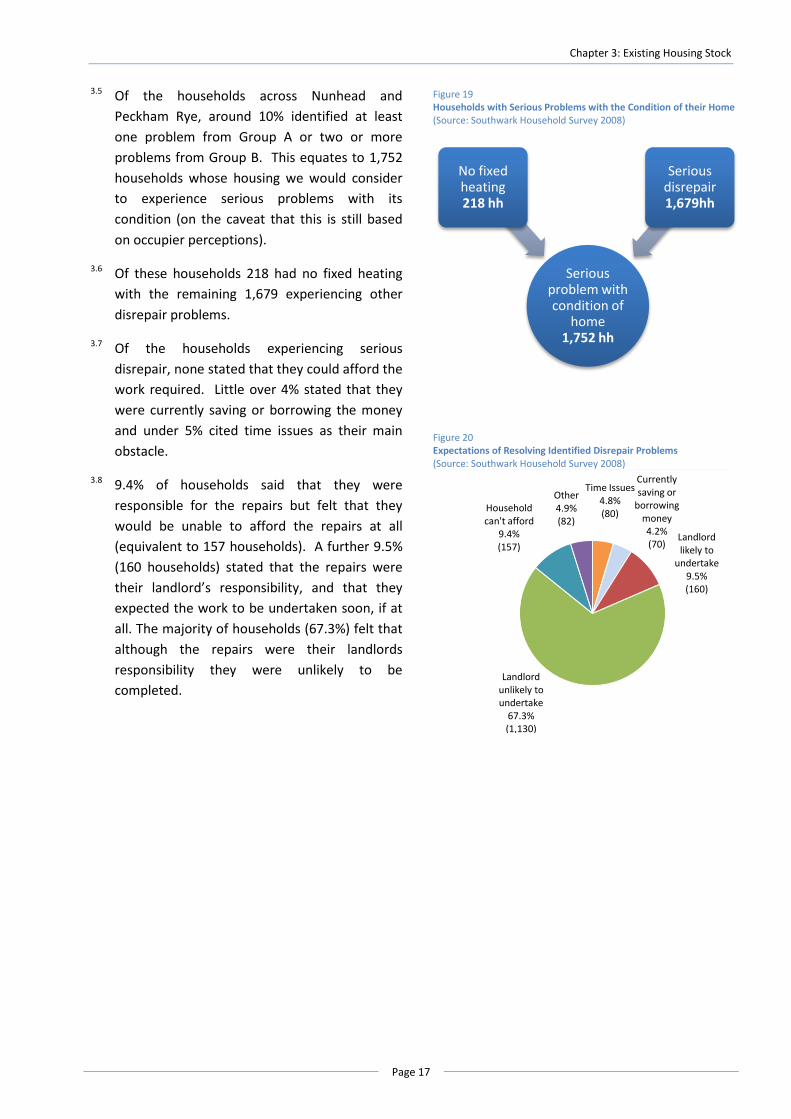
3.5 Of the households across Nunhead and
Peckham Rye, around 10% identified at least
one problem from Group A or two or more
problems from Group B. This equates to 1,752
households whose housing we would consider
to experience serious problems with its
condition (on the caveat that this is still based
on occupier perceptions).
3.6 Of these households 218 had no fixed heating
with the remaining 1,679 experiencing other
disrepair problems.
3.7 Of the households experiencing serious
disrepair, none stated that they could afford the
work required. Little over 4% stated that they
were currently saving or borrowing the money
and under 5% cited time issues as their main
obstacle.
3.8 9.4% of households said that they were
responsible for the repairs but felt that they
would be unable to afford the repairs at all
(equivalent to 157 households). A further 9.5%
(160 households) stated that the repairs were
their landlord’s responsibility, and that they
expected the work to be undertaken soon, if at
all. The majority of households (67.3%) felt that
although the repairs were their landlords
responsibility they were unlikely to be
completed.
Figure 19 Households with Serious Problems with the Condition of their Home (Source: Southwark Household Survey 2008)
Serious problem with condition of
home1,752 hh
No fixed heating218 hh
Serious disrepair1,679hh
Figure 20 Expectations of Resolving Identified Disrepair Problems (Source: Southwark Household Survey 2008)
Other4.9%(82)
Household can't afford
9.4%(157)
Landlord likely to
undertake9.5%(160)
Landlord unlikely to undertake
67.3%(1,130)
Time Issues4.8%(80)
Currently saving or
borrowing money4.2%(70)
Southwark Housing Requirements Study 2008
Page 18
Housing Tenure
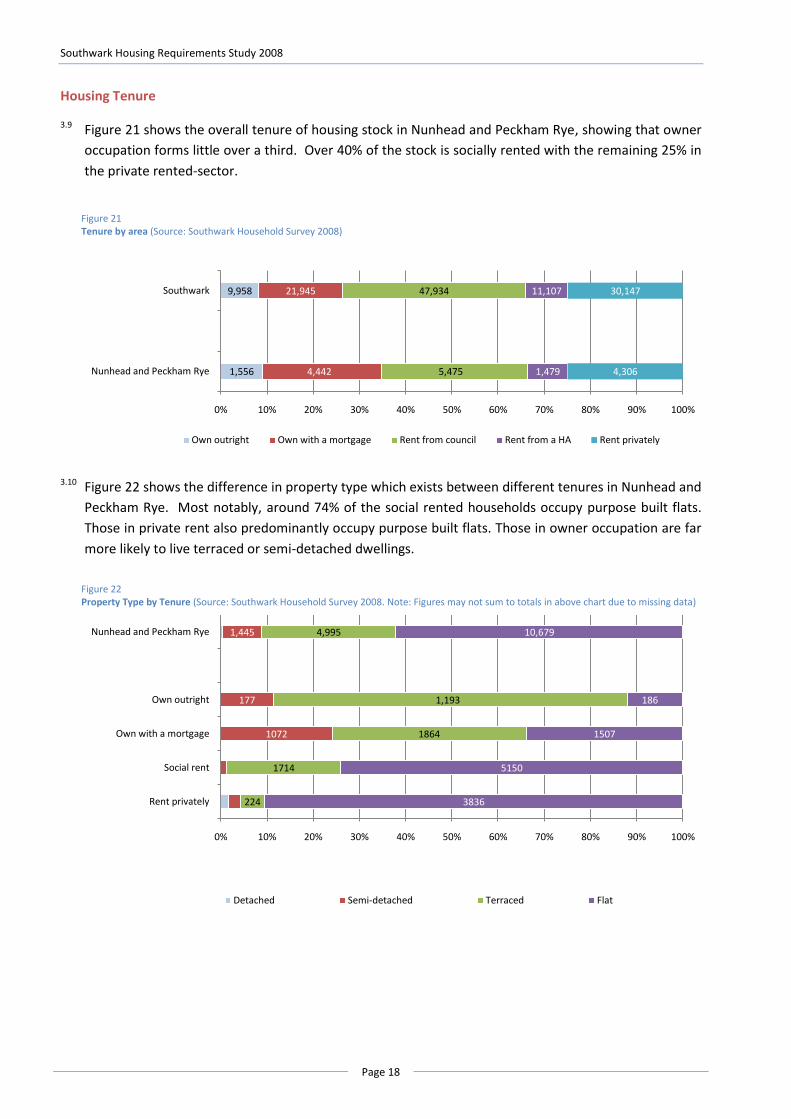
3.9 Figure 21 shows the overall tenure of housing stock in Nunhead and Peckham Rye, showing that owner
occupation forms little over a third. Over 40% of the stock is socially rented with the remaining 25% in
the private rented-sector.
3.10 Figure 22 shows the difference in property type which exists between different tenures in Nunhead and
Peckham Rye. Most notably, around 74% of the social rented households occupy purpose built flats.
Those in private rent also predominantly occupy purpose built flats. Those in owner occupation are far
more likely to live terraced or semi-detached dwellings.
Figure 22 Property Type by Tenure (Source: Southwark Household Survey 2008. Note: Figures may not sum to totals in above chart due to missing data)
1,445
177
1072
4,995
1,193
1864
1714
224
10,679
186
1507
5150
3836
0% 10% 20% 30% 40% 50% 60% 70% 80% 90% 100%
Nunhead and Peckham Rye
Own outright
Own with a mortgage
Social rent
Rent privately
Detached Semi-detached Terraced Flat
Figure 21 Tenure by area (Source: Southwark Household Survey 2008)
9,958
1,556
21,945
4,442
47,934
5,475
11,107
1,479
30,147
4,306
0% 10% 20% 30% 40% 50% 60% 70% 80% 90% 100%
Southwark
Nunhead and Peckham Rye
Own outright Own with a mortgage Rent from council Rent from a HA Rent privately
Chapter 3: Existing Housing Stock
Page 19
Overcrowding and Under-occupation
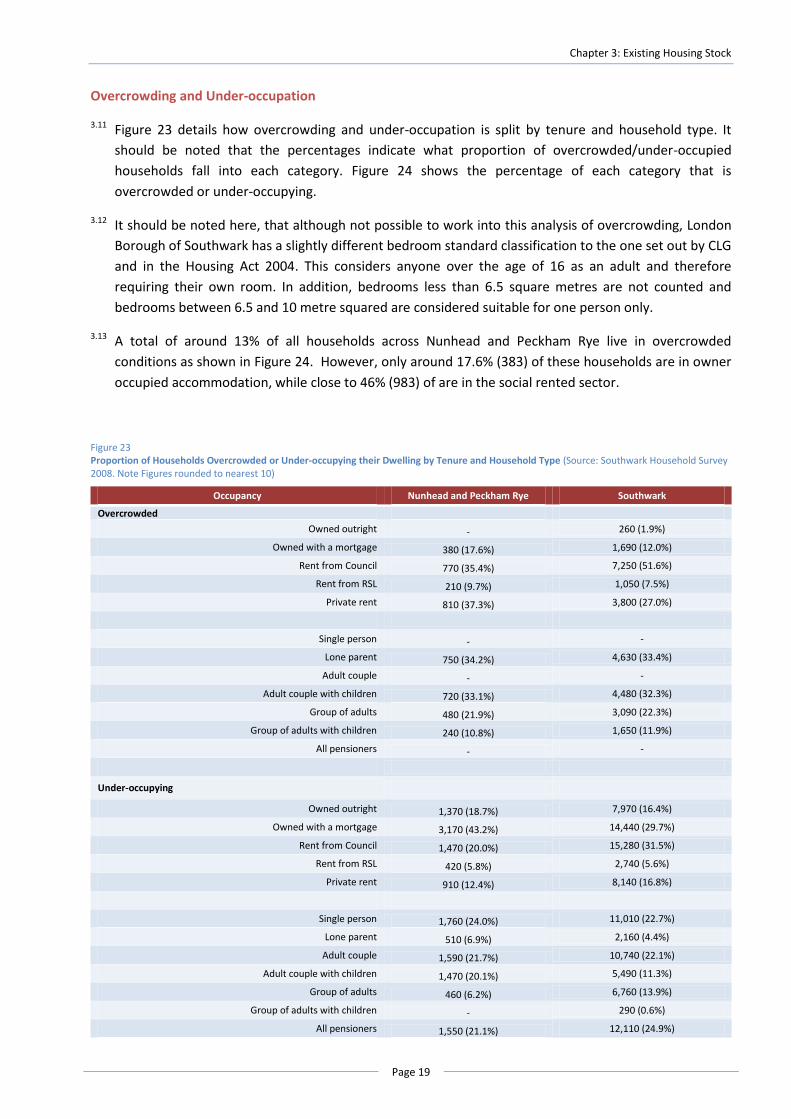
3.11 Figure 23 details how overcrowding and under-occupation is split by tenure and household type. It
should be noted that the percentages indicate what proportion of overcrowded/under-occupied
households fall into each category. Figure 24 shows the percentage of each category that is
overcrowded or under-occupying.
3.12 It should be noted here, that although not possible to work into this analysis of overcrowding, London
Borough of Southwark has a slightly different bedroom standard classification to the one set out by CLG
and in the Housing Act 2004. This considers anyone over the age of 16 as an adult and therefore
requiring their own room. In addition, bedrooms less than 6.5 square metres are not counted and
bedrooms between 6.5 and 10 metre squared are considered suitable for one person only.
3.13 A total of around 13% of all households across Nunhead and Peckham Rye live in overcrowded
conditions as shown in Figure 24. However, only around 17.6% (383) of these households are in owner
occupied accommodation, while close to 46% (983) of are in the social rented sector.
Figure 23 Proportion of Households Overcrowded or Under-occupying their Dwelling by Tenure and Household Type (Source: Southwark Household Survey 2008. Note Figures rounded to nearest 10)
Occupancy Nunhead and Peckham Rye Southwark
Overcrowded
Owned outright - 260 (1.9%)
Owned with a mortgage 380 (17.6%) 1,690 (12.0%)
Rent from Council 770 (35.4%) 7,250 (51.6%)
Rent from RSL 210 (9.7%) 1,050 (7.5%)
Private rent 810 (37.3%) 3,800 (27.0%)
Single person - -
Lone parent 750 (34.2%) 4,630 (33.4%)
Adult couple - -
Adult couple with children 720 (33.1%) 4,480 (32.3%)
Group of adults 480 (21.9%) 3,090 (22.3%)
Group of adults with children 240 (10.8%) 1,650 (11.9%)
All pensioners - -
Under-occupying
Owned outright 1,370 (18.7%) 7,970 (16.4%)
Owned with a mortgage 3,170 (43.2%) 14,440 (29.7%)
Rent from Council 1,470 (20.0%) 15,280 (31.5%)
Rent from RSL 420 (5.8%) 2,740 (5.6%)
Private rent 910 (12.4%) 8,140 (16.8%)
Single person 1,760 (24.0%) 11,010 (22.7%)
Lone parent 510 (6.9%) 2,160 (4.4%)
Adult couple 1,590 (21.7%) 10,740 (22.1%)
Adult couple with children 1,470 (20.1%) 5,490 (11.3%)
Group of adults 460 (6.2%) 6,760 (13.9%)
Group of adults with children - 290 (0.6%)
All pensioners 1,550 (21.1%) 12,110 (24.9%)
Southwark Housing Requirements Study 2008
Page 20
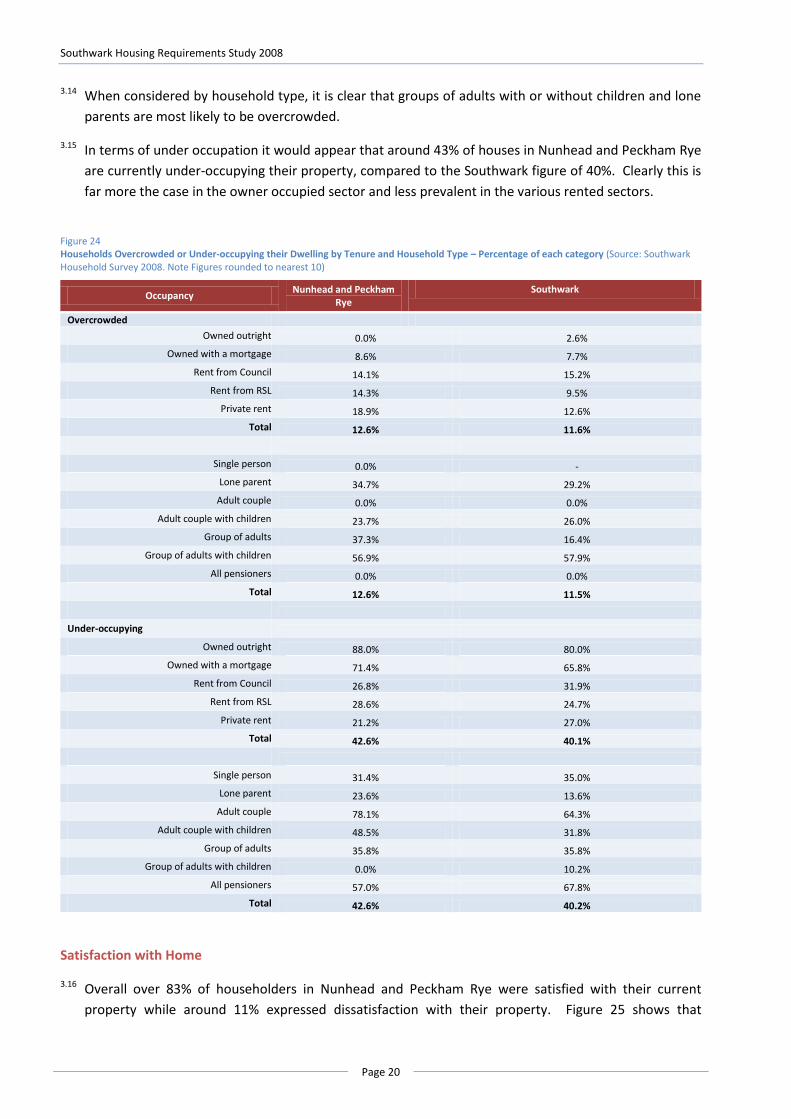
3.14 When considered by household type, it is clear that groups of adults with or without children and lone
parents are most likely to be overcrowded.
3.15 In terms of under occupation it would appear that around 43% of houses in Nunhead and Peckham Rye
are currently under-occupying their property, compared to the Southwark figure of 40%. Clearly this is
far more the case in the owner occupied sector and less prevalent in the various rented sectors.
Figure 24 Households Overcrowded or Under-occupying their Dwelling by Tenure and Household Type – Percentage of each category (Source: Southwark Household Survey 2008. Note Figures rounded to nearest 10)
Occupancy Nunhead and Peckham
Rye Southwark
Overcrowded
Owned outright 0.0% 2.6%
Owned with a mortgage 8.6% 7.7%
Rent from Council 14.1% 15.2%
Rent from RSL 14.3% 9.5%
Private rent 18.9% 12.6%
Total 12.6% 11.6%
Single person 0.0% -
Lone parent 34.7% 29.2%
Adult couple 0.0% 0.0%
Adult couple with children 23.7% 26.0%
Group of adults 37.3% 16.4%
Group of adults with children 56.9% 57.9%
All pensioners 0.0% 0.0%
Total 12.6% 11.5%
Under-occupying
Owned outright 88.0% 80.0%
Owned with a mortgage 71.4% 65.8%
Rent from Council 26.8% 31.9%
Rent from RSL 28.6% 24.7%
Private rent 21.2% 27.0%
Total 42.6% 40.1%
Single person 31.4% 35.0%
Lone parent 23.6% 13.6%
Adult couple 78.1% 64.3%
Adult couple with children 48.5% 31.8%
Group of adults 35.8% 35.8%
Group of adults with children 0.0% 10.2%
All pensioners 57.0% 67.8%
Total 42.6% 40.2%
Satisfaction with Home
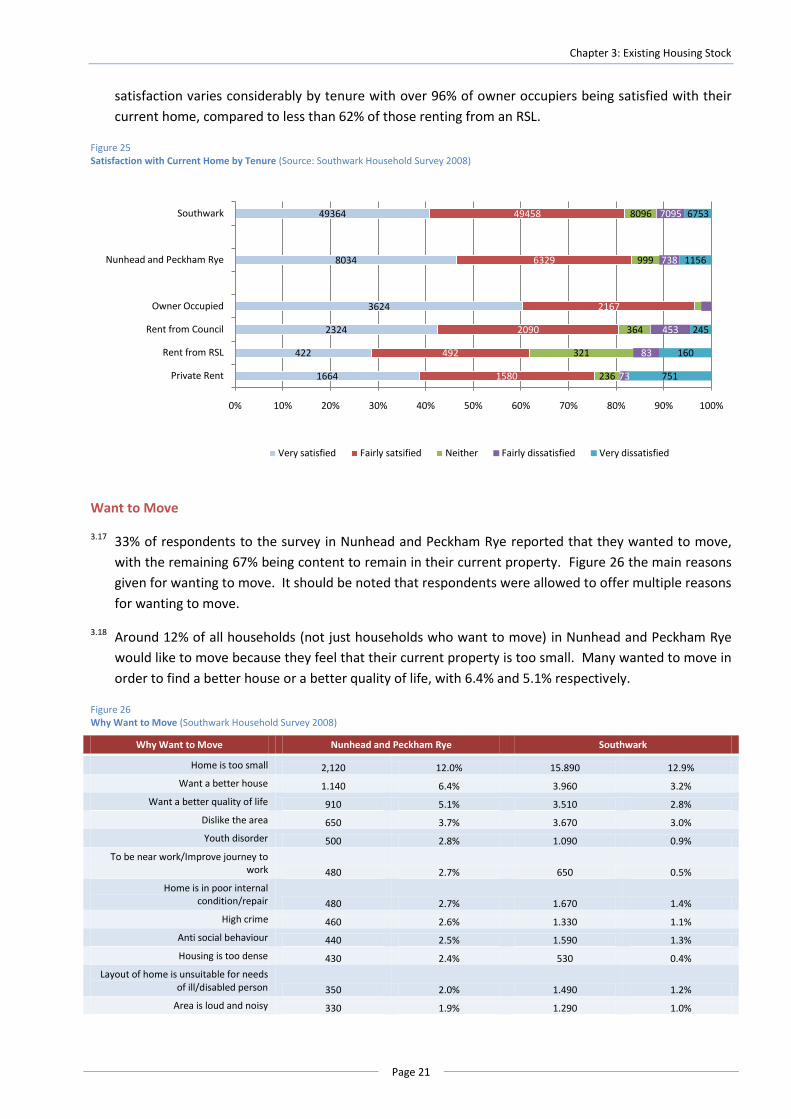
3.16 Overall over 83% of householders in Nunhead and Peckham Rye were satisfied with their current
property while around 11% expressed dissatisfaction with their property. Figure 25 shows that
Chapter 3: Existing Housing Stock
Page 21
satisfaction varies considerably by tenure with over 96% of owner occupiers being satisfied with their
current home, compared to less than 62% of those renting from an RSL.
Figure 25 Satisfaction with Current Home by Tenure (Source: Southwark Household Survey 2008)
Want to Move
3.17 33% of respondents to the survey in Nunhead and Peckham Rye reported that they wanted to move,
with the remaining 67% being content to remain in their current property. Figure 26 the main reasons
given for wanting to move. It should be noted that respondents were allowed to offer multiple reasons
for wanting to move.
3.18 Around 12% of all households (not just households who want to move) in Nunhead and Peckham Rye
would like to move because they feel that their current property is too small. Many wanted to move in
order to find a better house or a better quality of life, with 6.4% and 5.1% respectively.
Figure 26 Why Want to Move (Southwark Household Survey 2008)
Why Want to Move Nunhead and Peckham Rye Southwark
Home is too small 2,120 12.0% 15.890 12.9%
Want a better house 1.140 6.4% 3.960 3.2%
Want a better quality of life 910 5.1% 3.510 2.8%
Dislike the area 650 3.7% 3.670 3.0%
Youth disorder 500 2.8% 1.090 0.9%
To be near work/Improve journey to work 480 2.7% 650 0.5%
Home is in poor internal condition/repair 480 2.7% 1.670 1.4%
High crime 460 2.6% 1.330 1.1%
Anti social behaviour 440 2.5% 1.590 1.3%
Housing is too dense 430 2.4% 530 0.4%
Layout of home is unsuitable for needs of ill/disabled person 350 2.0% 1.490 1.2%
Area is loud and noisy 330 1.9% 1.290 1.0%
49364
8034
3624
2324
422
1664
49458
6329
2167
2090
492
1580
8096
999
364
321
236
7095
738
453
83
73
6753
1156
245
160
751
0% 10% 20% 30% 40% 50% 60% 70% 80% 90% 100%
Southwark
Nunhead and Peckham Rye
Owner Occupied
Rent from Council
Rent from RSL
Private Rent
Very satisfied Fairly satsified Neither Fairly dissatisfied Very dissatisfied
Southwark Housing Requirements Study 2008
Page 22
Housing Benefit
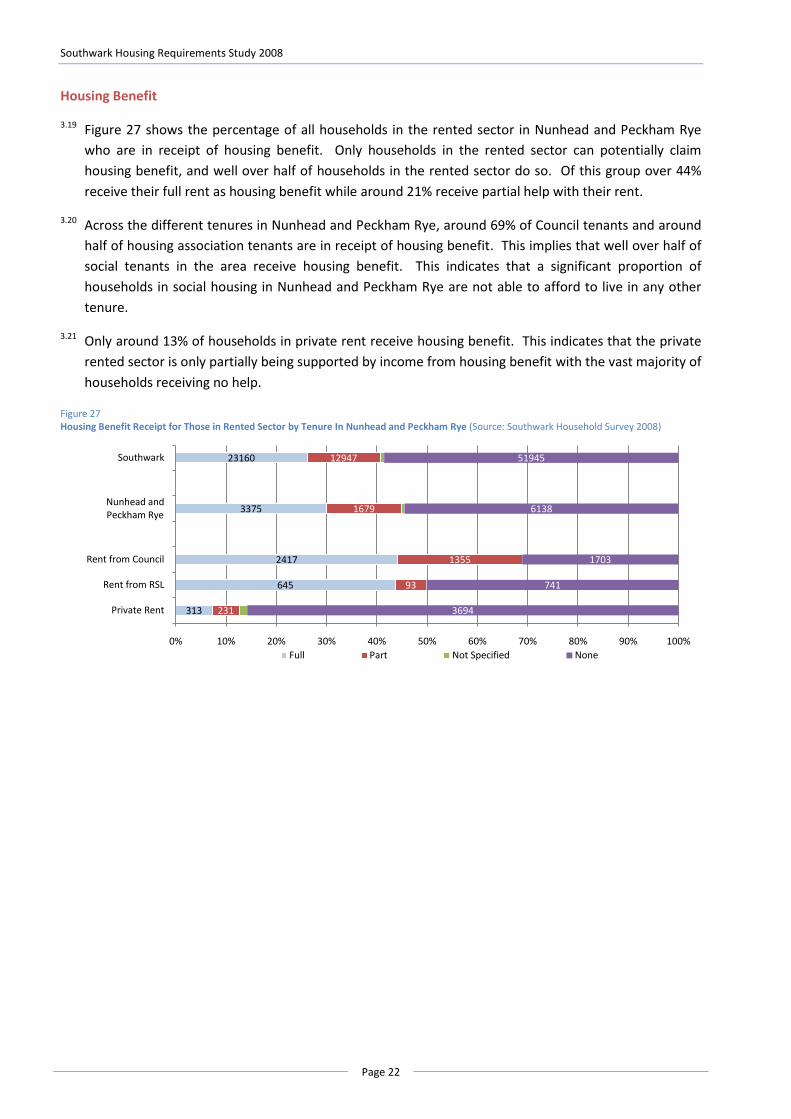
3.19 Figure 27 shows the percentage of all households in the rented sector in Nunhead and Peckham Rye
who are in receipt of housing benefit. Only households in the rented sector can potentially claim
housing benefit, and well over half of households in the rented sector do so. Of this group over 44%
receive their full rent as housing benefit while around 21% receive partial help with their rent.
3.20 Across the different tenures in Nunhead and Peckham Rye, around 69% of Council tenants and around
half of housing association tenants are in receipt of housing benefit. This implies that well over half of
social tenants in the area receive housing benefit. This indicates that a significant proportion of
households in social housing in Nunhead and Peckham Rye are not able to afford to live in any other
tenure.
3.21 Only around 13% of households in private rent receive housing benefit. This indicates that the private
rented sector is only partially being supported by income from housing benefit with the vast majority of
households receiving no help.
Figure 27 Housing Benefit Receipt for Those in Rented Sector by Tenure In Nunhead and Peckham Rye (Source: Southwark Household Survey 2008)
23160
3375
2417
645
313
12947
1679
1355
93
231
51945
6138
1703
741
3694
0% 10% 20% 30% 40% 50% 60% 70% 80% 90% 100%
Southwark
Nunhead and Peckham Rye
Rent from Council
Rent from RSL
Private Rent
Full Part Not Specified None
Page 23
Chapter 4: Unsuitably Housed Existing Households
Identifying Unsuitably Housed Households
4.1 Housing need is defined in the government guidance PPS3 as ‘the quantity of housing required for
households who are unable to access suitable housing without financial assistance. Housing demand as
‘the quantity of housing that households are willing and able to buy or rent. Therefore, to identify
existing housing need we must first consider the adequacy and suitability of households’ current
housing circumstances.
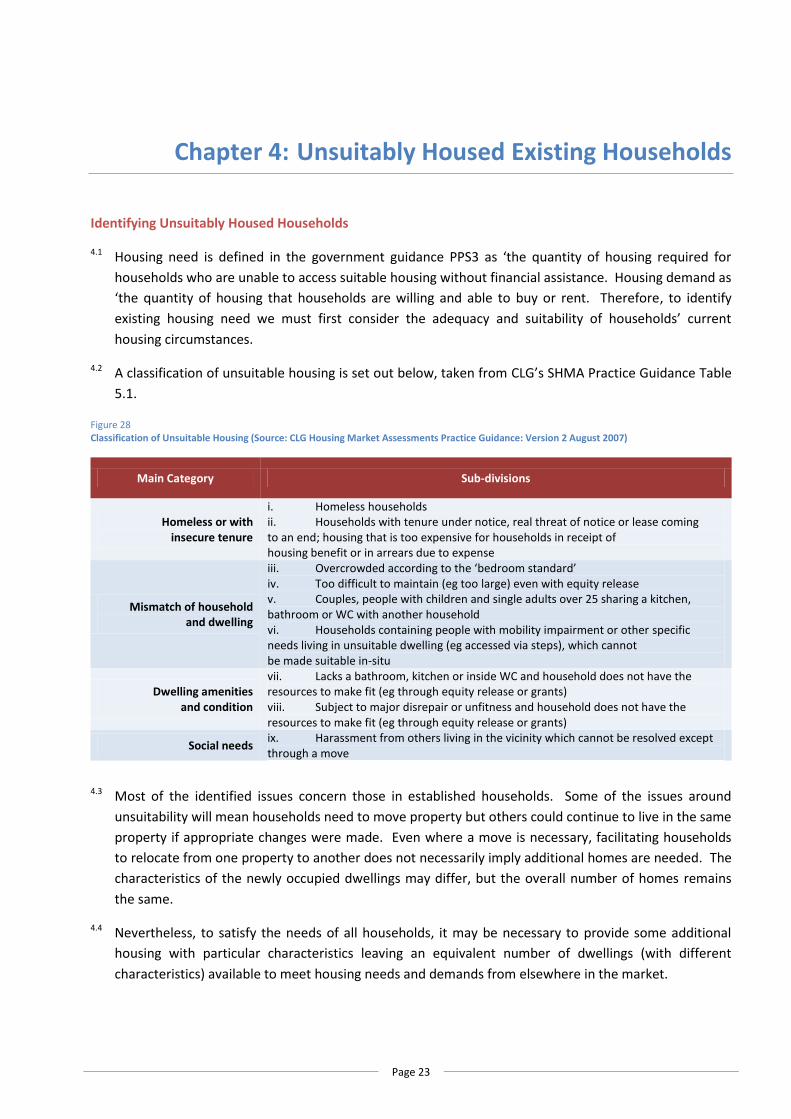
4.2 A classification of unsuitable housing is set out below, taken from CLG’s SHMA Practice Guidance Table
5.1.
Figure 28 Classification of Unsuitable Housing (Source: CLG Housing Market Assessments Practice Guidance: Version 2 August 2007)
Main Category Sub-divisions
Homeless or with insecure tenure
i. Homeless households ii. Households with tenure under notice, real threat of notice or lease coming to an end; housing that is too expensive for households in receipt of housing benefit or in arrears due to expense
Mismatch of household and dwelling
iii. Overcrowded according to the ‘bedroom standard’ iv. Too difficult to maintain (eg too large) even with equity release v. Couples, people with children and single adults over 25 sharing a kitchen, bathroom or WC with another household vi. Households containing people with mobility impairment or other specific needs living in unsuitable dwelling (eg accessed via steps), which cannot be made suitable in-situ
Dwelling amenities and condition
vii. Lacks a bathroom, kitchen or inside WC and household does not have the resources to make fit (eg through equity release or grants) viii. Subject to major disrepair or unfitness and household does not have the resources to make fit (eg through equity release or grants)
Social needs ix. Harassment from others living in the vicinity which cannot be resolved except through a move
4.3 Most of the identified issues concern those in established households. Some of the issues around
unsuitability will mean households need to move property but others could continue to live in the same
property if appropriate changes were made. Even where a move is necessary, facilitating households
to relocate from one property to another does not necessarily imply additional homes are needed. The
characteristics of the newly occupied dwellings may differ, but the overall number of homes remains
the same.
4.4 Nevertheless, to satisfy the needs of all households, it may be necessary to provide some additional
housing with particular characteristics leaving an equivalent number of dwellings (with different
characteristics) available to meet housing needs and demands from elsewhere in the market.
Southwark Housing Requirements Study 2008
Page 24
Established Households Living in Unsuitable Housing
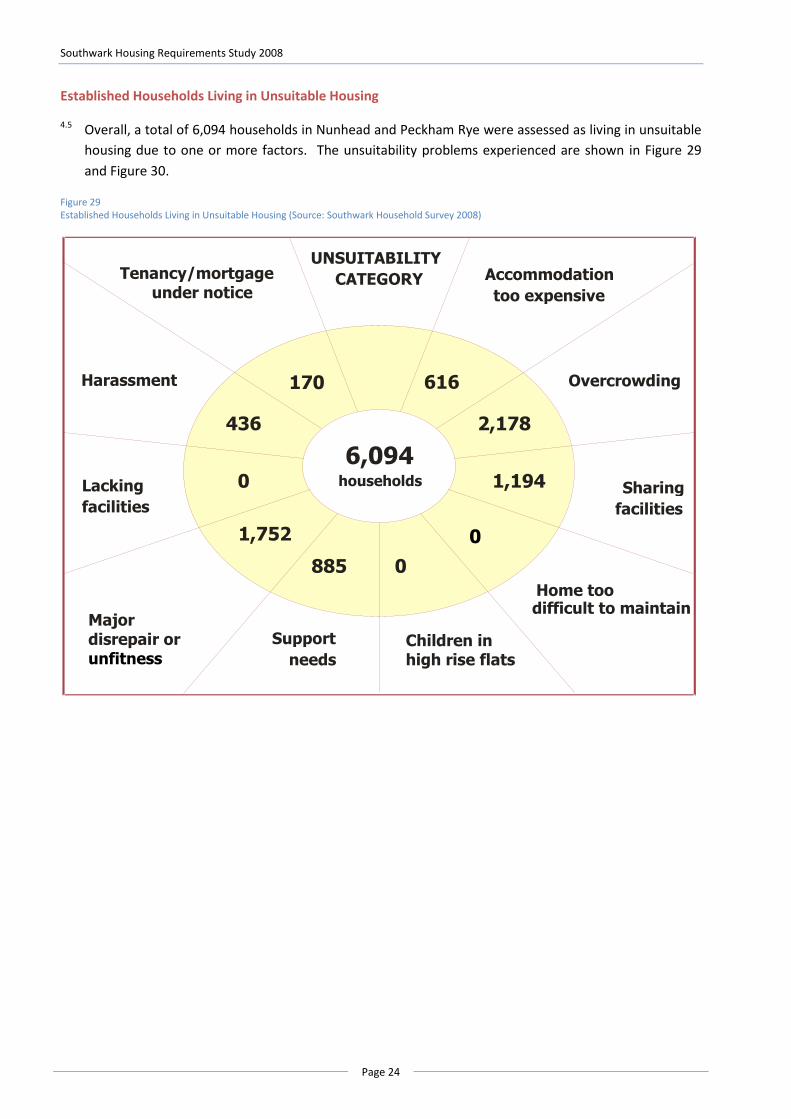
4.5 Overall, a total of 6,094 households in Nunhead and Peckham Rye were assessed as living in unsuitable
housing due to one or more factors. The unsuitability problems experienced are shown in Figure 29
and Figure 30.
Figure 29 Established Households Living in Unsuitable Housing (Source: Southwark Household Survey 2008)
Overcrowding
Sharing
facilities
Home too difficult to maintain
Children in high rise flats
Support
needs
Major disrepair or unfitness
Lacking
facilities
Harassment
Tenancy/mortgage under notice
170
436
0
1,752
885
616
2,178
1,194
0
0
6,094
households
UNSUITABILITY
CATEGORY Accommodation
too expensive
Chapter 4: Unsuitably Housed Existing Households
Page 25
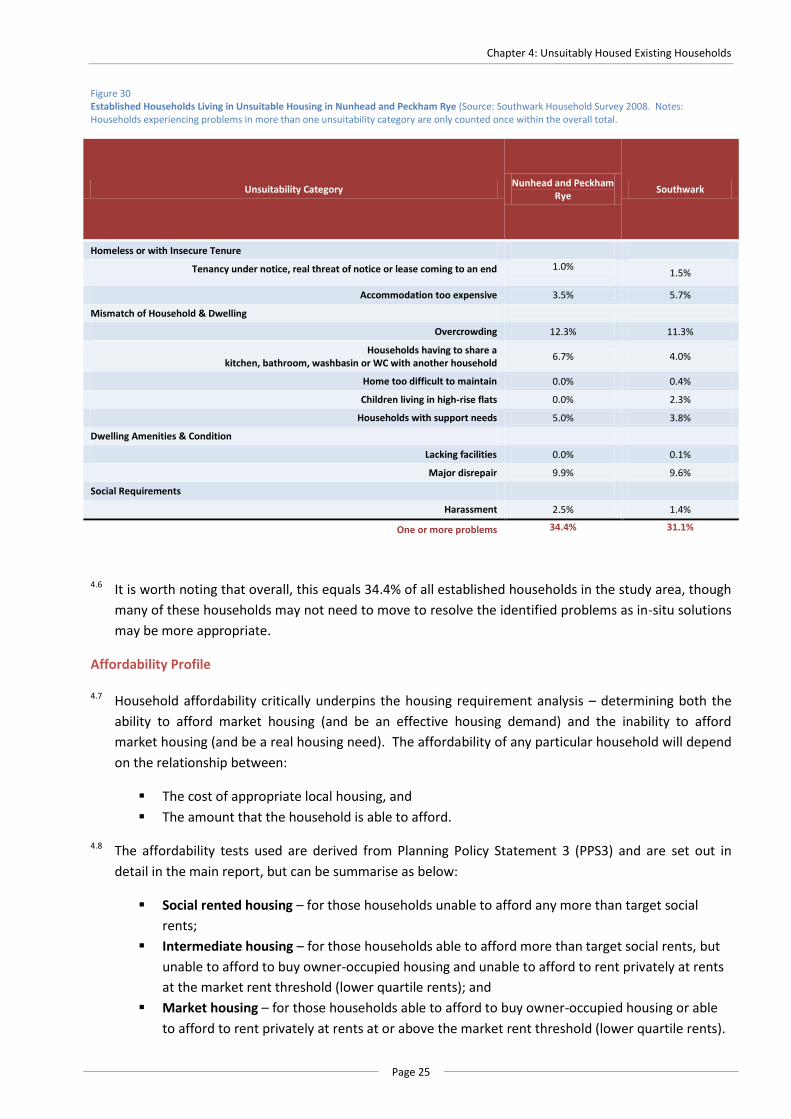
Figure 30 Established Households Living in Unsuitable Housing in Nunhead and Peckham Rye (Source: Southwark Household Survey 2008. Notes: Households experiencing problems in more than one unsuitability category are only counted once within the overall total.
Unsuitability Category Nunhead and Peckham
Rye Southwark
Homeless or with Insecure Tenure
Tenancy under notice, real threat of notice or lease coming to an end 1.0%
1.5%
Accommodation too expensive 3.5% 5.7%
Mismatch of Household & Dwelling
Overcrowding 12.3% 11.3%
Households having to share a kitchen, bathroom, washbasin or WC with another household
6.7% 4.0%
Home too difficult to maintain 0.0% 0.4%
Children living in high-rise flats 0.0% 2.3%
Households with support needs 5.0% 3.8%
Dwelling Amenities & Condition
Lacking facilities 0.0% 0.1%
Major disrepair 9.9% 9.6%
Social Requirements
Harassment 2.5% 1.4%
One or more problems 34.4%
31.1%
4.6 It is worth noting that overall, this equals 34.4% of all established households in the study area, though
many of these households may not need to move to resolve the identified problems as in-situ solutions
may be more appropriate.
Affordability Profile
4.7 Household affordability critically underpins the housing requirement analysis – determining both the
ability to afford market housing (and be an effective housing demand) and the inability to afford
market housing (and be a real housing need). The affordability of any particular household will depend
on the relationship between:
The cost of appropriate local housing, and
The amount that the household is able to afford.
4.8 The affordability tests used are derived from Planning Policy Statement 3 (PPS3) and are set out in
detail in the main report, but can be summarise as below:
Social rented housing – for those households unable to afford any more than target social
rents;
Intermediate housing – for those households able to afford more than target social rents, but
unable to afford to buy owner-occupied housing and unable to afford to rent privately at rents
at the market rent threshold (lower quartile rents); and
Market housing – for those households able to afford to buy owner-occupied housing or able
to afford to rent privately at rents at or above the market rent threshold (lower quartile rents).
Southwark Housing Requirements Study 2008
Page 26
4.9 Nevertheless, whilst PPS3 defines intermediate housing as being for those households able to afford
more than social rents, it should be recognised that it may not be possible to pragmatically deliver a
housing product for those households only able to afford fractionally more than social rents.
4.10 As an illustration of the importance of this distinction, Figure 31 highlights the level of household
income necessary to afford particular tenures. This shows that any household with an income of more
than £15,400 per annum requiring a 1-bed property can afford more than Housing Corporation Target
Rents. Therefore, under PPS3 definitions, these households are defined as requiring intermediate
housing.
4.11 In practice it is difficult to deliver intermediate housing products which are accessible for households
with incomes close to £15,400. Currently there are no intermediate housing products available in
Southwark for households with incomes of less than £29,000 per annum.
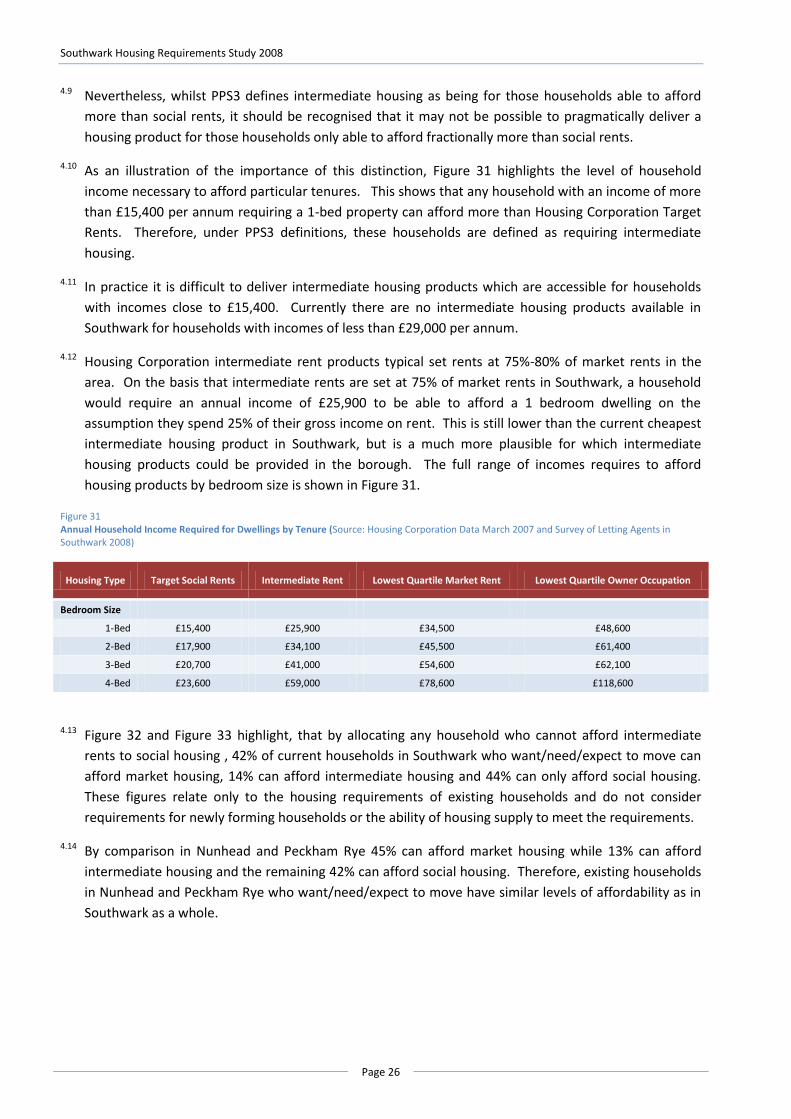
4.12 Housing Corporation intermediate rent products typical set rents at 75%-80% of market rents in the
area. On the basis that intermediate rents are set at 75% of market rents in Southwark, a household
would require an annual income of £25,900 to be able to afford a 1 bedroom dwelling on the
assumption they spend 25% of their gross income on rent. This is still lower than the current cheapest
intermediate housing product in Southwark, but is a much more plausible for which intermediate
housing products could be provided in the borough. The full range of incomes requires to afford
housing products by bedroom size is shown in Figure 31.
Figure 31 Annual Household Income Required for Dwellings by Tenure (Source: Housing Corporation Data March 2007 and Survey of Letting Agents in Southwark 2008)
Housing Type Target Social Rents Intermediate Rent Lowest Quartile Market Rent Lowest Quartile Owner Occupation
Bedroom Size
1-Bed £15,400 £25,900 £34,500 £48,600
2-Bed £17,900 £34,100 £45,500 £61,400
3-Bed £20,700 £41,000 £54,600 £62,100
4-Bed £23,600 £59,000 £78,600 £118,600
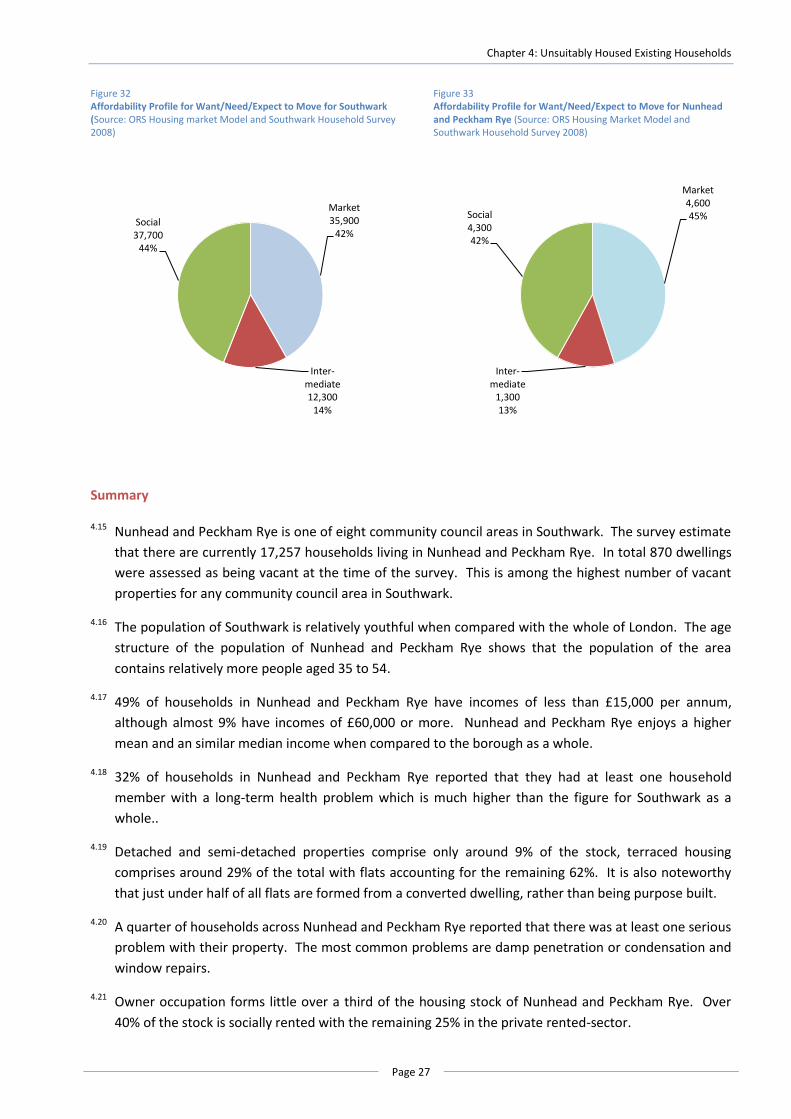
4.13 Figure 32 and Figure 33 highlight, that by allocating any household who cannot afford intermediate
rents to social housing , 42% of current households in Southwark who want/need/expect to move can
afford market housing, 14% can afford intermediate housing and 44% can only afford social housing.
These figures relate only to the housing requirements of existing households and do not consider
requirements for newly forming households or the ability of housing supply to meet the requirements.
4.14 By comparison in Nunhead and Peckham Rye 45% can afford market housing while 13% can afford
intermediate housing and the remaining 42% can afford social housing. Therefore, existing households
in Nunhead and Peckham Rye who want/need/expect to move have similar levels of affordability as in
Southwark as a whole.
Chapter 4: Unsuitably Housed Existing Households
Page 27
Figure 32 Affordability Profile for Want/Need/Expect to Move for Southwark (Source: ORS Housing market Model and Southwark Household Survey 2008)
Figure 33 Affordability Profile for Want/Need/Expect to Move for Nunhead and Peckham Rye (Source: ORS Housing Market Model and Southwark Household Survey 2008)
Summary
4.15 Nunhead and Peckham Rye is one of eight community council areas in Southwark. The survey estimate
that there are currently 17,257 households living in Nunhead and Peckham Rye. In total 870 dwellings
were assessed as being vacant at the time of the survey. This is among the highest number of vacant
properties for any community council area in Southwark.
4.16 The population of Southwark is relatively youthful when compared with the whole of London. The age
structure of the population of Nunhead and Peckham Rye shows that the population of the area
contains relatively more people aged 35 to 54.
4.17 49% of households in Nunhead and Peckham Rye have incomes of less than £15,000 per annum,
although almost 9% have incomes of £60,000 or more. Nunhead and Peckham Rye enjoys a higher
mean and an similar median income when compared to the borough as a whole.
4.18 32% of households in Nunhead and Peckham Rye reported that they had at least one household
member with a long-term health problem which is much higher than the figure for Southwark as a
whole..
4.19 Detached and semi-detached properties comprise only around 9% of the stock, terraced housing
comprises around 29% of the total with flats accounting for the remaining 62%. It is also noteworthy
that just under half of all flats are formed from a converted dwelling, rather than being purpose built.
4.20 A quarter of households across Nunhead and Peckham Rye reported that there was at least one serious
problem with their property. The most common problems are damp penetration or condensation and
window repairs.
4.21 Owner occupation forms little over a third of the housing stock of Nunhead and Peckham Rye. Over
40% of the stock is socially rented with the remaining 25% in the private rented-sector.
Market35,900
42%
Inter-mediate12,300
14%
Social37,700
44%
Market4,60045%
Inter-mediate
1,30013%
Social4,30042%
Southwark Housing Requirements Study 2008
Page 28
4.22 Around 12% of all households across Nunhead and Peckham Rye live in overcrowded conditions while
around 41% of households in Nunhead and Peckham Rye are currently under-occupying their property,
which is similar to the Southwark figure of 40%.
4.23 Overall over 83% of householders in Nunhead and Peckham Rye were satisfied with their current
property while around 11% expressed dissatisfaction with their property.
4.24 33% of respondents to the survey in Nunhead and Peckham Rye reported that they wanted to move.
Around 12% of all households (not just households who want to move) in Nunhead and Peckham Rye
would like to move because they feel that their current property is too small. Many wanted to move in
order to find a better house (6.4%) or a better quality of life (5.1%).
4.25 A total of 6,094 households in Nunhead and Peckham Rye were assessed as living in unsuitable housing
due to one or more factors. This equals 34.4% of all established households in the study area, which is
higher than the equivalent figure for Southwark as a whole of 31.1%.
4.26 Of the households in Nunhead and Peckham Rye who want/need/expect to move, 45% can afford
market housing while 13% can afford intermediate housing and the remaining 42% can afford social
housing. Therefore, existing households in Nunhead and Peckham Rye who want/need/expect to move
have similar levels of affordability as in Southwark as a whole.