Instructions for use
Title Study on the dynamics and inheritance of mitochondria during conidiation in Pyricularia oryzae
Author(s) Balagalle Rajapaksha Mudiyanselage Gonigoda Walauwe, Dineesha Nipuni Balagalla
Citation 北海道大学. 博士(農学) 甲第14651号
Issue Date 2021-09-24
DOI 10.14943/doctoral.k14651
Doc URL http://hdl.handle.net/2115/83135
Type theses (doctoral)
File Information dineesha_nipuni_balagalla.pdf
Hokkaido University Collection of Scholarly and Academic Papers : HUSCAP
一
Study on the dynamics and inheritance of mitochondria during
conidiation in Pyricularia oryzae
(イネいもち病菌の分生子形成時のミトコンドリアの動態と伝搬に関
する研究)
Balagalle Rajapaksha Mudiyanselage Gonigoda Walauwe Dineesha
Nipuni Balagalla
Submitted to the Graduate School of Agriculture
Hokkaido University
June 2021
In Partial Fulfilment of the Requirement for the Degree of Doctor of
Philosophy in Agriculture

i
CONTENTS
LIST OF FIGURES iii
LIST OF TABLES iv
ABSTEACT v
Chapter 1
GENERAL INTRODUCTION 1
Chapter 2
VISUALIZATION OF MOVEMENT OF MITOCHONDRIA IN
Pyricularia oryzae USING CITRASE A – GFP 16
Introduction 16
Methodology 19
Results 21
Discussion 31
Chapter 3
ESTABLISHMENT OF REAL-TIME PCR PROTOCOL 33
Introduction 33
Methodology 35
Results 40
Discussion 43
Chapter 4
q-RT-PCR TO QUANTITY ISOLATES FOR THE HOMOPLASMY AND
HETEROPLASMY CONDITION 44
Introduction 44
Methodology 47
Results 51
Discussion 52

ii
Chapter 5
General Discussion 53
REFERENCES 56
ACKNOWLEDGEMENT 63
iii
LIST OF FIGURES
Figure 1 Symptoms of Magnaporthe oryzae infection in rice 3
Figure 2 life cycle of the rice blast fungus P. oryzae 5
Figure 3: Single isolate can develop into blaso and gangliar conidia in P. oryzae 6
Figure 4: Blasto-conidia in P. oryzae 7
Figure 5 General functions of mitochondria 9
Figure 6 TCA cycle 11
Figure 7 The slide culture system 20
Figure 8 Representative series of observations observed under lower
magnification (20X) 23-24
Figure 9 Mitochondrial movement and morphology during conidia 27-28
Figure 10 Mitochondrial movement and morphology during
conidia development 29-30
Figure 11 Mitochondrial distribution during budding in S. cerevisiae 46
iv
LIST OF TABLES
Table 1: Summary of the observations of mitochondrial movement into
coniduim from condiaphore in P. oryzae 26
Table 2. Composition of reaction mixture for q-RT-PCR
(SYBR Green ER qPCR SuperMix for ABIPRISM) 36
Table 3. Condition of reaction for qPCR (SYBR Green ER qPCR
SuperMix for ABIPRISM) 36
Table 4. Composition of reaction mixture for qPCR (Go Taq qPCR Master Mix) 37
Table 5. Condition of reaction for qPCR (Go Taq qPCR Master Mix) 37
Table 6: Primer list for amplification of wild type and
QoI resistant type of cyt b allele 39
Table 7 Mean total copy number of WT and MT alleles per total DNA 41
Table 8 WT and MT allele copy number per total DNA and WT / MT ratio
in sensitive and resistant strains 42
Table 9: Enzyme reaction mixture 49
Table 10 q-RT-PCR conditions 50
Table 11 Primer list for amplification of wild type and QoI resistant type allele 50
Table 12 Ratio between wild type allele and resistant allele in colonies
with P. oryzae with conidiation and with no-conidiation 51
v
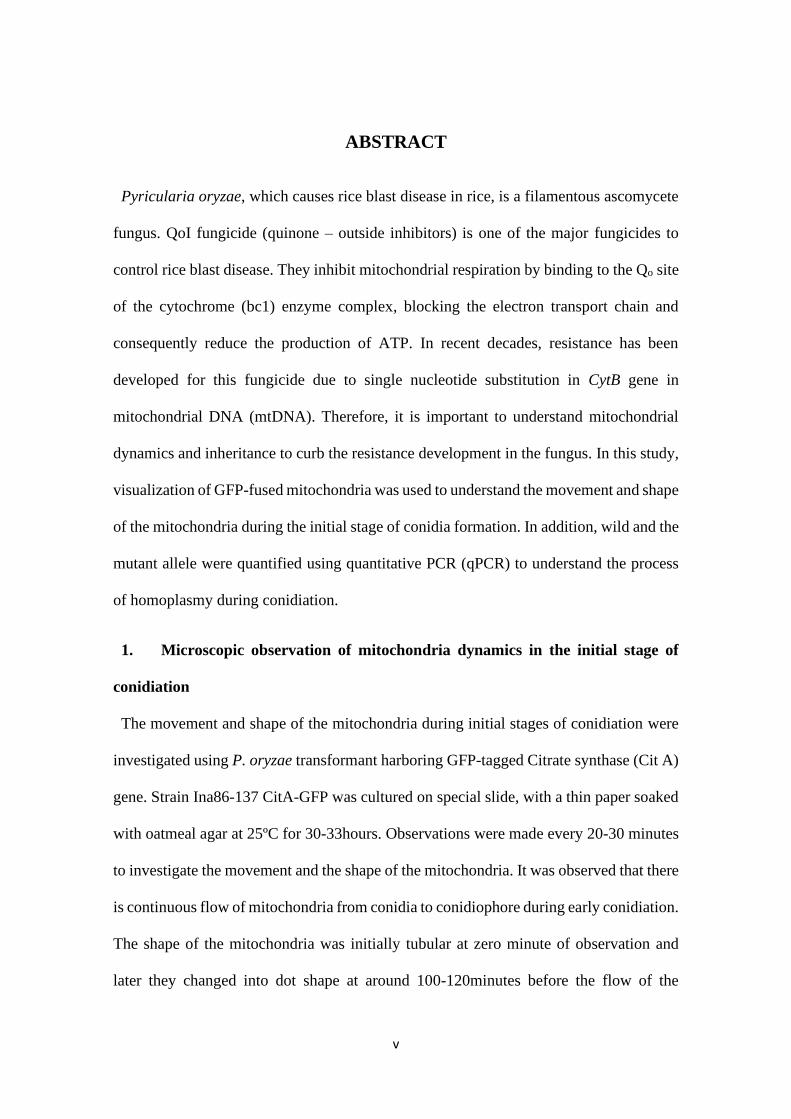
ABSTRACT
Pyricularia oryzae, which causes rice blast disease in rice, is a filamentous ascomycete
fungus. QoI fungicide (quinone – outside inhibitors) is one of the major fungicides to
control rice blast disease. They inhibit mitochondrial respiration by binding to the Qo site
of the cytochrome (bc1) enzyme complex, blocking the electron transport chain and
consequently reduce the production of ATP. In recent decades, resistance has been
developed for this fungicide due to single nucleotide substitution in CytB gene in
mitochondrial DNA (mtDNA). Therefore, it is important to understand mitochondrial
dynamics and inheritance to curb the resistance development in the fungus. In this study,
visualization of GFP-fused mitochondria was used to understand the movement and shape
of the mitochondria during the initial stage of conidia formation. In addition, wild and the
mutant allele were quantified using quantitative PCR (qPCR) to understand the process
of homoplasmy during conidiation.
1. Microscopic observation of mitochondria dynamics in the initial stage of
conidiation
The movement and shape of the mitochondria during initial stages of conidiation were
investigated using P. oryzae transformant harboring GFP-tagged Citrate synthase (Cit A)
gene. Strain Ina86-137 CitA-GFP was cultured on special slide, with a thin paper soaked
with oatmeal agar at 25ºC for 30-33hours. Observations were made every 20-30 minutes
to investigate the movement and the shape of the mitochondria. It was observed that there
is continuous flow of mitochondria from conidia to conidiophore during early conidiation.
The shape of the mitochondria was initially tubular at zero minute of observation and
later they changed into dot shape at around 100-120minutes before the flow of the
vi
mitochondria stops. Septa formation was also observed parallel to development of dot
shaped mitochondria.
It is very important to understand about the shape and movement of mitochondria during
conidiation to introduce novel strategies to control rice blast disease.
2. Establishment of qPCR for the quantification of Cytb alleles in mtDNA
One nucleotide substitution in the cytochrome b (Cytb) gene had been revealed to
develop resistance against QoI fungicides. Absolute qPCR system was established to
quantify each Cytb allele in this study, in order to monitor the ratio of resistant and wild
type allele in a strain. A linear standard curve was produced using standard DNA clone
of each allele, for 108-104 copies. Two resistant (R) field isolates and one susceptible field
isolate (S) were collected from each Akita and Hyogo prefectures. They are namely,
2013-156 (R), 2013-131(R), 2013-208(S) and 128(R), 132 (R), 130(S). The quantity of
the alleles were measured using qPCR and ratio of resistant and wild type allele were
calculated. The WT : MT ratio of the resistant strains, 2013-156, 2013-131, 128r, and
132r were 1 : 1.05x10³, 1 : 2.02x10³, 1 : 7.76x10², and 1 : 272x103 respectively. In the
susceptible strains 2013-208 and 130s the WT : MT ratio was 5.21x10² : 1 and 9.07x10² :
1 respectively. The quantity of the MT allele of the resistant strains was higher compared
to the WT alleles. In the susceptible strains the quantity of WT allele was higher compared
to the MT allele.
3. Elucidation of relationship between conidiation and homoplasmy
Occurrence of mutation in mitochondria will lead the heterogeneity of mitochondria in
a cell, which is called heteroplasmy. Heteroplasmy is not stable, and often return to the
condition called homoplasmy, in which one type of mitochondria dominates in a cell.
vii
Occurrence and rapid spread of QoI resistant mitochondria in the wild population can be
considered as a result of homoplasmy, but no investigation on the process to be
homoplasmy in P. oryzae. In order to study about homoplasmy and a conidiation, a
artificial heteroplasmy strain having similar amount of wild type allele and mutant allele
Cytb mtDNA was produced using PEG-mediated protoplast fusion. This heteroplasmy
was then used to generate single colony isolates with conidiation and without conidiation,
by single conidia isolation and single protoplast isolation, respectively. The isolates with
conidiation showed homoplasy when the quantity of the alleles were measured using
qPCR. Those isolates had almost only the wild type allele. Isolates without conidiation
retained heteroplasmy. These results suggested that conidiation is acting as an important
process to maintain homoplasmy of mitochondrial DNA.
This study demonstrated that the conidiation, which is an important event for P. oryzae
which produces the cell required for the pathogenesis, is the key event for the spread of
QoI resistance as well. Further analyses using qPCR system for CytB alleles and
fluorescent microscopic observation of mitochondria may help to mitigate building-up of
QoI fungicide resistance in P. oryzae and will have a great impact on the developing
sustainable management practices against the rice blast disease in the future.
1
Chapter 1
GENERAL INTRODUCTION
Pyricularia oryzae, which causes rice blast disease in rice is a filamentous ascomycete
fungus. P. oryzae is also the causal agent of blast disease of many cereals (Fernandez and
Orth, 2018). This pathogen has a host range of over 50 species including many
economically important cereals and grasses (Schulze-Lefert and Panstruga, 2011).
According to Nalley et al., 2016, around 30% global rice production is loss due to rice
blast, which is equivalent of feeding 60 million people annually. More than 55% of the
world population lives in Asia and around 92% of the rice grown and consume rice
(Barker et al, 1985). According to the analysis done by International Food Policy
Research Institute, there is 3% increase in the rice demand in every year and there will be
38% increase by 2030 (Wilson and Talbot, 2009). China, Korea, Japan, Vietnam and
United States had to destroy 5.7million hectares of rice in 2001 to 2005 due to rice blast
disease (Wilson and Talbot, 2009).
In recent years, P. oryzae has attracted attention of many researchers due to its economic
importance and as a model organism to investigate plant diseases. Therefore, detailed
information of different strains of P. oryzae and sequence data of the genome has become
wildly available (Chen et al, 2020; Wilson and Talbot, 2009; Zhu et al, 2016). P. oryzae
can infect leaves, stems, nodes and panicles of rice which include all stages of
development of the plant (Fig 1a-c). It was found that this fungus can even infect roots of
the rice plant (Sesma and Osbourn 2004). Upon infection in rice seedlings, small lesions

2
with a necrotic centre and a chlorotic margin are visible on leaves (Rahnama et al, 2020).
The major economic damage is caused by the neck and panicle blast which occurs in the
reproductive stage of the rice plant (Fig. 1b). This can drastically reduce the grain yield
per plant. On mature leaves large lesions with a necrotic centre and a chlorotic margin are
visible (Fig. 1c).

3
Figure 1 Symptoms of Magnaporthe oryzae infection in rice. a, Rice blast affects
seedlings, causing a leaf spot disease characterized by spreading lesions with a necrotic
centre and a chlorotic margin. b, In the field, neck and panicle blast are the major causes
of rice yield losses. The fungus sporulates profusely at nodes on the rice stem and rots the
neck of the mature rice plant, either causing the panicle to be lost or preventing grain
filling and maturation. c, Large rice blast lesions, which can be more than 1 cm in length,
on a mature rice plant. P. oryzae sporulates from lesions, and spores are dispersed by
dewdrop splash. Images are from Wilson and Talbot (2009).
b c a
4
Life cycle of P. oryzae
P. oryzae has seven chromosomes and a genome size of 40Mb, with approximately 9,000
genes. The pathogen cause blast spots on infected plants and aerial conidiophores emerge
from the conidia on the centre of the lesions which develops into a haploid ascomysete
(Boddy, 2016). P. oryzae undergo series of developmental stages to infect the host plant.
Initiation of infection happens when the three celled tear drop-shaped conidia attached to
the rice leaf cuticle. The conidia contain glycoprotein which becomes adhesive when wet
and helps to stick to the leaf surface. This aids the conidia to be spread with the help of
rain and wind and usually outbreak during rainy season or transition to rainy season (Asibi
et al. 2019; Dean et al, 2005). Upon a conidium stick on to a leaf tissue, one of the terminal
cells start germinating rapidly and produce germ tube to consequently penetrate the leaf
cuticle. Thus, the apex of the germ tube becomes swollen and flattened developing into
an appressorium. An appressorium is a specialized cell with a melanin-lined thickened
cell wall (Perez-Nadales, 2014). A penetration peg is produced at the bottom of the
appressorium which penetrates the leaf surface and enters the cell. This leads to a
successful infection of P. oryzae and new disease lesions will become visible about 4
days after inoculation (Fig. 2).
5
Figure 2 life cycle of the rice blast fungus P. oryzae (Wilson and Talbot, 2009).

6
Figure 3: Single isolate can develop into blaso and gangliar conidia in M oryzae. a-e,
development of blastoconidia. Blastoconidia generally detached at the conidiophore when
they become mature. f-j, development of gangliar conidia. They remain attached to the
conidiophore when they become mature (Rao and Jesudhas, 1984).
7
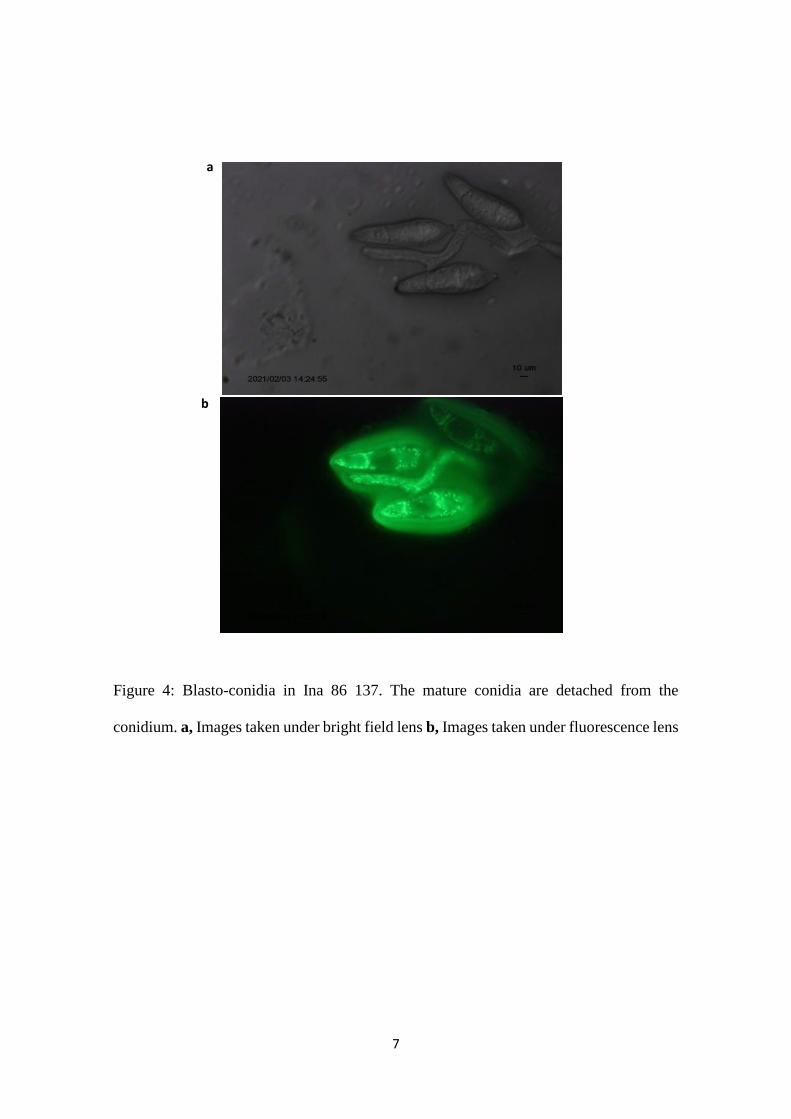
Figure 4: Blasto-conidia in Ina 86 137. The mature conidia are detached from the
conidium. a, Images taken under bright field lens b, Images taken under fluorescence lens
a
b
8
There are two types of conidiation in P. oryzae, namely blasto and gangliar (Fig 3).
Protuberance will arise at the tip of the conidiophore and it appears like a narrow
constriction. Later the three celled conidia will be formed and it will develop its shape
and size (Rao and Jesudhas, 1984). Blasto-conidia in P. oryzae when mature conidia are
detached from the conidium is shown in Fig 4.
Mitochondria
Emergence of mitochondria in a cell was described as an adaptation to deal with oxygen
in atmosphere (Sagan 1967). In general, Mitochondria are called as the power house of a
cell. Mitochondria, the main generator of adenosine triphosphate (ATP) are a semi-
autonomous double-membrane bound organelle. ATP is important for diverse cellular
functions which ultimately result in various physiological processes such as redox
signalling, homeostasis, lipid metabolism and programmed cell death. Mitochondria have
more importance in recent decade because it performs various functions other than ATP
and macromolecules production. Furthermore, mitochondria have role in cell homeostasis
by involving in signalling events namely, release of cytochrome c to invoke caspase-
dependent cell death, release of reactive oxygen species to oxidize thiols within redox-
regulated proteins, and induce gene expression and the activation of AMPK under
energetic stress to control mitochondrial dynamics (Martínez-Reyes, I. and Chandel, N.S.,
2020). The graphical representation of the general functions of mitochondria is given in
Figure 5.

9
Figure 5 General functions of mitochondria.
10
TCA cycle
Mitochondria provide chemical energy for the cell in the form of ATP produced through
the TCA cycle. Respirosomes are supercomplex molecules (complex I, III and IV) which
are present in inner mitochondrial membrane to carry-out the oxidation process. They
oxidize NADH and transfer electrons to final electron acceptor (oxygen). Electron
transport chain results in proton motive force across mitochondrial membrane into inter-
membrane space which will provide flow of protons for the generation of ATP (Figure
6).

11
Figure 6 TCA cycle. In a series of enzymatic reactions, electrons are transferred to the
electron transport chain (ETC) which is known as the mitochondrial respiratory chain.
12
Mitochondrial DNA
Mitochondrial DNA (mtDNA) can be defined as DNA present in mitochondrion and also
additional DNA types (small linear plasmid-like DNA) that are present in the
mitochondria. These DNA can replicate independently and contains protein–encoding
genes that are responsible for respirasome production. Conversely, there has to be
compatibility between nuclear encoded and mitochondrially encoded components for the
proper function of mitochondria. mtDNA is more prone to mutations than that of nuclear
DNA but they lack efficient repair mechanism in them. There can be simultaneous
mutations in different Mt DNA, thus it might surpass the wild type mtDNA (Mendoza et
al 2020).
Fusion and fission
Fusion and fission in mitochondria is a continuous process which occurs during its growth.
These two opposing processes give a dynamic shape to mitochondria which leads to a
variety of morphologies. Mitochondrial number is also regulated by fission and fusion
process and these processes can determine the number of mitochondria per cell at any
specific time. It is linked with development process like cell cycle as well. These
processes have role in mitochondrial structural integrity, function and appropriate
distribution into cells and helps cells to adapt to the environment context. Therefore,
mitochondria morphology is also highly dynamic and can range from elongated or
interconnected networks spanning the whole cell (Westermann, 2010). Mitochondria
exchange both soluble and membrane components during fission therefore they can repair
“transient defects” through this process (Lackner 2014).
13
There are molecules called as “dynamins” which are superfamily GTPase proteins
(DRPs). They are found in rice blast fungus and further studies have shown that MoDnm1,
MoFis1 and MoMdv1 are in complex to regulate mitochondrial fisson, mitophagy
progression and appressorium function and host penetration (Zhong et al 2016). Dnm1
is present in cytosol and it must be delivered to mitochondrial outer membrane for proper
function (Bui et al 2012) and it is involved to maintain equilibrium between fission and
fusion (Westermann 2010). Recent research evidence suggest that Dnm1 is the master
regulator of mitochondrial division (Zhong et al 2016).
Autophagy and mitophagy
Autophagy and mitophagy are crucial cellular processes that are responsible to maintain
cell equilibrium and these processes can selectively eliminate dysfunctional organells
(Youle and Narendra 2011). The main role of mitochondria in conidia is to provide the
energy for germination and growth before the host is parasitized (Li and Calderone 2017).
There is a transition period from biotrophy to nectrotrophy in M oryzae and during this
period mitochondrial dynamics and mitophagy is crucial (Kou et al 2019). Mitochondria
in conidia have a much more important role in germination and growth before the fungus
has completely transformed into nectrotrophy (Li and Calderone 2017).
14
QoI fungicide (Strobilrin fungicide)
QoI fungicide (quinone – outside inhibotors) are most important class of fungicide and it
is recorded as highest selling fungicide in the world (Ishii 2006). They inhibit
mitochondrial respiration by binding to the Qo site of the cytochrome (bc1) enzyme
complex. It will block the electron transfer and then block the production of ATP. This
fungicide is specific for single binding site and therefore they have high probability of the
developing fungicide resistance.
In recent years, M oryzae has undergone single nucleotide mutation at cytochrome b (cyt
b) gene that prevents the binding of the fungicide at Qo site. Further, they have developed
fungicide resistance by undergoing single nucleotide substitution at the same site, from
glycine to alanine at position 143 (G143A) or from phenyl alanine to leucine at position
129 (F129L) (Castroagudín et al 2015).
In the last decade, monitoring QoI fungicide resistance was started in Japan. It has been
identified that the QoI fungicide sensitivity of rice blast fungus has lost in some rice-
growing areas in Japan (Ishii 2015). In 2012 in Japan the emergence of a QoI resistant
strain in P. oryzae was detected in three prefectures, Yamaguchi, Shimane, and Ehime.
Resistance was showed to the metominostrobin, orysastrobin and azoxystrobin which
were all QoI fungicides (Miyagawa et al, 2013). In Brazil, QoI resistant P. oryzae was
reported due to a single amino acid substitution, at position 143 (G143A) and this resistant
population increased from 36% to 90% in 2005 to 2012 (Castroagudín et al. 2015). After
discontinuance of QoI fungicides in Japan the frequencies of QoI resistant strains reported
to be decreased significantly (Hayashi et al. 2017).

15
Strobilurins have become ineffective to control M oryzae infection during past decades
due to few reasons. Main reason could be incomplete understanding of pathogen’s life
cycle and extensive usage for decades to control the fungal infection.
16
Chapter 2
VISUALIZATION OF MOVEMENT OF MITOCHONDRIA IN
Pyricularia oryzae USING CITRASE A – GFP
2.1. Introduction
2.1.1 Microscopic observation
Microscopic observations are the best way to evaluate entire mitochondria with each
aspect. The two basic types of microscopy are light microscope or electron microscope
and they have their own advantages and disadvantages in visualization of mitochondria.
There are few methods to measure the cellular mitochondrial content but 3D imaging is
the only way to directly assess the volume of a cell that is occupied by mitochondria. 3D
visualization is helpful to understand more about mitochondria without any blind spots
(Syib’li et al 2020). There are few methods to visualize mitochondria under microscope,
namely, 1. Label mitochondria in live cells using fluorescent dye; 2. Use mitochondria
specific fluorescent antibodies; 3. Label with genetically encoded fluorescent dyes
(Glancy 2020). Mito Tracker series of dyes work by binding to thiol groups within
mitochondria and green fluorescent and MitoTracker can colocalized inside conidia
(Syib’li et al 2020). The first report of the use of GFP as a mitochondrial marker was
published in 1995 (Rizzuto et al 1995). The importance of visualizing mitochondria is
that the number of mitochondria in a live cell is directly proportional to the cellular
capacity of mitochondrial function (Glancy 2020).
17
2.1.2 GFP (Green Fluorescence Protein)
GFP was first cloned by Prasher (Prasher 1992) from jellyfish Aequorea victoria. This
protein has very unique characteristics such as 238 amino acid, 27-kDa protein which
absorbs light at maxima of 395 and 475 nm and emits light at maximum of 508 nm. It
does not need any cofactor or substrate for its activity and it is proven to be stable in vivo
(Lorang et al 2001). It can be fused to C or N terminus of many cellular and extra cellular
proteins without loss of activity.
GFP has been expressed and used in many organisms as a reporter for gene expression
and as a fluorescent tag for monitoring the subcellular localization in living cells (Kain et
al 1955).
2.1.3 Conidiation/ Conidiogenesis
Conidia are also called as asexual spores and are involved in the disease cycle of the
fungus. Hydration is the most important factor for this fungus to attach to the host plant
and to produce germ tube. This fungus develops a specialized infection structure known
as appressorium which generates the turgor pressure needed for penetration through host
cell. Once the invasive hyphae are developed, it will colonize and produce massive
conidia. This is known as the ‘infection cycle’ and may occur many times during the
growing season. Cascade of morphological events are involved in Conidiation and P.
oryzae produces three celled conidia through conidiation. It was shown that some
mutants of P. oryzae has different ability to conidiate at different timings (Han et al 2018).
18
2.1.4 Mitochondria in conidia
Mitochondria in conidia were visualized using confocal microscope and mitochondria
have different shapes based on length such as dots, tubules and network (Syib’li et al
2020). A novel version of mitograph was developed to quantify mitochondrial content in
living cells (Viana et al 2015) and it was used to quantify mitochondrion at the hyphal tip.
Dot shaped mitochondria were observed in hyphal tips and older hyphae had tubule
shaped mitochondria (Syib’li et al 2020). It was observed that mean volume of
mitochondria observed at the tip of hyphae is always smaller than the basal part (Syib’li
et al 2020).
Recently, the emergence of a QoI resistance by a single point mutation at cytochrome b
(Cytb) gene in P. oryzae was detected and has been widespread in Japan (Miyagawa et al.
2013; Ishii 2015; Castroagudín et al. 2015). On the other hand, after discontinuance of
QoI fungicides in Japan the frequencies of QoI resistant strains reported to be decreased
significantly (Hayashi et al. 2017). In order to clarify the mechanism of this phenomenon,
it is necessary to characterize mitochondrial behavior of P. oryzae especially during the
early stages of conidiation.
It is very important to understand the molecular mechanism involved in conidiation and
mitochondrial distribution to introduce novel strategies to control rice blast disease.
19
2.2 Methodology
2.1.1 Preparation of slide culture
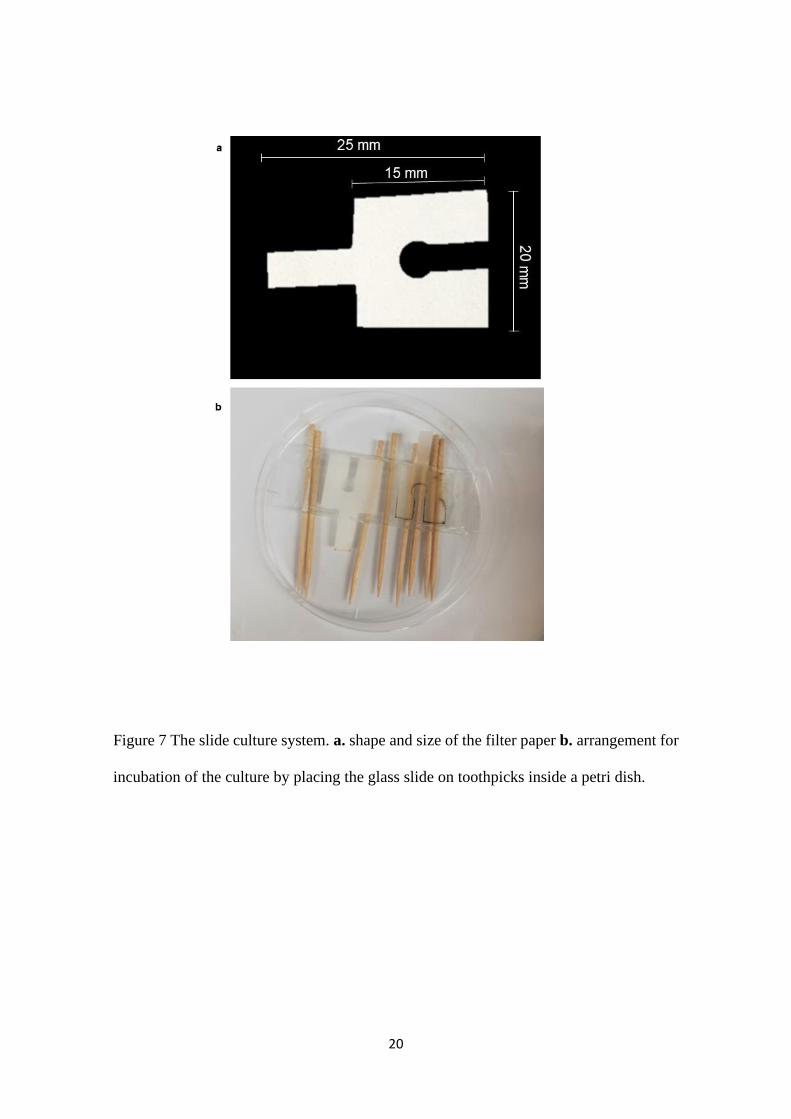
The filter papers were prepared (Figure 7a) and autoclaved. In order to characterize the
mitochondrial movement and morphology during early conidiation, CitA-GFP fused
strain (Syib’li et al. 2020) cultured on the filter paper soaked with oatmeal agar media
were used. Thin filter paper (20 mm × 25 mm) was cut into the shape shown in figure7a
and was soaked with the agar media. This filter paper was placed on a glass slide and
pressed with coverslip to spread of the media evenly. Small piece of filter paper (5 mm
×5 mm) pre inoculated with the fungus was used for the inoculation. Later, it was covered
with a coverslip. To prevent the filter paper from drying the coverslip and the filter paper
was sealed using ‘Vaseline’. The glass slides were placed on several toothpicks, inside a
petri dish as shown in figure 7b and incubated at 25°C for 30-33 h. The humidity was
maintained in the slide by adding water into extra filter paper placed on the slide.
The slides were observed under fluorescence microscope at 20X and 100X. The images
were captured under bright field and fluorescence light. The system used was
fluorescence microscope (Olympus BX 50) and all images were taken at bright field and
fluorescence light in 20-30 minutes of time laps.
20
Figure 7 The slide culture system. a. shape and size of the filter paper b. arrangement for
incubation of the culture by placing the glass slide on toothpicks inside a petri dish.
21
2.3 Results
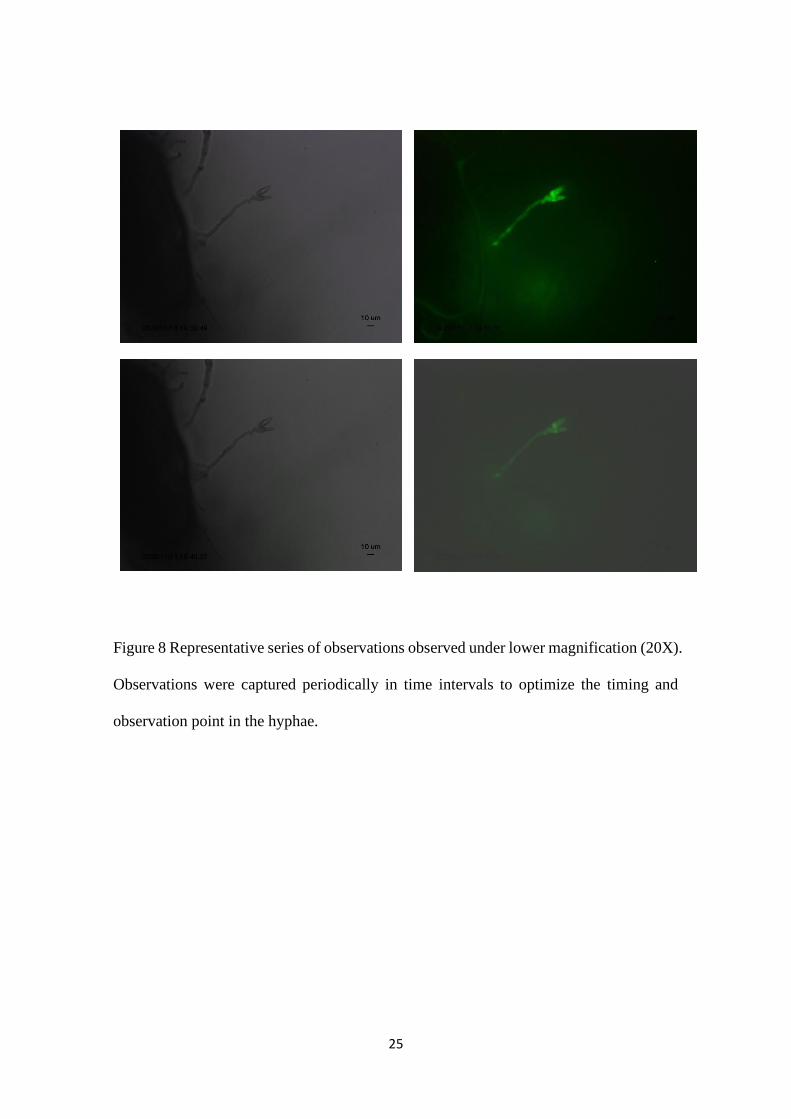
For the mitochondria observation during conidiation initiation, periodical observations
were made. Initially the observations were under lower magnification (20X)
magnification. Four observations were captured periodically in time intervals in lower
magnification to optimize the timing and observation point in the hyphae. One
representative series of observations were shown in figure 8. Observations were made
around every 25minutes till the conidia turn into two celled conidia using lower
magnification. Development of protuberance from conidiophore was easily
distinguishable under lower magnification. It was not easy to observe the shape and
moment where the flow of the mitochondria stops under this magnification.
Later, the observations were made under higher magnification (100X). The first
observation was taken when the protuberance like structure appears and terminated when
two celled conidium was formed. The observations were made until the flow of the
mitochondria from conidiophore to baby conidia stopped. At the initial stage (= time 0),
it was observed that the tubular-shaped mitochondria were flowing continuously towards
the edge of the protuberance (Fig. 9a, Table 1). After 28 minutes from the initial
observation, formation of small circular shaped conidia was observed and the
mitochondria were moving into the conidia and the shape remained as tubular (Fig. 9b,
Table 1). At the third observation point (56 min after initial observation), the tubular
mitochondria was still continuous from conidiophore to the conidia (Fig. 9c, Table 1).
The shape of the conidium was circular throw-out the 56 minutes observation period but
the size was increased with time. At 86 min after initial observation, the shape of the
conidium changed into oval shape while it was observed that the mitochondria were still
moving into the conidium. Yet the shape of the mitochondria was not changed (tubular
22
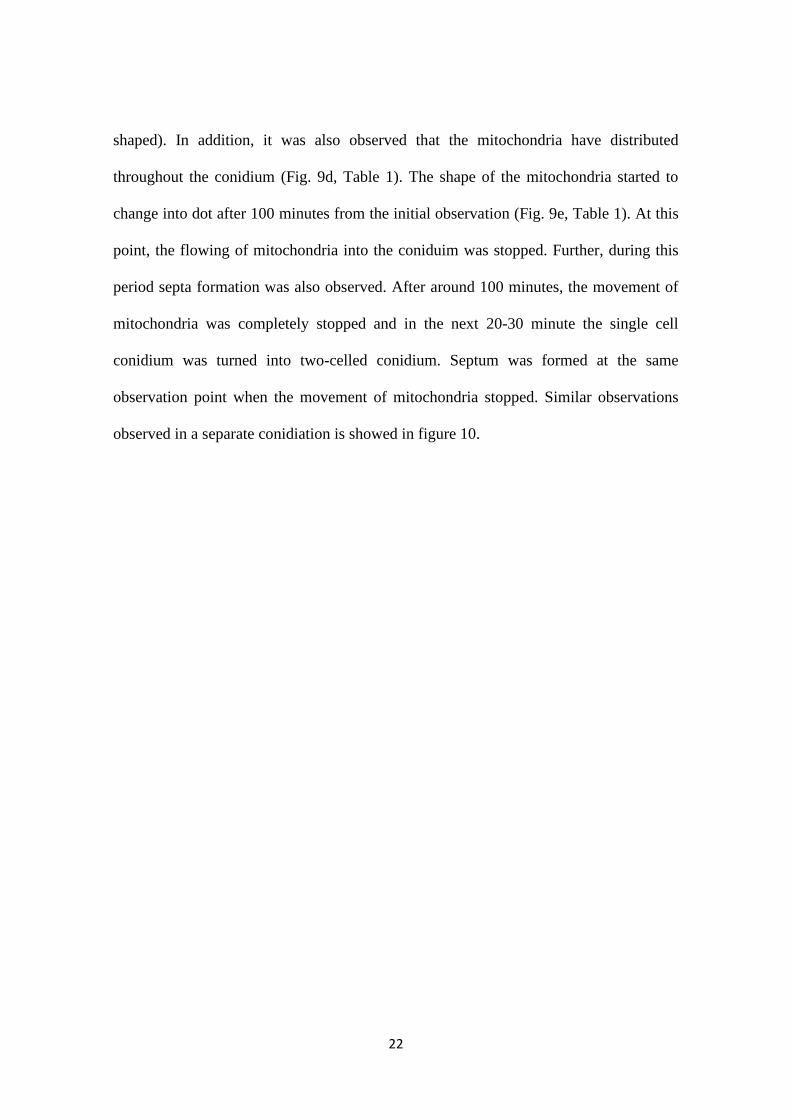
shaped). In addition, it was also observed that the mitochondria have distributed
throughout the conidium (Fig. 9d, Table 1). The shape of the mitochondria started to
change into dot after 100 minutes from the initial observation (Fig. 9e, Table 1). At this
point, the flowing of mitochondria into the coniduim was stopped. Further, during this
period septa formation was also observed. After around 100 minutes, the movement of
mitochondria was completely stopped and in the next 20-30 minute the single cell
conidium was turned into two-celled conidium. Septum was formed at the same
observation point when the movement of mitochondria stopped. Similar observations
observed in a separate conidiation is showed in figure 10.

23
Bright field Flouracence light

24
25
Figure 8 Representative series of observations observed under lower magnification (20X).
Observations were captured periodically in time intervals to optimize the timing and
observation point in the hyphae.
26
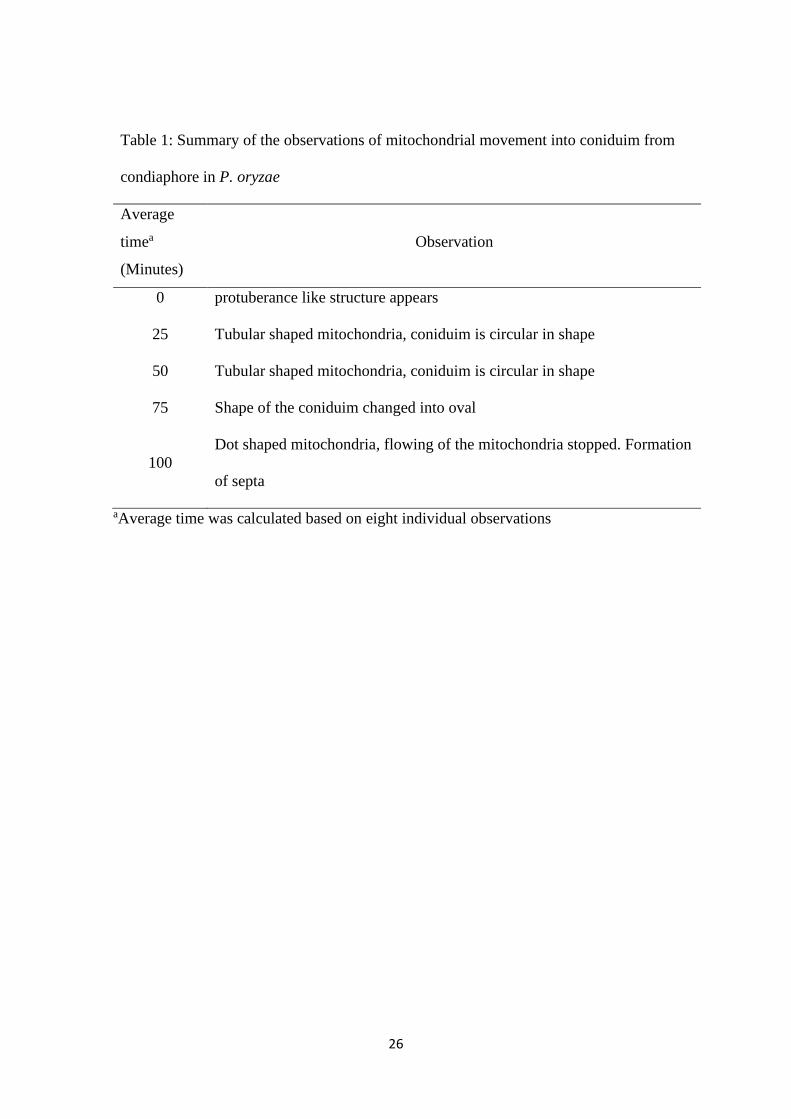
Table 1: Summary of the observations of mitochondrial movement into coniduim from
condiaphore in P. oryzae
Average
timea
(Minutes)
Observation
0 protuberance like structure appears
25 Tubular shaped mitochondria, coniduim is circular in shape
50 Tubular shaped mitochondria, coniduim is circular in shape
75 Shape of the coniduim changed into oval
100
Dot shaped mitochondria, flowing of the mitochondria stopped. Formation
of septa
aAverage time was calculated based on eight individual observations
27
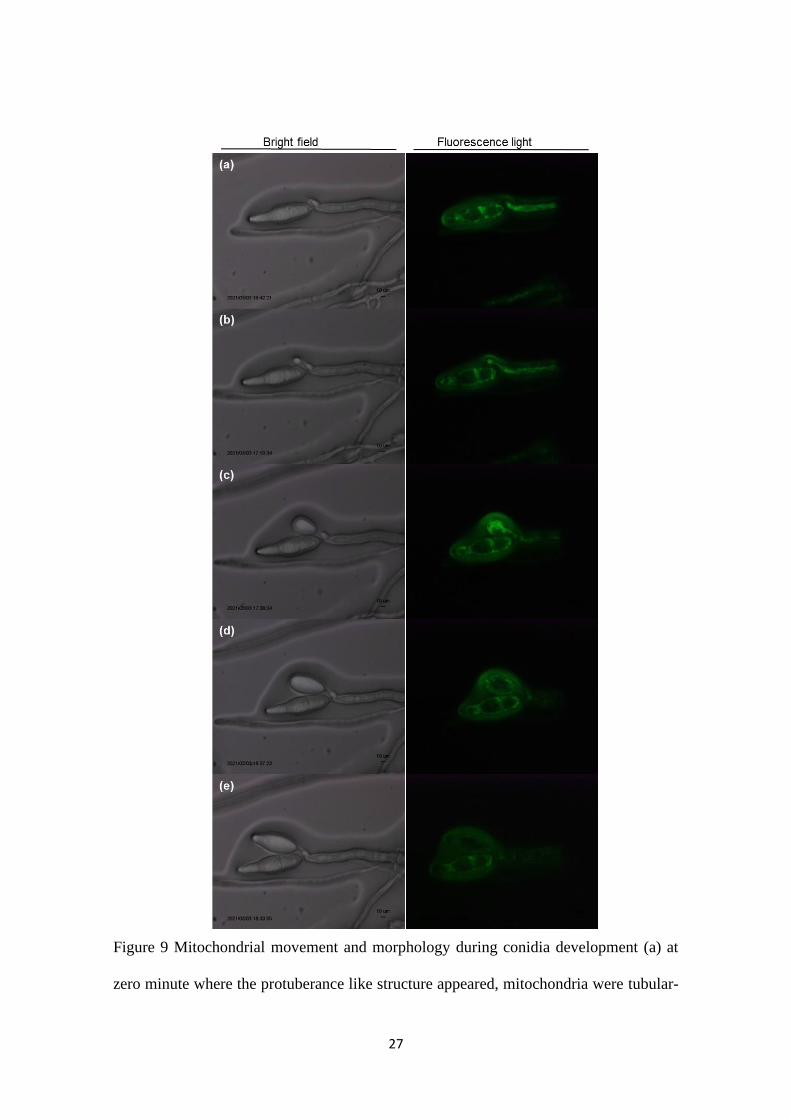
Figure 9 Mitochondrial movement and morphology during conidia development (a) at
zero minute where the protuberance like structure appeared, mitochondria were tubular-

28
shaped and moving towards the edge of the protuberance (b) at 28 minutes, conidia
became visible, tubular mitochondria were moving into the conidia (c) at 56 minutes,
tubular mitochondria continued to move into conidia (d) at 86 minutes, tubular
mitochondria have distributed throughout the conidium (e) at 112 minutes, movement of
mitochondria has stopped and shape was changed into dot shape. Conidium was about to
turned into two-celled conidium.

29

30
Figure 10 Mitochondrial movement and morphology during conidia development (a) at
zero minute where the protuberance like structure appeared, mitochondria were tubular-
shaped and moving towards the edge of the protuberance (b) at 24 minutes, conidia
became visible, tubular mitochondria were moving into the conidia (c) at 41 minutes,
tubular mitochondria continued to move into conidia (d) at 64 minutes, tubular
mitochondria have distributed throughout the conidium (e) at 88 minutes, movement of
mitochondria has stopped and shape was changed into dot shape. Conidium was about to
turned into two-celled conidium.
31
2.4 Discussion
In this chapter, we discussed about the morphology of mitochondria in P. oryzae during
the early conidiation using CitA-GFP system. Recently, Syib’li et al., (2020) visualized
the morphology of the mitochondria in P. oryzae using laser-scanning confocal
microscopy and found that the mitochondria of single celled baby-conidia are dot shaped
and later develop into a network as conidia aged. In the present research, we found that,
during the formation of protuberance like structure, the mitochondrial morphology is
tubular-shaped and changed to dot-like shape simultaneously with septa formation, before
the formation of two-celled conidia. Syib’li et al., (2020) reported that hyphal tips have
dot mitochondria and older hyphae have tubular shaped, whereas in the present study we
report mitochondria in conidiophore to be tubule. Tubular –shaped might be the specific
morphology needed during the movement of the mitochondria. Osman et al., (2015)
reported that in Saccharomyces cerevisiae, tubular mitochondria is distributed in the
budding daughter cell and subsequently localize at the distal membrane. Therefore, we
can state that both fungi might have similar conserved system for morphology and
distribution of mitochondria. In S cerevisiae, the mitochondrial fission protein Fis1 has
been found to be required for apoptosis and mitochondrial fragmentation (Madeo et al.
1999). The study on MoFIS1, Fis1 ortholog of P. oryzae, has found that MoFIS1 is
important for growth, conidiation and virulence of P. oryzae (Khan et al. 2015; Zeng et
al. 2014). MoFIS1 in P. oryzae may be involved in morphology of mitochondria through
regulating mitophagy (Zhong et al. 2016). This also highlights the linkage between
mitochondrial fission and conidiation in P. oryzae. MoFis1 may concern with the
mitochondrial metamorphosis during the early conidiation that was identified in this
report, but further analysis using MoFis1 mutants with CitA-GFP system is required.

32
These findings will elucidate the mechanism of mitochondrial inheritance in P. oryzae,
which is the key to solve the mechanism of QoI resistance distribution.

33
Chapter 3
ESTABLISHMENT OF REAL-TIME PCR PROTOCOL
3.1 Introduction
Quantitative polymerase chain reaction (q-PCR) or real-time PCR (RT-PCR) is a method
by which the quantity of the PCR product is measured in real-time. This technique is very
useful for investigating gene expression and quantification of alleles. In PCR, the
amplified DNA product is known as amplicon. In conventional PCR the amplicon is
detected after completion of all polymerase chain reaction cycles. On the contrary, RT-
PCR, the amplicon accumulation is measured as the polymerase chain reaction progresses.
Therefore, the term real time is used.
The amplicon quantification is done after each cycle by quantifying the fluorescent
reporter molecule in each reaction well. The fluorescent yield increased with an
increasing amount of amplicon. Popular fluorescent reporters used in RT-PCR are SYBR
Green and TaqMan. SYBR Green can only bind to double-stranded DNA and when
bound it emits around 1,000 times greater fluorescence than when it is free in solution.
With an increasing number of amplicons, which is a dsDNA, the fluorescent signal from
SYBR Green also increased (Tajadini et al., 2014). An alternative approach is use of
TaqMan probes, which contain two fluorophores namely quencher and reporter. The
quencher absorbs the signal from the reporter when both are at close proximity. Therefore,
the quencher and reporter are placed in close proximity on the same short oligonucleotides
in the PCR mix. During amplification, DNA polymerase activity separates the reporter

34
and quencher allowing them to set apart. This liberates the fluorescence. Using TaqMan
probe is expensive yet sequence-specific amplification can be measured. In contrast,
SYBR Green is a non-specific dsDNA-binding dye (Fraga et al., 2008).
RT-PCR allows determination of the initial number of copies of template DNA with high
accuracy. It also can be used to make qualitative decisions such as the presence or absence
of a sequence or to quantify copy number. In a typical amplification plot, the number of
PCR cycles is shown on the x-axis, and the fluorescence is shown on the y-axis. There
are two clear phases in the plot namely exponential phase and plateau. To reliably
quantify a copy number a standard curve is used (Svec et al., 2015).
Using a standard curve allows us to estimate the DNA concentration of unknown samples.
This is done by comparing the Ct value of the unknown sample to standards with known
DNA concentrations. To prepare a standard curve a dilution series from a known
concentration has to be made. The amount of fluorescent signal for each standard in the
dilution series is measured and the Ct values are recorded. These Ct values are used to
create the standard curve. Since Ct values are inversely proportional to the concentration
of DNA, the higher concentration will give a lower Ct value. When the Ct values for each
dilution are plotted on a graph, the standard curve can be generated using a simple
regression line. Since the standards are 10-fold dilutions, the Ct from one standard to the
next should be uniform. Standard curve is prepared using a log of the known standard
concentrations in the X axis and Ct value of each standard in the Y axis. The slope of the
plot measures the efficiency of the PCR reaction (Heid et al., 1996).
35
3.2 Methodology
3.2.1 Construction of qPCR standard plasmids for wild type and mutant alleles of Cytb to
quantify Cytb allele
DNA extracted from plasmid with wild type sequence (3.224kbp) (pGem-T easy
3016bp+ insert 208bp) and Plasmid with mutant type sequence (3.189kbp) (pGem-T easy
3016bp+ insert 208bp) were used to prepare the standard curve. The dilution series
(108,107,106,105,104,103,102 molecules/ µl) were prepared from both types of DNA.
3.2.2 Optimization of qPCR to quantify cyt b allele
Two different taq enzymes and PCR conditions were tested. Taq enzymes namely, SYBR
Green ER qPCR SuperMix for ABIPRISM and Go Taq qPCR Master Mix were tested to
optimize qPCR. Table 2 and 3 provides information on the pcr condition and the amount
of the chemicals used with SYBR Green ER qPCR SuperMix for ABIPRISM.
36
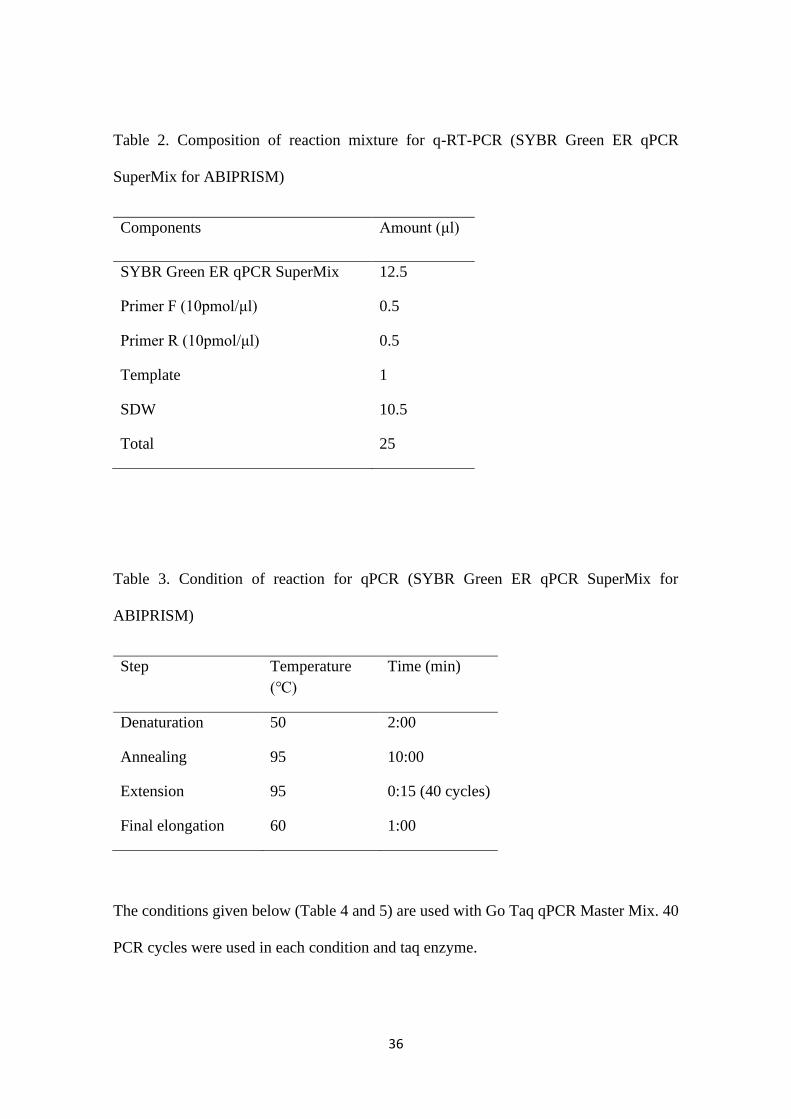
Table 2. Composition of reaction mixture for q-RT-PCR (SYBR Green ER qPCR
SuperMix for ABIPRISM)
Components Amount (μl)
SYBR Green ER qPCR SuperMix 12.5
Primer F (10pmol/μl) 0.5
Primer R (10pmol/μl) 0.5
Template 1
SDW 10.5
Total 25
Table 3. Condition of reaction for qPCR (SYBR Green ER qPCR SuperMix for
ABIPRISM)
Step Temperature
(℃)
Time (min)
Denaturation 50 2:00
Annealing 95 10:00
Extension 95 0:15 (40 cycles)
Final elongation 60 1:00
The conditions given below (Table 4 and 5) are used with Go Taq qPCR Master Mix. 40
PCR cycles were used in each condition and taq enzyme.

37
Table 4. Composition of reaction mixture for qPCR (Go Taq qPCR Master Mix)
Components Amount (μl)
Go Taq qPCR Master Mix 12.5
Primer F (100pmol / μl) 0.5
Primer R (100pmol / μl) 0.5
Template 5
SDW 6.5
Total 25
Table 5. Condition of reaction for qPCR (Go Taq qPCR Master Mix)
Step Temperature
(℃)
Temperature
(℃)
Time (min)
Denaturation 95 95 2:00
Annealing 95 95 0:15
Extension 60 60 1:00 (40 cycles)
Final elongation 60 60 1:00
38
3.2.3 Protoplast fusion to prepare the heteroplasmy fusant strain
To produce the heteroplasmy strain which contains the same amount of wild type (WT)
and mutant type (MT) alleles, two strains 2013-131 (MT) and 2013-158 (WT) were fused
using the protoplast-PEG method. protoplast isolation was done from mycelia which were
initially started with a stock mycelium and incubated for around five days in 2YEG liquid
medium (2 g/L yeast extract and 10 g/L glucose) at 27°C. The protoplast isolation was
done by digesting the cell wall of the mycelia with the digestion enzyme mix (Yatalase
0.02g/ml and cellulose 0.005g/ml) followed by incubation at 37°C in a shaker for one
hour. The mixture was then filtered through filter (Calbiochem), washed with isotonic
buffer and centrifuged. The collected protoplast was resuspended in 300 µl of isotonic
buffer. Mix the protoplast solution and add ice cool PEG solution. The mixture was kept
on ice for 20minutes. After the PEG treatment, 30 ml of STC buffer was added and it was
mixed gently. The mixture of protoplasts were centrifuged at 3500 rpm for 10minutes.
200 µl of STC buffer was added into the pellet. The protoplast solution was cultured in
bottom agar (Yeast Nitrogen base w/o amino acid 6.7g/L, glucose 5g/L, sucrose 205g/L
and agar 15g/L) for 24 hours. These colonies were again cultured on 24 well- micro plate
of PA (Prune extract 4g, Lactose 5g, Yeast extract 1g,agar 17g) for 1 week.
Go Taq master mix (Promega) and was used for RT-PCR reaction. 96 well-plate was
used for the reaction. The primer sequence is given Table 6.
39
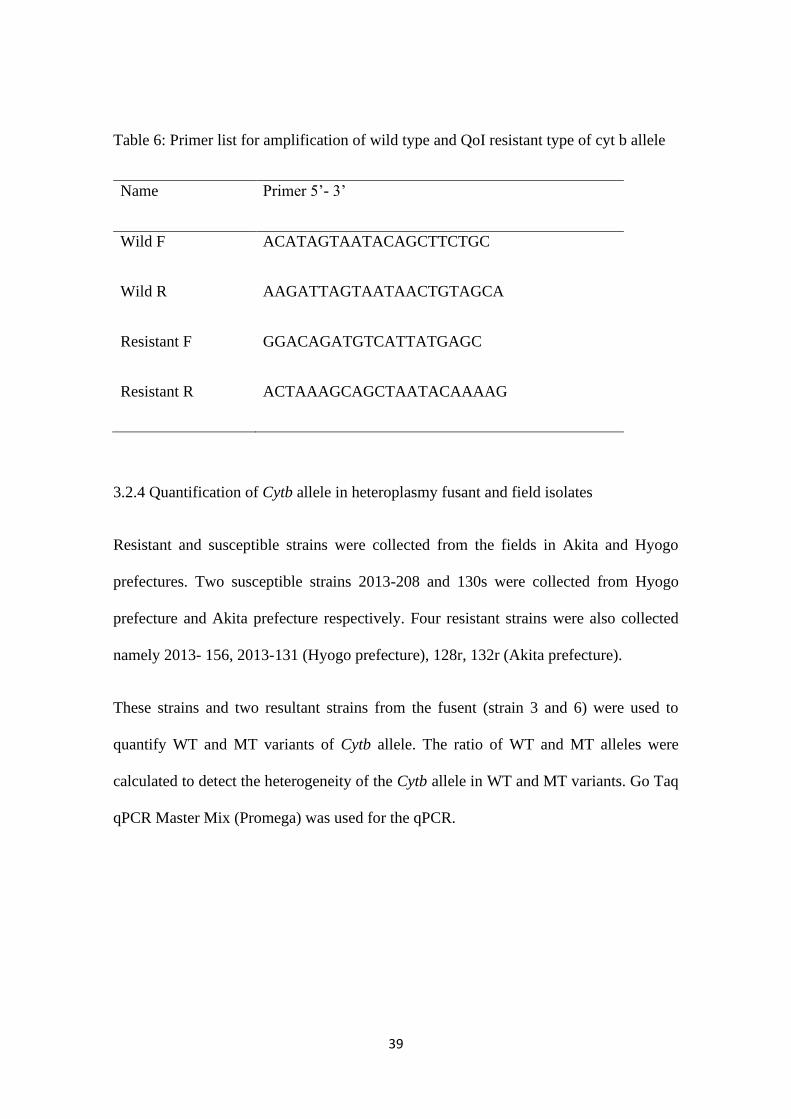
Table 6: Primer list for amplification of wild type and QoI resistant type of cyt b allele
Name Primer 5’- 3’
Wild F ACATAGTAATACAGCTTCTGC
Wild R AAGATTAGTAATAACTGTAGCA
Resistant F GGACAGATGTCATTATGAGC
Resistant R ACTAAAGCAGCTAATACAAAAG
3.2.4 Quantification of Cytb allele in heteroplasmy fusant and field isolates
Resistant and susceptible strains were collected from the fields in Akita and Hyogo
prefectures. Two susceptible strains 2013-208 and 130s were collected from Hyogo
prefecture and Akita prefecture respectively. Four resistant strains were also collected
namely 2013- 156, 2013-131 (Hyogo prefecture), 128r, 132r (Akita prefecture).
These strains and two resultant strains from the fusent (strain 3 and 6) were used to
quantify WT and MT variants of Cytb allele. The ratio of WT and MT alleles were
calculated to detect the heterogeneity of the Cytb allele in WT and MT variants. Go Taq
qPCR Master Mix (Promega) was used for the qPCR.
40
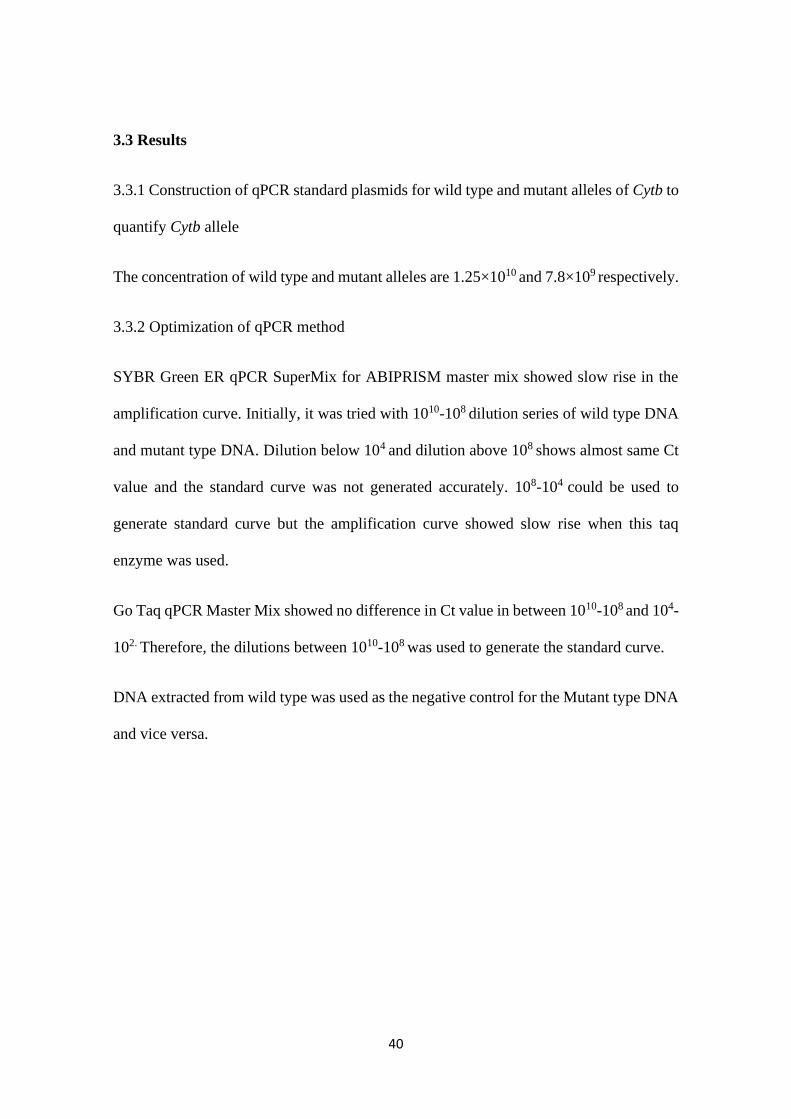
3.3 Results
3.3.1 Construction of qPCR standard plasmids for wild type and mutant alleles of Cytb to
quantify Cytb allele
The concentration of wild type and mutant alleles are 1.25×10¹⁰ and 7.8×10⁹ respectively.
3.3.2 Optimization of qPCR method
SYBR Green ER qPCR SuperMix for ABIPRISM master mix showed slow rise in the
amplification curve. Initially, it was tried with 1010-108 dilution series of wild type DNA
and mutant type DNA. Dilution below 104 and dilution above 108 shows almost same Ct
value and the standard curve was not generated accurately. 108-104 could be used to
generate standard curve but the amplification curve showed slow rise when this taq
enzyme was used.
Go Taq qPCR Master Mix showed no difference in Ct value in between 1010-108 and 104-
102. Therefore, the dilutions between 1010-108 was used to generate the standard curve.
DNA extracted from wild type was used as the negative control for the Mutant type DNA
and vice versa.
41
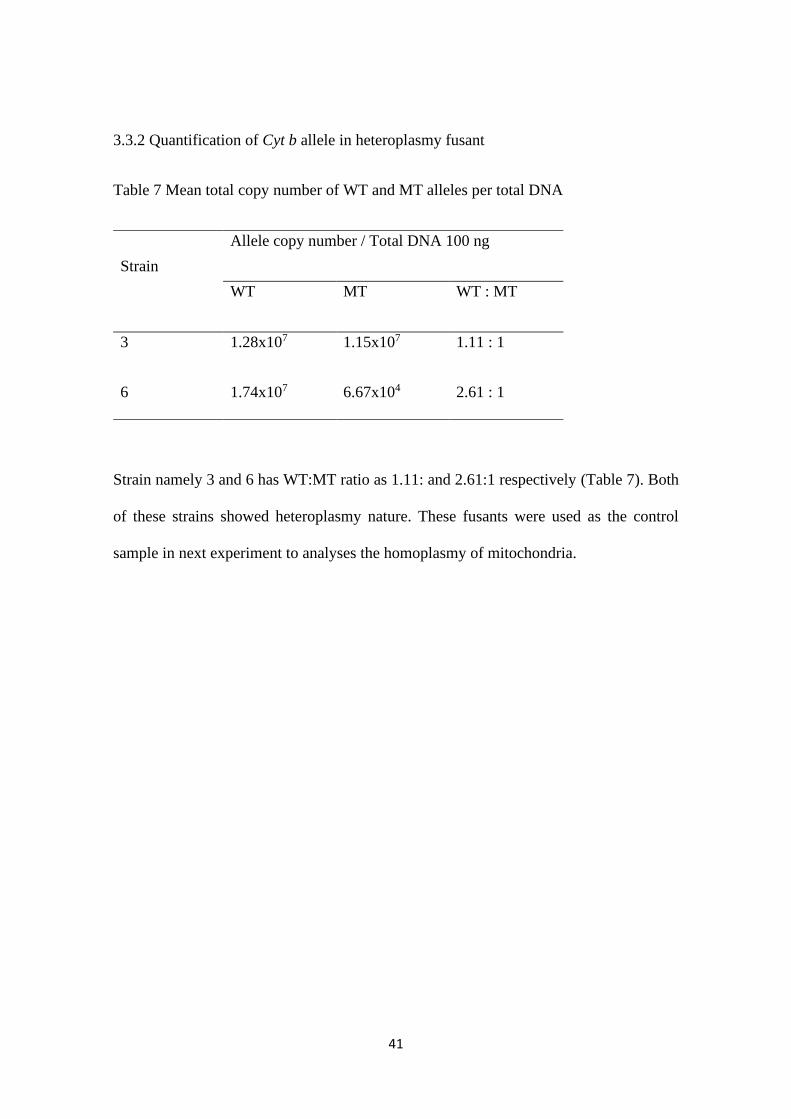
3.3.2 Quantification of Cyt b allele in heteroplasmy fusant
Table 7 Mean total copy number of WT and MT alleles per total DNA
Strain
Allele copy number / Total DNA 100 ng
WT MT WT : MT
3 1.28x10⁷ 1.15x10⁷ 1.11 : 1
6 1.74x10⁷ 6.67x10⁴ 2.61 : 1
Strain namely 3 and 6 has WT:MT ratio as 1.11: and 2.61:1 respectively (Table 7). Both
of these strains showed heteroplasmy nature. These fusants were used as the control
sample in next experiment to analyses the homoplasmy of mitochondria.

42
3.3.3 Quantification of Cyt b allele in field isolates
Table 8 WT and MT allele copy number per total DNA and WT / MT ratio in sensitive
and resistant strains
Strain Phenotype
Allele copy number / Toatal DNA 100 ng
WT MT WT : MT
2013-156 Resistant 5.79x10³ 7.87x10⁷ 1 : 1.36x10⁴
2013-208 Susceptible 1.34x10⁵ 5.70x101 2.34x10³ : 1
2013-131 Resistant 2.87x10² 5.23x10⁵ 1 : 1.82x10³
128r Resistant 1.86x10⁴ 1.73x10⁷ 1 : 9.27x10²
132r Resistant 7.80x10³ 4.67x10⁷ 1 : 5.98x10³
130s Susceptible 1.19x10¹⁰ 7.12x10³ 1.68x10⁶ : 1

43
3.4 Discussion
A standard solution with a known number of copies with WT / MT allele was used to
generate standard curve. Real-time could be used for the quantitative analysis of specific
allele. The polymerase enzyme, effective quantification range, and most effective
reaction conditions were finalized with this experiment. Dilution series of a known
number of copies with WT / MT allele were used in optimization. Polymerase enzyme
which is most appropriate for the present quantification system is Go Taq qPCR Master
Mix, with an effective range of quantification 108-104. This system was used to quantify
the WT / MT alleles of the strain in further experiments. We successfully created a
heteroplasmy strain which has the same amount of both wild type and mutant type allele.
This strain was used to understand the homoplasmy of Pyricularia oryzae in the next
experiment.

44
Chapter 4
q-RT-PCR TO QUANTITY ISOLATES FOR THE HOMOPLASMY
AND HETEROPLASMY CONDITION
3.1 Introduction
3.1.1 Mitochondrial inheritance and homoplasmy
Mitochondrial DNA (mtDNA) can easily undergo mutations than the nuclear DNA hence
is it often mentioned that mtDNA can evolve quickly (Brown et al 1979). mtDNA is bi-
parentally inherited but colonies prefer one type of mtDNA over other. S. cerevisiae is an
excellent model organism to study about cellular and molecular pathways and has been
used extensively to understand the molecular mechanisms of organelle inheritance. S.
cerevisiae has most of the mitochondrial DNA as linear molecules of different length.
The mitochondrial genome is packed into protein – DNA complexes known as nucleoids
and S. cerevisiae has about 10-40 nucleoids per cell. The mitochondrial genome contains
several of origins of replication but the role of mitochondrial RNA polymerase, Rp041 is
still doubtful.
Segregation of cellular mechanism of mitochondrial DNA is largely unknown. In S.
cerevisiae, it is hypothesized that retention of homoplasmy is influenced the fitness of the

45
allele to different environments and it also affects the nuclear sub nuclear genome in a
cell (Hewitt et al 2020). During the sexual reproduction two haploid cells fuse to form a
diploid cell. Zygote will have mixture of mitochondrial DNA if the parental cells have
contributed different mitochondrial cells and this can also happen during the vegetative
growth. This is termed as heteroplasmy. There are some evidences that says if
mitochondrial DNA remain un-mix within few cell divisions, they become homoplasmic
(Chen and Butow, 2005). Budding is known as multiplication of cells during asymmetric
cell division. Mitochondrial DNA enters to the bud as soon as it emerges. Bud directed
mitochondrial movement happens with the help of small fraction of mitochondrial DNA
pool which is transferred from zygote to the bud and determines about the mitochondrial
DNA type. Evidence suggests that bundle of actin cables along with myosin proteins are
involved in the bud directed mitochondrial movement (Westermann 2014, Lazzarino et
al 1994).

46
Figure 11 Mitochondrial distribution during budding in S. cerevisiae. a. Budding starting
at the midpoint of the cell will have both the types of the parental mtDNA (Heteroplasmy).
b,c. Budding starting at the either end of the cell will have one parental type mtDNA
(Homoplasmy).
47
3.2 Methodology
The fused strain was first cultured in prune agar for 3days and then the small gel pieces
were stored in 10% glycerol at -800C refrigerator for further use. The strain was taken out
from 10% glycerol and cultured in 2YEG broth for around 5days at 250C.
3.2.1 Prepare samples without conidiation
One mycelium was taken out from the Liquid medium and then inoculated back into fresh
2YEG medium again. They were incubated for around 5days and those mycelia were
used for protoplast isolation. The mycelia were filtered using mila cloth filter and the
mycelia were transferred into pre-weighed falcon tube. The digestion enzyme mixture
was pre-prepared and filtered using 0.4µm filter and injection tube. Digestion enzyme
mixture was poured into mycelia and incubated at 370C at shaker for 2 hours. Then the
mixture was filtered and washed with STC buffer. The supernatant was centrifuged at
3500g for 10minutes. After that, the pellet was collected and 500 µl of STC was added.
Centrifugation step was repeated and the pellet was collected again. The protoplast was
dissolved in 300µl of isotonic buffer. The number of cells was observed under
hemocytometer for making the dilution series. The different dilution series were
101 ,102 ,103, 104 with isotonic buffer and 101 with SDW. The diluted protoplast was
cultured on bottom broth agar at 250C for around 8 days to isolate single colonies. The
single colonies were transferred into 2YEG broth and incubated at 250C for 5days. Later,
the mycelia were filtered, freeze dried and processed with DNA extraction.
48
3.2.2 Prepare samples with conidiation
One mycelium was taken out from the Liquid medium and then inoculated into oatmeal
agar medium. They were incubated for around 10-14 days and then scraped using scraper.
The plates were incubated again for around 3 days and the condia were collected using
5ml of SDW. Conidia were diluted with SDW and the different dilution series of
101 ,102 ,103, 104 were prepared. Diluted conidia were cultured on water agar medium.
After 4-5 days, single colonies were isolated and they were inoculated into 2YEG medium.
Later, the mycelia were filtered, freeze dried and processed with DNA extraction.
3.2.3 Genomic DNA extraction
DNA was extracted by method explained by sone et al 1997. Briefly 0.05g of the sample
was put into micro centrifuge tube with metal beads. Bead shocker was used at 2500rpm
for 30sec and 500 µl of DNA extraction buffer was added. Phenol saturated with TE and
150µl Chloroform -isoamyl alcohol (24:1) was added. Then, it was centrifuged at
15,000rpm for 1hour. The upper layer was transferred into new micro centrifuge tube and
25µl of RNase A solution was added. The sample was incubated for 1 hour and later 500
µl of phenol was added. It was centrifuged for 5min at 15,000rpm. 250 µl of phenol and
250 µl of chloroform were added to the supernatant. Centrifugation was repeated. Then
500 µl of chloroform was added into the pellet before centrifugation. 500 µl of
isopropanol was added and it was centrifuged at above mentioned condition. Later add
70% ethanol into the pellet and centrifuge for 5min at 15,000rpm. The supernatant was
thrown and the pellet was dried in the dryer. Finally 50 µl of SDW was added to dissolve
the pellet and OD value was checked before further using the DNA for q-RT- PCR.
49
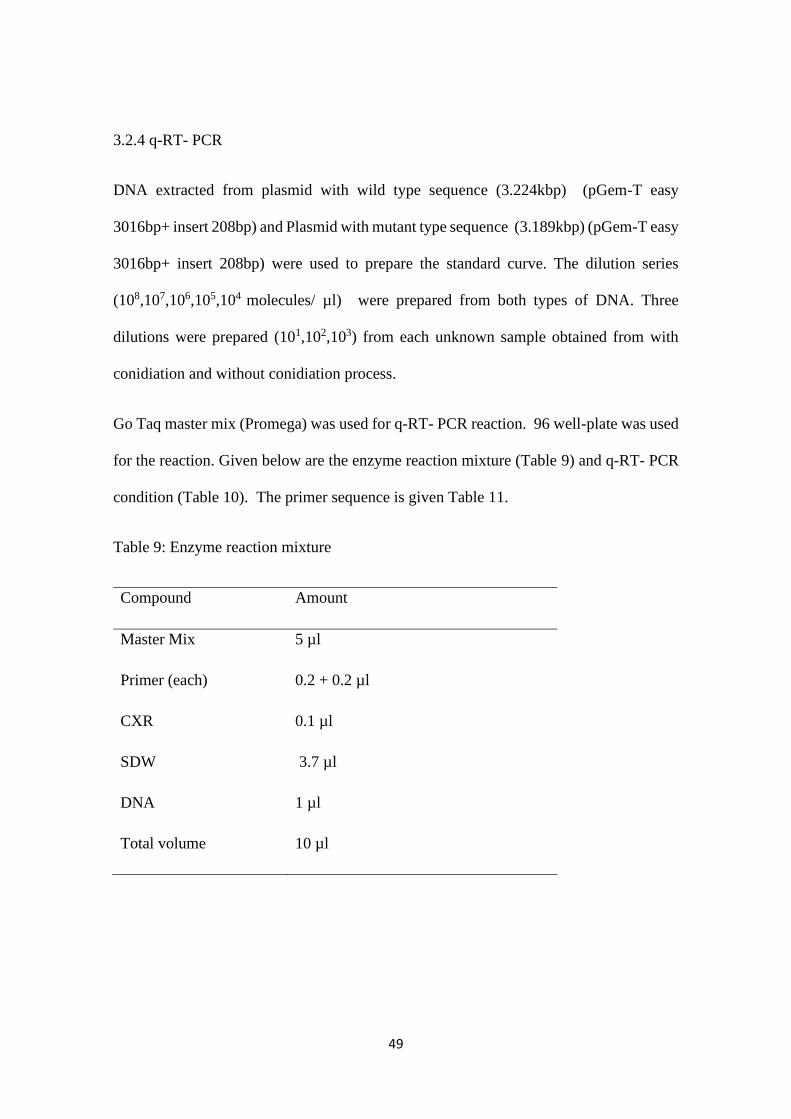
3.2.4 q-RT- PCR
DNA extracted from plasmid with wild type sequence (3.224kbp) (pGem-T easy
3016bp+ insert 208bp) and Plasmid with mutant type sequence (3.189kbp) (pGem-T easy
3016bp+ insert 208bp) were used to prepare the standard curve. The dilution series
(108,107,106,105,104 molecules/ µl) were prepared from both types of DNA. Three
dilutions were prepared (101,102,103) from each unknown sample obtained from with
conidiation and without conidiation process.
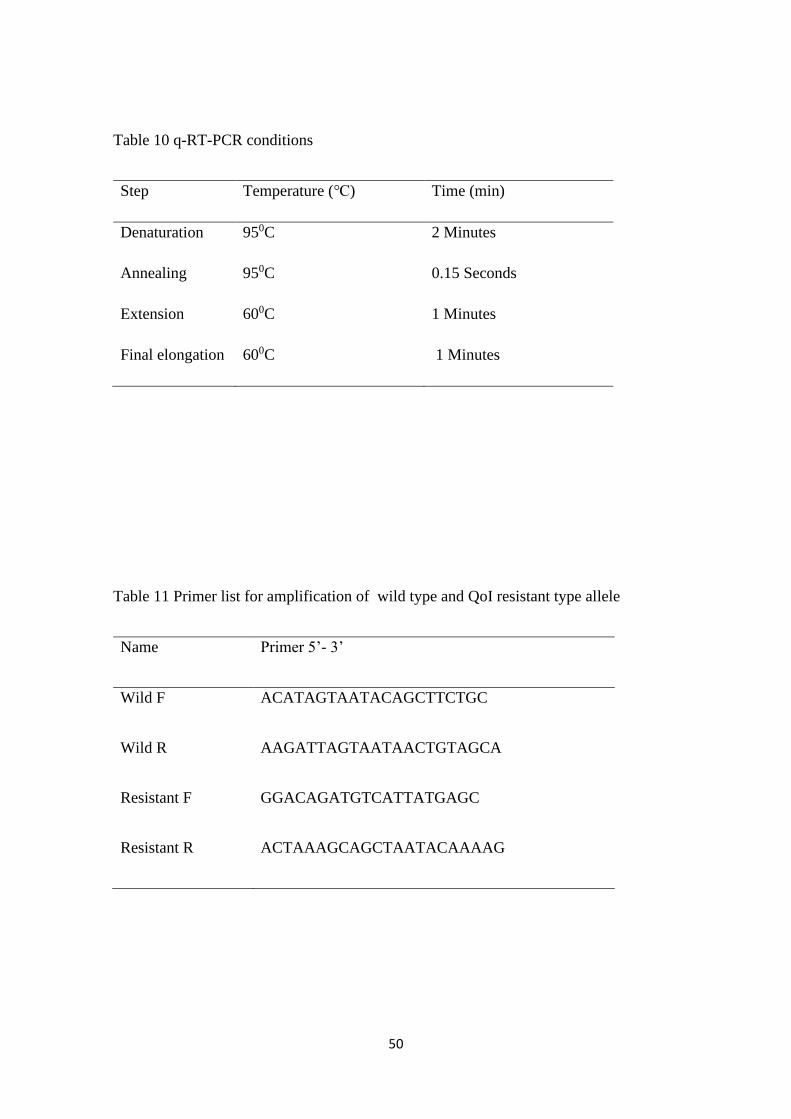
Go Taq master mix (Promega) was used for q-RT- PCR reaction. 96 well-plate was used
for the reaction. Given below are the enzyme reaction mixture (Table 9) and q-RT- PCR
condition (Table 10). The primer sequence is given Table 11.
Table 9: Enzyme reaction mixture
Compound Amount
Master Mix 5 µl
Primer (each) 0.2 + 0.2 µl
CXR 0.1 µl
SDW 3.7 µl
DNA 1 µl
Total volume 10 µl
50
Table 10 q-RT-PCR conditions
Step Temperature (℃) Time (min)
Denaturation 950C 2 Minutes
Annealing 950C 0.15 Seconds
Extension 600C 1 Minutes
Final elongation 600C 1 Minutes
Table 11 Primer list for amplification of wild type and QoI resistant type allele
Name Primer 5’- 3’
Wild F ACATAGTAATACAGCTTCTGC
Wild R AAGATTAGTAATAACTGTAGCA
Resistant F GGACAGATGTCATTATGAGC
Resistant R ACTAAAGCAGCTAATACAAAAG
51
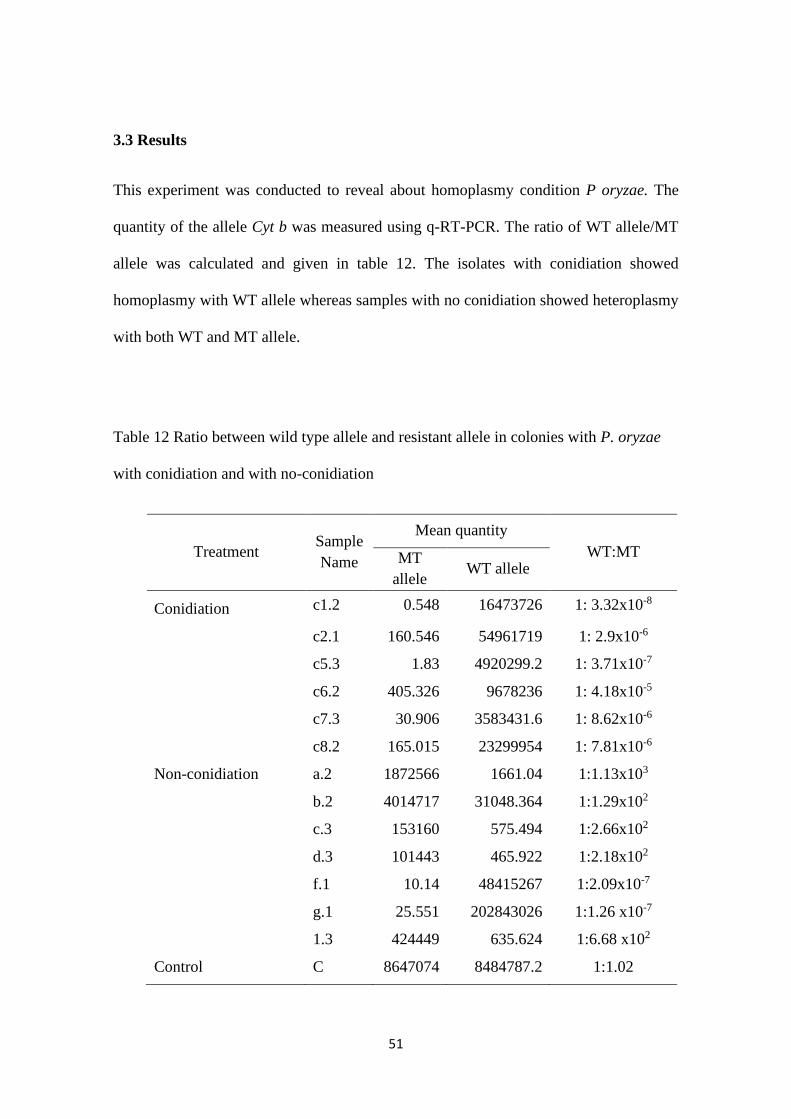
3.3 Results
This experiment was conducted to reveal about homoplasmy condition P oryzae. The
quantity of the allele Cyt b was measured using q-RT-PCR. The ratio of WT allele/MT
allele was calculated and given in table 12. The isolates with conidiation showed
homoplasmy with WT allele whereas samples with no conidiation showed heteroplasmy
with both WT and MT allele.
Table 12 Ratio between wild type allele and resistant allele in colonies with P. oryzae
with conidiation and with no-conidiation
Treatment Sample
Name
Mean quantity
WT:MT MT
allele WT allele
Conidiation c1.2 0.548 16473726 1: 3.32x10⁻⁸
c2.1 160.546 54961719 1: 2.9x10⁻⁶
c5.3 1.83 4920299.2 1: 3.71x10⁻⁷
c6.2 405.326 9678236 1: 4.18x10⁻⁵
c7.3 30.906 3583431.6 1: 8.62x10⁻⁶
c8.2 165.015 23299954 1: 7.81x10⁻⁶
Non-conidiation a.2 1872566 1661.04 1:1.13x10³
b.2 4014717 31048.364 1:1.29x10²
c.3 153160 575.494 1:2.66x10²
d.3 101443 465.922 1:2.18x10²
f.1 10.14 48415267 1:2.09x10⁻⁷
g.1 25.551 202843026 1:1.26 x10⁻⁷
1.3 424449 635.624 1:6.68 x10²
Control C 8647074 8484787.2 1:1.02
52
3.4 Discussion
Unlike nuclear genome, there are hundreds to thousand copies of mitochondrial DNA
(mtDNA) in each cell. As a result of high frequency of mutagenesis, heteroplasmy is
observed in a cell yet they quickly go back to homoplasmy after few sexual regeneration
cycles or during vegetative cell growth (Ling et al 2011). In this chapter, we have shown
our observations homoplasmy during asexual reproduction. We observed that the
conidiation is the key to control homoplasmy during the asexual reproduction of P. oryzae.
Previously it has been reported that a heteroplasmic S. cerevisiae strain obtained under
laboratory conditions by mating Mat a and Mat α was segregate into homoplasmic
progeny during zygote outgrowth. No selective pressure was used during the conidiation
and yet after twenty generations all cells were homoplasmic (Dujon B 1981; Dujon B
2020). We also observed similar results that mitochondria will go back to homoplasmy
after conidiation when there is no any stress (fungicide) is given. Mhr1-1 a mitochondrial
gene conversion gene deficient was isolated and characterized by Ling (1995) and later it
was revealed that Mhr 1 is essential for mtDNA partitioning into daughter cells (Ling
2002). It is also involved in the generation of homoplasmic progeny of heteroplasmic
mtDNA (Ling 2004). Mhr1-1 is a single amino acid replacement that might affect the
homoplasmic progeny and it slower the generation of homoplasmic cells. Over expressed
Mhr1 enhanced the heteroplasmic cells (Ling 2004). In P. oryzae also, same gene might
be involved in the maintenance of homoplasmicity.
53
Chapter 5
General Discussion
Pyricularia oryzae, is a filamentous ascomycete fungus which causes rice blast disease
in rice. This pathogen has a host range of over 50 species including many economically
important cereals and grasses (Schulze-Lefert and Panstruga, 2011). China, Korea, Japan,
Vietnam and United States had to destroy 5.7million hectares of rice in 2001 to 2005 due
to rice blast disease (Wilson and Talbot, 2009). P. oryzae can infect leaves, stems, nodes
and panicles of rice which include all stages of development of the plant. QoI fungicide
is widely used to control the disease and this created high resistance towards the fungicide.
This fungicide affects complex III in TCA and single nucleotide mutation can help P.
oryzae to develop resistance to the fungicide. Therefore it is important to understand
about the mitochondrial morphology and mitochondrial inheritance during conidiation.
This study focused on mitochondria present in conidiaphore and their movement into
conidia during condiation. We discussed about the morphology of mitochondria in P.
oryzae during the early conidiation using CitA-GFP system. P. oryzae transformant with
GFP-tagged Citrate synthase (Cit A) gene was used in this study. Strain Ina86-137 CitA-
GFP was cultured on special slide for 30-33hours and observed under the microscope
(Olympus BX 50). Initially, lower magnification was used to optimize the observation
time and the observation point of the conidiophore. Later, higher magnification was used
to observe the morphology and movement of mitochondria from protruberance to baby
conidia. In the present research, we found that, during the formation of protuberance like
54
structure, the mitochondrial morphology is tubular-shaped and changed to dot-like shape
simultaneously with septa formation, before the formation of two-celled conidia.
Therefore we can state that tubular shape might be the specific morphology needed during
the movement of the mitochondria from protuberance to conidia. Tubular mitochondria
is distributed in the budding daughter cell and subsequently localized at the distal
membrane in Saccharomyces cerevisiae (Osman et al 2015). Therefore, we can state that
both fungi might have similar conserved system for morphology and distribution of
mitochondria.
In next two experiments, quantitative real time polymerase chain reaction (q-RT-PCR)
was used to quantify the Cit b allele. q-RT-PCR is a method by which the quantity of the
PCR product is measured in real-time. This technique is very useful for investigating gene
expression and quantification of alleles. Allele quantification system was first established
with q-RT-PCR using wild type (WT) and Mutant type (MT) allele.
We observed that the conidiation is the key to control homoplasmy during the asexual
reproduction of P. oryzae. There are multiple copies of mitochondrial DNA (mtDNA) in
each cell and due to frequent mutagenesis, heteroplasmy is observed in cells with respect
to mtDNA (Fritsch et al, 2014; Ling et al, 2011). In a fussed strain of S. cerevisiae
obtained by mating Mat a and Mat α was also segregated into homoplasmic progeny. In
our observations mtDNA was segregated into homoplasmy after conidiation in the
absence of any stress such as fungicide. Mhr1-1 a mitochondrial gene conversion gene
deficient was isolated and characterized by Ling (1995). We believe that Mhr1-1 might
affect the homoplasmic progeny and it slower the generation of homoplasmic cells. Over

55
expressed Mhr1 enhanced the heteroplasmic cells (Ling 2004). We concluded that in P.
oryzae also, same gene might be involved in the maintenance of homoplasmicity.
56
REFERENCES
Asibi, A.E., Chai, Q. and Coulter, J.A., 2019. Rice blast: A disease with implications
for global food security. Agronomy, 9(8), pp.451.
Barker, R., Herdt, R.W. and Rose, B., 1985. The Rice Economy of Asia, Resources for
the Future in Cooperation. International Rice Research Institute, Washington, DC.
pp. 20-35.
Boddy, L. (2016). Pathogens of autotrophs. In S. C. Watkinson, N. Money, & L. Boddy
(Eds.), The Fungi Academic Press. pp. 245–292
Brown, W.M., George, M. and Wilson, A.C., 1979. Rapid evolution of animal
mitochondrial DNA. Proceedings of the National Academy of Sciences, 76(4),
pp.1967-1971.
Castroagudín, V.L., Ceresini, P.C., de Oliveira, S.C., Reges, J.T., Maciel, J.L., Bonato,
A.L., Dorigan, A.F. and McDonald, B.A., 2015. Resistance to QoI fungicides is
widespread in Brazilian populations of the wheat blast pathogen Magnaporthe
oryzae. Phytopathology, 105(3), pp.284-294.
Chen, M., Wang, B., Lu, G., Zhong, Z. and Wang, Z., 2020. Genome Sequence
Resource of Magnaporthe oryzae Laboratory Strain 2539. Molecular Plant-
Microbe Interactions, 33(8), pp.1029-1031.
Chen, X.J. and Butow, R.A., 2005. The organization and inheritance of the
mitochondrial genome. Nature Reviews Genetics, 6(11), pp.815-825.
57
Couch, B.C. and Kohn, L.M., 2002. A multilocus gene genealogy concordant with host
preference indicates segregation of a new species, Magnaporthe oryzae, from M.
grisea. Mycologia, 94(4), pp.683-693.
Dean, R.A., Talbot, N.J., Ebbole, D.J., Farman, M.L., Mitchell, T.K., Orbach, M.J.,
Thon, M., Kulkarni, R., Xu, J.R., Pan, H. and Read, N.D., 2005. The genome
sequence of the rice blast fungus Magnaporthe grisea. Nature, 434(7036),
pp.980-986.
Dujon, B., 2020. Mitochondrial genetics revisited. Yeast, 37(2), pp.191-205.
Fernandez, J. and Orth, K., 2018. Rise of a cereal killer: the biology of Magnaporthe
oryzae biotrophic growth. Trends in microbiology, 26(7), pp.582-597.
Fraga, D., Meulia, T. and Fenster, S., 2008. Real‐time PCR. Current protocols essential
laboratory techniques, (1), pp.10-3.
Glancy, B., 2020. Visualizing mitochondrial form and function within the cell. Trends
in molecular medicine, 26(1), pp.58-70.
Goh J, Jeon J, Lee Y.H., 2017 ER retention receptor, MoERR1 is required for fungal
development and pathogenicity in the rice blast fungus Magnaporthe oryzae. Sci
Rep 7:1259.
Han JH, Shin JH, Lee YH, Kim KS (2018) Distinct roles of the YPEL gene family in
development and pathogenicity in the ascomycete fungus Magnaporthe oryzae.
Sci Rep 8:14461.
58
Hayashi, K., Suzuki, F. and Hayano-Saito, Y., 2017. Multiplex PCR assay for
simultaneous detection of MBI-D and Q o I resistance in rice blast fungus. Journal
of General Plant Pathology, 83(5), pp.304-309.
Heid, C.A., Stevens, J., Livak, K.J. and Williams, P.M., 1996. Real time quantitative
PCR. Genome research, 6(10), pp.986-994.
Hewitt, S.K., Duangrattanalert, K., Burgis, T., Zeef, L.A., Naseeb, S. and Delneri, D.,
2020. Plasticity of mitochondrial DNA inheritance and its impact on nuclear gene
transcription in yeast hybrids. Microorganisms, 8(4), p.494.
Ishi, K., Maruyama, J.I., Juvvadi, P.R., Nakajima, H. and Kitamoto, K., 2005.
Visualizing nuclear migration during conidiophore development in Aspergillus
nidulans and Aspergillus oryzae: multinucleation of conidia occurs through direct
migration of plural nuclei from phialides and confers greater viability and early
germination in Aspergillus oryzae. Bioscience, biotechnology, and
biochemistry, 69(4), pp.747-754.
Ishii, H., 2006. Impact of fungicide resistance in plant pathogens on crop disease control
and agricultural environment. Japan Agricultural Research Quarterly:
JARQ, 40(3), pp.205-211.
Ishii, H., 2015. Rice pathogens in Japan. In Fungicide Resistance in Plant Pathogens.
Springer, Tokyo. pp. 341-354
Jensen, R.E., Aiken Hobbs, A.E., Cerveny, K.L. and Sesaki, H., 2000. Yeast
mitochondrial dynamics: fusion, division, segregation, and shape. Microscopy
research and technique, 51(6), pp.573-583.
59
Kain, S.R., Adams, M., Kondepudi, A., Yang, T.T., Ward, W.W. and Kitts, P., 1995.
Green fluorescent protein as a reporter of gene expression and protein
localization. Biotechniques, 19(4), pp.650-655.
Kou, Y., He, Y., Qiu, J., Shu, Y., Yang, F., Deng, Y. and Naqvi, N.I., 2019.
Mitochondrial dynamics and mitophagy are necessary for proper invasive growth
in rice blast. Molecular plant pathology, 20(8), pp.1147-1162.
Lackner, L.L., 2014. Shaping the dynamic mitochondrial network. BMC biology, 12(1),
p.35.
Lazzarino, D.A., Boldogh, I., Smith, M.G., Rosand, J. and Pon, L.A., 1994. Yeast
mitochondria contain ATP-sensitive, reversible actin-binding activity. Molecular
biology of the cell, 5(7), pp.807-818.
Li D, Calderone R (2017) Exploiting mitochondria as targets for the development of
new antifungals. Virulence 8(2):159–168.
Ling, F., Makishima, F., Morishima, N., Shibata, T., 1995 A nuclear mutation defective
in mitochondrial recombination in yeast. EMBO J. , 14, pp.4090–4101.
Ling, F., Mikawa, T. and Shibata, T., 2011. Enlightenment of yeast mitochondrial
homoplasmy: diversified roles of gene conversion. Genes, 2(1), pp.169-190.
Ling, F., Shibata, T., 2002 Recombination-dependent mtDNA partitioning. In vivo role
of Mhr1p to promote pairing of homologous DNA. EMBO J. , 21, pp.4730–4740.
60
Ling, F., Shibata, T., 2004 Mhr1p-dependent concatemeric mitochondrial DNA
formation for generating yeast mitochondrial homoplasmic cells. Mol. Biol.
Cell , 15, pp.310–322.
Lorang, J.M., Tuori, R.P., Martinez, J.P., Sawyer, T.L., Redman, R.S., Rollins, J.A.,
Wolpert, T.J., Johnson, K.B., Rodriguez, R.J., Dickman, M.B. and Ciuffetti, L.M.,
2001. Green fluorescent protein is lighting up fungal biology. Applied and
Environmental Microbiology, 67(5), pp.1987-1994.
Martínez-Reyes, I. and Chandel, N.S., 2020. Mitochondrial TCA cycle metabolites
control physiology and disease. Nature communications, 11(1), pp.1-11.
Mendoza, H., Perlin, M.H. and Schirawski, J., 2020. Mitochondrial Inheritance in
Phytopathogenic Fungi—Everything Is Known, or Is It?. International Journal of
Molecular Sciences, 21(11), p.3883.
Miyagawa, N., Fuji, M. and Kawabata, Y., 2013. Occurrence of orysastrobin-resistant
isolates of rice blast fungus. Jpn J Phytopathol, 79, pp.197.
Nalley, L., Tsiboe, F., Durand-Morat, A., Shew, A. and Thoma, G., 2016. Economic
and environmental impact of rice blast pathogen (Magnaporthe oryzae)
alleviation in the United States. PloS one, 11(12), p.e0167295.
Perez-Nadales, E., Nogueira, M.F.A., Baldin, C., Castanheira, S., El Ghalid, M., Grund,
E., Lengeler, K., Marchegiani, E., Mehrotra, P.V., Moretti, M. and Naik, V., 2014.
Fungal model systems and the elucidation of pathogenicity determinants. Fungal
genetics and biology, 70, pp.42-67.
61
Rahnama, M., Phillips, T.D. and Farman, M.L., 2020. First report of the blast pathogen,
Pyricularia oryzae, on Eragrostis tef in the United States. Plant Disease, 104(12),
p.3266.
Rizzuto, R., Brini, M., Pizzo, P., Murgia, M. and Pozzan, T., 1995. Chimeric green
fluorescent protein as a tool for visualizing subcellular organelles in living
cells. Current biology, 5(6), pp.635-642.
Schulze-Lefert, P. and Panstruga, R., 2011. A molecular evolutionary concept
connecting nonhost resistance, pathogen host range, and pathogen
speciation. Trends in plant science, 16(3), pp.117-125.
Sesma, A. and Osbourn, A.E., 2004. The rice leaf blast pathogen undergoes
developmental processes typical of root-infecting fungi. Nature, 431(7008),
pp.582-586.
Suelmann, R. and Fischer, R., 2000. Mitochondrial movement and morphology depend
on an intact actin cytoskeleton in Aspergillus nidulans. Cell motility and the
cytoskeleton, 45(1), pp.42-50.
Svec, D., Tichopad, A., Novosadova, V., Pfaffl, M.W. and Kubista, M., 2015. How
good is a PCR efficiency estimate: Recommendations for precise and robust qPCR
efficiency assessments. Biomolecular detection and quantification, 3, pp.9-16.
Syib’li, M.A., Kodama, A., Abe, A. and Sone, T., 2020. Three-dimensional
visualization of mitochondria in conidia of Pyricularia oryzae using green
fluorescent protein (GFP) fused with citrate synthase (CitA). Journal of General
Plant Pathology, 86, pp.250-256.

62
Tajadini, M., Panjehpour, M. and Javanmard, S.H., 2014. Comparison of SYBR Green
and TaqMan methods in quantitative real-time polymerase chain reaction analysis
of four adenosine receptor subtypes. Advanced biomedical research, 3.
Viana, M.P., Lim, S. and Rafelski, S.M., 2015. Quantifying mitochondrial content in
living cells. Methods in cell biology, 125, pp.77-93.
Westermann, B., 2014. Mitochondrial inheritance in yeast. Biochimica et Biophysica
Acta (BBA)-Bioenergetics, 1837(7), pp.1039-1046.
Wilson, R.A. and Talbot, N.J., 2009. Under pressure: investigating the biology of plant
infection by Magnaporthe oryzae. Nature Reviews Microbiology, 7(3), pp.185-
195.
Zhu, D., Kang, H., Li, Z., Liu, M., Zhu, X., Wang, Y., Wang, D., Wang, Z., Liu, W. and
Wang, G.L., 2016. A genome-wide association study of field resistance to
Magnaporthe oryzae in rice. Rice, 9(1), pp.1-9.
63
ACKNOWLEDGEMENT
I sincerely express my gratitude to my supervisor, Professor Teruo Sone, Research
Faculty of Agriculture, Hokkaido University for his unstinted support. His infinite
passion on research, style of student supervision and kind words, always motivated me to
become a scientist like him.
I also truly grateful to Dr Ayumi Abe, Applied Molecular Microbiology Laboratory,
Graduate School of Agriculture, Hokkaido University for his kind advice and assistance
rendered me during this period.
I would like to extend my sincere thanks to all my labmates at Applied Molecular
Microbiology Laboratory, who extended their support whenever I needed.
I owe a deep sense of gratitude to my husband, Wikum Harshana Jayasinghe and my
daughter, Nathsuki Shehansa Jayasighe for supporting me to achieve my goals.