Stop Hate UK Statistical Report
2014-15

2
A service provided in England, Scotland and Wales
A service provided in England, Scotland and Wales
Incorporating the

3
Letter from the Chief Executive Welcome to Stop Hate UK’s 2014–15 Statistical Report. This report consolidates Stop Hate Line, Stop Learning Disability Hate Crime and Stop LGB & T Hate Crime data received during the last financial year.
The last 12 months has again been challenging for 3rd Sector organisations, including Stop Hate UK as the government continues to cut services. Meanwhile national and international events continue to remind us why our work is so important. However, the Hate Crime agenda still struggles to be heard; particularly in the face of political messages that undermine, at least superficially, the basic principles of respect; tolerance; and freedom from abuse, that those of us working in this area promote. In spite of the challenges, 2014-15 has been a period of growth for Stop Hate UK which has seen a new helpline service developed and launched, a move to new premises and an increase in staff dedicated to providing a safe, confidential and supportive service for victims of Hate Crime.
In January 2015 Stop Hate UK launched a new helpline to support people who have experienced or witnessed Lesbian, Gay, Bisexual and Transgender Hate Crime. The Stop LGB&T Hate Crime helpline has been funded by the Equality and Human Rights Commission across England, Scotland and Wales until 31 st March 2016. We are developing relationships with new and existing LGBT partner organisations, particularly those in rural areas, and promoting the service with our new 8 ways to report cards; through social media; as well as attending events and meeting with partners in areas.
This year has also seen the birth of an exciting new partnership with Sitakumari – the Heartstone Odyssey. This is an arts project, based on a trilogy of books which tell the story of Chandra, an Indian dancer who travels to the UK and America and faces prejudice and racism along the way, which she ultimately overcomes. The project centres on delivering employability skills and Hate Crime awareness, to an identified group of young people who will later have conversations with the public around hate, in an arts setting. Stop Hate UK will be jointly delivering these sessions and will work initially in Liverpool and Birmingham. The books, The Heartstone Odyssey, are currently being developed into a screenplay and are to be pitched to major film studios in Hollywood by the Oscar winning film producer, Barrie Osbourne.
Other highlights from the year include sterling efforts by staff and supporter alike in raising Stop Hate UK’s profile as well as much needed funding. In August a group of intrepid explorers (which included 3 members of the staff team) undertook the three peaks challenge—climbing Snowdon, Ben Nevis and Scafell Pike in just 24hrs, while one of our Trustees undertook the Great South Run for our cause.
Other fund raising events included a Drumming evening with the Abamtimbo Burundi Drummers which brought together many old friends and a powerful evening of music with our favourite choir—Sing Freedom.
In November we attended the annual National Helplines Partnership awards event. I am proud to report that Stop Hate UK received runner up in the Helpline Impact Award category while one of our operators, Alison Knight was also runner up as Employee of the Year! It is gratifying for the work we do to be recognised in this way and I am immensely proud to lead such an organisation and its staff, volunteers and supporters. Well done everyone.
This year Stop Hate UK was a partner in National Hate Crime Awareness Event and we were involved in many events across the country—including the very moving Hate Crime Vigil and service at St Pauls in London. We are strengthening that partnership for the 2015 event.
2015 is the 20th Anniversary of Stop Hate UK and we are busy planning celebrations and so I look forward to seeing many of you during the year.
We hope that the Stop Hate Line, and our other services, will go from strength to strength in 2015-2016. I send you all best wishes and I hope you enjoy the rest of
the summer. Rose Simkins, Chief Executive
4
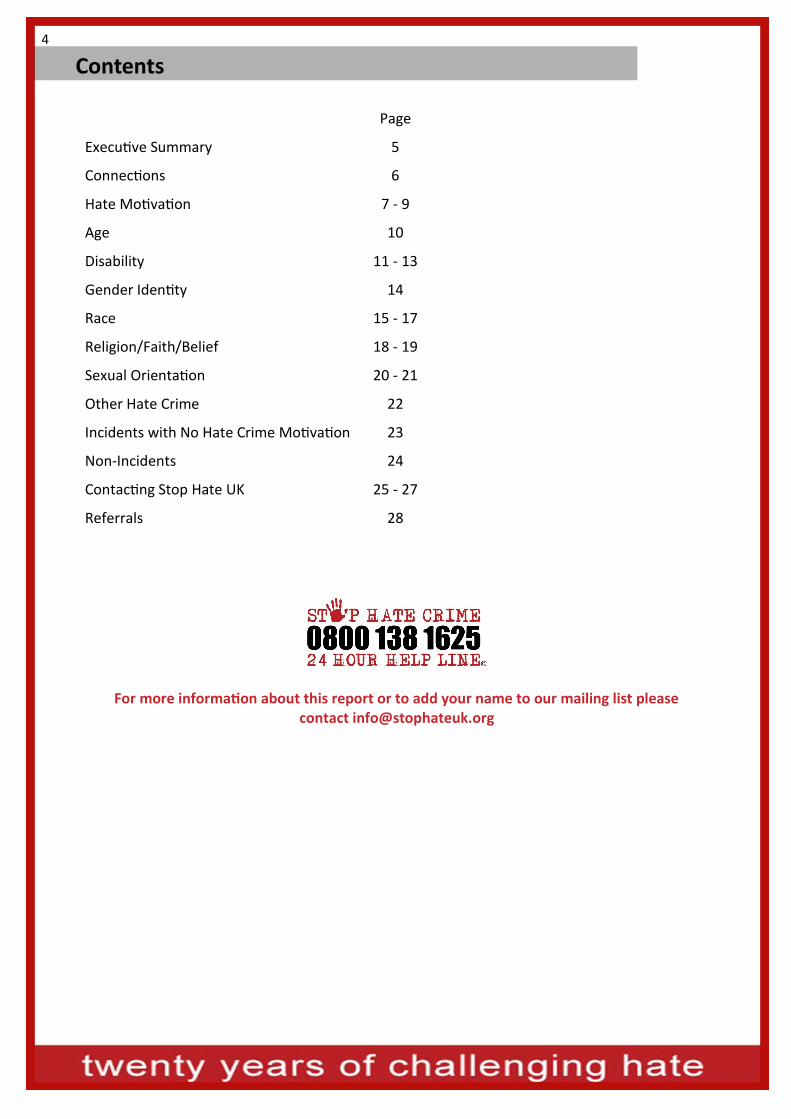
Contents
Page
Executive Summary 5
Connections 6
Hate Motivation 7 - 9
Age 10
Disability 11 - 13
Gender Identity 14
Race 15 - 17
Religion/Faith/Belief 18 - 19
Sexual Orientation 20 - 21
Other Hate Crime 22
Incidents with No Hate Crime Motivation 23
Non-Incidents 24
Contacting Stop Hate UK 25 - 27
Referrals 28
For more information about this report or to add your name to our mailing list please contact [email protected]

5
Executive Summary
This year Stop Hate UK answered 83% of calls to the 0800 and 0808 numbers within four rings. This shows that we continue to respond to victims when they need support. Our services are always open: available 24 hours a day, every day of the year.
Nearly 80% of contacts to Stop Hate UK were via the telephone during 2014-15. Previously our electronic reporting mechanisms had shown a growing usage but this trend has been reversed this year. However our new service for victims of LGB& T Hate Crime has seen greater use of email and other electronic methods in the first few months of operation therefore it is likely the trend will revert again during 2015-16.
This year Stop Hate UK made nearly 350 referrals to the police for investigation. We also made over 60 referrals to local authorities and more than 300 to other local support agencies. This means that through our service victims are able to get the support they need, in their local area.
Stop Hate UK received 315 reports where Race was a motivating factor and 310 where Disability was a motivating factor. These two strands remain the most often reported Hate reports. We also received 39 incident reports relating to Gender Identity Hate Crime - which represents a significant increase on the level of reporting for the second year running.
Reports involving a motivation based on Sexual Orientation also saw a 16% increase over last year and the new LGB&T Hate Crime helpline launched in January 2015 is likely to push that increase further.
The most commonly reported incident types continue to be Verbal Abuse and Threatening Behaviour, across all of the monitored strands.
Victims who identified that they were disabled most often reported having learning disability, mental ill health or physical/mobility disabilities.
While the numbers of reported incidents of Religion, Faith or Belief Hate Crimes remain relatively low, Muslim victims were most likely to report incidents again this year.
Overall we are pleased with the use of our services in 2014-15 and hope to see victims continue to receive an improved response from all agencies during 2015-16.
®
6
Table 1 — Total Number of Connections to all Stop Hate UK services
All calls and electronic contacts
Total 08-09
Total 09-10
Total 10-11
Total 11-12
Q1 14-15
Q2 14-15
Q3 14-15
Q4 14-15
Total 14-15
Total 12-13
Total 13-14
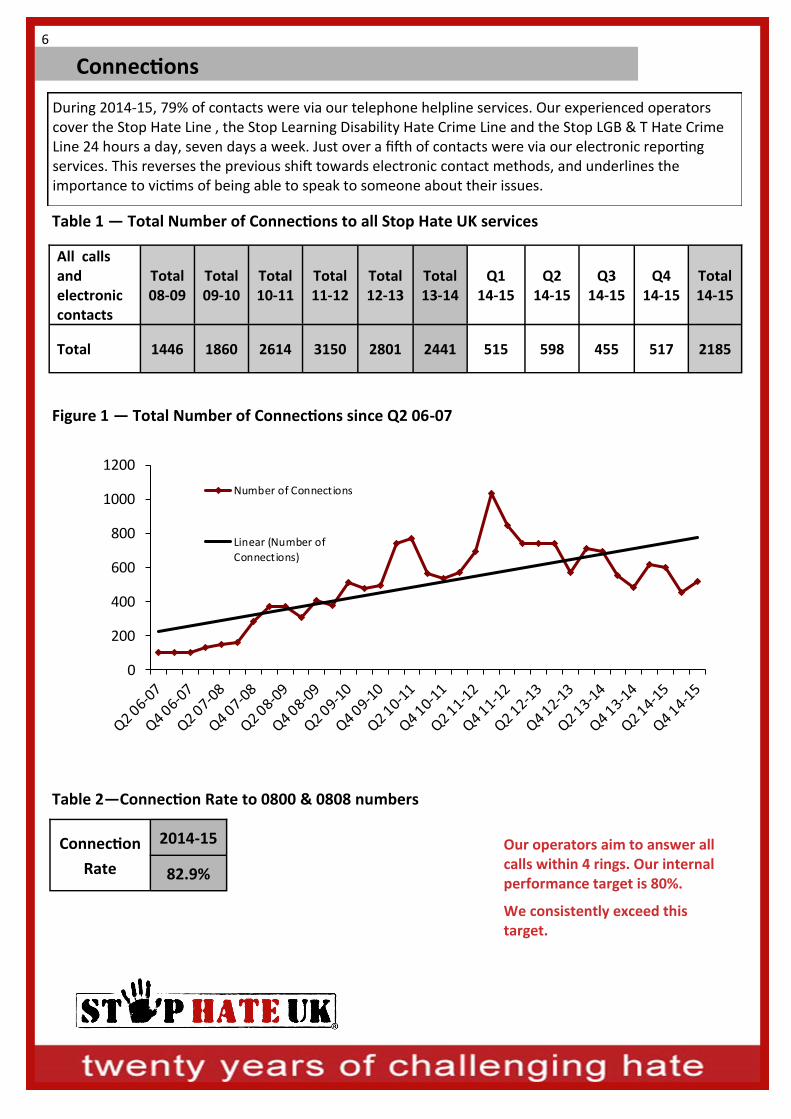
Total 1446 1860 2614 3150 515 598 455 517 2185 2801 2441
Figure 1 — Total Number of Connections since Q2 06-07
Connection
Rate
2014-15
82.9%
Table 2—Connection Rate to 0800 & 0808 numbers
Connections
During 2014-15, 79% of contacts were via our telephone helpline services. Our experienced operators cover the Stop Hate Line , the Stop Learning Disability Hate Crime Line and the Stop LGB & T Hate Crime Line 24 hours a day, seven days a week. Just over a fifth of contacts were via our electronic reporting services. This reverses the previous shift towards electronic contact methods, and underlines the importance to victims of being able to speak to someone about their issues.
Our operators aim to answer all calls within 4 rings. Our internal performance target is 80%.
We consistently exceed this target.
0
200
400
600
800
1000
1200
Number of Connections
Linear (Number of
Connections)

7
Hate Motivation
Statistical information can never give the full picture of Hate Crime. Figures can show you how many people were affected by a particular strand or how many were the victims of a particular type of incident, but they cannot tell you how this made the victim feel. Stop Hate UK has a conversational approach to recording Hate Crime. As well as taking details for the police and other agencies to investigate, we also listen to the victim, so they can tell us how incidents are affecting them and their family. This allows us to understand what they are experiencing and where appropriate arrange for local agencies to help.
Recorded below is a sample of some of the incidents that victims have told us about this year.
The Hate Crime Advocate is an additional service currently available to all Learning Disability, LGB&T callers and some Stop Hate Line areas. The advocate provides enhanced support over the phone and in writing to victims and assists them in liaising with local agencies and the police. If you are interested in this service speak to Andrew on 0113 293 5100.
Case Notes Caller with Learning Disability reporting problems at college. Caller stated he had autism and can get angry when he isn't listened to or 'things aren't right'. Caller stated he was being treated differently because of his particular disabilities and this is putting him in conflict with his tutor. Caller stated that his tutor gets him all worked up and this exacerbates the situation. Hate Crime Advocate followed up with caller and his mother, spending time talking through their concerns. As a result appropriate local support was identified and a coping strategy developed with the caller. Caller and his Mother were grateful for the chance to talk through their options and find a resolution to the problem.
Case Notes Caller with 4 children reporting daily abuse from a local group of youths in her neighbourhood. Caller is originally from Kurdistan but has lived in the UK for 7 years. Caller explained she has always had some problems since living in the area, however the targeted abuse has significantly increased over the past year and a half and now occur on a daily basis. Incidents included: numerous damage to car; threats of arson; several burglaries and burning of possessions; damage to front door with paint; physical attack resulting in injury and constant verbal abuse. Stop Hate UK made referral to Police and following joint and co-ordinated action from agencies the caller was successfully re located.

8
Hate Crime Q1 Q2 Q3 Q4 Total
Age 2 9 1 3 15
Disability 80 112 63 55 310
Gender Identity 9 10 14 6 39
Race 74 77 89 75 315
Religion/Faith/Belief 9 16 11 16 52
Sexual Orientation 39 35 28 20 122
Other* 71 54 38 38 201
Non-Hate Crime** 56 43 45 32 176
Number of calls reporting two or more Hate Crime strands
24 26 28 15 93
Hate Motivation - continued
The section below breaks down Hate Crime by strand allowing us to gain a better understanding of who is the victim of what kind of Hate Crime. If a person reports an incident with multiple motivations they will appear in all the relevant reports. We will also let you know about reports that we receive where the motivation is not one of the monitored strands, for example Alternative Subculture Hate Crime or where contacts are reporting other types of crime that are not perceived to be Hate-motivated.
This year the most commonly reported incident motivation was Race closely followed by Disability.
Table 3 — Hate Crime Motivation
Figure 2 — Hate Crime Motivation: 2014-15
*Stop Hate UK records incidents that are perceived by the victim to be motivated by Hate, but which do not fall into one of the monitored strands - for example Alternative Subculture Hate Crime.
**Non-Hate Crimes are incidents where the victim does not believe there was a Hate motivation involved.
Any crime motivated by an attribute personal to the victim has a greater impact than a similar crime committed for reasons not associated with the victim’s identity. *
*Crime Survey for England and Wales
0
20
40
60
80
100
120
Other Non-hate Age Disability GenderIdentity
Race Religion SexualOrientation
Q1 Q2 Q3 Q4

9
Hate Motivation - continued
Table 4 — Motivations
10% of contacts report Hate Crimes with multiple motivations compared to 9% in 2013/14. This highlights the importance of having multi-strand support available to victims.
Stop Hate UK operators are trained to support victims who report incidents relating to any strands of Hate Crime, including other forms of Hate Crime such as Sectarian Hate Crime or Caste Hate Crime.
Hate Crime Motivation Q1 Q2 Q3 Q4 Total
Age 1 5 - 2 8
Age and Disability - 2 1 1 4
Age and Other 1 - - 1 2
Disability 73 97 51 49 270
Disability and Other 2 2 3 - 7
Gender Identity 5 9 10 5 29
Gender Identity and Disability 1 - - - 1
Race 62 67 73 67 269
Race and Disability 2 - 5 3 10
Race and Disability and Age - 1 - - 1
Race and Gender Identity 1 - 2 - 3
Race and Religion 6 4 3 3 16
Race and Religion and Disability - 1 - - 1
Race and Religion and Sexual Orientation - 1 - - 1
Race and Sexual Orientation - 2 1 - 3
Race and Other 3 1 4 2 10
Religion 3 9 6 13 31
Religion and Disability - - 1 - 1
Religion and Other - - 1 - 1
Sexual Orientation 33 22 22 17 94
Sexual Orientation and Age - 1 - - 1
Sexual Orientation and Disability 2 7 2 1 12
Sexual Orientation and Disability and Other - 1 - - 1
Sexual Orientation and Gender Identity 2 - 2 1 5
Sexual Orientation and Gender Identity and Disability and Religion - 1 - - 1
Sexual Orientation and Other 2 - 1 1 4
Other 63 50 29 34 176
Number of contacts where a Hate Crime/Incident was reported 262 283 217 200 962
10
Age
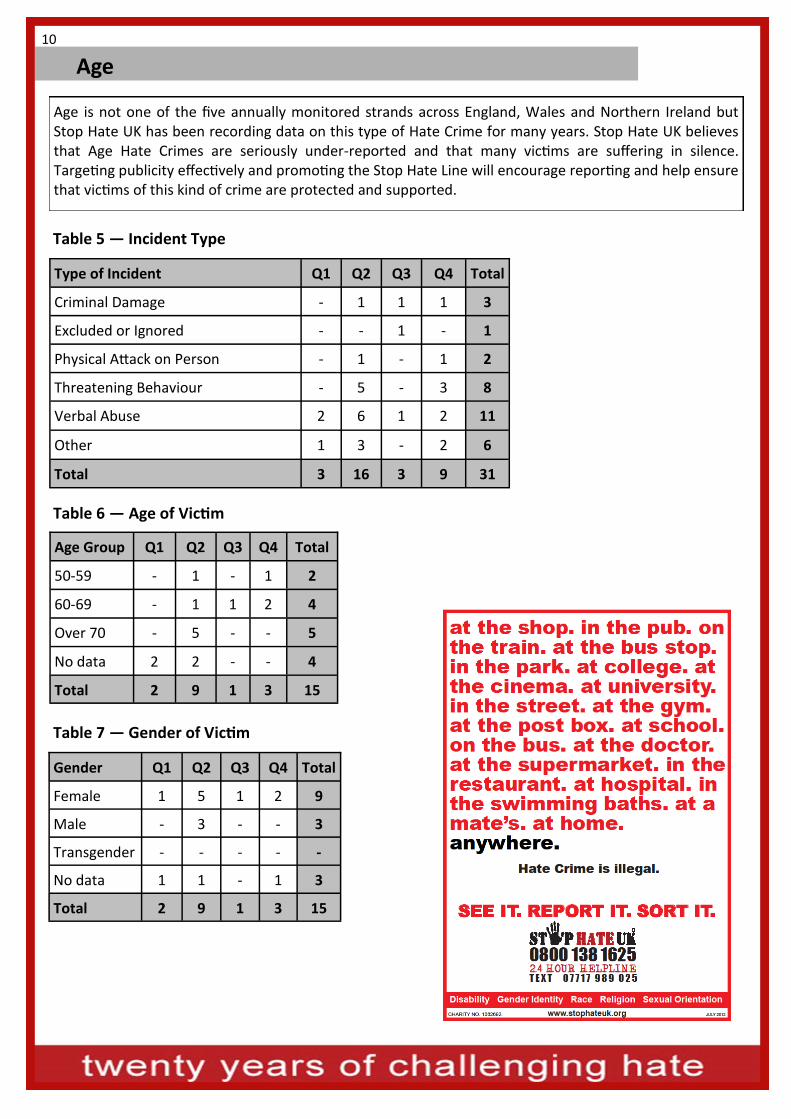
Table 5 — Incident Type
Type of Incident Q1 Q2 Q3 Q4 Total
Criminal Damage - 1 1 1 3
Excluded or Ignored - - 1 - 1
Physical Attack on Person - 1 - 1 2
Threatening Behaviour - 5 - 3 8
Verbal Abuse 2 6 1 2 11
Other 1 3 - 2 6
Total 3 16 3 9 31
Age is not one of the five annually monitored strands across England, Wales and Northern Ireland but Stop Hate UK has been recording data on this type of Hate Crime for many years. Stop Hate UK believes that Age Hate Crimes are seriously under-reported and that many victims are suffering in silence. Targeting publicity effectively and promoting the Stop Hate Line will encourage reporting and help ensure that victims of this kind of crime are protected and supported.
Table 6 — Age of Victim
Age Group Q1 Q2 Q4 Q3 Total
50-59 - 1 1 - 2
60-69 - 1 2 1 4
Over 70 - 5 - - 5
No data 2 2 - - 4
Total 2 9 3 1 15
Table 7 — Gender of Victim
Gender Q1 Q2 Q3 Q4 Total
Female 1 5 1 2 9
Male - 3 - - 3
Transgender - - - - -
No data 1 1 - 1 3
Total 2 9 1 3 15

11
Disability
Table 8 — Incident Type
Stop Hate UK received 310 reports of incidents with a Disability Hate motivation. 51% of victims were female, 48% male and 1% Transgender. 75% of victims were over 40. Verbal Abuse and Threatening Behaviour were the most commonly reported incident types.
Reports of Bullying and Teasing about looks have seen an increase this year as have Physical Attack. Incidents of False or Malicious Allegations remain a major issue for disabled people and are also reported to us on a regular basis. Cyber Bullying continues to feature across all strands of Hate Crime and Disability Hate Crime is no exception.
Case Notes Caller identifies as gay and disabled and a wheelchair user. Caller reports ongoing incidents involving people throwing eggs in his garden, stones at his windows and kicking his door. Caller believes that incidents are motivated by his disability, particularly given the abusive comments that he has also received, being called 'speedy Gonzalez' when out in his wheelchair. Caller suffers from depression, and incidents have been having a pronounced impact on his wellbeing. Operator was able to discover that the Caller had no formal or informal support. Referral made to police and follow up call by Hate Crime Advocate revealed caller had been visited by police, and caller found the meeting to be productive. They have advised that increased patrols by local PCSOs will be carried out in the area, and they will stop and visit caller from time to time to seek updates.
Type of Incident Q1 Q2 Q3 Q4 Total
ASB/Noise Nuisance 3 5 4 4 16
Asked to Give Up Money/Belongings 3 5 1 2 11
Bullying/Teasing about Looks/Body Shape/Size 2 10 5 4 21
Criminal Damage 13 11 5 4 33
Cyber Bullying 1 7 1 4 13
Discrimination 1 4 2 2 9
Excluded or Ignored 2 3 3 1 9
False/ Malicious Allegations 1 1 1 1 4
Forced to Do Something 0 6 2 1 9
Harassment/Stalking 2 2 3 1 8
Incitement 2 1 2 2 7
Offensive Language 4 8 7 1 20
Physical Attack 7 14 9 7 37
Rape/ Sexual Assault 1 0 0 0 1
Threatening Behaviour 37 45 23 15 120
Verbal Abuse 37 56 21 21 135
Other 10 22 15 16 63
Total 126 200 104 86 516
12
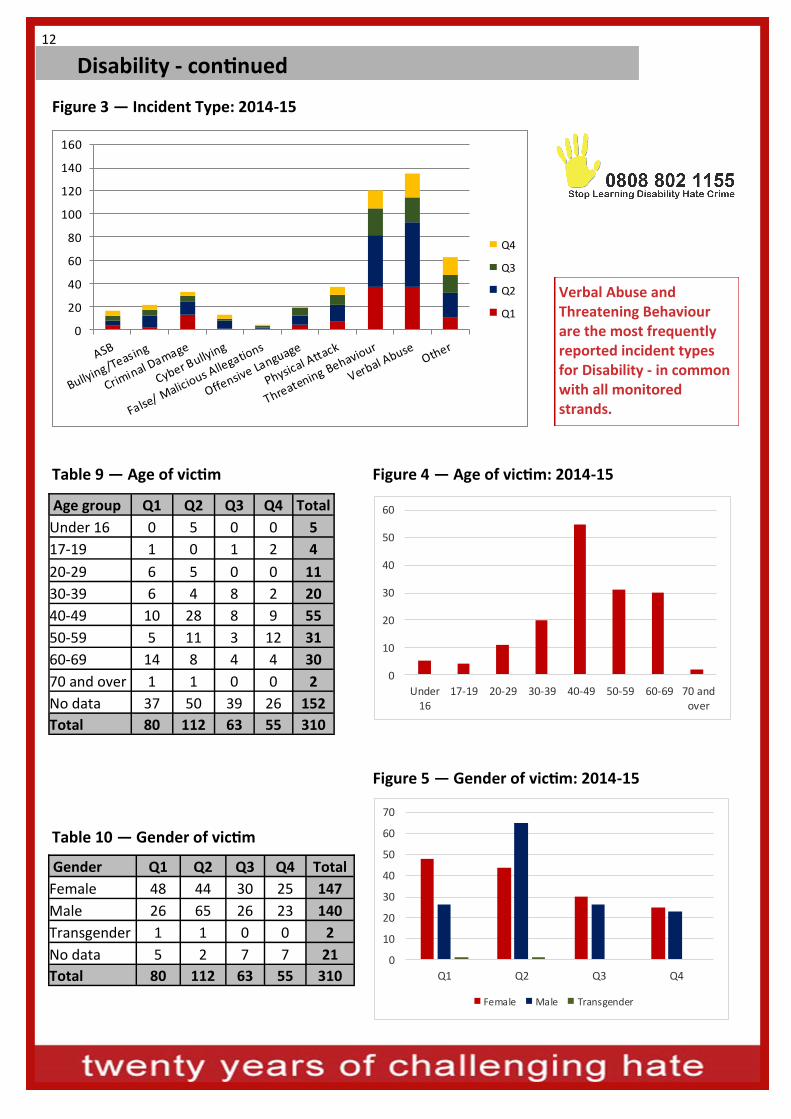
Figure 3 — Incident Type: 2014-15
Table 9 — Age of victim Figure 4 — Age of victim: 2014-15
Table 10 — Gender of victim
Figure 5 — Gender of victim: 2014-15
Disability - continued
Verbal Abuse and Threatening Behaviour are the most frequently reported incident types for Disability - in common with all monitored strands.
Age group Q1 Q2 Q3 Q4 Total
Under 16 0 5 0 0 5
17-19 1 0 1 2 4
20-29 6 5 0 0 11
30-39 6 4 8 2 20
40-49 10 28 8 9 55
50-59 5 11 3 12 31
60-69 14 8 4 4 30
70 and over 1 1 0 0 2
No data 37 50 39 26 152
Total 80 112 63 55 310
0
10
20
30
40
50
60
Under16
17-19 20-29 30-39 40-49 50-59 60-69 70 andover
Gender Q1 Q2 Q3 Q4 Total
Female 48 44 30 25 147
Male 26 65 26 23 140
Transgender 1 1 0 0 2
No data 5 2 7 7 21
Total 80 112 63 55 310 0
10
20
30
40
50
60
70
Q1 Q2 Q3 Q4
Female Male Transgender
0
20
40
60
80
100
120
140
160
Q4
Q3
Q2
Q1

13
Figure 6 — Disability of victim: 2014-15
Table 11 — Disability of victim
Disability - continued
Statistical Note: Victims may disclose more than one type of disability. All will be recorded in the relevant categories.
Contacts with a Physical Disability or Learning Disability have been most likely to report an incident this year. Mental Ill Health remains a significant factor in incidents of Disability Hate.
The Stop Hate Line Text Relay number is:
18001 0800 138 1625.
The Stop Learning Disability Hate Crime Text Relay number is:
18001 0808 802 1155
The Stop LGB & T Hate Crime Text Relay number is:
18001 0808 801 0661
We also offer SMS, chat, email, online form and postal reporting and support services.
Disability of Victim Q1 Q2 Q3 Q4 Total
Chronic Illness 6 6 4 2 18
Hearing Impairment 4 2 0 1 7
Learning Disability 33 42 25 15 115
Mental Health 13 13 6 9 41
Physical Mobility 5 23 14 9 51
Visual Impairment 1 2 0 1 4
Other 7 2 3 4 16
Total 69 90 49 37 245
0
5
10
15
20
25
30
35
40
45
Chronic Ilness Hearing
Impairment
Learning
Disability
Mental Health Physical
Mobility
Visual
Impairment
Other
Q1
Q2
Q3
Q4

14
Gender Identity
Table 13 — Gender of victim: 2014-15
Gender Q1 Q2 Q3 Q4 Total
Female 0 1 1 0 2
Male 1 0 1 1 3
Transgender 7 9 10 3 29
No data 1 0 2 2 5
Total 9 10 14 6 39
In 2013-14 only 555 Gender Identity Hate Crimes were reported to police nationally* - only 1.2% of all reported Hate Crimes. While this was an improvement of the previous year this strand of Hate Crime remains the least reported of the five monitored strands and we also currently see low call figures. This year, Stop Hate UK launched a new Helpline which covers England, Wales and Scotland specifically to target Lesbian, Gay, Bisexual and Transgender Hate Crime. While not officially launched until January 2015 we have seen an increase in calls relating to Gender Identity Hate Crime, amounting to 3.2% of all our separately monitored strands.
Our experience tells us that whilst the number of reports received by Stop Hate UK and other services may be low, the number of incidents suffered by the trans community is not.
*Latest available Home Office data
Type of Incident Q1 Q2 Q3 Q4 Total
Other 1 2 2 3 8
Verbal Abuse 6 5 7 2 20
Teasing about Looks/Body Shape/Size 2 1 1 0 4
Threatening Behaviour 4 3 4 0 11
Physical Attack 1 0 1 1 3
Offensive Language 2 0 2 0 4
Offensive Written/ Printed Material 0 0 1 0 1
Incitement 0 0 1 0 1
Forced to do Something 0 0 1 0 1
False/ Malicious Allegations 0 1 0 0 1
Deliberate/Threat of outing 0 1 1 0 2
Discrimination 1 1 1 0 3
Cyber Bullying 0 2 1 1 4
Criminal Damage 1 1 3 0 5
Total 18 17 26 7 68
Table 12 — Incident Type
Case Notes Caller identified as a Trans woman and reported being abused by hospital staff. The incident happened at hospital when she attended with her partner, who is lesbian to see an out of hour’s doctor. Caller said the doctor questioned her gender and her sexual orientation, as well as that of her partner. Caller said the doctor did not examine her properly and said ' why have you gone through the gender reassignment process?’ The doctor then made reference to the caller's partner saying 'why would she be with you and not a man?'. Incident was referred to the police.
Gender relates to the caller’s own definition of their gender.

15
Race, Ethnicity and Nationality
Table 14 — Incident Type
Figure 7 — Incident type: 2014-15
Race, Ethnicity and Nationality related incidents were the most commonly reported Hate Crime strand this year. The most commonly reported incident types were Verbal Abuse and Threatening Behaviour. ‘Other’ incidents reported included service provision, online publications, theft, and sexual assault.
Type of Incident Q1 Q2 Q3 Q4 Total
ASB 2 4 3 2 11
Criminal Damage 6 10 17 11 44
Cyber Bullying 3 2 6 3 14
Discrimination 6 3 3 2 14
Excluded or Ignored 4 1 6 2 13
False/ Malicious Allegations 1 0 2 1 4
Harassment 0 1 3 3 7
Incitement 3 0 3 3 9
Offensive Language 9 8 11 9 37
Offensive Written/ Printed Material 2 2 8 3 15
Other 12 14 14 11 51
Physical Attack 6 9 10 9 34
Threatening Behaviour 28 29 30 21 108
Verbal Abuse 31 40 43 33 147
Total 113 123 159 113 508
0
20
40
60
80
100
120
140
160
Q4
Q3
Q2
Q1
16
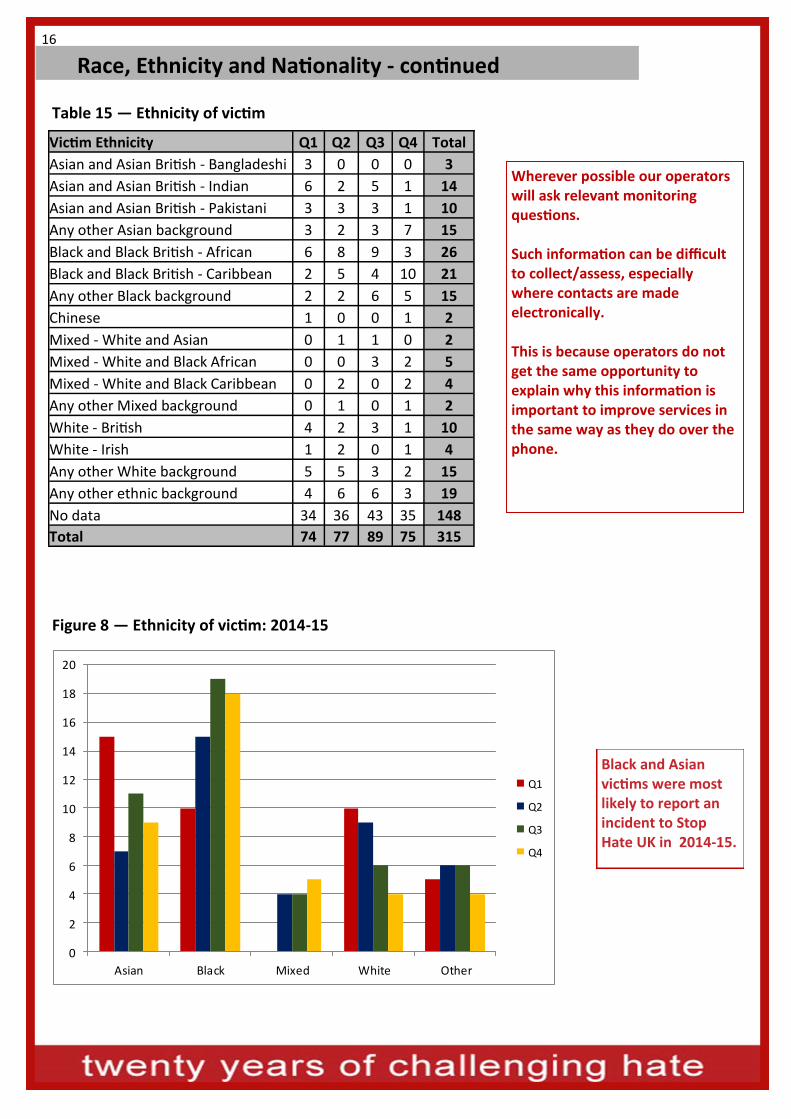
Table 15 — Ethnicity of victim
Figure 8 — Ethnicity of victim: 2014-15
Race, Ethnicity and Nationality - continued
Black and Asian victims were most likely to report an incident to Stop Hate UK in 2014-15.
Wherever possible our operators will ask relevant monitoring questions. Such information can be difficult to collect/assess, especially where contacts are made electronically. This is because operators do not get the same opportunity to explain why this information is important to improve services in the same way as they do over the phone.
Victim Ethnicity Q1 Q2 Q3 Q4 Total
Asian and Asian British - Bangladeshi 3 0 0 0 3
Asian and Asian British - Indian 6 2 5 1 14
Asian and Asian British - Pakistani 3 3 3 1 10
Any other Asian background 3 2 3 7 15
Black and Black British - African 6 8 9 3 26
Black and Black British - Caribbean 2 5 4 10 21
Any other Black background 2 2 6 5 15
Chinese 1 0 0 1 2
Mixed - White and Asian 0 1 1 0 2
Mixed - White and Black African 0 0 3 2 5
Mixed - White and Black Caribbean 0 2 0 2 4
Any other Mixed background 0 1 0 1 2
White - British 4 2 3 1 10
White - Irish 1 2 0 1 4
Any other White background 5 5 3 2 15
Any other ethnic background 4 6 6 3 19
No data 34 36 43 35 148
Total 74 77 89 75 315
0
2
4
6
8
10
12
14
16
18
20
Asian Black Mixed White Other
Q1
Q2
Q3
Q4
17
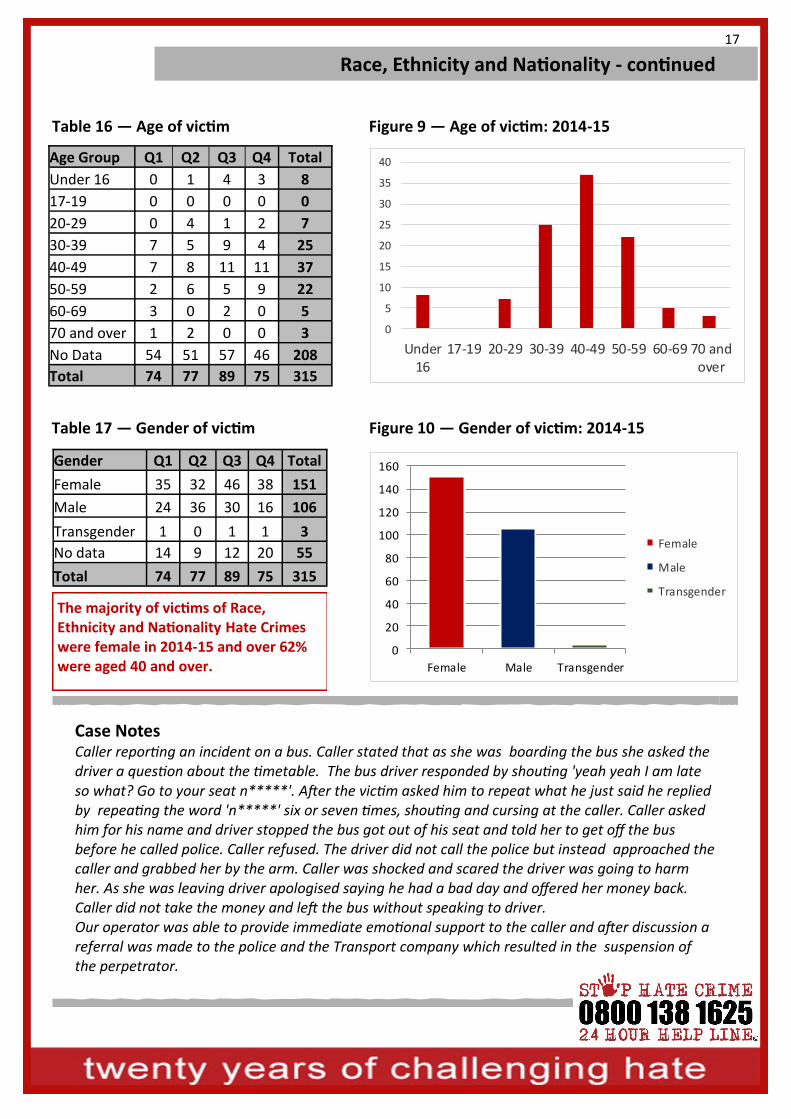
Table 16 — Age of victim
Table 17 — Gender of victim
Figure 9 — Age of victim: 2014-15
Figure 10 — Gender of victim: 2014-15
Race, Ethnicity and Nationality - continued
Case Notes Caller reporting an incident on a bus. Caller stated that as she was boarding the bus she asked the driver a question about the timetable. The bus driver responded by shouting 'yeah yeah I am late so what? Go to your seat n*****'. After the victim asked him to repeat what he just said he replied by repeating the word 'n*****' six or seven times, shouting and cursing at the caller. Caller asked him for his name and driver stopped the bus got out of his seat and told her to get off the bus before he called police. Caller refused. The driver did not call the police but instead approached the caller and grabbed her by the arm. Caller was shocked and scared the driver was going to harm her. As she was leaving driver apologised saying he had a bad day and offered her money back. Caller did not take the money and left the bus without speaking to driver. Our operator was able to provide immediate emotional support to the caller and after discussion a referral was made to the police and the Transport company which resulted in the suspension of the perpetrator.
The majority of victims of Race, Ethnicity and Nationality Hate Crimes were female in 2014-15 and over 62% were aged 40 and over.
Age Group Q1 Q2 Q3 Q4 Total
Under 16 0 1 4 3 8
17-19 0 0 0 0 0
20-29 0 4 1 2 7
30-39 7 5 9 4 25
40-49 7 8 11 11 37
50-59 2 6 5 9 22
60-69 3 0 2 0 5
70 and over 1 2 0 0 3
No Data 54 51 57 46 208
Total 74 77 89 75 315
0
5
10
15
20
25
30
35
40
Under16
17-19 20-29 30-39 40-49 50-59 60-69 70 andover
Gender Q1 Q2 Q3 Q4 Total
Female 35 32 46 38 151
Male 24 36 30 16 106
Transgender 1 0 1 1 3
No data 14 9 12 20 55
Total 74 77 89 75 315
0
20
40
60
80
100
120
140
160
Female Male Transgender
Female
Male
Transgender

18
Religion, Faith and Belief
Table 18 — Incident Type
Figure 11 — Incident Type: 2014-15
There were 94 reports of incidents related to a victim’s Religion, Faith or Belief during 2014-15. This is an increase from 2013-14 of just under 10%.
Type of Incident Q1 Q2 Q3 Q4 Total
Criminal Damage 1 1 0 0 2
Cyber Bullying 1 5 1 2 9
Excluded or Ignored 0 0 0 1 1
False/ Malicious Allegations 1 0 0 0 1
Harassment 1 1 0 0 2
Incitement 1 3 1 2 7
Offensive Language/Graffiti/Online posts 1 6 4 3 14
Physical Attack 1 2 1 2 6
Threatening Behaviour 4 6 4 4 18
Verbal Abuse 2 7 3 10 22
Written/print 0 1 1 0 2
Other 2 1 4 3 10
Total 15 33 19 27 94
0 5 10 15 20 25
Criminal Damage
Cyber Bullying
Excluded or Ignored
False/ Malicious Allegations
Harassment
Incitement
Offensive Language/Graffiti/Online posts
Physical Attack
Threatening Behaviour
Verbal Abuse
Written/print
Other

19
Table 19 — Ethnicity of victim
Religion, Faith and Belief - continued
Table 20 — Religion of victim
Figure 12 — Religion of victim: 2014-15
Persons reporting Religion, Faith and Belief Hate Crime during 2014-15 were most likely to be Muslim.
Religion Q1 Q2 Q3 Q4 Total
Buddhist - - - 2 2
Christian - - 3 - 3
Jewish 1 2 2 5
Muslim 3 6 6 3 18
Other 1 2 1 1 5
No data 4 6 1 8 19
Total 9 16 11 16 52
0
2
4
6
8
10
12
14
16
18
20
Buddhist Christian Jewish Muslim Other
Victim Ethnicity Q1 Q2 Q3 Q4 Total
Asian and Asian British Indian 2 - 1 - 3
Asian and Asian British Pakistani 1 3 1 1 6
Asian Other 1 - - - 1
Black and Black British African - - - 1 1
White - British 1 - 2 2 5
Any Other 1 - 3 1 5
No data 3 13 4 11 31
Total 9 16 11 16 52
Case Notes Caller contacted helpline to report that her neighbour regularly verbally abuses her and her family to other people with reference to her religion using phrases such as 'f****** Jewish liars' and 'they are going to die'. Incident referred to Local Authority

20
Sexual Orientation
Table 21 — Incident Type
Figure 13 — Incident Types: 2014-15
The number of Sexual Orientation Hate Crimes reported to Stop Hate UK has increased this year compared with the previous year. Our experience tells us that Hate Crime against the LGB community is a daily occurrence.
In January 2015 Stop Hate UK launched a new Helpline which covers England, Wales and Scotland specifically to target Lesbian, Gay, Bisexual and Transgender Hate Crime.
Verbal Abuse and Threatening Behaviour continue to be the most commonly reported incident types during 2014-15. Reports of Physical Attacks have increased this year and there were a number of reports of Offensive Language being used about members of the LGB community. Although not directed at an individual, derogatory and inflammatory remarks directed against any section of our society are extremely detrimental to everyone.
Incident Type Q1 Q2 Q3 Q4 Total
ASB 2 0 2 0 4
Criminal Damage 2 4 2 1 9
Cyber Bullying 1 1 1 2 5
Deliberate/Threat of Outing 0 1 2 0 3
Excluded or Ignored 1 0 0 1 2
Harassment 3 2 0 0 5
Incitement 1 1 1 4 7
Offensive Language 5 3 3 2 13
Other 2 5 3 1 11
Physical Attack 2 6 8 2 18
Teasing about Looks 1 1 1 0 3
Threatening Behaviour 23 20 10 10 63
Verbal Abuse 27 22 17 5 71
Written/printed material 0 1 0 0 1
Total 70 67 50 28 215
0 10 20 30 40 50 60 70 80
ASBCriminal Damage
Cyber BullyingDeliberate/Threat of Outing
Excluded or IgnoredHarassmentIncitement
Offensive LanguageOther
Physical AttackTeasing about Looks
Threatening BehaviourVerbal Abuse
Written/printed material
21
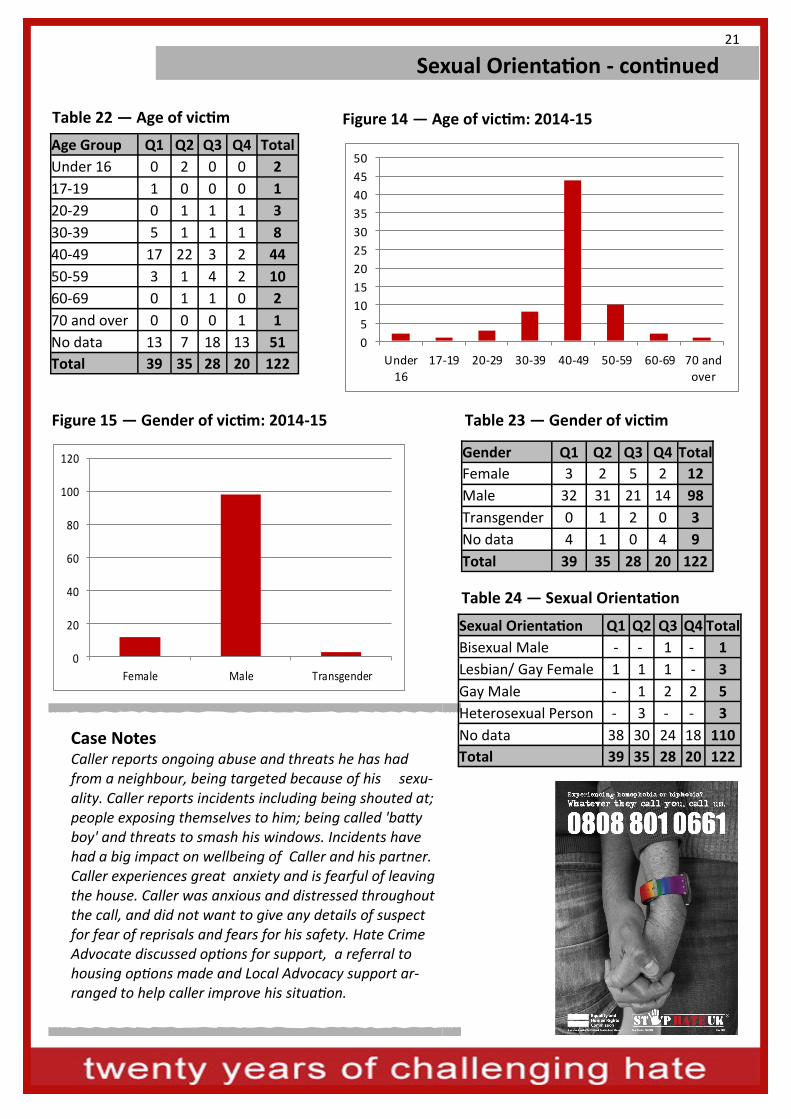
Figure 15 — Gender of victim: 2014-15
Table 22 — Age of victim Figure 14 — Age of victim: 2014-15
Table 23 — Gender of victim
Table 24 — Sexual Orientation
Sexual Orientation - continued
Age Group Q1 Q2 Q3 Q4 Total
Under 16 0 2 0 0 2
17-19 1 0 0 0 1
20-29 0 1 1 1 3
30-39 5 1 1 1 8
40-49 17 22 3 2 44
50-59 3 1 4 2 10
60-69 0 1 1 0 2
70 and over 0 0 0 1 1
No data 13 7 18 13 51
Total 39 35 28 20 122
0
5
10
15
20
25
30
35
40
45
50
Under
16
17-19 20-29 30-39 40-49 50-59 60-69 70 and
over
Gender Q1 Q2 Q3 Q4 Total
Female 3 2 5 2 12
Male 32 31 21 14 98
Transgender 0 1 2 0 3
No data 4 1 0 4 9
Total 39 35 28 20 122
0
20
40
60
80
100
120
Female Male Transgender
Case Notes Caller reports ongoing abuse and threats he has had from a neighbour, being targeted because of his sexu-ality. Caller reports incidents including being shouted at; people exposing themselves to him; being called 'batty boy' and threats to smash his windows. Incidents have had a big impact on wellbeing of Caller and his partner. Caller experiences great anxiety and is fearful of leaving the house. Caller was anxious and distressed throughout the call, and did not want to give any details of suspect for fear of reprisals and fears for his safety. Hate Crime Advocate discussed options for support, a referral to housing options made and Local Advocacy support ar-ranged to help caller improve his situation.
Sexual Orientation Q1 Q2 Q3 Q4 Total
Bisexual Male - - 1 - 1
Lesbian/ Gay Female 1 1 1 - 3
Gay Male - 1 2 2 5
Heterosexual Person - 3 - - 3
No data 38 30 24 18 110
Total 39 35 28 20 122
22
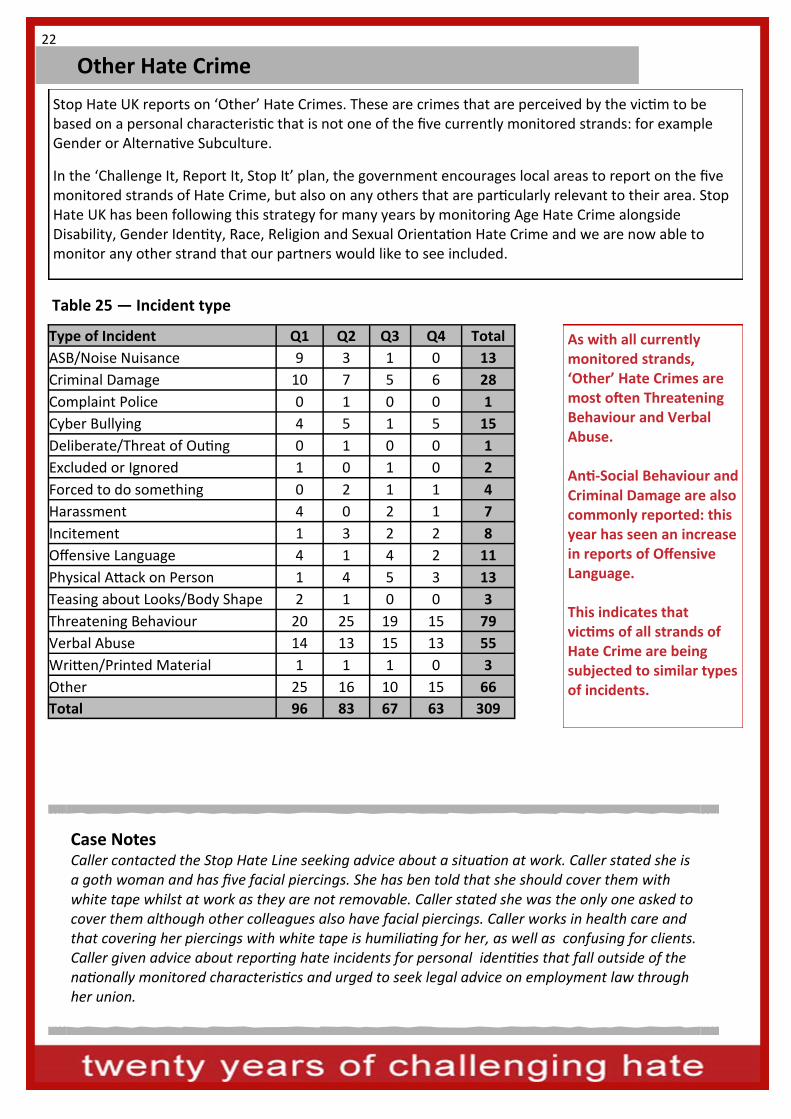
Other Hate Crime
Stop Hate UK reports on ‘Other’ Hate Crimes. These are crimes that are perceived by the victim to be based on a personal characteristic that is not one of the five currently monitored strands: for example Gender or Alternative Subculture.
In the ‘Challenge It, Report It, Stop It’ plan, the government encourages local areas to report on the five monitored strands of Hate Crime, but also on any others that are particularly relevant to their area. Stop Hate UK has been following this strategy for many years by monitoring Age Hate Crime alongside Disability, Gender Identity, Race, Religion and Sexual Orientation Hate Crime and we are now able to monitor any other strand that our partners would like to see included.
Table 25 — Incident type
As with all currently monitored strands, ‘Other’ Hate Crimes are most often Threatening Behaviour and Verbal Abuse. Anti-Social Behaviour and Criminal Damage are also commonly reported: this year has seen an increase in reports of Offensive Language. This indicates that victims of all strands of Hate Crime are being subjected to similar types of incidents.
Type of Incident Q1 Q2 Q3 Q4 Total
ASB/Noise Nuisance 9 3 1 0 13
Criminal Damage 10 7 5 6 28
Complaint Police 0 1 0 0 1
Cyber Bullying 4 5 1 5 15
Deliberate/Threat of Outing 0 1 0 0 1
Excluded or Ignored 1 0 1 0 2
Forced to do something 0 2 1 1 4
Harassment 4 0 2 1 7
Incitement 1 3 2 2 8
Offensive Language 4 1 4 2 11
Physical Attack on Person 1 4 5 3 13
Teasing about Looks/Body Shape 2 1 0 0 3
Threatening Behaviour 20 25 19 15 79
Verbal Abuse 14 13 15 13 55
Written/Printed Material 1 1 1 0 3
Other 25 16 10 15 66
Total 96 83 67 63 309
Case Notes Caller contacted the Stop Hate Line seeking advice about a situation at work. Caller stated she is a goth woman and has five facial piercings. She has ben told that she should cover them with white tape whilst at work as they are not removable. Caller stated she was the only one asked to cover them although other colleagues also have facial piercings. Caller works in health care and that covering her piercings with white tape is humiliating for her, as well as confusing for clients. Caller given advice about reporting hate incidents for personal identities that fall outside of the nationally monitored characteristics and urged to seek legal advice on employment law through her union.
23
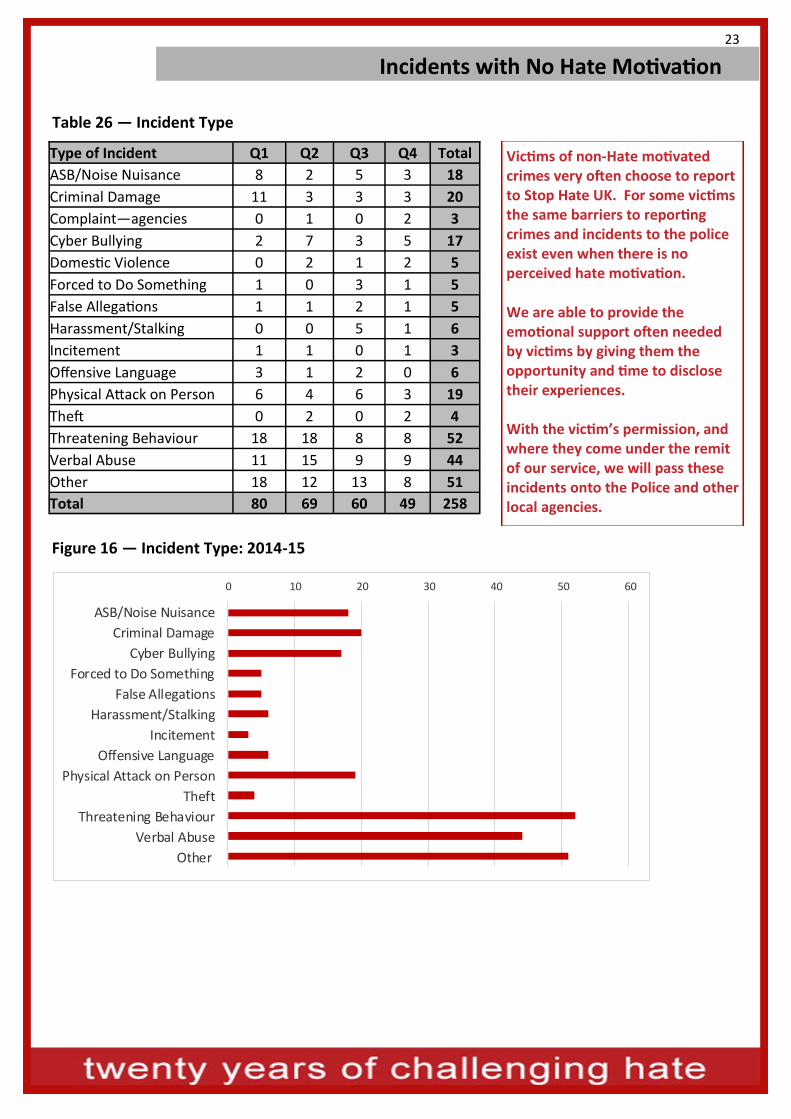
Table 26 — Incident Type
Figure 16 — Incident Type: 2014-15
Victims of non-Hate motivated crimes very often choose to report to Stop Hate UK. For some victims the same barriers to reporting crimes and incidents to the police exist even when there is no perceived hate motivation. We are able to provide the emotional support often needed by victims by giving them the opportunity and time to disclose their experiences. With the victim’s permission, and where they come under the remit of our service, we will pass these incidents onto the Police and other local agencies.
Incidents with No Hate Motivation
Type of Incident Q1 Q2 Q3 Q4 Total
ASB/Noise Nuisance 8 2 5 3 18
Criminal Damage 11 3 3 3 20
Complaint—agencies 0 1 0 2 3
Cyber Bullying 2 7 3 5 17
Domestic Violence 0 2 1 2 5
Forced to Do Something 1 0 3 1 5
False Allegations 1 1 2 1 5
Harassment/Stalking 0 0 5 1 6
Incitement 1 1 0 1 3
Offensive Language 3 1 2 0 6
Physical Attack on Person 6 4 6 3 19
Theft 0 2 0 2 4
Threatening Behaviour 18 18 8 8 52
Verbal Abuse 11 15 9 9 44
Other 18 12 13 8 51
Total 80 69 60 49 258
0 10 20 30 40 50 60
ASB/Noise Nuisance
Criminal Damage
Cyber Bullying
Forced to Do Something
False Allegations
Harassment/Stalking
Incitement
Offensive Language
Physical Attack on Person
Theft
Threatening Behaviour
Verbal Abuse
Other

24
Non-Incidents
Table 25 — Contact Type
Figure 17 — Contact Type: 2014-15
At Stop Hate UK we believe that a conversational approach allows victims of Hate Crime to gain confidence in reporting incidents and also gives them time to explain difficult, complicated and long running situations in a supportive and empathetic environment.
Stop Hate UK also recognises how important it is to victims to be able to discuss issues as they arise, keep up to date with their case and keep agencies in the loop relating to the abuse they are facing. Callers feel confident that Stop Hate UK is always there for them and this is reflected in the number of callers that regularly update us about the progress of their case. People value our ability to listen to their updates as it provides a continuity of support often lacking with main stream services.
Silent and dropped calls account for 12% of all calls. Operators will try and get a response from the caller by advising them they have contacted Stop Hate UK and asking how we can assist. In these instances no response has been received. We know that some calls are people testing that the system works
Type of Non-Incident Q1 Q2 Q3 Q4 Total
Agency updating 5 7 4 5 21
Client updating 99 130 58 65 352
Enquiry - about Stop Hate UK 25 37 25 39 126
Enquiry - publicity request 3 3 8 5 19
Enquiry - signposting 30 26 24 55 135
Hoax/Abusive 6 3 11 16 36
Listening/Support 17 20 8 50 95
Other 2 1 4 8 15
Silent/Dropped calls 112 48 51 44 255
Total 299 275 193 287 1054
0 50 100 150 200 250 300 350 400
Agency updating
Client updating
Enquiry - about Stop Hate UK
Enquiry - publicity request
Enquiry - signposting
Hoax/Abusive
Listening/Support
Other
Silent/Dropped calls

25
Table 26 — Method of contact Figure 18 — Method of contact: 2014-15
Table 27 — Type of Contact
Figure 19 — Type of Contact: 2014-15
Contacting Stop Hate UK
Contacts report incidents to the Stop Hate Line, the Stop Learning Disability Hate Crime Line and the Stop LGB & T Hate Crime line but they also contact us for updates and additional support. This extra level of service is something Stop Hate UK believes is really important for victims of Hate Crime, so that they have a space to talk about their experiences.
By providing a number of different ways to contact Stop Hate UK we strive to make it as simple and as convenient as possible for victims of Hate Crime to report what has happened to them.
Method Q1 Q2 Q3 Q4 Total
Telephone 501 487 355 379 1722
Email 53 59 52 75 239
SMS 13 14 18 16 61
Chat 32 23 27 31 113
Letter 5 1 0 0 6
Online Form 0 12 0 12 24
Total 615 599 454 517 2185
Type of Contact Q1 Q2 Q3 Q4 Total
Incident report 316 324 261 230 1131
Listening/support/update 121 157 70 120 468
Enquiry 58 66 57 99 280
Silent/dropped contact 112 48 51 44 255
Hoax/abusive/spam 6 3 11 16 36
Other 2 1 4 8 15
All Calls 615 599 454 517 2185
52%
21%
13%
12%
1% 1%
Incident report
Listening/support/update
Enquiry
Silent/dropped contact
Hoax/abusive/spam
Other
80%
11%
3%5%0% 1%
Telephone
SMS
Chat
Letter
Online Form

26
Table 29 — Average duration of connected telephone calls, SMS and chat (minutes)
Type of contact Q1 Q2 Q3 Q4 2014/15
Incident report 16.2 18.8 20.3 20.1 18.6
Enquiry/listening 5.3 7.5 10.3 7.5 7.4
All contacts 11.0 13.5 16.2 12.9 13.2
Contacting Stop Hate UK - continued
Table 28 — Time of contact
Figure 20 — Time of contact: 2014-15
Being able to contact someone 24 hours a day is really important. Hate Crimes do not just occur during office hours. The need to receive emotional support is more likely to be stronger during the night when victims are often alone and scared. Being able to report an incident as it happens, not only provides the victim with immediate reassurance, but it also ensures that details of what happened are collected quickly and passed onto the Police and other agencies for investigation and support.
Half of contacts with our helplines have been at weekends/ bank holidays or outside normal office hours this year.
The Stop Hate Line can be accessed by the Text Relay service by calling:
18001 0800 138 1625.
Some contacts may also find our chat and text services covered 24/7 by trained operators an accessible way to report Hate Crime.
Time Q1 Q2 Q3 Q4 Total
09:00-17:00 Monday to Friday (‘office hours’) 300 333 244 212 1089
17:00–09:00 Monday to Friday 184 158 135 180 657
Saturdays, Sundays and Bank Holidays 131 107 76 125 439
Total number of connections 615 598 455 517 2185
Total connections 'Out of Office hours' 315 265 211 305 1096
50%
30%
20%
09:00-17:00 Monday
to Friday (‘office hours ’)
17:00–09:00 Monday
to Friday
Saturdays, Sundaysand Bank Holidays

27
Contacting Stop Hate UK - continued
Table 30 — Method of finding out about the Stop Hate UK
Figure 21 — Method of finding out about Stop Hate UK: 2014-15
Stop Hate UK provides a unique service to victims of all forms of Hate Crime. Promotion of our services is vital to ensure that victims, third parties and witnesses are aware of how we can help.
Promotional materials are available from [email protected] and Stop Hate UK can work on bespoke campaigns to target specific communities or strands of Hate Crime.
Promotional material such as leaflets, posters and articles in newspapers are a good way of advertising our helplines. For more information contact us at: [email protected]
Method/Location Q1 Q2 Q3 Q4 Total
Advert 1 1 0 3 5
Council 4 10 8 3 25
Hate Incident Reporting Centres 0 0 0 1 1
Housing office 1 4 8 2 15
Internet 37 54 32 45 168
Leaflet 12 7 14 14 47
Local Organisation 25 41 36 39 141
Newsletter/Neswpaper 3 3 1 0 7
Police 9 6 9 12 36
Poster 1 2 4 1 8
Word of Mouth 9 12 5 7 33
Work 3 5 11 8 27
Other 1 0 2 6 9
0 20 40 60 80 100 120 140 160 180
Advert
Council
HIRC
Housing office
Internet
Leaflet
Local Organisation
Newsletter/Neswpaper
Police
Poster
Word of Mouth
Work
Other
A significant number of people learn about our service through local organisations indicating that our partnership approach is working.

28
Referrals Made by the Stop Hate Line
Table 31 — Referrals Made by Stop Hate UK
Figure 22 — Referrals Made by Stop Hate UK: 2014-15
Stop Hate UK makes referrals to agencies in Stop Hate Line areas and to relevant local agencies for callers to the Stop Learning Disability Hate Crime Line and the Stop LGB&T Hate Crime Line if the contact wants us to. Ongoing support for victims is then provided by agencies near to where the victim lives. We have operators from a diverse range of backgrounds but all our operators are trained to support victims of Hate Crime across the Hate Crime strands. This ensures that whenever a contact accesses the Stop Hate Line or Stop Learning Disability Hate Crime Line they will get someone who can empathise and understand the victim’s perspective, whilst at the same time giving accurate and timely advice.
Referrals are made to a number of agencies. Stop Hate Line funded areas can choose to add referral points for specialist agencies in their locality if they wish to, or they can make an onward referral themselves.
Stop Hate UK has made 340 referrals to police and nearly 400 referrals to other agencies this year. Where appropriate we will make information only referrals to organisations such as ‘Tell Mama’ (anti Muslim incidents), ‘Community Security Trust’ (anti semitic incidents) and GALOP (London based LGB&T incidents.
Referral Agency Q1 Q2 Q3 Q4 Total
Police—Full 82 106 62 53 303
Police—Anon 10 11 11 5 37
Victim Support 24 15 19 11 69
Local Authority 14 17 18 16 65
Safeguarding 1 - - - 1
Other Support Organisations 80 81 48 47 256
Total number of referrals made 211 230 158 132 731
0
20
40
60
80
100
120
Pol ice—Full Pol ice—Anon Victim Support Local Authority Other
Q1 Q2 Q3 Q4

29
For further information about Stop Hate UK or any of our services, please contact:
Ian Davey - Reporting Analyst [email protected]
Andrew Bolland - Partnerships and Contracts Manager [email protected]
Rose Simkins - Chief Executive [email protected]