Statistical Aspects of Imaging Cancer with PET
Finbarr O’Sullivan
Department of StatisticsUniversity College Cork
Ireland
50’th CelebrationMadison, WIJune, 2010.
Collaborators: Janet Eary, Ken Krohn, David Mankoff, Mark Muzi, Alex Spence (UW)Jian Huang, Niall Fitzgerald, Eric Wolsztynski (UCC)
Supported by: MI-2007 (SFI), P01-CA-42045 & RO1-CA-65537 (NIH)

Positron Emission Tomography (PET) BASICS
Data ~ Poisson(S+ARλ)λ is the target isotope emission distribution (where the tracer ends up)
R (Radon Transform); A (Attenuation); S (Scatter)
Dose Limited Resolution -> Statistical Aspects are Important (Vardi et al,…Nychka, Wahba…Leahy..)
Imaging Model

CLINICAL PET IMAGINGScanner (PET/CT)
ThyroidBrain
Heart
Bladder
Metabolic State of Cancer?
Normal Glucose (FDG) Pattern Source: Radiological Society of North America

PET Scans used in Cancer Medicine
• Diagnosis/Staging
• Treatment Response
• Recurrence Assessment
Increasing Emphasis on Clinical Validation: PET measurements Patient Outcomes [Survival, Disease Progression,Morbibity ]
18 year PET-FDG study at UW ~ 900 Sarcoma patients (scans and outcome data)

Human Sarcoma
• Class of malignant tumors affecting soft conjonctive tissue, cartilage and bone
• Can arise anywhere in the body, frequently hidden deep in the limbs
• Represents ~1% of adult cancers, more prevalent with children (~15-20%), ~10% of all cancers overall
• 5-year mean survival rate: ~90% (stage 1), ~75% (stage 2), ~54% (Stage 3) [statistics for the USA]
• Soft tissue sarcomas usually appear as a lump or mass, rarely cause pain, swelling, or other symptoms. Often misdiagnosed. Sometimes thought to be sports injuries.
• “Late detection” is not unusual → potentially advanced stage of development

PET-FDGSarcomaStudies
Soft TissueHigh Grade
Bone TissueHigh Grade
Soft TissueHigh Grade
Soft TissueHigh Grade
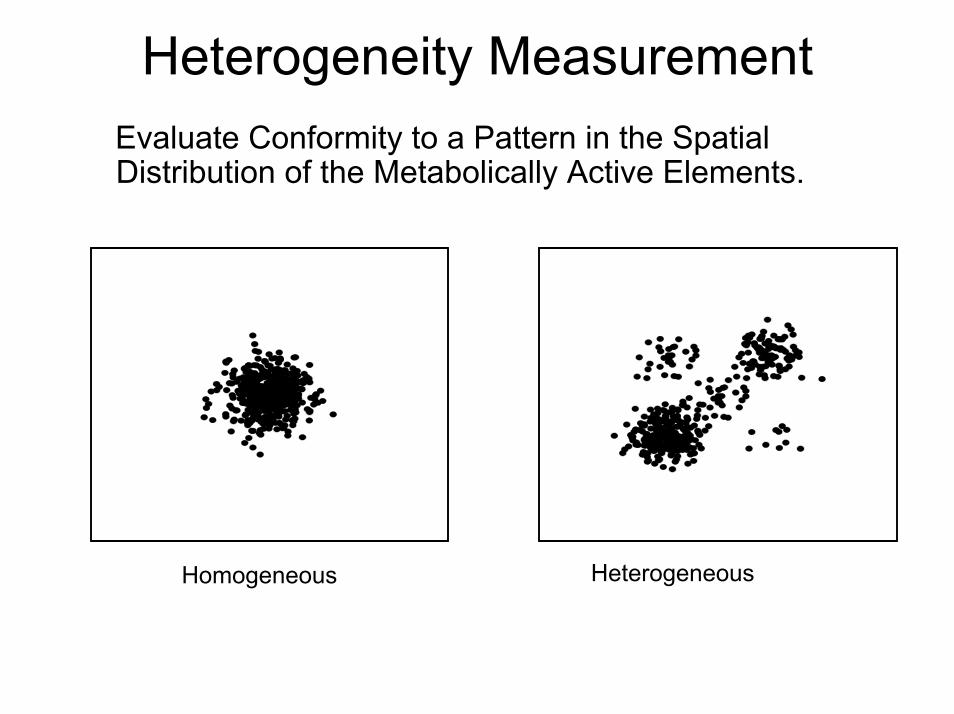
Heterogeneity Measurement Evaluate Conformity to a Pattern in the Spatial Distribution of the Metabolically Active Elements.
Homogeneous Heterogeneous

CV Spatially Insensitive
Spatially Coherent Spatially Incoherent
0.0 0.2 0.4 0.6 0.8 1.0
010
020
030
040
0
Histogram
CV is 0.71 for Both!

Ellipsoidal Model for Homogeneous Tumor
x1
0.1
0.2
0.3
0.4
0.5
0.60.7
0.8
0.9
1
1
2
Heterogeneity
| , (( ) ' ( ))
(monotone); ( , )
1-
( ) x g g x x
g
H R
θ µ µ
θ µ
λ −− Σ −
= Σ
=
≈
H=0.06g
O’Sullivan, Roy, Eary et al (2003,2005,2009)

HeterogeneityMeasurements
H=0.02 H=0.06
H=0.26 H=0.34

Heterogeneity
and
Patient Outcome
PredictorVariable (X)
Scale %Change in Risk(unitchange in X)
95%C.I.
P-value
AGE(years)
16.8 34 (-12,101) 0.150
SUV(max)(ml/gm)
6.14 -38 (-60,-29) 0.037
Heterogeneity 7.4% 87 (35,160) 0.0002

Roose, Chapman and Maini, SIAM Review, 2008.Cristini, Gatenby, Sutherland, Casciari, Rasey, Krohn 1986...2010
Necrosis
NecroticCenter

Tumor Synthesis (Growth Pattern)
Transverse Sagittal
Coronal
1 2 3 1 2 3
1 2 3
1 2 3
, , ) ( , , )( , , )
Uptake Model
, , )( )
Co-ordinate TransformationsPrincipal Axes : ( Flexible Cyclinder : ( , , )
( ) ( , , ) (h hh
x x x z z zz z z h r
rx x x h r gσ
θ
λ λ θ α τθ
→→
= ≈ +
Sarcoma
Bladder
PhaseInformation


Chemotherapy Response
MODEL:
PRE POST
GLM-Test:ˆ
ˆRESPONSE
β
βσ
=
Pre
) PRE quasi-Poisson( )POST quasi-Poisson(eβ
µµ
::
Co-
Reg
istra
tion
MarginMargin
Post
CorrelationAdjusted!

Dynamic PET Studies: Scans after Tracer Input

Quantitative Data Analysis:Separate Delivery and Retention
0( )( () ) ( )T B P
tPC t V Ct s sC dR t s= −∆ + −∆− ⋅∫
Residue
AIF
•Parametric (compartmental)
•Non-Parametric (non-compartmental)O’Sullivan et al. JASA (2009)
•Directly Sampled
•Image Extracted (Statistically Guided)O’Sullivan et al. IEEE-TMI (2010)
Data

Quantitative Analysis of Dynamic PET Data
BLOOD
FDG
TISSUE
FDG FDG-6-P
0.0
0.2
0.4
0.6
0.8
1.0
0 30 60 90 120Time (minutes)
Cp FLT Cp metArterial Input (AIF)
0.00
0.01
0.02
0.03
0.04
0.05
0.06
0 30 60 90 120
Time (minutes)
Tumor BrainTissue Data
Residue(Impulse Response)
0( )( () ) ( )T B P
tPC t V Ct s sC dRt s= −∆ + −∆− ⋅∫
Flux Flow
VD Extraction
Functionals

Nonparametric Residue Analysis
0
0( ) (( )
1
extraction
)
( ) (Survival Function)
is the residence density for tracer label is flow, is blood volume an
(
d
)
( )t
P Pt
T B
B
C t V t s ds
V
C C
t d
hK
R
hR
t s
γ
γ
τ τ
= −∆ + −∆
= −
− ⋅
∫
∫
Meier and Zierler (1954), Bassingthwaighte (1971), Ostergaard et al. (1996)
Estimation based a cross-validated regularization procedure involving Positivity/Monotonicity and Smoothness Constraints.

1 2
1 1 2 2
1 2
1 1 2 2 3
( ) ( ) ( ) .... ( )
( ) ....
( ) ( ) ( ) .... ( )
p
B p p
C p
M p
h B B B
h e e e
h h h h
λ τλ τ λ τ
τ φ τ φ τ φ τ
τ α α α
τ π τ π τ π τ
−− −
≈ + + +
≈ + + +
≈ + + +
B - splines
C om partm ental
M ixtures
Numerical Approximations for Residence
Mendelsohn and Rice (1984); Cunningham and Jones(1993) , O’Sullivan et al (2009)

Most Widely Used Compartmental Model for PET
BLOOD
FDG
K1
k2
TISSUE
FDG FDG-6-PO4 k4
k3
1 2
1 1 2 2
1 2
1 1 2 2 3
( ) ( ) ( ) .... ( )
( ) ....
( ) ( ) ( ) .... ( )
p
B p p
C p
M p
h B B B
h e e e
h h h h
λ τλ τ λ τ
τ φ τ φ τ φ τ
τ α α α
τ π τ π τ π τ
−− −
≈ + + +
≈ + + +
≈ + + +
B - splines
C om partm ental
M ixturesMay be reasonable in-vitro, but for in-vivo PET ROI data???
Implies a Residence Density of the form:

PET FDG Data from Normal Brain ROIs
Nonparametric and Compartmental Analysis[ A formal statistical test rejects the compartmental model, p-value=0.046 ]
Cerebellum ROI
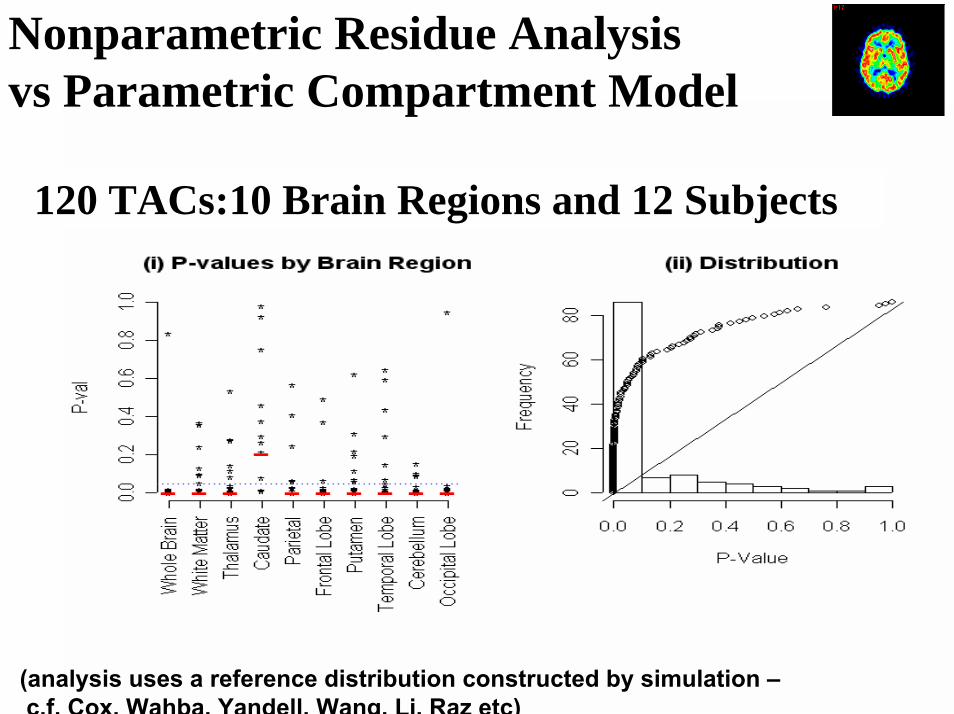
Nonparametric Residue Analysisvs Parametric Compartment Model
120 TACs:10 Brain Regions and 12 Subjects
(analysis uses a reference distribution constructed by simulation –c.f. Cox, Wahba, Yandell, Wang, Li, Raz etc)
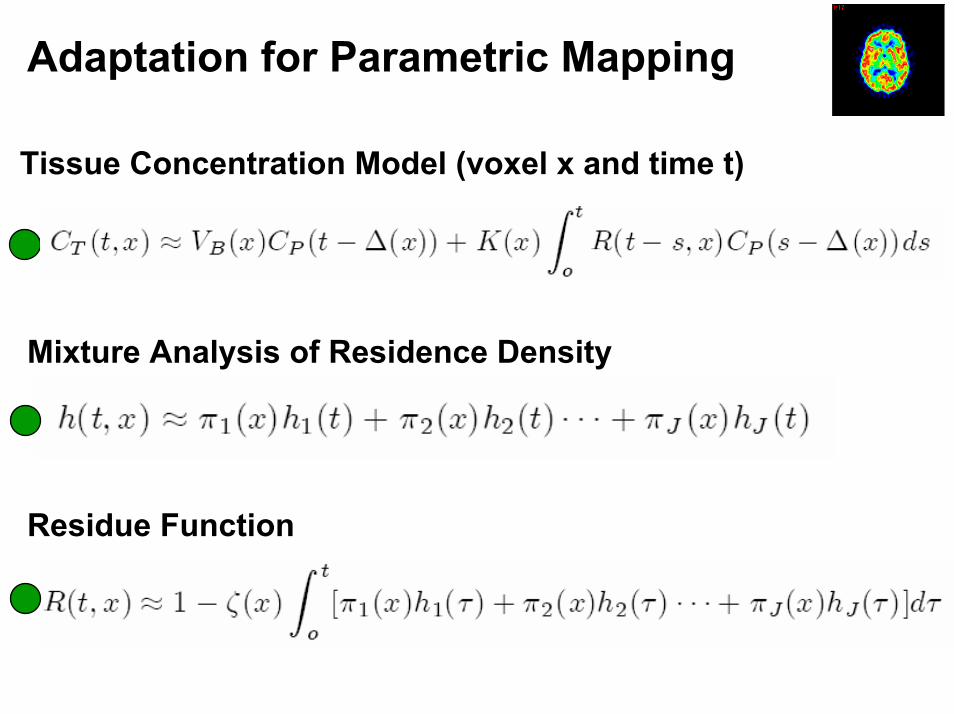
Adaptation for Parametric Mapping
Tissue Concentration Model (voxel x and time t)
Mixture Analysis of Residence Density
Residue Function

Residue Analysis of Segment Time Course Patterns
A
Residence
Residence
Time-Course
Time-Course
B

RMSData
ResidualPCA
RMSResidual
Temporal
Spatial
Diagnostic Assessment:
Voxel-Level Residuals

ml/gm
l/g
ml/g
/min
K VD VP
ml/1
0g/m
in
min
Flux MTT Ext0.0
0.0 0.0 0.0
0.00.0
0.5
0.52.0
0.60.3
0.5

Thym
idin
eVe
rapa
mil
mL
/g/m
in
0.0
Wat
er0.025
0.0
0.20
Uptake
Uptake
Uptake
mL
/g
0.0
2.21
mL
/g/m
in
0.0
0.37
2.60
K
K
K
mL
/g/m
inm
L/g
/min
mL
/g
0.0
0.13
VP
VD
Flux

Variance of Residues
(Greenwood’s Formula)
Approximation:
Flow AIFMean
-> Variation in Functionals by the Delta-Method

RegionalVoxel-LevelResidues andFlow Distribution
StandardizedVoxel-LevelResidues(Measured)

Some Analysis
Poisson with mean
Asymptotic Variance of MLEs

Summary
• PET in Cancer Imaging Diagnosis/StagingResponse AssessmentTreatment Planning
• Spatial and Temporal Aspects of PET Data Important
• Detailed Measurement and Modeling of the Disease Process is key to adaptive treatment
Statistics (Wisconsin style) has much to offer.(Please keep it going for another 50… at least!)