District of Sault Ste. MarieOur Children, Their Future
2013 Best Start Network Report, Volume 2

This report was created for the Best Start Network with the help of the Sault Ste. Marie Innovation Centre’s Community Geomatics Centre and the District of Sault Ste. Marie Social Services
Administration Board. The data in this report was compiled and the report was co-authored by Steve Zuppa, Kristen Hoffman, Miranda Moffatt, Danika Montgomery and Angela Piaskoski, with the help of
the District of Sault Ste. Marie Best Start Network.
This report was made possible through the generous support of the District of Sault Ste. Marie Social Services Administration Board
Thank you to our community parents and early learning programs for providing the photos in this report.
A digital version of this report can be found online. Go to www.ssm-dssab.ca and select the Child Care tab.
The Algoma Best Start Network has also released a report in tandem.


We would like to thank all of those who made this report possible:
Algoma Family Services
Algoma Public Health
Algoma District School Board
Canadian Red Cross
Children’s Aid Society of Algoma
Children’s Rehabilitation Centre-Algoma
Community Assistance Trust
Conseil scolaire catholique du Nouvel-Ontario
Conseil scolaire public du Grand Nord de l’Ontario
District of Sault Ste. Marie Social Services Administration Board
Group Health Centre
Huron-Superior Catholic District School Board
Metis Nation of Ontario
Ministry of Children and Youth Services
Ministry of Education
North East Mental Health Centre
Offord Centre for Child Studies
Child Care Algoma Ontario Early Years/Best Start Hubs
Parent Advisory Committee
Phoenix Rising Non-Profit Homes and Women’s Centre Inc.
Prince Township Best Start Hub
Salvation Army Community & Family Services
Sault Ste. Marie Child Care Supervisors Committee
Sault Ste. Marie Innovation Centre – Community Geomatics Centre
Sault Ste. Marie Police Service
Soup Kitchen Community Centre
The Indian Friendship Centre/Best Start Hub
Vincent Place Food Services
Acknowledgements

Communities Growing, Children Thriving
Since 2011, the Sault Ste. Marie and the Algoma District Best Start Networks have strategically operated in partnership to achieve a single Best Start mission and vision. We want to ensure that across the whole of Algoma, “children and families have easy access to consistent, quality services that are welcoming, integrated and responsive.”
Joint planning enables our two networks to maximize collaboration for the benefit of all children and families in our geographic areas. We recognize that true system integration is an ongoing process whereby service providers and stakeholders engage in progressively greater degrees of joint service activity.
The Joint Network’s central goal is that all children born and growing up in the District of Sault Ste. Marie and the District of Algoma will achieve their social, intellectual, economic, physical and emotional potential through the provision of integrated children’s services. In recent years, the Joint Best Start Network has been instrumental in the community planning of integrated children’s services. Our table is comprised of representatives from many local children’s service sector organizations and we regularly consult with community parents across the area.
This is the second edition of a report that provides community information on some key areas that have a significant impact on how well our children are developing: family structure, child care, health, education, family support services and our physical environment.
By measuring these indicators in our community, we are given an opportunity to identify and plan for the development or enhancement of services that support improved outcomes for our children.
Our communities have much to celebrate with regard to successful relationship building and decreased fragmentation in service delivery between children’s service providers, as well as partnering that supports seamless access for parents. The Best Start Network remains committed to the vision of Best Start and the development of an integrated service system that improves the lives of our children, our families and our communities.
We look forward to the future knowing that our Network partners continue to demonstrate the passion and determination to achieve our Vision.
Carla Fairbrother Brenda Clarke Co-Chair Co-Chair District of Sault Ste. Marie District of Sault Ste. Marie Best Start Network Best Start Network
A Message from The Best Start Network

Best Start Introduction 3Community Overview 5 SSM Census Agglomeration Definition 5 Population Change Between 2001 – 2011 6 Number of Children Aged 0 to 6 6 Aboriginal Profile 8 Francophone Profile 8 Socioeconomic Risk 10Health and Physical Environment 13 Births 13 Teen Mothers 13 Healthy Babies Healthy Children 14 Infant & Child Development Program 14 Don’t Wait and See 14 Asthma 15 Obesity 16 Mental Health 16 Nutrition NutriSTEP® 17 Food Security 17 Canada Prenatal Nutrition Program 17 Community Kitchens 17 Community Gardens 18 Community Assistance Trust 18 The Student Nutrition Program 18 Lunch Programs, Soup Kitchens, Food Banks 18 Safety Childhood Injuries 19 Crime 20 Physical Environment Playgrounds within Walking Distance 21Education and Child Care 27 Child Care 27 Best Start Hubs 29 Parent and Family Literacy Centres 29 Early Development Instrument (EDI) 30 Physical Health and Well Being 32 Social Competence 35 Emotional Maturity 38 Language & Cognitive Development 41 Communication & General Knowledge 44 Low in One or More Domains 47 Low in Two or More Domains 48 Best for Kids Summer Program 49 The Kindergarten Parent Survey 50 KPS Respondents 50 KPS Children 54 Child Health & Development 55 Child Care 56 Parents, Children & Pre-Kindergarten Experiences 58 Shared Kindergarten Experiences 63 Community Safety & Safe Spaces 64 JK & SK Enrolment 65Child & Family 67 Percentage of Families with Children Under 6 67 Median Family Income 2008: All Families 69 Youth Living in Low Income 69 Families Receiving Social Assistance 71 Best Start Hubs 73 Services/Parent and Family Support/Parenting Programs 73 Best Start Hub Locations 74 Best Start Hubs Drop-In Visits 76 Best Start Hubs: Access to Transportation - Update 79 Prenatal Education 79 Parenting Programs 79 Parent and Family Literacy Centres 80 Algoma Preschool Speech and Language Services 80 Early Literacy 81 Triple P 82 Children’s Aid Society of Algoma 82Data Sources 85Ta
ble
of C
onte
nts
This report, commissioned by the Sault Ste. Marie Best Start Network to assist in community planning, outlines and measures the services supporting children and families in Sault Ste. Marie, with a focus on children age 0 to 6. It includes a collection of indicators that impact child development and our children’s ability to reach their full potential. By examining information across neighbourhoods in Sault Ste. Marie, we can determine where more attention is needed in terms of accessing services and programs. It is important to find out where children shine in Sault Ste. Marie, as well as where they may need more attention.
The Community Overview examines the population and age breakdown of Sault Ste. Marie, as well as Aboriginal and Francophone profiles. This demographic information gives us a better understanding of Sault Ste. Marie, the age and sex breakdown of the population, and where children are located. The Social Risk Index is also outlined in this section, providing a more in-depth look into the population of Sault Ste. Marie using socioeconomic risk indicators. This helps to determine which neighbourhoods are more prone to socioeconomic risk. A map showing the social risk index by Census Tract in Sault Ste. Marie can be viewed on page 11.
The Health and Physical Environment section is a general assessment of infant and child health and services, as well as nutrition, safety, mental health and physical activity. Information on the birth rate in Sault Ste. Marie, teen mothers, the Infant and Child Development Program and the Don’t Wait and See program can be found in this section. Nutrition programs are also outlined and include the new NutriSTEP® program, designed to assess the nutritional risk of preschoolers, the Milk Program (Canada Prenatal Nutrition Program), Community Kitchens and Gardens, Community Assistance Trust, the Energy Break Program, lunch programs, Soup Kitchens and Food Banks. Children’s safety is addressed as well, with statistics on childhood injuries and crime. More and more importance is being placed on the physical activity levels of children due to the rise in obesity rates in Canada. Playgrounds are an important source for the healthy physical and social development of children. Page 22 begins a study on the number of playgrounds within walking distance in Sault Ste. Marie and their general quality.
The Education and Child Care section reviews the cost and availability of child care in Sault Ste. Marie, subsidies, service gaps and funding changes. The Early Development Instrument (EDI) is a questionnaire that uses five domains (Physical
Health and Well-Being, Social Competence, Emotional Maturity, Language and Cognitive Development and Communication Skills and General Knowledge) to measure development and readiness to learn in kindergarteners. EDI results have been mapped for Sault Ste. Marie and can be found on pages 31 through 49. The Kindergarten Parent Survey (KPS) results have been included in this report and can be found on pages 51 to 65. JK and SK enrolment numbers for the Algoma District School Board and the Huron-Superior Catholic District School Board have been graphed and can be found on page 66.
The section titled Child & Family reports on family structure, with information on the percentage of families with children under 6, median family income, and youth living in low income. Best Start Hubs services, programs, and location information, and a study of visits and transportation to Best Start Hubs are outlined in this section. The Healthy Babies Healthy Children program focuses on a range of areas, including breast-feeding, nutrition and health, parenting and literacy programs to give children a healthy start in life. Prenatal education is designed to provide expectant mothers and their partners with information about all aspects of pregnancy and delivery to aid their transition to parenting. Information on parenting, including classes, Parent and Family Literacy Centres, the Speech and Language Preschool Development Program, Best Start Hubs and Triple P (Positive Parenting Program) can also be found in this section. Children’s Aid Society statistics are located at the end of the Family section on page 82.
Following each section is a summary detailing how the indicators have changed since the “Our Children, Their Future” report of 2011. By comparing this data from report-to-report, services can be modified and implemented to better serve all children in Sault Ste. Marie, giving them their best start towards a bright future.
Exec
utiv
e Su
mm
ary
2

3
Background
Best Start is a provincially funded strategy that promotes optimal child development by supporting parents and caregivers. Local planning tables, called Best Start Networks, decide how best to organize and integrate services to meet the needs of their own population. Network members recognize that the health, well-being, and capabilities of residents in any community are vital to its long term economic success. Children who reach their full potential in life lead to the long term success of the community. Parents and caregivers have the most profound impact on a child’s early years of development and their subsequent success with school, employment and their overall contribution to society. Best Start seeks to provide parents and children with the health, education, social supports, and specialized children’s services that are necessary to support healthy child development and early learning.
The goal of community planning continues to be that parents with children from prenatal to age 6 have accessible services and supports. A child’s best start in life takes place at home, in child care programs, classrooms, health facilities, libraries, recreation facilities or wherever we interact with our children. The Best Start Network is committed to ensuring that children with special needs are identified early on for service intervention and that children experience a successful transition to school. Parent participation is central to the planning process and input from parents is sought on a regular basis. The result will be children who are ready and eager to learn by the time they enter school.
The first phase of Best Start involved the expansion of licensed child care spaces. The focus of the next phase shifted to better service integration in the children’s sector. In his report, “With our Best Future in Mind”, Ontario’s Special Advisor on Early Learning, Dr. Charles Pascal, recommends building upon the successes of the Best Start strategy for a system of integrated children’s services1. Service integration promotes the best use of existing funding and resources through collaborative agency planning. It addresses duplications and gaps in services to parents and children and makes services accessible to parents.
“Integration is a key process through which the service system will realize the ten year vision of Best Start. Improving our ability to meet the needs of young children and their families
through the transformation of the service system is a goal of Best Start. Through integration, the system will be more capable of responding to current and future opportunities in a way that will most benefit children”2.
System integration is an ongoing process whereby service providers and stakeholders engage in progressively greater degrees of joint service activity. To facilitate planning that meets the needs of families, we recognized the benefits of combining the efforts of the Sault Ste. Marie and Algoma District Best Start Networks and have been meeting jointly since June 2011. As we move further along the continuum of system integration, the Joint Best Start Network continues to make improvements in developing a system of services that seamlessly supports families and children in their communities in the District of Algoma and District of Sault Ste. Marie.
The Joint Network is pleased to note the progress that has been made over the last few years in the area of Language and Cognitive Development. Children across Sault Ste. Marie and Algoma are well below the threshold for vulnerability on the EDI in this domain. We credit this in large part to the considerable focus that has been placed on Early Literacy. Community planning strategies and programs related to Early
Best Start Introduction
1. Pascal, Charles E. (2009). With Our Best Future in Mind, Implementing Early Learning in Ontario. Toronto: Queen’s Printer for Ontario.
2. Building on the Foundation - Moving Forward. Addendum to the Implementation Planning Guidelines for Best Start Networks – System Integration, November 2006, pg. 3
Best Start IntroductionLiteracy have been taking place for a number of years across Algoma and Sault Ste. Marie.
The Early Literacy Practitioners utilize the Pre-K Early Language and Literacy Classroom Observation (ELLCO) Tool to assess literacy-rich environments and experiences using best practice. The observations focus on indicators of quality including Structure, Curriculum, Language Environment, Books, Book Reading, Print and Early Writing.
Quarterly Early Literacy Newsletters are available and include early literacy information and resources for parents, caregivers and professionals.
For example, in Sault Ste. Marie, the Family Literacy Coalition, initially created in 2009, is an integrated network of partners and services who meet regularly, have developed terms of reference and are committed to helping to strengthen, support and promote language and literacy skills to families in our community.
Across the Algoma District a training strategy on best practice and early learning has been facilitated by the Early Learning and Care Resource Team for a number of years. This team provides ongoing resources, support and consistent messaging of the importance of curriculum development that incorporates language and literacy skills to children and families across the District.
The vision of the Network is “Communities Growing, Children Thriving”. The Network has been very successful in accessing special purpose funding to facilitate the development of the service integration plan. In 2011/2012, an Innovation Fund project enhanced the community Coordinated Access Referral Mechanism and provided training to service providers. In 2012/2013, consultations with parents and front-line service providers were conducted across the district. The consultations revealed many systems and processes that were working well and also revealed areas where there is still some work to be done to streamline, simplify and improve access to services. In 2013/2014 Community Integration Leaders funding will be used to create innovative solutions to simplify access to service for parents and also to simplify the communication loop once a referral is made within the system. Efforts are being made to offer parents online and virtual methods to access services while still maintaining the ability to offer personalized services to meet the needs of families. All of the current projects have one primary goal; to ensure that at any point a parent accesses the children’s service system, a responsive continuum of services is available to them and
that where necessary, a personal connection is made available to respond to complex queries and issues.The Joint Best Start Network is committed to ensuring its roles and responsibilities are fulfilled in helping the present day children in the community realize their full potential. It is understood that this is the best possible investment in the communities of tomorrow. To achieve this, the Joint network is committed to working with the government, and other partners to ensure the successful implementation of the vision of the Best Start Initiative.
4
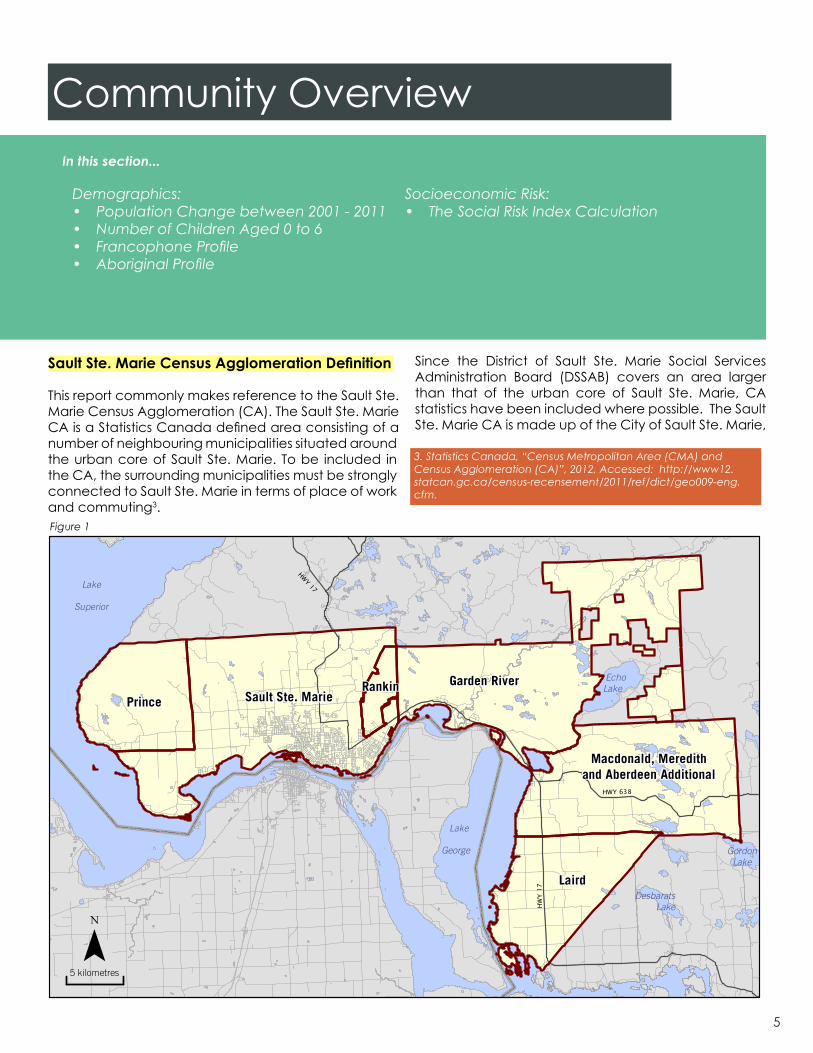
Figure 1
5
Sault Ste. Marie Census Agglomeration Definition
This report commonly makes reference to the Sault Ste. Marie Census Agglomeration (CA). The Sault Ste. Marie CA is a Statistics Canada defined area consisting of a number of neighbouring municipalities situated around the urban core of Sault Ste. Marie. To be included in the CA, the surrounding municipalities must be strongly connected to Sault Ste. Marie in terms of place of work and commuting3.
Since the District of Sault Ste. Marie Social Services Administration Board (DSSAB) covers an area larger than that of the urban core of Sault Ste. Marie, CA statistics have been included where possible. The Sault Ste. Marie CA is made up of the City of Sault Ste. Marie,
Community Overview
Lake
Superior
Lake
George
Laird
Sault Ste. MariePrince
Garden River
Macdonald, Meredithand Aberdeen Additional
Rankin EchoLake
GordonLake
Desbarats LakeHW
Y 17
HWY 17
HWY 638
¯5 kilometres
Demographics:• Population Change between 2001 - 2011• Number of Children Aged 0 to 6 • Francophone Profile• Aboriginal Profile
Socioeconomic Risk: • The Social Risk Index Calculation
In this section...
3. Statistics Canada, “Census Metropolitan Area (CMA) and Census Agglomeration (CA)”, 2012, Accessed: http://www12.statcan.gc.ca/census-recensement/2011/ref/dict/geo009-eng.cfm.

Prince Township, Rankin Location, Garden River, Macdonald, Meredith and Aberdeen Additional Township, and Laird Township.
It is important to note that the DSSAB territory also covers the area from the northern boundary of Sault Ste. Marie to Montreal River. This area includes unincorporated communities such as Goulais River and Searchmont. Statistics Canada groups this area into a large “Unorganized Area” comprised of all areas in the Algoma District that are not part of an incorporated municipality. Due to the lack of localized statistics, the population of the Sault North area has been omitted from this report.
The full geographic extent of the Sault Ste. Marie CA is shown in Figure 1.
Population Change Between 2001-2011
The City of Sault Ste. Marie and the surrounding areas that make up the Census Agglomeration had a population of 79,800* in 2011, an increase from 78,908* in 2001, but a slight decrease from 80,098 in 2006. Over the next five years, the population of this area is projected to grow by 0.2%4. The vast majority of people in this area reside in the City of Sault Ste. Marie, which had a population of 75,141 in 2011, 74,948 in 2006, and 74,566 in 2001.
The 2011 age-sex structure chart (Figure 2) shows a breakdown of the males and females by age group. Traditionally, charts of this shape signify a declining population5 as a large proportion of females age beyond the traditional fertility years of 15 to 44. These areas usually have a steady death rate, coupled with a low birth rate. Any growth in population is usually a result of immigration rather than natural increase.
The Sault Ste. Marie CA graph indicates an aging population, with a significant bulge in the 45 to 64 age groups, which represents the ‘baby-boom’ generation. The population of Sault Ste. Marie is older than the population of Ontario, as the median age of the population was 44.8 years in 2011 compared to 40.0 years for Ontario.
Overall, the youth population of Sault Ste. Marie has been in decline for a number of years. There are
proportionately fewer children and more seniors in the Sault Ste. Marie CA than the whole of Ontario. Within the CA in 2011 the proportion of older adults aged 65 and up (19.3%) exceeded the proportion of children aged 0 to 14 (14.4%) for the second straight census year.
Number of Children Aged 0 to 6
In addition to 5 year age groupings (see previous section) Statistics Canada also reports the number of persons by each individual year of age. The Sault Ste. Marie CA had 5,155 children aged 0 to 6 in 2011, up from 4,985 children aged 0 to 6 in 2006 but down from 5,515 in 2001. This represents a 6.5% decline in population in this age group from 2001 to 2011, but a 3.4% increase from 2006 to 2011 (Figure 3).
Figure 4 shows total population aged 0 to 6 by Census Tract (CT). Census Tracts (CTs) are small, stable geographic areas that usually have a total population of 2,500 to 8,000. The main map shows the urban area of the city, while the inset map shows all Census Tracts that make up the Census Agglomeration of
Community Overview
6
5 4 3 2 1 0 1 2 3 4 5
0-4
10-14
20-24
30-34
40-44
50-54
60-64
70-74
80-84
90-94
100+
P E R C E N T O F P O P U L A T I O N
AGE-SEX STRUCTURE COMPARISON (2001-2011)SAULT STE. MARIE CENSUS AGGLOMERATION (CA)
% MALE- 2011
% FEMALE- 2011
% MALE - 2001
% FEMALE 2001
SOURCE: STATISTICS CANADA
*It is important to note that the Rankin band council did not give permission to Statistics Canada in 2011 and 2001 to enter their territory for enumeration and therefore no population counts were recorded. Permission was granted in 2006 and population counts for Rankin are included in the totals for 2006.
Figure 2
4. Environics Analytics 2013 – available through PCensus 10 for ArcView (distributed by Tetrad Computer Applicaions) 5. Statistics Canada, “Population Pyramids”, 2011, Accessed: http://www.statcan.gc.ca/kits-trousses/animat/edu06a_0000-eng.htm.

7
Community OverviewSault Ste. Marie, including Prince, Garden River/Rankin, Macdonald, Meredith and Aberdeen Additional, and Laird.
The Census Tract with the greatest number of children aged 0 to 6 in 2011 was 0017.00 (the P-Patch) with 515, while the fewest reside in Prince Township (60 children aged 0 to 6).
0018.02
0009.00
0100.00
0018.01
0011.00
0008.00
0001.020017.00
0010.00
0015.00
0004.00
0016.000007.00
0003.00
0005.00
0013.000012.00
0001.010006.00
0014.00
0002.00
Second
Trunk
Pine
Black
Bay
Wellington
Great Northern
McNabb
Third
Wallace
Bruce
Base
Peoples
Huro
n
Korah
Lyons
Allen's Side
St. George's
Bennett
Gore
Chur
ch
Cathcart
Market
McNabb
SA
UL
T
ST
E.
M
AR
IE
RA
NK
IN
L
OC
AT
IO
N
15
D
Hwy 17
Hwy 638
¯1 Kilometre
10 Kilometres
Number of Children Aged 0 to 6By Census Tract (CT) 2011
60 to 125
126 to 175
176 to 250
251 to 325
326 to 515
Age GroupTotal Pop.
2001Total Pop.
2006Total Pop.
2011% Change 2001 - 2011
% Change 2006 - 2011
0 to 6 (all) 5,515 4,985 5,155 -6.5% 3.4%
7 to 12 (all) 6,285 5,315 4,635 -26.3% -12.8%
0 to 6 (females) 2,695 2,435 2,470 -8.3% 1.4%
7 to 12 (females) 2,350 2,585 2,270 -3.4% -12.2%
0 to 6 (males) 2,825 2,550 2,680 -5.1% 5.1%
7 to 12 (males) 3,260 2,720 2,360 -27.6% -13.2%
Figure 3
Figure 4

Community OverviewAboriginal Profile
In 2011, there were 8,070 Aboriginal people living in the Sault Ste. Marie CA, making up approximately 10.3% of the total population. In 2011, 4,840 persons identified as First Nations, accounting for over half (60%) of the Aboriginal population of the Sault Ste. Marie CA. Another 2,955 identified as Métis, accounting for a further 36.6% of the Aboriginal population. A small percentage (2%) reported multiple or other Aboriginal responses. Generally speaking, the Aboriginal population of the Sault Ste. Marie CA is younger than the non-Aboriginal population of the CA6. The median age of the Aboriginal population in the CA was 32.0 years in 2011, compared to 46.3 for all persons in the CA. In comparison, the median age of the Aboriginal population in Ontario was 31.2 years in 2011, compared to 40.2 for all persons in Ontario.
Nearly a quarter of all Aboriginal persons in Sault Ste. Marie were under the age of 15 in 2011, while only 6.2% were over the age of 65. Figure 5 shows the Aboriginal age breakdown.
Figure 6 indicates that there are proportionally more Aboriginal people in every age group in the Sault Ste. Marie CA than that of Ontario. Also the two age groups with the highest proportion of Aboriginal people in the Sault Ste. Marie CA in 2011 were the 0-4 and 5-9 age groups with 20.1% and 17.8% respectively. The proportion of Aboriginal people generally rises with youth in both the Sault Ste. Marie CA and Ontario. When examining the Ontario figures, please note that numeration was incomplete for some Aboriginal reserves and settlements in the 2011 Census for various reasons7.
Francophone Profile
According to the 2011 Census of Canada, the Francophone population in the Sault Ste. Marie CA totalled 2,640 persons, representing approximately 3.4% of the total population. In Ontario, the Francophone population totalled 584,500 persons, making up 4.6% of the entire population. For the purposes of this report, the Francophone population refers to the persons reporting French as their first official language spoken.
The Francophone Population age-sex structure chart (Figure 7) shows an aging population with a high number of seniors and older working age persons and a very low number of youth. In a report on Francophones
8
Starting in 2011, Aboriginal specific data became part of the National Household Survey rather than the long-form census. Due to this change, Aboriginal age data is no longer released in five year groupings and is not comparable to previous censuses. Also note that the following 2011 figures for the Sault Ste. Marie CA do not include data from Rankin Location. Please interpret this data with caution.
725675
565
660
480
1,230
1,045
1,360
830
380
125
0
500
1,000
1,500
ABORIGINAL POPULATION (2011)SAULT STE. MARIE CA
0%
5%
10%
15%
20%
25%
PERCENT ABORIGINAL BY AGE GROUP (2011)SAULT STE. MARIE CA AND ONTARIO
SSM Aboriginal Pop.
ON Aboriginal Pop.
Figure 5
Figure 6
6. France et al., 2009, pp. 7.7. Statistics Canada, “Census Data Notes: Incompletely enumerated Indian reserves and Indian settlements, Appendix 3”, Accessed: http://www12.statcan.gc.ca/census-recensement/2011/ref/irr-app-ann-1-eng.cfm.

9
Community Overviewin Ontario, Jean-Pierre Corbeil and Sylvie Lafrenière state: “[t]he change over time in the age structure of the Franco-Ontarian population reflects the aging of the population, and it results from the combined effect of a fertility rate below the replacement level and incomplete transmission of the French language from parents to children”8. These factors may help to explain the small numbers of Francophone youth in the Sault Ste. Marie CA.
The Percent Francophone by Age Group chart indicates there are proportionally less Francophone people in every age group in the Sault Ste. Marie CA than that of Ontario (Figure 8). Combining male and female populations, the two age groups with the highest proportion of Francophones in the CA in 2011 were the 70-74 and 75-79 age groups, both with 5.4%, while the three lowest were the 0-4, 5-9 and 10-14 cohorts with 0.9%, 1.4% and 1.5% respectively.
8. Jean-Pierre Corbeil and Sylvie Lafrenière, “Portrait of Official-Language Minorities in Canada: Francophones in Ontario”, Ottawa: Statistics Canada, Catalogue no. 89-642-X-001, pp. 80.
200 150 100 50 0 50 100 150 200
0-4
10-14
20-24
30-34
40-44
50-54
60-64
70-74
80+
P O P U L A T I O N C O U N T
FRANCOPHONE POPULATION BY AGE & SEX (2011)SAULT STE. MARIE CA
MALE FEMALE
SOURCE: STATISTICS CANADA
8 6 4 2 0 2 4 6 8
0-4
10-14
20-24
30-34
40-44
50-54
60-64
70-74
80+
P E R C E N T O F P O P U L A T I O N
FRANCOPHONE AGE-SEX STRUCTURE COMPARISON (2011)SAULT STE. MARIE CA AND ONTARIO
% MALE- SSM
% FEMALE- SSM
% MALE - ON
% FEMALE - ON
SOURCE: STATISTICS CANADA
Figure 7
Figure 8

Community OverviewSocioeconomic Risk: The Social Risk Index Calculation
The Social Risk Index is a measure of socioeconomic risk in communities and neighbourhoods and is derived from census data from Statistics Canada. The Social Risk Index used in this report is based on 2006 Census data, rather than the newer 2011 National Household Survey (NHS) data. This is for reasons of data reliability; as the change in collection methodology from the mandatory long-form census of 2006 to the voluntary NHS in 2011 has introduced a potential non-response bias in local results of Sault Ste. Marie.
The index measures nine critical risk indicators and compares the results of each against the provincial average. If the neighbourhood is worse than the provincial average in a certain indicator, that variable is given a score of 1. Adding up the scores for each indicator will result in a neighbourhood score of 0-9, where 0 indicates the lowest degree of socioeconomic risk and a score of 9 indicates the highest degree of socioeconomic risk. (Please note that local neighbourhoods could also be compared to the national average which may result is slightly different final scores). Results are generally classified by four established categories of risk:• 0 to 2 - Low Risk• 3 to 4 - Somewhat Low Risk• 5 to 6 - Somewhat High Risk• 7 to 9 - High Risk
The nine indicators used in the index are: lone-parent families, low income, knowledge of an official language, immigration, tenancy, residential mobility, unemployment, education and government income transfers. Results for the Sault Ste. Marie CA, the District
of Algoma, and Ontario are shown in the table below. Results for Sault Ste. Marie and Algoma that are higher than the Ontario value are shown in red.
Figure 9 shows that Sault Ste. Marie and Algoma both have a social risk index score of 4 and are considered to be at somewhat low socioeconomic risk. Sault Ste. Marie has a higher percentage of lone parent families, rented dwellings, and income from government transfers, as well as a higher unemployment rate than Ontario. The only indicators that are significantly lower than the provincial average are the percentage of persons not speaking an official language and recent immigrants, confirming that fewer recent immigrants have chosen to reside in Sault Ste. Marie and the Algoma District than other parts of Ontario.
For a more in depth look at the city, socioeconomic risk scores have been calculated by Census Tract (CT) and colour coded based on the four categories of risk. Due to insufficient data, scores for Tracts 5900100.00 (Garden River and Rankin Reserves) and 5900101.00 (Macdonald, Meredith and Aberdeen Additional and Laird) could not be calculated.
The resulting map (Figure 10) shows that the Social Risk Index scores of Sault Ste. Marie CTs vary considerably.* Findings can be summarized as follows: • Five CTs were deemed to be ‘High Risk’, each with
a social risk index score of 7. The majority of high risk CTs are located at or near the central core of the city. Combined, these Tracts had an approximate population of 850 children under the age of 6 in 2011. This is down from 890 in 2006 and 940 in 2001.
• Six CTs scored as ‘Somewhat High Risk’, and had a combined population of approximately 1,810 children aged 0 to 6 in 2011. This is up from 1,680 in 2006, but down from 1,880 in 2001.
10
Indicators (Census 2006)Sault Ste. Marie CA
Algoma District Ontario
Lone Parent Families (%) 18.2% 16.3% 15.8%
Families with Low Income (%) 10.1% 9.6% 11.7%
Not Speaking an Official Language (%) 0.5% 0.4% 2.2%
Recent Immigrants (%) 0.2% 0.2% 4.8%
Rented Dwellings (%) 29.6% 28.0% 28.8%
Who Moved in the Past Year (%) 12.6% 12.2% 13.4%
Adult Unemployment Rate 8.1% 8.9% 6.4%
Adults with Less than High School Education (%) 13.6% 16.3% 13.6%
Income from Government Transfers (%) 12.9% 14.6% 8.8%
Social Risk Index 4 4 -
Figure 9

11
Community Overview
• Four CTs scored as ‘Somewhat Low Risk’, and had a combined population of approximately 860 children aged 0 to 6 in 2011. This is up from 855 in 2006, but down from 1,010 in 2001.
• Six CTs were deemed to be ‘Low Risk’, each with index scores ranging from 0 to 2. The majority of low risk CTs are located in the east end to Dacey Road and the more rural areas of Sault Ste. Marie and Prince Township. Combined, these Tracts had an approximate population of 1,265 children aged 0 to 6 in 2011. This is up from 1,230 in 2006, but down from 1,445 in 2001.
5900018.02
5900009.00
5900100.00
5900018.01
5900011.00
5900008.00
5900001.02
5900017.00
5900010.00
5900015.00
5900004.00
5900016.005900007.00
5900003.00
5900005.00
5900013.005900012.00
5900001.01
5900006.00
5900014.00
5900002.00
Second
Trunk
Black
Pine
Bay
McNabb
Wellington
Great Northern
Third
Wallace
Pim
Bruce
Base
Peoples
Korah
St. George's
Allen's Side
Chur
ch
Huro
n
Cathcart
Pim
SA
UL
T
ST
E.
M
AR
IE
RA
NK
IN
L
OC
AT
IO
N
15
D
¯
Social Risk IndexBy Census Tract (CT) 2006
Low Risk (0-2)
Somewhat Low Risk (3-4)
Somewhat High Risk (5-6)
High Risk (7-9)
Insufficient Data
1 Kilometre
10 Kilometres
* Please note that further variations may exist within each CT, however a smaller geographic analysis by Census Dissemination Area (DA) may contain unreliable data due to low population counts and random rounding of values.
Figure 10

Community OverviewWhere have we gone since the last report?
The Community Overview section of the last Best Start Network report focussed on census data from 2006, this report uses census data from 2011. The following notes compare the difference between 2006 and 2011.Population The overall population of the Sault Ste. Marie CA remained relatively the same
between 2006 and 2011. • Please note that the SSM CA area includes Rankin Reserve which did
not participate in the 2011 census. Had the reserve participated, the population statistics of the SSM CA would have likely shown a slight increase from 2006.
■Population by Age
The population of the SSM CA is aging faster than the province. Seniors (age 65+) outnumber children (age 0 to 14) in the SSM CA. In 2011 19.3% of the population of SSM were seniors; up from 18% in 2006. In 2011 14.4% of the population of SSM were children; down from 15.5% in 2006. ▼
Child Population The population of children aged 0 to 6 has increased. There were 5,155 children aged 0 to 6 in 2011; up from 4,985 in 2006. ▲
Aboriginal Population
Statistics Canada changed from a long-form census in 2006 to a voluntary National Household Survey (NHS) in 2011. Counts for Aboriginal persons could not be compared between 2006 and 2011.
N/AFrancophone Population
Counts for Francophone persons could not be compared between 2006 and 2011. N/A
Social Risk Index The majority of indictors from the Social Risk Index were affected by the change from the long-form census to the NHS. It was determined that the 2006 SRI would not be used in this report due to data quality concerns.
N/AHigh Risk Neighbourhoods
Less children aged 0 to 6 lived in traditionally high-risk neighbourhoods in 2011 than in 2006. ▼
Low Risk Neighbourhoods
More children aged 0 to 6 lived in traditionally low-risk neighbourhoods in 2011 than in 2006. ▲
▲ Favourable Increase ▼ Favourable Decrease
▲ Unfavourable Increase ▼ Unfavourable Decrease
■ No Change N/A Change cannot be measured
12

13
Health
Births
The number of births per year in a municipality is an important measure that can help to predict the number of children to plan for in the community. This helps education, health and childrens’ services to be prepared for the number of clients they will receive in upcoming years. The number of births in the Sault Ste. Marie CA decreased in 2009 to 717, and then increased each year up to 2012 with 778. The number of low birth weight babies fluctuated between 40 and 60 from 2008 to 2012 (Figure 11). Looking back at the past 3 years, 8% of births in 2010 were considered low birth weight, dropping to 5.2% in 2011 and then rising again to 7.4% in 2012. In the past, the Sault Ste. Marie CA had a consistently lower crude birth rate than Ontario each year, likely because the percentage of the population represented by women in their child bearing years (15 to 49 years of age) was lower in Sault Ste. Marie CA than in Ontario. More recently, the difference between crude birth rates in the Sault Ste. Marie CA and Ontario has decreased to a difference of only 0.1 in 2012 (Figure 12).
Teen Mothers
Teen mothers include women between the ages of 15 and 19 who have given birth to a live baby that year. There is a higher risk of “social exclusion, poverty, dropping out of school and food insecurity” in young mothers9. Figure 13 shows the births to teen mothers as a percentage of total births for 2008 to 2012. The percentage of births to teen mothers in Sault Ste. Marie CA decreased in 2009 to 7% and then remained steady before increasing to 10% in 2012. In contrast, the percentage of births to teen mothers in Ontario has been relatively static at 3-4% over the 5 years studied.
Health and Physical Environment
Health:• Births• Teen Mothers• Well-Baby Visits• Infant & Child Development
Program• Don’t Wait and See• Asthma• Obesity
Nutrition:• NutriSTEP®• Food Security• Canada Prenatal Nutrition
Program• Community Kitchens• Community Gardens• Community Assistance Trust• The Student Nutrition Program• Lunch Programs, Soup
Kitchens, Food Banks
• Mental HealthSafety:• Childhood Injuries• Crime• Car Seat SafetyPhysical Environment:• Walking Distance to
Playgrounds
In this section...
9. Sexual and Prenatal Health in Algoma Report, Algoma Public Health, March 2010.
0
2
4
6
8
10
12
2008 2009 2010 2011 2012
Live
birt
hs p
er 1
,000
City of SSM and Ontario Crude Birth Rates, 2008 - 2012
Sault Ste. Marie Birth Rate
Ontario Birth Rate
Total: 755 Total: 717 Total: 748 Total: 768 Total: 778
0
100
200
300
400
500
600
700
800
900
2008 2009 2010 2011 2012
Num
ber
of L
ive
Birth
s
Live Births in SSM Agglomerate by Birth Weight Groups 2008 - 2012
Low Birth Weight (2499 grams or less) Normal Birth Weight (2500 - 4499 grams)High Birth Weight (4500+ grams)
Figure 11
Figure 12
Note: Crude birth rate calculation based on Statistics Canada population estimates for each year.

Healthy Babies Healthy Children
Healthy Babies Healthy Children (HBHC) is a voluntary program which provides families with home visits by public health nurses and family support workers. On Feb 25, 2013 the HBHC program was revised. The goals of this revision include:• streamlining the screening process to eliminate the
need for multiple contacts before service is started and helping families quickly access targeted services
• strengthening the HBHC program through education and training to support blended home visiting
• improving program efficiency with a common screen that is introduced prenatally, postpartum and in early childhood
• improving the effectiveness by providing validated tools to support identification and service delivery to vulnerable families.
The HBHC program continues to offer support and information regarding pregnancy and parenting, healthy child development, as well as healthy parent child interactions. Program staff also link families to community programs and services such as parenting and prenatal classes, mental health and addiction support, the Canada Prenatal Nutrition Program, Infant & Child Development Program, speech and language programs, oral health services and nurse practitioners.
Infant & Child Development Program
The Algoma Public Health Infant and Child Development Program offers services to parents with children from birth to six years of age who are either experiencing developmental delay or are at risk for delayed
development. Reasons for referral include premature birth, prenatal drug and/or alcohol exposure, Autism Spectrum Disorders, and developmental delays of unknown origin.
A continuum of client centred services are offered including parent support and education in both one-on-one and in group formats, developmental screening and assessment, direct and parent mediated intervention, and case management.
Figure 14 shows the number of clients receiving services from 2010 to 2013. Anyone can refer a child with permission of the parent or caregiver by calling the Parent Child Information Line at (705)541-7101.
Don’t Wait and See
Across Algoma, professionals who work with young children are asking parents “not to wait and see” if they suspect their child is not developing as expected. “Don’t Wait and See” is the theme for a campaign sponsored by the Sault Ste. Marie Best Start Network and the Algoma District Best Start Network.
The purpose is to raise awareness about the importance of screening and early intervention to help children who may be experiencing delays in reaching some important milestones.
Accessing services early when your child is a toddler or preschooler can make all the difference.
According to a Parent Child Advisor from the Infant and Child Development Program, it is very rewarding to hear parents say, “I am feeling more confident about putting my child in school” or “I was so excited to see my child having fun playing with other kids.”
Health and Physical Environment
14
401436
540
0
100
200
300
400
500
600
2010/2011 2011/2012 2012/2013
Num
ber
of C
lient
s
Infant and Child Development ProgramSault Ste. Marie Clients Receiving Services
3.8% 3.6% 3.5%3.2% 3.0%
9.1%
7.4% 7.6% 7.7%
10.4%
0%
2%
4%
6%
8%
10%
2008 2009 2010 2011 2012
Perc
ent o
f Tot
al B
irths
Births to Teen Mothers as a % of Total Births, 2008 - 2012, Sault Ste. Marie CA and Ontario
Ontario Sault Ste. Marie
Figure 13
Figure 14

Parents are encouraged to ask themselves if their 18 month old child can:• Say 20 words or more?• Point to show you something they are interested in?• Look at books and show you something?
Parents who answer “no” to any of these skills or who have questions about their child’s development should call the Parent Child Information Line at (705)541-7101 or 1-888-537-5741. Eighteen months is a milestone in a child’s development and a visit to a family physician or other health care provider is important at this time.
Families and health care providers can also visit www.18monthvisit.ca.
Asthma
Asthma is a “chronic inflammatory disease of the airways” that often begins in childhood but can be diagnosed at any age”10. Figure 15 shows age- and sex-adjusted incidence rates of asthma for Algoma Public Health, from 2004/05 to 2006/07. The highest asthma rates are for the 0 to 4 age group, which has slightly declined over the three years illustrated. The second highest rates are in the 5 to 9 age group which has slightly increased over the three years.
When compared with the provincial rates, asthma incidence rates were consistently lower in the 0 to 4 and 5 to 9 age groups in Algoma (Figure 16). According to the Asthma Society of Canada, “urbanization appears to be correlated with an increase in asthma”11. The population density for the Algoma Census Division (CD) is 2.4 persons per square kilometre, ranking 21st for population in Ontario and 44th out of 49 CDs for
0
5
10
15
20
25
30
35
40
45
50
0-4 5-9
Rate
per
1,0
00
Age Group
Age- and Sex-Adjusted Asthma Incidence Rates for Algoma Public Health, 2004/05 - 2006/07
2004/2005
2005/2006
2006/2007
0
5
10
15
20
25
30
35
40
45
0-4 5-9 0-4 5-9 0-4 5-9
Rate
per
1,0
00
2004/05 2005/06 2006/07Age/Year
Age- and Sex-Adjusted Asthma Incidence Rates
Ontario
Algoma
Figure 16
Health and Physical Environment
15
Figure 15
10. “Asthma Facts & Statistics.” Asthma Society of Canada. April 2005. Accessed February 2, 2011.11. “Asthma Facts & Statistics.”

population density12. This low population density may explain why Algoma’s asthma rates are lower than the provincial average.
Obesity
In January 2012, the Ontario Government set an ambitious goal to reduce childhood obesity by 20% over 5 years. In March of 2013, the Ministry of Health and Long Term Care released the Healthy Kids Panel report “No Time to Wait: The Healthy Kids Strategy” which provides a comprehensive 3-pronged strategy with 23 recommendations to address childhood overweight and obesity:• Strategy One: Start All Kids on the Path to Health • Strategy Two: Change the Food Environment• Strategy Three: Create Healthy Communities Algoma Public Health is involved in provincial consultations around how public health can participate in moving these recommendations forward.
Mental Health
The Ministry of Children and Youth Services states that “approximately one in five children and youth in Ontario have a mental health challenge. Mental health issues often begin at a young age — about 70 per cent of mental health challenges have their onset in childhood and adolescence. Early identification and intervention leads to improved school achievement and better health outcomes”13.
In Sault Ste. Marie and the Algoma District, Algoma Family Services (AFS) provides a range of voluntary Mental Health, Addictions and Family Violence Treatment Services for children and youth ages 0 to 18 years, and their families. The most common presenting problems for children and AFS youth in Sault Ste. Marie and Algoma are:• Aggressive Behaviour• Attention or Concentration• Anxiety• Withdrawn/Depressed
The top 3 diagnosis for children and youth mental health issues for Sault Ste. Marie and Algoma are Anxiety Disorders, Attention Deficit and Disruptive Behaviour Disorders (Figure 17).
In addition to already registered clients receiving services, AFS received more than 2,500 new referrals for individual services in 2012-2013. Approximately 70% of referrals are from Sault Ste. Marie and 30% from Central, East and North Algoma. Figure 18 reflects the age breakdown of new referrals for 2012-2013 in Sault Ste. Marie and Algoma.
More than 1,600 children and youth were served in the fiscal year of 2012-2013. The breakdown by age group for Sault Ste. Marie and Algoma is provided in Figure 19.
Health and Physical Environment
16
70
265364
202
561
826
0
200
400
600
800
1000
0 to 6 7 to 11 12 to 18Age Group
Number of New Referrals (Service Requests) 2012/13
Algoma SSM
Figure 18
34%
28%
13%
25%
Top 3 Diagnosis for Children and Youth 2012/13
Anxiety Disorders
Attention Deficit
Disruptive BehaviourDisorders
Various Others
12. Statistics Canada: Population and dwelling counts, for Canada, provinces and territories, and census divisions, 2006 and 2001 censuses - 100% data 13. “Mental Health Services.” Ministry of Children and Youth Services. October 2011. Accessed February 13, 2014.
Figure 17
Nutrition
NutriSTEP®
Children’s food choices directly affect their growth, development and academic performance. Eating habits are established at an early age and young children are especially vulnerable to poor nutrition. Algoma Public Health is implementing the provincial NutriSTEP program (www.nutristep.ca). Toddler NutriSTEP and Preschooler NutriSTEP are questionnaires used with parents to assess eating habits and identify nutrition problems in children. These screening tools address children’s food and nutrient intake, physical growth, development and physical capabilities, physical activity, food security and the feeding environment. Once the screening tool is completed, a score will show if the child is identified at low, moderate or high risk of nutrition concerns. Approximately 10-20% of the population of young children aged 18 months to 5 years will be identified as high nutritional risk. Parents are provided with educational material and information on how to access additional supports and community referrals.
Food Security
Eating a nutritious diet is important to help ensure optimal growth and development and to help prevent some chronic diseases. Algoma Public Health conducts an annual nutritious food basket costing in grocery stores across Algoma every May to prepare “The Cost of Eating Well in Algoma” report. These costs are based on a healthy diet including a variety of foods from Canada’s Food Guide. Money for food must be balanced with other household expenses, such as rent or mortgage payments, utilities, transportation,
along with many other expenses. Measuring the cost of nutritious food is one step in drawing attention to the need to ensure that people have incomes that allow them to buy nutritious food. The 2013, Nutritious Food Basket weekly cost for a family of four is $194.12, and the monthly cost would be $840.00. This has increased over 11% since 2010 which can make it difficult for people with a limited income to afford a nutritious diet for themselves and their families.
Canada Prenatal Nutrition ProgramAKA “The Milk Program”
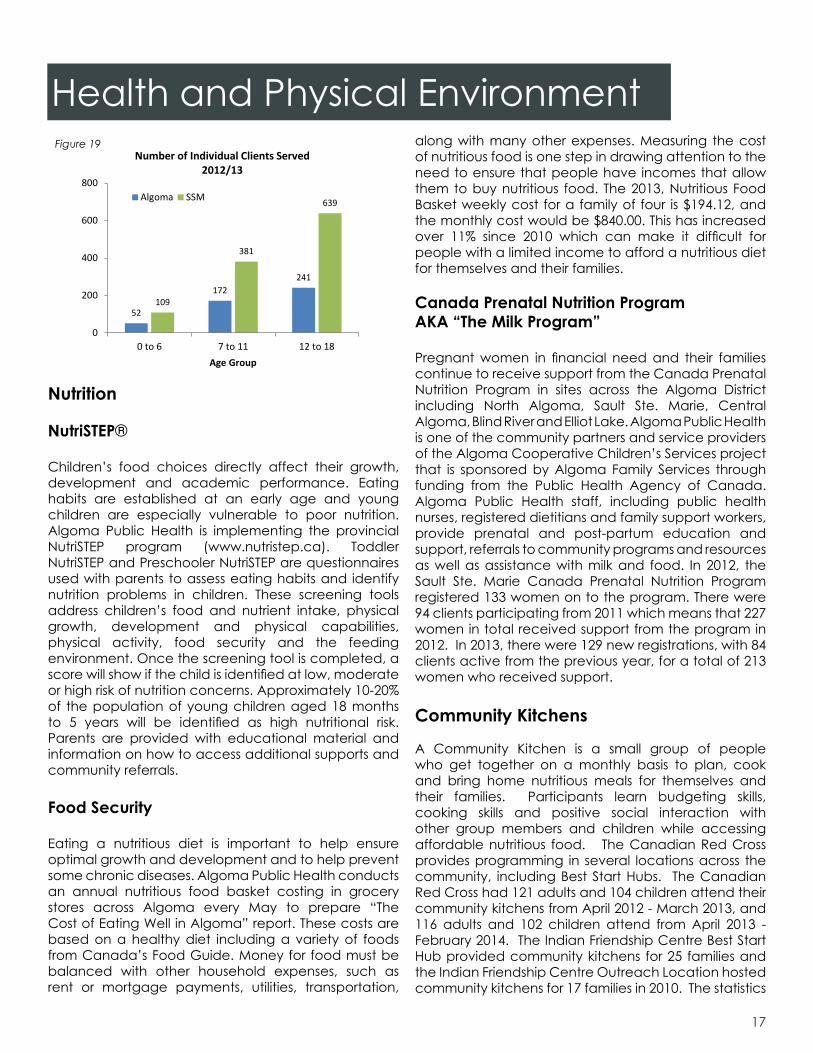
Pregnant women in financial need and their families continue to receive support from the Canada Prenatal Nutrition Program in sites across the Algoma District including North Algoma, Sault Ste. Marie, Central Algoma, Blind River and Elliot Lake. Algoma Public Health is one of the community partners and service providers of the Algoma Cooperative Children’s Services project that is sponsored by Algoma Family Services through funding from the Public Health Agency of Canada. Algoma Public Health staff, including public health nurses, registered dietitians and family support workers, provide prenatal and post-partum education and support, referrals to community programs and resources as well as assistance with milk and food. In 2012, the Sault Ste. Marie Canada Prenatal Nutrition Program registered 133 women on to the program. There were 94 clients participating from 2011 which means that 227 women in total received support from the program in 2012. In 2013, there were 129 new registrations, with 84 clients active from the previous year, for a total of 213 women who received support.
Community Kitchens
A Community Kitchen is a small group of people who get together on a monthly basis to plan, cook and bring home nutritious meals for themselves and their families. Participants learn budgeting skills, cooking skills and positive social interaction with other group members and children while accessing affordable nutritious food. The Canadian Red Cross provides programming in several locations across the community, including Best Start Hubs. The Canadian Red Cross had 121 adults and 104 children attend their community kitchens from April 2012 - March 2013, and 116 adults and 102 children attend from April 2013 - February 2014. The Indian Friendship Centre Best Start Hub provided community kitchens for 25 families and the Indian Friendship Centre Outreach Location hosted community kitchens for 17 families in 2010. The statistics
52
172241
109
381
639
0
200
400
600
800
0 to 6 7 to 11 12 to 18Age Group
Number of Individual Clients Served 2012/13
Algoma SSM
Figure 19
17
Health and Physical Environment

Figure 20
include all children, however, the agency indicates that most children attending the kitchens with their parents require child care and are within the 0 to 6 age group.
Community Gardens
The Allard Street Community Garden (ASCG), in partnership with the Canadian Red Cross, has been growing and prospering for the last 11 years. It now houses 65 raised garden beds which offer fresh organic produce to many members of the community. The ASCG has beds that are rented by individual families and organizations. Eight of the beds are financially supported by the Red Cross for partnering agencies (one belongs to the Red Cross for the Community Kitchen program). During the summer months, there is not only food growing at the ASCG, but also a great sense of comradery. The ASCG supports the community by donating to the Soup Kitchen, St. Vincent de Paul, Pauline’s Place and individual families in need.
Community Assistance Trust
Community Assistance Trust (CAT) is a volunteer committee of the United Way that assists the most vulnerable citizens with emergency funding to cover basic needs. Children’s items covered may include cribs, car seats, safety gates, mattresses, diapers and formula. All other sources of income for the recipient must be exhausted, making CAT the last resort for those in need. The following table (Figure 20) shows how much the Community Assistance Trust has helped people in Sault Ste. Marie.
The Student Nutrition Program
The Student Nutrition Program supports elementary and secondary schools across the City of Sault Ste. Marie by providing annual grants that support the purchase of nutritious foods for a breakfast, lunch, or snack program. By promoting healthy eating and providing
nutrition programs in school settings, students have the potential of achieving optimal health, growth and intellectual development14.
Since 2010/2011 over 700,000 meals have been served each year to students through the Student Nutrition Program, with 2010/2011 seeing the highest at 718,601 meals served (Figure 21).
Lunch Programs, Soup Kitchens, Food Banks
Lunch programs, Soup Kitchens and Food Banks do not track children 0 to 6 specifically, therefore, these numbers may include children from seven to 16 years of age as well. However, since nutrition is so crucial to a child’s development, it is important to note the number of programs that address food security in our community.
From 2010 to 2012, the following programs provided food to those in need:• Phoenix Rising Women’s Centre served meals to
1,319 women and children during 2011, and 1,211 in 2012; an increase from 888 meals served in 2010. In addition, snacks were given to 240 children in 2011, and 111 children in 2012
• The Soup Kitchen Community Centre served 690 meals to children in 2010, 568 meals in 2011 and 542 meals in 2012; and 18,332 meals to adults in 2010, 18,828 meals in 2011, and 19,530 meals in 2012
• Vincent Place Soup Kitchen provided 171 meals to children in 2011 and 198 in 2012, and 10,690 meals to adults in 2011 and 11,660 in 2012
• The Food Bank at Vincent Place Food Services provided children with food 945 times in 2010, 842 times in 2011 and 1,112 times in 2012, and adults 2,250 times in 2010, 3,263 times in 2011 and 3,669 times in 2012
• During 2012, the Salvation Army Community & Family Services provided food assistance to 1,204 children and teens.
18
Health and Physical Environment
2009/10 2010/11 2011/12 2012/13# of Schools Participating
69 69 72 69
# of Students Served
7,711 8,021 6,811 7,311
# of Meals Served
691,121 718,601 718,313 711,419
Figure 21
14. http://www.algomafamilyservices.org/index.php?g=3,24,63
Year # of Households
# of Adults
# of Children
Amount Assisted
2010 36 - 12 -
2011 30 42 33 $3,350.00
2012 121 134 101 $17,134.75
2013 103 127 85 $17,085.89

The Soup Kitchen Community Centre requires all children of school age to be in school during the school year, however parents are provided with items for the child’s lunch if needed. An Afterschool Program licensed for 30 children serves healthy snacks to about 17 to 22 students each day.
Safety
Childhood Injuries
In Canada, injuries are the leading cause of death in children. Many injuries can be prevented through safety precautions. For more information on how to prevent childhood injuries, visit www.safekidscanada.ca.
Figure 22 shows the number of Sault Ste. Marie resident child injuries (aged 0 to 6) for each year from 2008 to 2012 that were reported in an Ontario emergency room (i.e. Sault Area Hospital or another location). The totals fluctuate slightly from year to year, from a high of 767 in 2008, down to a low of 717 in 2009, then back up to 765, 726 and 758 in the following three years (2010 to 2012 consecutively). The average number of child injuries per year over these five years was 747 injuries.
Injuries can be broken down into a number of broad categories to help identify how children are being hurt in Sault Ste. Marie. Figure 23 shows emergency room visits for injuries to children age 0 to 6. The major groups of injuries included in the graph are:• Falls – including slips and stumbles, falls involving a chair, stairs, a bed, playground equipment and falls from one level to another
• Inanimate mechanical force injuries – including being struck by a projectile, or striking an object, being crushed or pinched, contact with sharp glass, a knife, tool or lawn mower, a firearm discharge or an explosion• Animate mechanical force injuries – including being hit, struck, kicked, bitten, twisted or scratched by another person. Also includes being bitten by an animal that is non-venomous or injured by a plant• Exposure to smoke, fire, heat, hot substances – including burns from fire or melting objects, contact with hot food/drink, tap water, steam, hot appliances, and metals• Accidental poisonings by and exposure to noxious substances – including ingestion of drugs or exposure to solvents, gasses, vapours, or pesticides.
Statistics on other injuries exist as well, however, due to small counts they were omitted from the graph.
Falls was consistently the category with the highest number of emergency room visits for each year graphed. Falls made up between 42.4% (2008) and 48.5% (2012) of all child injuries in Sault Ste. Marie in the years studied. Inanimate mechanical force injury was the second highest leading cause of child injury for each year between 2008 and 2012, while animate mechanical force injury consistently rounded out the top three. Exposure to smoke, fire, heat, hot substances, and accidental poisoning and exposure to noxious substances made up the lowest percentage of injuries out of the five categories studied.
767
717
765
726
758
650
700
750
800
850
2008 2009 2010 2011 2012
Cou
nt
Child Injuries per Year (Aged 0 to 6) Reported in Emergency: Sault Ste. Marie CA Residents in Ontario
Hospitals
Figure 22
Health and Physical Environment
19
Figure 23
268 261252
277
303
210
166
230
182197
97 97
6481
52
719 22 21 15
25 3039
23 25
0
100
200
300
400
2008 2009 2010 2011 2012
Cou
ntSelected Child Injuries (Aged 0 to 6) Reported in Emergency:
Sault Ste. Marie CA Residents in Ontario HospitalsFallsInanimate mechanical force injuriesAnimate mechanical force injuriesExposure to smoke, fire, heat, hot substancesAccidental poisoning exp. To noxious substances

Because falls accounted for almost one half of all child injuries between 2008 and 2012 in Sault Ste. Marie (2,166 in total), a closer look may be required. Knowing the different ways that children are often injured by falling may assist parents, guardians and caregivers in preventing these types of injuries in the future. Figure 24 shows the top nine types of falls that injured Sault Ste. Marie children between 2008 and 2012.
The type of fall that injured the most Sault Ste. Marie children during this time period was falls on the same level, making up 16.5% of all falls. Unspecified falls, trip and stumble falls, falls involving stairs and steps and falls involving beds followed in that order. Falls involving playground equipment, other furniture, falls from one level to another and falls involving chairs were less prevalent types of falls to injure children.
Crime
Community and neighbourhood safety is important for child development. Parental supervision and a safe neighbourhood can allow children to play without worry. Low crime rates are an important factor of neighbourhood safety. The Sault Ste. Marie Police Service, Community Services Branch is dedicated to keeping kids safe. Their website offers information on bullying, cyberbullying, internet safety, drugs and alcohol, depression and suicide, as well as other safety tips for winter, water, Halloween, bikes, etc. This information can be found online at www.ssmpskeepingkidssafe.org.
Since 2009, the total number of crime occurrences has decreased15. Property crime occurrences dropped from 4,309 in 2009 to 3,935 in 2012, violent crimes dropped from 835 in 2009 to 697 in 2012, and drug crime occurrences decreased from 185 in 2009 to 94 in 2011 and increased slightly to 107 in 2012. (Figure 25).
In 2009, there were 1,401 domestic violent crime occurrences in Sault Ste. Marie, which was the highest number of instances of this type of crime in an eight year span from 2008 to 2012. In 2010, there was a
significant drop with 1,191 occurrences recorded, which has slightly increased in the years since to 1,351 occurrences in 2012 (Figure 26).
225(16.5%)
225(16.5%)
147(10.8%)
139(10.2%)
133(9.8%)
117(8.6%)
107(7.9%)
103(7.6%)
56(4.1%)
0% 2% 4% 6% 8% 10% 12% 14% 16% 18%
OTHER FALL ON SAME LEVEL
UNSPECIFIED FALL
FALL SAME LVL FROM SLIP TRIP & STUMBLE
FALL ON AND FROM STAIRS AND STEPS
FALL INVOLVING BED
FALL INVOLVING PLAYGROUND EQUIPMENT
FALL INVOLVING OTHER FURNITURE
OTHER FALL FROM ONE LEVEL TO ANOTHER
FALL INVOLVING CHAIR
Top Types of Falls of Sault Ste. Marie CA Children (Aged 0 to 6) Who Reported to Hospital ER, 2008 - 2012
Health and Physical Environment
20
0
1000
2000
3000
4000
5000
6000
7000
2005 2006 2007 2008 2009 2010 2011 2012
Occ
urre
nces
Does not include domestic violence
Stats Canada Crime Index - Sault Ste. Marie Crime Occurrences by Category
Drugs
Crimes of Violence
Crimes of Property
1050
1100
1150
1200
1250
1300
1350
1400
1450
2005 2006 2007 2008 2009 2010 2011 2012
Occ
uren
ces
Domestic Violence
Figure 25
Figure 26
15. All statistics taken from the Stats Canada Crime index for Sault Ste. Marie.
Figure 24

Physical Environment
Playgrounds within Walking Distance
The physical activity level of children can be partly influenced by access to playgrounds. Research has shown that playgrounds are an important environment for the healthy physical development of children and can also provide social, emotional and cognitive benefits16. A playground can provide the types of play that help children learn reflexes and movement control, develop fine and gross motor skills, increase flexibility and balancing skills, and learn to walk, run, jump, throw, climb, slide and swing. These activities all lead to improved physical health and fitness17.
Playgrounds also help children build self-confidence and self-esteem though risk-taking, conflict resolution and imaginative dramatic play. Children can also learn to interact with others by learning to take turns and play cooperatively. Research has also shown that certain types of playground equipment facilitate cognitive learning for children. For example, climbers/bars assist children in learning scientific concepts such as the force of gravity and spatial awareness. Swings also help kids learn perceptual processes and body awareness through space18.
The following analysis examines the walking distance to playgrounds and the general condition and quality of playgrounds. The results can help identify the neighbourhoods that do not have a playground within a reasonable walking distance, as well as playgrounds that are in need of attention due to poor condition.
Playground “Gaps”
For the purposes of this analysis, playgrounds have been defined as any publicly accessible municipal or schoolyard park that contains playground equipment, such as swings, a climber and/or a slide. Analysis boundaries were also restricted to the City of Sault Ste. Marie and Prince Township, due to lack of available data outside of these areas.
There are 83 publicly accessible playgrounds in Sault Ste. Marie and Prince, of which 60 are operated by the
City of Sault Ste. Marie and 2 by Prince Township. The other 21 publicly accessible playgrounds are located on school grounds. Private playgrounds, of which there were 13, were not included in distance calculation results as access is normally restricted to a small population.
To determine “gaps” in playground coverage within the city, a reasonable maximum distance that a child can be expected to walk had to be determined. Based on discussions with City of Sault Ste. Marie staff, the average child can reasonably be expected to walk a maximum of 800 metres (1/2 mile) to reach a playground. Assuming average adult walking speed is about 5 kilometres per hour, and a child’s walking speed is about 3 kilometres per hour (50 metres per minute), an 800 metre walk would take around 15 to 16 minutes.
Playground Equipment Evaluation
All 96 municipal, school and private playgrounds in the City of Sault Ste. Marie and Prince Township were visited by SSMIC staff members in the summer of 2013. Playgrounds were scored based on the following criteria:
Age Appropriateness of Equipment: A great playground will have equipment tailored to children aged 0 to 12. Children of different ages that live in the same neighbourhood should all be able to enjoy the playground.
Equipment Variety: A great playground should have a wide variety of equipment for children to play on to learn balance, build strength and interact with other children. A full playground should contain multiple climbing apparatuses/bars, multiple slides, and at least one swingset or saucer/tire swing, and other types of equipment.
Equipment Condition: A great playground will have equipment that is in working order, is safe to use, and does not require repairs.
Green Space & Sportsfields: A great playground should have space either within the playground itself or have some room outside of the playground like baseball diamonds and fields for children to run around. A great park/playground may offer a sportsfield, such as a baseball diamond or a basketball court.
Playgrounds that contained limited equipment, minimal greenspace, or hazards/conditions that may cause
21
Health and Physical Environment
16. International Play Equipment Manufacturers Association (IPEMA), “Voice of Play”, 2013, Accessed: http://voiceofplay.org/default.aspx.17. International Play Equipment Manufacturers Association18. International Play Equipment Manufacturers Association
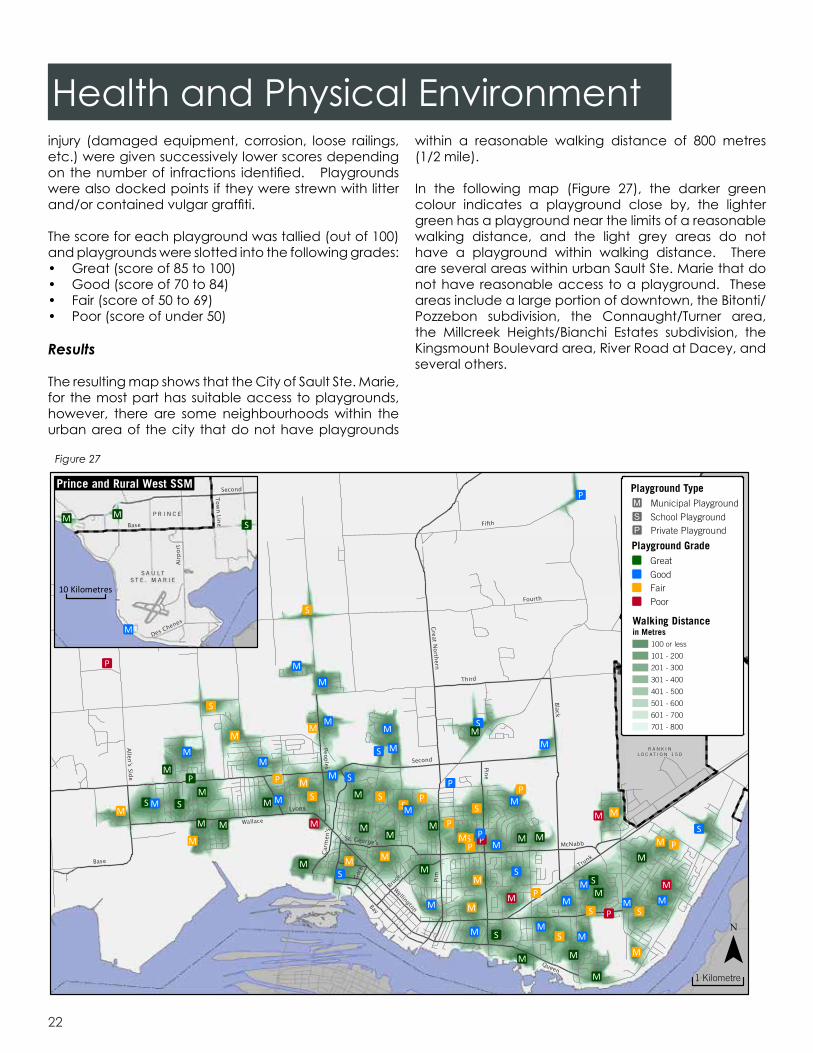
Health and Physical Environmentinjury (damaged equipment, corrosion, loose railings, etc.) were given successively lower scores depending on the number of infractions identified. Playgrounds were also docked points if they were strewn with litter and/or contained vulgar graffiti.
The score for each playground was tallied (out of 100) and playgrounds were slotted into the following grades: • Great (score of 85 to 100)• Good (score of 70 to 84)• Fair (score of 50 to 69)• Poor (score of under 50)
Results
The resulting map shows that the City of Sault Ste. Marie, for the most part has suitable access to playgrounds, however, there are some neighbourhoods within the urban area of the city that do not have playgrounds
within a reasonable walking distance of 800 metres (1/2 mile).
In the following map (Figure 27), the darker green colour indicates a playground close by, the lighter green has a playground near the limits of a reasonable walking distance, and the light grey areas do not have a playground within walking distance. There are several areas within urban Sault Ste. Marie that do not have reasonable access to a playground. These areas include a large portion of downtown, the Bitonti/Pozzebon subdivision, the Connaught/Turner area, the Millcreek Heights/Bianchi Estates subdivision, the Kingsmount Boulevard area, River Road at Dacey, and several others.
22
Â
Â
Â
P
P
P
Â
Â
Â
P
P
P
Â
Â
Â
Â
ÂÂ
Â
P
P
P
P
PP
P
ÂP
Â
ÂÂ
Â
ÂÂ
Â
Â
Â
 S
SS
S
SS
S
S
S
S
Â
Â
Â
Â
Â
Â
S
S
S
S
S
S
Â
Â
 Â
ÂS
S
S S
S
ÂÂ
ÂÂ
MM
MM
Â
 Â
Â
Â
Â
Â
Â
Â
Â
Â
Â
Â
M
M M
M
M
M
M
M
M
M
M
M
M
Â
Â
 Â
Â
Â
Â
Â
Â
Â
Â
Â
Â
Â
Â
Â
Â
Â
Â
ÂÂ
Â
Â
M
M
M M
M
M
M
M
M
M
M
M
M
M
M
M
M
M
M
MM
M
M
Â
 Â
Â
Â
ÂÂ
Â
ÂÂÂ
Â
Â
Â
Â
Â
Â
Â
ÂÂ
Â
M
M M
M
M
MM
M
MMM
M
M
M
M
M
M
M
MM
M
Fourth
Fifth
Second
Trunk
Pine
Queen
Black
Bay
Wellington
Great Northern
Pim
McNabb
Third
Wallace
Base
Bruce
Peoples
Carm
en's
Lyons
Allen's Side
St. George's
Gore
R A N K I NL O C A T I O N 1 5 D
ÂS
ÂM
ÂÂ MMBase
Second
Airp
ort
Town Line
Des Chenes
¯1 Kilometre
10 Kilometres
Municipal Playground
School PlaygroundPrivate Playground
ÂMÂSÂP
Great
GoodFair
Poor
Â
ÂÂ
Â
Walking Distancein Metres
100 or less
101 - 200
201 - 300
301 - 400
401 - 500
501 - 600
601 - 700
701 - 800
Playground Type
Playground Grade
Prince and Rural West SSM
P R I N C E
S A U L TS T E . M A R I E
Figure 27

Health and Physical EnvironmentThe downtown is of particular interest as a mixed commercial and residential neighbourhood, with a generally lower socioeconomic status than the Sault Ste. Marie average. This includes lower levels of parental education, lower income households, a high proportion of rented dwellings, and a very mobile population. Those who live from Dennis Street, east to Kohler Street generally do not have access to a playground (Figure 28). In 2011, there were approximately 120 children aged 0 to 6 living in this area of downtown.
23
ÂS
Â
Â
Â
ÂM
M
M
M
Â
Â
M
M
ÂM
Alberta
Carm
en's
St. George's
Upton
Wilcox
Etienne Brule
Victoria
Hamilton
Penhorwood
John Street
Bruce Street
Bay
Queen
Pim
Albert
Bruce
Wellington
MacDonald
Huro
n
East
Gore
Cathcart
Chur
ch
Grosvenor
The
Popl
ar
BrienJo
hn
OntarioUp
ton
Sprin
g
Simps
on
Borron
Forest
Elgin
Wilson
Weldon
Brock
Campbell
Leo
Kohl
er
Curran
Birch
Belle
vue
Foster
Wilcox Smale
Andr
ew
Crawford
Grace
Summ
it
Dennis
Wemyss
Pilgr
im
RailroadAlexandra
Canal
London
Biggi
ngs
Tanc
redWo
odwa
rd Victoria
St. Mary's River
King
Oakland
Trelawne
Cunningham
March
Lansdowne
Spruce
Cedar
Fauquier
Herrick
Oakwood
Laird
McGr
egor
Maple
Algoma
Euclid
Hamilton
LaBelle
Bell
Findlay
Salisbury
Towers
Melrose
Hawthorne
Hearst
St. J
ames
Beve
rley
Edward
Coul
son
Glad
ston
e
Manilla
Abbott
Alworth
Rosedale
Bluche
r
Hughe
s
Putney
Blak
e
Montgomery
Hadl
ey
Russ
Ramsay
Laur
ier
McPhail
Bingh
am
Glad
ston
e
Upton
TrelawneTanc
red
¯
Municipal Playground
School PlaygroundPrivate Playground
ÂMÂSÂP
Great
GoodFair
Poor
Â
ÂÂ
Â
Walking Distancein Metres
100 or less
101 - 200
201 - 300
301 - 400
401 - 500
501 - 600
601 - 700
701 - 800
Playground Type
Playground Grade
250 Metres
Figure 28

Health and Physical Environment
24
The west end also has two significant gaps in playground coverage. The Bitonti/Pozzebon subdivision and the area surrounding the western half of Connaught Avenue do not have playgrounds within a reasonable walking distance (Figure 29). In 2011, there were approximately 95 children aged 0 to 6 living in these two areas combined.
Of the 83 public access playgrounds in Sault Ste. Marie and Prince, 26 received a grade of “Great” (31.3%), 30 received a grade of “Good” (36.1%), 23 received a grade of “Fair” (27.7%) and 4 received a grade of “Poor” (4.8%). The average score for public access playgrounds for Sault Ste. Marie and Prince was “Good” (average score of 75). The results are summarized in Figure 30.
The public access playgrounds that fell into the Poor category were spread across the city. They represented playgrounds that contained multiple
hazards, signs of repeated vandalism and/or a general lack of equipment.
Of the 13 private playgrounds identified in Sault Ste. Marie and Prince, 1 received a grade of “Great”, 4 received a grade of “Good”, 5 received a grade of
ÂP
ÂS
ÂM
Â
Â
Â
M
M
M
Â
Â
Â
Â
M
M
M
M
ÂÂ
Â
Â
MM
M
M
Manzo
Korah
Sussex
Munroe
Lennox
Patrick
Hillside
Wm. Merrifield
Mike Zuke
David Kyle
Laurentian
Ruth StreetVesta Co-op
Second
Korah
Goulais
Wallace
Farwell
Lyons
Peoples
Rossmore
Wellington
Henrietta
Elliott
Carm
en's
Douglas
FirstPrentice
Sussex
Cooper
Third
Turner
Second
Moody
Estelle
Laura
Johnson
Patrick
Connaught
Balfour
Shafer
Wallace
Churchill
Carufel
Doncaster
Henry
Fifth
St. P
atric
k
Sixth
Franklin
Selby
Hill
Ruth
Langdon
Lennox
Sydenham
Bitonti
Fourth
NicholW
ilding
Murton
McFadden
Maretta
Hare
Edison
Penno
Hampton
Lloyd
Spadina
Devon
Bloor
Hocking
Raymond
Pozzebon
Vivian
Asquith
Swartz
Walters
Donna Brunswick
Letcher
Everett
Dovercourt
Cheshire
Digby
Dundas
Kingsford
Pittsburgh
Sunnydale
Pond
Pretoria Hill
Dawson
Diane
Wright
St. Michael's
Rushmere
Rockport
Assunta
Woodcroft
Lidstone
McLean
Morgan
Patricia
CumberlandVictor Emmanuel
Cheshire
Wallace
Devon
Langdon
Spadina
Doncaster
Sydenham
Kingsford
2̄50 Metres
Municipal Playground
School PlaygroundPrivate Playground
ÂMÂSÂP
Great
GoodFair
Poor
Â
ÂÂ
Â
Walking Distancein Metres
100 or less
101 - 200
201 - 300
301 - 400
401 - 500
501 - 600
601 - 700
701 - 800
Playground Type
Playground Grade
31.3%
36.1%
27.7%
4.8%
Playground Grades: Public Access Playgrounds (Municipal & Schools)
Great
Good
Fair
Poor
Figure 30
Figure 29
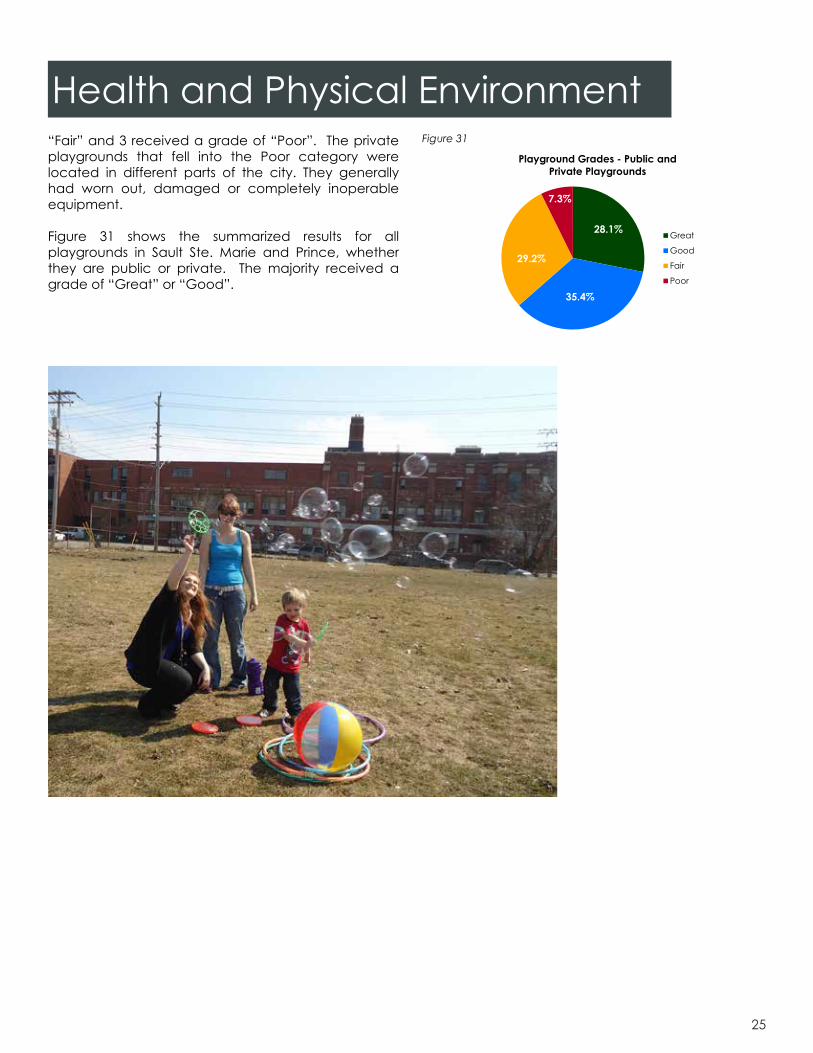
Health and Physical Environment“Fair” and 3 received a grade of “Poor”. The private playgrounds that fell into the Poor category were located in different parts of the city. They generally had worn out, damaged or completely inoperable equipment.
Figure 31 shows the summarized results for all playgrounds in Sault Ste. Marie and Prince, whether they are public or private. The majority received a grade of “Great” or “Good”.
25
28.1%
35.4%
29.2%
7.3%
Playground Grades - Public and Private Playgrounds
Great
Good
Fair
Poor
Figure 31

Health and Physical Environment
26
Where have we gone since the last report?
The Health and Physical Environment section of this Best Start Network report builds on the existing indicators selected for the 2011 report. For each indicator, two to three years of data has been added.
Births There were more births to Sault Ste. Marie mothers in 2012 than the previous four years. There were 778 births in 2012; up 30 from 748 in 2010. Because of this increase in births, the crude birth rate of Sault Ste. Marie has risen to match that of Ontario.
▲Births to Teenage Mothers
Teenage females accounted for a greater percentage of births in Sault Ste. Marie in 2012 than previous years. The percentage of births to teen mothers in the Sault Ste. Marie CA increased from 7% in 2010 to 10% in 2012. This Figure is significantly higher than the Ontario average of 4%.
▲Infant & Child Development Program
The Infant & Child Development Program has seen an increase in the number of clients between 2010 and 2013. There were 540 clients receiving services in 2012/13; up from 401 clients in 2010/11. This can be viewed as a positive change as more parents with infants and children with potential developmental difficulties are receiving help.
▲Asthma No new asthma data was available at the time of publication. N/AObesity No new obesity data was available at the time of publication. N/AMental Health The mental health indicator is a new piece in this report. A comparison
with the last report is not possible. N/AFood Security The cost of a nutritious food basket is rising in the Algoma District. It is up
11% from $751.90/month in 2010 to $840.00/month in 2013. ▲Lunch Programs, Soup Kitchens, Food Banks
Because of differences in reporting from centre to centre, it is not possible to determine if there was an increase in the total number of meals provided to children in the community between 2010 and 2012.
N/AChild Injuries: Falls Falls are consistently the category with the highest number of ER visits by
children aged 0 to 6. The number of children who visited the ER for a fall increased from 252 in 2010, to 303 in 2012. ▲
Crime The number of crime occurrences declined between 2010 and 2012. Violent crimes, drug crimes, and property crimes all posted declines between this time period. ▼
Domestic Violence
Domestic violence is on the rise in Sault Ste. Marie. Occurrences of domestic violence rose from 1,191 in 2010 to 1,351 in 2012. ▲
Playgrounds The playground gap identified in downtown SSM in 2011 has not been formally addressed. • Please note that this analysis has led several community
organizations to express an interest in building a playground in the downtown area.
■

Child Care
The District of Sault Ste. Marie Social Services Administration Board (DSSAB) provides service system management for child care and early years programming in Sault Ste. Marie and the surrounding area. Through agreements with the Ministry of Education, funding is provided to assist licensed child care programs with operating costs and child care fee subsidies.
Fee Subsidy
A fee subsidy assists parents with the cost of a child care space. Eligibility for a fee subsidy is dependent on a family’s level of income. In Sault Ste. Marie, families eligible for full fee subsidy currently pay a minimum user fee of $1.75 per day, however effective April 1, 2014 and in keeping with best practice across the province, child care centres will no longer be charging this fee. Currently the average charge for a full day of care in the community ranges from $35.87 for preschoolers to $41.70 for infants.
In 2013, 566 families and 690 children were assisted with fee subsidy. A significant majority (70%) was lone parent families and of these, 76% had an annual income of less than $20,000. The most common reason noted for requiring a child care subsidy (36%) continues to be to sustain full-time employment.
Licensed Child Care Spaces
Sault Ste. Marie now has a total of 1,664 licensed child care spaces available. This is an increase of 322 spaces since 2011 and includes infant, toddler, JK/SK and before and after school program spaces. Spaces in the community are located in child care centres (863), schools (626) and licensed home child care (175) (Figure 32). On any given day the wait list for child care in the community is approximately 1,100 children, with around half of the families registered requesting fee subsidy assistance. In 2012/2013, approximately 34% of child care spaces in Sault Ste. Marie had subsidy available.
In a recent survey (June, 2013), operators reported a vacancy rate of less than 8%. Many of these vacancies were a result of summer closures, especially before and after school programs. Vacancies can occur even with a lengthy waitlist. For example, parents may be waiting for a space at a particular location, require full-day/year round care, or may require subsidy when the space available is full fee.
It is also important to note that some operators do not offer spaces up to their licensed capacity. There is a shortage of qualified Registered Early Childhood Educators (RECEs) and operators may only have staff available to offer a portion of their licensed spaces. The reasons for the shortage of RECEs are many, including non-competitive salary ranges. In Sault Ste. Marie the average yearly salary for RECEs in a licensed child care program is approximately $35,500.00 per year.
Service Gaps
For many years, the Community Child Care Plan has cited infant spaces and extended hours of care as service gaps to the community. Many parents place their child on the centralized wait list for child care prior to their child’s birth. Extended hours of care for shift work and weekend care is only available through licensed home child care. These two issues continue to be identified, despite a small increase in infant spaces over the last two years. Although the community is licensed for 70 homes, only 35 are currently operating. There continues to be an ongoing effort to recruit and license more home child care operators and to increase the number of homes meeting the cultural needs of Francophone and Aboriginal families.
Child Care and Full Day Kindergarten
In September 2011, all schools in Sault Ste. Marie began offering full-day junior kindergarten programs. By September 2014, there will be fully implemented Full Day Learning programs in all of these classrooms, as directed by the Ministry of Education. Children now
Education and Child Care
27
Child CareBest Start Hubs Parent and Family Literacy Centres Early Development Instrument (EDI)
Best for Kids Summer ProgramThe Kindergarten Parent Survey JK & SK Enrolment
In this section...
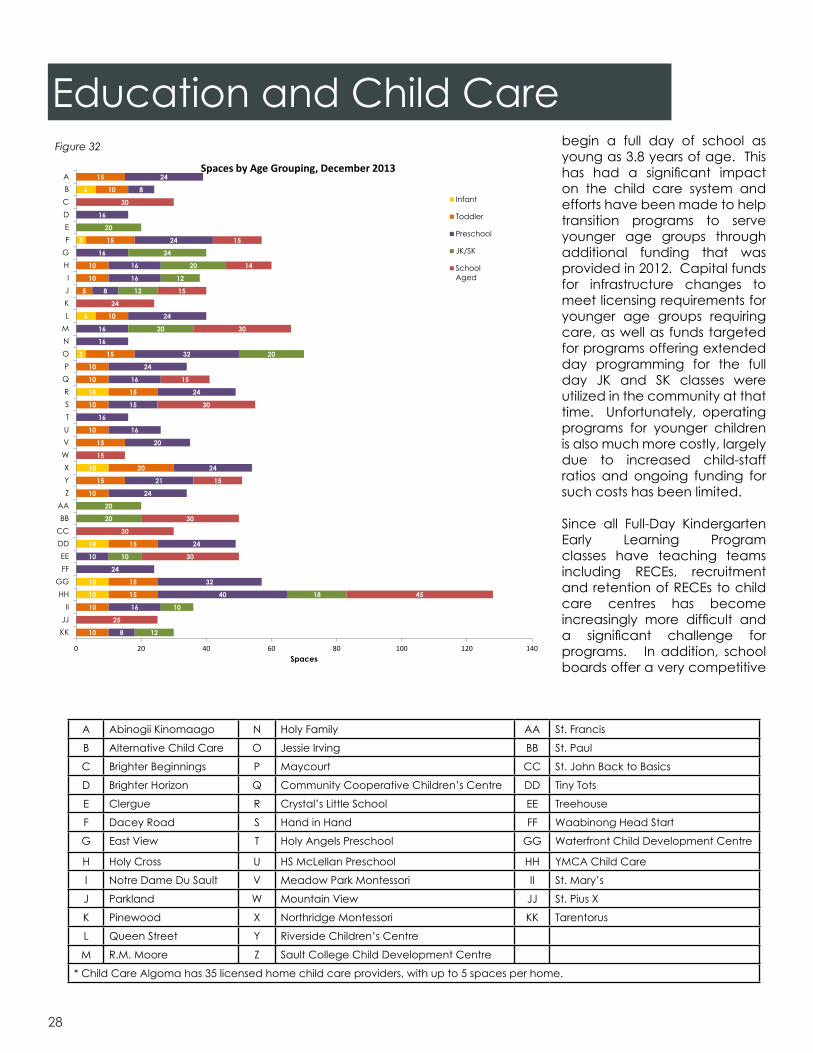
Education and Child Carebegin a full day of school as young as 3.8 years of age. This has had a significant impact on the child care system and efforts have been made to help transition programs to serve younger age groups through additional funding that was provided in 2012. Capital funds for infrastructure changes to meet licensing requirements for younger age groups requiring care, as well as funds targeted for programs offering extended day programming for the full day JK and SK classes were utilized in the community at that time. Unfortunately, operating programs for younger children is also much more costly, largely due to increased child-staff ratios and ongoing funding for such costs has been limited.
Since all Full-Day Kindergarten Early Learning Program classes have teaching teams including RECEs, recruitment and retention of RECEs to child care centres has become increasingly more difficult and a significant challenge for programs. In addition, school boards offer a very competitive
28
A Abinogii Kinomaago N Holy Family AA St. Francis
B Alternative Child Care O Jessie Irving BB St. Paul
C Brighter Beginnings P Maycourt CC St. John Back to Basics
D Brighter Horizon Q Community Cooperative Children’s Centre DD Tiny Tots
E Clergue R Crystal’s Little School EE Treehouse
F Dacey Road S Hand in Hand FF Waabinong Head Start
G East View T Holy Angels Preschool GG Waterfront Child Development Centre
H Holy Cross U HS McLellan Preschool HH YMCA Child Care
I Notre Dame Du Sault V Meadow Park Montessori II St. Mary’s
J Parkland W Mountain View JJ St. Pius X
K Pinewood X Northridge Montessori KK Tarentorus
L Queen Street Y Riverside Children’s Centre
M R.M. Moore Z Sault College Child Development Centre
* Child Care Algoma has 35 licensed home child care providers, with up to 5 spaces per home.
Figure 32
10
10
10
10
10
3
6
3
6
10
10
15
15
15
10
15
20
15
10
10
15
10
10
15
10
5
10
10
15
10
15
8
16
40
32
24
10
24
24
21
24
20
16
16
15
24
16
24
32
16
16
24
8
16
16
16
24
16
8
24
12
10
18
10
20
20
20
20
12
12
20
24
20
25
45
30
30
30
15
15
30
15
30
24
15
14
15
30
0 20 40 60 80 100 120 140
KKJJII
HHGG
FFEE
DDCCBB
AAZYX
WVUTSRQP
ONMLKJI
HGFEDCBA
Spaces
Spaces by Age Grouping, December 2013
Infant
Toddler
Preschool
JK/SK
SchoolAged

Education and Child Carerate of pay compared to many licensed child care programs. In a few instances, partnerships between school boards and child care providers that included the sharing of RECE staff have been beneficial, however not all providers are able to meet the financial/salary obligations such a partnership entails.
Child Care and Schools
Recent changes to legislation allowing school boards to have before and after school programs run by child care operators has increased the number of child care spaces located in schools. In addition, in 2013, funding through the Ministry of Education’s Capital Retrofit program became available. This provided opportunities for some existing child care programs to relocate to schools that had available space and were able to accommodate the necessary physical changes to meet licensing requirements for child care. This program was done in partnership with local school boards, the DSSAB and identified local service providers. To date, two such projects have been completed with potential for two or three more for 2014. Currently in Sault Ste. Marie, 626 licensed spaces (37.6%) are located in 16 elementary schools and one high school location has 2 programs on site.
Funding Changes
In December of 2012, a long awaited new funding formula for child care was released by the Ministry of Education. Unfortunately for Sault Ste. Marie, this resulted in a potential 22% cut in funding that was capped at 10% until the end of 2015. Mitigation funding was also provided to assist in a gradual implementation of the required changes which would need to be considered. Since then, as a result of advocacy efforts which have been undertaken, the reduction in funding has been reduced to 17%. Although the new formula was based on a number of weighted factors, Sault Ste. Marie was significantly and negatively impacted by the child population factor used and the fact remains that population continues to decline in the community, much as it is in many communities in the North.
Also of note in the new funding formula announcement was the absence of a consistent funding strategy that could begin to address the salary disparity between licensed child care programs and school board early learning programs as had been hoped.
Over the past year the DSSAB has met with service providers on a number of occasions and has worked with an advisory group of stakeholders to identify
recommendations on the direction the future funding model would take. Two main priorities identified for the model are to ensure that funding be as equitable as possible and that every effort is made to preserve subsidized spaces.
Given the significant waitlist and low vacancy rates in Sault Ste. Marie, access to child care spaces, especially for those least able to pay will be significantly impacted moving forward.
Best Start Hubs
Best Start Hubs were created under the direction of the Ministry of Children and Youth Services (MCYS) in 2003 and were initially called Ontario Early Years Centres (OEYCs); expanding their name to include the term “Best Start Hubs” in response to the provincial government’s Best Start Initiative. Prior to being OEYCs, many of these centres had been Family Resource Programs (FRPs). The goal of Best Start Hubs is to provide families with seamless services.
Research has shown that a child’s earliest experiences shape the physical development of the brain and the child’s capacity for further development. Children who have achieved their developmental milestones before starting school are better able to cope with, and take advantage of all the experiences a school environment has to offer. While we recognize that families provide the primary and most important environments to support optimal development, the neighbourhoods and communities in which children are raised also influence their developmental outcomes.
See more information on Best Start Hubs on page 73, in the Child and Family section.
Parenting and Family Literacy Centres
Parenting and Family Literacy Centres in Sault Ste. Marie are offered through the Algoma District School Board and funded by the Ministry of Education. There are currently 4 locations: Etienne Brule, Northern Heights, Riverview and Pinewood Public Schools. For more information on Parenting and Family Literacy Centres please refer to page 81 in the Child and Family section of this report.
29
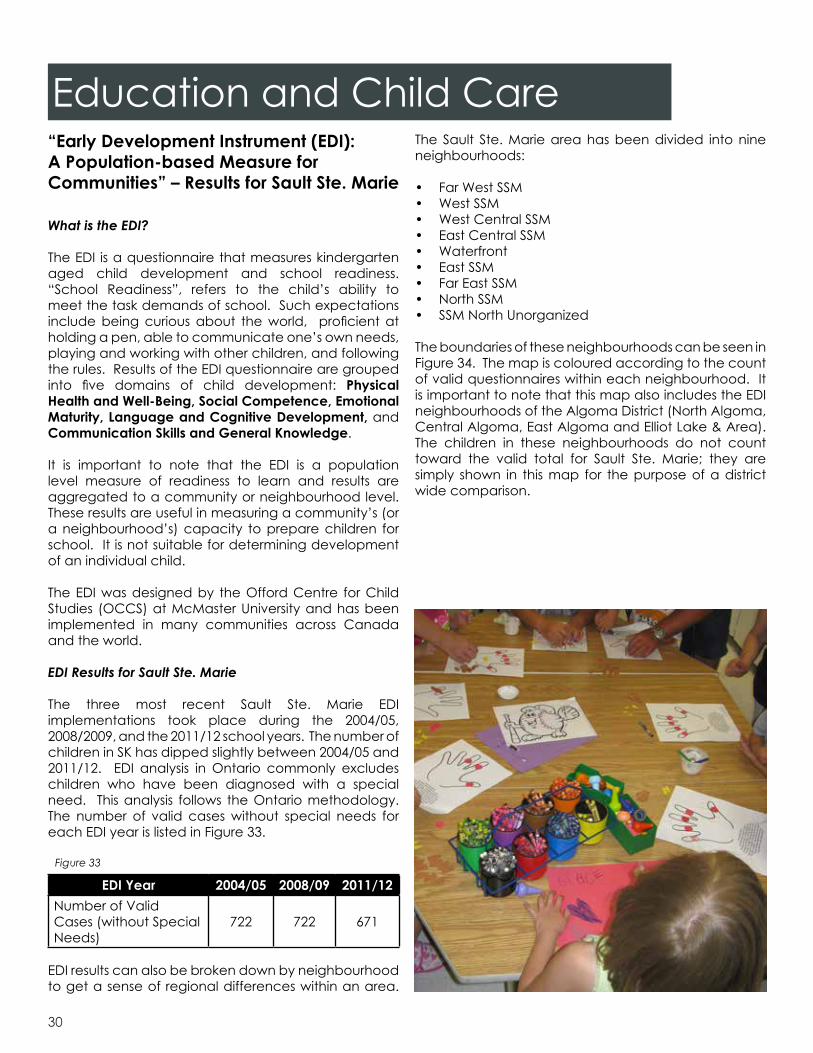
Figure 33
“Early Development Instrument (EDI): A Population-based Measure for Communities” – Results for Sault Ste. Marie
What is the EDI?
The EDI is a questionnaire that measures kindergarten aged child development and school readiness. “School Readiness”, refers to the child’s ability to meet the task demands of school. Such expectations include being curious about the world, proficient at holding a pen, able to communicate one’s own needs, playing and working with other children, and following the rules. Results of the EDI questionnaire are grouped into five domains of child development: Physical Health and Well-Being, Social Competence, Emotional Maturity, Language and Cognitive Development, and Communication Skills and General Knowledge.
It is important to note that the EDI is a population level measure of readiness to learn and results are aggregated to a community or neighbourhood level. These results are useful in measuring a community’s (or a neighbourhood’s) capacity to prepare children for school. It is not suitable for determining development of an individual child.
The EDI was designed by the Offord Centre for Child Studies (OCCS) at McMaster University and has been implemented in many communities across Canada and the world.
EDI Results for Sault Ste. Marie
The three most recent Sault Ste. Marie EDI implementations took place during the 2004/05, 2008/2009, and the 2011/12 school years. The number of children in SK has dipped slightly between 2004/05 and 2011/12. EDI analysis in Ontario commonly excludes children who have been diagnosed with a special need. This analysis follows the Ontario methodology. The number of valid cases without special needs for each EDI year is listed in Figure 33.
EDI Year 2004/05 2008/09 2011/12Number of Valid Cases (without Special Needs)
722 722 671
EDI results can also be broken down by neighbourhood to get a sense of regional differences within an area.
The Sault Ste. Marie area has been divided into nine neighbourhoods:
• Far West SSM• West SSM• West Central SSM• East Central SSM• Waterfront• East SSM• Far East SSM• North SSM• SSM North Unorganized
The boundaries of these neighbourhoods can be seen in Figure 34. The map is coloured according to the count of valid questionnaires within each neighbourhood. It is important to note that this map also includes the EDI neighbourhoods of the Algoma District (North Algoma, Central Algoma, East Algoma and Elliot Lake & Area). The children in these neighbourhoods do not count toward the valid total for Sault Ste. Marie; they are simply shown in this map for the purpose of a district wide comparison.
Education and Child Care
30
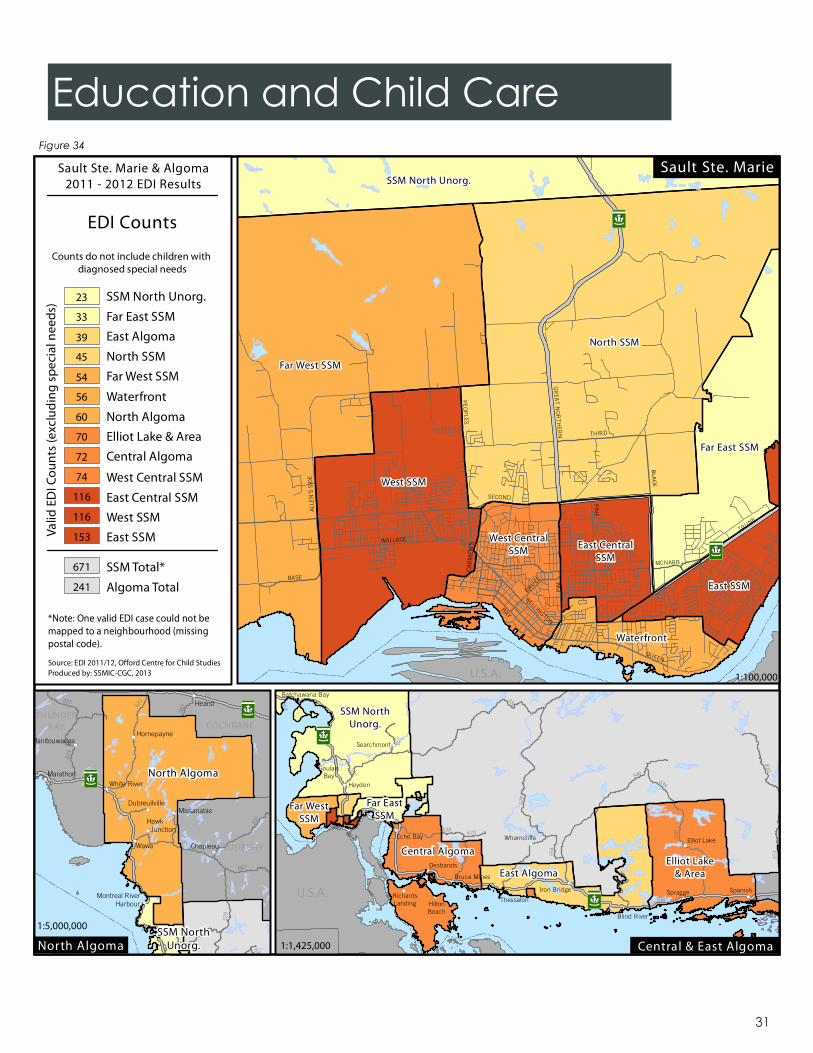
Education and Child Care
31
Figure 34
³²71
³²71
CA
RM
EN'S
BAY
North SSM
Far West SSM
West SSM
Far East SSM
East SSM
SSM North Unorg.
West CentralSSM East Central
SSM
Waterfront
SECOND
PIN
E
TRUNK
QUEEN
BLACK
GR
EAT
NO
RT
HE
RN
PIM
WELLINGTON
MCNABB
THIRD
WALLACE
BASE
BRUCE
PE
OP
LES
ALL
EN
'S S
IDE
!(
!(
!(
!(
!(
!(
!(
!(
!(
!(
!(
!(
!( !(
!(
!( Heyden
SpanishSpragge
Echo Bay
Thessalon
Desbarats
Searchmont
Elliot Lake
Blind River
Iron Bridge
Wharncliffe
Bruce Mines
GoulaisBay
HiltonBeach
Batchawana Bay
RichardsLanding
East Algoma
SSM NorthUnorg.
Elliot Lake& Area
Central Algoma
Far EastSSM
Far WestSSM
17
556
129
546
108638
639
810
553
557
552
532
554
670
563
538
!(
!(
!(
!(
!(
!(
!(
!(
!(
!(
!(
Wawa
Hearst
Chapleau
Marathon
Missanabie
Hornepayne
White River
Manitouwadge
Dubreuilville
Hawk Junction
Montreal RiverHarbour
North Algoma
SSM NorthUnorg.
1711
101
129
631625
667
546
614
583
639
563
Valid
ED
I Cou
nts
(exc
ludi
ng s
peci
al n
eeds
)
Sault Ste. Marie & Algoma2011 - 2012 EDI Results
EDI Counts
23 SSM North Unorg.
33 Far East SSM
39 East Algoma
45 North SSM
54 Far West SSM
74 West Central SSM116 East Central SSM116 West SSM153 East SSM
671 SSM Total*
*Note: One valid EDI case could not bemapped to a neighbourhood (missingpostal code).
Source: EDI 2011/12, Offord Centre for Child StudiesProduced by: SSMIC-CGC, 2013
56 Waterfront
60 North Algoma70 Elliot Lake & Area
72 Central Algoma
241 Algoma Total
Counts do not include children with diagnosed special needs
Sault Ste. Marie
North Algoma Central & East Algoma
U.S.A.
³²71
³²71
U.S.A.
³²71
SUDBURY
COCHRANETHUNDER
BAY³²11
1:100,000
1:1,425,000
1:5,000,000

Figure 35
EDI Results for Sault Ste. Marie: Vulnerability
The EDI is commonly used to get a sense of vulnerability in a population of children. If a child scores below the 10th percentile cut-off of the site/comparison population on any of the five domains, he/she is said to be vulnerable on that scale of development. The lowest 10th percentile is of particular interest as vulnerability in kindergarten has been reported to contribute to children’s outcomes later in school19. For this analysis the Ontario Baseline has been used to determine vulnerability. Figure 35 illustrates the percentage of Sault Ste. Marie SK children who fell below the 10th percentile cut-off based on the Ontario Baseline for the last three EDI implementations. This table shows that the percent of vulnerable children is increasing in Sault Ste. Marie, particularly within the Physical Health & Well-Being domain.
Each EDI domain is made up of several subdomains which focus on a specific skill or ability. The following sections provide detailed information about each EDI domain and its related subdomains. Subdomains are reported by the percent of children who are “ready”, “middle”, or “not ready” for the school day. In the following subdomain graphs, the percent ready is shown in green, the percent in the middle category is shown in yellow, and the percent not ready is shown in orange. Each graph includes the Ontario average for the purposes of comparison. Understanding these subdomains allows service providers to be specific as to
what needs should be targeted in program planning.
Physical Health and Well Being
The Physical Health and Well Being domain measures gross and fine motor skills (holding a pencil, running on the playground, motor coordination), adequate energy levels for classroom activities, independence in looking after own needs, and daily living skills. A child below the 10th percentile “has inadequate fine and gross motor skills, is sometimes tired or hungry, is usually clumsy, and may have flagging energy levels”20.
In 2011/12, nearly one in four (23.8%) children in Sault Ste. Marie were deemed vulnerable in this domain; up from 19.8% in 2008/09 and up from 16.3% in 2004/05. Sault Ste. Marie children have consistently fared the worst on this domain compared to the other four. This
domain is seeing an upward trend in the percentage of vulnerable children. N e i g h b o u r h o o d s ranged from 8.7% to 39.2% vulnerable. The West Central and North SSM neighbourhoods had vulnerability levels more than twice as high as the province as a whole (Figure 36).
Education and Child Care
32
SSM EDI Results% Vulnerable (Ontario Baseline cut-offs)
2004/2005 2008/2009 2011/2012 TrendPhysical Health & Well-Being 16.3% 19.8% 23.8% ▲
Social Competence 10.7% 11.1% 13.2% ▲
Emotional Maturity 14.1% 12.0% 13.2% -
Language & Cognitive Development 6.1% 4.3% 6.3% -
Communication & General Knowledge 6.1% 8.7% 10.6% ▲
Low in 1 or More Domains 27.5% 30.7% 33.2% ▲
Low in 2 or More Domains 13.6% 14.4% 16.7% ▲
19. Magdalena Janus, The Early Development Instrument: A Tool for Monitoring Children’s Development and Readiness for School, November 2006. Accessed: http://www.offordcentre.com/readiness/files/PUB.20. Magdalena Janus “The Early Development Instrument: A Tool for Monitoring Children’s Development and Readiness for School”, Early Child Development from Measurement to Action: A Priority for Growth and Equity Ed. Mary Eming Young and Linda M. Richardson, World Bank Publications, 2007, pg. 188.
EDI results are commonly mapped by neighbourhood to get a sense of differences that may exist within a community. A vulnerability map has been included for each domain within the following sections of this report. In these maps, the large EDI neighbourhoods of Sault Ste. Marie and the Algoma District are classified from low to high vulnerability using the Ontario Baseline. Sault Ste. Marie and Algoma District neighbourhoods with a lower percentage of vulnerable children compared to the Ontario average are depicted in green, while neighbourhoods with a higher percentage of vulnerable children are depicted in orange. Sault Ste. Marie and Algoma District neighbourhoods that are at or near the Ontario average vulnerability rate are shown in yellow.
Lowest
Low
Average
High
Highest

Education and Child Care
The Physical Health & Well Being domain can be further divided into three subdomains:• Physical Readiness for the School Day• Physical Independence• Gross and Fine Motor Skills
³²71
³²71
CA
RM
EN'S
BAY
North SSM
Far West SSM
West SSM
Far East SSM
East SSM
SSM North Unorg.
West CentralSSM East Central
SSM
Waterfront
SECOND
PIN
E
TRUNK
QUEEN
BLACK
GR
EAT N
OR
THER
N
PIM
WELLINGTON
MCNABB
THIRD
WALLACE
BASE
BRUCE
PEO
PLE
S
ALL
EN'S
SID
E
!(
!(
!(
!(
!(
!(
!(
!(
!(
!(
!(
!(
!( !(
!(
!( Heyden
SpanishSpragge
Echo Bay
Thessalon
Desbarats
Searchmont
Elliot Lake
Blind River
Iron Bridge
Wharncliffe
Bruce Mines
GoulaisBay
HiltonBeach
Batchawana Bay
RichardsLanding
East Algoma
SSM NorthUnorg.
Elliot Lake& Area
Central Algoma
Far EastSSM
Far WestSSM
17
556
129
546
108638
639
810
557
552
532
554
670
563
538
!(
!(
!(
!(
!(
!(
!(
!(
!(
!(
!(
Wawa
Hearst
Chapleau
Marathon
Missanabie
Hornepayne
White River
Manitouwadge
Dubreuilville
Hawk Junction
Montreal RiverHarbour
North Algoma
SSM NorthUnorg.
17
11
101
129
631625
667
546
614
583
639
563
% V
ulne
rabl
e - O
ntar
io B
asel
ine
Sault Ste. Marie & Algoma2011 - 2012 EDI Results
Physical Health &Well-being
7.1 Elliot Lake & Area
8.7 SSM North Unorg.
12.5 Waterfront
13.3 North Algoma
17.9 East Algoma
24.2 Far East SSM26.7 North SSM31.9 Central Algoma39.2 West Central SSM
23.8 SSM Vulnerability
Note: Colour classification is based on theOntario Baseline.Source: EDI 2011/12, Offord Centre for Child StudiesProduced by: SSMIC-CGC, 2013
18.5 Far West SSM
23.3 East Central SSM23.3 West SSM
24.2 East SSM
17.8 Algoma Vulnerability12.9 Ontario Vulnerability
Measures gross and fine motor skills,adequate energy levels for classroom activities,
independence and daily living skills
Sault Ste. Marie
North Algoma Central & East Algoma
U.S.A.
³²71
³²71
U.S.A.
³²71
SUDBURY
COCHRANETHUNDER
BAY³²11
1:100,000
1:1,425,000
1:5,000,000
33
Figure 36
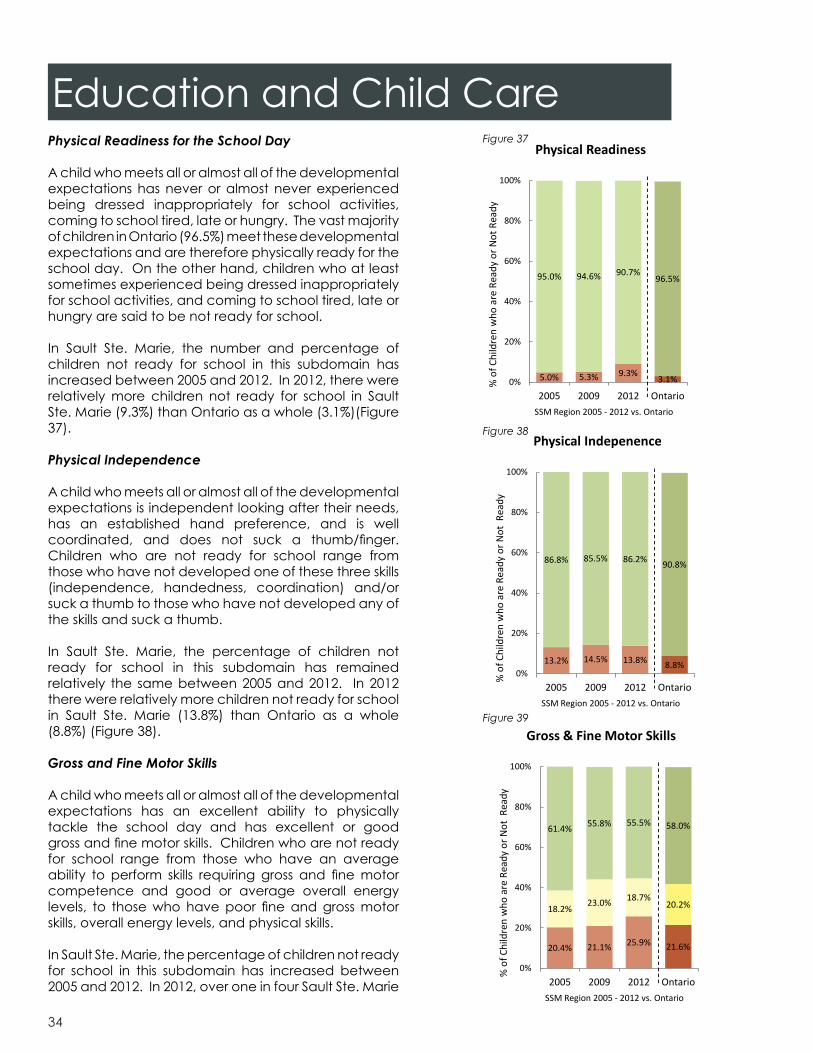
34
Education and Child CarePhysical Readiness for the School Day
A child who meets all or almost all of the developmental expectations has never or almost never experienced being dressed inappropriately for school activities, coming to school tired, late or hungry. The vast majority of children in Ontario (96.5%) meet these developmental expectations and are therefore physically ready for the school day. On the other hand, children who at least sometimes experienced being dressed inappropriately for school activities, and coming to school tired, late or hungry are said to be not ready for school.
In Sault Ste. Marie, the number and percentage of children not ready for school in this subdomain has increased between 2005 and 2012. In 2012, there were relatively more children not ready for school in Sault Ste. Marie (9.3%) than Ontario as a whole (3.1%)(Figure 37).
Physical Independence
A child who meets all or almost all of the developmental expectations is independent looking after their needs, has an established hand preference, and is well coordinated, and does not suck a thumb/finger. Children who are not ready for school range from those who have not developed one of these three skills (independence, handedness, coordination) and/or suck a thumb to those who have not developed any of the skills and suck a thumb.
In Sault Ste. Marie, the percentage of children not ready for school in this subdomain has remained relatively the same between 2005 and 2012. In 2012 there were relatively more children not ready for school in Sault Ste. Marie (13.8%) than Ontario as a whole (8.8%) (Figure 38).
Gross and Fine Motor Skills
A child who meets all or almost all of the developmental expectations has an excellent ability to physically tackle the school day and has excellent or good gross and fine motor skills. Children who are not ready for school range from those who have an average ability to perform skills requiring gross and fine motor competence and good or average overall energy levels, to those who have poor fine and gross motor skills, overall energy levels, and physical skills.
In Sault Ste. Marie, the percentage of children not ready for school in this subdomain has increased between 2005 and 2012. In 2012, over one in four Sault Ste. Marie
5.0% 5.3% 9.3%3.1%
95.0% 94.6% 90.7%96.5%
0%
20%
40%
60%
80%
100%
2005 2009 2012 Ontario
% o
f Chi
ldre
n w
ho a
re R
eady
or N
ot R
eady
SSM Region 2005 - 2012 vs. Ontario
Physical Readiness
13.2% 14.5% 13.8% 8.8%
86.8% 85.5% 86.2% 90.8%
0%
20%
40%
60%
80%
100%
2005 2009 2012 Ontario
% o
f Chi
ldre
n w
ho a
re R
eady
or N
ot R
eady
SSM Region 2005 - 2012 vs. Ontario
Physical Indepenence
20.4% 21.1% 25.9% 21.6%
18.2%23.0% 18.7%
20.2%
61.4% 55.8% 55.5% 58.0%
0%
20%
40%
60%
80%
100%
2005 2009 2012 Ontario
% o
f Chi
ldre
n w
ho a
re R
eady
or N
ot R
eady
SSM Region 2005 - 2012 vs. Ontario
Gross & Fine Motor Skills
Figure 37
Figure 38
Figure 39

Education and Child Carechildren were not ready for school in this subdomain (25.9%). This is relatively higher than Ontario as a whole (21.6%). The 2012 results represent the first time that Sault Ste. Marie had proportionally more children not ready for school in this domain than the province (Figure 39).
Social Competence
The Social Competence domain measures curiosity about the world, eagerness to try new experiences, knowledge of standards of acceptable behaviour in a public place, ability to control own behaviour, appropriate respect for adult authority, cooperation with others, following rules, and the ability to play and work with other children. A child below the 10th percentile “has poor overall social skills; has regular serious problems in more than one area of getting along with other children – accepting responsibility for his or her own actions, following rules and class routines, being respectful of adults, children and others’ property, having self-confidence and self-control, and adjusting to change; and is usually unable to work independently”21.
In 2011/12, 13.2% of children in Sault Ste. Marie were deemed vulnerable in this domain; up from 11.1% in 2008/09 and up from 10.7% in 2004/05. This domain is seeing an upward trend in the percentage of vulnerable children. Neighbourhoods ranged from 0% to 28.4% vulnerable. The West Central and West SSM neighbourhoods had vulnerability levels considerably higher than the province as a whole (Figure 40).
21. Janus, 2007, pg. 188.
35

36
Education and Child Care
The Social Competence domain can be further divided into four subdomains:• Overall Social Competence• Responsibility and Respect• Approaches to Learning• Readiness to Explore New Things
³²71
³²71
CA
RM
EN'S
BAY
North SSM
Far West SSM
West SSM
Far East SSM
East SSM
SSM North Unorg.
West CentralSSM East Central
SSM
Waterfront
SECOND
PIN
E
TRUNK
QUEEN
BLACK
GR
EAT N
OR
THER
N
PIM
WELLINGTON
MCNABB
THIRD
WALLACE
BASE
BRUCE
PEO
PLE
S
ALL
EN'S
SID
E
!(
!(
!(
!(
!(
!(
!(
!(
!(
!(
!(
!(
!( !(
!(
!( Heyden
SpanishSpragge
Echo Bay
Thessalon
Desbarats
Searchmont
Elliot Lake
Blind River
Iron Bridge
Wharncliffe
Bruce Mines
GoulaisBay
HiltonBeach
Batchawana Bay
RichardsLanding
East Algoma
SSM NorthUnorg.
Elliot Lake& Area
Central Algoma
Far EastSSM
Far WestSSM
17
556
129
546
108638
639
810
557
552
532
554
670
563
538
!(
!(
!(
!(
!(
!(
!(
!(
!(
!(
!(
Wawa
Hearst
Chapleau
Marathon
Missanabie
Hornepayne
White River
Manitouwadge
Dubreuilville
Hawk Junction
Montreal RiverHarbour
North Algoma
SSM NorthUnorg.
17
11
101
129
631625
667
546
614
583
639
563
% V
ulne
rabl
e - O
ntar
io B
asel
ine
Sault Ste. Marie & Algoma2011 - 2012 EDI Results
Social Competence
0.0 SSM North Unorg.
2.8 Central Algoma
3.3 North Algoma
8.9 North SSM
8.9 Waterfront
12.9 East Central SSM15.5 West SSM15.7 Elliot Lake & Area28.4 West Central SSM
13.2 SSM Vulnerability
Note: Colour classification is based on theOntario Baseline.Source: EDI 2011/12, Offord Centre for Child StudiesProduced by: SSMIC-CGC, 2013
9.1 Far East SSM
9.3 Far West SSM11.1 East SSM
12.8 East Algoma
8.7 Algoma Vulnerability9.3 Ontario Vulnerability
Measures overall social competence,responsibility and respect, approaches to learning,
and readiness to explore new things
Sault Ste. Marie
North Algoma Central & East Algoma
U.S.A.
³²71
³²71
U.S.A.
³²71
SUDBURY
COCHRANETHUNDER
BAY³²11
1:100,000
1:1,425,000
1:5,000,000
Figure 40

Education and Child CareOverall Social Competence
A child who meets all or almost all of the developmental expectations has excellent or good overall social development, a very good ability to get along with other children and play with various children, and is usually cooperative and self-confident. Children who are not ready for school have average to poor overall social skills, low self-confidence and are rarely able to play with various children and interact cooperatively.
In Sault Ste. Marie, the percentage of children not ready for school in this subdomain has remained relatively the same between 2005 and 2012. In 2012, there were relatively more children not ready for school in Sault Ste. Marie (12.3%) than Ontario as a whole (8.4%) (Figure 41).
Responsibility and Respect
A child who meets all or almost all of the developmental expectations always or most of the time shows respect for others and for property, follows rules and takes care of materials, accepts responsibility for actions, and shows self-control. Children who are not ready for school only sometimes or never accept responsibility for actions, show respect for others and for property, demonstrate self-control, and are rarely able to follow rules and take care of materials.
In Sault Ste. Marie, the percentage of children not ready for school in this subdomain has declined slightly between 2005 and 2012. In 2012, there was a slightly larger percentage of children not ready for school in Sault Ste. Marie (6%) than Ontario as a whole (4.7%) (Figure 42).
Approaches to Learning
A child who meets all or almost all of the developmental expectations always or most of the time works neatly, independently, and solves problems, follows instructions and class routines, easily adjusts to changes. Children who are not ready for school only sometimes or never work neatly, independently, are rarely able to solve problems, follow class routines and do not easily adjust to changes in routines.
In Sault Ste. Marie, the percentage of children not ready for school in this subdomain has remained nearly the same between 2005 and 2012. In 2012 there were relatively more children not ready for school in Sault Ste. Marie (11.2%) than Ontario as a whole (8.2%) (Figure 43).
11.3% 11.1% 12.3% 8.4%
43.0% 44.2% 42.6%41.2%
45.7% 44.7% 45.0% 50.2%
0%
20%
40%
60%
80%
100%
2005 2009 2012 Ontario
% o
f Chi
ldre
n w
ho a
re R
eady
or N
ot R
eady
SSM Region 2005 - 2012 vs. Ontario
Overall Social Competence
10.1% 10.0% 11.2% 8.2%
29.6% 30.7% 24.8% 29.3%
60.3% 59.3% 64.0% 62.4%
0%
20%
40%
60%
80%
100%
2005 2009 2012 Ontario
% o
f Chi
ldre
n w
ho a
re R
eady
or N
ot R
eady
SSM Region 2005 - 2012 vs. Ontario
Approaches to Learning
37
Figure 41
7.4% 7.5% 6.0% 4.7%
21.6% 17.0% 19.3% 16.4%
71.1% 75.5% 74.7% 78.8%
0%
20%
40%
60%
80%
100%
2005 2009 2012 Ontario
% o
f Chi
ldre
n w
ho a
re R
eady
or N
ot R
eady
SSM Region 2005 - 2012 vs. Ontario
Responsibility and RespectFigure 42
Figure 43

38
Education and Child Care
Readiness to Explore New Things
A child who meets all or almost all of the developmental expectations is curious about the surrounding world, and eager to explore new books, toys and games. Children who are not ready for school only sometimes or never show curiosity about the world, and are eager to explore new books, toys and games. Very few children are not ready for school in this subdomain.
In Sault Ste. Marie, the percentage of children not ready for school in this subdomain has increased slightly between 2005 and 2012. In 2012, there was a slightly smaller percentage of children not ready for school in Sault Ste. Marie (2.7%) than Ontario as a whole (3.1%). This is the only subdomain of the Social Competence domain where Sault Ste. Marie has a smaller percentage of children not ready for school than the province as a whole (Figure 44).
1.5% 2.4% 2.7% 3.1%13.4% 16.5% 16.7% 19.9%
85.1% 81.2% 80.6% 76.6%
0%
20%
40%
60%
80%
100%
2005 2009 2012 Ontario
% o
f Chi
ldre
n w
ho a
re R
eady
or N
ot R
eady
SSM Region 2005 - 2012 vs. Ontario
Readiness to Explore New Things
Emotional Maturity
The Emotional Maturity domain measures ability to reflect before acting, a balance between being too fearful and too impulsive, ability to deal with feelings at the age-appropriate level, and empathic responses to other people’s feelings. A child below the 10th percentile “has regular problems managing aggressive behaviour; is prone to disobedience and/or easily distractible, inattentive, and impulsive; is usually unable to show helping behaviour toward other children; and is sometimes upset when left by the caregiver”22.
In 2011/12, 13.2% of children in Sault Ste. Marie were deemed vulnerable in this domain; up from 12% in 2008/09, but down from 14.4% in 2004/05. Neighbourhoods ranged from 0% to 21.6% vulnerable. The West Central , West and Far East SSM neighbourhoods had vulnerability levels considerably higher than the province as a whole (Figure 45).
22. Janus, 2007, pg. 188.
Figure 44

Education and Child Care
³²71
³²71
CA
RM
EN'S
BAY
North SSM
Far West SSM
West SSM
Far East SSM
East SSM
SSM North Unorg.
West CentralSSM East Central
SSM
Waterfront
SECOND
PIN
E
TRUNK
QUEEN
BLACK
GR
EAT N
OR
THER
N
PIM
WELLINGTON
MCNABB
THIRD
WALLACE
BASE
BRUCE
PEO
PLE
S
ALL
EN'S
SID
E
!(
!(
!(
!(
!(
!(
!(
!(
!(
!(
!(
!(
!( !(
!(
!( Heyden
SpanishSpragge
Echo Bay
Thessalon
Desbarats
Searchmont
Elliot Lake
Blind River
Iron Bridge
Wharncliffe
Bruce Mines
GoulaisBay
HiltonBeach
Batchawana Bay
RichardsLanding
East Algoma
SSM NorthUnorg.
Elliot Lake& Area
Central Algoma
Far EastSSM
Far WestSSM
17
556
129
546
108638
639
810
557
552
532
554
670
563
538
!(
!(
!(
!(
!(
!(
!(
!(
!(
!(
!(
Wawa
Hearst
Chapleau
Marathon
Missanabie
Hornepayne
White River
Manitouwadge
Dubreuilville
Hawk Junction
Montreal RiverHarbour
North Algoma
SSM NorthUnorg.
17
11
101
129
631625
667
546
614
583
639
563
% V
ulne
rabl
e - O
ntar
io B
asel
ine
Sault Ste. Marie & Algoma2011 - 2012 EDI Results
Emotional Maturity
0.0 North SSM
3.7 Far West SSM
8.3 North Algoma
8.7 SSM North Unorg.
10.5 East SSM
17.1 Elliot Lake & Area18.2 Far East SSM19.0 West SSM21.6 West Central SSM
13.2 SSM Vulnerability
Note: Colour classification is based on theOntario Baseline.Source: EDI 2011/12, Offord Centre for Child StudiesProduced by: SSMIC-CGC, 2013
11.1 Central Algoma
13.8 East Central SSM14.3 Waterfront
15.4 East Algoma
12.7 Algoma Vulnerability10.3 Ontario Vulnerability
Measures prosocial and helping behaviour,anxious and fearful behaviour, aggressive
behaviour and hyperactivity and inattention
Sault Ste. Marie
North Algoma Central & East Algoma
U.S.A.
³²71
³²71
U.S.A.
³²71
SUDBURY
COCHRANETHUNDER
BAY³²11
1:100,000
1:1,425,000
1:5,000,000
39
Figure 45
The Emotional Maturity domain can be further divided into four subdomains:• Prosocial and Helping Behaviour• Anxious and Fearful Behaviour• Aggressive Behaviour• Hyperactivity and Inattention
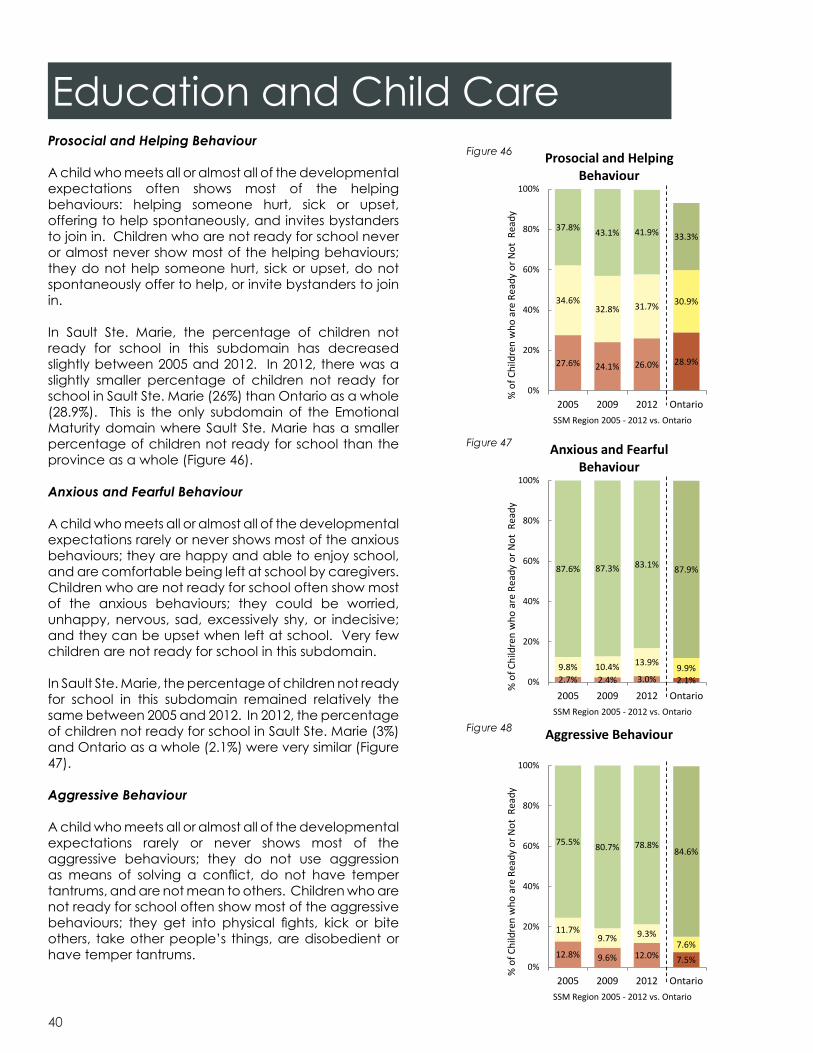
40
Education and Child CareProsocial and Helping Behaviour
A child who meets all or almost all of the developmental expectations often shows most of the helping behaviours: helping someone hurt, sick or upset, offering to help spontaneously, and invites bystanders to join in. Children who are not ready for school never or almost never show most of the helping behaviours; they do not help someone hurt, sick or upset, do not spontaneously offer to help, or invite bystanders to join in.
In Sault Ste. Marie, the percentage of children not ready for school in this subdomain has decreased slightly between 2005 and 2012. In 2012, there was a slightly smaller percentage of children not ready for school in Sault Ste. Marie (26%) than Ontario as a whole (28.9%). This is the only subdomain of the Emotional Maturity domain where Sault Ste. Marie has a smaller percentage of children not ready for school than the province as a whole (Figure 46).
Anxious and Fearful Behaviour
A child who meets all or almost all of the developmental expectations rarely or never shows most of the anxious behaviours; they are happy and able to enjoy school, and are comfortable being left at school by caregivers. Children who are not ready for school often show most of the anxious behaviours; they could be worried, unhappy, nervous, sad, excessively shy, or indecisive; and they can be upset when left at school. Very few children are not ready for school in this subdomain.
In Sault Ste. Marie, the percentage of children not ready for school in this subdomain remained relatively the same between 2005 and 2012. In 2012, the percentage of children not ready for school in Sault Ste. Marie (3%) and Ontario as a whole (2.1%) were very similar (Figure 47).
Aggressive Behaviour
A child who meets all or almost all of the developmental expectations rarely or never shows most of the aggressive behaviours; they do not use aggression as means of solving a conflict, do not have temper tantrums, and are not mean to others. Children who are not ready for school often show most of the aggressive behaviours; they get into physical fights, kick or bite others, take other people’s things, are disobedient or have temper tantrums.
27.6% 24.1% 26.0% 28.9%
34.6%32.8% 31.7% 30.9%
37.8% 43.1% 41.9% 33.3%
0%
20%
40%
60%
80%
100%
2005 2009 2012 Ontario
% o
f Chi
ldre
n w
ho a
re R
eady
or N
ot R
eady
SSM Region 2005 - 2012 vs. Ontario
Prosocial and Helping Behaviour
2.7% 2.4% 3.0% 2.1%9.8% 10.4% 13.9% 9.9%
87.6% 87.3% 83.1% 87.9%
0%
20%
40%
60%
80%
100%
2005 2009 2012 Ontario
% o
f Chi
ldre
n w
ho a
re R
eady
or N
ot R
eady
SSM Region 2005 - 2012 vs. Ontario
Anxious and Fearful Behaviour
12.8% 9.6% 12.0% 7.5%
11.7%9.7% 9.3%
7.6%
75.5% 80.7% 78.8%84.6%
0%
20%
40%
60%
80%
100%
2005 2009 2012 Ontario
% o
f Chi
ldre
n w
ho a
re R
eady
or N
ot R
eady
SSM Region 2005 - 2012 vs. Ontario
Aggressive Behaviour
Figure 46
Figure 47
Figure 48

In Sault Ste. Marie, the percentage of children not ready for school in this subdomain remained relatively the same between 2005 and 2012. In 2012 there were relatively more children not ready for school in Sault Ste. Marie (12%) than Ontario as a whole (7.5%) (Figure 48).
Hyperactivity and Inattention
A child who meets all or almost all of the developmental expectations never shows most of the hyperactive behaviours; they are able to concentrate, settle to chosen activities, wait their turn, and most of the time think before doing something. Children who are not ready for school often show most of the hyperactive behaviours; they could be restless, distractible, impulsive; they fidget and have difficulty settling into activities.
In Sault Ste. Marie, the percentage of children not ready for school in this subdomain decreased slightly between 2005 and 2012. In 2012, there were relatively more children not ready for school in Sault Ste. Marie (14.3%) than Ontario as a whole (12.4%) (Figure 49).
Language & Cognitive Development
The Language & Cognitive Development domain measures reading awareness, age-appropriate reading and writing skills, age-appropriate numeracy skills, the ability to understand similarities and differences, and the ability to recite back specific pieces of information from memory. A child below the 10th percentile “has problems in both reading/writing and numeracy; is unable to read and write simple words, is uninterested in trying, and is often unable to attach sounds to letters; has difficulty remembering things, counting to 20, and recognizing and comparing numbers; and is usually not interested in numbers”23.
In 2011/12, 6.3% of children in Sault Ste. Marie were deemed vulnerable in this domain; up from 4.3% in 2008/09 and up slightly from 6.1% in 2004/05. Sault Ste. Marie children fared the best on this domain compared to the other four. Neighbourhoods ranged from 1.7% to 16.2% vulnerable. Only the West Central SSM neighbourhood had a vulnerability level considerably higher than the province as a whole (Figure 50).
Education and Child Care
16.0% 14.1% 14.3% 12.4%
18.3%15.4% 15.1% 14.3%
65.7% 70.5% 70.6% 73.0%
0%
20%
40%
60%
80%
100%
2005 2009 2012 Ontario
% o
f Chi
ldre
n w
ho a
re R
eady
or N
ot R
eady
SSM Region 2005 - 2012 vs. Ontario
Hyperactivity and Inattention
23. Janus, 2007, pg. 189.
41
Figure 49

42
Education and Child Care
³²71
³²71
CA
RM
EN'S
BAY
North SSM
Far West SSM
West SSM
Far East SSM
East SSM
SSM North Unorg.
West CentralSSM East Central
SSM
Waterfront
SECOND
PIN
E
TRUNK
QUEEN
BLACK
GR
EAT N
OR
THER
N
PIM
WELLINGTON
MCNABB
THIRD
WALLACE
BASE
BRUCE
PEO
PLE
S
ALL
EN'S
SID
E
!(
!(
!(
!(
!(
!(
!(
!(
!(
!(
!(
!(
!( !(
!(
!( Heyden
SpanishSpragge
Echo Bay
Thessalon
Desbarats
Searchmont
Elliot Lake
Blind River
Iron Bridge
Wharncliffe
Bruce Mines
GoulaisBay
HiltonBeach
Batchawana Bay
RichardsLanding
East Algoma
SSM NorthUnorg.
Elliot Lake& Area
Central Algoma
Far EastSSM
Far WestSSM
17
556
129
546
108638
639
810
557
552
532
554
670
563
538
!(
!(
!(
!(
!(
!(
!(
!(
!(
!(
!(
Wawa
Hearst
Chapleau
Marathon
Missanabie
Hornepayne
White River
Manitouwadge
Dubreuilville
Hawk Junction
Montreal RiverHarbour
North Algoma
SSM NorthUnorg.
17
11
101
129
631625
667
546
614
583
639
563
% V
ulne
rabl
e - O
ntar
io B
asel
ine
Sault Ste. Marie & Algoma2011 - 2012 EDI Results
Language & CognitiveDevelopment
1.7 North Algoma
1.9 Far West SSM
2.8 Central Algoma
2.9 Elliot Lake & Area
3.6 Waterfront
6.1 Far East SSM7.7 East Algoma7.8 East SSM
16.2 West Central SSM
6.3 SSM Vulnerability
Note: Colour classification is based on theOntario Baseline.Source: EDI 2011/12, Offord Centre for Child StudiesProduced by: SSMIC-CGC, 2013
4.3 East Central SSM
4.3 SSM North Unorg.4.3 West SSM
4.4 North SSM
3.3 Algoma Vulnerability9.6 Ontario Vulnerability
Measures basic and advanced literacy skills,interest in literacy/numeracy and memory,
and basic numeracy skills
Sault Ste. Marie
North Algoma Central & East Algoma
U.S.A.
³²71
³²71
U.S.A.
³²71
SUDBURY
COCHRANETHUNDER
BAY³²11
1:100,000
1:1,425,000
1:5,000,000
Figure 50
The Language & Cognitive Development domain can be further divided into four subdomains:• Basic Literacy Skills• Interest Literacy/Numeracy and Memory• Advanced Literacy Skills• Basic Numeracy Skills

Basic Literacy Skills
A child who meets all or almost all of the developmental expectations has all the basic literacy skills: knows how to handle a book, can identify some letters and attach sounds to some letters, shows awareness of rhyming words, knows the writing directions, and is able to write their own name. Children who are not ready for school do not have most of the basic literacy skills: they have problems with identifying letters or attaching sounds to them, rhyming; may not know the writing directions and even how to write their own name.
In Sault Ste. Marie, the percentage of children not ready for school in this subdomain increased slightly between 2005 and 2012. In 2012, there were relatively less children not ready for school in Sault Ste. Marie (6.9%) than Ontario as a whole (9.2%) (Figure 51).
Interest Literacy/Numeracy and Memory
A child who meets all or almost all of the developmental expectations shows interest in books and reading, math and numbers, and has no difficulty with remembering things. Children who are not ready for school may not show interest in books and reading, or math and number games, or both; and may have difficulty remembering things.
In Sault Ste. Marie, the percentage of children not ready for school in this subdomain remained relatively the same between 2005 and 2012. In 2012, there were relatively less children not ready for school in Sault Ste. Marie (9.7%) than Ontario as a whole (14.5%) (Figure 52).
Advanced Literacy Skills
A child who meets all or almost all of the developmental expectations has at least half of the advanced literacy skills: reading simple/complex words or sentences, writing voluntarily, writing simple words or sentences. Children who are not ready for school have only up to one of the advanced literacy skills; cannot read or write simple words or sentences; and rarely write voluntarily.
In Sault Ste. Marie, the percentage of children not ready for school in this subdomain increased between 2005 and 2012. In 2012 there were relatively less children not ready for school in Sault Ste. Marie (12%) than Ontario as a whole (15.6%) (Figure 53).
Education and Child Care
5.6% 3.6% 6.9% 9.2%11.3%
8.7%9.6%
17.0%
83.2% 87.7% 83.6%73.6%
0%
20%
40%
60%
80%
100%
2005 2009 2012 Ontario
% o
f Chi
ldre
n w
ho a
re R
eady
or N
ot R
eady
SSM Region 2005 - 2012 vs. Ontario
Basic Literacy
10.4% 8.2% 9.7% 14.5%
11.7%9.8% 11.7%
10.2%
77.9% 82.0% 78.6% 73.8%
0%
20%
40%
60%
80%
100%
2005 2009 2012 Ontario
% o
f Chi
ldre
n w
ho a
re R
eady
or N
ot R
eady
SSM Region 2005 - 2012 vs. Ontario
Interest in Literacy/Numeracy and Memory
8.3% 8.2% 12.0% 15.6%6.2% 5.4%
9.1%9.6%
85.5% 87.1%78.9% 72.8%
0%
20%
40%
60%
80%
100%
2005 2009 2012 Ontario
% o
f Chi
ldre
n w
ho a
re R
eady
or N
ot R
eady
SSM Region 2005 - 2012 vs. Ontario
Advanced Literacy
43
Figure 51
Figure 52
Figure 53
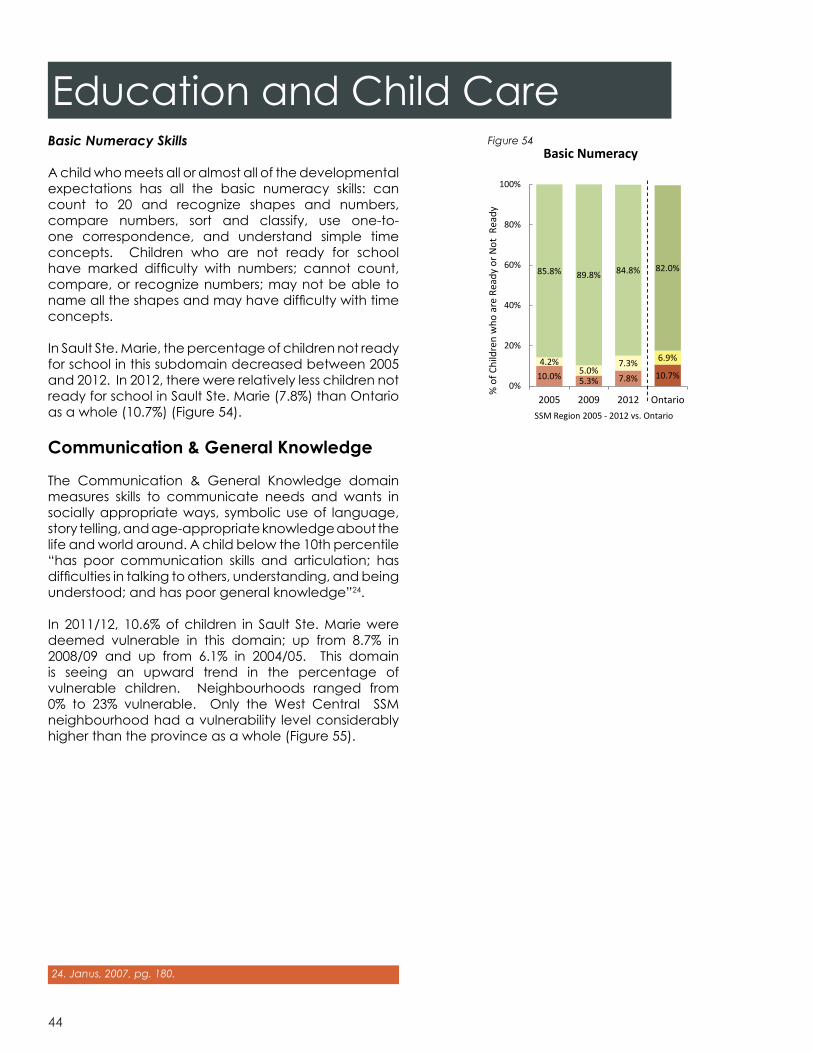
44
Basic Numeracy Skills
A child who meets all or almost all of the developmental expectations has all the basic numeracy skills: can count to 20 and recognize shapes and numbers, compare numbers, sort and classify, use one-to-one correspondence, and understand simple time concepts. Children who are not ready for school have marked difficulty with numbers; cannot count, compare, or recognize numbers; may not be able to name all the shapes and may have difficulty with time concepts.
In Sault Ste. Marie, the percentage of children not ready for school in this subdomain decreased between 2005 and 2012. In 2012, there were relatively less children not ready for school in Sault Ste. Marie (7.8%) than Ontario as a whole (10.7%) (Figure 54).
Communication & General Knowledge
The Communication & General Knowledge domain measures skills to communicate needs and wants in socially appropriate ways, symbolic use of language, story telling, and age-appropriate knowledge about the life and world around. A child below the 10th percentile “has poor communication skills and articulation; has difficulties in talking to others, understanding, and being understood; and has poor general knowledge”24.
In 2011/12, 10.6% of children in Sault Ste. Marie were deemed vulnerable in this domain; up from 8.7% in 2008/09 and up from 6.1% in 2004/05. This domain is seeing an upward trend in the percentage of vulnerable children. Neighbourhoods ranged from 0% to 23% vulnerable. Only the West Central SSM neighbourhood had a vulnerability level considerably higher than the province as a whole (Figure 55).
Education and Child Care
10.0% 5.3% 7.8% 10.7%4.2%
5.0%7.3% 6.9%
85.8% 89.8% 84.8% 82.0%
0%
20%
40%
60%
80%
100%
2005 2009 2012 Ontario
% o
f Chi
ldre
n w
ho a
re R
eady
or N
ot R
eady
SSM Region 2005 - 2012 vs. Ontario
Basic Numeracy
24. Janus, 2007, pg. 180.
Figure 54

Education and Child Care
³²71
³²71
CA
RM
EN'S
BAY
SECOND
PIN
E
TRUNK
QUEEN
BLACK
GR
EAT N
OR
THER
N
PIM
WELLINGTON
MCNABB
THIRD
WALLACE
BASE
BRUCE
PEO
PLE
S
ALL
EN'S
SID
E
!(
!(
!(
!(
!(
!(
!(
!(
!(
!(
!(
!(
!( !(
!(
!( Heyden
SpanishSpragge
Echo Bay
Thessalon
Desbarats
Searchmont
Elliot Lake
Blind River
Iron Bridge
Wharncliffe
Bruce Mines
GoulaisBay
HiltonBeach
Batchawana Bay
RichardsLanding
17
556
129
546
108638
639
810
557
552
532
554
670
563
538
!(
!(
!(
!(
!(
!(
!(
!(
!(
!(
!(
Wawa
Hearst
Chapleau
Marathon
Missanabie
Hornepayne
White River
Manitouwadge
Dubreuilville
Hawk Junction
Montreal RiverHarbour
17
11
101
129
631625
667
546
614
583
639
563
³²71
³²71
³²71
³²11
45
Figure 55
The Communication & General Knowledge domain has only one subdomain:• Communication Skills & General Knowledge
Education and Child CareCommunication Skills & General Knowledge
A child who meets all or almost all of the developmental expectations has excellent or very good communication skills; can communicate easily and effectively, can participate in story-telling or imaginative play, articulates clearly, shows adequate general knowledge, and is proficient in their native language. Children who are not ready for school range from being average to very poor in effective communication, may have difficulty in participating in games involving the use of language, may be difficult to understand and may have difficulty understanding others; may show little general knowledge and may have difficulty with their native language (Figure 56).
In Sault Ste. Marie, the percentage of children not ready for school in this domian increased between 2005 and 2012. In 2012, there were relatively more children not ready for school in Sault Ste. Marie (29.6%) than Ontario as a whole (27.4%).
20.0% 22.9%29.6% 27.4%
23.1% 21.9%20.3% 23.8%
56.8% 55.3% 50.1% 48.7%
0%
20%
40%
60%
80%
100%
2005 2009 2012 Ontario
% o
f Chi
ldre
n w
ho a
re R
eady
or N
ot R
eady
SSM Region 2005 - 2012 vs. Ontario
Communication Skills and General Knowledge
Figure 56
46
Education and Child CareLow in One or More Domains
The following map indicates the percentage of children who were deemed vulnerable in at least one domain.
In 2011/12, one in three (33.2%) children in Sault Ste. Marie were vulnerable in at least one domain; up
from 30.7% in 2008/09, and up from 27.5% in 2004/05. The vulnerability rate has continually risen in Sault Ste. Marie. Neighbourhoods ranged from 21.7% to 44.6% vulnerable. The West Central and West SSM neighbourhoods had vulnerability levels considerably higher than the province as a whole (Figure 57).
³²71
³²71
CA
RM
EN'S
BAY
North SSM
Far West SSM
West SSM
Far East SSM
East SSM
SSM North Unorg.
West CentralSSM East Central
SSM
Waterfront
SECOND
PIN
E
TRUNK
QUEEN
BLACK
GR
EAT N
OR
THER
N
PIM
WELLINGTON
MCNABB
THIRD
WALLACE
BASE
BRUCE
PEO
PLE
S
ALL
EN'S
SID
E
!(
!(
!(
!(
!(
!(
!(
!(
!(
!(
!(
!(
!( !(
!(
!( Heyden
SpanishSpragge
Echo Bay
Thessalon
Desbarats
Searchmont
Elliot Lake
Blind River
Iron Bridge
Wharncliffe
Bruce Mines
GoulaisBay
HiltonBeach
Batchawana Bay
RichardsLanding
East Algoma
SSM NorthUnorg.
Elliot Lake& Area
Central Algoma
Far EastSSM
Far WestSSM
17
556
129
546
108638
639
810
557
552
532
554
670
563
538
!(
!(
!(
!(
!(
!(
!(
!(
!(
!(
!(
Wawa
Hearst
Chapleau
Marathon
Missanabie
Hornepayne
White River
Manitouwadge
Dubreuilville
Hawk Junction
Montreal RiverHarbour
North Algoma
SSM NorthUnorg.
17
11
101
129
631625
667
546
614
583
639
563
% V
ulne
rabl
e - O
ntar
io B
asel
ine
Sault Ste. Marie & Algoma2011 - 2012 EDI Results
Vulnerable in Oneor More Domains
20.0 North Algoma
21.7 SSM North Unorg.
23.2 Waterfront
25.9 Far West SSM
28.2 East Algoma
35.6 North SSM37.9 West SSM40.3 Central Algoma44.6 West Central SSM
33.2 SSM Vulnerability
Note: Colour classification is based on theOntario Baseline.Source: EDI 2011/12, Offord Centre for Child StudiesProduced by: SSMIC-CGC, 2013
28.6 Elliot Lake & Area
31.4 East SSM32.8 East Central SSM
33.3 Far East SSM
29.9 Algoma Vulnerability28.0 Ontario Vulnerability
Percent of children vulnerable in oneor more domains of the EDI
Sault Ste. Marie
North Algoma Central & East Algoma
U.S.A.
³²71
³²71
U.S.A.
³²71
SUDBURY
COCHRANETHUNDER
BAY³²11
1:100,000
1:1,425,000
1:5,000,000
Figure 57
47

48
Low in Two or More Domains
The following map indicates the percentage of children who were deemed vulnerable in at least two domains. Children low in two or more domains are considered less ready to learn than those with one or no vulnerabilities.
In 2011/12, 16.7% of children in Sault Ste. Marie were vulnerable in two or more domains; up from 14.4% in 2008/09, and up from 13.6% in 2004/05. The vulnerability rate of children with multiple vulnerabilities has continually risen in Sault Ste. Marie. Neighbourhoods ranged from 0% to 31.1% vulnerable. The West Central and West SSM neighbourhoods had vulnerability levels considerably higher than the province as a whole (Figure 58).
Education and Child Care
³²71
³²71
CA
RM
EN'S
BAY
North SSM
Far West SSM
West SSM
Far East SSM
East SSM
SSM North Unorg.
West CentralSSM East Central
SSM
Waterfront
SECOND
PIN
E
TRUNK
QUEEN
BLACK
GR
EAT N
OR
THER
N
PIM
WELLINGTON
MCNABB
THIRD
WALLACE
BASE
BRUCE
PEO
PLE
S
ALL
EN'S
SID
E
!(
!(
!(
!(
!(
!(
!(
!(
!(
!(
!(
!(
!( !(
!(
!( Heyden
SpanishSpragge
Echo Bay
Thessalon
Desbarats
Searchmont
Elliot Lake
Blind River
Iron Bridge
Wharncliffe
Bruce Mines
GoulaisBay
HiltonBeach
Batchawana Bay
RichardsLanding
East Algoma
SSM NorthUnorg.
Elliot Lake& Area
Central Algoma
Far EastSSM
Far WestSSM
17
556
129
546
108638
639
810
557
552
532
554
670
563
538
!(
!(
!(
!(
!(
!(
!(
!(
!(
!(
!(
Wawa
Hearst
Chapleau
Marathon
Missanabie
Hornepayne
White River
Manitouwadge
Dubreuilville
Hawk Junction
Montreal RiverHarbour
North Algoma
SSM NorthUnorg.
17
11
101
129
631625
667
546
614
583
639
563
% V
ulne
rabl
e - O
ntar
io B
asel
ine
Sault Ste. Marie & Algoma2011 - 2012 EDI Results
Vulnerable in Twoor More Domains
0.0 SSM North Unorg.
8.9 North SSM
9.7 Central Algoma
10.0 North Algoma
10.7 Waterfront
18.2 Far East SSM18.6 Elliot Lake & Area21.6 West SSM31.1 West Central SSM
16.7 SSM Vulnerability
Note: Colour classification is based on theOntario Baseline.Source: EDI 2011/12, Offord Centre for Child StudiesProduced by: SSMIC-CGC, 2013
11.1 Far West SSM
13.7 East SSM15.4 East Algoma
18.1 East Central
13.3 Algoma Vulnerability13.9 Ontario Vulnerability
Percent of children vulnerable in twoor more domains of the EDI
Sault Ste. Marie
North Algoma Central & East Algoma
U.S.A.
³²71
³²71
U.S.A.
³²71
SUDBURY
COCHRANETHUNDER
BAY³²11
1:100,000
1:1,425,000
1:5,000,000
Figure 58

Education and Child CareBest for Kids Summer Program at Étienne Brûlé Public School
Data from the current and previous EDI implementations has shown an increasing serious rate of vulnerability in physical health and well-being for children living in the downtown area of Sault Ste. Marie. Almost one out of two children in the downtown was shown to be vulnerable in this domain in 2011/12. Mapping has also shown that the downtown of Sault Ste. Marie is the area of the community most lacking in playground equipment. Most of the downtown is more than a kilometre walk from any play or recreation area. As well, children from the downtown have been shown to have the lowest participation rates for any type of sports and recreation activity.
The EDI data was presented to the Sault Ste. Marie Best for Kids Committee (BFK), which is a municipal committee passionately committed to fostering a community that has an extraordinary quality of life for children and families. In response to this information, the BFK committee received support from the Sault Ste. Marie municipal council to pilot a summer day program at Étienne Brûlé Public School.
The City of Sault Ste. Marie committed three students to organize and administer the day program through the summer of 2012 and 2013. Numerous agencies stepped forward to provide funds, programming and support to the summer program including: Algoma Art Gallery, Algoma District School Board, Algoma Family Services, Algoma Public Health, Child Care Algoma, City of Sault Ste. Marie Fire, Police, Social Services and Transit, Sault Ste. Marie Public Library, Sault Ste. Marie Innovation Centre, United Steel Workers Union, YMCA and many others. The day camp sessions were focused on physical activity, arts, crafts and nutrition.
Overall the program was a great success in the first two summers. It is anticipated that the summer day program at Étienne Brûlé will continue.
49

50
Education and Child CareThe Kindergarten Parent Survey 2011/12
The Kindergarten Parent Survey (KPS) is meant to produce additional information on the early life experiences of senior kindergarten children and their families. The goal of the KPS is to help identify factors that can be used towards better preparing pre-grade school children for their learning careers.
The KPS was sent to all parents of children that participated in the Early Development Instrument (EDI) implementation of 2011/2012. Of the 724 surveys sent out in Sault Ste. Marie, 316 were filled in and returned for a response rate of 44%. The 2011/12 KPS response rate in Sault Ste. Marie was nearly identical to the KPS response rate for all of Ontario (44.7%).
The following section outlines the responses to many important KPS questions. Topics include demographics, children’s pre-kindergarten experiences, child care, community spaces, etc. This section also contains comparisons between KPS indicators and EDI vulnerability rates (where applicable). Comparisons between KPS indicators and EDI vulnerability rates help identify factors within the community that potentially influence a child’s development.
It must be noted that because only 44% of eligible parents/guardians chose to fill out and return the survey, the results may be prone to non-response bias. Therefore, the survey may not accurately reflect the entire population of 2011/2012 senior kindergarten children in Sault Ste. Marie.
For example, when the EDI vulnerability rate of children in Sault Ste. Marie is compared between children whose parents/guardians returned the KPS and those who did not, those who did not return the survey were much
more likely to have a vulnerable child (Figure 59). This could be an indication of non-response bias. Because of this possible existence of bias, all of the following KPS charts should be interpreted with caution.
KPS Respondents
Nearly all KPS respondents were mothers (90.5%), had always lived in Canada (88.2%), and spoke English at home (95.3%) (Figures 60,61,62).
88.2%
4.6%1.2%
0.9% 2.5% 2.5%
Years in Canada
Always
>10 yrs
6 - 10 yrs
3 - 5 yrs
<2 yrs
Unanswered
90.5%
3.8%2.5% 3.2%
Relationship to Child
Mother
Father
Other
Unanswered
26.1%
40.5%
33.2%
0%
10%
20%
30%
40%
50%
KPS Returned KPS Not Returned All SSM SKChildren
(from EDI)
Perc
ent o
f Vul
enra
ble
Chi
ldre
n
KPS Return Status
EDI Vulnerability by KPS Return Status Figure 59
Figure 60
Figure 61

Most responding families had two parents living in the home (74.1%). Other parents shared custody (7.3%) or were raising a child on their own (15.2%) (Figure 63).
Family composition can have an effect on the EDI vulnerability of children. It was found that Sault Ste. Marie children who had only one parent had a higher likelihood of being vulnerable in one or more domains of the EDI (35.4% vulnerability rate) than children who had two parents either in the home or sharing custody (Figure 64).
The majority of children moved no more than once over the past five years (69.3%), however 13.4% of children moved three or more times within the past five years (Figure 65).
This is important because frequent moves to a new home may have an impact on a child’s development. In Sault Ste. Marie it has been found that senior kindergarten children who have moved three or more times in their lives are more likely to be vulnerable in one or more domains of the EDI than children who have moved two or less times (Figure 66).
Education and Child Care
73.1%62.5%
78.3%
26.9%35.4%
21.7%
0%
20%
40%
60%
80%
100%
Two Parents AtHome(234)
One Parent
(48)
Two ParentsSharing Custody
(23)
Perc
ent o
f Chi
ldre
n
Family Composition
EDI Vulnerability Rate by Family Composition
Not Vulnerable
Vulnerable
95.3%
0.3%1.9% 2.53%
Language Spoken Most Often at Home (Parent)
English
French
Other
Unanswered
74.1%
15.2%
7.3%
2.8% 0.6%
Family Composition
Two Parents AtHome
One Parent
Two ParentsSharing Custody
Other
Unanswered
2.5%
3.2%
3.2%
7.0%
14.9%
29.1%
40.2%
0% 10% 20% 30% 40% 50%
Unanswered
Five+ Times
Four Times
Three Times
Twice
Once
Never
% Children
Number of Times Child Has Moved(Last 5 Years)
Figure 62
Figure 63
Figure 64
Figure 65
51

52
Education and Child Care
The majority of respondents had completed a post-secondary education (67.4%), and the largest proportion held a college degree or trade certification (40.5%) (Figure 67).
To compare the level of education of the responding parent or guardian to the EDI vulnerability of the child, the respondents that had a graduate or undergraduate degree were grouped into the “University Degree” category and those that had a high school diploma or did not complete high school were grouped into the “High School Diploma or Less” category. It was found that children of respondents that have a high school diploma or less were somewhat more likely to be vulnerable in one or more domains (39.1% vulnerability rate) than children of those who have a college or trade certificate (32% vulnerability rate) and much more likely than children of respondents that have a university degree (11.8% vulnerability rate)(Figure 68). The vulnerability rate of children of respondents that have a university degree is significantly below that of the Sault Ste. Marie average of 33.2%.
Most responding households (57%) had an income of at least $50,000 a year, before taxes. A significant percentage of responding households were earning $30,000 or less (15.2%) (Figure 69).
It was found that EDI vulnerability rates were higher in the lower income households than the higher income households in Sault Ste. Marie. Children who lived in households earning under $17,000 a year had a vulnerability rate of 38.5%, while those living in households earning over $100,000 a year had a vulnerability rate of 19.7% (Figure 70).
75.6% 73.4%
54.8%
24.4% 26.6%
45.2%
0%
20%
40%
60%
80%
Never(127)
Once or Twice(139)
3 or More(42)
Perc
ent o
f Chi
ldre
n
Number of Times the Child Has Moved (Last 5 Years)
EDI Vulnerability Rate by the Number of Times the Child Has Moved (Last 5 Years)
Not Vulnerable
Vulnerable
88.2%
68.0%59.8%
11.8%
32.0%39.1%
0%
20%
40%
60%
80%
100%
University Degree
(85)
College/TradeCertificate
(128)
High SchoolDiploma or less
(92)
Perc
ent o
f Chi
ldre
n
Level of Education of Respondent
EDI Vulnerability Rate by Level of Education of Respondent
Not Vulnerable
Vulnerable
8.2%7.0%
15.5%
11.7%
22.8% 22.5%
12.3%
0%
5%
10%
15%
20%
25%
<$17,000 $17K - $30K $30K-$50K $50K-75K $75K-100K >$100K Unanswered
% K
PS R
espo
nden
ts
Household Income (Before Tax)
61.5% 59.1%
69.4%75.7% 72.2%
80.3%
38.5% 40.9%
28.6%24.3%
27.8%
19.7%
0%
20%
40%
60%
80%
100%
<$17,000(26)
$17K - $30K(22)
$30K-$50K(49)
$50K-75K(37)
$75K-100K(72)
>$100K(71)
Perc
ent o
f Chi
ldre
n
Household Income Group (Before Tax)
EDI Vulnerability Rate by Household Income Group (Before Tax)
Not Vulnerable
Vulnerable
Figure 66
10.4%
16.5%
40.5%
21.8%
7.3%3.5%
0%
10%
20%
30%
40%
50%
Graduate Degree UndergraduateDegree
College/TradesCertificate
High School Did not completeHigh School
Unanswered
% K
PS R
espo
nden
ts
Level of Education of the Respondent
Figure 67
Figure 68
Figure 70
Figure 69
Education and Child CareAs seen in Figure 71, the majority of respondents were employed and working for pay (57.9%), as were their partners (69.6%). A large portion of respondents were caring for family/homemaking (21.2%), as compared to their partners (1.9%). More than half reported that they and their partner worked on average 25 to 49 hours per week (52.9% respondents; 51.9% partners). Partners were reported to work additional hours more frequently than respondents (>50 hours/week, 18.7% partners vs. 5.4% respondents).
Figure 71
53
57.9%
21.2%
4.4%
3.8%
3.8%
3.8%5.1%
Employment Status of Respondent
Working for pay
Caring for family/homemaking
Student
Recovering from illness/disability
Unemplyed and looking for work
Retired
Other
Unanswered
69.6%1.9%
1.3%1.3%1.9%0.6%1.6%
21.8%
Employment Status of Partner

54
Education and Child CareKPS Children
There was an almost even split between the number of boys (50.2%), and girls (49.8%) whose parent or guardian completed the KPS. The majority of these children spoke English as their first language (94.3%), and several spoke French (0.3%) or another language (0.9%) within the home (Figure 72).
The majority of children were either currently or had previously attended a junior kindergarten program (91.4%). The bulk of those children (96.5%) were enrolled in a Full-Day kindergarten program (Figure 73).
Of the 316 KPS respondents, 11.1% of the children identify themselves as an Aboriginal, Metis, Inuit or First Nations person.
A large percentage (45.9%) of KPS respondents indicated that their families include two children, while 22.8% had three children, and 14% of families had four or more children.
When looking to understand a child’s home environment it is helpful to identify that 7% of respondents reported using a community food service at least four times within the last year (Figure 74).
94.3%
0.3%0.9% 4.4%
Language Spoken Most Often At Home (Child)
English
French
Other
Unanswered
85%
4%
3%4%
3%
Visits to Community Food Services in the Last Year
Not At All
1 - 3 Times
4 - 6 Times
7 or More Times
Unanswered
90.5%
0.9%4.1% 4.4%
Children Attending Junior Kindergarten (JK) Program
Yes, at school
Yes, at a locationother than a school
No
Unanswered
Figure 72
Figure 73
Figure 74

1.6%
1.3%
10.8%
40.5%
45.9%
0% 10% 20% 30% 40% 50%
Unanswered
Fair
Good
Very Good
Excellent
Child's General Health
Education and Child CareKPS – Child Health & Development
Children’s health was most often reported to be good, very good, or excellent (97.2%) (Figure 75). Most children were living in smoke-free homes (90.8%). Most families had a regular family doctor or health care provider (94.3%). However, 4.4% did not have a regular family doctor or health care provider.
Children’s “screen time” and their participation in sports provide indicators of their physical activity and their interaction with other children. Most children spent 1-2 hours in front of a screen each day (77.2%), while a small percentage spent over five hours a day (1.3%) (Figure 76).
Children more frequently played sports without a coach, such as biking or skate-boarding (96.6%) compared to those who played with a coach at least once a year (82.0%) including hockey or dance. Very few children in Sault Ste. Marie are not playing any
kind of sport be it with or without a coach. The majority of those who participated in organized (coached) sports, played at least once a week (56%) while 33.2% indicated participating in an organized sport several times a year or less (Figure 77).
Children who played organized sports one to three times a month to more than once a week were grouped as “Often” playing sports, children who participated in organized sports once or several times a year were grouped as “Rarely” playing sports, and children who did not participate were grouped as “Never” playing sports. It was found that EDI vulnerability rates were higher for children never or rarely playing organized sports than those who often played organized sports (Figure 78).
5.7%
77.2%
13.6%
1.3% 2.2%
Child's Screen Time in Hours (TV/Computer/Video Games)
None
1 to 2
3 to 4
5 or more
Unanswered
56.0%
5.4%
11.7%
4.4%
17.1%
5.1%
Child's Participation in Organized (Coached) Sports Within Last Year
Once a Week
1-3 Times a Month
Several Times a Year
Once a Year
Not at all
Unanswered
Figure 75
Figure 76
Figure 77
75.3%70.6%
61.1%
24.7%29.4%
38.9%
0%
20%
40%
60%
80%
Often(194)
Rarely(51)
Never(54)
Perc
ent o
f Chi
ldre
n
Child Pariticipation in Organized (Coached) Sports
EDI Vulnerability Rate by Participation in Organized (Coached) Sports
Not Vulnerable
Vulnerable
Figure 78
55

56
Education and Child CareKPS - Child Care
The majority of infants (0-12 months) were cared for by their parent(s) (78.9%) and a large proportion remained in parental care from ages one to four (Figure 79). Most infants (0-12 months) in non-parental care were in unpaid unlicensed care (7.6%).
Alternative child care services were used more frequently as children got older, with licenced centres remaining more popular than other services (range 14.6% - 29.7%, ages 1-4 years). Children were more likely to move into licensed child care (either home or at a centre) as they got older.
In addition to the existing childcare arrangements, it is important to consider how much time children are spending with their parents as compared to being in the care of others (Figure 80). From birth to age four children spent more hours in parental care than in alternative care arrangements. Most infants (0-12 months) did not spend time in child care (78.9%). As children got older, they spent more time in the care of others. On average 24.4% of all children between the ages of one and four years old spent more than 30 hours per week in non-parental care.
78.9
%
42.7
%
31.3
%
31.3
%
4.1% 14
.6%
23.4
% 29.7
%
2.2%
9.5%
13.0
%
11.1
%
2.8%
12.7
%
11.7
%
9.8%
7.6% 15
.8%
16.1
%
14.2
%
4.4%
4.7%
4.4%
3.8%
0%
10%
20%
30%
40%
50%
60%
70%
80%
90%
0 to 12m 1 to 1.5y 1.5 to 2.5y 2.5 to 4y
Type of Child Care Accessed by Child's Age
Parent Care Only
Licensed Centre
Licensed Home
Paid Unlicensed
Unpaid Unlicensed
Unanswered
Figure 79

Education and Child Care
Reputation, quality of care, cost, and hours of operation were the factors most often considered “very important” in child care choice by KPS respondents (Figure 81). Knowing other families using those services, having access to additional supports, child knowing the caregiver and having the availability of fee subsidies were the factors least often considered “very important” in child care choice by KPS respondents.
Most workplaces (55.2%) did not offer KPS respondents or their partners, if they had a partner, alternative work arrangements to accommodate child care needs. Overall, only 18% of families could make alternative work arrangements to accommodate their child care needs. The most common type of work arrangement was flexible start/end times (40.4%), followed by compressed work week (26.3%), and flex time (16.7%).
6.3%
21.2
% 27.2
%
23.4
%
3.2%
16.5
% 20.6
%
21.2
%
7.0%
10.4
%
12.7
%
14.6
%
78.2
%
44.0
%
33.2
%
33.5
%
5.4%
7.9%
6.3%
7.3%
0%
10%
20%
30%
40%
50%
60%
70%
80%
90%
0 - 12m 1 - 1.5 yrs 1.5 - 2.5 yrs 2.5 - 4 yrs
Hours Spent in Child Care by Child's AgeMore than 30 Hours/Week
21 - 30 Hours/Week
Less than 20 Hours/Week
None- Parent Care Only
Unanswered
6.0%
15.5%
21.2%
26.6%
37.7%
49.1%
53.5%
53.8%
70.6%
73.1%
0.0% 10.0% 20.0% 30.0% 40.0% 50.0% 60.0% 70.0% 80.0%
Knowing other Families
Additional Supports
Child knows Caregiver
Availability of Subsidy
Location
ECE on Staff
Hours
Cost
Quality
Reputation
Factors Considered Very Important in Child Care Choice
Figure 80
Figure 81
57

58
Although there were several instances where both parents took parental leave (9.2%), mothers most often took parental leave from work (57.9%) (Figure 82). Combined parental leave most often ranged between 6 months to a year (47.8%), although several families took parental leave for over one year (19.3%). Some families did not take parental leave (24.7%).
There may be many barriers to parents and caregivers seeking childcare. The top five barriers identified by KPS respondents when looking for childcare are listed in Figure 83. They were: ‘’too expensive”(39.4%), “no space”(25.2%), “hours do not meet needs”(23.7%), “hard to find unplanned care”(20.5%) and “concerns about quality”(19.6%). Of the respondents, 20.8% indicated they felt there were no barriers to child care.
KPS – Parents, Children & Pre-Kindergarten Experiences
Just over a quarter of KPS respondents reported that they had attended a program like Triple-P to help them in their parenting role (26.3%) (Figure 84).
Children’s involvement in community activities was slightly limited; they most frequently made use of play-based programs, public library, and bookstores (Figure 85). Less than half of children participated in literacy programs, music, arts or dance, or visited parenting centres. Fewer than 5% of KPS respondents reported regular participation in children’s clubs, cultural/ethnic programs, or language-based programs and are not included in Figure 85.
Education and Child Care
57.9%
4.7%
9.2%
24.7%
3.5%Parental Leave
Mother
Father
Both
None
Unanswered
26.3%
68.4%
5.4%
0%
10%
20%
30%
40%
50%
60%
70%
80%
Yes No Unanswered
Parenting Program Attendance
Figure 82
Figure 83
Figure 84
19.6%
20.5%
20.8%
23.7%
25.2%
39.4%
0.0% 10.0% 20.0% 30.0% 40.0% 50.0%
Concern about quality
Hard to find unplanned care
None
Hours do not meet needs
No space
Too expensive
Top Barriers When Seeking Child Care

Education and Child Care
It was found that Sault Ste. Marie EDI vulnerability rates varied by the frequency of child attendance to community activities and programs prior to kindergarten. Children who never attended play-based children’s programs such as Best Start Hubs, drop-ins, etc., were more likely to be vulnerable in one or more EDI domains (36% vulnerability rate), than those who attended these programs on a frequent or infrequent basis (Figure 86).
Children who rarely or never attended literacy and family reading programs such as “story times” or Literacy Play, were more likely to be vulnerable in one or more EDI domains (30.3% and 30.1% vulnerability rate respectively) than those who often attended these programs (20.3% vulnerability rate) (Figure 87).
36.9
%
23.1
%
25.5
%
25.0
%
35.6
%
29.7
%
22.7
%
25.8
%
14.1
%
9.9%
43.8
%
44.9
%
40.5
%
51.2
%
60.4
% 65.1
%
20.6
% 25.4
%
0%
10%
20%
30%
40%
50%
60%
70%
Play-Based Program Literacy Program Parenting Centres Music, Arts orDance
Public Library Bookstore
Children's Participation in Community Activities/Programs Prior to Kindergarten
Often
Rarely
Never
78.8% 75.7%
64.0%
21.2% 24.3%
36.0%
0%
20%
40%
60%
80%
100%
Often(113)
Rarely(70)
Never(125)
Perc
ent o
f Chi
ldre
n
Child Attendance Frequency: Play-based Programs
EDI Vulnerability Rate by Attendance in Play-based Programs
Not Vulnerable
Vulnerable
Figure 85
Figure 86
59
79.7%69.7% 69.9%
20.3%30.3% 30.1%
0%
20%
40%
60%
80%
100%
Often(69)
Rarely(76)
Never(153)
Perc
ent o
f Chi
ldre
n
Child Attendance Frequency: Literacy Programs
EDI Vulnerability Rate by Attendance in Literacy Programs
Not Vulnerable
Vulnerable
Figure 87

60
Education and Child CareChildren who never attended parenting and family literacy centres were more likely to be vulnerable in one or more EDI domains (30.8% vulnerability rate) than those who attended these centres on a frequent or infrequent basis (Figure 88).
Children who never attended a music, arts or dance program were more likely to be vulnerable in one or more EDI domains (31.8% vulnerability rate) than those who attended these centres on a frequent or infrequent basis (Figure 89).
The results of EDI vulnerability compared to public library attendance were unexpected. It was found that children that often attended the library were somewhat more likely to be vulnerable on one or more domains (30.3% vulnerability rate) than those who rarely or never attended libraries (Figure 90).
75.0% 78.3%69.2%
25.0% 21.7%30.8%
0%
20%
40%
60%
80%
100%
Often(52)
Rarely(46)
Never(201)
Perc
ent o
f Chi
ldre
n
Child Attendance Frequency: Parent/Family Centres
EDI Vulnerability Rate by Attendance at Parent/Family Centres
Not Vulnerable
Vulnerable
80.0% 80.0%
68.2%
20.0% 20.0%
31.8%
0%
20%
40%
60%
80%
100%
Often(75)
Rarely(30)
Never(198)
Perc
ent o
f Chi
ldre
n
Child Attendance Frequency: Music/Arts/Dance Programs
EDI Vulnerability Rate by Attendance at Music/Arts/Dance Programs
Not Vulnerable
Vulnerable
69.7% 72.4% 74.6%
30.3% 27.6% 25.4%
0%
20%
40%
60%
80%
Often(109)
Rarely(134)
Never(63)
Perc
ent o
f Chi
ldre
n
Child Attendance Frequency: Public Library
EDI Vulnerability Rate by Attendance at a Public Library
Not Vulnerable
Vulnerable
Figure 88 Figure 89
Figure 90

Children who never attended a bookstore were more likely to be vulnerable in one or more EDI domains (39% vulnerability rate) than those who attended these centres on a frequent or infrequent basis (Figure 91).
As a summary of attendance to community activities or programs, children who did not or rarely attended community activities or programs were more likely to be vulnerable in one or more EDI domains (34.8% and 31% vulnerability rates respectively) than those who often attended multiple activities and/or programs (24% vulnerability rate) (Figure 92).
Children did, however, participate fairly frequently in activities with their parent or another close caregiver (Figure 93). More than three-quarters of respondents reported talking with their child on a daily basis about their day (83.5%), and more than half reported reading a story to their child every day (61.4%). Children were more frequently helping out with chores and playing with adults than practicing literacy or numeracy skills to prepare them for school.
In fact, math games and printing letters/numbers were among the least frequent “everyday” activity (23.1% and 24.1% respectively) and amongst the most frequent “never” activities in a week (7% and 17.1% respectively).
The most frequent parenting challenges identified by KPS respondents were “getting child to eat healthy” (18.8%); “lack of family time” (15.8%); “encouraging appropriate behaviour” 14.8%; “family finances” (11.9%); and “getting children ready each day” (11.7%).
76.0%
58.3%
69.0% 65.2%
24.0%
41.7%
31.0% 34.8%
0%
20%
40%
60%
80%
Often attendsmultiple
(150)
Often attends 1;rarely others
(24)
Rarely attendsany(71)
Never attendsany(23)
Perc
ent o
f Chi
ldre
n
Child Attendance Frequency: Community Activities/Programs
EDI Vulnerability Rate by Community Activities/Programs Attendance
Not Vulnerable
Vulnerable
Education and Child Care
73.3% 76.3%
61.0%
26.7% 23.7%
39.0%
0%
20%
40%
60%
80%
100%
Often(90)
Rarely(135)
Never(77)
Perc
ent o
f Chi
ldre
n
Child Attendance Frequency: Bookstore
EDI Vulnerability Rate by Attendance at a Bookstore
Not Vulnerable
Vulnerable
Figure 91
Figure 92
61

62
Education and Child Care
32.0%
35.1%
23.1%
7.0%
2.8%Math Games
9.8%
24.4%
61.4%
1.3% 3.2%Read a Story
27.5%
27.2%
24.1%
17.1%
4.1%Printing Numbers/Letters
25.0%
28.8%
32.0%
11.7%
2.5%Letter Sounds
20.6%
29.4%41.8%
4.7% 3.5%Songs/Rhymes
32.9%
38.0%
18.4%
6.6%4.1%
Arts/Crafts/Drawings
23.1%
31.0%
36.1%
6.0% 3.8%Played Together
2.8%
8.5%
83.5%
0.6%4.4%
Talked Together
13.6%
40.8%
39.9%
1.9%3.8%
Family Physical Activity
22.2%
47.5%
25.6%
1.9% 2.8%Shared Outings
17.1%
31.3%45.6%
3.2% 2.8%Household Chores
2.8%
8.5%
83.5%
0.6%4.4%
Once, or Twice
3 or more times
Everyday
Never
Unanswered
Children’s Participation in Various Activities with KPS Respondents or Other Adults in the Past 7 DaysFigure 93

Education and Child CareKPS - Shared Kindergarten Experiences
The largest barrier to parental involvement in their child’s school or classroom was a lack of time or scheduling conflicts with work (58.7%), followed by caretaking responsibilities for other children (16.8%) (Figure 94). A notable percentage of parents expressed that they were unfamiliar with classroom activities (8.7%), a health issue or disability prevented them from participating in school activities (4.7%), and 4% did not have necessary transportation. Additional challenges included not knowing other parents (2.2%), requiring a police check (1.9%), and not knowing teachers or staff well (1.2%).
More than half of the KPS respondents reported that they had “never” volunteered in the classroom or school of their child (Figure 95), whereas the majority of respondents indicated that they had participated in a school or class event at least once (91.4%). About three quarters (73.1%) of respondents indicated that they had attended parent-teacher conferences and meetings once or twice since the beginning of the school year.
4.0%
4.7%
7.1%
8.7%
16.8%
58.7%
0.0% 20.0% 40.0% 60.0% 80.0%
No Transportation
Health Issue/Disability
Other
Don’t know activties
Hard to get care for other children
Times /conflict with work
Top Challenges to Parents Involvement in School Activities
11.4
% 14.9
%
46.5
%
20.9
%
73.1
%
36.4
%
44.9
%
24.4
%
13.0
%
45.6
%
6.6%
51.3
%
2.5%
3.2%
1.9%
3.5%
0%
10%
20%
30%
40%
50%
60%
70%
80%
Attended a parent-teacherconference?
Attended a general schoolmeeting?
Attended a school or classevent?
Volunteered in the classroomor school?
Parental Involvement in Child's School Since Beginning of School Year
Three of More Times
Once or Twice
Never
Unanswered
Figure 94
Figure 95
63

64
KPS – Community Safety & Safe Spaces
Parent or guardians’ impressions of their community and access to public facilities provide some indication of the safety and services that communities provide to support their children. These impressions, however, can be biased based on geographical location; for example, threats that exist in rural areas are not always similar to those in urban areas (e.g. bears; road safety). This should be considered when examining the overall response for the Sault Ste. Marie population.
The majority of KPS respondents reported feeling that their community was safe for children to play during the day (85.7%), and that there existed safe spaces in which they could do so (78.6%) (Figure 96).
More than half of the respondents felt safe to walk at night (63.7%). Although it was expected that neighbours would watch for trouble (65.1%), this did not necessarily mean that respondents expected neighbours to keep each other’s children safe (57.9%); nor were the neighbours good problem solvers (38.8%). Neighbours were, however, perceived as being likely to help each other out (64.4%) and provide good adult role-models for children (67.1%). The majority of KPS respondents indicated that they lived in a child-friendly community (69.1%) and knew their neighbours (71.9%) (Figure 97).
Safe spaces in the form of public facilities were judged to be, for the majority, accessible to respondents and their families (Figure 98). Cultural centres, however, were judged to be much less accessible than other facilities (26.3%).
Education and Child Care
92.7%
92.4%
92.1%
91.5%
88.0%
80.1%
77.5%
66.1%
63.6%
26.3%
0% 20% 40% 60% 80% 100%
Park/Athletic Field
School
Family/Friends
Grocery Store
Mall/Plaza
Library
Pool
Community Centre
Faith Centre
Cultural Centre
Accessibility of Public Facilities
85.1%
79.4%
63.5%
0% 20% 40% 60% 80% 100%
Safe for Children to Play
Safe Spaces
Safe to Walk at Night
Community Safety
71.9%
69.1%
67.1%
65.1%
64.4%
57.9%
38.8%
0% 10% 20% 30% 40% 50% 60% 70% 80%
I Know My Neighbours
Child-friendly Neighbourhood
Neighbours Role-Model for Children
Neighbours Watch for Trouble
Neighbours Help Each Other
Neighbours Keep Children Safe
Neighbours Solve Problems
Relationship With NeighboursFigure 97
Figure 98
Figure 96

JK and SK Enrolment
As of September 2011, all schools in Sault Ste. Marie have offered a full-day kindergarten program. This means that children are starting school as young as 3.8 years of age. Kindergarten uses play-based learning and structured activities over a regular school day to promote learning in all academic areas, and social and emotional development25.
For the 2013/14 school year, Algoma District School Board had 481 children enrolled in junior kindergarten and 502 enrolled in in senior kindergarten (Figure 99). This was a slight decrease of 47 kindergarteners from the previous school year. The Huron-Superior Catholic District School Board had 239 children enrolled in junior kindergarten and 259 in senior kindergarten during the 2013/14 school year (Figure 100), an increase of 12 children from the previous school year.
École Notre-Dame-du-Sault, of the Conseil scolaire catholique du Nouvel-Ontario, had 30 children enrolled in junior kindergarten and 38 children enrolled in senior kindergarten for the 2013/14 school year, a small increase of one child from the previous year. Additionally, for its first year open, the Conseil scolaire public du Grand Nord de l’Ontario school, École publique Écho-des-Rapides, had 4 students enrolled in junior kindergarten (Figure 101).
There are many before and after school programs offered throughout Sault Ste. Marie that are available for a reasonable fee. These programs are often offered for different age groups, and may be available for older children as well. To see which schools offer before and after school programs, visit www.saultdaycare.ca, and click on “Child Care Providers”, or phone the school for more information.
271
313
287 282 280299
250
288
204
244222
212
249237 239
259
0
50
100
150
200
250
300
350
JK SK JK SK JK SK JK SK JK SK JK SK JK SK JK SK
2006/07 2007/08 2008/09 2009/10 2010/11 2011/12 2012/13 2013/14
Num
ber o
f Stu
dent
s
JK & SK Enrolment for the Huron Superior Catholic District School Board
365
420385 394
340
394 391413
448 440
515 506 506524
481502
0
100
200
300
400
500
600
JK SK JK SK JK SK JK SK JK SK JK SK JK SK JK SK
2006/07 2007/08 2008/09 2009/10 2010/11 2011/12 2012/13 2013/14N
umbe
r of S
tude
nts
JK & SK Enrolment for the Algoma District School Board
Education and Child Care
25. “Full-Day Kindergarten”. Ministry of Education website (http://www.edu.gov.on.ca/kindergarten/whatwillmychildlearnanddo.html). February 15, 2011. Accessed January 9, 2014.
Figure100
Figure 101
Figure 99
65
33
27
3235
30
38
0
5
10
15
20
25
30
35
40
JK SK JK SK JK SK
2011/2012 2012/2013 2013/2014
Num
ber o
f Stu
dent
s
JK & SK Enrolment for French Language Schools
École Notre-Dame-du-Sault École publique Écho-des-Rapides
66
Education and Child CareWhere have we gone since the last report?
The Education and Child Care section of this Best Start Network report builds on the existing indicators selected for the 2011 report. For each indicator, two to three years of data has been added.Licensed Child Care Spaces
The number of licensed child care spaces has risen in SSM. There were a total of 1,664 spaces available in 2013; up from 1,342 in 2011. ▲
Subsidized Licensed Child Care Spaces
The percentage of subsidized spaces declined between 2011 and 2013. Approximately 34% of child care spaces had subsidy available in 2013; down from 43% in 2011. Also, in 2013, 566 families and 690 children were assisted; down from 735 families and 898 children in 2011. ▼
Child Care Service Gaps
Number of operating licensed home child care sites rose from 33 in 2011 to 35 in 2013.• Please note that is number is still well below the 70 homes SSM is licensed for. ▲
EDI: Domain Vulnerability
Vulnerability rates increased in all five domains of the EDI between the 2008/09 and the 2011/12 implementations. The Physical Health and Well-Being domain saw the largest increase in percent vulnerable at 4 percentage points. In SSM in 2011/12 nearly one in four SK-aged children were deemed vulnerable on this domain. The other four domains averaged an increase in the percent of children deemed vulnerable of about 2 percentage points.
▲EDI: General Vulnerability
General vulnerability (low in one or more domains of the EDI) increased between the 2008/09 and the 2011/12 implementations. One in three (33.2%) SK-aged children were vulnerable in at least one domain in 2011/12; up from 30.7% in 2008/09. ▲
EDI: Subdomains The EDI subdomain analysis is a new addition in this report. A comparison with the previous report is not possible. N/A
Kindergarten Parents Survey (KPS)
The KPS result summary is a new addition in this report. A comparison with the previous report is not possible. N/A
School Enrolment JK and SK enrolment both rose for both the Algoma District School Board and the Huron-Superior between the 2010/11 and the 2013/14 school years. Combined, JK enrolment is up by 68 children and SK is up by 77 children during this time.• Please note data for the Conseil scolaire catholique du Nouvel-Ontario and the
Conseil scolaire public du Grand Nord de l’Ontario schools were not available in 2011.
▲

Child & Family
67
Percentage of Families with Children Under 6
Figure 102 shows that in 2010 the Sault Ste. Marie CA had a higher proportion of lone-parent families that had at least one child under 6 years of age than that of Ontario and Canada. In Ontario in 2010, approximately 18.3% of all families with at least one child under 6 years of age were headed by a lone-parent, while in Sault Ste. Marie, 29.2% of families with at least one child less than 6 years of age were headed by a lone-parent.
This indicator is significant because lone-parent families are more likely to be below the poverty level, rent their homes, and are not able to accumulate financial resources due to lower salaries and higher unemployment in comparison to couple families. Depending on the characteristics and parenting quality of the lone-parent, children living in lone-parent families on average are more likely to exhibit behavioural problems and do poorer in school than children living with both parents26.
The following map (Figure 103) shows the proportion of families with young children that were headed by a lone-parent in 2010 by Census Tract (CT). Several CTs of Sault Ste. Marie had a higher proportion of lone-parent families with young children than that of the CA as a whole. The Jamestown/Cathcart area (CT 5900007.00) had the greatest proportion of lone-parent families with young children in Sault Ste. Marie with 54.6%. It is the only CT that had a greater proportion of lone-parent families than couple families.
70.8% 71.4%
81.7% 81.5%
29.2% 29.3%
18.3% 18.5%
0%
10%
20%
30%
40%
50%
60%
70%
80%
90%
Sault Ste. Marie CA District of Algoma Ontario Canada
FAMILY TYPE 2010 - FAMILIES WITH CHILDREN UNDER 6
2010 Couple Parent Families 2010 Lone Parent Families
26. Ambert, Anne-Marie. “One Parent Families: Characteristics, Causes, consequences, and issues”, Vanier Institute for the Family. Accessed online: http://www.vifamily.ca/media/node/396/attachments/oneparent_families.pdf. Ambert, 2006.
Figure 102
Percentage of Families with Children Under 6Median Family Income 2008: All FamiliesYouth Living in Low IncomeFamilies Receiving Social AssistanceBest Start HubsPrenatal Education
Parenting ProgramsParenting and Family Literacy CentresAlgoma Preschool Speech and Language ServicesEarly LiteracyTriple PChildren’s Aid Society of Algoma
In this section...

Child & Family
68
Figure 104 shows that between 2006 and 2010, the percentage of families headed by a lone-parent fluctuated only slightly in both Sault Ste. Marie and Ontario. Sault Ste. Marie shows a very slight upward trend, while Ontario shows a very slight downward trend. However, the gap between Sault Ste. Marie and Ontario has not widened by a significant margin.
5900018.025900009.00
5900100.00
5900018.01
5900011.00
5900008.00
5900001.02
5900017.00
5900010.00
5900015.00
5900004.00
5900016.005900007.00
5900003.00
5900005.00
5900013.005900012.00
5900001.01
5900006.00
5900014.00
5900002.00
Second
Trunk
Pine
Black
Bay
Great Northern
McNabb
Third
Wallace
Bruce
Base
Peoples
Huro
n
KorahAllen's Side
St. George's
Chur
ch
Cathcart
Market
McNabb
SA
UL
T
ST
E.
M
AR
IE
RA
NK
IN
L
OC
AT
IO
N
15
D
Hwy 17
Hwy 638
¯1 Kilometre
10 Kilometres
Families with Children Under 6Headed by a Lone-ParentBy Census Tract (CT) 2010
1 - 14%
15 - 28%
29 - 42%
42 - 55%
No DataSource: Statistics Canada
(SAAD Taxfiler Data)
29.0% 28.7% 28.8% 29.6% 29.2%
18.7% 18.2% 18.0% 17.9% 18.3%
0%
5%
10%
15%
20%
25%
30%
35%
2006 2007 2008 2009 2010
LONE PARENT FAMILIES - FAMILIES WITH CHILDREN UNDER 6
Sault Ste. Marie CA Ontario
Figure 103
Figure 104

Child & Family
69
Median Family Income: All Families
Figure 105 indicates that although couple families in the Sault Ste. Marie CA generally had a median family income slightly above that of Ontario in 2010, the median income for local lone-parent families ($34,290) was significantly less than Ontario ($38,300).
Combined, Figures 102 and 105 indicate that there were more lone-parents who had at least one child under the age of 6 in Sault Ste. Marie in 2010 and they likely had a lower income than lone-parents in other parts of Ontario.
Figure 106 shows that between 2006 and 2010, the median income of couple families in Sault Ste. Marie surpassed the Ontario average. The median income of couple families rose by $7,220 in Sault Ste. Marie between 2006 and 2010, while the median income of couple families in Ontario rose by $5,150. In both Sault Ste. Marie and Ontario, 2009 was the only year that saw a decline in median income from the previous year.
Figure 107 shows a closing gap in median income of lone-parent families between Sault Ste. Marie and Ontario between 2006 and 2010 (however, the difference between Sault Ste. Marie and Ontario is still significant). The median income of lone-parent families rose by $5,590 in Sault Ste. Marie between 2006 and 2010, while the median income of couple families in Ontario rose by $4,000. Unlike the couple families of Sault Ste. Marie, the median income of lone-parent families did not decline between 2008 and 2009.
Youth Living in Low Income
The Low Income Measure After Tax (LIM-AT) is a low income line measured by Statistics Canada. It can be defined as a fixed percentage (50%) of median adjusted after-tax income of households observed at the person level, where ‘adjusted’ indicates that a household’s needs are taken into account27. Statistics Canada maintains that low income lines are not measures of poverty, rather they reflect a consistent and well-defined methodology that identifies those who are substantially worse off than average. This data is available by a limited number of age groups, including youth under the age of 18. LIM-AT data is not available for children under the age of 6.
$79,420
$73,810
$79,050$76,950
$34,290 $33,520
$38,300 $37,050
$0
$10,000
$20,000
$30,000
$40,000
$50,000
$60,000
$70,000
$80,000
$90,000
Sault Ste. Marie CA District of Algoma Ontario Canada
MEDIAN FAMILY INCOME 2010 - BY FAMILY TYPE
2010 Couple Families 2010 Lone-Parent Families
$72,200
$74,960
$78,940
$76,670
$79,420
$73,900
$76,510$78,350
$77,060$79,050
$50,000
$55,000
$60,000
$65,000
$70,000
$75,000
$80,000
$85,000
$90,000
2006 2007 2008 2009 2010
MEDIAN FAMILY INCOME 2006-2010 - COUPLE FAMILIES
Sault Ste. Marie CA Ontario
$28,700$29,760
$30,950 $31,540
$34,290$34,300$35,630
$36,840 $36,780$38,300
$0
$5,000
$10,000
$15,000
$20,000
$25,000
$30,000
$35,000
$40,000
$45,000
2006 2007 2008 2009 2010
MEDIAN FAMILY INCOME 2006-2010 - LONE PARENT FAMILIES
Sault Ste. Marie CA Ontario
Figure 105
Figure 106
Figure 107
27. Statistics Canada, Low-income measure after tax (LIM-AT), July 2013. Accessed online: http://www12.statcan.gc.ca/nhs-enm/2011/ref/dict/fam021-eng.cfm.

Child & Family
70
Approximately 18.5% of the Sault Ste. Marie CA youth population (under the age of 18) lived in low income families in 2010. In comparison to Sault Ste. Marie, 19.7% of Algoma youth and 18.3% of Ontario youth lived in low income families in 2010.
The percentage of youth who lived in low income families in 2010 can also be calculated for each CT in the Sault Ste. Marie CA to serve as a comparison. The following map (Figure 108) indicates that CTs within the older urban core of the city generally fared worse than those closer to the urban fringe and rural areas of the city. The CTs that had the highest proportion of youth under the age of 18 living in low income families
were the Downtown (5900006.00) with 41.1%, the Jamestown/Cathcart area (5900007.00), with 37.2%, and the Garden River and Rankin Reserves (5900100.00) with 42.4%.
5900018.025900009.00
5900100.00
5900018.01
5900011.00
5900008.00
5900001.02
5900017.00
5900010.00
5900015.00
5900004.00
5900016.005900007.00
5900003.00
5900005.00
5900013.005900012.00
5900001.01
5900006.00
5900014.00
5900002.00
Second
Trunk
Pine
Black
Bay
Great Northern
McNabb
Third
Wallace
Bruce
Base
Peoples
Huro
n
KorahAllen's Side
St. George's
Chur
ch
Cathcart
Market
McNabb
SA
UL
T
ST
E.
M
AR
IE
RA
NK
IN
L
OC
AT
IO
N
15
D
Hwy 17
Hwy 638
¯*Low Income Measure - After Tax: a fixed percentage (50%) of median adjusted after-tax income of households observed at the person level (Statistics Canada).
1 Kilometre
10 Kilometres
Percent of Persons Under 18Living in Low Income (LIM-AT*) By Census Tract (CT) 2010
5 - 10%
10.1 - 20%
20.1 - 35%
35.1 - 42%
No DataSource: Statistics Canada
(SAAD Taxfiler Data)
Figure 108

Child & Family
71
Figure 109 shows that between 2006 and 2010, the percentage of youth under the age of 18 living in low income families in Sault Ste. Marie had declined from a high of 23% in 2008 to 18.5% in 2010. Ontario had hovered around the 20% mark between 2006 and 2009, but had dropped to 18.3% in 2010. Between 2006 and 2009, Sault Ste. Marie had a constantly higher percentage of youth living in low income families than that of Ontario; however, in 2010 the percentages were nearly the same.
Families Receiving Social Assistance
Ontario has two social assistance programs to help eligible residents who are in financial need. Ontario Works helps people who are in temporary financial need and the Ontario Disability Support Program (ODSP) helps people with disabilities.
Approximately 12.6% of families in the Sault Ste. Marie CA received income support from social assistance in 2010. In comparison to Sault Ste. Marie, 12.8% of Algoma families and 8.6% of Ontario families received income support from social assistance in 2010.
The percentage of families receiving social assistance in 2010 can also be calculated for each CT in the Sault Ste. Marie CA to serve as a comparison. Like most other indicators relating to income, Figure 110 indicates that CTs within the older urban core of the city generally fared worse than other areas of the city. The CTs that had the highest proportion of families receiving social assistance were the Downtown (5900006.00) with 29.3%, the Jamestown/Cathcart area (5900007.00), with 41.8%, and the Bayview area (5900008.00) with 24.3%.
21.4%22.4% 23.0% 22.6%
18.5%20.0% 19.8% 20.1% 20.1%
18.3%
0%
5%
10%
15%
20%
25%
30%
2006 2007 2008 2009 2010
YOUTH LIVING IN LOW INCOME FAMILIES 2006-2010
Sault Ste. Marie CA Ontario
Why do we look at after-tax income data?
The number of people falling below the cut-offs has been consistently lower on an after-tax basis than on a before-tax basis. This is because of the tax system in Canada, where those with more income are taxed at a higher rate than those with less. These “progressive” tax rates compress the distribution of income. Therefore, some families in low income before taking taxes into account are relatively better off and not in low income on an after-tax basis.
http://www.statcan.gc.ca/pub/75f0002m/2012002/lico-sfr-eng.htm
Figure 109
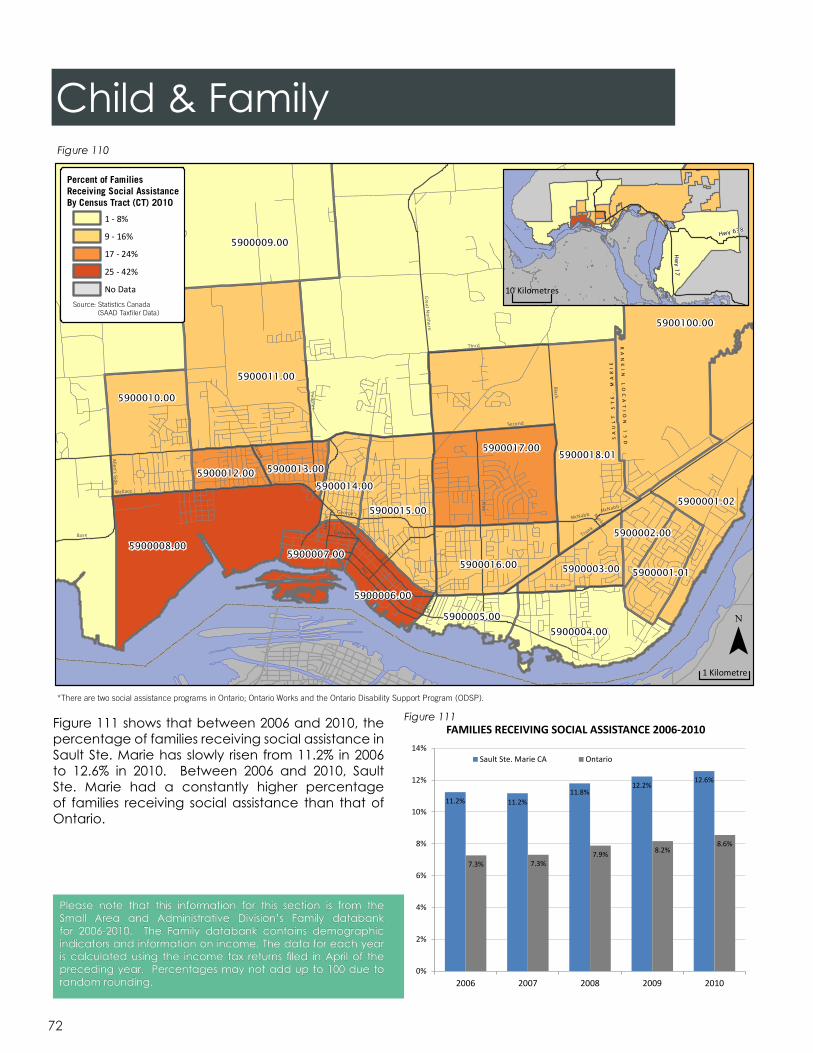
Figure 111 shows that between 2006 and 2010, the percentage of families receiving social assistance in Sault Ste. Marie has slowly risen from 11.2% in 2006 to 12.6% in 2010. Between 2006 and 2010, Sault Ste. Marie had a constantly higher percentage of families receiving social assistance than that of Ontario.
Child & Family
72
11.2% 11.2%11.8%
12.2%12.6%
7.3% 7.3%7.9% 8.2%
8.6%
0%
2%
4%
6%
8%
10%
12%
14%
2006 2007 2008 2009 2010
FAMILIES RECEIVING SOCIAL ASSISTANCE 2006-2010
Sault Ste. Marie CA Ontario
Figure 111
5900018.025900009.00
5900100.00
5900018.01
5900011.00
5900008.00
5900001.02
5900017.00
5900010.00
5900015.00
5900004.00
5900016.005900007.00
5900003.00
5900005.00
5900013.005900012.00
5900001.01
5900006.00
5900014.00
5900002.00
Second
Trunk
Pine
Black
Bay
Great Northern
McNabb
Third
Wallace
Bruce
Base
Peoples
Huro
n
KorahAllen's Side
St. George's
Chur
ch
Cathcart
Market
McNabb
SA
UL
T
ST
E.
M
AR
IE
RA
NK
IN
L
OC
AT
IO
N
15
D
Hwy 17
Hwy 638
¯*There are two social assistance programs in Ontario; Ontario Works and the Ontario Disability Support Program (ODSP).
1 Kilometre
10 Kilometres
Percent of FamiliesReceiving Social AssistanceBy Census Tract (CT) 2010
1 - 8%
9 - 16%
17 - 24%
25 - 42%
No DataSource: Statistics Canada
(SAAD Taxfiler Data)
Figure 110
Please note that this information for this section is from the Small Area and Administrative Division’s Family databank for 2006-2010. The Family databank contains demographic indicators and information on income. The data for each year is calculated using the income tax returns filed in April of the preceding year. Percentages may not add up to 100 due to random rounding.
Child & Family
73
Best Start Hubs
Services
Best Start Hub services provide both parent and child oriented programs and are available and accessible to all young children and their families. Services support both children’s healthy development and provide parents with new skills to support their children. The child and family-centred services offer:• Early learning interactive programs for parents,
caregivers and children• Skill-based curriculum promoting early literacy and
skill development • Parent and caregiver education to support
relationships with their children • Pre- and post-natal resources information and
support • Child focused early learning programs and activities
promoting child development • Information and referrals to link families with
specialized services • Outreach programs to encourage and support
participation across the community• Early and on-going screening of all children.
Best Start Hubs provide programming that supports play and inquiry-based learning opportunities for children. The program and activities change to reflect the emerging needs of the child. While age may provide a guide, Early Years Educators observe the children to determine each child’s particular needs, strengths and interests. In addition, Early Years Educators use common stages of development to determine age appropriate activities that are flexible enough to allow each child’s individual growth. Opportunities are provided for spontaneous free play offering a wide range of activities to enhance the developmental domains.
The drop-in environments are designed to encourage children to explore, create and discover. Activities provide rich, varied stimulation which children absorb and integrate into core brain development.
Parent and Family Support
Best Start Hubs provide parent and caregiver education on a variety of topics, facilitating one-to-one discussions, small group sessions, large group presentations and peer support networks. Best Start Hubs coordinate services that are reflective and responsive to individual, family and community strengths and needs, sensitive to
the social, linguistic and cultural diversity of families and communities, including Francophone and Aboriginal communities. Hubs are staffed by Early Years Educators that have an appropriate range of skills and abilities necessary to respond effectively to the needs of adults, children and their families. Parent/caregiver education focuses on healthy child development and the skills and strategies necessary for parents to promote the individual child’s readiness to learn. Educational activities help parents expand their knowledge of child development, nutrition and behaviour management, increasing their awareness of community resources, enhancing their confidence in their parenting skills and strengthening their parent-child relationships. We work in partnership with community agencies in publishing the Parenting Matters Newsletter, which is a quarterly newsletter for parents, caregivers, and professionals that outlines in detail all of the upcoming parenting programs and services. This newsletter is circulated not only in the City of Sault Ste. Marie but is also available on the Child Care Algoma website (www.childcarealgoma.ca).
Parenting Programs
Best Start Hubs offer a wide range of evidenced-based programming, including (but not limited to) the many listed programs below. In 2013, the SSM Best Start Hubs exceeded expectations and supported over 1800 parents in their parenting role.
Best Start Hubs have certified practitioners in the Triple P Positive Parenting Program who help to create a positive, caring relationship between children and families with easy to use tips and new ideas that help build confidence. Participants in the program learn new parenting skills in developing positive relationships, encouraging desirable behaviour, teaching children new behaviours and skills and managing misbehaviour.
Best Start Hubs offer community-based prevention programs such as the Empathy Belly which is a powerful tool that focuses on teen pregnancy, childbirth education, life skills education and prenatal care.
Certified Infant Massage Instructors build on the importance of attachment through the facilitation of stimulating forms of touch that nourish the relationship between the parent and child. Massage enhances an infant’s feelings of warmth, relaxation, security, comfort and it leads to a healthier, happier childhood and
adulthood.
Certified Roots of Empathy instructors focus on raising levels of empathy in children resulting in more respectful and caring relationships, while reducing levels of bullying and aggression. The program includes visits to the classroom every three weeks over the school year by a neighbourhood infant and parent. Students observe the baby’s development, celebrate milestones, interact with the baby and learn about an infant’s needs and temperament.
Early supports through the use of the Nipissing District Developmental Screen provide parents with the opportunity to follow their child’s growth and development examining the thirteen key developmental stages. Based on screening results, registration is initiated and/or specialized services are referred through the local access mechanism.
Early Years Educators are certified Car Seat Technicians who educate parents on current regulations, selecting appropriate car/booster seats based on height and weight and provide specific steps necessary to ensure the correct installation of the car/booster seat in the vehicle. Technicians stay up-to-date with obtaining recall notices and attend specialized training.
Certified staff in the Rainbow Kids Yoga facilitate the Parent and Baby Yoga which nurtures and strengthens your body and your relationship with your baby through gentle techniques for calmness, happiness and mother-child bonding. Certified staff facilitate Parent and Toddler Yoga, which provides fun, developmentally-appropriate yoga with postures, games, rhymes and songs for toddlers to do with their parents or caregivers.
Trained leaders at the Best Start Hubs guide the Family Math interactive sessions, where parents and their children are actively involved in activities that reinforce skills and the understanding of math concepts, to enhance children’s success upon entry into kindergarten.
Best Start Hubs engage in ongoing evaluation to ensure program effectiveness. Evaluations help to determine successes, what to continue doing, what should be done differently and what to consider for future planning. Annual planning will continue to be a process through which partners are consulted to assist in determining the mix and levels of services to meet the needs and priorities. As a key partner at the Best Start Network table, the Hubs are committed to integration and collaboration with community
partners to ensure that the community moves along the continuum of system integration. In addition, the goal of the Hubs is to ensure that there are supports and services to represent cultural and linguistic diversity in the community.
Best Start Hub Locations
Best Start Hubs provide families and caregivers with universally accessible programs, services and resources in easily accessible locations.
Outreach programs and services are designed to provide a gateway that links children and families to community services and supports. Additional services are available at Willowgrove United Church, Mountain View School in Goulais River and Aweres School in Heyden.
Over the past year the Aboriginal Best Start Hub has been involved in a number of initiatives supported by the Aboriginal Planning Committee of the Best Start Network. Native Language Learning opportunities were offered to children accessing programs at the Indian Friendship Centre. Programming related to special events, traditional parenting, breastfeeding support as well as child safety have also been offered and well attended by families of the community. In addition there were over 500 drop in visits recorded.
Partners from the Métis Nation of Ontario, Waabinong Head Start and the Indian Friendship Centre have received training and participate in the Triple P Initiative in our community.
Child & Family
74

Child & Family
75
Aweres185 Highway 556, Heyden, ON
102-A Wellington Street East Serving Central / All of SSM
Best Start HubHoly Angels SchoolHours of OperationMon. to Thurs.9 a.m. to 4:30 p.m.Fri. 9 a.m. to 4 p.m.
(705) 945-8898 ext. 255www.childcarealgoma.ca
Best Start HubHoly Cross SchoolHours of OperationMon., Wed., Thurs., Fri.9 a.m. to 5 p.m.EVENING HOURS:Tues. 9 a.m. to 7 p.m.Sat. 10 a.m. to 2:30 p.m.
(705) 945-8898 ext. 303www.childcarealgoma.ca 16 Texas AvenueServing East / All
of SSM
Best Start HubIndian Friendship CentreHours of OperationMon. to Fri.8:30 a.m. to 4:30 p.m.Open some evenings for programs
122 East Street Serving Aboriginal Families
Carrefour Meilleur départÉcole Notre-Dame du SaultParenting and Child focussed programs are offered to the Francophone community. For more information, please call (705) 945-8898 ext. 255 600 rue nord
Serving Francophone Families
3042 Second Line WestServing West End/Sault North/
All of SSM
Best Start HubPrince Township Community CentreHours of OperationMon. to Fri.9 a.m. to 3 p.m.Sat. 10 a.m. to 3 p.m.EVENING HOURS:Thurs. 6 p.m. to 8 p.m.Best Start Hubs North
of Sault Ste. MarieAdditional services are available at the Hubs north of SSM.
Mountain ViewMahler Road, Goulais, ON

Child & FamilyBest Start Hub Drop-In Visits
In 2013, there were 20,763 child drop-in visits recorded for Holy Angels School, Prince Township Community Centre, Holy Cross School and the Sault North Hubs. This number includes multiple visits by the same child. This marked an increase from 2010, when 17,784 child drop-in visits were recorded. Please note that at the time of publication, numbers for the Indian Friendship Centre and Notre-Dame du Sault were unavailable.
Figures 112 and 113 show the breakdown of visits to each Best Start Hub for 2009 through to 2013. Holy Angels School (which replaced the Station Mall Ontario Early Years Centre in mid-2008) saw the most child visits in 2010, while Prince Township had the most visits in 2011 and again in 2012. Holy Cross opened in December of 2012, and had the highest number of visits of any site in the last 5 years with 9,282 child visits.
76
LocationChild Visits Adult Visits
2009 2010 2011 2012 2013 2009 2010 2011 2012 2013Child Care Algoma - Dacey Road
4,405 3,521 2,590 4,202* - 2,094 2,053 1,570 1,897* -
Holy Angels School
5,929 7,042 5,057 3,305 3,410 5,016 5,613 3,348 2,712 2,805
Prince Twp.
6,988 6,303 6,187 8,990 6,459 4,621 4,156 3,728 6,590 4,351
Sault North Sites
1,442 918 988 1,057 1,066 1,055 685 584 701 573
Holy Cross
- - - 351 9,828 - - - 216 6,523
Total 18,764 17,784 14,822 17,905 20,763 12,786 12,507 9,230 12,116 14,252
Figure 112
* Please note that Child Care Algoma Dacey Road Best Start Hub moved to Holy Cross in December 2012. Therefore, the Dacey Road 2012 visits only include the months of January to November, and the Holy Cross 2012 visits are only visits from December.**Please note that numbers for the IFC and Francophone Hubs are not included in this publication.

Figure 114 shows Best Start Hub 2013 child drop-in visits by Census Tract (CT) of residence. As the volume of visitors varies greatly within the CA, maps such as these help indicate what neighbourhoods most child drop-in visitors are coming from and what neighbourhoods seem to have lower than expected attendance. Since Best Start Hubs partially rely on word-of-mouth advertising to promote services, it is possible that caregivers in the lower volume CTs may not be hearing about the hubs from a friend or family member. The map (Figure 114) simply shows number of child drop-in visits by CT to any of the four Hubs noted in Figure 113, from light orange (low volume) to dark orange (high volume).
Child & Family
77
Holy Cross
Holy Angels
Allen'sSide
Lyons
Pim
Base
Korah
Gore
Huro
n
St. George's
Peoples
Bruce
Wellington
Wallace
Queen
Great Northern
Bay
Cathcart
Third
Carm
en's
McNabb
Chur
ch
Second
Pine
Trunk
Blac
k
5900004.00
5900001.02
5900018.02
5900018.01
5900015.00
5900017.00
5900016.005900003.00
5900002.00
5900001.01
5900011.00
5900014.00
5900005.00
5900006.00
5900007.00
5900012.005900013.00
5900010.00
5900009.00
5900008.00
5900100.00
Aweres
Mountain View
PrinceTownship
Please note that visits to the Indian Friendship Centre and Notre-Dame du Sault are not counted in this map.
1 Kilometre
10 Kilometres
BSH/OEYC 2013 Child Drop-in Visitsby Census Tract (CT)
20,763 total visits (19,644 mapped)
184 to 500 visits
501 to 1,500 visits
1,501 to 2,000 visits
2,001 to 2,500 visits
Over 2,500 visits
Figure 114
4,405
5,929
6,988
1,442
3,521
7,042
6,303
918
2,590
5,057
6,187
988
4,202
3,305
8,990
1,057
9,282
3,410
6,459
1,066
0 2,000 4,000 6,000 8,000 10,000
Holy Cross
Dacey Road
Holy Angels
PrinceTownship
Sault North
Child Visits to Best Start Network Hubs 2009 - 201320132012201120102009
Figure 113

In Figure 115, 2013 child drop-in visitor information is represented by pie charts. The size of the pie chart indicates the number of child visits to any hub by CT. A large pie indicates a heavy volume of visits to any hub, while a small pie indicates few visits. The pie ‘slices’ indicate the proportion of child visits to a certain hub location (out of 100) for that particular CT. Hubs are colour coded light green for Holy Cross (which moved from Child Care Algoma -Dacey Road in December of 2012), light blue for Holy Angels, darker green for the Prince Township Hub and dark blue for the Sault North sites. The map background layer coloured yellow to dark red indicates the number of children aged 0 to 6 by CT (as seen in the Community Overview section of this report, Figure 4).
This map allows for a quick comparison between the number of visits and the population of children aged 0
to 6 for each CT. Neighbourhoods with a larger number of children and a lower volume of visits to the Best Start Hubs can be identified. For example, the Korah Road and Moss Road area (CT 5900011.00) of Sault Ste. Marie is a neighbourhood with a relatively large population of children aged 0 to 6 but a low volume of children attending drop-in services at a local Best Start Hub.
Furthermore, each CT can be examined to determine which Hub is preferred for those residents, as indicated by the pie ‘slices’ in the charts. Prince Township Hub draws visitors from all around the city, even though Prince is located in the far western portion of the Sault Ste. Marie CA. Since opening in December of 2012, Holy Cross has become the dominant Hub for the residents residing in the East End of the city. Conversely, the Sault North sites see very few children from the city of Sault Ste. Marie.
Child & Family
78
Hwy 17Second
Trunk
Pine
Black
Bay
Wellington
Pim
Great Northern
McNabb
Third
Wallace
Bruce
Carm
en's
Base
Peoples
Huro
n
Korah
Lyons
Allen'sSide
St. George's
Highway
17
Bennett
Gore
Chur
ch
Cathcart
Market
McNabb
Hwy
17
Hwy 556
Hwy 638
Hwy 552 Hwy
532
Please note that Child Care Algoma (Dacey Road) Best Start Hub moved to Holy Cross Catholic School in December 2012.
Holy Cross
Holy Angels
Mountain View
Aweres
PrinceTownship
Number of Children Age 6 and UnderBy Census Tract (CT) 2011
Proportion of 2013 BSH Visits to SitesBy Census Tract (CT)
1 Kilometre
10 Kilometres
(Pie size indicates thenumber of visits per CT)
Sault North Sites
Holy Cross
Holy Angels
Prince Township
60 - 125
126 - 175
176 - 250
251 - 325
326 - 515
No Data
Figure 115

Child & Family
79
Best Start Hubs: Access to Transportation - Update
The 2011 Best Start Network Report indicated that the Holy Angels Best Start Hub, located in the downtown, lacked bus stops within a 300 to 400 metre walk. Research has shown that an average person will walk about 5 minutes or 400 metres to reach a bus stop (assuming a walking speed of 80 m/min). This distance may be less if this person is escorting children aged 0 to 6. The nearest bus stops south of Wellington Street required the pedestrian to cross that road to access the centre. There are no crosswalks between Gore and Bruce Streets. Adult visitors to Best Start Hubs are usually escorting small children (possibly in a stroller) and often carrying bags. It can be difficult to walk long distances under these circumstances. This was cited as a potential barrier to access for visitors who rely on public transportation.
These findings were presented to Sault Ste. Marie Transit Services in November of 2011. SSM Transit agreed with the findings of the Best Start Network and subsequently changed the North Street bus route. A new bus stop was placed on the north side of Wellington Street East, in the immediate vicinity of the Holy Angels Best Start Hub building.
Prenatal Education
Pregnancy is a time when women are highly motivated to improve their health. For many expectant parents, it is also the first time they actively seek out health information and community services. Health and social service providers working with pregnant women have a unique opportunity to screen and identify risks, such as family violence, mental health, addiction, and poverty, which can negatively impact maternal health, birth outcomes and child development. As such, they can put supports in place before the baby arrives to mitigate negative outcomes. Two examples of supportive programs that build parenting knowledge and skills include the Canada Prenatal Nutrition Program and the Healthy Babies Healthy Children Program.
Although prenatal education sessions are only one of many factors that contribute to a healthy pregnancy, they encourage expectant parents to take an active and informed role in making decisions about their pregnancy, birth, and newborn. Algoma Public Health (APH) provides a variety of prenatal education options that cater to various schedules and learning styles, including evening, daytime, teen, and online
options. Gaining knowledge and skills for healthy choices, preparation for childbirth, and breastfeeding increases parental confidence and ability to cope with challenges.
From April 1, 2012 to March 31, 2013, 196 pregnant women (most were first time mothers) and their partners attended at least one APH prenatal class in Sault Ste. Marie. During that same time period, there were 429 deliveries to first time mothers at Sault Area Hospital. This suggests that about 46% of first time pregnant women who delivered at SAH attended at least one prenatal session at Algoma Public Health. The addition of an online prenatal education option may increase the reach to those who do not wish to participate in prenatal groups.
Parenting Programs
The Young Parents Connection (YPC) program has been running successfully for 8 years. In 2013, 117 different youth accessed the program. On an average approximately 25 - 30 young parents ages 15 - 25 participate weekly in the program. The goal of YPC is to support young parents in improving the health and well being of their families by providing them information, skill building activities and social support through a weekly event in which partner agencies collaborate.
The community partners include Algoma Public Health, Children’s Aid Society, Child Care Algoma/Best Start Hub, Ontario Works, Red Cross, Sault College, The Pregnancy Centre, Women in Crisis, YMCA, and new to the committee is Algoma District School Board.
These partners are able to provide a large variety of evidence based programming to include prenatal, after the baby and toddler groups. Each year the YPC committee facilitates a “Check-In” with the youth to identify areas of improving program delivery and what interests that they may have regarding their learning as parents. This information assists in developing the program calendar. The 2013 program calendar included Triple P, an information session provided by SSM City Police on Cyber Bullying, “Makeover Night” for the young mothers and Red Cross Fathers Kitchen, and a Job Fair assisted by Ontario Works to get youth ready for employment.
As a committee, YPC strives on supporting the young
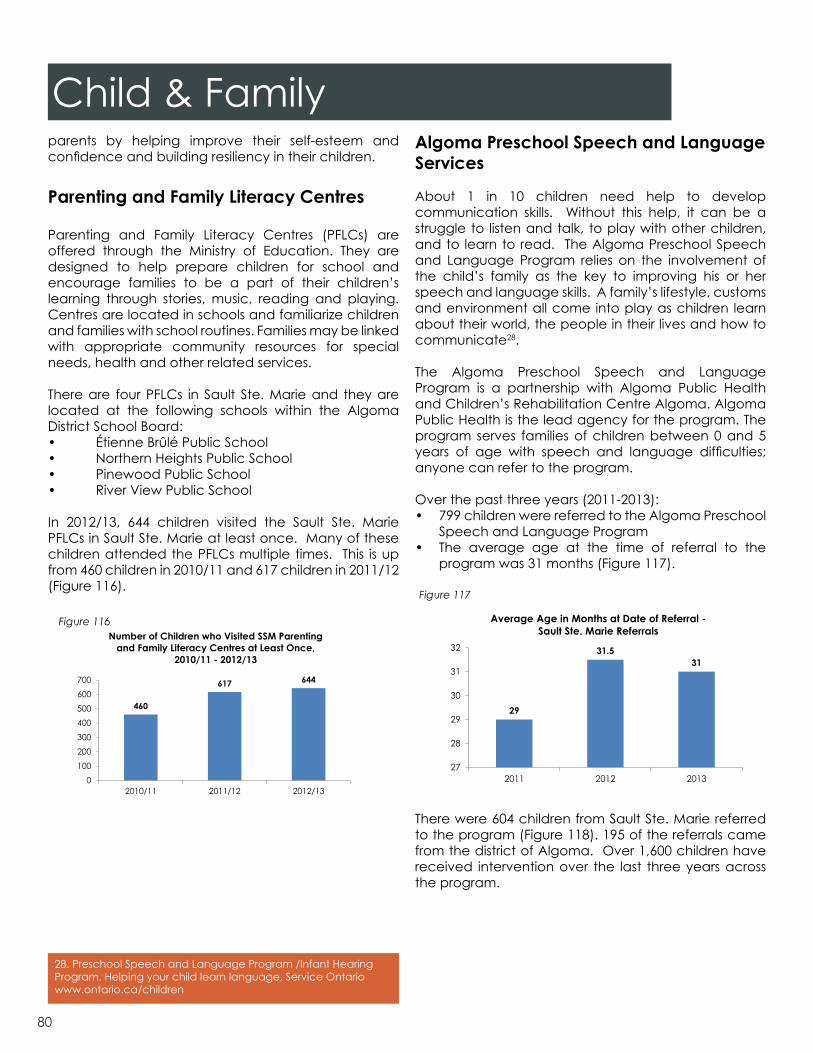
parents by helping improve their self-esteem and confidence and building resiliency in their children.
Parenting and Family Literacy Centres
Parenting and Family Literacy Centres (PFLCs) are offered through the Ministry of Education. They are designed to help prepare children for school and encourage families to be a part of their children’s learning through stories, music, reading and playing. Centres are located in schools and familiarize children and families with school routines. Families may be linked with appropriate community resources for special needs, health and other related services.
There are four PFLCs in Sault Ste. Marie and they are located at the following schools within the Algoma District School Board:• Étienne Brûlé Public School• Northern Heights Public School• Pinewood Public School• River View Public School
In 2012/13, 644 children visited the Sault Ste. Marie PFLCs in Sault Ste. Marie at least once. Many of these children attended the PFLCs multiple times. This is up from 460 children in 2010/11 and 617 children in 2011/12 (Figure 116).
Algoma Preschool Speech and Language Services
About 1 in 10 children need help to develop communication skills. Without this help, it can be a struggle to listen and talk, to play with other children, and to learn to read. The Algoma Preschool Speech and Language Program relies on the involvement of the child’s family as the key to improving his or her speech and language skills. A family’s lifestyle, customs and environment all come into play as children learn about their world, the people in their lives and how to communicate28.
The Algoma Preschool Speech and Language Program is a partnership with Algoma Public Health and Children’s Rehabilitation Centre Algoma. Algoma Public Health is the lead agency for the program. The program serves families of children between 0 and 5 years of age with speech and language difficulties; anyone can refer to the program.
Over the past three years (2011-2013):• 799 children were referred to the Algoma Preschool
Speech and Language Program• The average age at the time of referral to the
program was 31 months (Figure 117).
There were 604 children from Sault Ste. Marie referred to the program (Figure 118). 195 of the referrals came from the district of Algoma. Over 1,600 children have received intervention over the last three years across the program.
460
617 644
0100200300400500600700
2010/11 2011/12 2012/13
Number of Children who Visited SSM Parenting and Family Literacy Centres at Least Once,
2010/11 - 2012/13
Child & Family
29
31.531
27
28
29
30
31
32
2011 2012 2013
Average Age in Months at Date of Referral -Sault Ste. Marie Referrals
Figure 116
Figure 117
28. Preschool Speech and Language Program /Infant Hearing Program, Helping your child learn language, Service Ontariowww.ontario.ca/children
80

Children and their parents participated in one or more of the following interventions in a variety of locations (e.g., clinic, child care or schools):• Parent training (e.g., It Takes Two to Talk® Hanen,
Wee Talk)• Parent-child groups (e.g., Toddler Talk)• Group therapy (e.g., early language groups,
speech production groups)• Individual therapy• Caregiver consultation and home programming
If you have concerns about your child’s speech and language skills, please call the Parent Child Information Line at (705) 541-7101 or 888-537-5741.
Early Literacy
The Early Literacy Practitioner (ELP) has supported and strengthened the promotion of early literacy and language development in the community. The ELP has partnered with local programs to cultivate literacy-rich environments. Early Literacy has and will continue to include a large range of programs, depending on the community needs and requests from local service providers, schools, and child care programs. The ELP has provided a number of “train the trainer” workshops for staff working with children to support their early literacy programming. The ELP has also worked directly with parents in supporting their efforts with their own children. The ELP has worked collaboratively with the local libraries and other recreational/cultural programs in supporting their efforts to develop and/or support a cohesive community early literacy strategy. The Social Communication School Readiness Program is offered at the Best Start Hub and is one in which the Early Literacy Practitioner is instrumental in facilitating for children who have been diagnosed with Autism
Spectrum Disorder. The ELP works collaboratively with service providers from Algoma Public Health, Children’s Rehabilitation Centre Algoma and Community Living Algoma to provide a baseline screen of school readiness skills using the Miller Method.
Housed at the Best Start Hub, the Early Years Resource Library provides a collection of resources regarding young children for parents, caregivers and professionals. The Early Literacy Practitioner provides a Literacy section on Child Care Algoma’s Website. The literacy section offers a venue for parents, caregivers, and professionals to access early literacy information and support including learning activity packages. The combination of Fiction and Non-Fiction books were chosen in response to the EDI, which shows a gap in literacy education for boys. The Family Literacy Coalition, initially created in 2009, is an integrated network of partners and service providers who meet regularly, have developed terms of reference and are committed to helping to strengthen, support and promote language and literacy skills to families in the community.
The Early Literacy Practitioner has been involved with the “Don’t Wait and See” campaign sponsored by the Joint Best Start Network, which asks parents “not to wait and see” if they suspect their child is not developing as expected. The purpose is to raise awareness about the importance of screening, early intervention and assisting families to receive services. This campaign has strengthened and enhanced linkages between partnering agencies. There is more information about this campaign on page 14 of this report.
The Early Literacy Practitioner utilizes the Pre-K Early Language and Literacy Classroom Observation (ELLCO) Tool to assess literacy-rich environments and experiences using best practices. The observations focus on indicators of quality including Structure, Curriculum, Language Environment, Books, Book Reading, Print and Early Writing.
A monthly Literacy Calendar and a quarterly Early Literacy Newsletter is available and includes early literacy information and resources for parents, caregivers and professionals.
Mechanisms are used to monitor essential elements of programming. Evaluations are regularly used to
81
183
220201
0
50
100
150
200
250
2011 2012 2013
Sault Ste. Marie Referrals to Algoma Preschool Speech and Language Services
Child & FamilyFigure 118

Child & Familydetermine the extent at which the programs are meeting the needs of children and families. Parent feedback, evaluations, and EDI results all contribute to the data that drives much of the programming within the community and is used as a measurement tool for the success of our efforts of improvement.
Triple P
Throughout the District of Algoma a group of more than a dozen child and youth serving organizations has undertaken the implementation of a multi-level parenting and family support strategy, which provides consistent and positive messages about parenting no matter where a parent chooses to receive service. The Triple P Positive Parenting Program has been proven to prevent and treat behavioural, emotional and developmental problems in children by enhancing the knowledge, skills and confidence of parents. The program is designed to give parents “just enough” information to teach them skills and help them to become independent problem solvers. It focuses on five main principles:• Ensuring a safe interesting environment• Creating a positive learning environment• Using assertive discipline• Having realistic expectations• Taking care of yourself as a parent
Triple P is available throughout the District of Algoma with more than 200 practitioners trained since January 2011. Parenting seminars are available for all families at numerous locations throughout the community. An online calendar is available at www.triplepalgoma.ca. More intensive or individualized supports are also available at multiple locations.
The long term objectives of the program include reducing the need for intensive mental health services and improving the overall mental health of parents, children and the community as a whole.
In 2013, there were 197 Triple P Seminars held in Sault Ste. Marie, 85 in North Algoma and 83 in East Algoma. There were 35 Triple P Groups in Sault Ste. Marie, 12 in North Algoma and 25 in East Algoma. There were 110 one on one Triple P/special events held in Sault Ste. Marie, 23 in North Algoma and 48 in East Algoma.
Children’s Aid Society of Algoma
“The purpose of the Children’s Aid Society is to protect the children of Algoma and promote their well-being in a manner that reflects community standards and the spirit of related legislation, while making the most efficient use of community and Society resources”29.
The average number of children in care through CAS (196 in 2012/13) has increased slightly since 2011/12 (192), but has decreased since 2010/11 (208) (Figure 119).
The average number of children in care, age 0 to 5 was 75 in 2010/11, 66 in 2011/12 and 67 in 2012/13 (Figure 120).
29. http://www.algomacas.org/index.cfm?fuseaction=content&menuid=18&pageid=1023
82
180
185
190
195
200
205
210
2010/2011 2011/2012 2012/2013
Average # of Children in Care through CAS
Figure 119
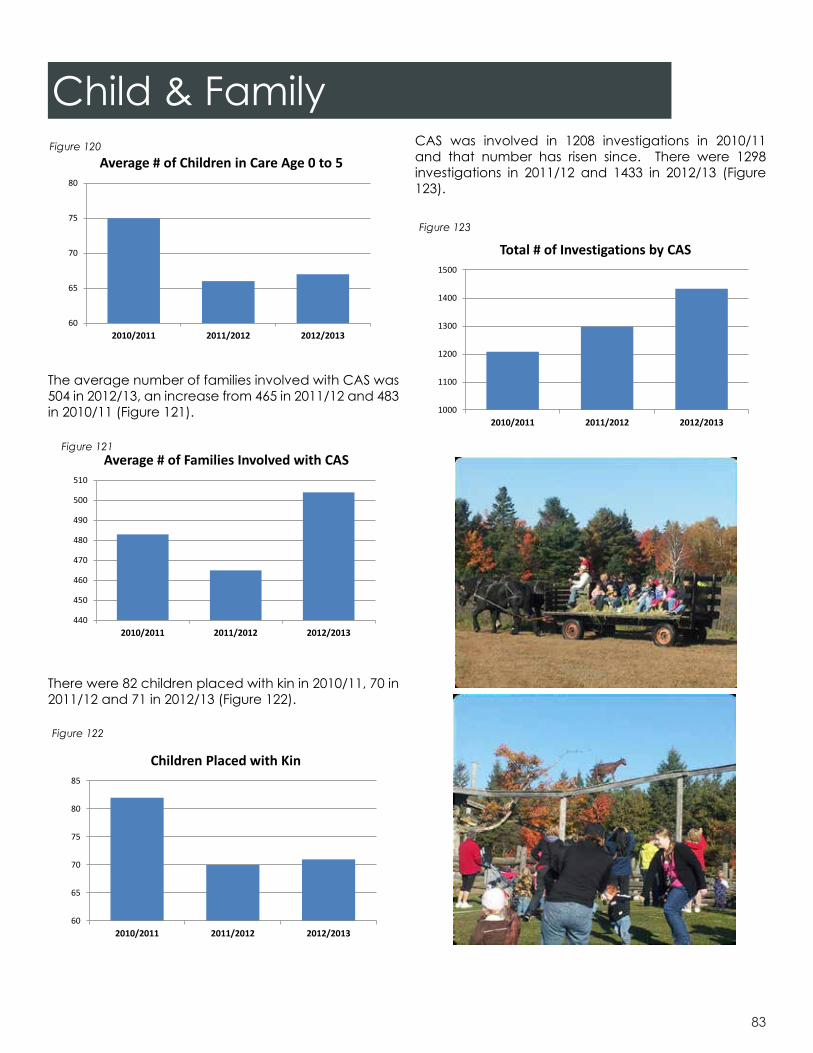
The average number of families involved with CAS was 504 in 2012/13, an increase from 465 in 2011/12 and 483 in 2010/11 (Figure 121).
There were 82 children placed with kin in 2010/11, 70 in 2011/12 and 71 in 2012/13 (Figure 122).
CAS was involved in 1208 investigations in 2010/11 and that number has risen since. There were 1298 investigations in 2011/12 and 1433 in 2012/13 (Figure 123).
83
1000
1100
1200
1300
1400
1500
2010/2011 2011/2012 2012/2013
Total # of Investigations by CAS
Figure 122
Child & Family
440
450
460
470
480
490
500
510
2010/2011 2011/2012 2012/2013
Average # of Families Involved with CAS
60
65
70
75
80
85
2010/2011 2011/2012 2012/2013
Children Placed with Kin
Figure 121
60
65
70
75
80
2010/2011 2011/2012 2012/2013
Average # of Children in Care Age 0 to 5Figure 120
Figure 123
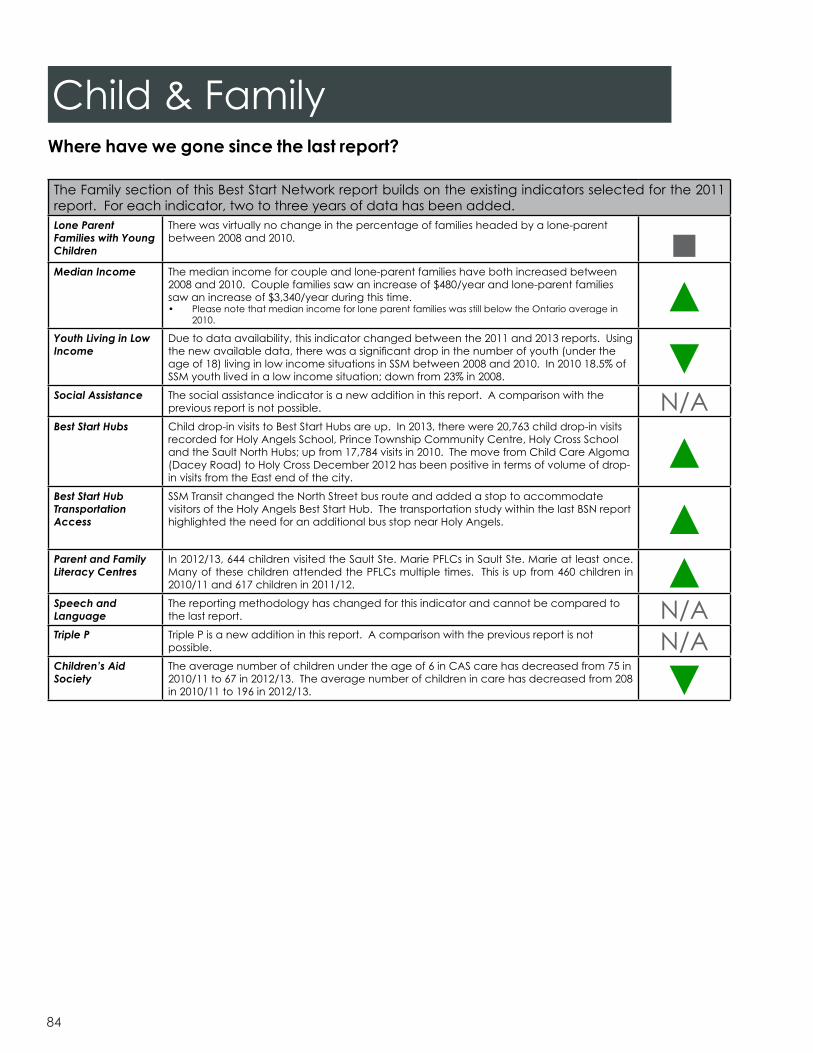
84
Where have we gone since the last report?
The Family section of this Best Start Network report builds on the existing indicators selected for the 2011 report. For each indicator, two to three years of data has been added.Lone Parent Families with Young Children
There was virtually no change in the percentage of families headed by a lone-parent between 2008 and 2010. ■
Median Income The median income for couple and lone-parent families have both increased between 2008 and 2010. Couple families saw an increase of $480/year and lone-parent families saw an increase of $3,340/year during this time.• Please note that median income for lone parent families was still below the Ontario average in
2010. ▲
Youth Living in Low Income
Due to data availability, this indicator changed between the 2011 and 2013 reports. Using the new available data, there was a significant drop in the number of youth (under the age of 18) living in low income situations in SSM between 2008 and 2010. In 2010 18.5% of SSM youth lived in a low income situation; down from 23% in 2008. ▼
Social Assistance The social assistance indicator is a new addition in this report. A comparison with the previous report is not possible. N/A
Best Start Hubs Child drop-in visits to Best Start Hubs are up. In 2013, there were 20,763 child drop-in visits recorded for Holy Angels School, Prince Township Community Centre, Holy Cross School and the Sault North Hubs; up from 17,784 visits in 2010. The move from Child Care Algoma (Dacey Road) to Holy Cross December 2012 has been positive in terms of volume of drop-in visits from the East end of the city.
▲Best Start Hub Transportation Access
SSM Transit changed the North Street bus route and added a stop to accommodate visitors of the Holy Angels Best Start Hub. The transportation study within the last BSN report highlighted the need for an additional bus stop near Holy Angels. ▲
Parent and Family Literacy Centres
In 2012/13, 644 children visited the Sault Ste. Marie PFLCs in Sault Ste. Marie at least once. Many of these children attended the PFLCs multiple times. This is up from 460 children in 2010/11 and 617 children in 2011/12. ▲
Speech and Language
The reporting methodology has changed for this indicator and cannot be compared to the last report. N/A
Triple P Triple P is a new addition in this report. A comparison with the previous report is not possible. N/A
Children’s Aid Society
The average number of children under the age of 6 in CAS care has decreased from 75 in 2010/11 to 67 in 2012/13. The average number of children in care has decreased from 208 in 2010/11 to 196 in 2012/13. ▼
Child & Family
85
Data SourcesCommunity Overview
figure #/titlesource
1 Sault Ste. Marie Census Agglomeration (CA) MapStatistics Canada, 2011 Census Boundary Files, Statistics Canada catalogue no. 92-160-XWE.
2 % Age-Sex Structure Comparison 2001 – 2011 (Pyramid) Sault Ste. Marie CAStatistics Canada, 2011 Census of Population, Statistics Canada catalogue no. 98-311-X2011021; and 2001 Census of Population, Statistics Canada catalogue no. 95F0300XCB2001004.
3 Comparison of Child Population 2001-2011 (Table), Sault Ste. Marie CAStatistics Canada, 2011 Census of Population, Statistics Canada catalogue no. 98-311-X2011021; 2006 Census of Population, Statistics Canada catalogue no. 97-551-XCB2006009; and 2001 Census of Population, Statistics Canada catalogue no. 95F0300XCB2001004.
4 Number of Children Aged 0 to 6 by Census Tract (CT) 2011Statistics Canada, 2011 Census of Population, Statistics Canada catalogue no. 98-311-X2011019.
5 Aboriginal Population (2011) - Sault Ste. Marie CAStatistics Canada, 2011 National Household Survey, Aboriginal Identity (8), Age Groups (20), Registered or Treaty Indian Status (3) and Sex (3) for the Population in Private Households of Canada, Provinces, Territories, Census Metropolitan Areas and Census Agglomerations, Statistics Canada Catalogue no. 99-011-X2011028.
6 Percent Aboriginal by Age Group (2011) - Sault Ste. Marie CA and OntarioStatistics Canada, 2011 National Household Survey, Aboriginal Identity (8), Age Groups (20), Registered or Treaty Indian Status (3) and Sex (3) for the Population in Private Households of Canada, Provinces, Territories, Census Metropolitan Areas and Census Agglomerations, Statistics Canada Catalogue no. 99-011-X2011028.
7 Francophone Population (2011) - Sault Ste. Marie CAStatistics Canada, 2011 Census of Population, Mother Tongue (8), First Official Language Spoken (7), Knowledge of Official Languages (5), Age Groups (25) and Sex (3) for the Population Excluding Institutional Residents of Canada, Provinces, Territories, Census Metropolitan Areas and Census Agglomerations, 2011 Census, Statistics Canada Catalogue no. 98-314-XCB2011045.
8 Percent Francophone by Age Group (2011) - Sault Ste. Marie CA and OntarioStatistics Canada, 2011 Census of Population, Mother Tongue (8), First Official Language Spoken (7), Knowledge of Official Languages (5), Age Groups (25) and Sex (3) for the Population Excluding Institutional Residents of Canada, Provinces, Territories, Census Metropolitan Areas and Census Agglomerations, 2011 Census, Statistics Canada Catalogue no. 98-314-XCB2011045.
9, 10 Social Risk IndexStatistics Canada. 2006 Census of Canada: Profile for Sault Ste. Marie at the CT, CA level and Algoma at the CD level. Ottawa, Ontario. Statistics Canada [producer]; Community Data Consortium, Ottawa [distributor]. Available: https://communitydata-donneescommunautaires.ca/.Statistics Canada. 2006 Census of Canada: Income Status Before Tax and Income Status After Tax, Economic Family Structure and Presence of Children for the Economic Families; Sex, Household Living Arrangements for Sault Ste. Marie at the CT level. Ottawa, Ontario. Statistics Canada [producer]; Community Data Consortium, Ottawa [distributor]. Available: https://communitydata-donneescommunautaires.ca/.

86
Data SourcesHealth and Physical Environment
figure #/titlesource
11 Live Births in Sault Ste. Marie by Birth Weight Groups, 2008 - 2012intelliHealth Ontario
12 Sault Ste. Marie and Ontario CrudeBirth Rates, 2008 - 2012Ontario data from the Inpatient Discharge Main Table from CIHI DAD; Sault Ste. Marie data from intelliHealth Ontario
13 Births to Teen Mothers as a % of Total Births, 2008 - 2012, Sault Ste. Marie CA and OntariointelliHealth Ontario
14 Infant and Child Development Program Clients Receiving ServiceAlgoma Public Health
15 Age- and Sex-Adjusted Asthma Incidence Rates for Algoma Public Health, 2004/05 - 2006/07“Asthma in Ontario: Prevalence, Active Prevalence, Newly Diagnosed Asthma and Health Services Utilization.” ICES. 2004 - 2007. Accessed February 7, 2011.
16 Age- and Sex-Adjusted Asthma Incidence Rates (Ontario and Algoma)“Asthma in Ontario: Prevalence, Active Prevalence, Newly Diagnosed Asthma and Health Services Utilization.” ICES. 2004- 2007. Accessed February 7, 2011.
17 Mental Health: Top 3 Diagnosis for Children and Youth 2012/13Algoma Family Services
18 Mental Health: Number of New Referrals (Service Requests) 2012/13Algoma Family Services
19 Mental Health: Number of Individual Clients Served 2012/13Algoma Family Services
20 Number of Households, Adults, and Children Assisted from 2010 to 2013 Community Assistance Trust
21 Student Nutrition Program ParticipationAlgoma Family Services
22 Child Injuries per Year (Aged 0 to 6) Reported in Emergency: Sault Ste. Marie CA Residents in Ontario Hospitals, 2008-12intelliHEALTH Ontario. Ambulatory ED External Cause Dx by calendar year (2008−2012), by PHU, age, and sex of patient, by external cause code (icd10). Toronto, Ontario. Ministry of Health and Long-Term Care [producer]; Algoma Public Health, Sault Ste. Marie [distributor].
23 Selected Child Injuries (Aged 0 to 6) Reported in Emergency: Sault Ste. Marie Residents in Ontario Hospitals, 2008-12intelliHEALTH Ontario. Ambulatory ED External Cause Dx by calendar year (2008−2012), by PHU, age, and sex of patient, by external cause code (icd10). Toronto, Ontario. Ministry of Health and Long-Term Care [producer]; Algoma Public Health, Sault Ste. Marie [distributor].
24 Top Six Types of Falls of Sault Ste. Marie Children (Aged 0 to 6) Who Reported to Hospital ER, 2008-12intelliHEALTH Ontario. Ambulatory ED External Cause Dx by calendar year (2008−2012), by PHU, age, and sex of patient, by external cause code (icd10). Toronto, Ontario. Ministry of Health and Long-Term Care [producer]; Algoma Public Health, Sault Ste. Marie [distributor].
25 Statistics Canada Crime Index - Sault Ste. Marie Occurrences by CategoryStatistics Canada Crime Index for Sault Ste. Marie (2005 to 2010) and Statistics Canada Crime Index for Sault Ste. Marie (2008 to 2012), Ottawa, Ontario. Statistics Canada [producer]; Sault Ste. Marie Police Service [distributor].
26 Domestic Violence Occurrences in Sault Ste. MarieStatistics Canada Crime Index for Sault Ste. Marie (2005 to 2010) and Statistics Canada Crime Index for Sault Ste. Marie (2008 to 2012), Ottawa, Ontario. Statistics Canada [producer]; Sault Ste. Marie Police Service [distributor].
27-29 Walking Distances to Playgrounds“City of Sault Ste. Marie Parks/Playgrounds” City of Sault Ste. Marie, Accessed online via: http://www.city.sault-ste-marie.on.ca/Open_Page.aspx?ID=512&deptid=1, July 10, 2013, and Sault Ste. Marie Innovation Centre, Community Geomatics Centre, 2013
30-31 Playground GradesSault Ste. Marie Innovation Centre, Community Geomatics Centre, 2013
87
Data SourcesEducation and Child Care
figure #/titlesource
32 Spaces by Age Grouping and Available Subsidy - Feb. 2013District of Sault Ste. Marie Social Services Administration Board
33-58 Early Development Instrument (EDI) Tables, Maps, and ChartsOfford Centre for Child Studies (OCCS), McMaster University, 2005, 2009, and 2012.
59-98 Kindergarten Parent Survey (KPS) Charts 2011/12Offord Centre for Child Studies (OCCS), McMaster University, 2012.
99 Algoma District School Board JK and SK Enrolment (2006/07 - 2013/14)Algoma District School Board
100 Huron-Superior Catholic District School Board JK and SK Enrolment (2006/07 - 2013/14)Huron-Superior Catholic District School Board
101 Conseil scolaire catholique du Nouvel-Ontario and Conseil scolaire public du Grand Nord de l’Ontario JK and SK Enrolment (2011/12 - 2013/14)Conseil scolaire catholique du Nouvel-Ontario and Conseil scolaire public du Grand Nord de l’Ontario
Child and Family
figure #/titlesource
102 Family Type 2010 – Families with Children Under 6Statistics Canada (SAAD Taxfiler Data), 2010
103 Families with Children Under 6 Headed by a Lone-Parent By Census Tract (CT) 2010Statistics Canada (SAAD Taxfiler Data), 2010
104 Lone Parent Families – Families with Children Under 6Statistics Canada (SAAD Taxfiler Data), 2006 - 2010
105 Median Family Income 2010 – By Family TypeStatistics Canada (SAAD Taxfiler Data), 2010
106 Median Family Income 2006-2010 – Couple FamiliesStatistics Canada (SAAD Taxfiler Data), 2006 - 2010
107 Median Family Income 2006-2010 – Lone Parent FamiliesStatistics Canada (SAAD Taxfiler Data), 2006 - 2010
108 Percent of Persons Under 18 Living in Low Income (LIAM-AT*) By Census Tract (CT) 2010Statistics Canada (SAAD Taxfiler Data), 2010
109 Youth Living in Low Income Families 2006 - 2010Statistics Canada (SAAD Taxfiler Data), 2006 - 2010
110 Percent of Families Receiving Social Assistance By Census Tract (CT) 2010 Statistics Canada (SAAD Taxfiler Data), 2010
111 Families Receiving Social Assistance 2006 - 2010Statistics Canada (SAAD Taxfiler Data), 2006 - 2010
112-113 Child Visits & Adult Visits to Best Start Hub Locations (2009 - 2013)Sault Ste. Marie Best Start Hubs/Ontario Early years Centres, 2009 - 2013
114 BSH/OEYC 2013 Child Drop-in Visits by Census Tract (CT)Sault Ste. Marie Best Start Hubs/Ontario Early years Centres, 2013
88
Data Sources115 Number of Children Ages 6 and Under By Census Tract (CT) 2011 / Proportion of 2013 BSH Visits to Sites By Census Tract (CT)Statistics Canada, 2011 Census of Population, Statistics Canada catalogue no. 98-311-X2011019.Sault Ste. Marie Best Start Hubs/Ontario Early Years Centres, 2013
116 Number of Children who Visited SSM Parenting and Family Literacy Centres at Least Once, 2010/11 to 2012/13Algoma District School Board
117 Average Age in Months at Date of Referral – Sault Ste. Marie Referrals Ministry of Children and Youth Services, Integrated Services for Children Information System (ISCIS) Database (2011-2013)
118 Sault Ste. Marie Referrals to Algoma Preschool Speech and Language ServicesMinistry of Children and Youth Services, Integrated Services for Children Information System (ISCIS) Database (2011-2013)
119 Average # of Children in Care through CASChildren’s Aid Society of Algoma, 2010/11 - 2012/13
120 Average # of Children in Care Age 0 to 5Children’s Aid Society of Algoma, 2010/11 - 2012/13
121 Average # of Families Involved with CASChildren’s Aid Society of Algoma, 2010/11 - 2012/13
122 Children Placed with KinChildren’s Aid Society of Algoma, 2010/11 - 2012/13
123 Total # of Investigations by CASChildren’s Aid Society of Algoma, 2010/11 - 2012/13