VisualOptions 1
Spot and analyze unusual option activity
• Spot unusual option activity.• Scans the entire market looking for unusual volume (every hour), analyzing the last prices, volume, open int, theoretical price, and all
greeks. • With a simple way, the system allows to analyzes any unusual activity.

VisualOptions 2
Tracking open positions (from Think or Swim)
• Ability to track all open positions you have in ThinkorSwim• View P/L, days until expiration, etc• Sort your P/L list with any field• Track your strategies, analyze each option of your strategy.

VisualOptions 3
Risk Profile charts
• Analyze any strategy with risk profile chart.• Evaluates different environments of the strategy (stock change, IV change, etc)

VisualOptions 4
Option Chain
• Analyze the option chain.• Get information from different
sources• Able to analyze each particular
contract

VisualOptions 5
Option Contract analysis
• Analyze an specific option contract.
• Historical prices• Historical Volume & Open
Interest• Historical Volatilities: HV and IV• Historical Geeks• Historical quote list

VisualOptions 6
Put/Call ratio
• View Put/Call ratio of any symbol.• OI Put/Call ratio • Volume Put/Call ratio
7
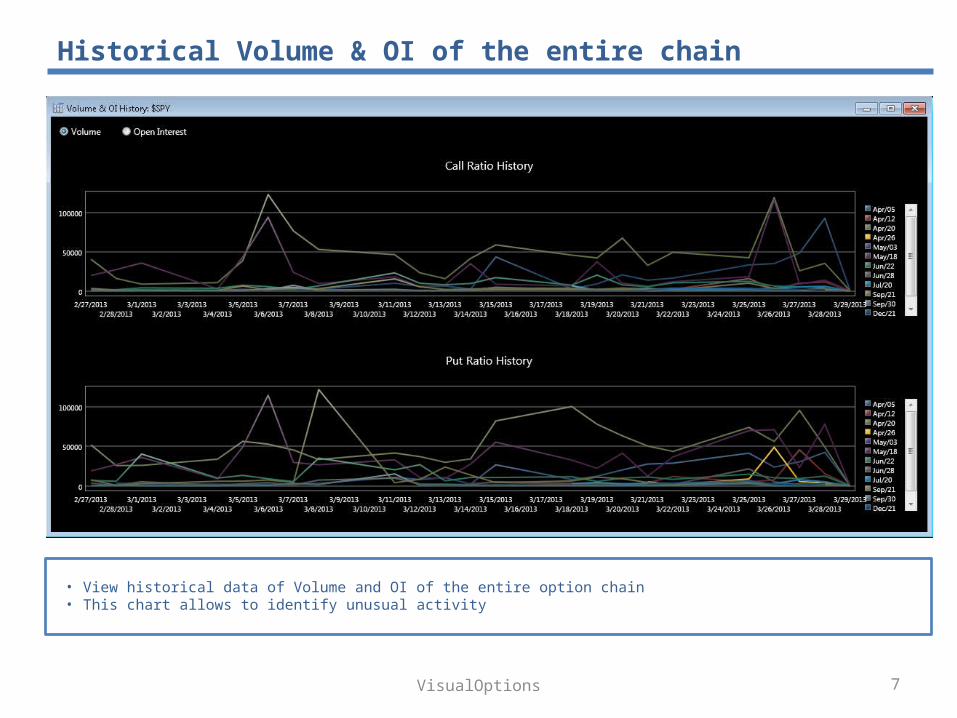
Historical Volume & OI of the entire chain
• View historical data of Volume and OI of the entire option chain• This chart allows to identify unusual activity
VisualOptions
VisualOptions 8
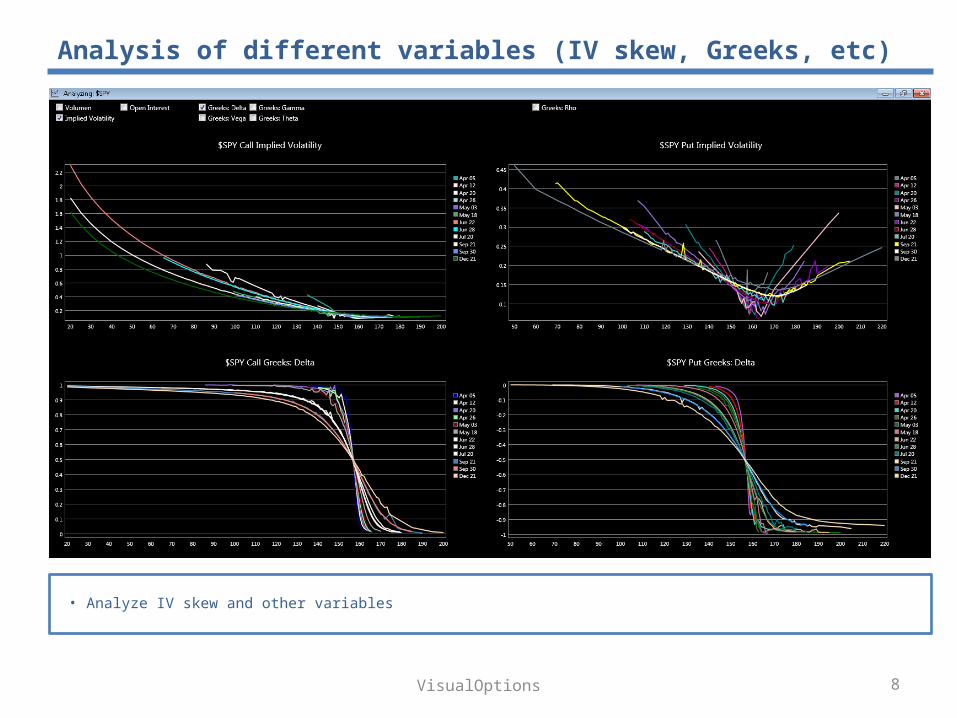
Analysis of different variables (IV skew, Greeks, etc)
• Analyze IV skew and other variables
VisualOptions 9
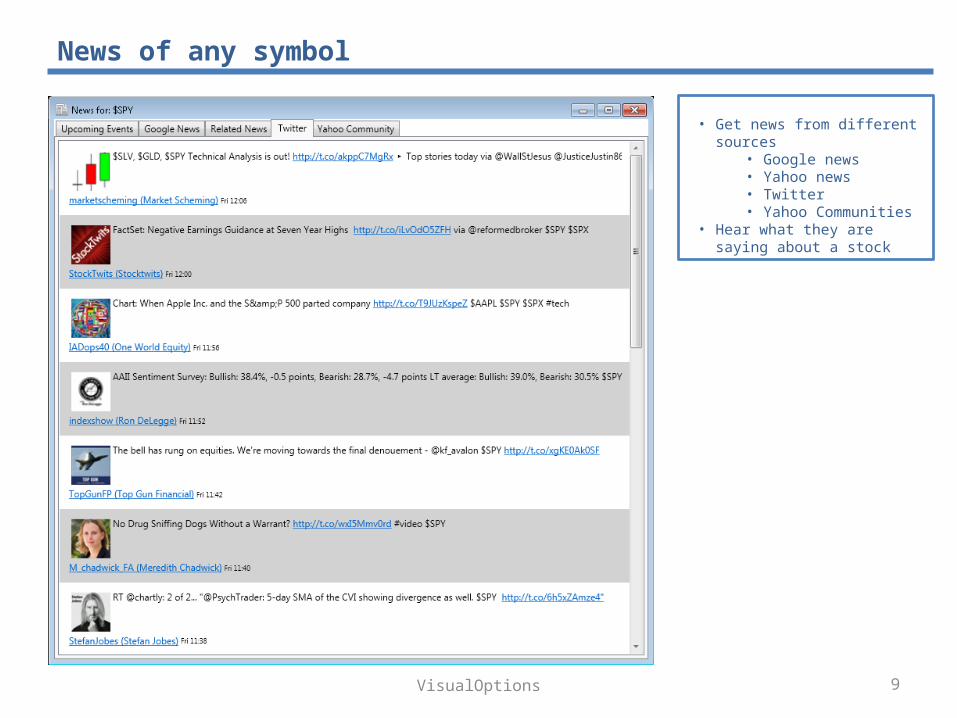
News of any symbol
• Get news from different sources• Google news• Yahoo news• Twitter• Yahoo Communities
• Hear what they are saying about a stock