Spot and analyze unusual option activity • Spot unusual option activity. • Scans the entire market looking for unusual volume (every hour), analyzing the last prices, volume, open int, theoretical price, and all greeks. • With a simple way, the system allows to analyzes any unusual activity. VisualOptions 1

Spot and analyze unusual option activity Spot unusual option activity. Scans the entire market looking for unusual volume (every hour), analyzing the last.
Dec 18, 2015
Welcome message from author
This document is posted to help you gain knowledge. Please leave a comment to let me know what you think about it! Share it to your friends and learn new things together.
Transcript

VisualOptions 1
Spot and analyze unusual option activity
• Spot unusual option activity.• Scans the entire market looking for unusual volume (every hour), analyzing the last prices, volume, open int, theoretical price, and all
greeks. • With a simple way, the system allows to analyzes any unusual activity.

VisualOptions 2
Tracking open positions (from Think or Swim)
• Ability to track all open positions you have in ThinkorSwim• View P/L, days until expiration, etc• Sort your P/L list with any field• Track your strategies, analyze each option of your strategy.

VisualOptions 3
Risk Profile charts
• Analyze any strategy with risk profile chart.• Evaluates different environments of the strategy (stock change, IV change, etc)

VisualOptions 4
Option Chain
• Analyze the option chain.• Get information from different
sources• Able to analyze each particular
contract

VisualOptions 5
Option Contract analysis
• Analyze an specific option contract.
• Historical prices• Historical Volume & Open
Interest• Historical Volatilities: HV and IV• Historical Geeks• Historical quote list

VisualOptions 6
Put/Call ratio
• View Put/Call ratio of any symbol.• OI Put/Call ratio • Volume Put/Call ratio
7
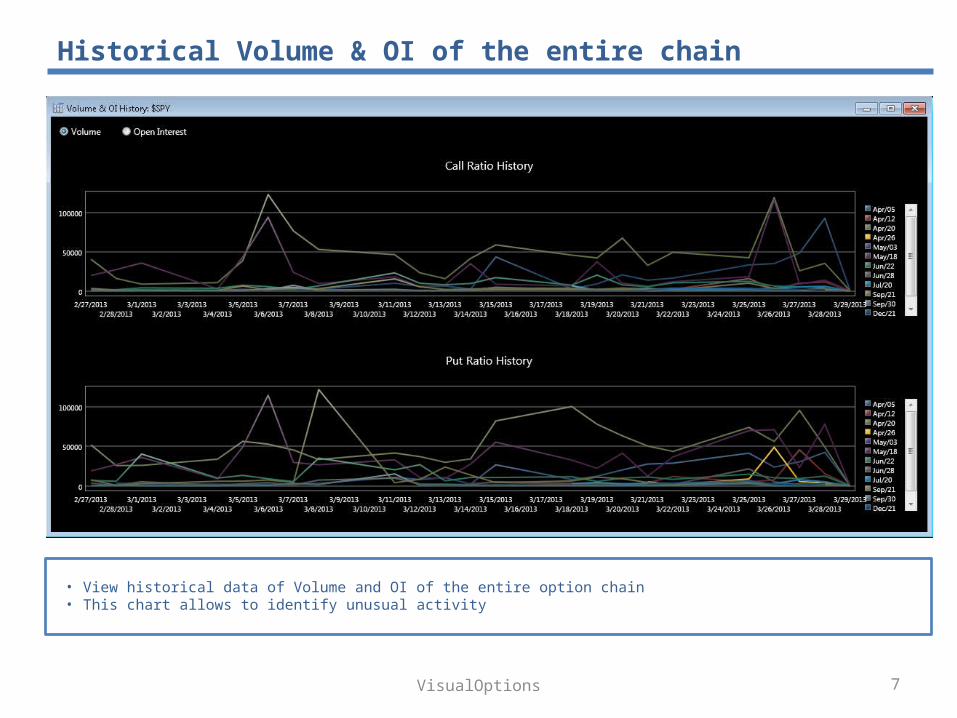
Historical Volume & OI of the entire chain
• View historical data of Volume and OI of the entire option chain• This chart allows to identify unusual activity
VisualOptions
VisualOptions 8
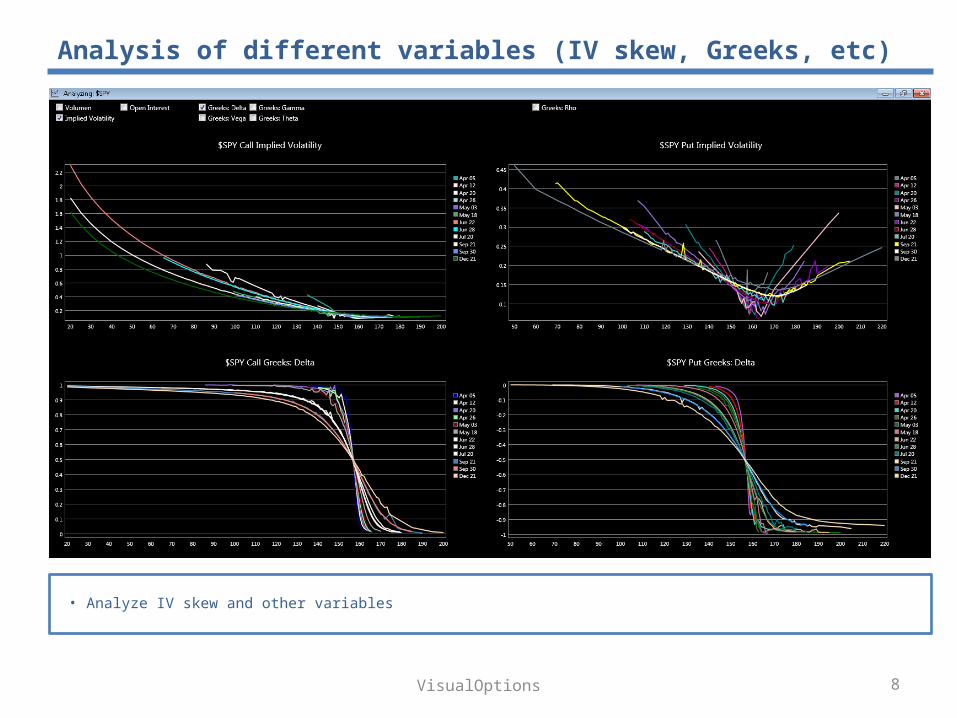
Analysis of different variables (IV skew, Greeks, etc)
• Analyze IV skew and other variables
VisualOptions 9
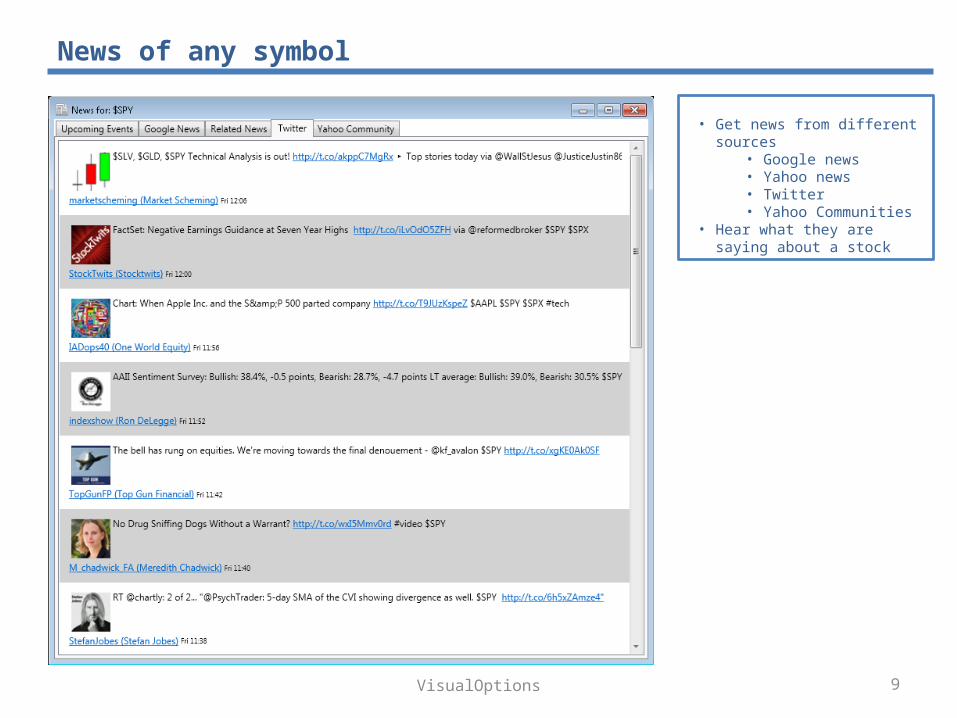
News of any symbol
• Get news from different sources• Google news• Yahoo news• Twitter• Yahoo Communities
• Hear what they are saying about a stock
Related Documents