


1 | P a g e
Kaksha Learning Outcome Survey
This survey covered two blocks Rajaund and Babain of Haryana State. A total of 60 Govt. Primary
Schools (30 schools from Rajaund and 30 schools from Babain block) were covered under the survey.
Out of 30 schools per block, 15 schools were selected for experiment whereas, 15 schools were
selected as a control group. Thus a total of 30 schools were selected as experimental group and 30
were selected as a control group. Achievement tests in Hindi, English and Mathematics were prepared
for lower primary level students and administered on standard I-IV students of the selected schools
of Rajaund and Babain blocks.
For Hindi and English languages, Listening, Reading, Vocabulary and Writing skills were covered in the
achievement test whereas for Mathematics, mathematical operations like Shape Recognition,
Number Recognition, Place Value of Numbers, Number Operations like Multiplication, Addition &
Subtraction, Number Patterns (Recognition of Odd/Even Numbers), Word Problems, Measurement
Units and Time (Time, Name of Days, Weeks & Months) were covered in the achievement test.
This analysis report presents the learning level/performance of standard I-IV students of experimental
and control groups in Hindi, English and Mathematics. Standard I-IV section wise report is prepared
with Hindi, English and Mathematics as sub-sections. The first figure of each sub-sections presents
gender wise learning level/performance of students of experimental and control groups of Rajaund
block in achievement test (Figure numbers. 1, 5, 9, 13, 17, 21, 25, 29, 33, 37, 41 & 45), second and
third figures of each sub-section presents gender wise learning level of Babain block students and over
all learning level/performance of experimental and control group students in achievement tests
(Figure numbers. 2, 3, 6, 7, 10, 11, 18, 19, 22, 23, 26, 27, 30, 31, 34, 35, 38, 39, 42, 43, 46 & 47) whereas
the fourth figure of each sub-section presents the question wise mean scores of students in
achievement test (Figure numbers. 4, 8, 12, 16, 20, 24, 28, 32, 36, 40. 44 & 48). Result is presented in
percentage of students who secured 70% and more than 70% of marks from the total marks of each
learning skill.
OVERALL FINDINGS OF THE SURVEY ARE AS BELOW:
1) The proportion of students achieving >50% marks in any of the skills tested across all the three
subjects- Hindi, English and Mathematics, is very low. Effort needs to be made to bring a larger
population of the students into the >50 % bracket for all skills in all subjects.
2 | P a g e
2) There was a significant proportion of children that could not answer the test at all. These
children must be drawn into the educative process by making learning more enjoyable and
easily comprehensible.
3) A remedial solution that emphasizes the three skill sets – listening, reading and writing for
Hindi and English must be put in place. Such a program should be flexible to suit the needs of
the individual learner and should be repeatable so that drilling of concepts can be done
amongst students. Also, if the program can teach the same concept in a number of ways, it
will be greatly beneficial as children can learn through the method that is easiest for them.
Furthermore, a holistic re-enforcement strategy that emphasizes on listening, reading and
writing skills simultaneously and makes learning more enjoyable and understandable for
children would greatly benefit in attracting children who are found to be disinterested in
learning. A specialized solution that augments teaching capabilities of teachers while
simultaneously educating students would be very beneficial as it can speed up the
improvement of learning levels of children significantly.
4) Similarly, for Mathematics, it was found that a large majority of students achieved less than
50% marks in the overall mathematics test across all the various skills tested. In order to bring
a larger population of children above the 50% benchmark a remedial program should be
deployed that emphasizes on all topics of mathematics using real world examples, objects,
teaching aids and other engaging strategies which would make learning more enjoyable and
impactful.
3 | P a g e
Section I: Standard I 1. Hindi
An achievement test totaling 31 marks was prepared including the questions of Listening (14 marks),
Reading (11 marks) and Writing (6 marks). The Hindi achievement test was administered on a total of
300 standard I students of 60 (30 experimental & 30 control) Govt. Primary Schools of the Rajaund
and Babain blocks. Out of 300 students, 134 students were male whereas 143 students were female
whereas 23 students did not respond. The following figure 1 to figure 4 presents the learning
level/performance of standard I students in Hindi achievement test.
Rajaund: Out of the total 150 (100%) standard I students from Rajaund block, 64 (42.66%) were male
and 77 (51.33%) were female whereas, remaining 9 (6%) students did not respond. Out of total 150
(100%) students, 75 (50%) were from experimental group whereas, 75 (50%) students were from
control group. Out of the 75 (100%) students from experimental group, 27 (36%) were male and 43
(57.33%) were female whereas, the remaining 5 (6.66%) students did not respond. Same as, out of the
75 (100%) students from control group, 37 (49.33%) were male and 34 (45.33%) were female whereas,
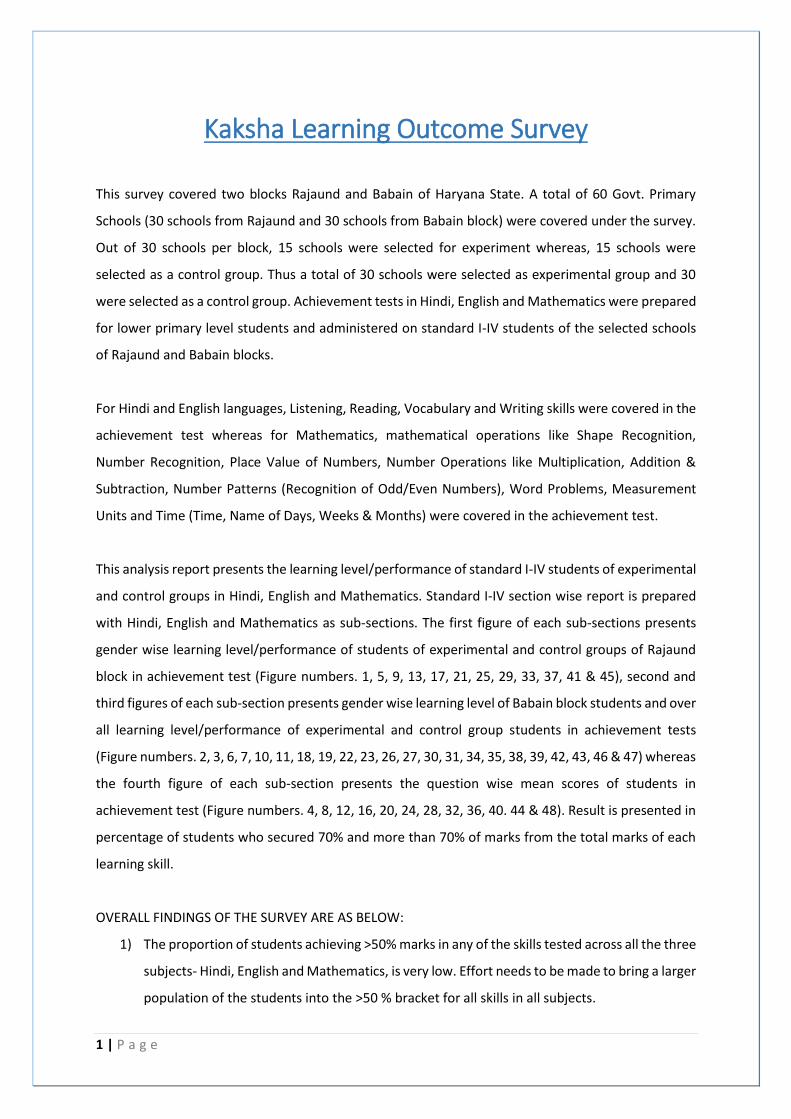
the remaining 4 (5.33) students did not respond. The following figure shows gender wise learning level
of standard I students of experimental and control group in Hindi.
Figure 1
0.00%
2.00%
4.00%
6.00%
8.00%
10.00%
12.00%
14.00%
16.00%
18.00%
20.00%
Male Female Male Female
Experimental Control
Rajaund
Listening 12.66% 19.33% 18.00% 17.33%
Reading 6.66% 8.00% 8.66% 11.33%
Writing 1.33% 3.33% 2.00% 2.66%
Pe
rce
nta
ge o
f St
ud
en
ts
Rajaund Intra-Skill Comparison of Class I Hindi
4 | P a g e
From the figure 1 it was found that out of the total 150 (100%) students from Rajaund block, only 12-
19% of the students could secure more than 70% of marks in listening skills (listening and recognizing
simple action words and naming words) and 6-11% of students could secure more than 70% of marks
in reading skills (alphabet reading and names of family members). Only 1-3% of the students could
secure more than 70% of marks in writing skills (writing two letter words). This means that more than
80% of both male and female students failed to secure a minimum of 70% in basic skills in Hindi
language. It is seen from the graph that the proficiency in writing skills is very low, however even the
proficiency in listening skills and reading skills is well below acceptable levels as will be demonstrated
in the subsequent graphs.
Babain: Out of the total 150 (100%) standard I students from Babain block, 70 (46.66%) were male
and 66 (44%) were female whereas, remaining 14 (9.33%) students did not respond. Out of total 150
(100%) students, 75 (50%) were from experimental group whereas, 75 (50%) students were from
control group. Out of the 75 (100%) students from experimental group, 32 (42.66%) were male and
36 (48%) were female whereas, the remaining 7 (9.33%) students did not respond. Same as, out of the
75 (100%) students from control group, 38 (50.66%) were male and 30 (40%) were female whereas,
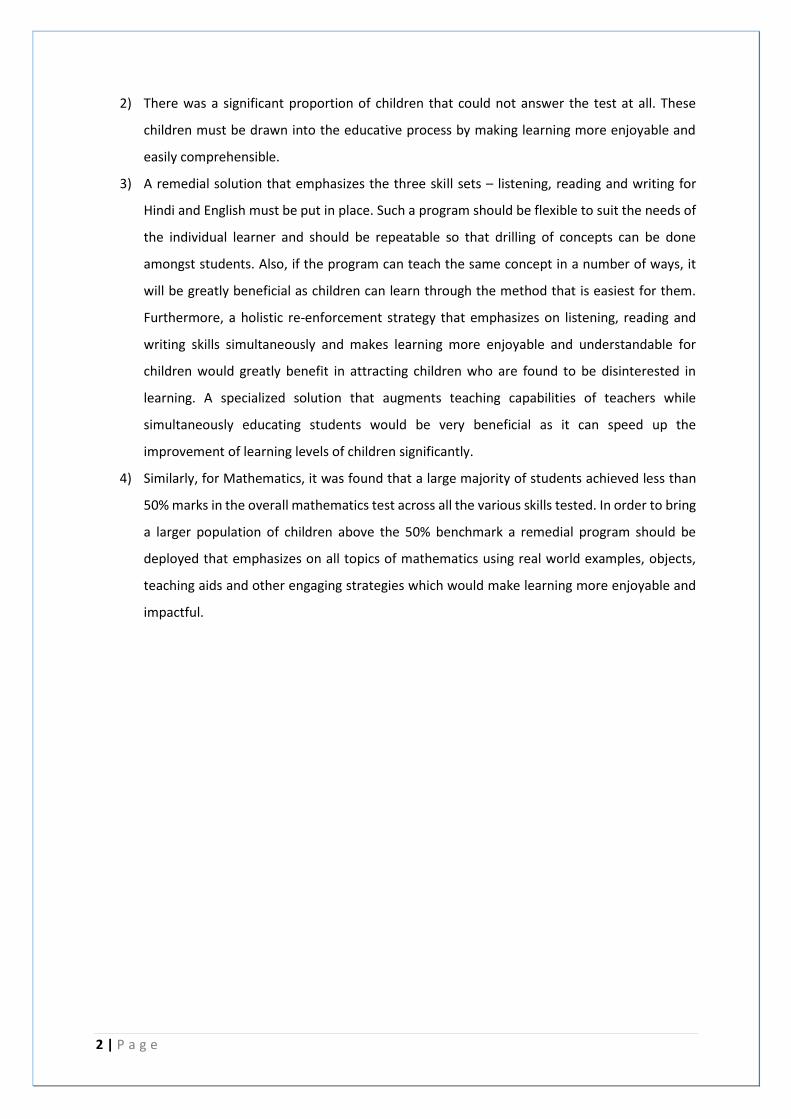
the remaining 7 (9.33) students did not respond. The following figure shows gender wise learning level
of standard I students of experimental and control group in Hindi for Babain block.
Figure 2
0.00%
5.00%
10.00%
15.00%
20.00%
25.00%
Male Female Male Female
Experimental Control
Babain
Listening 19.33% 23.33% 15.33% 15.33%
Reading 8.00% 10.00% 4.00% 8.66%
Writing 2.00% 3.33% 1.33% 2.66%
Pe
rce
nta
ge o
f St
ud
en
ts
Babain Intra-Skill Comparison of Class I Hindi
5 | P a g e
From the figure 2 it can be observed that out of the total 150 (100%) students from Babain block, 15-
23% of the students could secure more than 70% of marks in listening skills (listening and recognizing
action words and naming words) and 4-10% of the students could secure more than 70% of marks in
reading skills (alphabets and names of family members) of Hindi whereas, only 1-3% of students could
secure more than 70% of marks in writing skill in Hindi (two letter words). This means that more than
75% of both the male and female students failed to achieve a minimum of 70% in basic language skills
in Hindi. The male and female students of both experimental and control group were found very weak
in Hindi writing skills, as more than 96% of the students failed to achieve more than 70% of marks. It
is seen from the graph that the proficiency in writing skills is very low, however even the proficiency
in listening skills and reading skills is well below acceptable levels as will be elucidated in the
subsequent graphs.
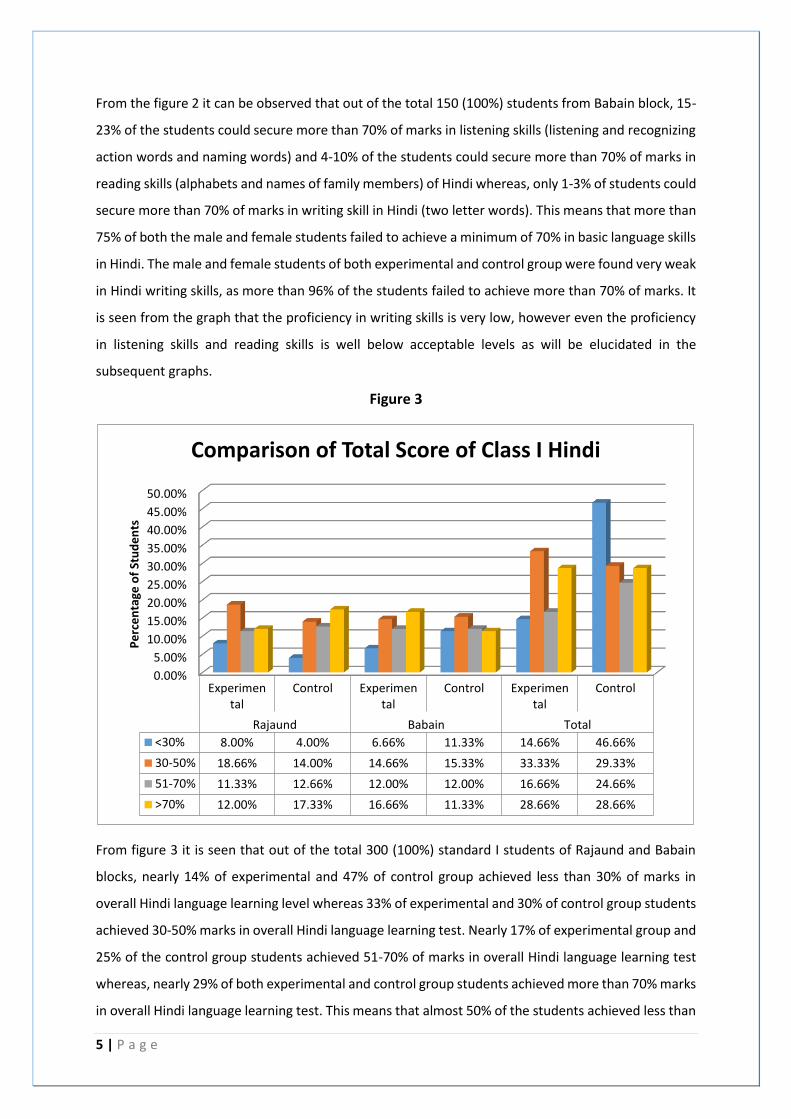
Figure 3
From figure 3 it is seen that out of the total 300 (100%) standard I students of Rajaund and Babain
blocks, nearly 14% of experimental and 47% of control group achieved less than 30% of marks in
overall Hindi language learning level whereas 33% of experimental and 30% of control group students
achieved 30-50% marks in overall Hindi language learning test. Nearly 17% of experimental group and
25% of the control group students achieved 51-70% of marks in overall Hindi language learning test
whereas, nearly 29% of both experimental and control group students achieved more than 70% marks
in overall Hindi language learning test. This means that almost 50% of the students achieved less than
0.00%
5.00%
10.00%
15.00%
20.00%
25.00%
30.00%
35.00%
40.00%
45.00%
50.00%
Experimental
Control Experimental
Control Experimental
Control
Rajaund Babain Total
<30% 8.00% 4.00% 6.66% 11.33% 14.66% 46.66%
30-50% 18.66% 14.00% 14.66% 15.33% 33.33% 29.33%
51-70% 11.33% 12.66% 12.00% 12.00% 16.66% 24.66%
>70% 12.00% 17.33% 16.66% 11.33% 28.66% 28.66%
Pe
rce
nta
ge o
f St
ud
en
ts
Comparison of Total Score of Class I Hindi
6 | P a g e
50% marks from the experimental group and almost 76% of students achieved less than 50% from the
control group.
It is clear from the graphs above that majority of the children are unable to get more than 50% marks
which is less than acceptable. A holistic re-enforcement strategy that emphasizes on listening, reading
and writing skills simultaneously and makes learning more enjoyable and understandable for children
would greatly benefit the class at large.
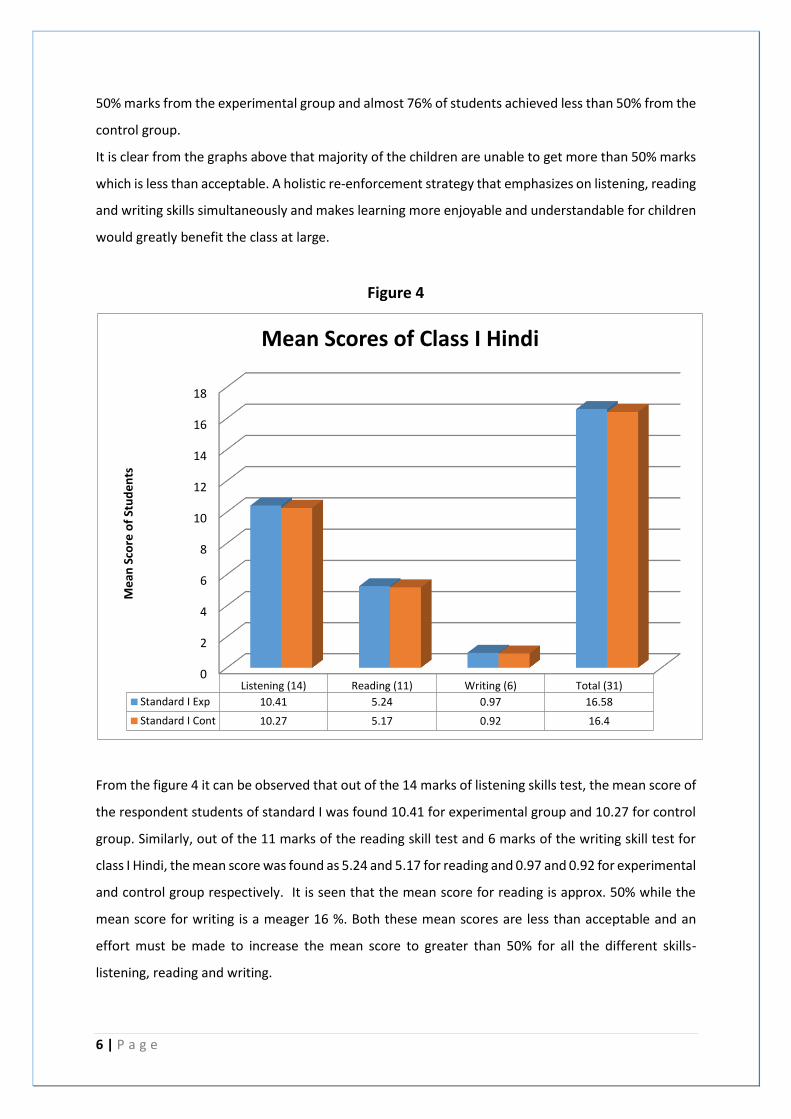
Figure 4
From the figure 4 it can be observed that out of the 14 marks of listening skills test, the mean score of
the respondent students of standard I was found 10.41 for experimental group and 10.27 for control
group. Similarly, out of the 11 marks of the reading skill test and 6 marks of the writing skill test for
class I Hindi, the mean score was found as 5.24 and 5.17 for reading and 0.97 and 0.92 for experimental
and control group respectively. It is seen that the mean score for reading is approx. 50% while the
mean score for writing is a meager 16 %. Both these mean scores are less than acceptable and an
effort must be made to increase the mean score to greater than 50% for all the different skills-
listening, reading and writing.
0
2
4
6
8
10
12
14
16
18
Listening (14) Reading (11) Writing (6) Total (31)
Standard I Exp 10.41 5.24 0.97 16.58
Standard I Cont 10.27 5.17 0.92 16.4
Me
an S
core
of
Stu
de
nts
Mean Scores of Class I Hindi
7 | P a g e
OVERALL INFERENCE:
1) The proportion of students achieving >50% marks in any of the 3 skills is very low. Effort
needs to be made to bring a larger population of the students into the >50 % bracket for
all skills- listening, reading and writing.
2) There was a significant proportion of children who could not answer the test at all. These
children must be drawn into the educative process by making learning more enjoyable
and easily comprehensible.
2. English
An achievement test of a total of 23 marks was prepared including questions of Listening (12 marks),
Reading (6 marks) and Writing (5 marks). The English achievement test was administered on a total of
300 standard I students of 60 Govt. Primary Schools of the Rajaund and Babain blocks. Out of 300
students, 145 (48.33%) students were male and 139 (46.33%) students were female whereas 16
(5.33%) students did not respond. Block-wise, 145 (66 male and 79 female) students were from
Rajaund block and 139 (72 male and 67 female) students were from Babain block. The following figure
5 to figure 8 presents the learning level/performance of standard I students in English achievement
test.
Rajaund: Out of the total 150 (100%) standard I students from Rajaund block, 66 (44%) were male
and 79 (52.66%) were female whereas, remaining 5 (3.33%) students did not respond. Out of total 150
(100%) students, 75 (50%) were from experimental group whereas, 75 (50%) students were from
control group. Out of the 75 (100%) students from experimental group, 29 (38.66%) were male and
43 (57.33%) were female whereas, the remaining 3 (6.66%) students did not respond. Same as, out of
the 75 (100%) students from control group, 37 (49.33%) were male and 36 (48%) were female
whereas, the remaining 2 (2.66%) students did not respond. The following figure shows gender-wise
learning level of standard I students of experimental and control group in English.
8 | P a g e
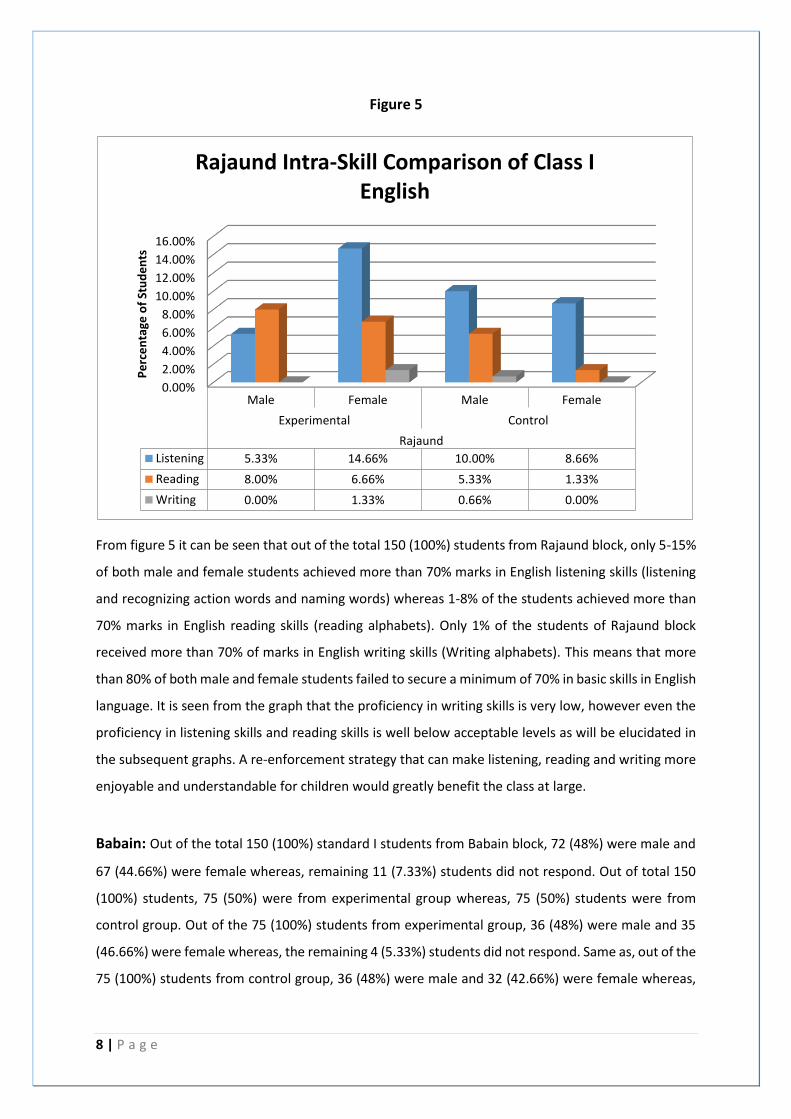
Figure 5
From figure 5 it can be seen that out of the total 150 (100%) students from Rajaund block, only 5-15%
of both male and female students achieved more than 70% marks in English listening skills (listening
and recognizing action words and naming words) whereas 1-8% of the students achieved more than
70% marks in English reading skills (reading alphabets). Only 1% of the students of Rajaund block
received more than 70% of marks in English writing skills (Writing alphabets). This means that more
than 80% of both male and female students failed to secure a minimum of 70% in basic skills in English
language. It is seen from the graph that the proficiency in writing skills is very low, however even the
proficiency in listening skills and reading skills is well below acceptable levels as will be elucidated in
the subsequent graphs. A re-enforcement strategy that can make listening, reading and writing more
enjoyable and understandable for children would greatly benefit the class at large.
Babain: Out of the total 150 (100%) standard I students from Babain block, 72 (48%) were male and
67 (44.66%) were female whereas, remaining 11 (7.33%) students did not respond. Out of total 150
(100%) students, 75 (50%) were from experimental group whereas, 75 (50%) students were from
control group. Out of the 75 (100%) students from experimental group, 36 (48%) were male and 35
(46.66%) were female whereas, the remaining 4 (5.33%) students did not respond. Same as, out of the
75 (100%) students from control group, 36 (48%) were male and 32 (42.66%) were female whereas,
0.00%
2.00%
4.00%
6.00%
8.00%
10.00%
12.00%
14.00%
16.00%
Male Female Male Female
Experimental Control
Rajaund
Listening 5.33% 14.66% 10.00% 8.66%
Reading 8.00% 6.66% 5.33% 1.33%
Writing 0.00% 1.33% 0.66% 0.00%
Pe
rce
nta
ge o
f St
ud
en
ts
Rajaund Intra-Skill Comparison of Class I English
9 | P a g e
the remaining 7 (9.33) students did not respond. The following figure shows gender-wise learning level
of standard I students of experimental and control group in Hindi.
Figure 6
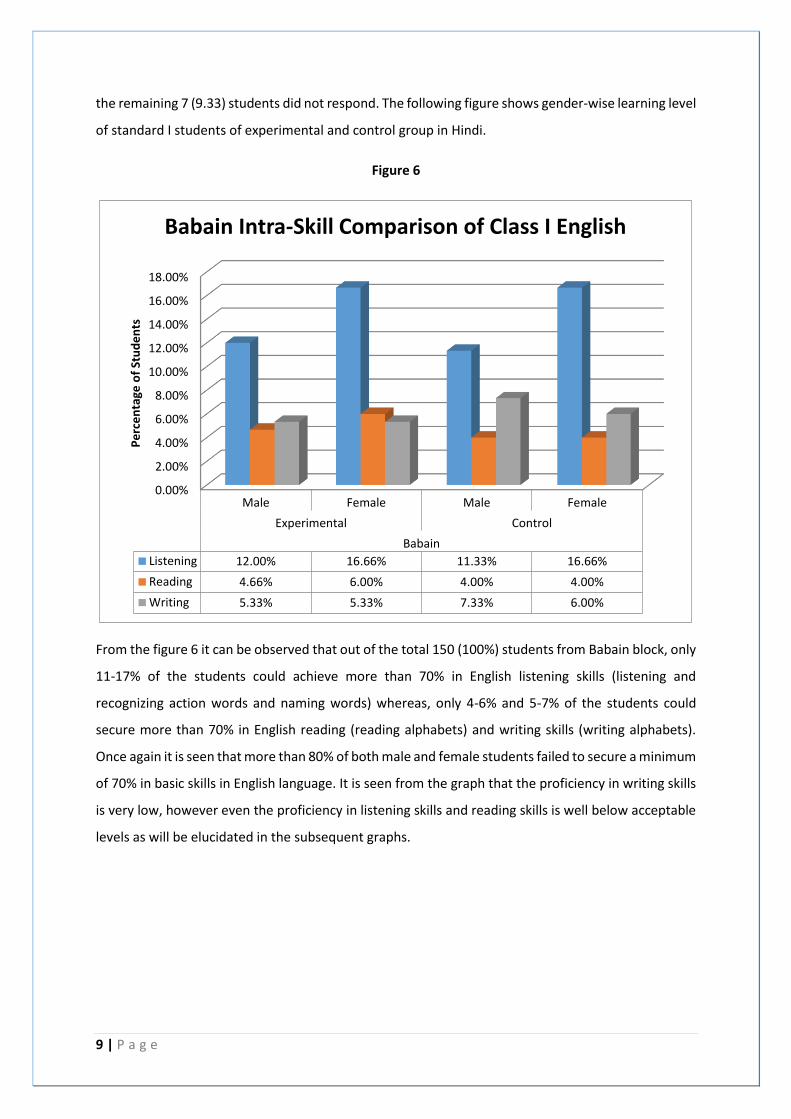
From the figure 6 it can be observed that out of the total 150 (100%) students from Babain block, only
11-17% of the students could achieve more than 70% in English listening skills (listening and
recognizing action words and naming words) whereas, only 4-6% and 5-7% of the students could
secure more than 70% in English reading (reading alphabets) and writing skills (writing alphabets).
Once again it is seen that more than 80% of both male and female students failed to secure a minimum
of 70% in basic skills in English language. It is seen from the graph that the proficiency in writing skills
is very low, however even the proficiency in listening skills and reading skills is well below acceptable
levels as will be elucidated in the subsequent graphs.
0.00%
2.00%
4.00%
6.00%
8.00%
10.00%
12.00%
14.00%
16.00%
18.00%
Male Female Male Female
Experimental Control
Babain
Listening 12.00% 16.66% 11.33% 16.66%
Reading 4.66% 6.00% 4.00% 4.00%
Writing 5.33% 5.33% 7.33% 6.00%
Pe
rce
nta
ge o
f St
ud
en
ts
Babain Intra-Skill Comparison of Class I English
10 | P a g e
Figure 7
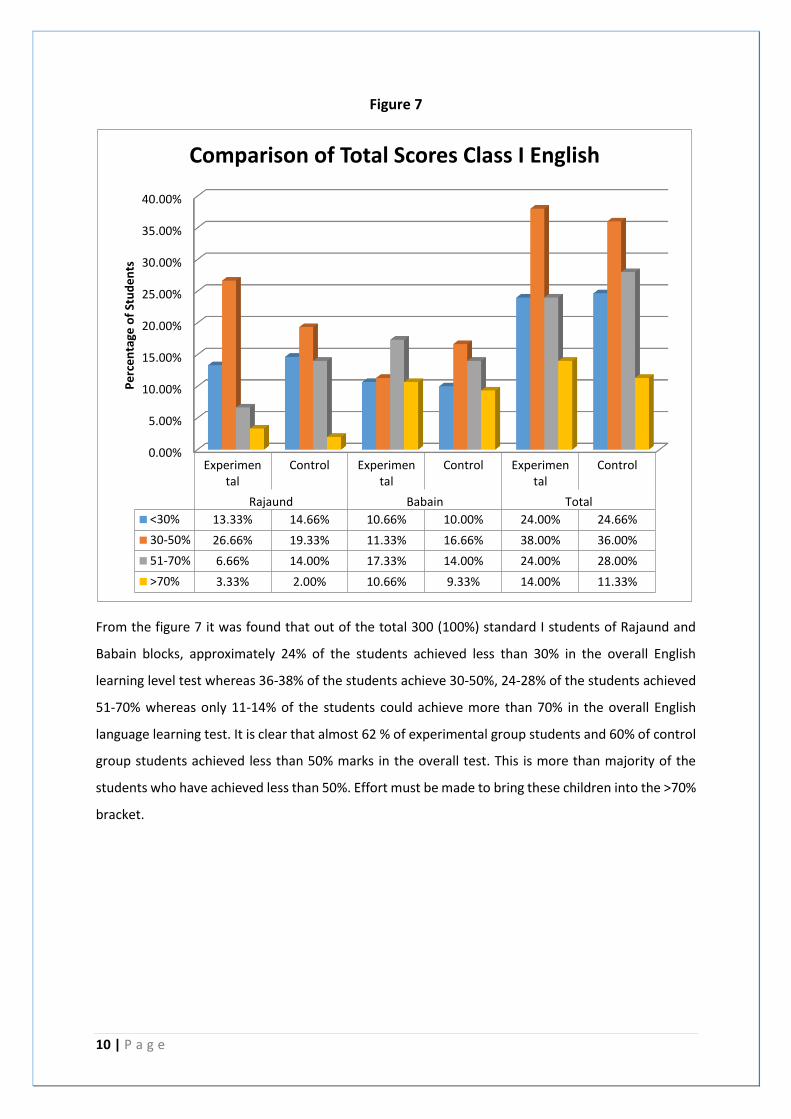
From the figure 7 it was found that out of the total 300 (100%) standard I students of Rajaund and
Babain blocks, approximately 24% of the students achieved less than 30% in the overall English
learning level test whereas 36-38% of the students achieve 30-50%, 24-28% of the students achieved
51-70% whereas only 11-14% of the students could achieve more than 70% in the overall English
language learning test. It is clear that almost 62 % of experimental group students and 60% of control
group students achieved less than 50% marks in the overall test. This is more than majority of the
students who have achieved less than 50%. Effort must be made to bring these children into the >70%
bracket.
0.00%
5.00%
10.00%
15.00%
20.00%
25.00%
30.00%
35.00%
40.00%
Experimental
Control Experimental
Control Experimental
Control
Rajaund Babain Total
<30% 13.33% 14.66% 10.66% 10.00% 24.00% 24.66%
30-50% 26.66% 19.33% 11.33% 16.66% 38.00% 36.00%
51-70% 6.66% 14.00% 17.33% 14.00% 24.00% 28.00%
>70% 3.33% 2.00% 10.66% 9.33% 14.00% 11.33%
Pe
rce
nta
ge o
f St
ud
en
ts
Comparison of Total Scores Class I English
11 | P a g e
Figure 8
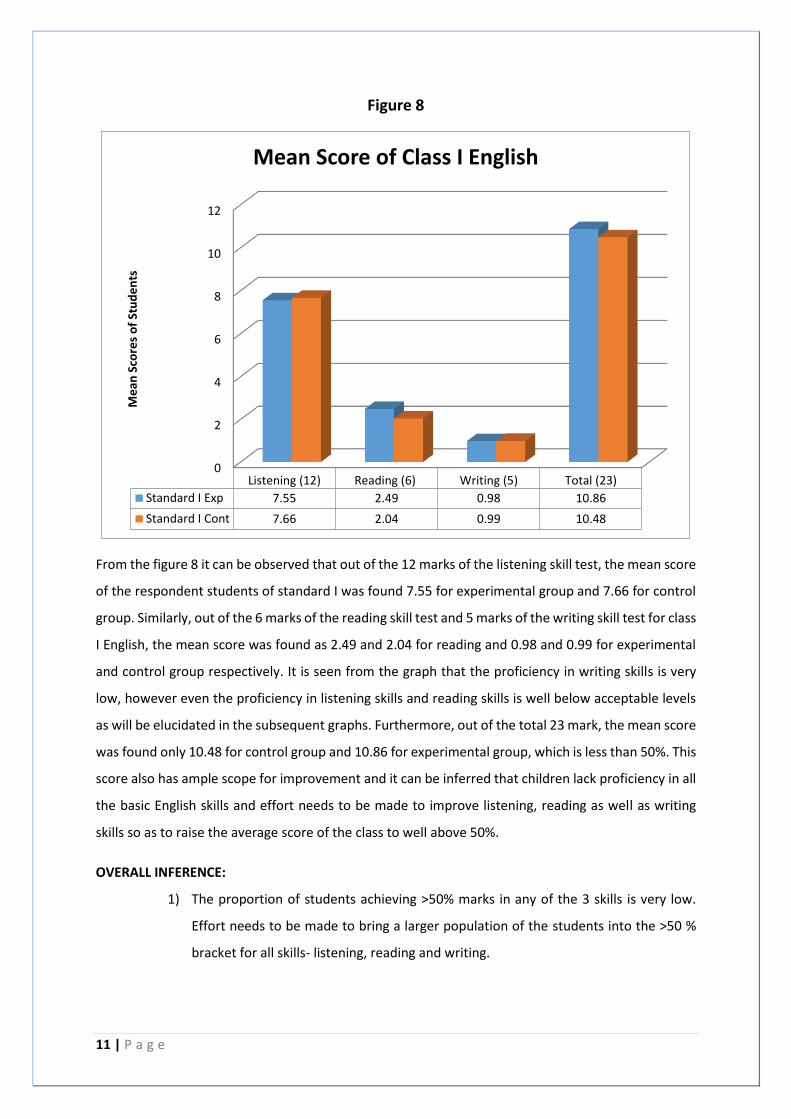
From the figure 8 it can be observed that out of the 12 marks of the listening skill test, the mean score
of the respondent students of standard I was found 7.55 for experimental group and 7.66 for control
group. Similarly, out of the 6 marks of the reading skill test and 5 marks of the writing skill test for class
I English, the mean score was found as 2.49 and 2.04 for reading and 0.98 and 0.99 for experimental
and control group respectively. It is seen from the graph that the proficiency in writing skills is very
low, however even the proficiency in listening skills and reading skills is well below acceptable levels
as will be elucidated in the subsequent graphs. Furthermore, out of the total 23 mark, the mean score
was found only 10.48 for control group and 10.86 for experimental group, which is less than 50%. This
score also has ample scope for improvement and it can be inferred that children lack proficiency in all
the basic English skills and effort needs to be made to improve listening, reading as well as writing
skills so as to raise the average score of the class to well above 50%.
OVERALL INFERENCE:
1) The proportion of students achieving >50% marks in any of the 3 skills is very low.
Effort needs to be made to bring a larger population of the students into the >50 %
bracket for all skills- listening, reading and writing.
0
2
4
6
8
10
12
Listening (12) Reading (6) Writing (5) Total (23)
Standard I Exp 7.55 2.49 0.98 10.86
Standard I Cont 7.66 2.04 0.99 10.48
Me
an S
core
s o
f St
ud
en
ts
Mean Score of Class I English
12 | P a g e
2) There was a significant proportion of children who could not answer the test at all.
These children must be drawn into the educative process by making learning more
enjoyable and easily comprehensible.
3. Mathematics
An achievement test of a total of 30 marks was prepared including questions of Measurement (4
marks), Counting (5 marks), Matching of 2D Shapes (4 marks), Number Operations like Addition (4
marks) & Subtraction (4 marks) and Identification of Numbers (4 marks) & Money (5 marks). The
Mathematics achievement test was administered on a total of 300 standard I students of 60 Govt.
Primary Schools of the Rajaund and Babain blocks. Out of 300 students, 129 (43%) students were male
and 141 (47%) students were female whereas, 20 (6.66) students did not respond. Block-wise, 129 (66
male and 63 female) students were from Rajaund block and 141 (73 male and 68 female) students
were from Babain block. The following figure 9 to figure 12 presents the learning level/performance
of standard I students in the Mathematics achievement test.
Rajaund: Out of the total 150 (100%) standard I students from Rajaund block, 64 (42.66%) were male
and 77 (51.33%) were female whereas, remaining 9 (6%) students did not respond. Out of total 150
(100%) students, 75 (50%) were from experimental group whereas, 75 (50%) students were from
control group. Out of the 75 (100%) students from experimental group, 27 (36%) were male and 43
(57.33%) were female whereas, the remaining 5 (6.66%) students did not respond. Similarly, out of
the 75 (100%) students from control group, 37 (49.33%) were male and 34 (45.33%) were female
whereas, the remaining 4 (5.33) students did not respond. Figure 10 shows gender wise learning level
of standard I students of experimental and control group in Hindi.
13 | P a g e
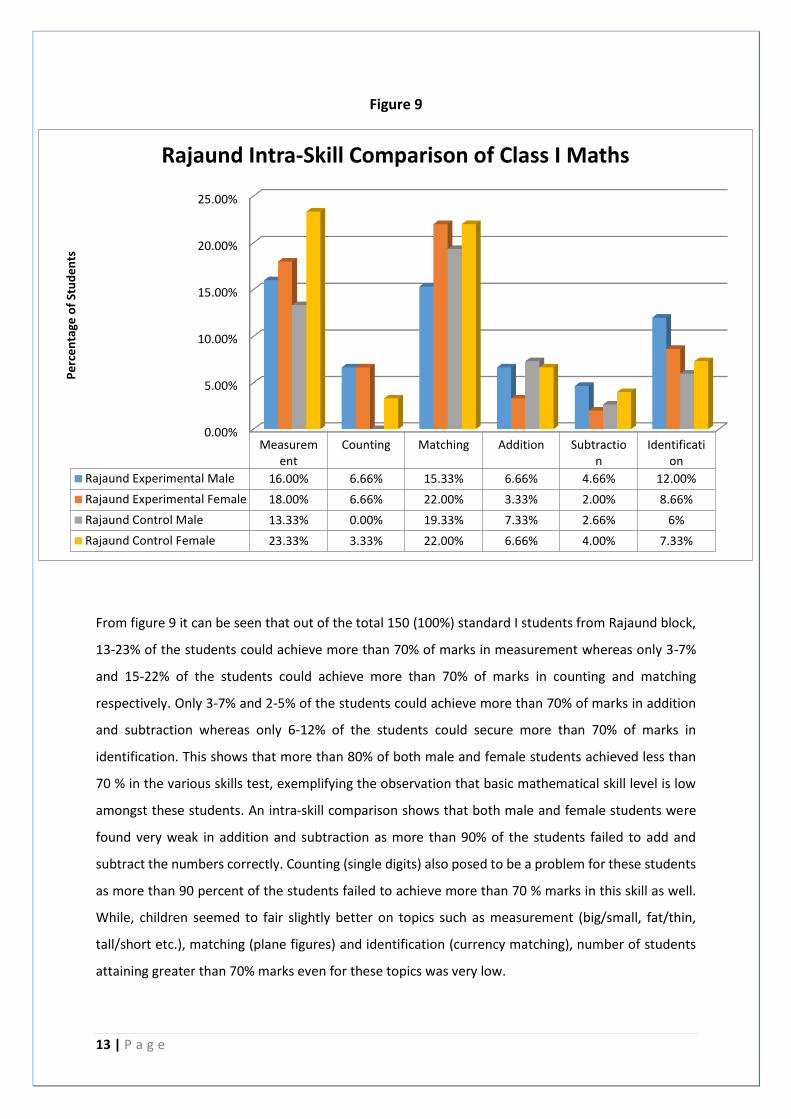
Figure 9
From figure 9 it can be seen that out of the total 150 (100%) standard I students from Rajaund block,
13-23% of the students could achieve more than 70% of marks in measurement whereas only 3-7%
and 15-22% of the students could achieve more than 70% of marks in counting and matching
respectively. Only 3-7% and 2-5% of the students could achieve more than 70% of marks in addition
and subtraction whereas only 6-12% of the students could secure more than 70% of marks in
identification. This shows that more than 80% of both male and female students achieved less than
70 % in the various skills test, exemplifying the observation that basic mathematical skill level is low
amongst these students. An intra-skill comparison shows that both male and female students were
found very weak in addition and subtraction as more than 90% of the students failed to add and
subtract the numbers correctly. Counting (single digits) also posed to be a problem for these students
as more than 90 percent of the students failed to achieve more than 70 % marks in this skill as well.
While, children seemed to fair slightly better on topics such as measurement (big/small, fat/thin,
tall/short etc.), matching (plane figures) and identification (currency matching), number of students
attaining greater than 70% marks even for these topics was very low.
0.00%
5.00%
10.00%
15.00%
20.00%
25.00%
Measurement
Counting Matching Addition Subtraction
Identification
Rajaund Experimental Male 16.00% 6.66% 15.33% 6.66% 4.66% 12.00%
Rajaund Experimental Female 18.00% 6.66% 22.00% 3.33% 2.00% 8.66%
Rajaund Control Male 13.33% 0.00% 19.33% 7.33% 2.66% 6%
Rajaund Control Female 23.33% 3.33% 22.00% 6.66% 4.00% 7.33%
Pe
rce
nta
ge o
f St
ud
en
ts
Rajaund Intra-Skill Comparison of Class I Maths
14 | P a g e
Babain: Out of the total 150 (100%) standard I students from Babain block, 70 (46.66%) were male
and 66 (44%) were female whereas, remaining 14 (9.33%) students did not respond. Out of total 150
(100%) students, 75 (50%) were from experimental group whereas, 75 (50%) students were from
control group. Out of the 75 (100%) students from experimental group, 32 (42.66%) were male and
36 (48%) were female whereas, the remaining 7 (9.33%) students did not respond. Same as, out of the
75 (100%) students from control group, 38 (50.66%) were male and 30 (40%) were female whereas,
the remaining 7 (9.33) students did not respond. The figure 11 shows gender-wise learning level of
standard I students of experimental and control group in Hindi.
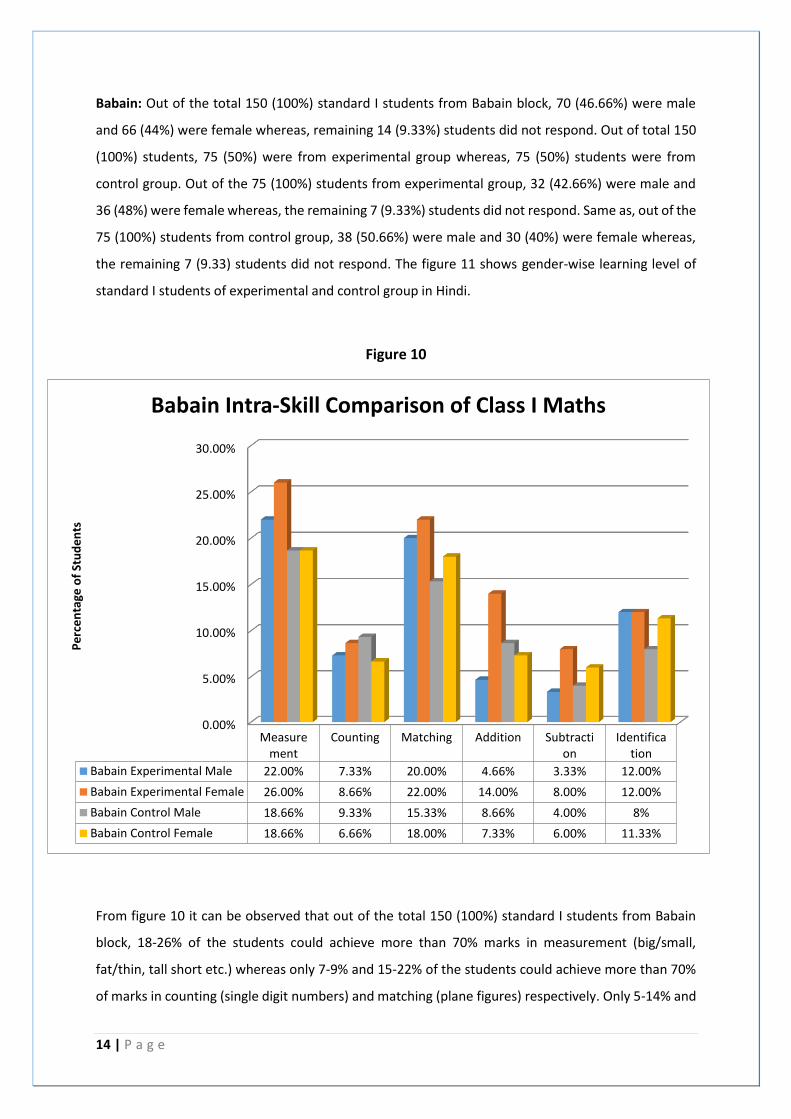
Figure 10
From figure 10 it can be observed that out of the total 150 (100%) standard I students from Babain
block, 18-26% of the students could achieve more than 70% marks in measurement (big/small,
fat/thin, tall short etc.) whereas only 7-9% and 15-22% of the students could achieve more than 70%
of marks in counting (single digit numbers) and matching (plane figures) respectively. Only 5-14% and
0.00%
5.00%
10.00%
15.00%
20.00%
25.00%
30.00%
Measurement
Counting Matching Addition Subtraction
Identification
Babain Experimental Male 22.00% 7.33% 20.00% 4.66% 3.33% 12.00%
Babain Experimental Female 26.00% 8.66% 22.00% 14.00% 8.00% 12.00%
Babain Control Male 18.66% 9.33% 15.33% 8.66% 4.00% 8%
Babain Control Female 18.66% 6.66% 18.00% 7.33% 6.00% 11.33%
Pe
rce
nta
ge o
f St
ud
en
ts
Babain Intra-Skill Comparison of Class I Maths
15 | P a g e
3-8% of the students could achieve more than 70% of marks in addition and subtraction whereas 8-
12% of the students could secure more than 70% of marks in identification of currency. Thus it can be
inferred that more than 80% of both male and female students secured less than 70 percent in the
overall Math skills test.
An intra-skill comparison shows that both male and female students were found very weak in addition
and subtraction as more than 90% of the students failed to add and subtract the numbers correctly.
Counting (single digits) also posed to be a problem for these students as more than 90 percent of the
students failed to achieve more than 70 % marks in this skill as well. While, children seemed to fair
slightly better on topics such as measurement (big/small, fat/thin, tall/short etc.), matching (plane
figures) and identification (currency matching), number of students attaining greater than 70% marks
even for these topics was very low.
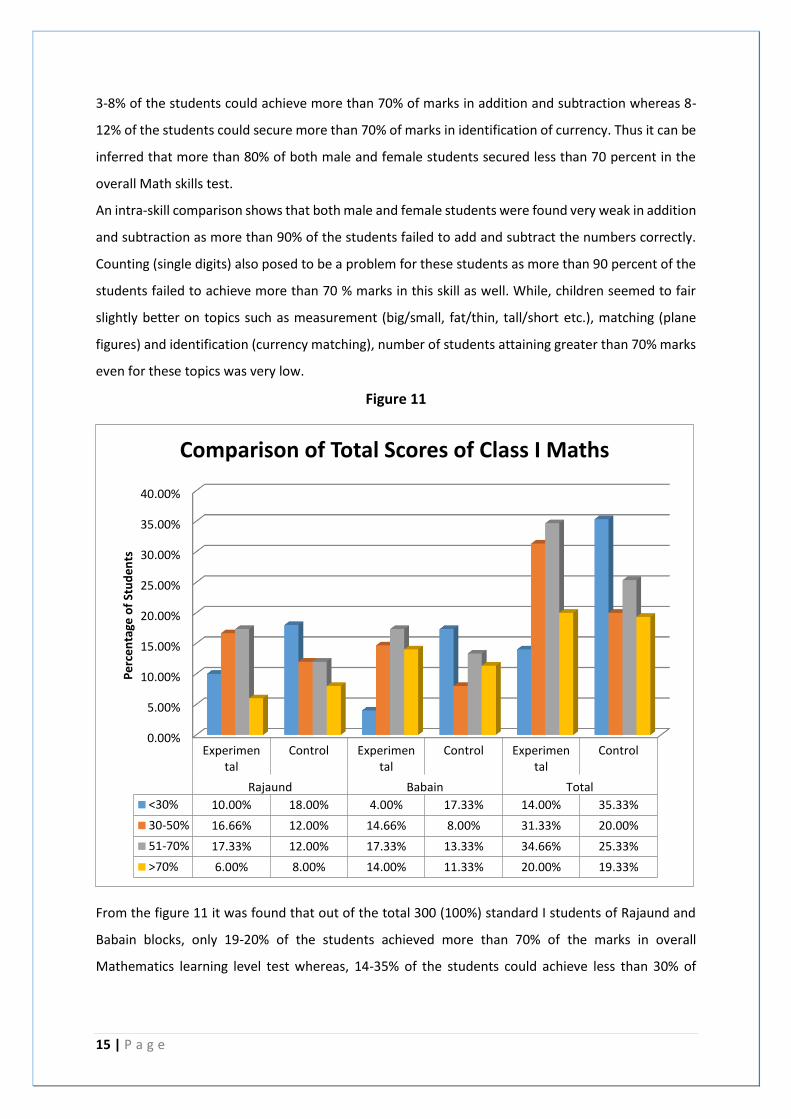
Figure 11
From the figure 11 it was found that out of the total 300 (100%) standard I students of Rajaund and
Babain blocks, only 19-20% of the students achieved more than 70% of the marks in overall
Mathematics learning level test whereas, 14-35% of the students could achieve less than 30% of
0.00%
5.00%
10.00%
15.00%
20.00%
25.00%
30.00%
35.00%
40.00%
Experimental
Control Experimental
Control Experimental
Control
Rajaund Babain Total
<30% 10.00% 18.00% 4.00% 17.33% 14.00% 35.33%
30-50% 16.66% 12.00% 14.66% 8.00% 31.33% 20.00%
51-70% 17.33% 12.00% 17.33% 13.33% 34.66% 25.33%
>70% 6.00% 8.00% 14.00% 11.33% 20.00% 19.33%
Pe
rce
nta
ge o
f St
ud
en
ts
Comparison of Total Scores of Class I Maths
16 | P a g e
marks. 20-31% achieved 30-50%, 25-34% of the students achieved 51-70% of marks in the overall
Mathematics learning level test.
Thus it can be seen that 45-55% of students are still attaining an overall score of less than 50%. This is
a large proportion of students who need to be brought into the above 50 % bracket.
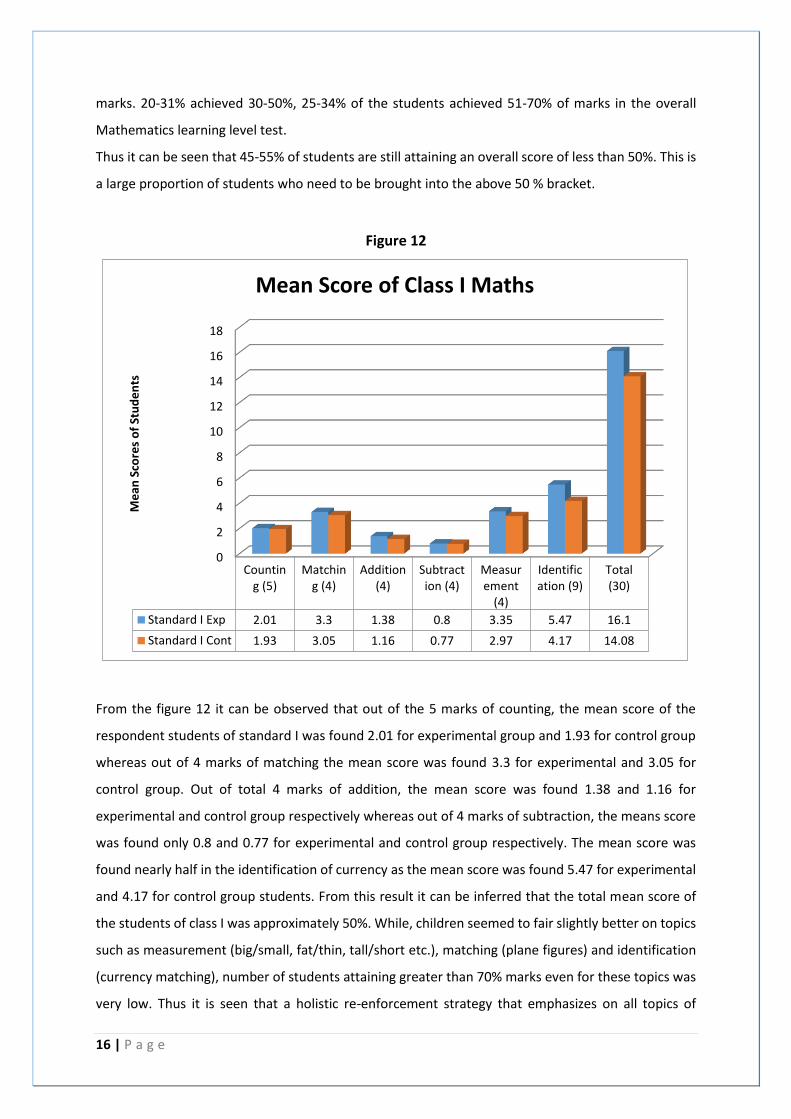
Figure 12
From the figure 12 it can be observed that out of the 5 marks of counting, the mean score of the
respondent students of standard I was found 2.01 for experimental group and 1.93 for control group
whereas out of 4 marks of matching the mean score was found 3.3 for experimental and 3.05 for
control group. Out of total 4 marks of addition, the mean score was found 1.38 and 1.16 for
experimental and control group respectively whereas out of 4 marks of subtraction, the means score
was found only 0.8 and 0.77 for experimental and control group respectively. The mean score was
found nearly half in the identification of currency as the mean score was found 5.47 for experimental
and 4.17 for control group students. From this result it can be inferred that the total mean score of
the students of class I was approximately 50%. While, children seemed to fair slightly better on topics
such as measurement (big/small, fat/thin, tall/short etc.), matching (plane figures) and identification
(currency matching), number of students attaining greater than 70% marks even for these topics was
very low. Thus it is seen that a holistic re-enforcement strategy that emphasizes on all topics of
0
2
4
6
8
10
12
14
16
18
Counting (5)
Matching (4)
Addition(4)
Subtraction (4)
Measurement
(4)
Identification (9)
Total(30)
Standard I Exp 2.01 3.3 1.38 0.8 3.35 5.47 16.1
Standard I Cont 1.93 3.05 1.16 0.77 2.97 4.17 14.08
Me
an S
core
s o
f St
ud
en
ts
Mean Score of Class I Maths
17 | P a g e
mathematics using real world examples, objects, teaching aids and other engaging strategies would
make learning more enjoyable and understandable for children.
OVERALL INFERENCE:
1) The proportion of students achieving >50% marks in any of the mathematical skills is very
low. Effort needs to be made to bring a larger population of the students into the >50 %
bracket for all skills- counting, matching, addition, subtraction, measurement and
identification.
2) Even though children seemed to be struggling with certain concepts like addition,
subtraction and currency identification, it was also seen that a very small proportion of
children achieved >70% scores even on the other concepts tested. Thus it is seen that a
holistic re-enforcement strategy that emphasizes on all topics of mathematics using real
world examples, objects, teaching aids and other engaging strategies would make learning
more enjoyable and understandable for children.
3) There was a significant proportion of children who could not answer the test at all. These
children must be drawn into the educative process by making learning more enjoyable
and easily comprehensible.
18 | P a g e
Section II: Standard II 1. Hindi
An achievement test of a total of 26 marks was prepared including questions of Listening (2 marks),
Reading (17 marks) and Writing (7 marks). The Hindi achievement test was administered on a total of
300 standard III students of 60 Govt. Primary Schools of Rajaund and Babain blocks. Out of 300
students, 131 (43.66%) students were male and 150 (50%) students were female whereas 19 (6.33%)
students did not respond. Block wise, 142 (65 male and 77 female) students were from Rajaund block
and 139 (66 male and 73 female) students were from Babain block. The following figure 13 to figure
16 presents the learning level/performance of standard II students in Hindi achievement test.
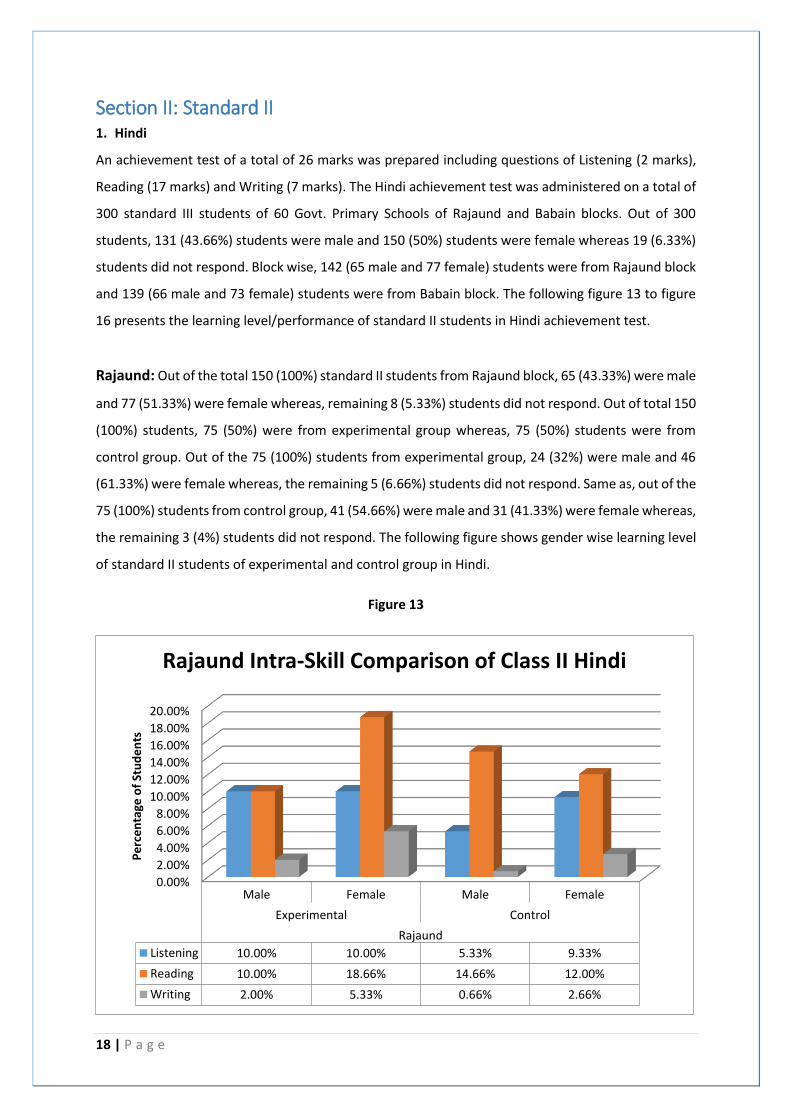
Rajaund: Out of the total 150 (100%) standard II students from Rajaund block, 65 (43.33%) were male
and 77 (51.33%) were female whereas, remaining 8 (5.33%) students did not respond. Out of total 150
(100%) students, 75 (50%) were from experimental group whereas, 75 (50%) students were from
control group. Out of the 75 (100%) students from experimental group, 24 (32%) were male and 46
(61.33%) were female whereas, the remaining 5 (6.66%) students did not respond. Same as, out of the
75 (100%) students from control group, 41 (54.66%) were male and 31 (41.33%) were female whereas,
the remaining 3 (4%) students did not respond. The following figure shows gender wise learning level
of standard II students of experimental and control group in Hindi.
Figure 13
0.00%
2.00%
4.00%
6.00%
8.00%
10.00%
12.00%
14.00%
16.00%
18.00%
20.00%
Male Female Male Female
Experimental Control
Rajaund
Listening 10.00% 10.00% 5.33% 9.33%
Reading 10.00% 18.66% 14.66% 12.00%
Writing 2.00% 5.33% 0.66% 2.66%
Pe
rce
nta
ge o
f St
ud
en
ts
Rajaund Intra-Skill Comparison of Class II Hindi
19 | P a g e
From figure 13 it can be seen that out of the total 150 (100%) students from Rajaund block, only 5-
10% of the students could secure more than 70% of marks in listening skills (four lines riddles) and 10-
18% of students could secure more than 70% of marks in reading skill (body parts, family members,
community workers and naming words). Only 1-5% of the students could secure more than 70% of
marks in writing skills (three letter words). This means that more than 80% of both male and female
students failed to secure >70% in the overall Hindi test. Both the experimental and control group
students were found very weak in Hindi writing skill as nearly 95% of both male and female students
could not achieve more than 70% of marks in Hindi writing test. . It is seen from the graph that the
proficiency in writing skills is very low, however even the proficiency in listening skills and reading skills
is well below acceptable levels as will be elucidated in the subsequent graphs.
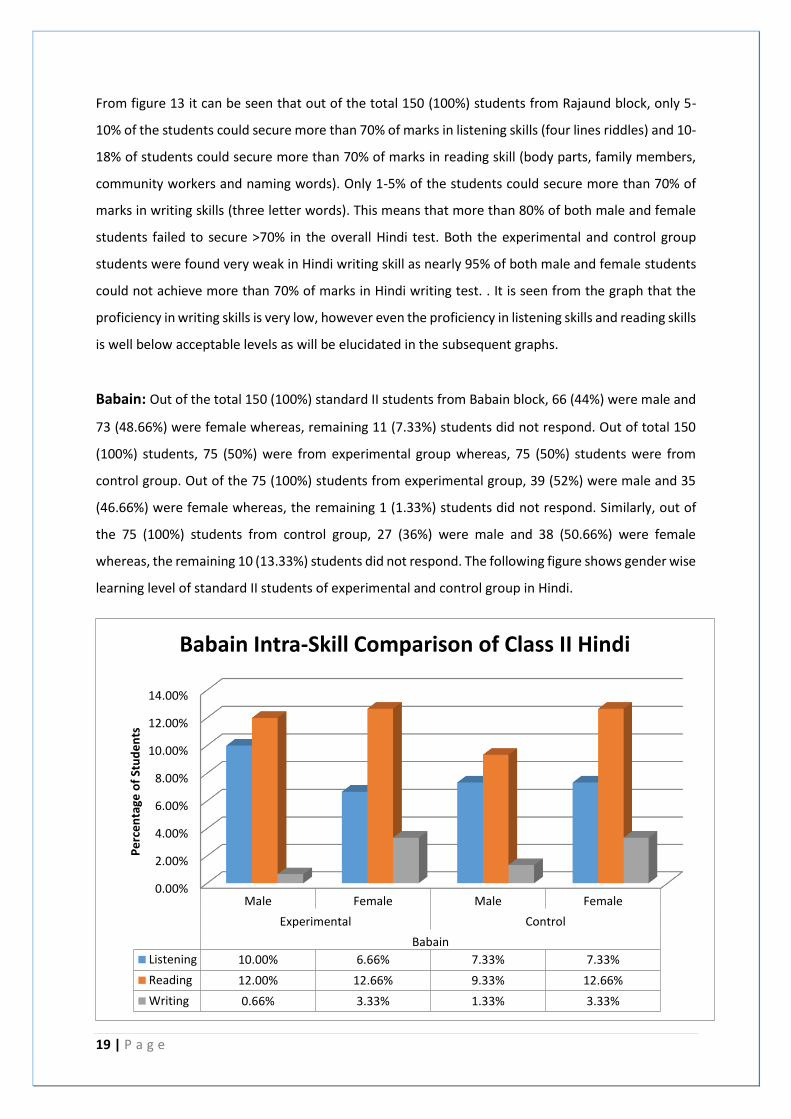
Babain: Out of the total 150 (100%) standard II students from Babain block, 66 (44%) were male and
73 (48.66%) were female whereas, remaining 11 (7.33%) students did not respond. Out of total 150
(100%) students, 75 (50%) were from experimental group whereas, 75 (50%) students were from
control group. Out of the 75 (100%) students from experimental group, 39 (52%) were male and 35
(46.66%) were female whereas, the remaining 1 (1.33%) students did not respond. Similarly, out of
the 75 (100%) students from control group, 27 (36%) were male and 38 (50.66%) were female
whereas, the remaining 10 (13.33%) students did not respond. The following figure shows gender wise
learning level of standard II students of experimental and control group in Hindi.
0.00%
2.00%
4.00%
6.00%
8.00%
10.00%
12.00%
14.00%
Male Female Male Female
Experimental Control
Babain
Listening 10.00% 6.66% 7.33% 7.33%
Reading 12.00% 12.66% 9.33% 12.66%
Writing 0.66% 3.33% 1.33% 3.33%
Pe
rce
nta
ge o
f St
ud
en
ts
Babain Intra-Skill Comparison of Class II Hindi
20 | P a g e
From figure 14 it can be observed that out of the total 150 (100%) students from Babain block, only 6-
10% of the students could secure more than 70% in the listening skill test (four line riddles) and 9-13%
of the students could secure more than 70% in the reading skill test (body parts, family members,
community workers and naming words), only 1-3% of students could secure more than 70% in the
writing skill test (three letter words) in Hindi. This means that more than 90% of both male and female
students failed to secure a minimum of 70% in basic skills in Hindi language. It is also seen through the
graph that both male and female students of experimental and control group seem to be struggling
much more with writing and listening skills in Hindi as compared to reading skills. This could be
because the listening test on this exam involved four lined riddles and not just words. Children might
have been unable to follow four lined riddles. A re-enforcement strategy that can make listening to
longer sentences and writing more enjoyable and understandable for children would greatly benefit
the class at large.
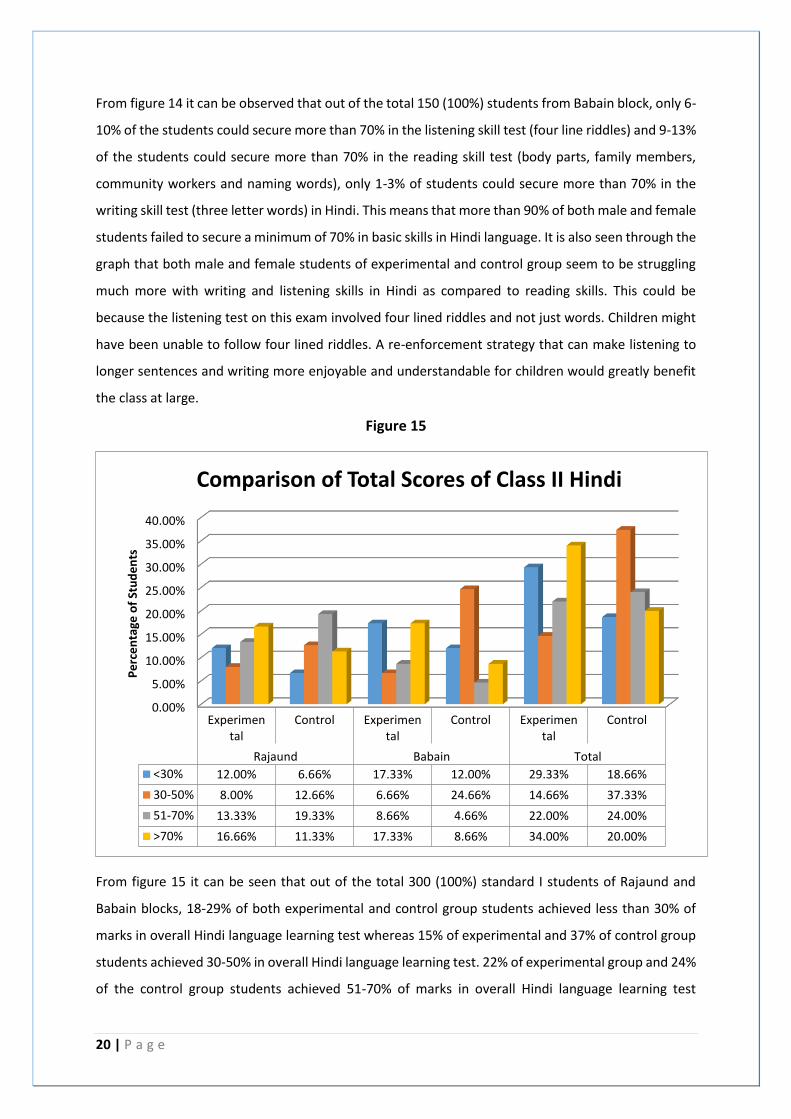
Figure 15
From figure 15 it can be seen that out of the total 300 (100%) standard I students of Rajaund and
Babain blocks, 18-29% of both experimental and control group students achieved less than 30% of
marks in overall Hindi language learning test whereas 15% of experimental and 37% of control group
students achieved 30-50% in overall Hindi language learning test. 22% of experimental group and 24%
of the control group students achieved 51-70% of marks in overall Hindi language learning test
0.00%
5.00%
10.00%
15.00%
20.00%
25.00%
30.00%
35.00%
40.00%
Experimental
Control Experimental
Control Experimental
Control
Rajaund Babain Total
<30% 12.00% 6.66% 17.33% 12.00% 29.33% 18.66%
30-50% 8.00% 12.66% 6.66% 24.66% 14.66% 37.33%
51-70% 13.33% 19.33% 8.66% 4.66% 22.00% 24.00%
>70% 16.66% 11.33% 17.33% 8.66% 34.00% 20.00%
Pe
rce
nta
ge o
f St
ud
en
ts
Comparison of Total Scores of Class II Hindi
21 | P a g e
whereas, 34% of the experimental and 20% of control group students achieved more than 70% in
overall Hindi language learning test.
This means that almost 45-% of the students achieved less than 50% marks from the experimental
group and almost 50% of students achieved less than 50% marks from the control group.
It is clear from the graphs above that majority of the children are unable to get more than 50% marks
and that the proficiency in writing skills is very low, however even the proficiency in listening skills and
reading skills is well below acceptable levels as will be elucidated in the subsequent graphs.
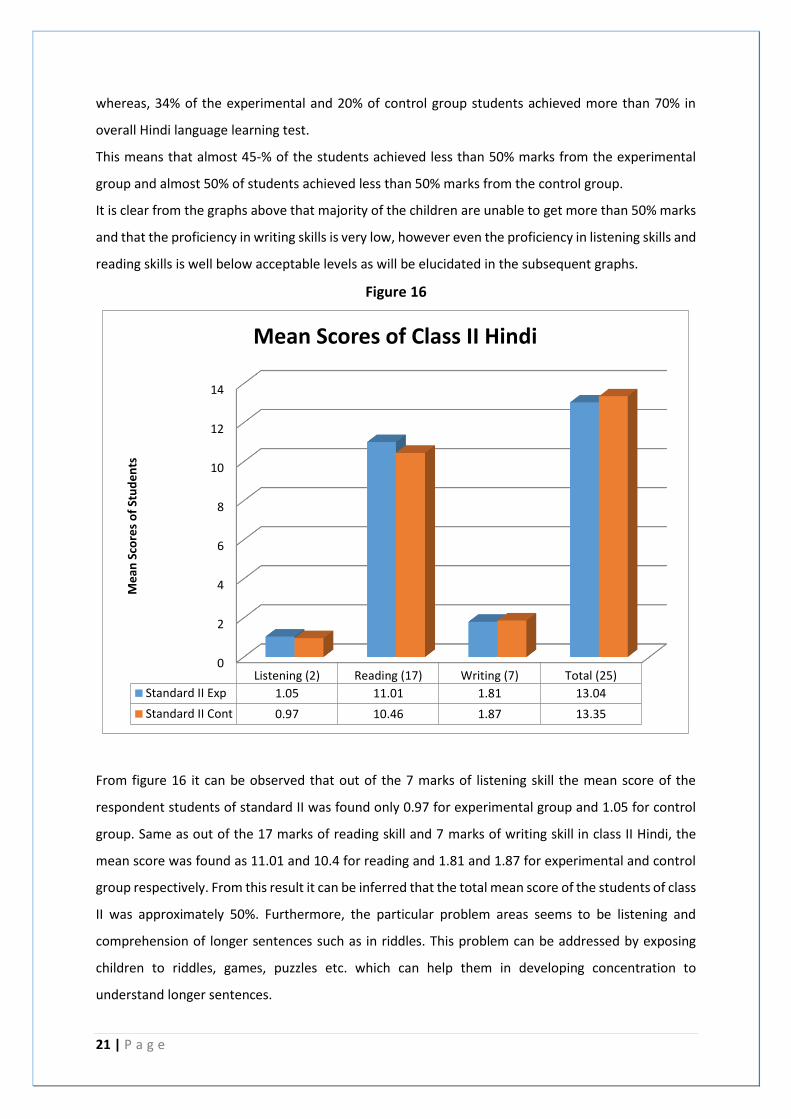
Figure 16
From figure 16 it can be observed that out of the 7 marks of listening skill the mean score of the
respondent students of standard II was found only 0.97 for experimental group and 1.05 for control
group. Same as out of the 17 marks of reading skill and 7 marks of writing skill in class II Hindi, the
mean score was found as 11.01 and 10.4 for reading and 1.81 and 1.87 for experimental and control
group respectively. From this result it can be inferred that the total mean score of the students of class
II was approximately 50%. Furthermore, the particular problem areas seems to be listening and
comprehension of longer sentences such as in riddles. This problem can be addressed by exposing
children to riddles, games, puzzles etc. which can help them in developing concentration to
understand longer sentences.
0
2
4
6
8
10
12
14
Listening (2) Reading (17) Writing (7) Total (25)
Standard II Exp 1.05 11.01 1.81 13.04
Standard II Cont 0.97 10.46 1.87 13.35
Me
an S
core
s o
f St
ud
en
ts
Mean Scores of Class II Hindi
22 | P a g e
OVERALL INFERENCE:
1) The proportion of students achieving >50% marks in any of the 3 skills is very low. Effort needs
to be made to bring a larger population of the students into the >50 % bracket for all skills-
listening, reading and writing.
2) There was a significant proportion of children that could not answer the test at all. These
children must be drawn into the educative process by making learning more enjoyable and
easily comprehensible.
2. English
An achievement test of a total of 20 marks was prepared including questions of Listening (10 marks),
Reading (6 marks) and Writing (4 marks). The English achievement test was administered on a total of
300 standard II students of 60 Govt. Primary Schools of the Rajaund and Babain blocks. Out of 300
students, 131 (43.66%) students were male and 156 (52%) students were female whereas the
remaining 13 (4.33%) students did not respond. Block-wise, 147 (67 male and 80 female) students
were from Rajaund block and 140 (64 male and 76 female) students were from Babain block. The
following figure 17 to figure 20 presents the learning level/performance of standard II students in
English achievement test.
Rajaund: Out of the total 150 (100%) standard II students from Rajaund block, 67 (44.66%) were male
and 80 (53.33%) were female whereas, remaining 3 (2 %) students did not respond. Out of total 150
(100%) students, 75 (50%) were from experimental group whereas, 75 (50%) students were from
control group. Out of the 75 (100%) students from experimental group, 40 (53.33%) were male and
35 (46.66%) were female. Similarly, out of the 75 (100%) students from control group, 27 (36%) were
male and 45 (60%) were female whereas, the remaining 3 (4%) students did not respond. The following
figure shows gender wise learning level of standard II students of experimental and control group in
English.
23 | P a g e
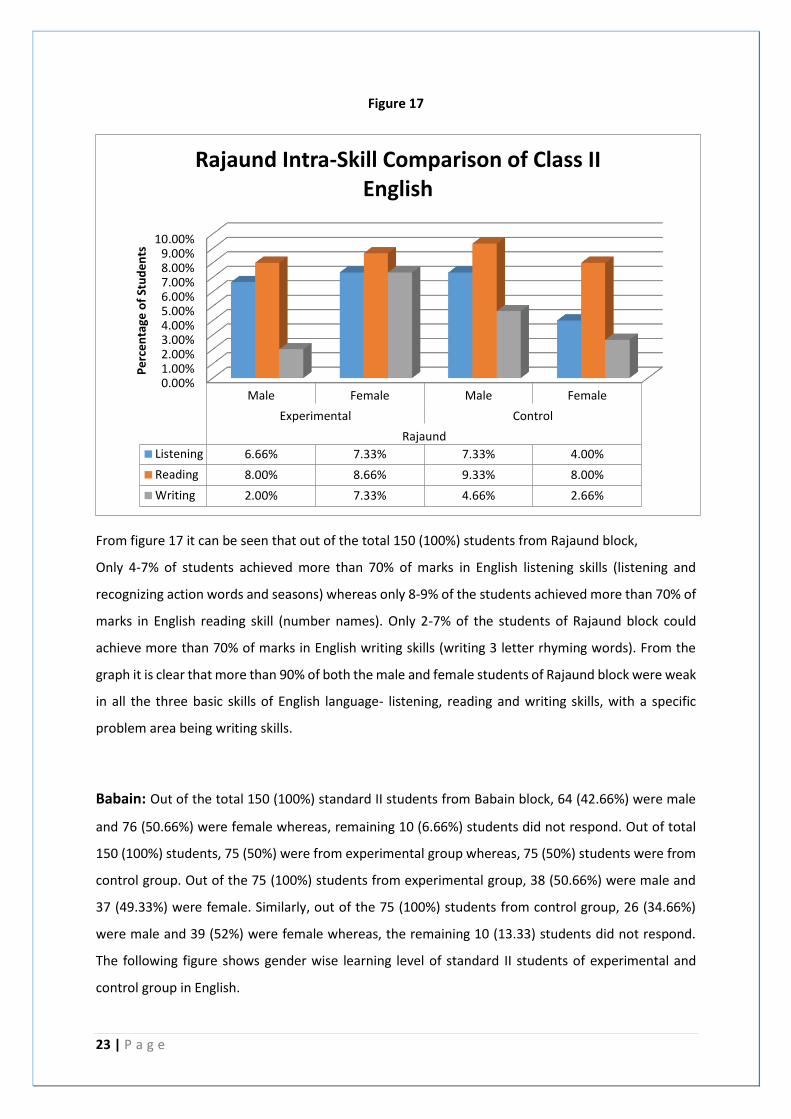
Figure 17
From figure 17 it can be seen that out of the total 150 (100%) students from Rajaund block,
Only 4-7% of students achieved more than 70% of marks in English listening skills (listening and
recognizing action words and seasons) whereas only 8-9% of the students achieved more than 70% of
marks in English reading skill (number names). Only 2-7% of the students of Rajaund block could
achieve more than 70% of marks in English writing skills (writing 3 letter rhyming words). From the
graph it is clear that more than 90% of both the male and female students of Rajaund block were weak
in all the three basic skills of English language- listening, reading and writing skills, with a specific
problem area being writing skills.
Babain: Out of the total 150 (100%) standard II students from Babain block, 64 (42.66%) were male
and 76 (50.66%) were female whereas, remaining 10 (6.66%) students did not respond. Out of total
150 (100%) students, 75 (50%) were from experimental group whereas, 75 (50%) students were from
control group. Out of the 75 (100%) students from experimental group, 38 (50.66%) were male and
37 (49.33%) were female. Similarly, out of the 75 (100%) students from control group, 26 (34.66%)
were male and 39 (52%) were female whereas, the remaining 10 (13.33) students did not respond.
The following figure shows gender wise learning level of standard II students of experimental and
control group in English.
0.00%1.00%2.00%3.00%4.00%5.00%6.00%7.00%8.00%9.00%
10.00%
Male Female Male Female
Experimental Control
Rajaund
Listening 6.66% 7.33% 7.33% 4.00%
Reading 8.00% 8.66% 9.33% 8.00%
Writing 2.00% 7.33% 4.66% 2.66%
Pe
rce
nta
ge o
f St
ud
en
ts
Rajaund Intra-Skill Comparison of Class II English
24 | P a g e
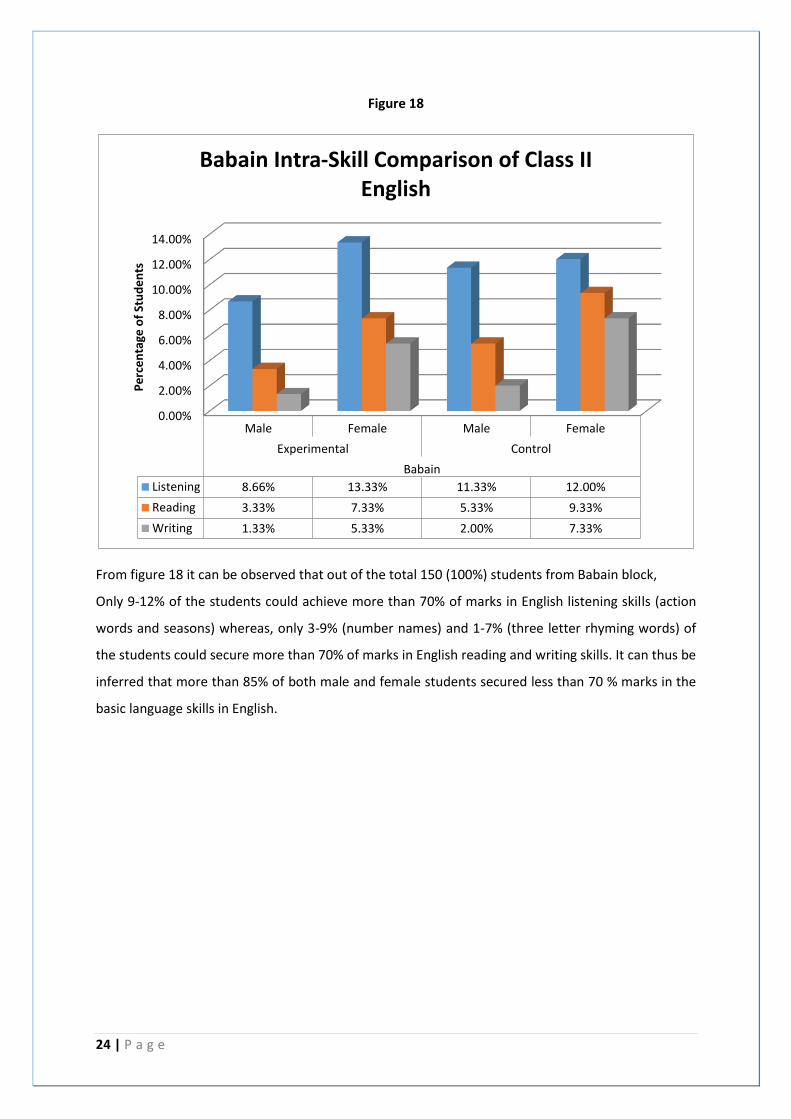
Figure 18
From figure 18 it can be observed that out of the total 150 (100%) students from Babain block,
Only 9-12% of the students could achieve more than 70% of marks in English listening skills (action
words and seasons) whereas, only 3-9% (number names) and 1-7% (three letter rhyming words) of
the students could secure more than 70% of marks in English reading and writing skills. It can thus be
inferred that more than 85% of both male and female students secured less than 70 % marks in the
basic language skills in English.
0.00%
2.00%
4.00%
6.00%
8.00%
10.00%
12.00%
14.00%
Male Female Male Female
Experimental Control
Babain
Listening 8.66% 13.33% 11.33% 12.00%
Reading 3.33% 7.33% 5.33% 9.33%
Writing 1.33% 5.33% 2.00% 7.33%
Pe
rce
nta
ge o
f St
ud
en
ts
Babain Intra-Skill Comparison of Class II English
25 | P a g e
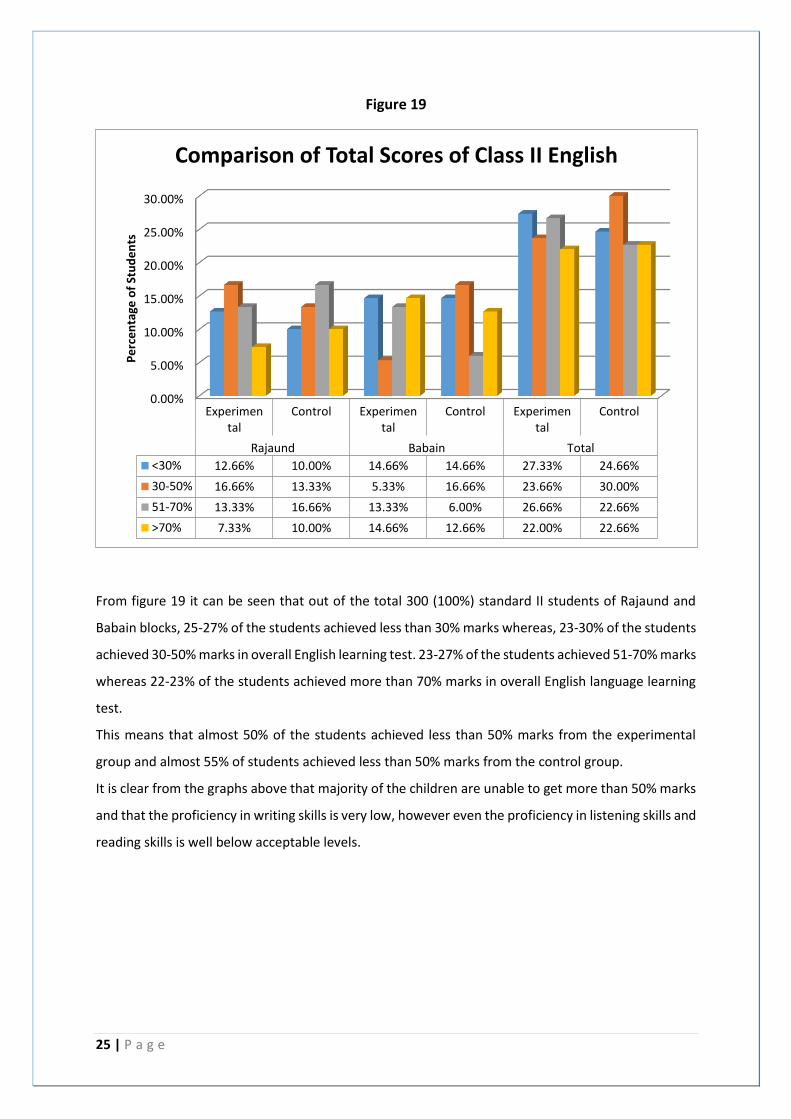
Figure 19
From figure 19 it can be seen that out of the total 300 (100%) standard II students of Rajaund and
Babain blocks, 25-27% of the students achieved less than 30% marks whereas, 23-30% of the students
achieved 30-50% marks in overall English learning test. 23-27% of the students achieved 51-70% marks
whereas 22-23% of the students achieved more than 70% marks in overall English language learning
test.
This means that almost 50% of the students achieved less than 50% marks from the experimental
group and almost 55% of students achieved less than 50% marks from the control group.
It is clear from the graphs above that majority of the children are unable to get more than 50% marks
and that the proficiency in writing skills is very low, however even the proficiency in listening skills and
reading skills is well below acceptable levels.
0.00%
5.00%
10.00%
15.00%
20.00%
25.00%
30.00%
Experimental
Control Experimental
Control Experimental
Control
Rajaund Babain Total
<30% 12.66% 10.00% 14.66% 14.66% 27.33% 24.66%
30-50% 16.66% 13.33% 5.33% 16.66% 23.66% 30.00%
51-70% 13.33% 16.66% 13.33% 6.00% 26.66% 22.66%
>70% 7.33% 10.00% 14.66% 12.66% 22.00% 22.66%
Pe
rce
nta
ge o
f St
ud
en
ts
Comparison of Total Scores of Class II English
26 | P a g e
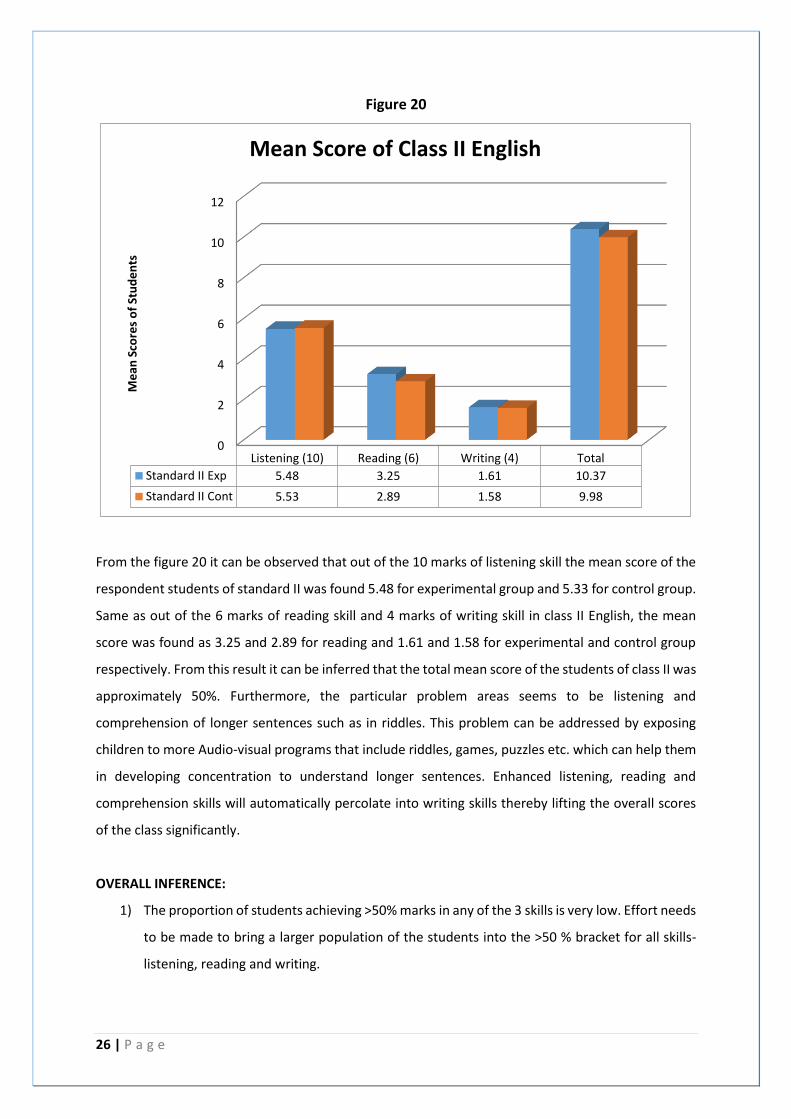
Figure 20
From the figure 20 it can be observed that out of the 10 marks of listening skill the mean score of the
respondent students of standard II was found 5.48 for experimental group and 5.33 for control group.
Same as out of the 6 marks of reading skill and 4 marks of writing skill in class II English, the mean
score was found as 3.25 and 2.89 for reading and 1.61 and 1.58 for experimental and control group
respectively. From this result it can be inferred that the total mean score of the students of class II was
approximately 50%. Furthermore, the particular problem areas seems to be listening and
comprehension of longer sentences such as in riddles. This problem can be addressed by exposing
children to more Audio-visual programs that include riddles, games, puzzles etc. which can help them
in developing concentration to understand longer sentences. Enhanced listening, reading and
comprehension skills will automatically percolate into writing skills thereby lifting the overall scores
of the class significantly.
OVERALL INFERENCE:
1) The proportion of students achieving >50% marks in any of the 3 skills is very low. Effort needs
to be made to bring a larger population of the students into the >50 % bracket for all skills-
listening, reading and writing.
0
2
4
6
8
10
12
Listening (10) Reading (6) Writing (4) Total
Standard II Exp 5.48 3.25 1.61 10.37
Standard II Cont 5.53 2.89 1.58 9.98
Me
an S
core
s o
f St
ud
en
ts
Mean Score of Class II English
27 | P a g e
2) There was a significant proportion of children that could not answer the test at all. These
children must be drawn into the educative process by making learning more enjoyable and
easily comprehensible.
3. Mathematics
An achievement test of a total of 50 marks was prepared including questions of Shape
Recognition/Matching of 2D & 3D Shapes (9 marks), Counting & Number Recognition (4 marks),
Comparison of Ascending Order (4 marks) & Descending Order (4 marks), Number Operations like
Addition (6 marks) & Subtraction (6 marks), Measurement Units (8 marks) and Time-name of days and
months (9 marks). The Mathematics achievement test was administered on a total of 300 standard II
students of 60 Govt. Primary Schools of the Rajaund and Babain blocks. Out of 300 students, 126 (43%)
students were male and 153 (51%) students were female whereas the remaining 21 (7%) students did
not respond. Block-wise, 145 (63 male and 80 female) students were from Rajaund block and 134 (63
male and 71 female) students were from Babain block. The following figure 21 to figure 24 presents
the learning level/performance of standard II students in Mathematics achievement test.
Rajaund: Out of the total 150 (100%) standard II students from Rajaund block, 63 (42 %) were male
and 82 (54.66%) were female whereas, remaining 5 (3.33%) students did not respond. Out of total 150
(100%) students, 75 (50%) were from experimental group whereas, 75 (50%) students were from
control group. Out of the 75 (100%) students from experimental group, 37 (49.33%) were male and
36 (48%) were female whereas, the remaining 2 (2.66%) students did not respond. Same as, out of the
75 (100%) students from control group, 26 (34.66%) were male and 46 (61.33%) were female whereas,
the remaining 3 (4%) students did not respond. The figure 10 shows gender wise learning level of
standard II students of experimental and control group in Mathematics.
28 | P a g e
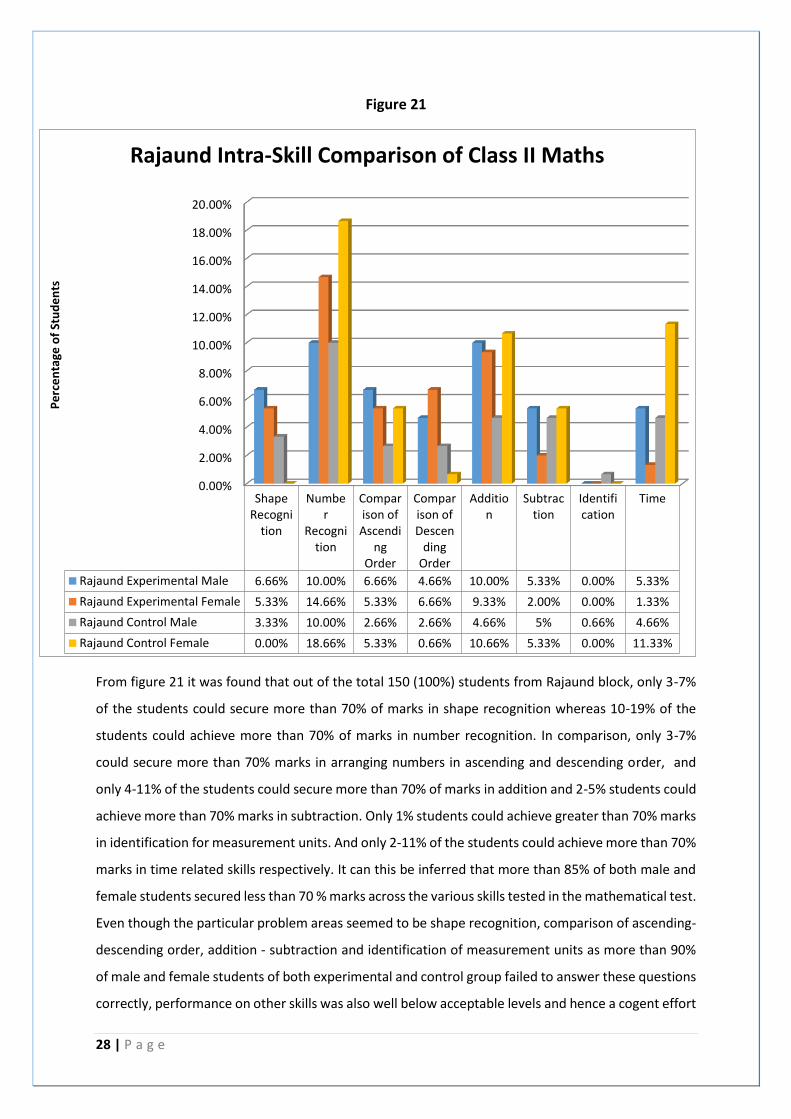
Figure 21
From figure 21 it was found that out of the total 150 (100%) students from Rajaund block, only 3-7%
of the students could secure more than 70% of marks in shape recognition whereas 10-19% of the
students could achieve more than 70% of marks in number recognition. In comparison, only 3-7%
could secure more than 70% marks in arranging numbers in ascending and descending order, and
only 4-11% of the students could secure more than 70% of marks in addition and 2-5% students could
achieve more than 70% marks in subtraction. Only 1% students could achieve greater than 70% marks
in identification for measurement units. And only 2-11% of the students could achieve more than 70%
marks in time related skills respectively. It can this be inferred that more than 85% of both male and
female students secured less than 70 % marks across the various skills tested in the mathematical test.
Even though the particular problem areas seemed to be shape recognition, comparison of ascending-
descending order, addition - subtraction and identification of measurement units as more than 90%
of male and female students of both experimental and control group failed to answer these questions
correctly, performance on other skills was also well below acceptable levels and hence a cogent effort
0.00%
2.00%
4.00%
6.00%
8.00%
10.00%
12.00%
14.00%
16.00%
18.00%
20.00%
ShapeRecogni
tion
Number
Recognition
Comparison ofAscendi
ngOrder
Comparison ofDescen
dingOrder
Addition
Subtraction
Identification
Time
Rajaund Experimental Male 6.66% 10.00% 6.66% 4.66% 10.00% 5.33% 0.00% 5.33%
Rajaund Experimental Female 5.33% 14.66% 5.33% 6.66% 9.33% 2.00% 0.00% 1.33%
Rajaund Control Male 3.33% 10.00% 2.66% 2.66% 4.66% 5% 0.66% 4.66%
Rajaund Control Female 0.00% 18.66% 5.33% 0.66% 10.66% 5.33% 0.00% 11.33%
Pe
rce
nta
ge o
f St
ud
en
ts
Rajaund Intra-Skill Comparison of Class II Maths
29 | P a g e
must be made to enhance all the skills so that the overall performance in the test improves
significantly.
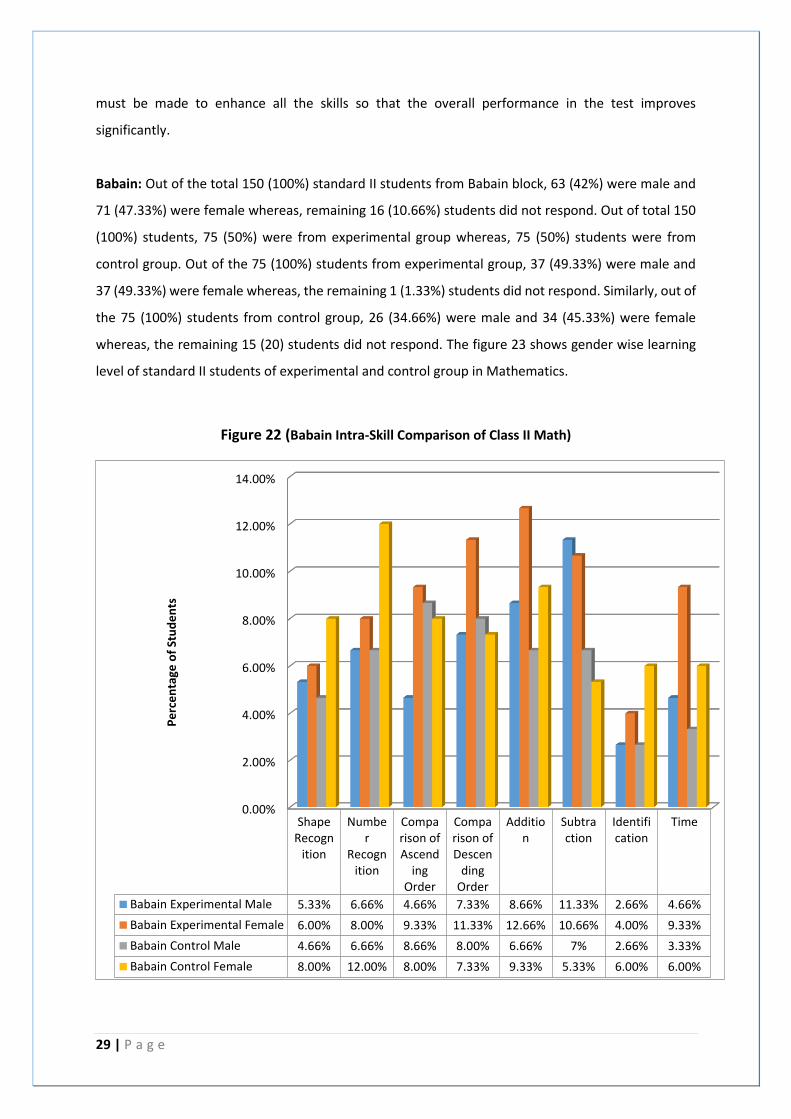
Babain: Out of the total 150 (100%) standard II students from Babain block, 63 (42%) were male and
71 (47.33%) were female whereas, remaining 16 (10.66%) students did not respond. Out of total 150
(100%) students, 75 (50%) were from experimental group whereas, 75 (50%) students were from
control group. Out of the 75 (100%) students from experimental group, 37 (49.33%) were male and
37 (49.33%) were female whereas, the remaining 1 (1.33%) students did not respond. Similarly, out of
the 75 (100%) students from control group, 26 (34.66%) were male and 34 (45.33%) were female
whereas, the remaining 15 (20) students did not respond. The figure 23 shows gender wise learning
level of standard II students of experimental and control group in Mathematics.
Figure 22 (Babain Intra-Skill Comparison of Class II Math)
0.00%
2.00%
4.00%
6.00%
8.00%
10.00%
12.00%
14.00%
ShapeRecogn
ition
Number
Recognition
Comparison ofAscend
ingOrder
Comparison ofDescen
dingOrder
Addition
Subtraction
Identification
Time
Babain Experimental Male 5.33% 6.66% 4.66% 7.33% 8.66% 11.33% 2.66% 4.66%
Babain Experimental Female 6.00% 8.00% 9.33% 11.33% 12.66% 10.66% 4.00% 9.33%
Babain Control Male 4.66% 6.66% 8.66% 8.00% 6.66% 7% 2.66% 3.33%
Babain Control Female 8.00% 12.00% 8.00% 7.33% 9.33% 5.33% 6.00% 6.00%
Pe
rce
nta
ge o
f St
ud
en
ts
30 | P a g e
From figure 22 it can be seen that out of the total 150 (100%) students from Babain block, only 5-8%
of the students could secure more than 70% of marks in shape recognition whereas 7-12% of the
students could achieve more than 70% of marks in number recognition. In comparison, only 5-10%
children could secure >70% marks in arranging numbers in ascending order, only 7-11% of the students
could secure more than 70% of marks in arranging numbers in descending order, 7-13% children could
secure >70% marks in addition while 5-11% students achieved >70% in subtraction related questions.
Only 3-6% students achieved greater than 70% marks in identifying measurement units and only 3-9%
of the students could achieve more than 70% marks in time (days months etc.) related skills
respectively. It can this be inferred that more than 86% of both male and female students secured less
than 70 % marks across the various skills tested in the mathematical test. Even though the particular
problem areas seemed to be shape recognition, comparison of ascending-descending order, addition
- subtraction and identification of measurement units as more than 90% of male and female students
of both experimental and control group failed to answer these questions correctly, performance on
other skills was also well below acceptable levels and hence a cogent effort must be made to enhance
all the skills so that the overall performance in the test improves significantly.
31 | P a g e
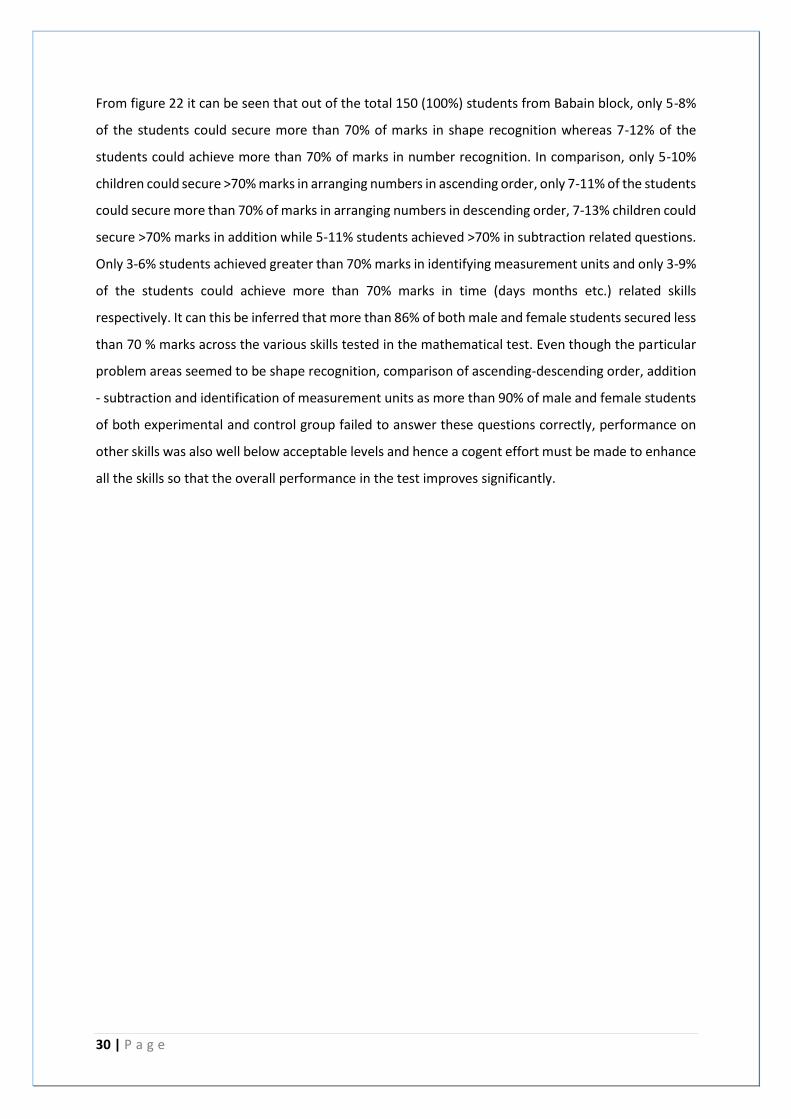
Figure 23
From figure 23 it can be seen that out of the total 300 (100%) standard II students of Rajaund and
Babain blocks, only 10-12% of the students could achieve more than 70% of the marks and 14% of the
students could achieve 50-70% of marks in overall Mathematics learning level test whereas more than
70% of the students achieved less than 50% marks in the mathematics test.
0.00%
10.00%
20.00%
30.00%
40.00%
50.00%
60.00%
Experimental
Control Experimental
Control Experimental
Control
Rajaund Babain Total
<30% 28.66% 26.66% 24.00% 28.66% 53.33% 55.33%
30-50% 11.33% 13.00% 10.00% 6.66% 20.66% 20.66%
51-70% 8.00% 8.00% 6.00% 6.00% 14.00% 14.00%
>70% 2.00% 1.33% 10.00% 8.66% 12.00% 10.00%
Pe
rce
nta
ge o
f St
ud
en
ts
Comparison of Total Scores of Class II Maths
32 | P a g e
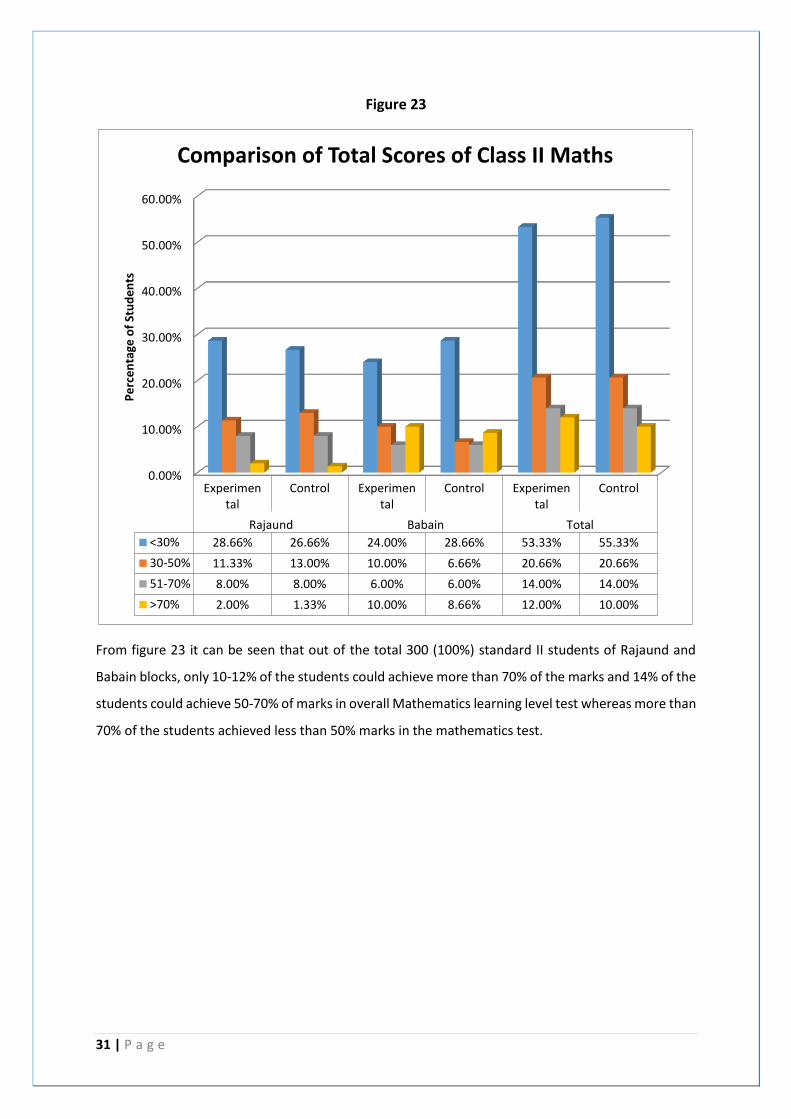
Figure 24
From the figure 24 it can be observed that out of the 9 marks of shape recognition, the mean score of
the respondent students of standard II was found 3.12 for experimental group and 2.6 for control
group whereas out of 4 marks of number recognition, the mean score was found 1.78 for experimental
and 1.98 for control group. Out of total 4 marks of comparison of ascending order, the mean score
was found only 1.51 and 1.33 for experimental and control group respectively whereas out of 4 marks
of comparison of descending order, the means score was found 1.42 and 0.95 for experimental and
control group respectively. Out of total 6 marks of addition, the mean score was found 2.63 and 2.07
for experimental and control group respectively whereas out of 6 marks of subtraction, the means
score was found only 2.72 and 1.62 for experimental and control group respectively. The mean score
for identification of measurement units was 1.79 for experimental and 1.92 for control group students.
From this result it can be inferred that the mean score for the mathematical test across all the skills
tested was as low as 30%. It is seen that performance on all skills was below acceptable levels and
efforts need to be made to improve understanding across all mathematical concepts.
0
2
4
6
8
10
12
14
16
18
ShapeRecognition (9)
Number
Recognition (4)
Comparison ofAscendi
ngOrder
(4)
Comparison ofDescen
dingOrder
(4)
Addition (6)
Subtraction (6)
Identification
(8)
Time(9)
Total(50)
Standard II Exp 3.12 1.78 1.51 1.42 2.63 2.22 1.79 2.26 16.55
Standard II Cont 2.6 1.98 1.33 0.95 2.07 1.62 1.92 2.48 15.05
Me
an S
core
s o
f St
ud
en
ts
Mean Scores of Class II Maths
33 | P a g e
OVERALL INFERENCE:
1) The proportion of students achieving >50% marks in any of the mathematical skills is very
low. Effort needs to be made to bring a larger population of the students into the >50 %
bracket for all skills- counting, matching, addition, subtraction, measurement and
identification.
2) . Even though the particular problem areas seemed to be shape recognition, comparison
of ascending-descending order, addition - subtraction and identification of measurement
units, performance on other skills was also well below acceptable levels and hence a
coherent effort must be made to enhance all the skills so that the overall performance in
the test improves significantly.
3) There was a significant proportion of children who could not answer the test at all. These
children must be drawn into the educative process by making learning more enjoyable
and easily comprehensible.
34 | P a g e
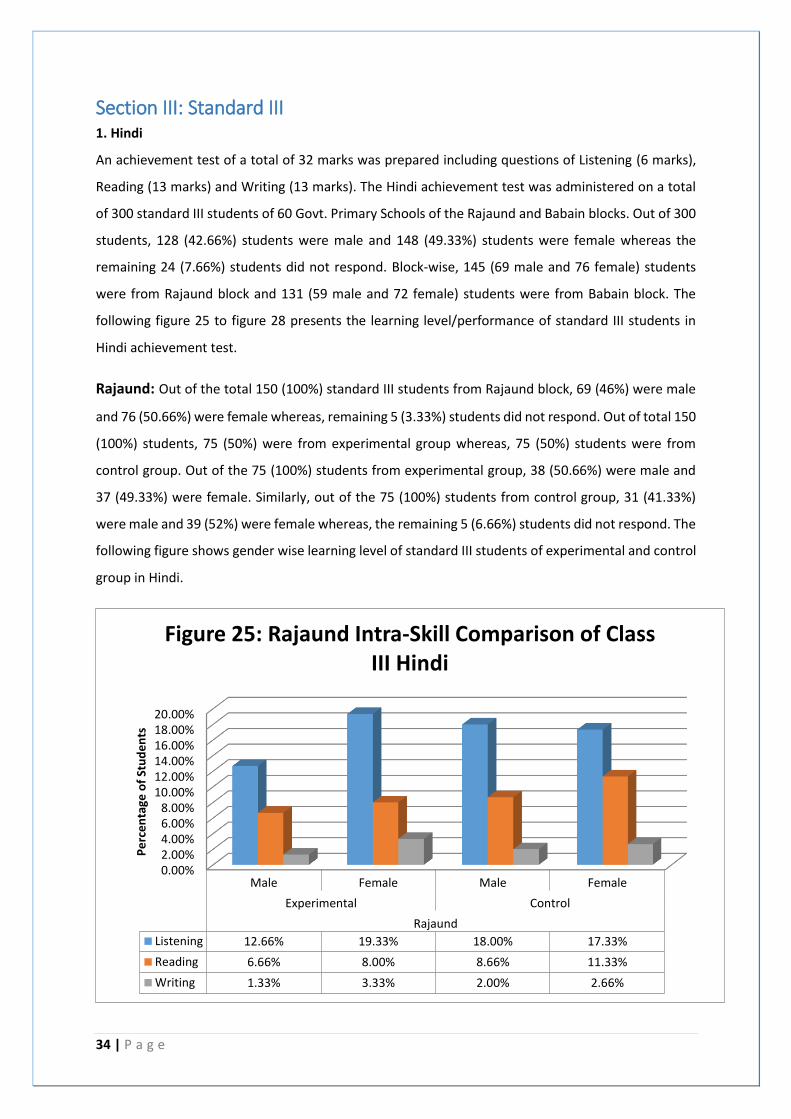
Section III: Standard III 1. Hindi
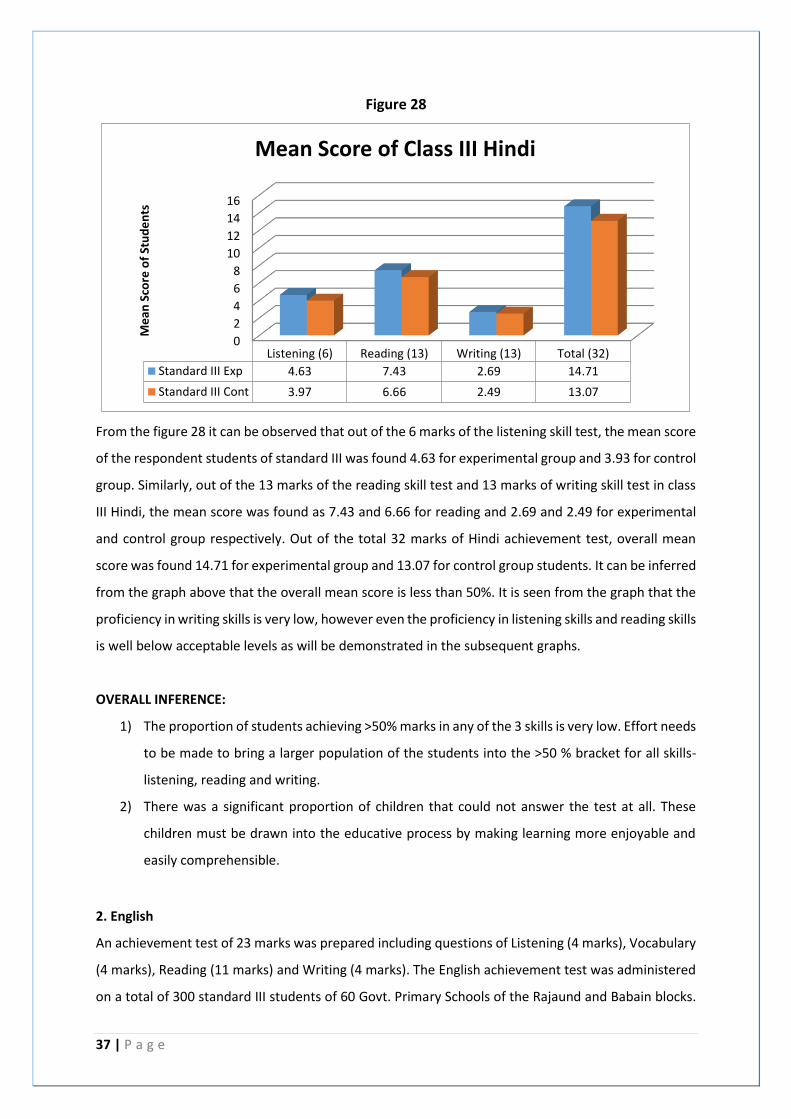
An achievement test of a total of 32 marks was prepared including questions of Listening (6 marks),
Reading (13 marks) and Writing (13 marks). The Hindi achievement test was administered on a total
of 300 standard III students of 60 Govt. Primary Schools of the Rajaund and Babain blocks. Out of 300
students, 128 (42.66%) students were male and 148 (49.33%) students were female whereas the
remaining 24 (7.66%) students did not respond. Block-wise, 145 (69 male and 76 female) students
were from Rajaund block and 131 (59 male and 72 female) students were from Babain block. The
following figure 25 to figure 28 presents the learning level/performance of standard III students in
Hindi achievement test.
Rajaund: Out of the total 150 (100%) standard III students from Rajaund block, 69 (46%) were male
and 76 (50.66%) were female whereas, remaining 5 (3.33%) students did not respond. Out of total 150
(100%) students, 75 (50%) were from experimental group whereas, 75 (50%) students were from
control group. Out of the 75 (100%) students from experimental group, 38 (50.66%) were male and
37 (49.33%) were female. Similarly, out of the 75 (100%) students from control group, 31 (41.33%)
were male and 39 (52%) were female whereas, the remaining 5 (6.66%) students did not respond. The
following figure shows gender wise learning level of standard III students of experimental and control
group in Hindi.
0.00%2.00%4.00%6.00%8.00%
10.00%12.00%14.00%16.00%18.00%20.00%
Male Female Male Female
Experimental Control
Rajaund
Listening 12.66% 19.33% 18.00% 17.33%
Reading 6.66% 8.00% 8.66% 11.33%
Writing 1.33% 3.33% 2.00% 2.66%
Pe
rce
nta
ge o
f St
ud
en
ts
Figure 25: Rajaund Intra-Skill Comparison of Class III Hindi
35 | P a g e
From the figure 25 it was found that out of the total 150 (100%) students from Rajaund block, only 13-
19% of the students could secure more than 70% of marks in the listening skill test (short sentences)
and only 7-11% of students could secure more than 70% of marks in the reading skill (opposite words,
synonyms and short sentences) test. Only 1-3% of the students could secure more than 70% of marks
in the writing skills test (four lines on a balloon). This means that more than 80% of both male and
female students secured less than 70 % marks in all the skills tested i.e. listening, reading and writing.
It is seen from the graph that the proficiency in writing skills is very low, however even the proficiency
in listening skills and reading skills is well below acceptable levels as will be demonstrated in the
subsequent graphs.
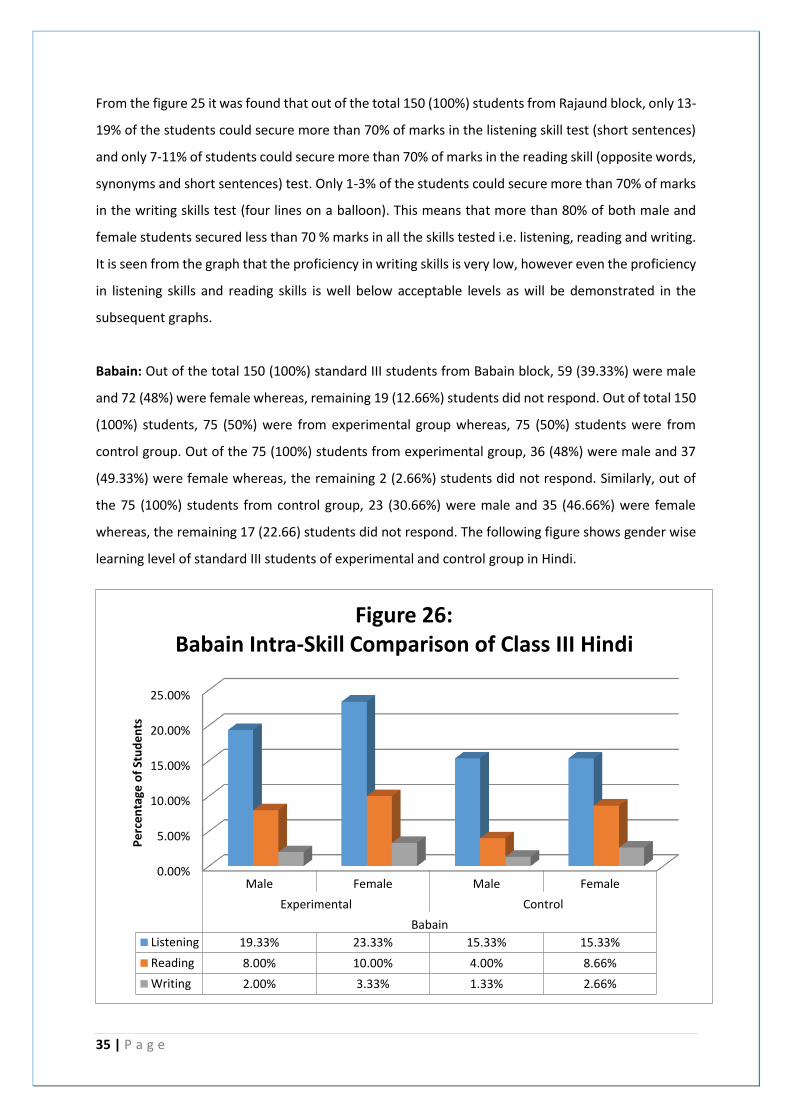
Babain: Out of the total 150 (100%) standard III students from Babain block, 59 (39.33%) were male
and 72 (48%) were female whereas, remaining 19 (12.66%) students did not respond. Out of total 150
(100%) students, 75 (50%) were from experimental group whereas, 75 (50%) students were from
control group. Out of the 75 (100%) students from experimental group, 36 (48%) were male and 37
(49.33%) were female whereas, the remaining 2 (2.66%) students did not respond. Similarly, out of
the 75 (100%) students from control group, 23 (30.66%) were male and 35 (46.66%) were female
whereas, the remaining 17 (22.66) students did not respond. The following figure shows gender wise
learning level of standard III students of experimental and control group in Hindi.
0.00%
5.00%
10.00%
15.00%
20.00%
25.00%
Male Female Male Female
Experimental Control
Babain
Listening 19.33% 23.33% 15.33% 15.33%
Reading 8.00% 10.00% 4.00% 8.66%
Writing 2.00% 3.33% 1.33% 2.66%
Pe
rce
nta
ge o
f St
ud
en
ts
Figure 26: Babain Intra-Skill Comparison of Class III Hindi
36 | P a g e
From figure 26 it can be seen that out of the total 150 (100%) students from Babain block, only 15-
23% of the students could secure more than 70% of marks in the listening skill test (short sentences)
and only 4-10% of the students could secure more than 70% of marks in the reading skill test
(opposites, synonyms, short sentences) whereas, only 1-3% of students could secure more than 70%
of marks in the writing skill test (four lines on a balloon). Thus it can be inferred that more than 80%
of both male and female students secured less than 70% marks in all the skills tested i.e. listening,
reading and writing skills. It is seen from the graph that the proficiency in writing skills is very low,
however even the proficiency in listening skills and reading skills is well below acceptable levels as will
be demonstrated in the subsequent graphs.
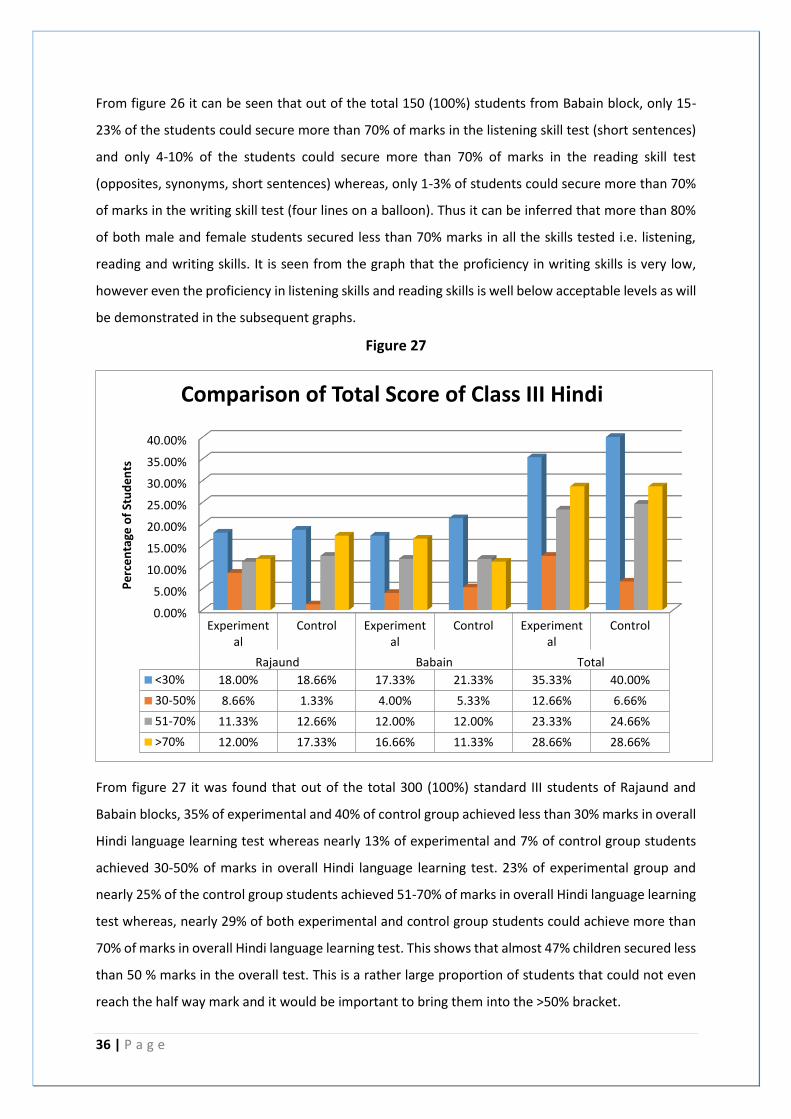
Figure 27
From figure 27 it was found that out of the total 300 (100%) standard III students of Rajaund and
Babain blocks, 35% of experimental and 40% of control group achieved less than 30% marks in overall
Hindi language learning test whereas nearly 13% of experimental and 7% of control group students
achieved 30-50% of marks in overall Hindi language learning test. 23% of experimental group and
nearly 25% of the control group students achieved 51-70% of marks in overall Hindi language learning
test whereas, nearly 29% of both experimental and control group students could achieve more than
70% of marks in overall Hindi language learning test. This shows that almost 47% children secured less
than 50 % marks in the overall test. This is a rather large proportion of students that could not even
reach the half way mark and it would be important to bring them into the >50% bracket.
0.00%
5.00%
10.00%
15.00%
20.00%
25.00%
30.00%
35.00%
40.00%
Experimental
Control Experimental
Control Experimental
Control
Rajaund Babain Total
<30% 18.00% 18.66% 17.33% 21.33% 35.33% 40.00%
30-50% 8.66% 1.33% 4.00% 5.33% 12.66% 6.66%
51-70% 11.33% 12.66% 12.00% 12.00% 23.33% 24.66%
>70% 12.00% 17.33% 16.66% 11.33% 28.66% 28.66%
Pe
rce
nta
ge o
f St
ud
en
ts
Comparison of Total Score of Class III Hindi
37 | P a g e
Figure 28
From the figure 28 it can be observed that out of the 6 marks of the listening skill test, the mean score
of the respondent students of standard III was found 4.63 for experimental group and 3.93 for control
group. Similarly, out of the 13 marks of the reading skill test and 13 marks of writing skill test in class
III Hindi, the mean score was found as 7.43 and 6.66 for reading and 2.69 and 2.49 for experimental
and control group respectively. Out of the total 32 marks of Hindi achievement test, overall mean
score was found 14.71 for experimental group and 13.07 for control group students. It can be inferred
from the graph above that the overall mean score is less than 50%. It is seen from the graph that the
proficiency in writing skills is very low, however even the proficiency in listening skills and reading skills
is well below acceptable levels as will be demonstrated in the subsequent graphs.
OVERALL INFERENCE:
1) The proportion of students achieving >50% marks in any of the 3 skills is very low. Effort needs
to be made to bring a larger population of the students into the >50 % bracket for all skills-
listening, reading and writing.
2) There was a significant proportion of children that could not answer the test at all. These
children must be drawn into the educative process by making learning more enjoyable and
easily comprehensible.
2. English
An achievement test of 23 marks was prepared including questions of Listening (4 marks), Vocabulary
(4 marks), Reading (11 marks) and Writing (4 marks). The English achievement test was administered
on a total of 300 standard III students of 60 Govt. Primary Schools of the Rajaund and Babain blocks.
0
2
4
6
8
10
12
14
16
Listening (6) Reading (13) Writing (13) Total (32)
Standard III Exp 4.63 7.43 2.69 14.71
Standard III Cont 3.97 6.66 2.49 13.07
Me
an S
core
of
Stu
de
nts
Mean Score of Class III Hindi
38 | P a g e
Out of 300 students, 129 (43%) students were male and 151 (50.33%) students were female whereas
the remaining 20 (6.66%) students did not respond. Block-wise, 150 (72 male and 78 female) students
were from Rajaund block and 130 (59 male and 71 female) students were from Babain block. The
following figure 29 to figure 32 presents the learning level/performance of standard III students in
English achievement test.
Rajaund: Out of the total 150 (100%) standard III students from Rajaund block, 72 (48%) were male
and 78 (52%) were female. Out of total 150 (100%) students, 75 (50%) were from experimental group
whereas, 75 (50%) students were from control group. Out of the 75 (100%) students from
experimental group, 39 (52%) were male and 36 (48%) were female. Similarly, out of the 75 (100%)
students from control group, 33 (44%) were male and 42 (56%) were female. The following figure
shows gender wise learning level of standard III students of experimental and control group in English.
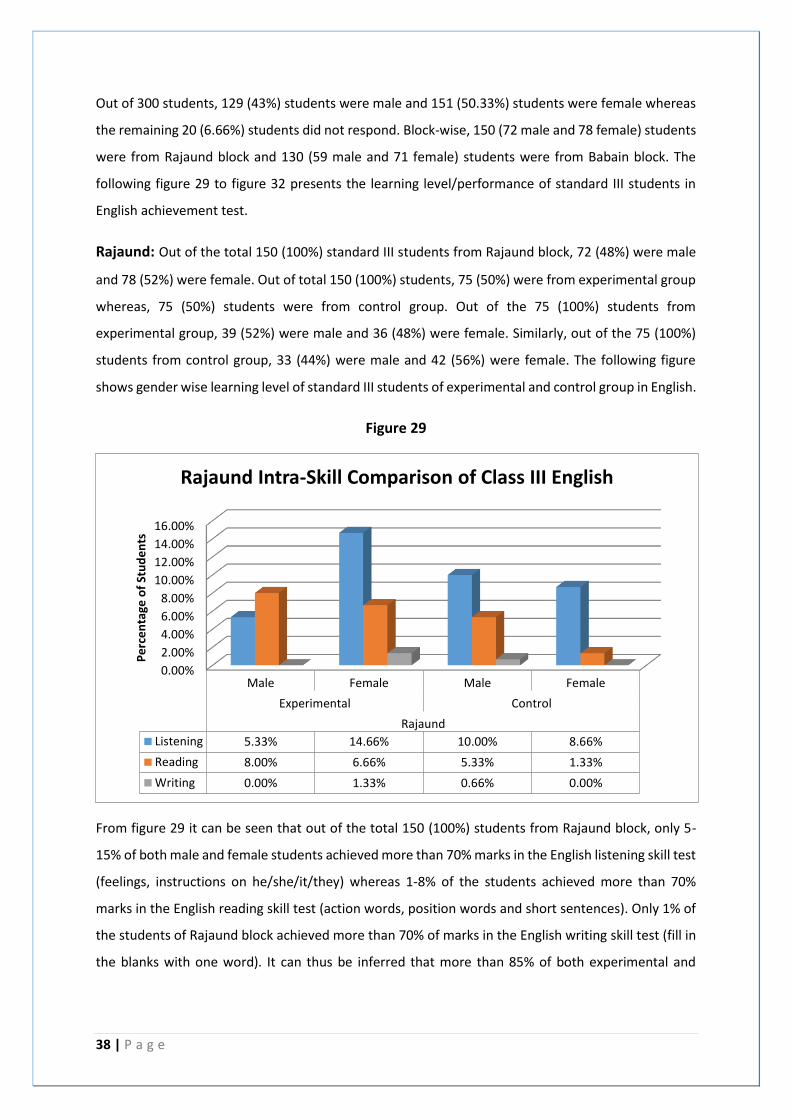
Figure 29
From figure 29 it can be seen that out of the total 150 (100%) students from Rajaund block, only 5-
15% of both male and female students achieved more than 70% marks in the English listening skill test
(feelings, instructions on he/she/it/they) whereas 1-8% of the students achieved more than 70%
marks in the English reading skill test (action words, position words and short sentences). Only 1% of
the students of Rajaund block achieved more than 70% of marks in the English writing skill test (fill in
the blanks with one word). It can thus be inferred that more than 85% of both experimental and
0.00%
2.00%
4.00%
6.00%
8.00%
10.00%
12.00%
14.00%
16.00%
Male Female Male Female
Experimental Control
Rajaund
Listening 5.33% 14.66% 10.00% 8.66%
Reading 8.00% 6.66% 5.33% 1.33%
Writing 0.00% 1.33% 0.66% 0.00%
Pe
rce
nta
ge o
f St
ud
en
ts
Rajaund Intra-Skill Comparison of Class III English
39 | P a g e
control group failed secure >70% marks in all the three skill sets tested – listening, reading and writing
skills.
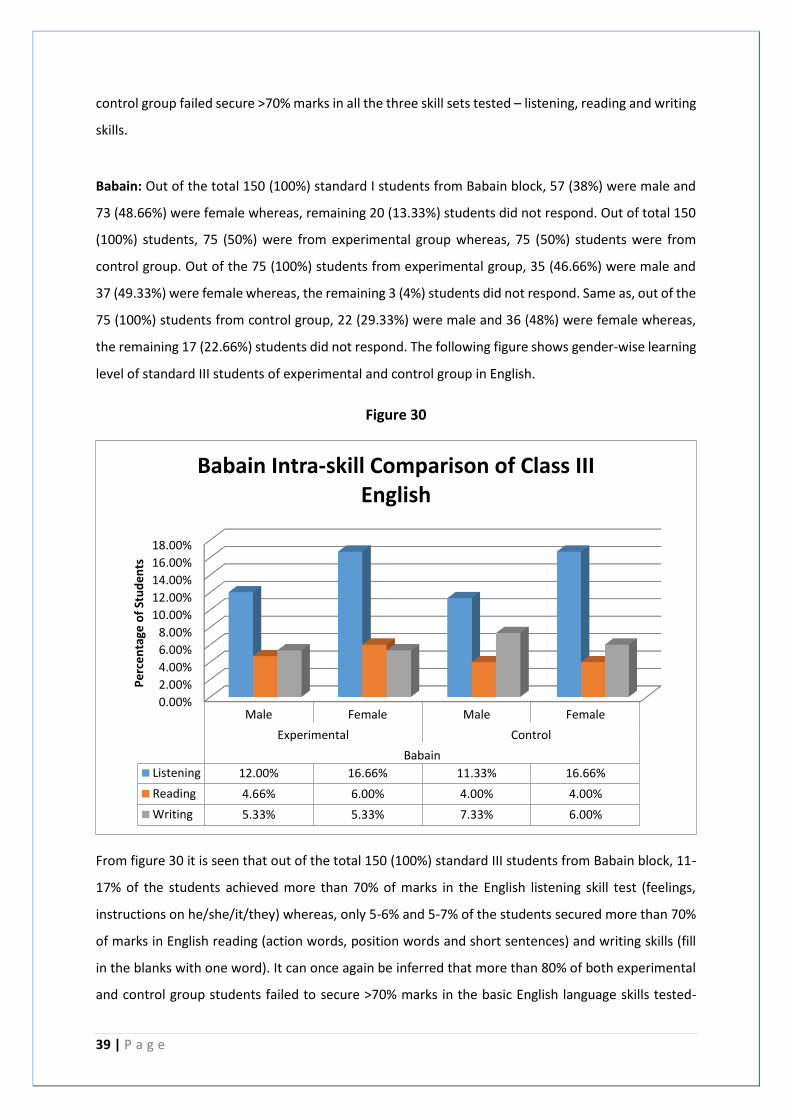
Babain: Out of the total 150 (100%) standard I students from Babain block, 57 (38%) were male and
73 (48.66%) were female whereas, remaining 20 (13.33%) students did not respond. Out of total 150
(100%) students, 75 (50%) were from experimental group whereas, 75 (50%) students were from
control group. Out of the 75 (100%) students from experimental group, 35 (46.66%) were male and
37 (49.33%) were female whereas, the remaining 3 (4%) students did not respond. Same as, out of the
75 (100%) students from control group, 22 (29.33%) were male and 36 (48%) were female whereas,
the remaining 17 (22.66%) students did not respond. The following figure shows gender-wise learning
level of standard III students of experimental and control group in English.
Figure 30
From figure 30 it is seen that out of the total 150 (100%) standard III students from Babain block, 11-
17% of the students achieved more than 70% of marks in the English listening skill test (feelings,
instructions on he/she/it/they) whereas, only 5-6% and 5-7% of the students secured more than 70%
of marks in English reading (action words, position words and short sentences) and writing skills (fill
in the blanks with one word). It can once again be inferred that more than 80% of both experimental
and control group students failed to secure >70% marks in the basic English language skills tested-
0.00%
2.00%
4.00%
6.00%
8.00%
10.00%
12.00%
14.00%
16.00%
18.00%
Male Female Male Female
Experimental Control
Babain
Listening 12.00% 16.66% 11.33% 16.66%
Reading 4.66% 6.00% 4.00% 4.00%
Writing 5.33% 5.33% 7.33% 6.00%
Pe
rce
nta
ge o
f St
ud
en
ts
Babain Intra-skill Comparison of Class III English
40 | P a g e
listening, reading and writing. However, the anomaly in this graph is that children found reading more
difficult than listening and writing. This could perhaps be because the reading test tested concepts
such as position words, action words and short sentences which children may not have been
comfortable with. The writing skills test consisted of ‘fill in the blanks with one word’ which children
could have found easier than the listening and reading test.
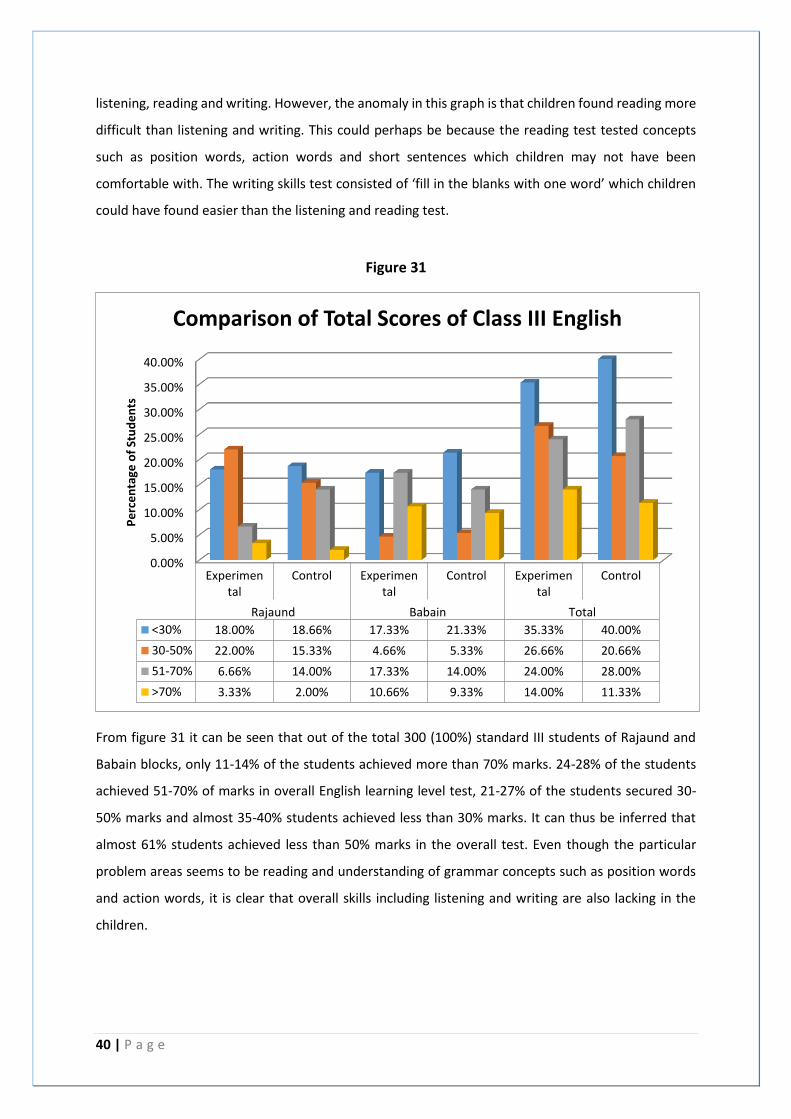
Figure 31
From figure 31 it can be seen that out of the total 300 (100%) standard III students of Rajaund and
Babain blocks, only 11-14% of the students achieved more than 70% marks. 24-28% of the students
achieved 51-70% of marks in overall English learning level test, 21-27% of the students secured 30-
50% marks and almost 35-40% students achieved less than 30% marks. It can thus be inferred that
almost 61% students achieved less than 50% marks in the overall test. Even though the particular
problem areas seems to be reading and understanding of grammar concepts such as position words
and action words, it is clear that overall skills including listening and writing are also lacking in the
children.
0.00%
5.00%
10.00%
15.00%
20.00%
25.00%
30.00%
35.00%
40.00%
Experimental
Control Experimental
Control Experimental
Control
Rajaund Babain Total
<30% 18.00% 18.66% 17.33% 21.33% 35.33% 40.00%
30-50% 22.00% 15.33% 4.66% 5.33% 26.66% 20.66%
51-70% 6.66% 14.00% 17.33% 14.00% 24.00% 28.00%
>70% 3.33% 2.00% 10.66% 9.33% 14.00% 11.33%
Pe
rce
nta
ge o
f St
ud
en
ts
Comparison of Total Scores of Class III English
41 | P a g e
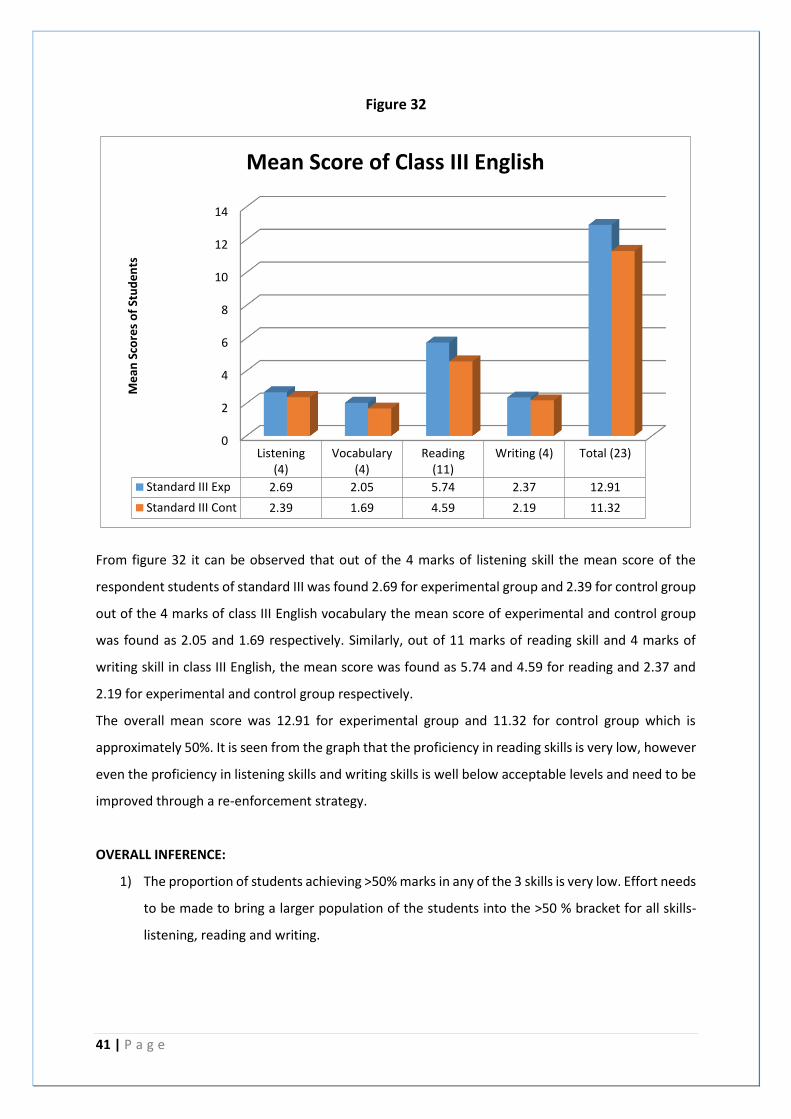
Figure 32
From figure 32 it can be observed that out of the 4 marks of listening skill the mean score of the
respondent students of standard III was found 2.69 for experimental group and 2.39 for control group
out of the 4 marks of class III English vocabulary the mean score of experimental and control group
was found as 2.05 and 1.69 respectively. Similarly, out of 11 marks of reading skill and 4 marks of
writing skill in class III English, the mean score was found as 5.74 and 4.59 for reading and 2.37 and
2.19 for experimental and control group respectively.
The overall mean score was 12.91 for experimental group and 11.32 for control group which is
approximately 50%. It is seen from the graph that the proficiency in reading skills is very low, however
even the proficiency in listening skills and writing skills is well below acceptable levels and need to be
improved through a re-enforcement strategy.
OVERALL INFERENCE:
1) The proportion of students achieving >50% marks in any of the 3 skills is very low. Effort needs
to be made to bring a larger population of the students into the >50 % bracket for all skills-
listening, reading and writing.
0
2
4
6
8
10
12
14
Listening(4)
Vocabulary(4)
Reading(11)
Writing (4) Total (23)
Standard III Exp 2.69 2.05 5.74 2.37 12.91
Standard III Cont 2.39 1.69 4.59 2.19 11.32
Me
an S
core
s o
f St
ud
en
ts
Mean Score of Class III English
42 | P a g e
2) There was a significant proportion of children that could not answer the test at all. These
children must be drawn into the educative process by making learning more enjoyable and
easily comprehensible.
3. Mathematics
An achievement test of a total of 37 marks was prepared including questions of Shape Recognition &
Drawing of Shapes (5 marks), Counting & Number Recognition (3 marks), Place Value (4 marks),
Number Operations like Multiplication (8 marks), Addition (4 marks) & Subtraction (2 marks), Number
Patterns-Recognition of Odd/Even Numbers (2 marks), Word Problem (2 marks), Measurement Units
(3 marks) and Time-reading time to the hour (4 marks). The Mathematics achievement test was
administered on a total of 300 standard III students of 60 Govt. Primary Schools of the Rajaund and
Babain blocks. Out of 300 (100%) students, 119 (39.66%) students were male and 153 (51%) students
were female whereas the remaining 28 (8.66%) students did not respond. Block-wise, 145 (60 male
and 85 female) students were from Rajaund block and 127 (59 male and 68 female) students were
from Babain block. The following figure 33 to figure 36 presents the learning level/performance of
standard III students in Mathematics achievement test.
Rajaund: Out of the total 150 (100%) standard III students from Rajaund block, 64 (42.66%) were male
and 77 (51.33%) were female whereas, remaining 9 (6%) students did not respond. Out of total 150
(100%) students, 75 (50%) were from experimental group whereas, 75 (50%) students were from
control group. Out of the 75 (100%) students from experimental group, 27 (36%) were male and 43
(57.33%) were female whereas, the remaining 5 (6.66%) students did not respond. Similarly, out of
the 75 (100%) students from control group, 37 (49.33%) were male and 34 (45.33%) were female
whereas, the remaining 4 (5.33) students did not respond. The figure 10 shows gender-wise learning
level of standard I students of experimental and control group in Hindi.
43 | P a g e
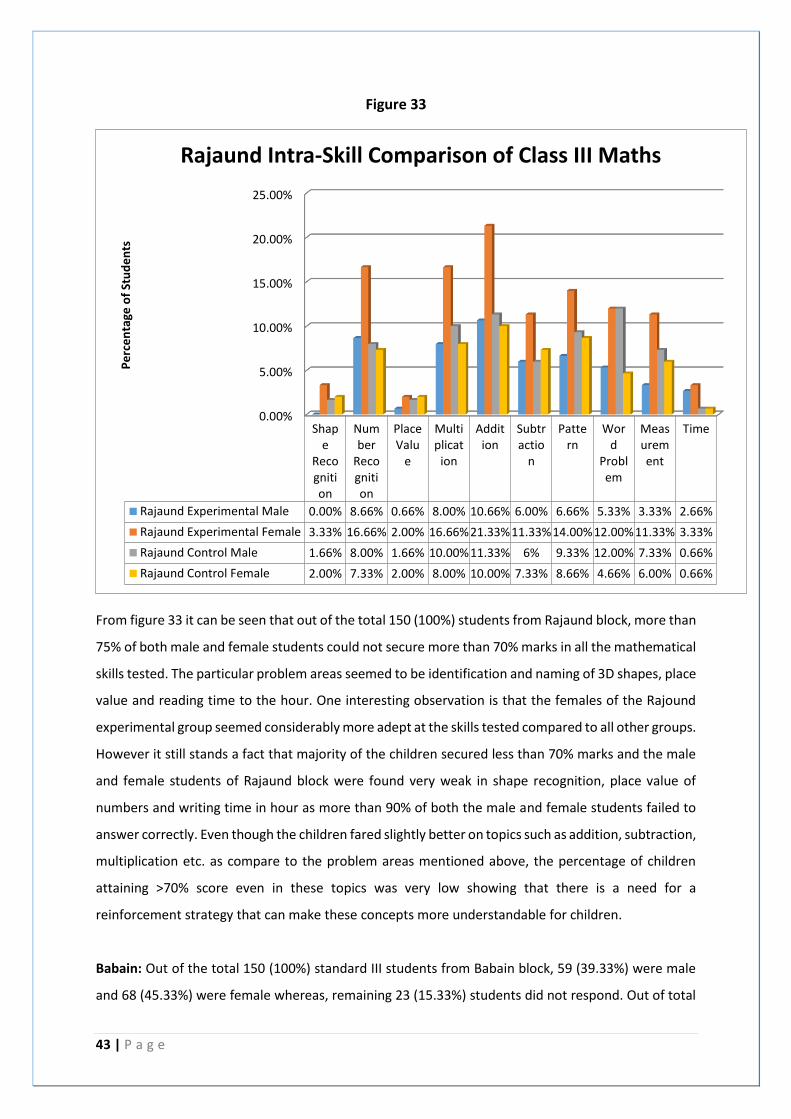
Figure 33
From figure 33 it can be seen that out of the total 150 (100%) students from Rajaund block, more than
75% of both male and female students could not secure more than 70% marks in all the mathematical
skills tested. The particular problem areas seemed to be identification and naming of 3D shapes, place
value and reading time to the hour. One interesting observation is that the females of the Rajound
experimental group seemed considerably more adept at the skills tested compared to all other groups.
However it still stands a fact that majority of the children secured less than 70% marks and the male
and female students of Rajaund block were found very weak in shape recognition, place value of
numbers and writing time in hour as more than 90% of both the male and female students failed to
answer correctly. Even though the children fared slightly better on topics such as addition, subtraction,
multiplication etc. as compare to the problem areas mentioned above, the percentage of children
attaining >70% score even in these topics was very low showing that there is a need for a
reinforcement strategy that can make these concepts more understandable for children.
Babain: Out of the total 150 (100%) standard III students from Babain block, 59 (39.33%) were male
and 68 (45.33%) were female whereas, remaining 23 (15.33%) students did not respond. Out of total
0.00%
5.00%
10.00%
15.00%
20.00%
25.00%
Shape
Recognition
Number
Recognition
PlaceValu
e
Multiplicat
ion
Addition
Subtractio
n
Pattern
Word
Problem
Measurement
Time
Rajaund Experimental Male 0.00% 8.66% 0.66% 8.00% 10.66% 6.00% 6.66% 5.33% 3.33% 2.66%
Rajaund Experimental Female 3.33% 16.66% 2.00% 16.66%21.33%11.33%14.00%12.00%11.33% 3.33%
Rajaund Control Male 1.66% 8.00% 1.66% 10.00%11.33% 6% 9.33% 12.00% 7.33% 0.66%
Rajaund Control Female 2.00% 7.33% 2.00% 8.00% 10.00% 7.33% 8.66% 4.66% 6.00% 0.66%
Pe
rce
nta
ge o
f St
ud
en
ts
Rajaund Intra-Skill Comparison of Class III Maths
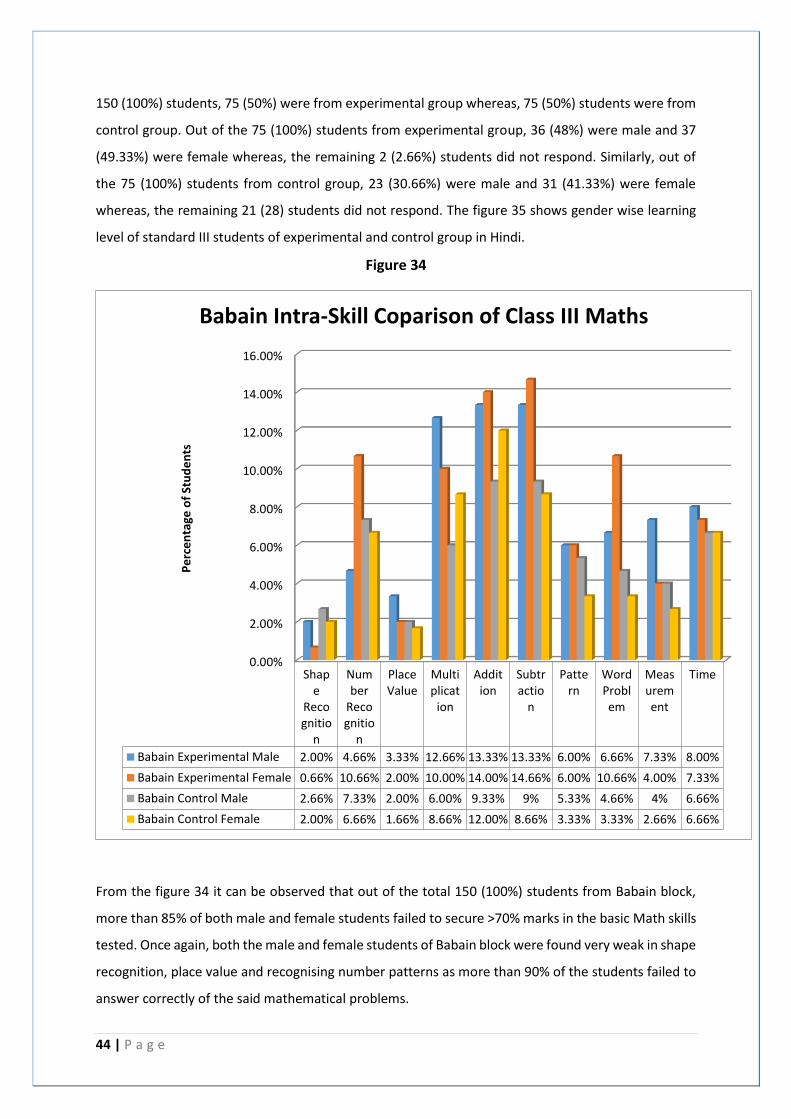
44 | P a g e
150 (100%) students, 75 (50%) were from experimental group whereas, 75 (50%) students were from
control group. Out of the 75 (100%) students from experimental group, 36 (48%) were male and 37
(49.33%) were female whereas, the remaining 2 (2.66%) students did not respond. Similarly, out of
the 75 (100%) students from control group, 23 (30.66%) were male and 31 (41.33%) were female
whereas, the remaining 21 (28) students did not respond. The figure 35 shows gender wise learning
level of standard III students of experimental and control group in Hindi.
Figure 34
From the figure 34 it can be observed that out of the total 150 (100%) students from Babain block,
more than 85% of both male and female students failed to secure >70% marks in the basic Math skills
tested. Once again, both the male and female students of Babain block were found very weak in shape
recognition, place value and recognising number patterns as more than 90% of the students failed to
answer correctly of the said mathematical problems.
0.00%
2.00%
4.00%
6.00%
8.00%
10.00%
12.00%
14.00%
16.00%
Shape
Recognitio
n
Number
Recognitio
n
PlaceValue
Multiplicat
ion
Addition
Subtractio
n
Pattern
WordProblem
Measurement
Time
Babain Experimental Male 2.00% 4.66% 3.33% 12.66% 13.33% 13.33% 6.00% 6.66% 7.33% 8.00%
Babain Experimental Female 0.66% 10.66% 2.00% 10.00% 14.00% 14.66% 6.00% 10.66% 4.00% 7.33%
Babain Control Male 2.66% 7.33% 2.00% 6.00% 9.33% 9% 5.33% 4.66% 4% 6.66%
Babain Control Female 2.00% 6.66% 1.66% 8.66% 12.00% 8.66% 3.33% 3.33% 2.66% 6.66%
Pe
rce
nta
ge o
f St
ud
en
ts
Babain Intra-Skill Coparison of Class III Maths
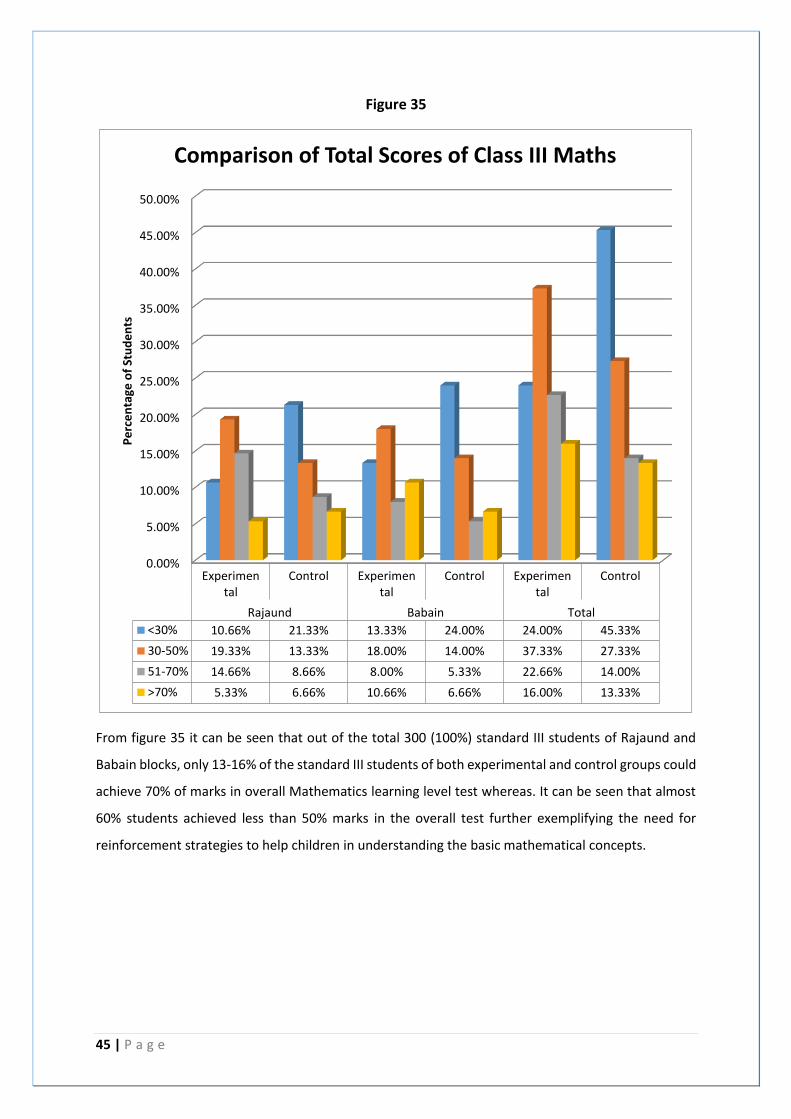
45 | P a g e
Figure 35
From figure 35 it can be seen that out of the total 300 (100%) standard III students of Rajaund and
Babain blocks, only 13-16% of the standard III students of both experimental and control groups could
achieve 70% of marks in overall Mathematics learning level test whereas. It can be seen that almost
60% students achieved less than 50% marks in the overall test further exemplifying the need for
reinforcement strategies to help children in understanding the basic mathematical concepts.
0.00%
5.00%
10.00%
15.00%
20.00%
25.00%
30.00%
35.00%
40.00%
45.00%
50.00%
Experimental
Control Experimental
Control Experimental
Control
Rajaund Babain Total
<30% 10.66% 21.33% 13.33% 24.00% 24.00% 45.33%
30-50% 19.33% 13.33% 18.00% 14.00% 37.33% 27.33%
51-70% 14.66% 8.66% 8.00% 5.33% 22.66% 14.00%
>70% 5.33% 6.66% 10.66% 6.66% 16.00% 13.33%
Pe
rce
nta
ge o
f St
ud
en
ts
Comparison of Total Scores of Class III Maths
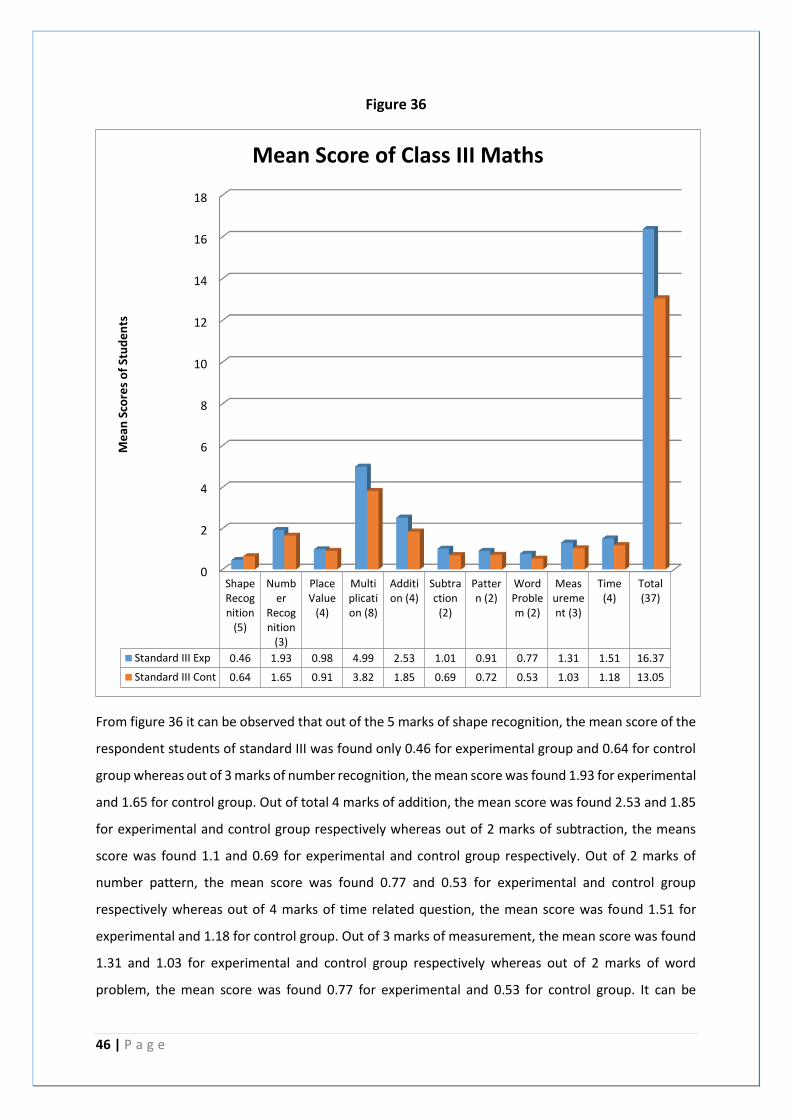
46 | P a g e
Figure 36
From figure 36 it can be observed that out of the 5 marks of shape recognition, the mean score of the
respondent students of standard III was found only 0.46 for experimental group and 0.64 for control
group whereas out of 3 marks of number recognition, the mean score was found 1.93 for experimental
and 1.65 for control group. Out of total 4 marks of addition, the mean score was found 2.53 and 1.85
for experimental and control group respectively whereas out of 2 marks of subtraction, the means
score was found 1.1 and 0.69 for experimental and control group respectively. Out of 2 marks of
number pattern, the mean score was found 0.77 and 0.53 for experimental and control group
respectively whereas out of 4 marks of time related question, the mean score was found 1.51 for
experimental and 1.18 for control group. Out of 3 marks of measurement, the mean score was found
1.31 and 1.03 for experimental and control group respectively whereas out of 2 marks of word
problem, the mean score was found 0.77 for experimental and 0.53 for control group. It can be
0
2
4
6
8
10
12
14
16
18
ShapeRecognition
(5)
Number
Recognition
(3)
PlaceValue
(4)
Multiplication (8)
Addition (4)
Subtraction
(2)
Pattern (2)
WordProblem (2)
Measurement (3)
Time(4)
Total(37)
Standard III Exp 0.46 1.93 0.98 4.99 2.53 1.01 0.91 0.77 1.31 1.51 16.37
Standard III Cont 0.64 1.65 0.91 3.82 1.85 0.69 0.72 0.53 1.03 1.18 13.05
Me
an S
core
s o
f St
ud
en
ts
Mean Score of Class III Maths
47 | P a g e
inferred that the overall mean score of 16.37 and 13.05 is less than 50% showing that there is ample
scope for improvement in the basic mathematical skills so that the overall mean score for the class
can rise significantly.
OVERALL INFERENCE:
1) The proportion of students achieving >50% marks in any of the mathematical skills is very
low. Effort needs to be made to bring a larger population of the students into the >50 %
bracket for all skills- counting, matching, addition, subtraction, measurement and
identification.
2) Even though children seemed to be struggling with certain concepts like shape
recognition, patterns, word problems, place value etc., it was also seen that a very small
proportion of children achieved >70% scores even on the other concepts tested. Thus it is
seen that a holistic re-enforcement strategy that emphasizes on all topics of mathematics
using real world examples, objects, teaching aids and other engaging strategies would
make learning more enjoyable and understandable for children.
3) There was a significant proportion of children who could not answer the test at all. These
children must be drawn into the educative process by making learning more enjoyable
and easily comprehensible.
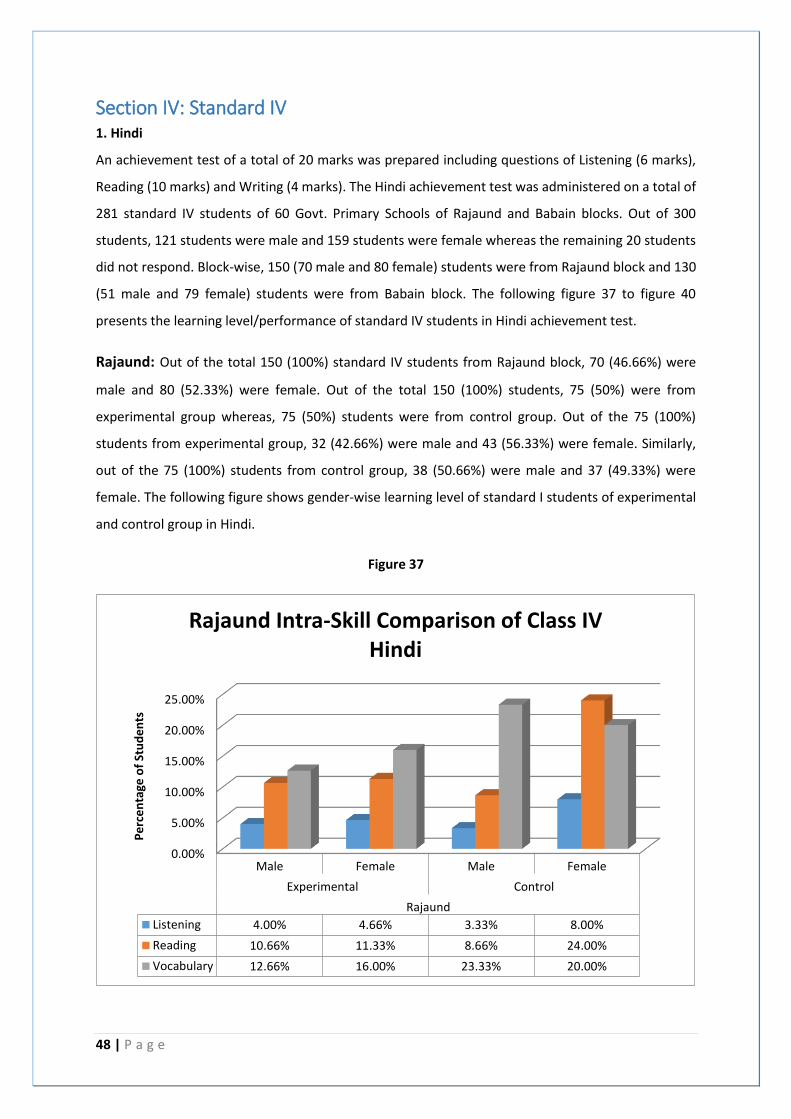
48 | P a g e
Section IV: Standard IV 1. Hindi
An achievement test of a total of 20 marks was prepared including questions of Listening (6 marks),
Reading (10 marks) and Writing (4 marks). The Hindi achievement test was administered on a total of
281 standard IV students of 60 Govt. Primary Schools of Rajaund and Babain blocks. Out of 300
students, 121 students were male and 159 students were female whereas the remaining 20 students
did not respond. Block-wise, 150 (70 male and 80 female) students were from Rajaund block and 130
(51 male and 79 female) students were from Babain block. The following figure 37 to figure 40
presents the learning level/performance of standard IV students in Hindi achievement test.
Rajaund: Out of the total 150 (100%) standard IV students from Rajaund block, 70 (46.66%) were
male and 80 (52.33%) were female. Out of the total 150 (100%) students, 75 (50%) were from
experimental group whereas, 75 (50%) students were from control group. Out of the 75 (100%)
students from experimental group, 32 (42.66%) were male and 43 (56.33%) were female. Similarly,
out of the 75 (100%) students from control group, 38 (50.66%) were male and 37 (49.33%) were
female. The following figure shows gender-wise learning level of standard I students of experimental
and control group in Hindi.
Figure 37
0.00%
5.00%
10.00%
15.00%
20.00%
25.00%
Male Female Male Female
Experimental Control
Rajaund
Listening 4.00% 4.66% 3.33% 8.00%
Reading 10.66% 11.33% 8.66% 24.00%
Vocabulary 12.66% 16.00% 23.33% 20.00%
Pe
rce
nta
ge o
f St
ud
en
ts
Rajaund Intra-Skill Comparison of Class IV Hindi
49 | P a g e
From figure 37 it can be seen that out of the total 150 (100%) students from Rajaund block, only 3-8%
of the students could secure more than 70% of marks in the listening skill test (dictation + listening +
writing) and 8-24% of students could secure more than 70% marks in the reading skill test (reading a
para and answering questions). 12-23% of the students could secure more than 70% of marks in the
vocabulary test (naming words and action words). From the graph above, it can be inferred that more
than 75% of the experimental and control group students failed to secure >70 % marks in the skills
tested in the Hindi language test- listening + writing, reading and vocabulary. It can also be inferred
that children had more trouble with the dictation (listening +writing test) which included writing of
words as compared to the reading and vocabulary test. Furthermore reading of a paragraph and
answering the questions proved to be more difficult than testing the vocabulary based on naming
words and action words. However, it is also seen that very small proportion of children could achieve
>70% score even in the reading segment showing that a strategy needs to be developed that addresses
all the three skills-listening , reading and writing.
Babain: Out of the total 150 (100%) standard IV students from Babain block, 51 (34%) were male and
79 (52.66%) were female whereas, remaining 20 (13.33%) students did not respond. Out of total 150
(100%) students, 75 (50%) were from experimental group whereas, 75 (50%) students were from
control group. Out of the 75 (100%) students from experimental group, 28 (37.33%) were male and
42 (56%) were female whereas, the remaining 5 (6.66%) students did not respond. Similarly, out of
the 75 (100%) students from control group, 23 (30.66%) were male and 37 (49.33%) were female
whereas, the remaining 15 (20) students did not respond. The following figure shows gender-wise
learning level of standard I students of experimental and control group in Hindi.
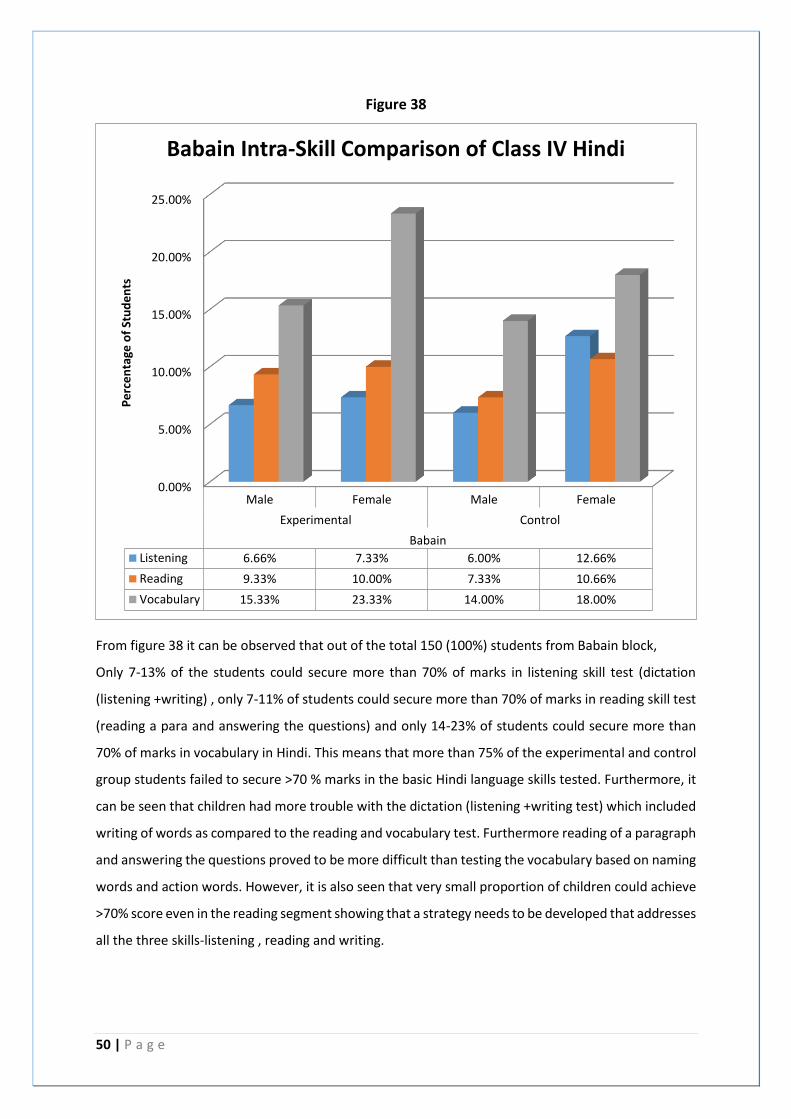
50 | P a g e
Figure 38
From figure 38 it can be observed that out of the total 150 (100%) students from Babain block,
Only 7-13% of the students could secure more than 70% of marks in listening skill test (dictation
(listening +writing) , only 7-11% of students could secure more than 70% of marks in reading skill test
(reading a para and answering the questions) and only 14-23% of students could secure more than
70% of marks in vocabulary in Hindi. This means that more than 75% of the experimental and control
group students failed to secure >70 % marks in the basic Hindi language skills tested. Furthermore, it
can be seen that children had more trouble with the dictation (listening +writing test) which included
writing of words as compared to the reading and vocabulary test. Furthermore reading of a paragraph
and answering the questions proved to be more difficult than testing the vocabulary based on naming
words and action words. However, it is also seen that very small proportion of children could achieve
>70% score even in the reading segment showing that a strategy needs to be developed that addresses
all the three skills-listening , reading and writing.
0.00%
5.00%
10.00%
15.00%
20.00%
25.00%
Male Female Male Female
Experimental Control
Babain
Listening 6.66% 7.33% 6.00% 12.66%
Reading 9.33% 10.00% 7.33% 10.66%
Vocabulary 15.33% 23.33% 14.00% 18.00%
Pe
rce
nta
ge o
f St
ud
en
ts
Babain Intra-Skill Comparison of Class IV Hindi
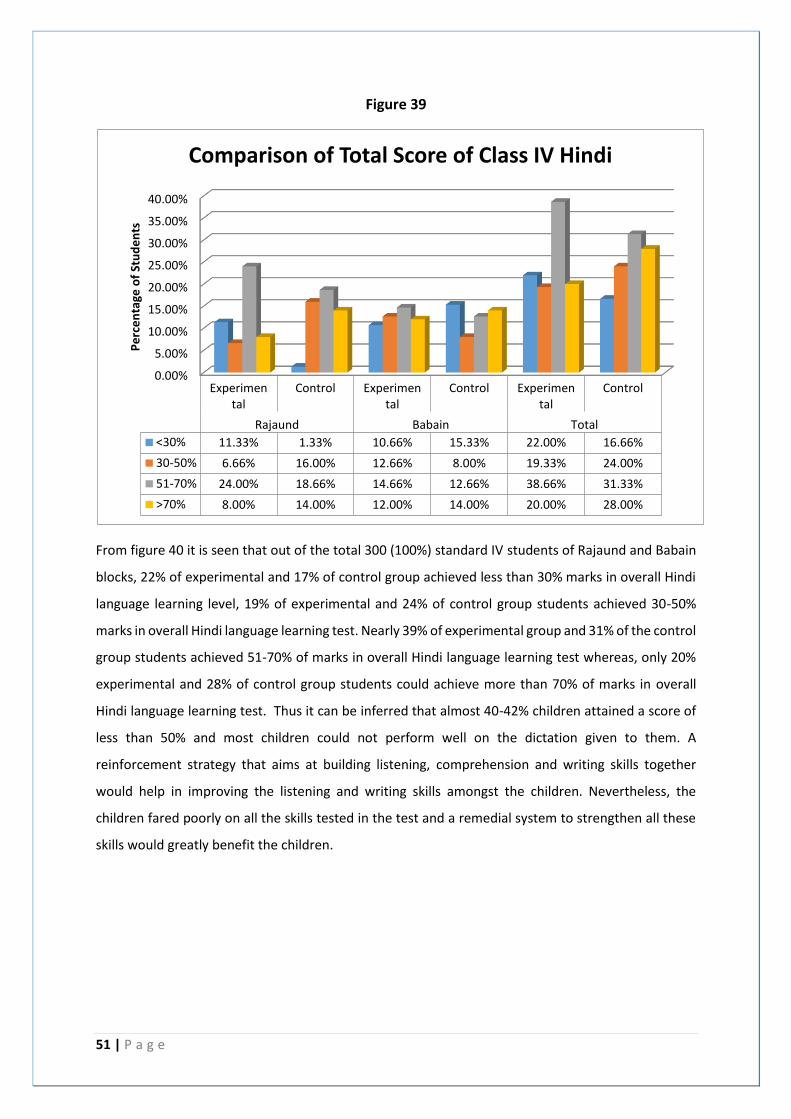
51 | P a g e
Figure 39
From figure 40 it is seen that out of the total 300 (100%) standard IV students of Rajaund and Babain
blocks, 22% of experimental and 17% of control group achieved less than 30% marks in overall Hindi
language learning level, 19% of experimental and 24% of control group students achieved 30-50%
marks in overall Hindi language learning test. Nearly 39% of experimental group and 31% of the control
group students achieved 51-70% of marks in overall Hindi language learning test whereas, only 20%
experimental and 28% of control group students could achieve more than 70% of marks in overall
Hindi language learning test. Thus it can be inferred that almost 40-42% children attained a score of
less than 50% and most children could not perform well on the dictation given to them. A
reinforcement strategy that aims at building listening, comprehension and writing skills together
would help in improving the listening and writing skills amongst the children. Nevertheless, the
children fared poorly on all the skills tested in the test and a remedial system to strengthen all these
skills would greatly benefit the children.
0.00%
5.00%
10.00%
15.00%
20.00%
25.00%
30.00%
35.00%
40.00%
Experimental
Control Experimental
Control Experimental
Control
Rajaund Babain Total
<30% 11.33% 1.33% 10.66% 15.33% 22.00% 16.66%
30-50% 6.66% 16.00% 12.66% 8.00% 19.33% 24.00%
51-70% 24.00% 18.66% 14.66% 12.66% 38.66% 31.33%
>70% 8.00% 14.00% 12.00% 14.00% 20.00% 28.00%
Pe
rce
nta
ge o
f St
ud
en
ts
Comparison of Total Score of Class IV Hindi
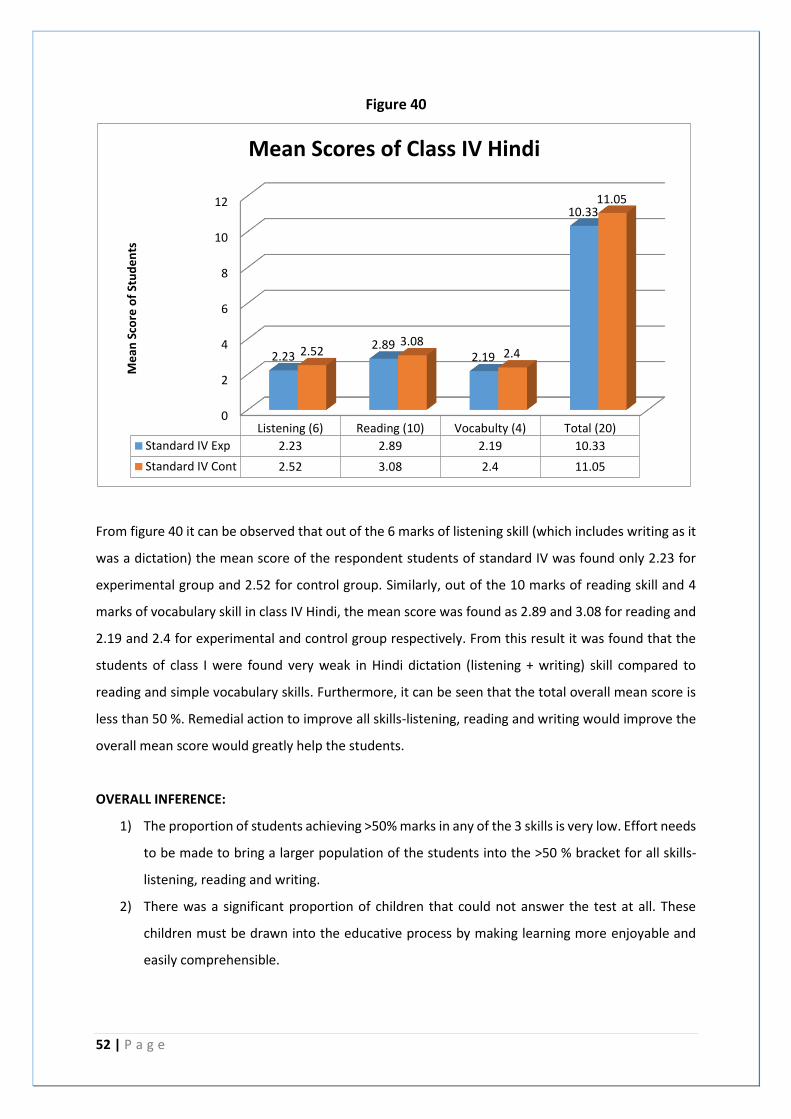
52 | P a g e
Figure 40
From figure 40 it can be observed that out of the 6 marks of listening skill (which includes writing as it
was a dictation) the mean score of the respondent students of standard IV was found only 2.23 for
experimental group and 2.52 for control group. Similarly, out of the 10 marks of reading skill and 4
marks of vocabulary skill in class IV Hindi, the mean score was found as 2.89 and 3.08 for reading and
2.19 and 2.4 for experimental and control group respectively. From this result it was found that the
students of class I were found very weak in Hindi dictation (listening + writing) skill compared to
reading and simple vocabulary skills. Furthermore, it can be seen that the total overall mean score is
less than 50 %. Remedial action to improve all skills-listening, reading and writing would improve the
overall mean score would greatly help the students.
OVERALL INFERENCE:
1) The proportion of students achieving >50% marks in any of the 3 skills is very low. Effort needs
to be made to bring a larger population of the students into the >50 % bracket for all skills-
listening, reading and writing.
2) There was a significant proportion of children that could not answer the test at all. These
children must be drawn into the educative process by making learning more enjoyable and
easily comprehensible.
0
2
4
6
8
10
12
Listening (6) Reading (10) Vocabulty (4) Total (20)
Standard IV Exp 2.23 2.89 2.19 10.33
Standard IV Cont 2.52 3.08 2.4 11.05
2.232.89
2.19
10.33
2.523.08
2.4
11.05
Me
an S
core
of
Stu
de
nts
Mean Scores of Class IV Hindi
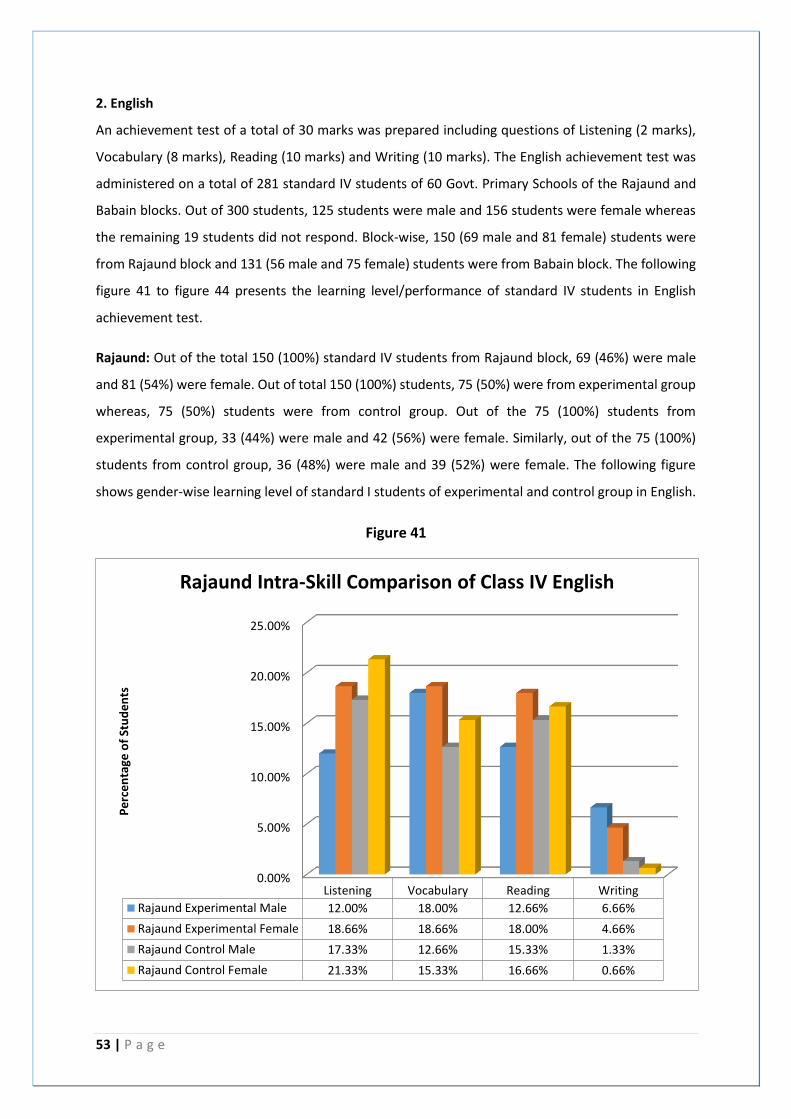
53 | P a g e
2. English
An achievement test of a total of 30 marks was prepared including questions of Listening (2 marks),
Vocabulary (8 marks), Reading (10 marks) and Writing (10 marks). The English achievement test was
administered on a total of 281 standard IV students of 60 Govt. Primary Schools of the Rajaund and
Babain blocks. Out of 300 students, 125 students were male and 156 students were female whereas
the remaining 19 students did not respond. Block-wise, 150 (69 male and 81 female) students were
from Rajaund block and 131 (56 male and 75 female) students were from Babain block. The following
figure 41 to figure 44 presents the learning level/performance of standard IV students in English
achievement test.
Rajaund: Out of the total 150 (100%) standard IV students from Rajaund block, 69 (46%) were male
and 81 (54%) were female. Out of total 150 (100%) students, 75 (50%) were from experimental group
whereas, 75 (50%) students were from control group. Out of the 75 (100%) students from
experimental group, 33 (44%) were male and 42 (56%) were female. Similarly, out of the 75 (100%)
students from control group, 36 (48%) were male and 39 (52%) were female. The following figure
shows gender-wise learning level of standard I students of experimental and control group in English.
Figure 41
0.00%
5.00%
10.00%
15.00%
20.00%
25.00%
Listening Vocabulary Reading Writing
Rajaund Experimental Male 12.00% 18.00% 12.66% 6.66%
Rajaund Experimental Female 18.66% 18.66% 18.00% 4.66%
Rajaund Control Male 17.33% 12.66% 15.33% 1.33%
Rajaund Control Female 21.33% 15.33% 16.66% 0.66%
Pe
rce
nta
ge o
f St
ud
en
ts
Rajaund Intra-Skill Comparison of Class IV English
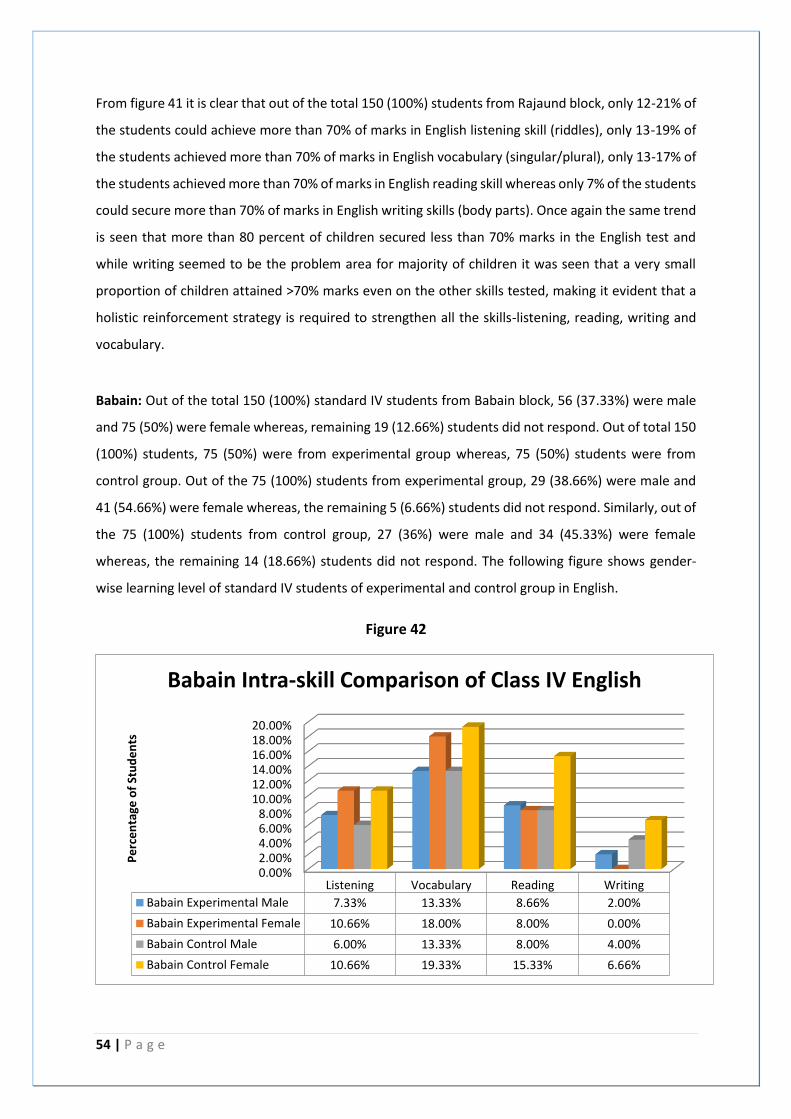
54 | P a g e
From figure 41 it is clear that out of the total 150 (100%) students from Rajaund block, only 12-21% of
the students could achieve more than 70% of marks in English listening skill (riddles), only 13-19% of
the students achieved more than 70% of marks in English vocabulary (singular/plural), only 13-17% of
the students achieved more than 70% of marks in English reading skill whereas only 7% of the students
could secure more than 70% of marks in English writing skills (body parts). Once again the same trend
is seen that more than 80 percent of children secured less than 70% marks in the English test and
while writing seemed to be the problem area for majority of children it was seen that a very small
proportion of children attained >70% marks even on the other skills tested, making it evident that a
holistic reinforcement strategy is required to strengthen all the skills-listening, reading, writing and
vocabulary.
Babain: Out of the total 150 (100%) standard IV students from Babain block, 56 (37.33%) were male
and 75 (50%) were female whereas, remaining 19 (12.66%) students did not respond. Out of total 150
(100%) students, 75 (50%) were from experimental group whereas, 75 (50%) students were from
control group. Out of the 75 (100%) students from experimental group, 29 (38.66%) were male and
41 (54.66%) were female whereas, the remaining 5 (6.66%) students did not respond. Similarly, out of
the 75 (100%) students from control group, 27 (36%) were male and 34 (45.33%) were female
whereas, the remaining 14 (18.66%) students did not respond. The following figure shows gender-
wise learning level of standard IV students of experimental and control group in English.
Figure 42
0.00%2.00%4.00%6.00%8.00%
10.00%12.00%14.00%16.00%18.00%20.00%
Listening Vocabulary Reading Writing
Babain Experimental Male 7.33% 13.33% 8.66% 2.00%
Babain Experimental Female 10.66% 18.00% 8.00% 0.00%
Babain Control Male 6.00% 13.33% 8.00% 4.00%
Babain Control Female 10.66% 19.33% 15.33% 6.66%
Pe
rce
nta
ge o
f St
ud
en
ts
Babain Intra-skill Comparison of Class IV English
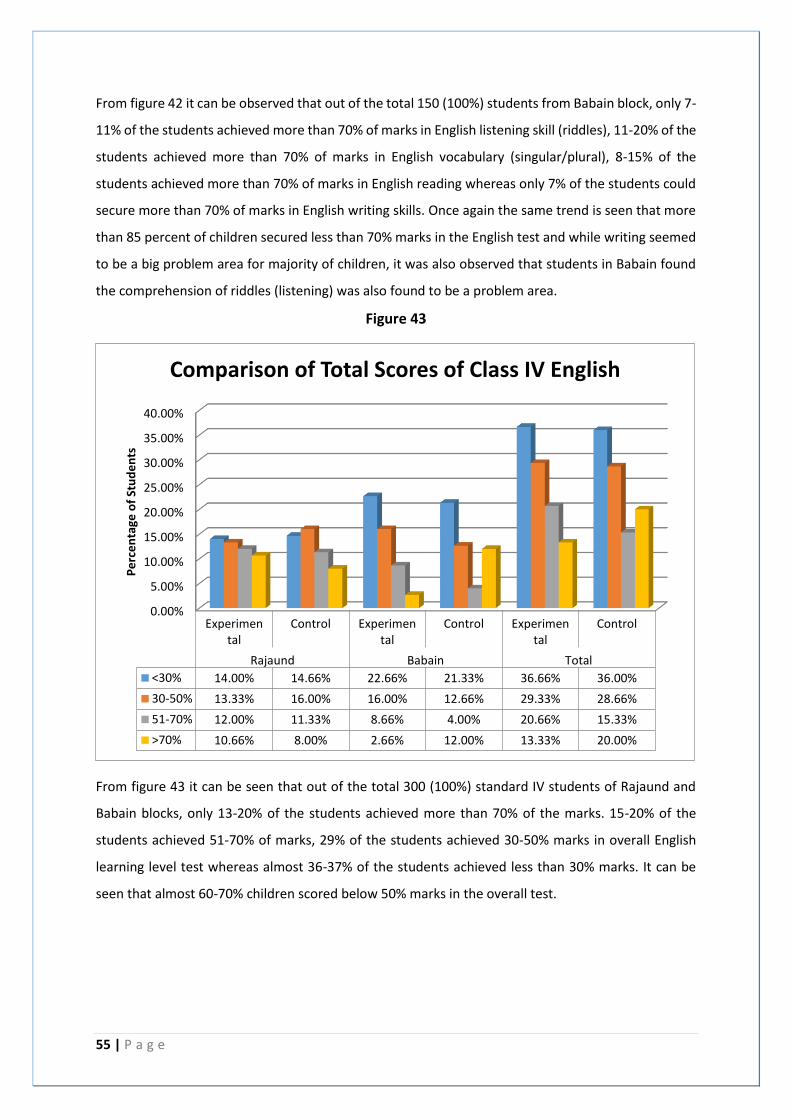
55 | P a g e
From figure 42 it can be observed that out of the total 150 (100%) students from Babain block, only 7-
11% of the students achieved more than 70% of marks in English listening skill (riddles), 11-20% of the
students achieved more than 70% of marks in English vocabulary (singular/plural), 8-15% of the
students achieved more than 70% of marks in English reading whereas only 7% of the students could
secure more than 70% of marks in English writing skills. Once again the same trend is seen that more
than 85 percent of children secured less than 70% marks in the English test and while writing seemed
to be a big problem area for majority of children, it was also observed that students in Babain found
the comprehension of riddles (listening) was also found to be a problem area.
Figure 43
From figure 43 it can be seen that out of the total 300 (100%) standard IV students of Rajaund and
Babain blocks, only 13-20% of the students achieved more than 70% of the marks. 15-20% of the
students achieved 51-70% of marks, 29% of the students achieved 30-50% marks in overall English
learning level test whereas almost 36-37% of the students achieved less than 30% marks. It can be
seen that almost 60-70% children scored below 50% marks in the overall test.
0.00%
5.00%
10.00%
15.00%
20.00%
25.00%
30.00%
35.00%
40.00%
Experimental
Control Experimental
Control Experimental
Control
Rajaund Babain Total
<30% 14.00% 14.66% 22.66% 21.33% 36.66% 36.00%
30-50% 13.33% 16.00% 16.00% 12.66% 29.33% 28.66%
51-70% 12.00% 11.33% 8.66% 4.00% 20.66% 15.33%
>70% 10.66% 8.00% 2.66% 12.00% 13.33% 20.00%
Pe
rce
nta
ge o
f St
ud
en
ts
Comparison of Total Scores of Class IV English
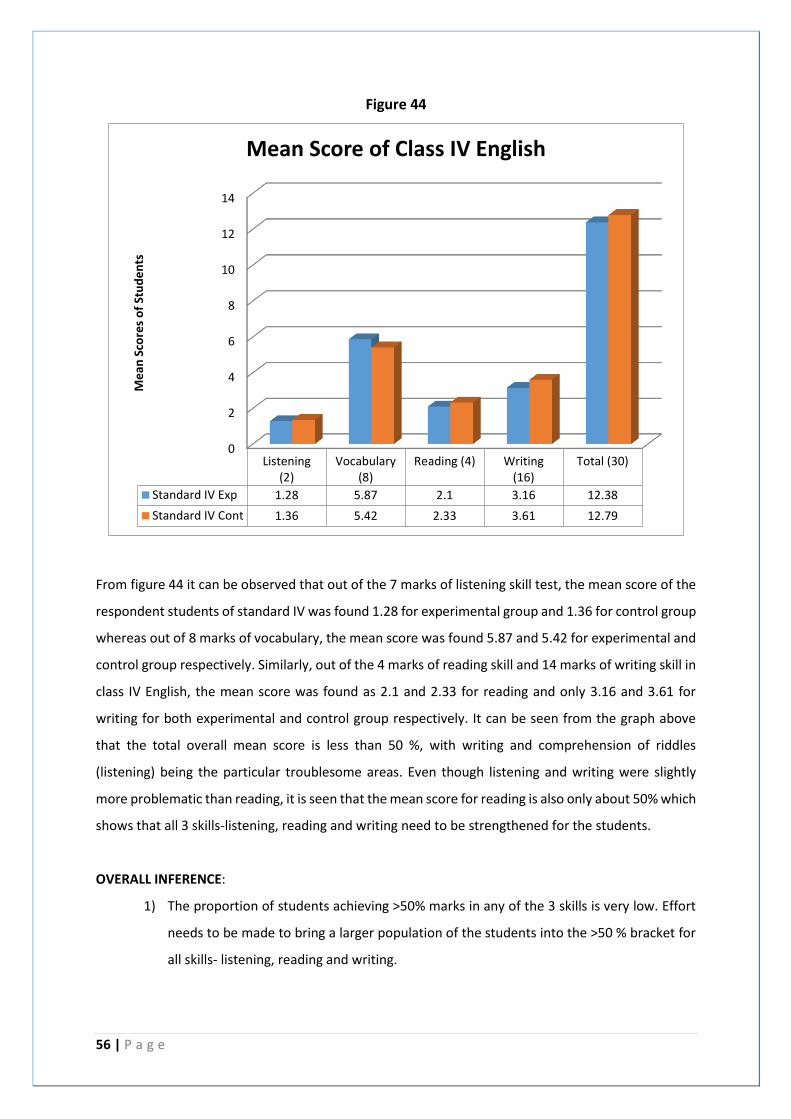
56 | P a g e
Figure 44
From figure 44 it can be observed that out of the 7 marks of listening skill test, the mean score of the
respondent students of standard IV was found 1.28 for experimental group and 1.36 for control group
whereas out of 8 marks of vocabulary, the mean score was found 5.87 and 5.42 for experimental and
control group respectively. Similarly, out of the 4 marks of reading skill and 14 marks of writing skill in
class IV English, the mean score was found as 2.1 and 2.33 for reading and only 3.16 and 3.61 for
writing for both experimental and control group respectively. It can be seen from the graph above
that the total overall mean score is less than 50 %, with writing and comprehension of riddles
(listening) being the particular troublesome areas. Even though listening and writing were slightly
more problematic than reading, it is seen that the mean score for reading is also only about 50% which
shows that all 3 skills-listening, reading and writing need to be strengthened for the students.
OVERALL INFERENCE:
1) The proportion of students achieving >50% marks in any of the 3 skills is very low. Effort
needs to be made to bring a larger population of the students into the >50 % bracket for
all skills- listening, reading and writing.
0
2
4
6
8
10
12
14
Listening(2)
Vocabulary(8)
Reading (4) Writing(16)
Total (30)
Standard IV Exp 1.28 5.87 2.1 3.16 12.38
Standard IV Cont 1.36 5.42 2.33 3.61 12.79
Me
an S
core
s o
f St
ud
en
tsMean Score of Class IV English
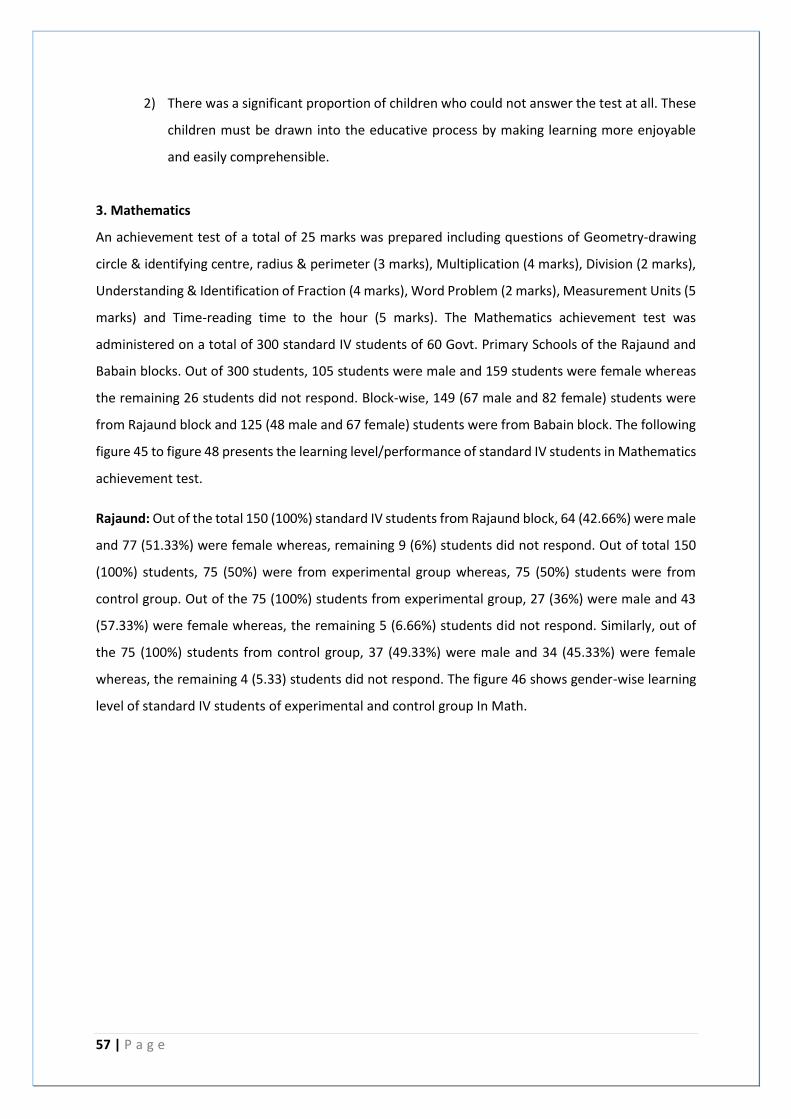
57 | P a g e
2) There was a significant proportion of children who could not answer the test at all. These
children must be drawn into the educative process by making learning more enjoyable
and easily comprehensible.
3. Mathematics
An achievement test of a total of 25 marks was prepared including questions of Geometry-drawing
circle & identifying centre, radius & perimeter (3 marks), Multiplication (4 marks), Division (2 marks),
Understanding & Identification of Fraction (4 marks), Word Problem (2 marks), Measurement Units (5
marks) and Time-reading time to the hour (5 marks). The Mathematics achievement test was
administered on a total of 300 standard IV students of 60 Govt. Primary Schools of the Rajaund and
Babain blocks. Out of 300 students, 105 students were male and 159 students were female whereas
the remaining 26 students did not respond. Block-wise, 149 (67 male and 82 female) students were
from Rajaund block and 125 (48 male and 67 female) students were from Babain block. The following
figure 45 to figure 48 presents the learning level/performance of standard IV students in Mathematics
achievement test.
Rajaund: Out of the total 150 (100%) standard IV students from Rajaund block, 64 (42.66%) were male
and 77 (51.33%) were female whereas, remaining 9 (6%) students did not respond. Out of total 150
(100%) students, 75 (50%) were from experimental group whereas, 75 (50%) students were from
control group. Out of the 75 (100%) students from experimental group, 27 (36%) were male and 43
(57.33%) were female whereas, the remaining 5 (6.66%) students did not respond. Similarly, out of
the 75 (100%) students from control group, 37 (49.33%) were male and 34 (45.33%) were female
whereas, the remaining 4 (5.33) students did not respond. The figure 46 shows gender-wise learning
level of standard IV students of experimental and control group In Math.
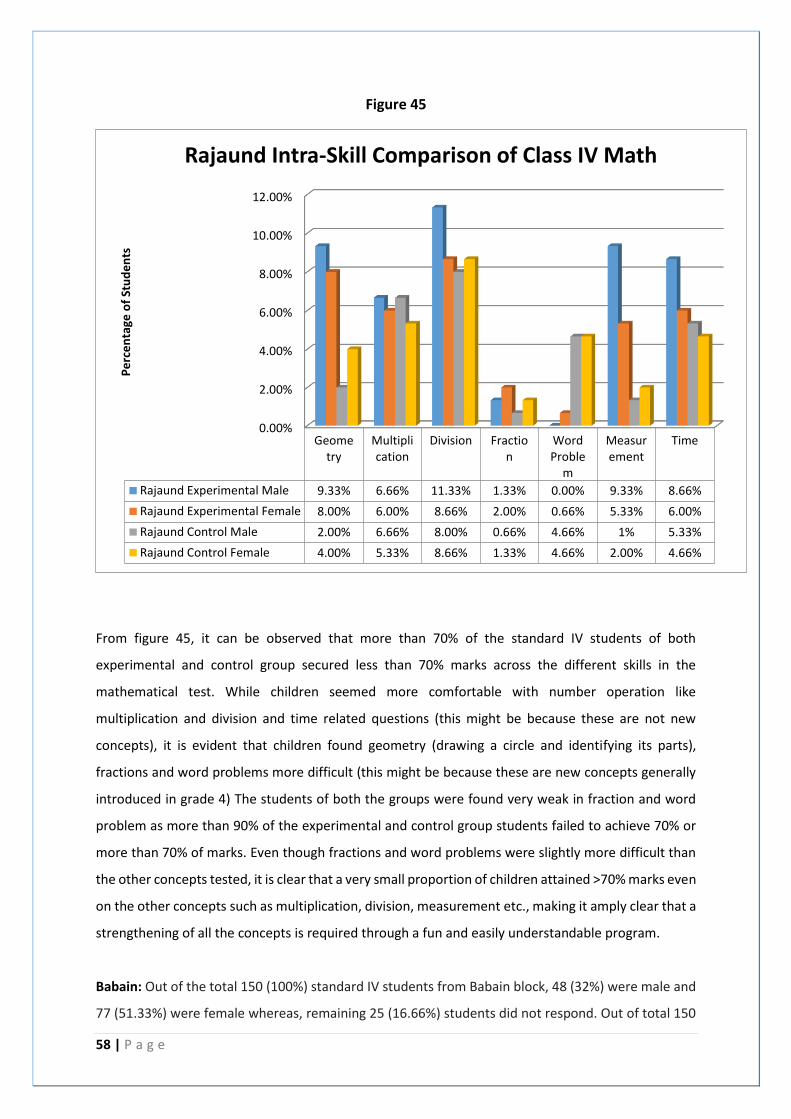
58 | P a g e
Figure 45
From figure 45, it can be observed that more than 70% of the standard IV students of both
experimental and control group secured less than 70% marks across the different skills in the
mathematical test. While children seemed more comfortable with number operation like
multiplication and division and time related questions (this might be because these are not new
concepts), it is evident that children found geometry (drawing a circle and identifying its parts),
fractions and word problems more difficult (this might be because these are new concepts generally
introduced in grade 4) The students of both the groups were found very weak in fraction and word
problem as more than 90% of the experimental and control group students failed to achieve 70% or
more than 70% of marks. Even though fractions and word problems were slightly more difficult than
the other concepts tested, it is clear that a very small proportion of children attained >70% marks even
on the other concepts such as multiplication, division, measurement etc., making it amply clear that a
strengthening of all the concepts is required through a fun and easily understandable program.
Babain: Out of the total 150 (100%) standard IV students from Babain block, 48 (32%) were male and
77 (51.33%) were female whereas, remaining 25 (16.66%) students did not respond. Out of total 150
0.00%
2.00%
4.00%
6.00%
8.00%
10.00%
12.00%
Geometry
Multiplication
Division Fraction
WordProble
m
Measurement
Time
Rajaund Experimental Male 9.33% 6.66% 11.33% 1.33% 0.00% 9.33% 8.66%
Rajaund Experimental Female 8.00% 6.00% 8.66% 2.00% 0.66% 5.33% 6.00%
Rajaund Control Male 2.00% 6.66% 8.00% 0.66% 4.66% 1% 5.33%
Rajaund Control Female 4.00% 5.33% 8.66% 1.33% 4.66% 2.00% 4.66%
Pe
rce
nta
ge o
f St
ud
en
ts
Rajaund Intra-Skill Comparison of Class IV Math
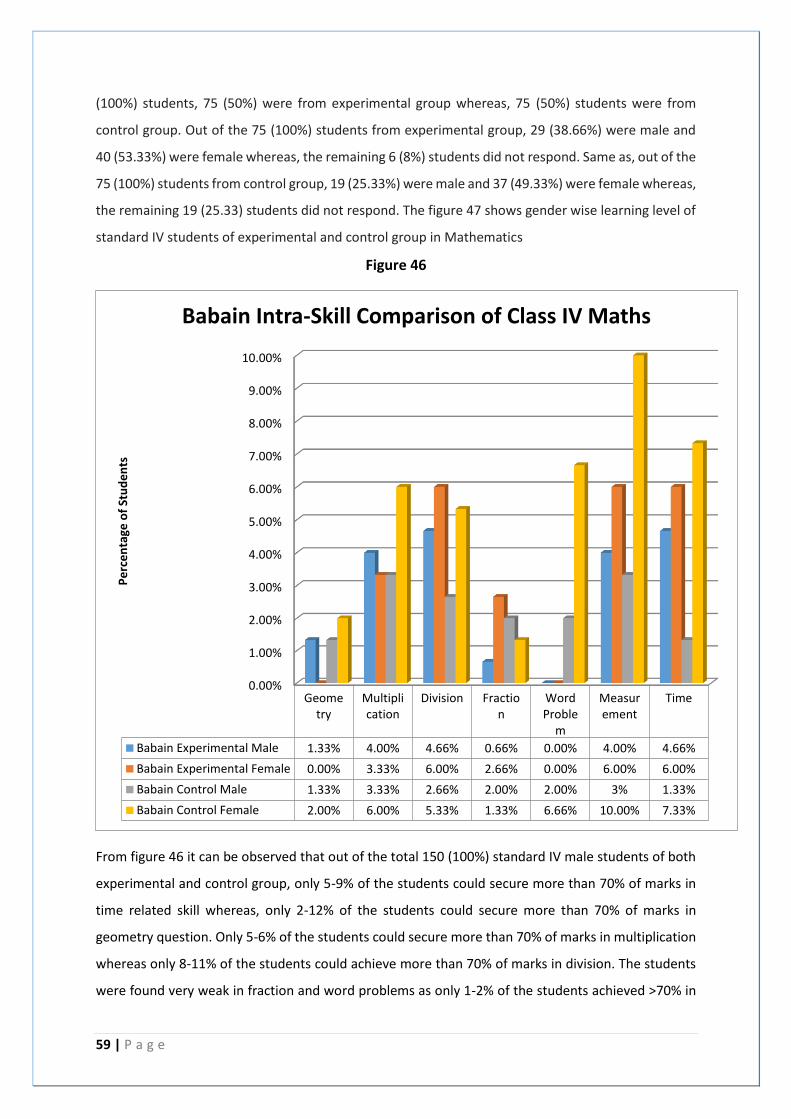
59 | P a g e
(100%) students, 75 (50%) were from experimental group whereas, 75 (50%) students were from
control group. Out of the 75 (100%) students from experimental group, 29 (38.66%) were male and
40 (53.33%) were female whereas, the remaining 6 (8%) students did not respond. Same as, out of the
75 (100%) students from control group, 19 (25.33%) were male and 37 (49.33%) were female whereas,
the remaining 19 (25.33) students did not respond. The figure 47 shows gender wise learning level of
standard IV students of experimental and control group in Mathematics
Figure 46
From figure 46 it can be observed that out of the total 150 (100%) standard IV male students of both
experimental and control group, only 5-9% of the students could secure more than 70% of marks in
time related skill whereas, only 2-12% of the students could secure more than 70% of marks in
geometry question. Only 5-6% of the students could secure more than 70% of marks in multiplication
whereas only 8-11% of the students could achieve more than 70% of marks in division. The students
were found very weak in fraction and word problems as only 1-2% of the students achieved >70% in
0.00%
1.00%
2.00%
3.00%
4.00%
5.00%
6.00%
7.00%
8.00%
9.00%
10.00%
Geometry
Multiplication
Division Fraction
WordProble
m
Measurement
Time
Babain Experimental Male 1.33% 4.00% 4.66% 0.66% 0.00% 4.00% 4.66%
Babain Experimental Female 0.00% 3.33% 6.00% 2.66% 0.00% 6.00% 6.00%
Babain Control Male 1.33% 3.33% 2.66% 2.00% 2.00% 3% 1.33%
Babain Control Female 2.00% 6.00% 5.33% 1.33% 6.66% 10.00% 7.33%
Pe
rce
nta
ge o
f St
ud
en
ts
Babain Intra-Skill Comparison of Class IV Maths
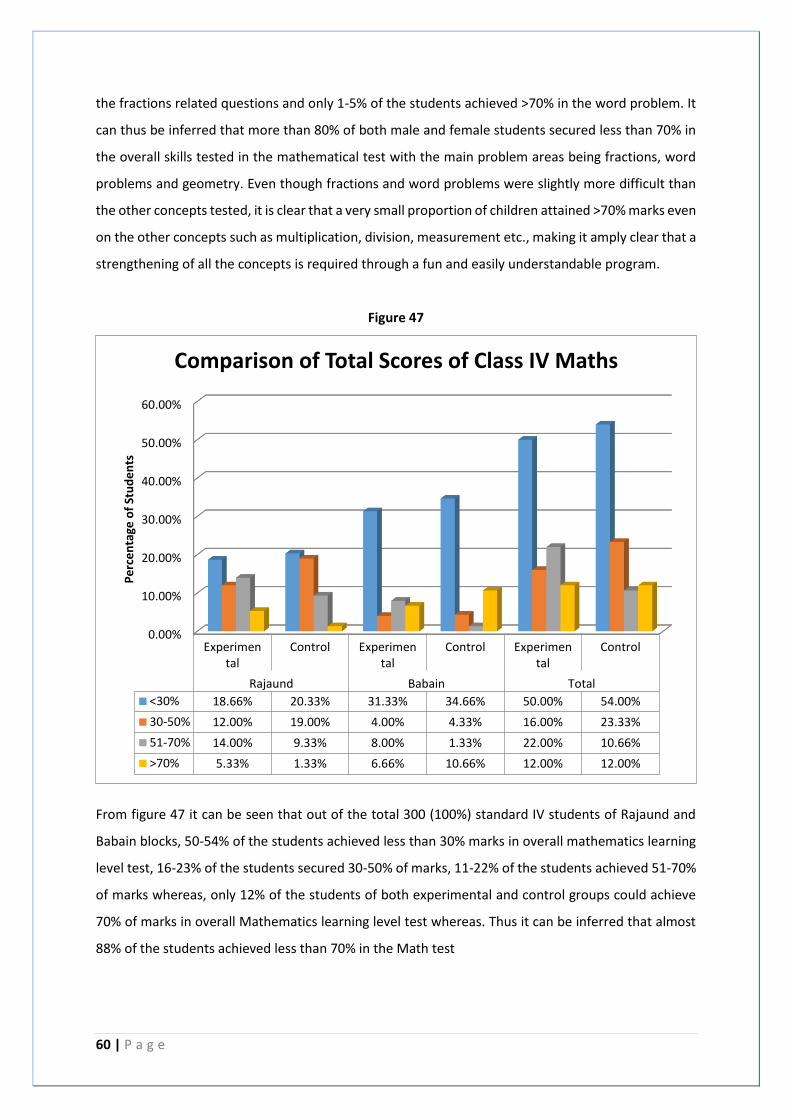
60 | P a g e
the fractions related questions and only 1-5% of the students achieved >70% in the word problem. It
can thus be inferred that more than 80% of both male and female students secured less than 70% in
the overall skills tested in the mathematical test with the main problem areas being fractions, word
problems and geometry. Even though fractions and word problems were slightly more difficult than
the other concepts tested, it is clear that a very small proportion of children attained >70% marks even
on the other concepts such as multiplication, division, measurement etc., making it amply clear that a
strengthening of all the concepts is required through a fun and easily understandable program.
Figure 47
From figure 47 it can be seen that out of the total 300 (100%) standard IV students of Rajaund and
Babain blocks, 50-54% of the students achieved less than 30% marks in overall mathematics learning
level test, 16-23% of the students secured 30-50% of marks, 11-22% of the students achieved 51-70%
of marks whereas, only 12% of the students of both experimental and control groups could achieve
70% of marks in overall Mathematics learning level test whereas. Thus it can be inferred that almost
88% of the students achieved less than 70% in the Math test
0.00%
10.00%
20.00%
30.00%
40.00%
50.00%
60.00%
Experimental
Control Experimental
Control Experimental
Control
Rajaund Babain Total
<30% 18.66% 20.33% 31.33% 34.66% 50.00% 54.00%
30-50% 12.00% 19.00% 4.00% 4.33% 16.00% 23.33%
51-70% 14.00% 9.33% 8.00% 1.33% 22.00% 10.66%
>70% 5.33% 1.33% 6.66% 10.66% 12.00% 12.00%
Pe
rce
nta
ge o
f St
ud
en
ts
Comparison of Total Scores of Class IV Maths

61 | P a g e
Figure 48
From the figure 48 it can be observed that out of the 4 marks of multiplication, the mean score of the
respondent students of standard IV was found 2.03 for experimental group and 1.93 for control group
whereas out of 5 marks of time related skill, the mean score was found 1.85 for experimental and 1.68
for control group. Out of total 3 marks of geometry question, the mean score was found only 0.8 and
0.51 for experimental and control group respectively whereas out of 2 marks of division, the means
score was found 0.79 and 0.76 for experimental and control group respectively. Out of 5 marks of
measurement, the mean score was found 1.71 and 1.27 for experimental and control group
respectively whereas out of 2 marks of word problem, the mean score was found 0.73 for
experimental and 0.72 for control group. The mean score in fraction was found very low as out of 4
marks the means score was measured only 0.91 for experimental and 1.03 for control group students.
From this result it can be conjectured that the students of class IV were very weak in time, geometry
and fraction related skills of mathematics. The overall mean score was also found very low as out of
total 25 marks, the mean score was measured only 8.77 for experimental and 7.92 for control group
which is 32-35%. This is a very dismal mean score and efforts must be taken to raise the class average
0
2
4
6
8
10
Multiplication(4)
Time(5)
Geometry (3)
Division(2)
Measurement (5)
Word
Problem(2)
Fraction(4)
Total(25)
Standard IV Exp 2.03 1.85 0.8 0.79 1.71 0.73 0.91 8.77
Standard IV Cont 1.93 1.68 0.51 0.76 1.27 0.72 1.03 7.92
Me
an S
core
s o
f St
ud
en
ts
Mean Score of Class IV Maths
62 | P a g e
to higher than 50% at least which will only be achieved if a holistic effort is made to strengthen all the
concepts being taught to the students through an enjoyable and effective strategy.
OVERALL INFERENCE:
1) The proportion of students achieving >50% marks in any of the mathematical skills is very
low. Effort needs to be made to bring a larger population of the students into the >50 %
bracket for all the skills tested above.
2) It is clear that both the male and female students are struggling with geometry, fractions
and word problems. Even though fractions and word problems were slightly more difficult
than the other concepts tested, it is clear that a very small proportion of children attained
>70% marks even on the other concepts such as multiplication, division, measurement
etc., making it amply clear that a strengthening of all the concepts is required through a
fun and easily understandable program.
3) There was a significant proportion of children who could not answer the test at all. These
children must be drawn into the educative process by making learning more enjoyable
and easily comprehensible.


![A BASELINE SURVEY OF MINORITY …1].pdfA BASELINE SURVEY OF MINORITY CONCENTRATION DISTRICTS OF INDIA SIRSA (Haryana) Sponsored by Ministry of Minority Affairs Government of India](https://static.cupdf.com/doc/110x72/5aaa8d647f8b9a7c188e3cb2/a-baseline-survey-of-minority-1pdfa-baseline-survey-of-minority-concentration.jpg)
