


8/7/2019 Sector_LED_20100715_Mirae
http://slidepdf.com/reader/full/sectorled20100715mirae 1/20
Hedge fund investors Long-only investors
Take advantage of the upcoming LEDmarket’s upside rally, as seasonally
strong demand is to come in 2H10.
Average over 50% of profit CAGR
expected for LED makers
Tight LED package supply will secureLED makers’ remarkable earnings
growth until 2011
1
See the last page of this report for important disclosures
K o r e a / T e c h n o l o g y LED Industry
LED demand growth to
accelerate in 2H10We foresee an LED market upside rally on seasonally strongdemand to come in 2H10. The reasons are three-fold: 1) thepersistent strain on LED chip supplies should limit chip pricedecline; 2) domestic LED makers should show acceleratingearnings growth on completed capex expansion alongsideseasonally strong demand; and 3) likely robust high-enddemand (e.g. 3D TVs) and increased LED TV penetration inChina should drive global LED demand in 2H10. We believeLED companies still have sufficient upside if their earningscontinue to meet expectations, even after outperforming the
market to date. We see our Overweight rating on the sectoras justifiable, given that LED makers’ average profit CAGR exceeds 50%. Our top picks for the sector are LG Innotek and Samsung Electro-Mechanics.
» Strains on LED package supplies will continue into 2011
It will take about a year before ingot makers complete their capacity
expansion currently underway. As such, although they will raise LED TV
ingots’ portion to 50% of their total ingot output, LED supply will remain
tight for the time being. We estimate demand for LED packages will be
14.4bn in 2010 but the supply forecast for 2010 (13.6bn units of LED
packages) satisfies only 95% of the demand forecast. We expect supply
(25.4bn units) will still not meet demand (25.5bn units) in 2011.
» LED makers’ earnings rise rapidly on strong LED TV demandLED makers’ remarkable earnings growth of late is driven by strong demand
for LED TVs. All key domestic LED makers except Seoul Semiconductor
(Samsung LED, LG Innotek, and Lumens) recorded more than 80% sales
contributions from their TV BLU divisions. All four companies invested a
combined W1.4tn into expanding their TV BLU capex and are expected to
record operating margins of over 10%. With global LED TV demand likely to
soar 148%, from 37mn units in 2010 to 92mn units in 2011, we expect the
LED players’ earnings uptrend to continue into 2011.
» LED market drivers: 3D TVs and Chinese demand
Since the start of the 2010 World Cup, 3D TVs have been drawing
increasing attention in the market. Samsung Electronics is expected topost sales of 1m 3D TVs in August, while demand for 3D TVs is
expected to reach 6m units, making up 16.2% of the global LED TV
market in 2010. In addition, 3D TVs require 30% more LED chips than
existing LED TVs, for high lamination and refresh rates. Coupled with 3D
TV, Chinese demand for LED TVs will drive the global LED market.
China is expected to constitute 20% of the global LED TV market in
3Q10, up significantly from 5% in 4Q09.
Soon-Hak Lee, Korea Analyst
+82 2 3774 1651 [email protected]
Jubi Park, Korea Analyst
+82 2 3774 1938 [email protected]
Overweight15 Jul 2010
Company Ticker Rating PriceTarget
price
Seoul
Semiconductor 009150 BUY W149,000 W200,000
LG Innotek 011070 BUY W178,500 W230,000
Lumens 038060 BUY W12,450 W18,000
Hansol LCD 004710 BUY W57,800 W80,000
Note: Prices are in KRW; Price close as of (13/7/2010 close)
Source for data: Bloomberg, companies, Mirae Asset Research
0
1,000
2,000
3,000
4,000
5,000
6,000
7,000
8,000
9,000
1Q10 2Q10E 3Q10E 4Q10E 1Q11E 2Q11E 3Q11E 4Q11E
(mn unit)
Demand Supply
Stocks for action
Supply and demand trend for LED TV
LED operating margin trend by LED makers
Supply and demand trend for LED TV
(30)
(20)
(10)
0
10
20
30
1Q09 2Q09 3Q09 4Q09 1Q10 2Q10E 3Q10E 4Q10E
(%)
Samsung LED LG Innotek Seoul Semiconductor Lumens
0
10,000
20,000
30,000
40,000
50,000
60,000
4Q09 2Q10E 4Q10E 2Q11E 4Q11E 2Q12E 4Q12E
(K units)
0
5
10
15
20
25
(%)
Globa l LED TV (lhs) China (lhs) Port ion (rhs)
8/7/2019 Sector_LED_20100715_Mirae
http://slidepdf.com/reader/full/sectorled20100715mirae 2/20
Soon-Hak Lee, Handset Analyst, 82 2 3774 1651 [email protected] Korea/Display 15 July 2010
Jubi Park, Small-cap Analyst, 82 2 3774 1938 [email protected]
2
C O N T E N T S
LED demand growth to accelerate in 2H10 ...................................................1 1. Executive Summary ...................................................................................3 2. LED players to maintain upbeat earnings on chip supply strain................4
Chip supply shortages for LED TV BLU to continue into 2011 4 LED makers’ earnings rising fast on strong LED TV demand 6
3. Key drivers in 2H10: 3D TVs and China......................................................8 Demand for over 20mn LED TVs expected in 2H10 8 3D TV market expansion to help increase demand for LED further 8 LED demand to be driven by wider penetration of LED TVs in China 9
COMPANY SECTION
Lumens [038060 KS, BUY]: Economies of scale achieved with China plant ........ 10 Flagging sales but improved operating margin 10 Expectations of 2H peak season 11 Profit growth through economies of scale 11
Summary financial statements 12
Hansol LCD [004710 KS, BUY]: Positive evolution continues............................ 14 2Q10 sales and operating profit to rise 35.1% QoQ, 99.6% QoQ 14 Higher sales portion of LED BLU will increase business reliability 14
Summary financial statements 16 Analyst team profile.....................................................................................18

8/7/2019 Sector_LED_20100715_Mirae
http://slidepdf.com/reader/full/sectorled20100715mirae 3/20
Soon-Hak Lee, Handset Analyst, 82 2 3774 1651 [email protected] Korea/Display 15 July 2010
Jubi Park, Small-cap Analyst, 82 2 3774 1938 [email protected]
3
1. Executive SummaryLED companies showed remarkable earnings growth in 1H10. Both their sales and operating
profit are showing exponential growth, as LED chip and package prices remain strong on
persistent strain on LED supply. Their notable earnings performance was fueled by Korea’s top-
2 TV and LCD panel makers’ dominant market leadership. We expect LED companies will see
another leap in earnings in 2H10, on growing LED TV demand. While the global LED TV
demand forecast for FY10 is 37m units, actual LED TV sales stood at only 10m units in 1H10.
This points to at least 20m LED TV sales globally in 2H10, and another earnings rally for key
domestic players.
We expect LED supply to remain tight through 2011. Although LED makers will raise the LED
TV BLU portion of total chip output to 50%, LED TV supply will not likely increase dramatically,
due to productivity issues. We estimate for 2010, LED package demand (14.4bn) should
outstrip supply (13.6bn units) by roughly 5%. We expect the slight undersupply of LED
packages to continue into 2011, as supply (25.4bn units) will still not meet demand (25.5bn
units). Given this supply forecast is mainly for 2” substrates, the supply strain can be resolved
earlier than expected, depending on output portions of 4” and 6” substrates. However,
considering that it will take quite some time before the chip production yield for larger-sizedsubstrates improves to the level of 2” substrates, we expect the supply to remain tight though
1H11, at least.
Domestic LED companies, particularly Samsung LED, saw their earnings rise steeply. Samsung
LED logged sales of W330bn and operating profit of W51.2bn in 1Q10, and is expected to
report a 30.7% QoQ rise in sales (W431.3bn) and an 87.3% QoQ surge in operating profit
(W95.9bn) for 2Q10. We forecast LG Innotek to report an operating margin of 7.5% for 2Q10,
as its LED division, having remained in the red until FY09, turned profitable in 1Q10. Seoul
Semiconductor expects to report sales of over W200bn and operating margin of 12% for 2Q10,
as it raised the sales contribution from TV BLU LED from 15% in 1Q10 to 40% in 2Q10.
Lumens, a supplier of LED packages to Samsung Electronics, expects to turn in an operating
margin of 9.3% for 2Q10.
In 2H10, four domestic LED makers are expected to grow rapidly, benefiting from LED TV
market growth on 3D TV sales and Chinese demand. Demand for LED chips will rise not only
because 3D TVs require 30% more LED chips than existing LED TVs, for high lamination and
refresh rates, but the proportion of LED TVs in the Chinese LCD TV market is also expected to
expand from 5% in 4Q09 to 20% in 3Q10. Before seasonally busy 3Q10, LED chip makers
have completed their capacity expansion. Given this, we expect their sales to grow 20 to 40%
QoQ, yielding double-digit operating margins in 2H10.
Our top picks for the LED sector include LG Innotek (011070, BUY, TP: W230,000), which is
seeing rapid earnings growth in its LED division, and Samsung Electro-Mechanics, which
delivers steady earnings from the LED, MLCC and substrate business divisions.
CE retailers will attempt to offset
slowing white CE sales by
boosting LCD TV sales
LED makers’ dramatic earnings
growth was powered by surging
demand for LED TV BLU. Most
domestic LED players, except
Seoul Semiconductor, generate
over 80% of sales from their LED
TV BLU divisions.
8/7/2019 Sector_LED_20100715_Mirae
http://slidepdf.com/reader/full/sectorled20100715mirae 4/20
Soon-Hak Lee, Handset Analyst, 82 2 3774 1651 [email protected] Korea/Display 15 July 2010
Jubi Park, Small-cap Analyst, 82 2 3774 1938 [email protected]
4
2. LED players to maintain upbeat earnings on chipsupply strain
Chip supply shortages for LED TV BLU to continue into 2011
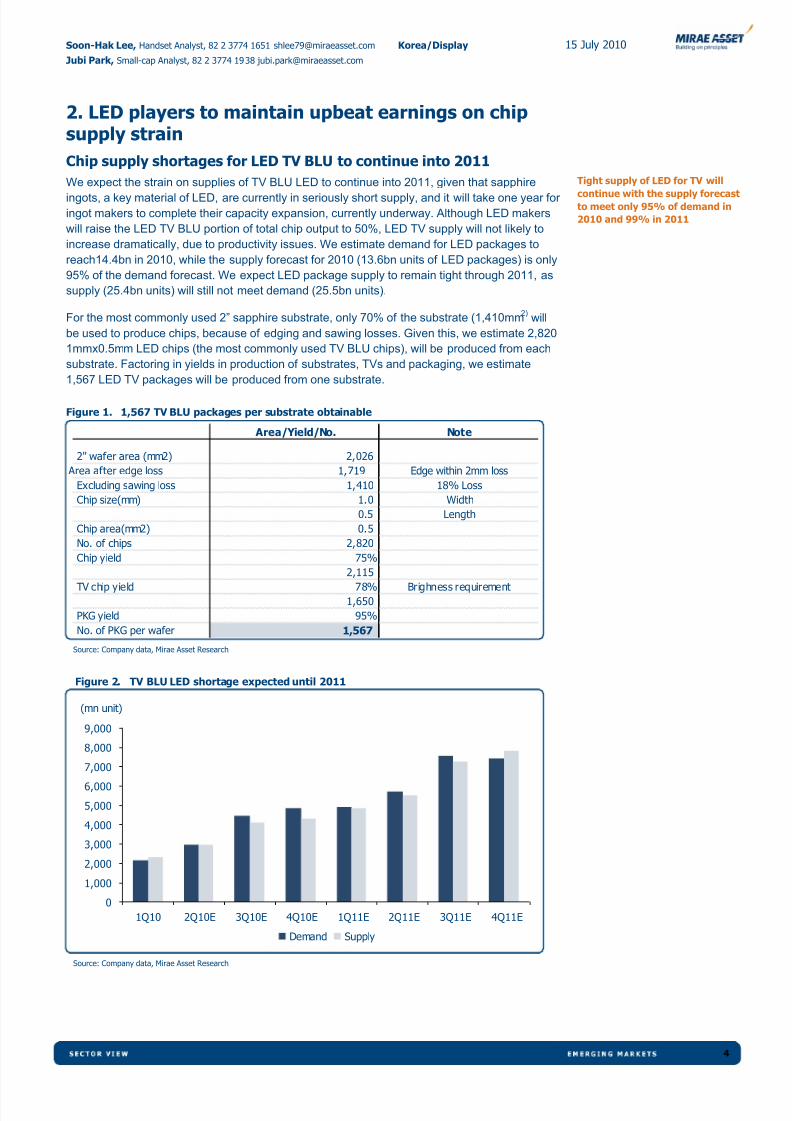
We expect the strain on supplies of TV BLU LED to continue into 2011, given that sapphire
ingots, a key material of LED, are currently in seriously short supply, and it will take one year for
ingot makers to complete their capacity expansion, currently underway. Although LED makers
will raise the LED TV BLU portion of total chip output to 50%, LED TV supply will not likely to
increase dramatically, due to productivity issues. We estimate demand for LED packages to
reach14.4bn in 2010, while the supply forecast for 2010 (13.6bn units of LED packages) is only
95% of the demand forecast. We expect LED package supply to remain tight through 2011, as
supply (25.4bn units) will still not meet demand (25.5bn units).
For the most commonly used 2” sapphire substrate, only 70% of the substrate (1,410mm2)
will
be used to produce chips, because of edging and sawing losses. Given this, we estimate 2,820
1mmx0.5mm LED chips (the most commonly used TV BLU chips), will be produced from each
substrate. Factoring in yields in production of substrates, TVs and packaging, we estimate
1,567 LED TV packages will be produced from one substrate.
Figure 1. 1,567 TV BLU packages per substrate obtainable
Area/Yield/No. Note
2" wafer area (mm2) 2,026
Area after edge loss 1,719 Edge within 2mm loss
Excluding sawing loss 1,410 18% Loss
Chip size(mm) 1.0 Width
0.5 Length
Chip area(mm2) 0.5
No. of chips 2,820
Chip yield 75%
2,115 TV chip yield 78% Brighness requirement
1,650
PKG yield 95%
No. of PKG per wafer 1,567
Source: Company data, Mirae Asset Research
Figure 2. TV BLU LED shortage expected until 2011
0
1,000
2,000
3,000
4,000
5,000
6,000
7,000
8,000
9,000
1Q10 2Q10E 3Q10E 4Q10E 1Q11E 2Q11E 3Q11E 4Q11E
(mn unit)
Demand Supply
Source: Company data, Mirae Asset Research
Tight supply of LED for TV will
continue with the supply forecastto meet only 95% of demand in
2010 and 99% in 2011

8/7/2019 Sector_LED_20100715_Mirae
http://slidepdf.com/reader/full/sectorled20100715mirae 5/20
Soon-Hak Lee, Handset Analyst, 82 2 3774 1651 [email protected] Korea/Display 15 July 2010
Jubi Park, Small-cap Analyst, 82 2 3774 1938 [email protected]
5
The leading global sapphire ingot makers are Rubicon (US), Monocrystal (Russia), and
Sapphire Tech (Korea). Hansol LCD has recently made a foray into the global ingot market, and
is expected to produce ingots from 2H11. We project global sapphire ingot production capacity
to reach 2.15mn/month by end-2010 and grow only 80% YoY to 3.87mn/month by end-2011.
Meanwhile, since LED TV demand is forecast to climb 148% YoY in 2011, we anticipate tight
supply to continue, even assuming that the number of LED chips required for LED TVs drops
5% each quarter.
So, will LED supplies remain tight by end-2011? We made the aforementioned LED supply
forecast based on 2” substrates. However, given that the mass-production of 4” substrates is
already underway, and that of 6” substrates is likely to begin early FY11, we anticipate the
production yield should rise further. Considering that chipmakers can produce 14% more chips
from 4” substrates, 44% more chips from 6” substrates compared with 2” substrates, we believe
supply strains can be resolved earlier than expected, depending on output portions of 4” and 6”
substrates. However, given that most ingot makers currently focus on producing 2” substrates,
their entry into the larger-sized ingot market is unlikely to accelerate. Overall, we foresee LED
chip supply shortages continuing into at least 1H11.
Figure 3. 14% and 44% productivity increase for 4” and 6” wafers
Wafer sizeRadius
(mm)
Excluding
edge loss
Effective
area(mm2)
Area after
sawing
loss(mm2)
Increase
2" 25.4 23.4 1,719 1,410
4" 50.8 48.8 7,478 6,132
6" 76.2 74.2 17,288 14,176
MOCVD
2"x42 59,214
4"x11 67,449 14%
6"x6 85,056 44%
Source: Company data, Mirae Asset Research
Figure 4. Supply and demand table for TV LED
(K units) 1Q10 2Q10E 3Q10E 4Q10E 1Q11E 2Q11E 3Q11E 4Q11E
Global LED TV 3,077 6,442 9,846 17,693 15,726 19,086 23,127 34,440
Direct type portion 18% 12% 10% 9% 9% 10% 9% 10%
Edge type portion 82% 88% 90% 91% 91% 90% 91% 90%
Direct type 548 756 960 1,645 1,441 1,834 2,180 3,362
Edge type portion 2,529 5,686 8,886 16,048 14,285 17,252 20,947 31,078
Over 40" portion 65% 51% 45% 42% 40% 41% 40% 39%
Under 40" portion 35% 49% 55% 58% 60% 59% 60% 61%
Over 40" 1,642 2,906 4,028 6,685 5,732 6,997 8,423 11,984
Under 40" 887 2,780 4,858 9,363 8,553 10,255 12,524 19,094
LED PKG necessity
Avg direct type 2,000 1,800 1,620 1,458 1,385 1,316 1,250 1,188 Avg edge type (>40") 270 257 244 231 220 209 198 189
Avg edge type (<40") 180 171 162 154 147 139 132 126
Total PKG necessity 1,698,992 2,581,601 3,325,844 5,390,925 4,510,457 5,303,424 6,053,973 8,652,261
Setmaker PKG demand 2,140,297 2,953,722 4,466,203 4,842,872 4,906,940 5,678,698 7,526,162 7,393,084
Ingot capa (K mm/m) 1,415 1,634 2,036 2,145 2,404 2,749 3,611 3,870
Utilization rate 95% 95% 95% 95% 95% 95% 95% 95%
LED BLU portion 40% 45% 50% 50% 50% 50% 50% 50%
Sapphire wafer (Q) 1,452 1,886 2,611 2,751 3,083 3,525 4,631 4,963
PKG for LED BLU 2,275,037 2,955,538 4,090,846 4,310,914 4,830,937 5,524,301 7,257,710 7,777,733
Demand - Supply 134,741 1,816 (375,356) (531,958) (76,004) (154,398) (268,452) 384,648
Source: Company data, Mirae Asset Research

8/7/2019 Sector_LED_20100715_Mirae
http://slidepdf.com/reader/full/sectorled20100715mirae 6/20
Soon-Hak Lee, Handset Analyst, 82 2 3774 1651 [email protected] Korea/Display 15 July 2010
Jubi Park, Small-cap Analyst, 82 2 3774 1938 [email protected]
6
LED makers’ earnings rising fast on strong LED TV demand
Domestic LED players have exhibited notable earnings improvement in 2010. We expect the
four leading domestic LED chip and packaging suppliers (Samsung LED, LG Innotek, Seoul
Semiconductor, Lumens), not including Seoul Semiconductor, to report over 100% YoY growth
in sales for FY10. In particular, Samsung LED should display the industry’s strongest earnings
growth, with sales and operating profit estimated to climb 192% YoY, and 526% YoY,respectively, in FY10. LG Innotek expects the fastest earnings turnaround in FY10, with a likely
357% YoY jump in sales and 6.8% operating profit; a dramatic turnaround from an operating
loss of 19.2% in FY09.
The LED market is indeed on an exponential growth path. It’s no wonder, then, that Samsung
LED and LG Innotek, with immense captive markets (Samsung LED, and LG Innotek,
respectively), are set to grow explosively, going forward. Moreover, Seoul Semiconductor and
Lumens, even without captive markets, anticipate their operating profit to surge 137% YoY and
465% YoY, respectively, in FY10.
LED players’ remarkable earnings growth has been fueled by LED TV. Samsung Electronics
secured first mover advantage in the global LED market, offering an immediate boon to
Samsung LED. Lumens’s stronger-than-expected earnings were also possible as it focused onproducing TV BLU LED to be shipped to Samsung Electronics. Seoul Semiconductor’s earnings
growth has also been accelerating as the company began to supply TV LEDs. The company is
likely to raise its sales contribution from LED TV to 50% in 4Q10 from 15% in 1Q10. LG Innotek,
increasingly focused on TV BLU, anticipates its operating margin topping 7% in 2H10 and 10%
in early FY11, when the mass production of 6” substrates will begin.
Figure 5. LED sales and TV BLU business portion trend
LED sales
(KRW bn) 1Q09 2Q09 3Q09 4Q09 1Q10 2Q10E 3Q10E 4Q10E 2009 2010E
Samsung LED 87.0 146.8 183.2 224.7 330.0 431.3 532.1 580.4 641.7 1,873.8
LG Innotek 29.9 46.2 65.6 94.4 155.1 245.5 311.5 366.6 236.1 1,078.7
Seoul Semiconductor 81.3 115.9 132.9 123.3 124.5 200.0 270.0 230.0 453.4 824.5Lumens 15.5 23.2 42.9 51.4 50.5 67.7 98.9 94.3 133.0 311.4
LED operat ing profit
(KRW bn)
Samsung LED 3.9 11.0 19.8 30.7 51.2 95.9 132.9 129.2 65.4 409.2
LG Innotek -8.0 -9.3 -11.3 -16.9 5.4 18.4 24.0 26.0 -45.4 73.9
Seoul Semiconductor 2.9 12.1 21.1 7.8 13.3 24.0 35.0 32.0 44.0 104.3
Lumens 0.2 0.2 2.1 3.2 4.1 6.3 11.4 10.5 5.7 32.3
LED OPM
(%)
Samsung LED 4.5 7.5 10.8 13.7 15.5 22.2 25.0 22.3 10.2 21.8
LG Innotek -26.8 -20.1 -17.2 -17.9 3.5 7.5 7.7 7.1 -19.2 6.8
Seoul Semiconductor 3.6 10.5 15.9 6.3 10.7 12.0 13.0 13.9 9.7 12.7
Lumens 1.4 0.9 4.9 6.2 8.1 9.3 11.6 11.1 4.3 10.4TV BLU sales
Samsung LED 52.2 95.4 128.2 168.5 267.0 349.6 424.0 443.1 444.4 1,483.8
LG Innotek 15.8 29.6 48.5 83.1 141.5 228.4 292.6 344.9 177.0 1,007.4
Seoul Semiconductor 0.0 0.0 0.0 0.0 18.0 80.0 121.0 115.0 0.0 334.0
Lumens 3.0 10.2 29.3 41.8 38.0 54.8 83.1 80.3 84.3 256.1
TV BLU portion
Samsung LED 60.0 65.0 70.0 75.0 80.9 81.1 79.7 76.3 69.3 79.2
LG Innotek 53.0 64.0 74.0 88.0 91.3 93.0 94.0 94.1 75.0 93.4
Seoul Semiconductor 0.0 0.0 0.0 0.0 14.5 40.0 44.8 50.0 0.0 40.5
Lumens 19.4 44.0 68.4 81.2 75.2 80.9 84.0 85.1 63.4 82.3
Source: Company data, Mirae Asset Research
Domestic LED makers, except
Seoul Semiconductor, expect
their LED sales to jump in excess
of 100% YoY in FY10.
LED players’ impressive earnings
growth has been fueled by robust
demand for LED TVs. For mostdomestic players, except Seoul
Semiconductor, the sales
contribution from LED TVs is over
80%.

8/7/2019 Sector_LED_20100715_Mirae
http://slidepdf.com/reader/full/sectorled20100715mirae 7/20
Soon-Hak Lee, Handset Analyst, 82 2 3774 1651 [email protected] Korea/Display 15 July 2010
Jubi Park, Small-cap Analyst, 82 2 3774 1938 [email protected]
7
Figure 6. Operating margin of LED business
(30)
(20)
(10)
0
10
20
30
1Q09 2Q09 3Q09 4Q09 1Q10 2Q10E 3Q10E 4Q10E
(%)
Samsung LED LG Innotek Seoul Semiconductor Lumens
Source: Company data, Mirae Asset Research
Figure 7. 20%~40% QoQ growth continues excluding slow season
(20)
0
20
40
60
80
100
1Q09 2Q09 3Q09 4Q09 1Q10 2Q10E 3Q10E 4Q10E
(%)
Samsung LED LG Innotek Seoul Semiconductor Lumens
Source: Company data, Mirae Asset Research
Figure 8. TV BLU sales surging in 2010
0
20
40
60
80
100
1Q09 2Q09 3Q09 4Q09 1Q10 2Q10E 3Q10E 4Q10E
(%)
Samsung LED LG Innotek Seoul Semiconductor Lumens
Source: Company data, Mirae Asset Research
8/7/2019 Sector_LED_20100715_Mirae
http://slidepdf.com/reader/full/sectorled20100715mirae 8/20
Soon-Hak Lee, Handset Analyst, 82 2 3774 1651 [email protected] Korea/Display 15 July 2010
Jubi Park, Small-cap Analyst, 82 2 3774 1938 [email protected]
8
3. Key drivers in 2H10: 3D TVs and China
Demand for over 20mn LED TVs expected in 2H10
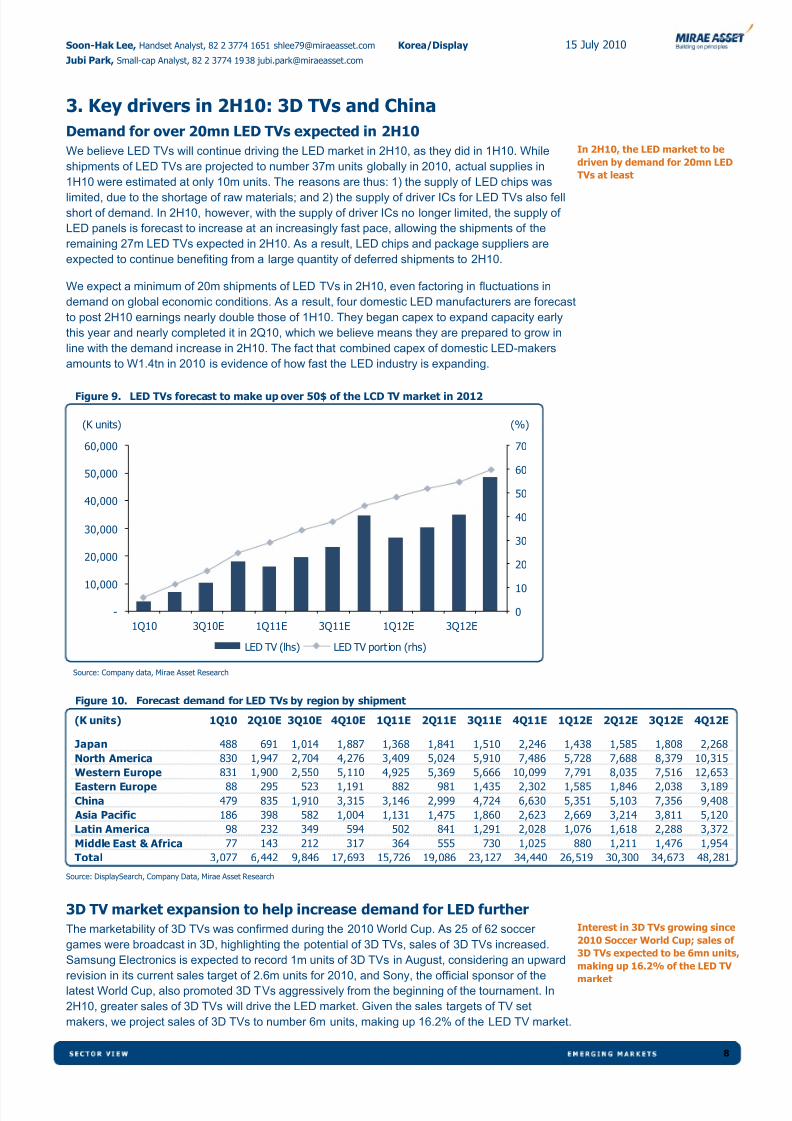
We believe LED TVs will continue driving the LED market in 2H10, as they did in 1H10. While
shipments of LED TVs are projected to number 37m units globally in 2010, actual supplies in
1H10 were estimated at only 10m units. The reasons are thus: 1) the supply of LED chips was
limited, due to the shortage of raw materials; and 2) the supply of driver ICs for LED TVs also fell
short of demand. In 2H10, however, with the supply of driver ICs no longer limited, the supply of
LED panels is forecast to increase at an increasingly fast pace, allowing the shipments of the
remaining 27m LED TVs expected in 2H10. As a result, LED chips and package suppliers are
expected to continue benefiting from a large quantity of deferred shipments to 2H10.
We expect a minimum of 20m shipments of LED TVs in 2H10, even factoring in fluctuations in
demand on global economic conditions. As a result, four domestic LED manufacturers are forecast
to post 2H10 earnings nearly double those of 1H10. They began capex to expand capacity early
this year and nearly completed it in 2Q10, which we believe means they are prepared to grow in
line with the demand increase in 2H10. The fact that combined capex of domestic LED-makers
amounts to W1.4tn in 2010 is evidence of how fast the LED industry is expanding.
Figure 9. LED TVs forecast to make up over 50$ of the LCD TV market in 2012
-
10,000
20,000
30,000
40,000
50,000
60,000
1Q10 3Q10E 1Q11E 3Q11E 1Q12E 3Q12E
(K units)
0
10
20
30
40
50
60
70
(%)
LED TV (lhs) LED TV port ion (rhs)
Source: Company data, Mirae Asset Research
Figure 10. Forecast demand for LED TVs by region by shipment
(K units) 1Q10 2Q10E 3Q10E 4Q10E 1Q11E 2Q11E 3Q11E 4Q11E 1Q12E 2Q12E 3Q12E 4Q12E
Japan 488 691 1,014 1,887 1,368 1,841 1,510 2,246 1,438 1,585 1,808 2,268
North America 830 1,947 2,704 4,276 3,409 5,024 5,910 7,486 5,728 7,688 8,379 10,315
Western Europe 831 1,900 2,550 5,110 4,925 5,369 5,666 10,099 7,791 8,035 7,516 12,653
Eastern Europe 88 295 523 1,191 882 981 1,435 2,302 1,585 1,846 2,038 3,189
China 479 835 1,910 3,315 3,146 2,999 4,724 6,630 5,351 5,103 7,356 9,408
Asia Pacific 186 398 582 1,004 1,131 1,475 1,860 2,623 2,669 3,214 3,811 5,120
Latin America 98 232 349 594 502 841 1,291 2,028 1,076 1,618 2,288 3,372
Middle East & Africa 77 143 212 317 364 555 730 1,025 880 1,211 1,476 1,954
Total 3,077 6,442 9,846 17,693 15,726 19,086 23,127 34,440 26,519 30,300 34,673 48,281
Source: DisplaySearch, Company Data, Mirae Asset Research
3D TV market expansion to help increase demand for LED further
The marketability of 3D TVs was confirmed during the 2010 World Cup. As 25 of 62 soccer
games were broadcast in 3D, highlighting the potential of 3D TVs, sales of 3D TVs increased.
Samsung Electronics is expected to record 1m units of 3D TVs in August, considering an upwardrevision in its current sales target of 2.6m units for 2010, and Sony, the official sponsor of the
latest World Cup, also promoted 3D TVs aggressively from the beginning of the tournament. In
2H10, greater sales of 3D TVs will drive the LED market. Given the sales targets of TV set
makers, we project sales of 3D TVs to number 6m units, making up 16.2% of the LED TV market.
In 2H10, the LED market to be
driven by demand for 20mn LED
TVs at least
Interest in 3D TVs growing since
2010 Soccer World Cup; sales of
3D TVs expected to be 6mn units,making up 16.2% of the LED TV
market
8/7/2019 Sector_LED_20100715_Mirae
http://slidepdf.com/reader/full/sectorled20100715mirae 9/20
Soon-Hak Lee, Handset Analyst, 82 2 3774 1651 [email protected] Korea/Display 15 July 2010
Jubi Park, Small-cap Analyst, 82 2 3774 1938 [email protected]
9
3D TVs merit a price premium as their luminance and refresh rates are higher than existing LED
TVs. LED for 3D TVs are selling at 20 to 40% higher price than other LEDs, and a hearty 57%
higher than CCFL, as 3D TVs require approximately 30% more LED chips than existing LED TVs.
This is in order to prevent darkness of screens with 240Hz refresh rates in the high-speed frame.
LG Electronics, meanwhile, released direct LED-based 3D TVs in an effort to differentiate its
products from others’. Its 55” 3D TV uses 1,500 LED chips. This means that 3D TVs will postpone
a reduction in the number of LED chips used in TVs, benefiting LED manufacturers in the end.
Figure 11. 3D TVs merit 20-40% price premium to existing LED TVs
Brand Model CCFL/LED 3D Size Resolution Rate Price($) Premium
Samsung UN46C7000WF LED 3D 46" 1080p 240Hz 2199.99 57%
LN46C750 CCFL 3D 46" 1080p 240Hz 1399.99
UN55C7000WF LED 3D 55" 1080p 240Hz 2699.99 29%
UN55C6300SF LED 55" 1080p 120Hz 2099.99
LG 55LX6500 LED 3D 55" 1080p 240Hz 2969.99 41%
55LE5400 LED 55" 1080p 120Hz 2099.99
Sony KDL-46HX800 LED 3D 46" 1080p 240Hz 2429.99 22%
KDL-46NX800 LED 46" 1080p 240Hz 1999.99
Source: Company data, Mirae Asset Research
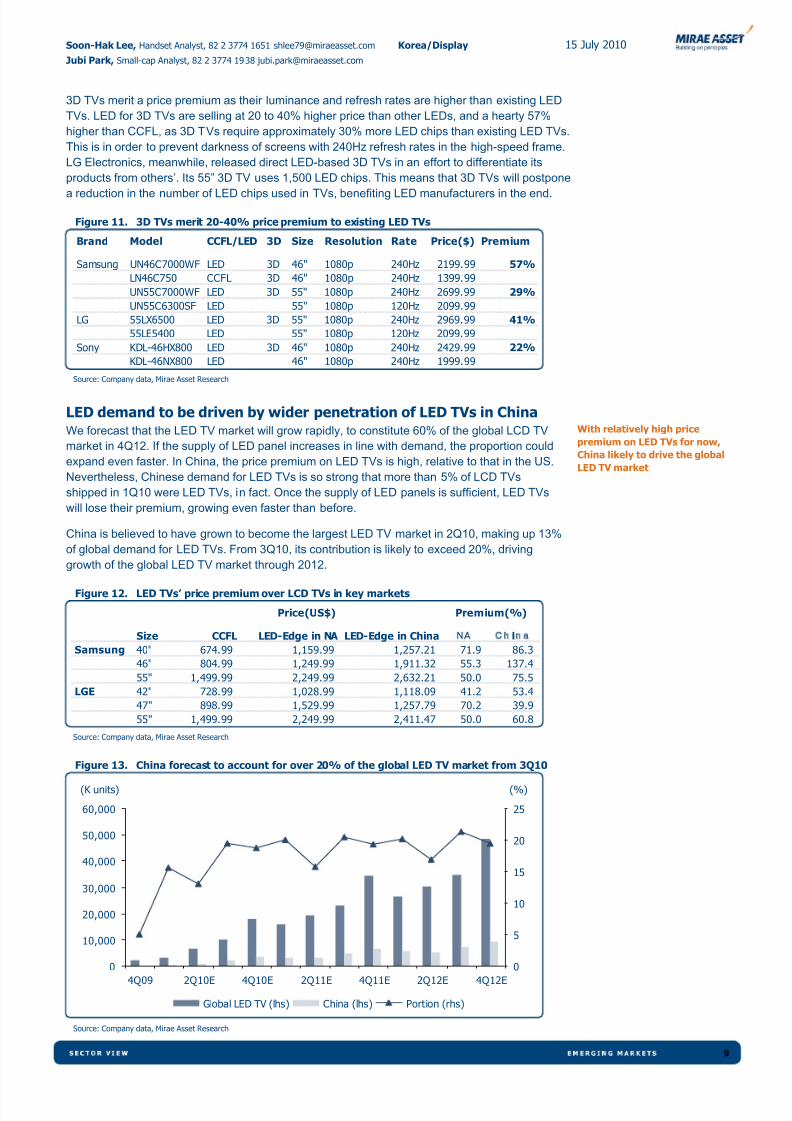
LED demand to be driven by wider penetration of LED TVs in ChinaWe forecast that the LED TV market will grow rapidly, to constitute 60% of the global LCD TV
market in 4Q12. If the supply of LED panel increases in line with demand, the proportion could
expand even faster. In China, the price premium on LED TVs is high, relative to that in the US.
Nevertheless, Chinese demand for LED TVs is so strong that more than 5% of LCD TVs
shipped in 1Q10 were LED TVs, in fact. Once the supply of LED panels is sufficient, LED TVs
will lose their premium, growing even faster than before.
China is believed to have grown to become the largest LED TV market in 2Q10, making up 13%
of global demand for LED TVs. From 3Q10, its contribution is likely to exceed 20%, driving
growth of the global LED TV market through 2012.
Figure 12. LED TVs’ price premium over LCD TVs in key markets
Size CCFL LED-Edge in NA LED-Edge in China NA Ch in a
Samsung 40" 674.99 1,159.99 1,257.21 71.9 86.3
46" 804.99 1,249.99 1,911.32 55.3 137.4
55" 1,499.99 2,249.99 2,632.21 50.0 75.5
LGE 42" 728.99 1,028.99 1,118.09 41.2 53.4
47" 898.99 1,529.99 1,257.79 70.2 39.9
55" 1,499.99 2,249.99 2,411.47 50.0 60.8
Price(US$) Premium(%)
Source: Company data, Mirae Asset Research
Figure 13. China forecast to account for over 20% of the global LED TV market from 3Q10
0
10,000
20,000
30,000
40,000
50,000
60,000
4Q09 2Q10E 4Q10E 2Q11E 4Q11E 2Q12E 4Q12E
(K units)
0
5
10
15
20
25
(%)
Global LED TV (lhs) China (lhs) Portion (rhs)
Source: Company data, Mirae Asset Research
With relatively high price
premium on LED TVs for now,
China likely to drive the global
LED TV market

8/7/2019 Sector_LED_20100715_Mirae
http://slidepdf.com/reader/full/sectorled20100715mirae 10/20
Hedge fund investors Long-only investors
Lumens is underappreciated compared
with other LED shares like SEMCO and
Seoul Semiconductors
The front LED industry is expected to
enjoy robust growth in the long term.
Lumens will continue to grow in theLED TV and lighting categories
10
Earnings review
See the last page of this report for important disclosures
K o r e a / T e c h H a r d w a r e & E q u i p m e n t
Lumens ׀ 038060 KS
Economies of scale achievedwith China plantWe maintain our Buy rating and target price of W18,000 on
Lumens. The reasons for our positive view are threefold: (1)
the company widened operating margin in 2Q10, despite
sales slightly below estimates due to sluggish European
markets and delayed operation of its Chinese plant; (2) we
expect Lumens to improve profitability through economies of scale achieved after it expanded production capacity for LED
packages to 170m units per month, ahead of peak season;
and (3) the fall in LED package prices will be limited due to
the shortage of LED raw materials. We are encouraged that
Topaz, in which Lumens has a 44.3% stake, is expected to
benefit from insufficient supply of ultra-bright-light guide
plates (LGP), a key component of LED TVs. Our target price
implies 16.5x FY11E EPS, which is undemanding, given
three-year EPS CAGR of 108%.
» Flagging sales but improved operating margin
» Expectations of 2H peak season
» Profit growth through economies of scale
Flagging sales but improved operating margin
For 2Q10, we expect Lumens to post sales of W67.7bn, 10% below our
estimate of W75.2bn, as (1) set makers adjusted inventories due to the
European economic slowdown; and (2) operation of the company’s plant
in Kun Shan, China was delayed for two months. However, operating
margin is estimated at 9.3%, ahead of our estimate, and operating profit
is estimated at W6.3bn, 6.7% shy of our initial projection of W6.8bn. We
maintain our target price, expecting the company to yield an operating
margin of 11%, owing to economies of scale achieved once its Chinese
plant comes on-stream.
Fiscal year ending Dec-09A Dec-10E Dec-11E Dec-12E
Revenue (KRWb) 133.0 311.4 456.9 551.3
Op EBIT (KRWb) 5.72 32.33 52.27 65.81
Net income (KRWb) 5.20 27.47 43.16 54.57
Norm profit (KRWb) 5.20 27.47 43.16 54.57
EPS (KRW) 153 692 1,087 1,374
EPS growth NA 351.0% 57.1% 26.4%
Norm P/E (x) 82.17 18.22 11.59 9.17
EV/EBITDA (x) 29.70 12.20 8.03 6.07
Dividend yield 0.00% 0.00% 0.79% 1.19%
P/B (x) 4.88 4.34 3.24 2.46
ROE 9.4% 27.1% 32.0% 30.5%
Net debt/equity 36.6% 21.7% 4.5% (17.8%)
Cons EPS (KRW) 153 714 1,017 1,374
Prev EPS (KRW) 135 752 991 1,287
Target price W18,000
Current price (13 July 2010) W12,600
Upside/downside 42.9%
Consensus target price W17,000
Difference from consensus 5.9%
Forecast earnings & valuation
BUY 16 July 2010
Market cap (Wbn/US$mn) 500.5/409.0
Shares outstanding 39.72mn
Free float 68.8%
52-week price high/low W4,110 –15,900
Daily average turnover (3M) US$28.30mn
Performance 1M 3M 12M
Absolute 10.5% 18.9% 195
Relative to KOSPI 7.0% 17.5% 173.7%
Absolute (US$) 11.6% 8.9% 207.2%Major shareholders
Kyung-Jae Lee 11.5%
Hanmi Semiconductor Inc. 7.6%
2,900
4,900
6,900
8,900
10,900
12,900
14,900
16,900
Jul-09 Sep-09 Nov-09 Jan-10 Mar-10 May-10 Jul-10
66
116
166
216
266
316
366
416Price Close Relati ve to .KS11 (RHS)
Performance
Trading data
Source for data: Company, Bloomberg, Mirae Asset Research
Earnings quality score
Earnings Quality Score
Historical Earnings Stability
Consensus Forecast Certainty
Consensus Forecast Accuracy
38
50
48
50
0 25 50 75 100
Sector Average: 55
BUY 11 May 2010
BUY 12 Apr 2010
Soon-Hak Lee, Korea Handset Analyst, 82 2 3774 1651 [email protected]

8/7/2019 Sector_LED_20100715_Mirae
http://slidepdf.com/reader/full/sectorled20100715mirae 11/20
Soon-Hak Lee, Korea Handset Analyst, 82 2 3774 1651 [email protected] Lumens 16 July 2010
038060 KS
11
Expectations of 2H peak season
We estimate sales of LED TVs at 10mn units globally in 1H10 versus a full-year sales estimate
of 37m units. We believe set makers will begin to build up their parts inventories ahead of
seasonally strong 2H10, in which China’s National Day and Black Friday fall, allowing LED
markers to continue to enjoy booming sales. Assuming that sales of at least 20m LED TVs are
possible, and given that the company has more than 20% of market share within Samsung
Electronics, we forecast the company will enjoy sales of nearly W100bn each quarter.
Profit growth through economies of scale
As it has completed capacity expansion at its Chinese plant, the company is now able to supply
170m LED packages a month, which is enough to manufacture 1.7m LED TVs per quarter.
Capacity expansion will reduce the company’s fixed costs and help it improve operating margin.
The company’s mass production strengthens its chip purchasing power, and its strategic
business tie-up with Taiwan-based LED chip makers helps it to maintain stable chip supplies,
limiting a rise in chip prices. 3Q10 sales and operating profit are projected to be a record
W98.9bn and W11.4bn, respectively.
Figure 14. 2Q10 earnings forecast revisions
Before Revision After Revision
(W bn, %) 2Q10E 2Q10E Diff. (%, %p) 1Q10 QoQ (%,%p) 2Q09 YoY (%, %p)
Revenue 75.2 67.7 -10.0% 50.5 34.1% 23.2 192.4%
OP 6.8 6.3 -6.7% 4.1 54.7% 0.2 2965.2%
Pre-tax profit 6.3 6 -9.2% 3.4 67.0% 0.1 4326.5%
NP 5.8 5 -9.2% 2.7 92.2% 0.5 870.2%
Operating Margin 9.0% 9.3% 0.3 8.1% 1.2 0.9% 8.5
Net Margin 7.7% 7.8% 0.1 5.4% 2.4 2.4% 5.5 Source: Company data, Mirae Asset Research
Figure 15. Revision of annual earnings forecasts
(W bn, %) 2010E 2011E 2010E 2011E 2010E 2011E
Revenue 340.2 442.4 311.4 456.9 -8.5% 3.3%
OP 35.1 49.8 32.3 52.5 -7.8% 5.4%
Pre-tax profit 33.4 48.7 30.3 50.8 -9.1% 4.3%
NP 30.3 41.4 27.5 43.2 -9.2% 4.3%
EPS (KRW) 762.1 1,041.8 691.6 1,086.7 -9.2% 4.3%
Operating Margin 10.3% 11.2% 10.4% 11.5% 0.1 0.2
Net Margin 8.9% 9.4% 8.8% 9.4% (0.1) 0.1
Before Revision After Revision Difference (%, %p)
Source: Company data, Mirae Asset Research

8/7/2019 Sector_LED_20100715_Mirae
http://slidepdf.com/reader/full/sectorled20100715mirae 12/20
Soon-Hak Lee, Korea Handset Analyst, 82 2 3774 1651 [email protected] Lumens 16 July 2010
038060 KS
12
Summary financial statements
Profit & Loss
(KRWb) Dec-08A Dec-09A Dec-10E Dec-11E Dec-12E
Revenue 75 133 311 457 551 Cost of goods sold (62) (113) (255) (373) (451)
Gross profit 13 20 57 84 101
SG and A (10) (14) (24) (31) (35)
Op profit 3 6 32 52 66
Op EBITDA 8 15 43 63 77
Depreciation (3) (7) (10) (10) (10)
Amortisation (2) (2) (1) (1) (1)
Op EBIT 3 6 32 52 66
Net interest (1) (2) (2) (2) (1)
Associates and JCEs - - 0 2 2
Other income (5) 1 (0) (2) (2)
Net exceptional income - - - - -
Profit before tax (3) 4 30 51 64
Tax 1 1 (3) (8) (10) Post-tax profit (2) 5 27 43 55
Minorities - - - - -
Preferred dividends
Net income (2) 5 27 43 55
Norm profit (2) 5 27 43 55
Dividends - - - (4) (6)
Retained earnings (2) 5 27 39 49
Source: Company data, Mirae Asset Research estimates
Cashflow
(KRWb) Dec-08A Dec-09A Dec-10E Dec-11E Dec-12E
Op EBITDA 8 15 43 63 77
Decrease in working capital (13) (24) (20) (16) (3) Other operating cashflow (1) 1 4 (6) (6)
Operating cashflow (6) (8) 27 40 68
Tax paid 1 1 (3) (8) (10)
Net interest (1) (2) (2) (2) (1)
Dividends received - - 0 2 2
Cashflow (6) (9) 22 33 59
Capital expenditure (8) (45) (15) (12) (12)
Net acquisitions - - - - -
Net investments (4) (1) (5) (3) (2)
Other investing cashflow 8 (17) 2 3 2
Investing cashflow (4) (63) (19) (13) (11)
Dividends paid - - - (4) (6)
Increase in equity 7 60 0 - (0)
Increase in debt 26 20 3 - -
Other financing cashflow (26) (2) 3 2 1 Financing cash flow 7 79 7 (2) (5)
Beginning cash 13 9 16 26 44
Total cash generated (4) 6 10 18 43
Forex effects
Ending cash 9 16 26 44 87
Source: Company data, Mirae Asset Research estimates

8/7/2019 Sector_LED_20100715_Mirae
http://slidepdf.com/reader/full/sectorled20100715mirae 13/20
Soon-Hak Lee, Korea Handset Analyst, 82 2 3774 1651 [email protected] Lumens 16 July 2010
038060 KS
13
Balance Sheet
(KRWb) Dec-08A Dec-09A Dec-10E Dec-11E Dec-12E
Current assets 33 99 173 220 278
Cash and equivalents 9 16 26 44 87
Receivables 10 37 75 87 97
Inventories 11 34 52 67 71
Other current assets 4 12 21 22 23 Non current assets 28 83 84 89 92
Net operating fixed assets 13 51 46 46 47
Interest in associates
Other non-current ssets 15 32 38 43 45
Total assets 62 182 257 309 370
Current liabilities 27 64 104 116 128
Payables 8 38 83 95 106
ST debt 16 17 14 14 14
Other current liabilities 3 8 7 7 8
Total non-current liabilities 12 31 39 39 39
LT debt 11 30 38 38 38
Other non-current liabilities 1 0 1 1 1
Total liabilities 39 94 142 154 166
Issued capital 15 20 20 20 20
Share premium reserve 22 65 65 65 65 Reserves/Adjustments (19) (7) 1 1 1
Retained earnings 5 10 29 69 117
Minorities - - - - -
Other equity - - - - -
Shareholders' equity 23 88 115 155 203
Source: Company data, Mirae Asset Research estimates
Key Ratios
Dec-08A Dec-09A Dec-10E Dec-11E Dec-12E
Turnover growth 507.3% 77.4% 134.1% 46.7% 20.7%
Gross profit growth 187.5% 50.6% 187.3% 47.8% 20.6%
Operating profit growth 8.4% 86.6% 465.1% 61.7% 25.9%
EBITDA growth (9.6%) 381.7% 178.4% 46.7% 21.0%EPS growth (120.3%) NA 351.0% 57.1% 26.4%
Norm BPS growth (61.1%) 222.7% 12.5% 34.0% 31.4%
Gross margin 17.4% 14.8% 18.1% 18.3% 18.3%
Operating margin 4.1% 4.3% 10.4% 11.4% 11.9%
EBITDA margin 4.3% 11.6% 13.8% 13.8% 13.9%
EBIT margin (2.3%) 4.7% 10.4% 11.5% 11.9%
Net income margin (2.47%) 3.91% 8.82% 9.45% 9.90%
ROE (9.3%) 9.4% 27.1% 32.0% 30.5%
ROA (4.4%) 4.3% 12.5% 15.2% 16.1%
Net debt/equity 80.2% 36.6% 21.7% 4.5% (17.8%)
Interest cover ratio 2.55 2.56 11.05 18.10 22.78
Dividend payout ratio 0.0% 0.0% 0.0% 9.2% 10.9%
Inventory days 62.3 108.7 74.0 65.2 57.5
Account receivable days 47.0 101.8 87.7 69.8 64.4
Account payable days 47.8 123.0 118.8 92.5 86.3Reported EPS (KRW) -66 153 692 1,087 1,374
EPS (KRW) -66 153 692 1,087 1,374
Reported BPS (KRW) 800 2,582 2,905 3,892 5,116
Norm BPS (KRW) 800 2,582 2,905 3,892 5,116
DPS (KRW) 0.0 0.0 0.0 100.0 150.0
Cashflow per share (KRW) -230 -271 561 826 1,492
Reported P/E (x) NA 82.17 18.22 11.59 9.17
Norm P/E (x) NA 82.17 18.22 11.59 9.17
P/B (x) 15.75 4.88 4.34 3.24 2.46
P/CF NA NA 22.46 15.25 8.45
EV/EBITDA (x) 116.1 29.7 12.2 8.0 6.1
EV/Operating Cashflow (x) NA NA 19.48 12.65 6.80
EV/Sales (x) 4.97 3.45 1.69 1.11 0.84
Dividend yield 0.00% 0.00% 0.00% 0.79% 1.19%
Source: Company data, Mirae Asset Research estimates

8/7/2019 Sector_LED_20100715_Mirae
http://slidepdf.com/reader/full/sectorled20100715mirae 14/20
Hedge fund investors Long-only investors
Watch for growing sales visibility backed
by the rapidly growing LED proportion
of total BLU output
We see positive implications for its
transformation to an LED company
once it successfully enters its sapphire
ingot and solar cell businesses
14
Earnings review
See the last page of this report for important disclosures
K o r e a / T e c h H a r d w a r e & E q u i p m e n t
Hansol LCD ׀ 004710.KS
Positive evolution continuesWe maintain our Buy rating and target price of W80,000 on
Hansol LCD based on three principle investment points: (1)
the rapidly increasing proportion of LEDs used in total
backlight unit (BLU) output, leading to (2) growing sales
visibility; and (3) Hansol’s prospects for successful entry into
new businesses, including LED sapphire ingots and solar cell
modules. We see our target P/E of 14x 12-month forward
EPS of W5,570 undemanding given the likelihood Hansol will
successfully enter new business lines and the company’s
overall business stability supported by steady LED BLU sales
(comprising 64% of total sales).
» 2Q10 sales and operating profit to rise 35.1% YoY, 99.6% YoY
» Higher portion of LED BLU sales will lead to greaterincrease business reliability
» Entry into new businesses is positive
» Buy rating and target price of W80,000 m aintained
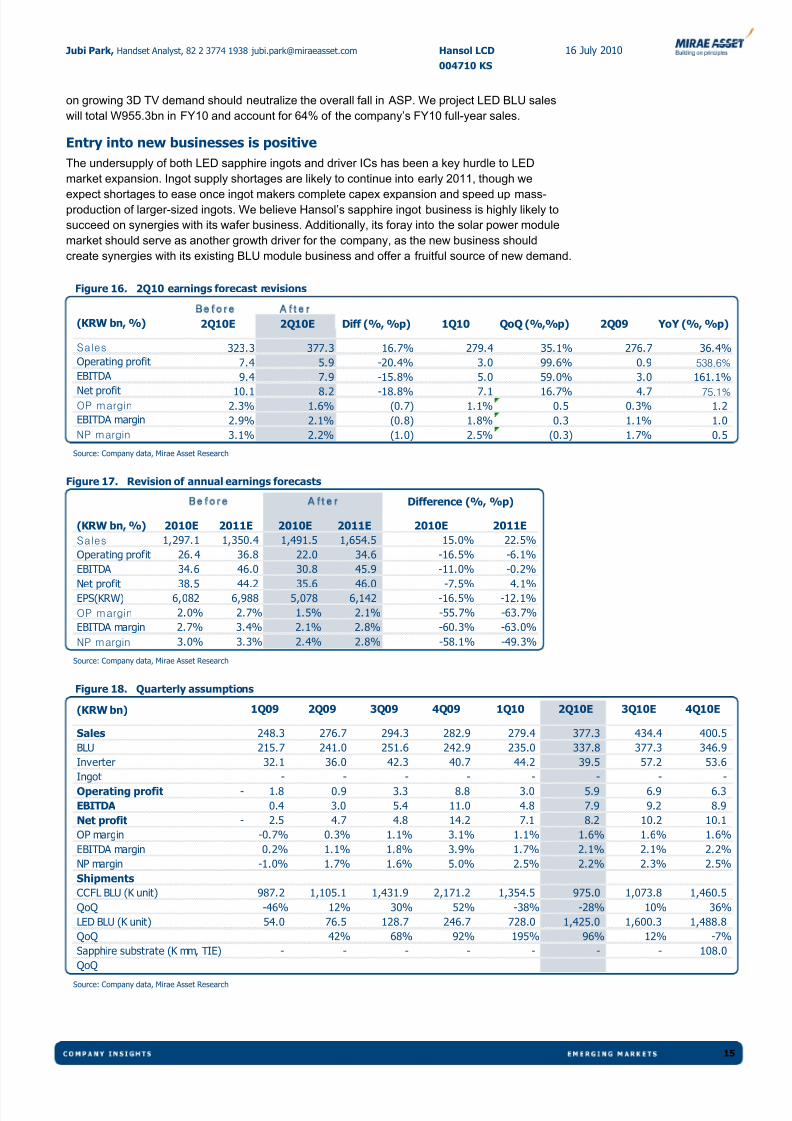
2Q10 sales and operating profit to rise 35.1% QoQ,99.6% QoQWe expect Hansol LCD to report a 35.1% QoQ rise in sales (W377.3bn)
and 99.6% QoQ jump in operating profit (W5.9bn) for 2Q10. Such
upbeat 2Q10 earnings, should they be realized, would be due mainly a
surge in LED BLU portion in total BLU shipments from 35% in 1Q10 to
59.4% in 2Q10. We raised our FY10 full-year sales estimate for the
company by 15%, to roughly W1.5tr, as LED BLU is forecast to
represent over 50% of Hansol’s total BLU output in FY10. Meanwhile,
we lowered our FY10 operating profit forecast for Hansol to W22bn, toreflect cost hikes on the increased sales proportion of LED BLU.
Higher sales portion of LED BLU w ill increasebusiness reliability
We anticipate the company’s LED BLU shipments to rise steadily in
2H10 as global LED TV shipments are forecast to be 27m units, 2.7
times larger than the figure recorded in 1H10. Rising ASP of LED BLU
Fis ca l y ea r e nd in g De c- 09A De c-1 0E De c-1 1E De c-1 2E
Revenue (KRWb) 1,102 1,492 1,655 1,925
Op EBIT (KRWb) 11.24 22.02 34.60 41.78
Net income (KRWb) 21.16 35.59 46.03 53.38
Norm profit (KRWb) 21.16 35.59 46.03 53.38
EPS (KRW) 3,233 5,078 6,142 7,122
EPS growth 234.7% 57.1% 21.0% 16.0%
Norm P/E (x) 17.94 11.42 9.44 8.14EV/EBITDA (x) 11.87 8.00 6.03 5.12
Dividend yield 0.396% 0.000% 0.413% 0. 413%
P/B (x) 3.01 2.03 1.78 1.47
ROE 18.0% 21.8% 20.7% 19.7%
Net debt/equity 0. 3% (7.2%) (15.8%) (17.5%)
Cons EPS (KRW) 3,233 5,405 6,368 7,122
Prev EPS (KRW) 3,344 6,082 6,988 7,421
Jubi Park, Handset Analyst, +82 2 3774 1938 [email protected]
Forecast earnings & valuation
B U Y 16 July 2010 BU Y
19 May 2010
Market cap (Wbn/US$mn) 347.3/286.0
Shares outstanding 6.33mn
Free float 78.5%
52-week price high/low W19,474 –61,966
Daily average turnover (3M) US$10.10mn
Performance 1M 3M 12M
Absolute 3.2% 43.4% 162
Relative to -0.4% 42.0% 136.3%
Absolute (US$) 6.0% 32.9% 183.4%
Major shareholders
Hansol Paper 12.7%
Samsung Investment 6.5%
15,00020,000
25,000
30,000
35,000
40,000
45,000
50,000
55,000
60,000
65,000
Jul-09 Sep-09 Nov-09 Jan-10 Mar-10 May-10 Ju l-10
53
78
103
128
153
178
203
228
253
278
303Price Close Re lative to .KS11 (RHS)
Performance
Trading data
Source for data: Company, Bloomberg, Mirae Asset Research
Earnings qual i ty score
Earnings Quality Score
Historical Earnings Stability
Consensus Forecast Certainty
Consensus Forecast Accuracy
23
50
43
30
0 25 50 75 100
Sector Average: 55
Target price W80,000
Current pr ice (13 July 2010) W57,800
Upside/downside 38.4%
Consensus target price W72,500
Difference from consensus 10.3%
8/7/2019 Sector_LED_20100715_Mirae
http://slidepdf.com/reader/full/sectorled20100715mirae 15/20
Jubi Park, Handset Analyst, 82 2 3774 1938 [email protected] Hansol LCD 16 July 2010
004710 KS
15
on growing 3D TV demand should neutralize the overall fall in ASP. We project LED BLU sales
will total W955.3bn in FY10 and account for 64% of the company’s FY10 full-year sales.
Entry into new businesses is positive
The undersupply of both LED sapphire ingots and driver ICs has been a key hurdle to LED
market expansion. Ingot supply shortages are likely to continue into early 2011, though we
expect shortages to ease once ingot makers complete capex expansion and speed up mass-production of larger-sized ingots. We believe Hansol’s sapphire ingot business is highly likely to
succeed on synergies with its wafer business. Additionally, its foray into the solar power module
market should serve as another growth driver for the company, as the new business should
create synergies with its existing BLU module business and offer a fruitful source of new demand.
Figure 16. 2Q10 earnings forecast revisions
Be fore A fte r
(KRW bn, %) 2Q10E 2Q10E Diff (%, %p) 1Q10 QoQ (%,%p) 2Q09 YoY (%, %p)
Sales 323.3 377.3 16.7% 279.4 35.1% 276.7 36.4%
Operating profit 7.4 5.9 -20.4% 3.0 99.6% 0.9 538.6%
EBITDA 9.4 7.9 -15.8% 5.0 59.0% 3.0 161.1%
Net profit 10.1 8.2 -18.8% 7.1 16.7% 4.7 75.1%
OP margin 2.3% 1.6% (0.7) 1.1% 0.5 0.3% 1.2
EBITDA margin 2.9% 2.1% (0.8) 1.8% 0.3 1.1% 1.0
NP margin 3.1% 2.2% (1.0) 2.5% (0.3) 1.7% 0.5
Source: Company data, Mirae Asset Research
Figure 17. Revision of annual earnings forecasts
(KRW bn, %) 2010E 2011E 2010E 2011E 2010E 2011E
Sales 1,297.1 1,350.4 1,491.5 1,654.5 15.0% 22.5%
Operating profit 26. 4 36.8 22.0 34.6 -16.5% -6.1%
EBITDA 34.6 46.0 30.8 45.9 -11.0% -0.2%Net profit 38.5 44.2 35.6 46.0 -7.5% 4.1%
EPS(KRW) 6,082 6,988 5,078 6,142 -16.5% -12.1%
OP margin 2.0% 2.7% 1.5% 2.1% -55.7% -63.7%
EBITDA margin 2.7% 3.4% 2.1% 2.8% -60.3% -63.0%
NP margin 3.0% 3.3% 2.4% 2.8% -58.1% -49.3%
Be fore A fte r Difference (%, %p)
Source: Company data, Mirae Asset Research
Figure 18. Quarterly assumptions
(KRW bn) 1Q09 2Q09 3Q09 4Q09 1Q10 2Q10E 3Q10E 4Q10E
Sales 248.3 276.7 294.3 282.9 279.4 377.3 434.4 400.5
BLU 215.7 241.0 251.6 242.9 235.0 337.8 377.3 346.9
Inverter 32.1 36.0 42.3 40.7 44.2 39.5 57.2 53.6 Ingot - - - - - - - -
Operating profit 1.8- 0.9 3.3 8.8 3.0 5.9 6.9 6.3
EBITDA 0.4 3.0 5.4 11.0 4.8 7.9 9.2 8.9
Net profit 2.5- 4.7 4.8 14.2 7.1 8.2 10.2 10.1
OP margin -0.7% 0.3% 1.1% 3.1% 1.1% 1.6% 1.6% 1.6%
EBITDA margin 0.2% 1.1% 1.8% 3.9% 1.7% 2.1% 2.1% 2.2%
NP margin -1.0% 1.7% 1.6% 5.0% 2.5% 2.2% 2.3% 2.5%
Shipments
CCFL BLU (K unit) 987.2 1,105.1 1,431.9 2,171.2 1,354.5 975.0 1,073.8 1,460.5
QoQ -46% 12% 30% 52% -38% -28% 10% 36%
LED BLU (K unit) 54.0 76.5 128.7 246.7 728.0 1,425.0 1,600.3 1,488.8
QoQ 42% 68% 92% 195% 96% 12% -7%
Sapphire substrate (K mm, TIE) - - - - - - - 108.0
QoQ
Source: Company data, Mirae Asset Research

8/7/2019 Sector_LED_20100715_Mirae
http://slidepdf.com/reader/full/sectorled20100715mirae 16/20
Jubi Park, Handset Analyst, 82 2 3774 1938 [email protected] Hansol LCD 16 July 2010
004710 KS
16
Summary financial statements
Profit & Loss
(KRWb) Dec-08A Dec-09A Dec-10E Dec-11E Dec-12E
Revenue 1,096 1,102 1,492 1,655 1,925 Cost of goods sold (1,029) (1,052) (1,420) (1,571) (1,827)
Gross profit 67 50 71 84 98
SG and A (47) (39) (49) (49) (56)
Op profit 19 11 22 35 42
Op EBITDA 30 20 31 46 54
Depreciation (11) (9) (9) (11) (12)
Amortisation - - - - -
Op EBIT 19 11 22 35 42
Net interest (1) (0) (0) (0) (0)
Associates and JCEs 1 18 16 16 15
Other income (10) (5) 2 4 6
Net exceptional income - - - - -
Profit before tax 10 23 40 54 63
Tax (3) (2) (4) (8) (9) Post-tax profit 6 21 36 46 53
Minorities - - - - -
Preferred dividends
Net income 6 21 36 46 53
Norm profit 6 21 36 46 53
Dividends (2) (2) - (2) (2)
Retained earnings 5 20 36 44 52
Source: Company data, Mirae Asset Research estimates
Cashflow
(KRWb) Dec-08A Dec-09A Dec-10E Dec-11E Dec-12E
Op EBITDA 30 20 31 46 54
Decrease in working capital 19 (5) (14) 5 (31) Other operating cashflow 0 (11) (18) (15) (8)
Operating cashflow 50 3 (2) 36 15
Tax paid (3) (2) (4) (8) (9)
Net interest (1) (0) (0) (0) (0)
Dividends received 1 18 16 16 15
Cashflow 47 19 9 44 20
Capital expenditure (4) (3) (36) (27) (9)
Net acquisitions - - - - -
Net investments (18) 5 (8) 5 3
Other investing cashflow (0) (0) 5 4 1
Investing cashflow (22) 2 (39) (19) (5)
Dividends paid 2 2 - 2 2
Increase in equity - - 5 - -
Increase in debt (15) (6) 2 - -
Other financing cashflow 2 (13) 41 (2) (3) Financing cash flow (11) (17) 47 (0) (1)
Beginning cash 0 13 17 33 57
Total cash generated 13 4 16 24 13
Forex effects
Ending cash 13 17 33 57 70
Source: Company data, Mirae Asset Research estimates

8/7/2019 Sector_LED_20100715_Mirae
http://slidepdf.com/reader/full/sectorled20100715mirae 17/20
Jubi Park, Handset Analyst, 82 2 3774 1938 [email protected] Hansol LCD 16 July 2010
004710 KS
17
Balance Sheet
(KRWb) Dec-08A Dec-09A Dec-10E Dec-11E Dec-12E
Current assets 72 84 168 193 246
Cash and equivalents 13 17 33 57 70
Receivables 35 37 89 86 115
Inventories 16 21 36 39 49
Other current assets 8 9 11 11 12 Non current assets 142 147 194 220 229
Net operating fixed assets 108 95 122 139 136
Interest in associates
Other non-current ssets 34 52 71 81 93
Total assets 215 231 362 413 475
Current liabilities 93 91 146 151 161
Payables 46 64 120 125 134
ST debt 21 16 18 18 18
Other current liabilities 26 11 8 9 9
Total non-current liabilities 13 14 15 17 18
LT debt 2 1 1 1 1
Other non-current liabilities 11 14 15 16 17
Total liabilities 106 106 161 168 179
Issued capital 32 32 36 36 36
Share premium reserve 15 15 51 51 51 Reserves/Adjustments (0) (3) (3) (3) (3)
Retained earnings 62 82 116 160 212
Minorities - - - - -
Other equity - - - - -
Shareholders' equity 109 126 201 245 296
Source: Company data, Mirae Asset Research estimates
Key Ratios
Dec-08A Dec-09A Dec-10E Dec-11E Dec-12E
Turnover growth 47.2% 0.6% 35.3% 10.9% 16.3%
Gross profit growth 75.7% (24.2%) 41.4% 17.7% 16.3%
Operating profit growth 90.3% (41.2%) 95.9% 57.1% 20.8%
EBITDA growth (10.7%) 47.0% 53.0% 34.0% 13.9%EPS growth (33.9%) 234.7% 57.1% 21.0% 16.0%
Norm BPS growth 1.0% 15.9% 48.7% 14.2% 21.1%
Gross margin 6.07% 4.57% 4.78% 5.07% 5.07%
Operating margin 1.74% 1.02% 1.48% 2.09% 2.17%
EBITDA margin 1.99% 2.91% 3.28% 3.97% 3.89%
EBIT margin 0.98% 2.12% 2.70% 3.28% 3.27%
Net income margin 0.58% 1.92% 2.39% 2.78% 2.77%
ROE 5.8% 18.0% 21.8% 20.7% 19.7%
ROA 2.9% 9.5% 12.0% 11.9% 12.0%
Net debt/equity 9.0% 0.3% (7.2%) (15.8%) (17.5%)
Interest cover ratio 9.05 11.44 30.62 50.91 61.48
Dividend payout ratio 25.0% 7.1% 0.0% 3.9% 3.4%
Inventory days 5.61 7.37 9.16 9.01 9.84
Account receivable days 11.74 12.30 21.70 18.92 21.89
Account payable days 16.28 22.14 30.74 29.06 26.90Reported EPS (KRW) 966 3,233 5,078 6,142 7,122
EPS (KRW) 966 3,233 5,078 6,142 7,122
Reported BPS (KRW) 16,605 19,241 28,614 32,664 39,547
Norm BPS (KRW) 16,605 19,241 28,614 32,664 39,547
DPS (KRW) 241.7 229.5 0.0 239.3 239.3
Cashflow per share (KRW) 7,106 2,878 1,285 5,842 2,655
Reported P/E (x) 60.05 17.94 11.42 9.44 8.14
Norm P/E (x) 60.05 17.94 11.42 9.44 8.14
P/B (x) 3.49 3.01 2.03 1.78 1.47
P/CF 8.16 20.16 45.14 9.93 21.85
EV/EBITDA (x) 17.88 11.87 8.00 6.03 5.12
EV/Operating Cashflow (x) 7.8 109.7 NA 11.0 26.1
EV/Sales (x) 0.355 0.345 0.263 0.239 0.199
Dividend yield 0.417% 0.396% 0.000% 0.413% 0.413%
Source: Company data, Mirae A sset Research estimates

8/7/2019 Sector_LED_20100715_Mirae
http://slidepdf.com/reader/full/sectorled20100715mirae 18/20
Soon-Hak Lee, Handset Analyst, 82 2 3774 1651 [email protected] Korea/Display 15 July 2010
Jubi Park, Small-cap Analyst, 82 2 3774 1938 [email protected]
18
Analyst team profile
Soon Hak LeeH A N D S E T A N A L Y S T
After graduating from Hanyang University with BA in Electronic & Electrical Engineering,
Soonhak worked at Samsung Electronics in handset technology planning for 5 years. He joined
Mirae Asset Securities as handset analyst in January 2010. Soonhak is currently covering
Korean handset industry and component sectors.
Jubi ParkS M A L L - C A P A N A L Y S T
After earning an MBA degree at Seoul National University, Jubi joined Mirae Asset in Korea in2009 to assist the technology research. Jubi is also a graduate of The University of California,
Los Angeles, majoring in business economics and has previously worked with the audit
department of BDO Daejoo Accounting Corporation as an AICPA for two years.
+82 2-3774-1651/ 10-3090-6846
+822-3774-8940/ 10-7185-8940
8/7/2019 Sector_LED_20100715_Mirae
http://slidepdf.com/reader/full/sectorled20100715mirae 19/20
Soon-Hak Lee, Handset Analyst, 82 2 3774 1651 [email protected] Korea/Display 15 July 2010
Jubi Park, Small-cap Analyst, 82 2 3774 1938 [email protected]
19
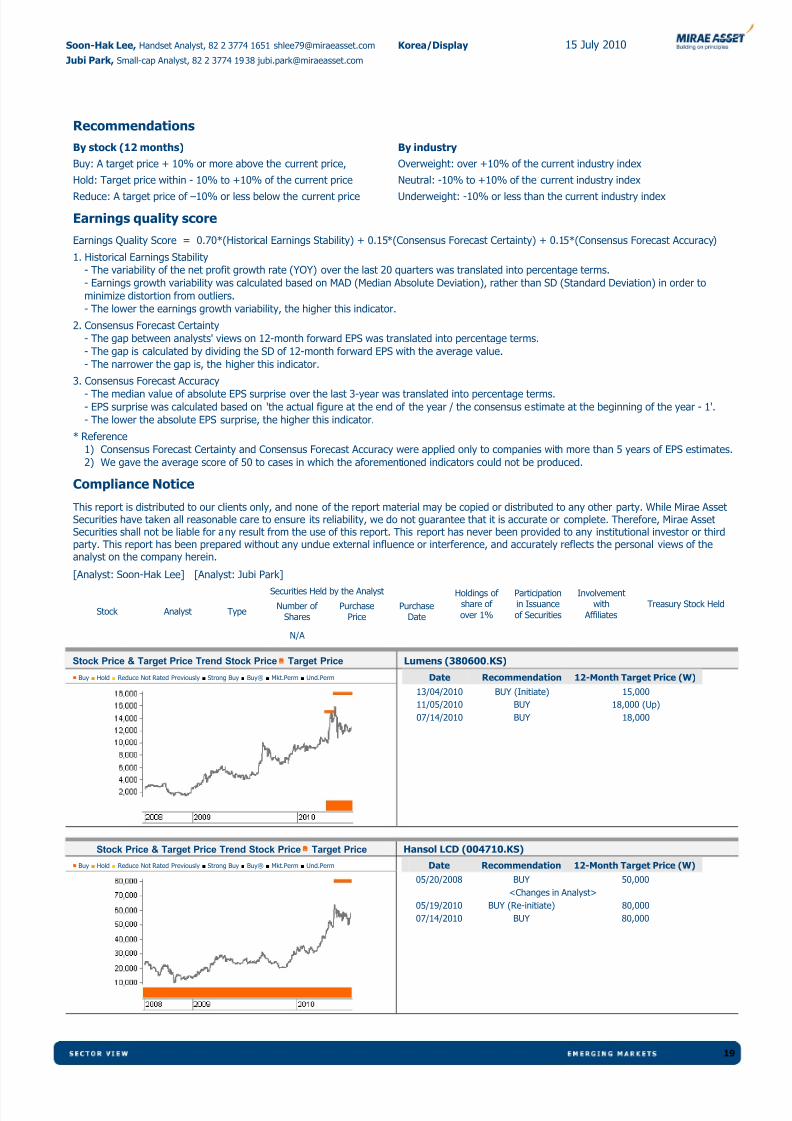
Recommendations
By stock (12 months)
Buy: A target price + 10% or more above the current price,
Hold: Target price within - 10% to +10% of the current price
Reduce: A target price of –10% or less below the current price
By industry
Overweight: over +10% of the current industry index
Neutral: -10% to +10% of the current industry index
Underweight: -10% or less than the current industry index
Earnings quality score
Earnings Quality Score = 0.70*(Historical Earnings Stability) + 0.15*(Consensus Forecast Certainty) + 0.15*(Consensus Forecast Accuracy)
1. Historical Earnings Stability
- The variability of the net profit growth rate (YOY) over the last 20 quarters was translated into percentage terms.
- Earnings growth variability was calculated based on MAD (Median Absolute Deviation), rather than SD (Standard Deviation) in order to
minimize distortion from outliers.
- The lower the earnings growth variability, the higher this indicator.
2. Consensus Forecast Certainty
- The gap between analysts' views on 12-month forward EPS was translated into percentage terms.
- The gap is calculated by dividing the SD of 12-month forward EPS with the average value.
- The narrower the gap is, the higher this indicator.
3. Consensus Forecast Accuracy- The median value of absolute EPS surprise over the last 3-year was translated into percentage terms.
- EPS surprise was calculated based on 'the actual figure at the end of the year / the consensus estimate at the beginning of the year - 1'.
- The lower the absolute EPS surprise, the higher this indicator.
* Reference
1) Consensus Forecast Certainty and Consensus Forecast Accuracy were applied only to companies with more than 5 years of EPS estimates.
2) We gave the average score of 50 to cases in which the aforementioned indicators could not be produced.
Compliance Notice
This report is distributed to our clients only, and none of the report material may be copied or distributed to any other party. While Mirae AssetSecurities have taken all reasonable care to ensure its reliability, we do not guarantee that it is accurate or complete. Therefore, Mirae AssetSecurities shall not be liable for any result from the use of this report. This report has never been provided to any institutional investor or thirdparty. This report has been prepared without any undue external influence or interference, and accurately reflects the personal views of theanalyst on the company herein.
[Analyst: Soon-Hak Lee] [Analyst: Jubi Park]Securities Held by the Analyst
Stock Analyst TypeNumber of
SharesPurchase
PricePurchase
Date
Holdings of share of
over 1%
Participationin Issuance
of Securities
Involvementwith
Affiliates
Treasury Stock Held
N/A
Stock Price & Target Price Trend Stock Price Target Price Lumens (380600.KS)
■ Buy ■ Hold ■ Reduce Not Rated Previously ■ Strong Buy ■ Buy® ■ Mkt.Perm ■ Und.Perm Date Recommendation 12-Month Target Price (W)
13/04/2010 BUY (Initiate) 15,000
11/05/2010 BUY 18,000 (Up)
07/14/2010 BUY 18,000
Stock Price & Target Price Trend Stock Price Target Price Hansol LCD (004710.KS)
■ Buy ■ Hold ■ Reduce Not Rated Previously ■ Strong Buy ■ Buy® ■ Mkt.Perm ■ Und.Perm Date Recommendation 12-Month Target Price (W)
05/20/2008 BUY 50,000
<Changes in Analyst>
05/19/2010 BUY (Re-initiate) 80,000
07/14/2010 BUY 80,000

8/7/2019 Sector_LED_20100715_Mirae
http://slidepdf.com/reader/full/sectorled20100715mirae 20/20
Soon-Hak Lee, Handset Analyst, 82 2 3774 1651 [email protected] Korea/Display 15 July 2010
Jubi Park, Small-cap Analyst, 82 2 3774 1938 [email protected]
Required Disclosure
The views expressed in this report accurately reflect the personal views of the analysts about the subject securities and listed corporations. Each analyst declares that neither he/she nor his/her associate serves as an officer or has any financial interests in relation to the listed corporation reviewed by the analyst. None of the listed corporations reviewed or any third party has provided or agreed to provide any compensation or other benefits in connection
with this report to any of the analysts of Mirae Asset Securities (HK) Limited (“MAHK”). MAHK confirms that it, whether individually or as a group, (i) does not own 1% or more financial interests in any of the listed corporations reviewed; or (ii) does not have any individual employed by or associated with any member companies of MAHK Group serving as an officer of any listed corporation reviewed. MAHK is not involved in making a market in the securities of the covered stocks. MAHK has no investment banking relationship with the stocks covered within the preceding 12 months.
This disclosure statement is made pursuant to paragraph 16 of the “Code of Conduct for Persons Licensed by or Registered with the Securities and Futures Commission”.
Disclaimer
This report was originally prepared and issued by MAHK for distribution to their professional, accredited and institutional investor customers. It is notdirected to, or intended for distribution to or use by, any person or entity who is a citizen or resident of or located in any locality, state, country or other
jurisdiction where such distribution, publication, availability or use would be contrary to law or regulation or which would subject MAHK and itssubsidiaries and affiliates (collectively MAHK Group) to any registration or licensing requirement within such jurisdictions. None of the material, nor itscontents, nor any copy of it, may be altered in any way, transmitted to, copied or distributed to any other party, without the prior express writtenpermission of MAHK Group. All trademarks, service marks and logos used in this report are trademarks or service marks or registered trademarks orservice marks of MAHK Group.
The information, opinion and material presented in this report are provided for general information purposes only and shall not be used or consideredas an offer or the solicitation of an offer to sell or to buy or subscribe for securities, other financial instruments or any derivative related to such
securities or instruments. MAHK Group may not have taken any steps to ensure that the securities referred to in this report are suitable for anyparticular investor. The contents of this report do not constitute investment advice to any person and such person shall not be treated as a customer of MAHK Group by virtue of receiving this report.
Information and opinions presented in this report have been obtained or derived from sources believed by MAHK Group to be reliable, but MAHK Groupmakes no representation or warranty, express or implied as to their accuracy, fairness or completeness and MAHK Group accepts no liability for anydirect or consequential loss arising from the use of the material presented in this report unless such liability arises under specific statutes or regulations.This report is not to be relied upon in substitution for the exercise of independent judgment. MAHK Group may have issued other reports that areinconsistent with, and reach different conclusions from, the information presented in this report. The reports reflect the different assumptions, viewsand analytical methods of the analysts who prepared them. For the avoidance of doubt, views expressed in this report do not necessarily representthose of MAHK Group and may not imply comparable future performance.
This report may provide the addresses of, or contain hyperlinks to, various websites. To the extent that this report refers to material outside MAHK Group’s own website, MAHK Group has not reviewed the linked sites and takes no responsibility for the content contained therein. Such address orhyperlink (including addresses or hyperlinks to MAHK Group own website material) is provided solely for your convenience and information and thecontent of the linked sites does not in any way form part of this report. Accessing such websites shall be at your own risk.
MAHK Group may, to the extent permitted by law, participate or invest in financing transactions with the issuer(s) of the securities referred to in thisreport, perform services for or solicit business from such issuers, and/or have a position or effect transactions in the securities or other financialinstruments thereon. MAHK Group may, to the extent permitted by law, act upon or use the information or opinions presented herein, or the researchor analysis on which they are based, before the material is published. MAHK Group, its officers or directors and the analysts preparing this report (eachan Analyst and collectively the Analysts) may have relationships with, financial interests in or business relationships with any or all of the companiesmentioned in this report (each a listed corporation and collectively the listed corporations)
Information, opinions and estimates are provided on an “as in” basis without warranty of any kind and may be changed at any time without priornotice. There can be no assurance that future events or results will be consistent with any such opinion. Nothing in this report constitutes investment,legal, accounting or tax advice nor a representation that any investment or strategy is suitable or appropriate to your individual circumstances. Nothing
in this report constitutes a personal recommendation to you.
This report has been prepared by the research analyst(s) licensed by the Securities and Futures Commission in Hong Kong. The research analysts arenot employees or associated persons of any corporation mentioned in this report. These research analysts are not registered as research analysts withFINRA or the NYSE, but are licensed persons in compliance with Hong Kong regulatory requirements. Those research analysts may not be associatedpersons of Mirae USA and may not be subject to FINRA Rule 2711 and NYSE Rule 472 restrictions on communications with a subject company, publicappearances and trading securities held by a research analyst account. This report has been prepared by MAHK for distribution in Hong Kong; in Koreaby its holding company named Mirae Asset Securities Co. Ltd; in Vietnam by its joint venture company named Mirae Asset Securities (Vietnam) JointStock Company; in the United Kingdom by its subsidiary named Mirae Asset Securities (UK) Ltd; in the United States by its subsidiary named Mirae
Asset Securities (USA) Inc.This information may only be issued or passed on to any person in the United Kingdom if that person is of a kind described in Article 19 of the FinancialServices and Markets Act 2000 (Financial Promotions) Order 2001 or otherwise pursuant to exemptions to section 21 of the Financial Services andMarket Act 2000. In addition, no person who is an Authorised Person may issue or pass on this information, or otherwise promote MAHK Group, to anyperson in the United Kingdom other than under the rules of the Financial Services Authority (FSA) applicable to such Authorised Persons. This reportand any information, material and contents herein are intended for general circulation only and do not take into account the specific investmentobjectives, financial situation or particular needs or any particular person.
Any U.S. recipient of this report that would like further information regarding any security discussed herein should contact Mirae Asset Securities (USA)Inc. Furthermore, any recipient of this report that would like to effect any transaction in any security discussed herein should contact and place theorders with Mirae Asset Securities (USA) Inc. which, without in any way limiting the foregoing, accepts responsibility (solely for purposes of an withinthe meaning of Rule 15a-6 under the SEC Act of 1934) for this report and its dissemination in the United States.
Investments in general and, derivatives, in particular, involve numerous risks, including, inter alia, market risk, counterparty default risk and liquidityrisk. In some cases, securities and other financial instruments may be difficult to value or sell and reliable information about the value or risks related tothe security or financial instrument may be absent. The investment(s) mentioned in this report may not be suitable for all investors and a personreceiving or reading this report should seek advice from a financial adviser regarding the suitability of such investment(s), taking into account thespecific investment objectives, financial situation or particular needs of that person, before making a commitment to purchase any of such
investment(s). The suitability of any particular investment or strategy whether opined on, or referred to in this report or otherwise will depend on aperson’s individual circumstances and objectives and should be confirmed by such person with his advisers independently before adoption orimplementation thereof.
This document may not be taken or transmitted into or distributed in Japan, Canada or the People’s Republic of China.
Copyright 2009 MAHK Group. All rights reserved.
