1
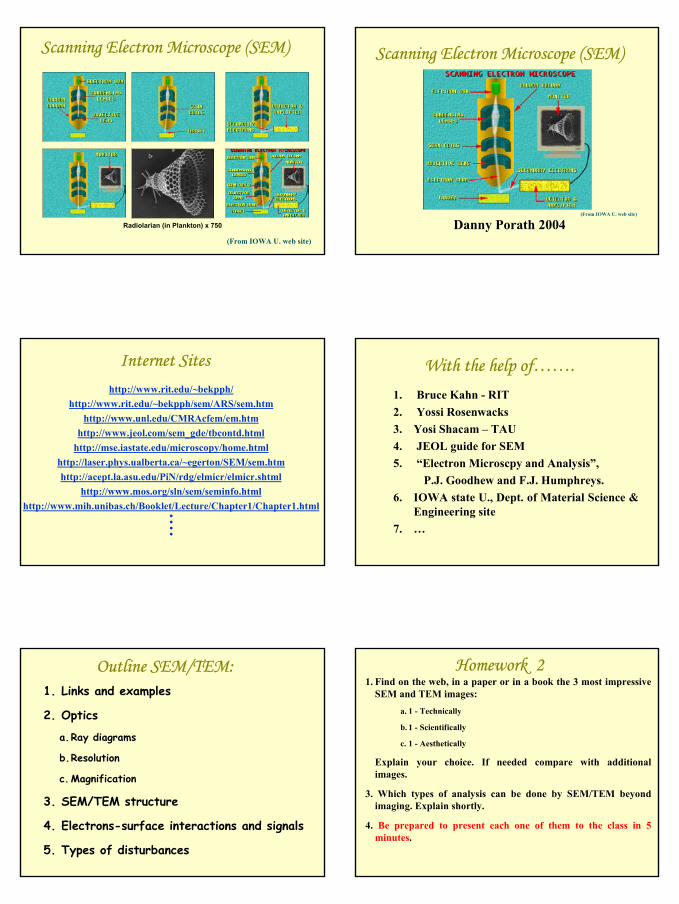
Scanning Electron Microscope (SEM)
Danny Porath 2004(From IOWA U. web site)
Scanning Electron Microscope (SEM)
Radiolarian (in Plankton) x 750
(From IOWA U. web site)
With the help of…….1. Bruce Kahn - RIT2. Yossi Rosenwacks3. Yosi Shacam – TAU4. JEOL guide for SEM5. “Electron Microscpy and Analysis”,
P.J. Goodhew and F.J. Humphreys.6. IOWA state U., Dept. of Material Science &
Engineering site 7. …
Internet Siteshttp://www.rit.edu/~bekpph/
http://www.rit.edu/~bekpph/sem/ARS/sem.htmhttp://www.unl.edu/CMRAcfem/em.htm
http://www.jeol.com/sem_gde/tbcontd.htmlhttp://mse.iastate.edu/microscopy/home.html
http://laser.phys.ualberta.ca/~egerton/SEM/sem.htmhttp://acept.la.asu.edu/PiN/rdg/elmicr/elmicr.shtml
http://www.mos.org/sln/sem/seminfo.htmlhttp://www.mih.unibas.ch/Booklet/Lecture/Chapter1/Chapter1.html....
Homework 21. Find on the web, in a paper or in a book the 3 most impressive
SEM and TEM images:a. 1 - Technically
b. 1 - Scientifically
c. 1 - Aesthetically
Explain your choice. If needed compare with additional images.
3. Which types of analysis can be done by SEM/TEM beyond imaging. Explain shortly.
4. Be prepared to present each one of them to the class in 5 minutes.
Outline SEM/TEM:1. Links and examples
2. Optics
a.Ray diagrams
b.Resolution
c.Magnification
3. SEM/TEM structure
4. Electrons-surface interactions and signals
5. Types of disturbances
2
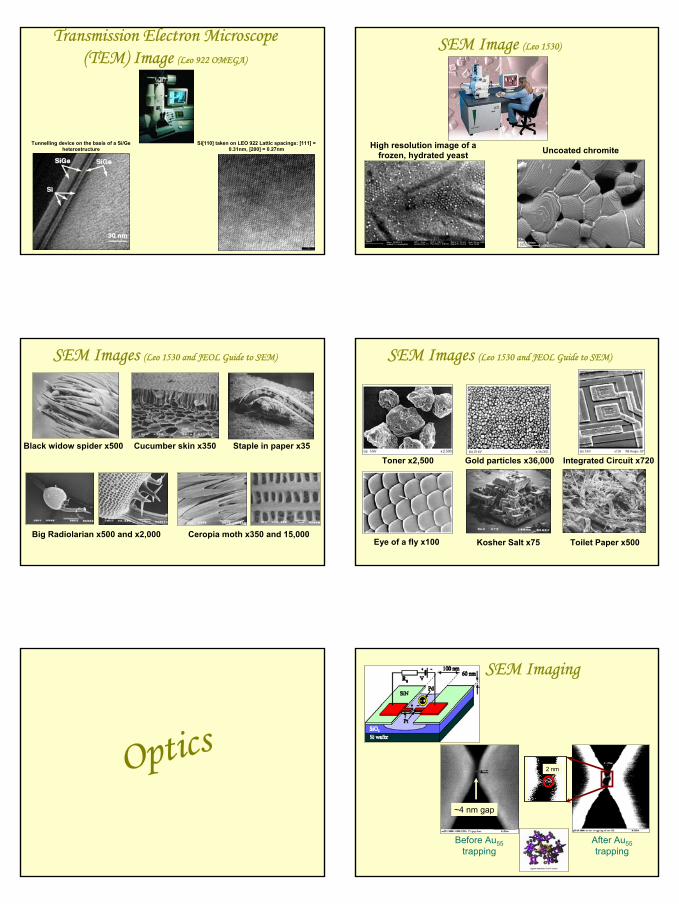
SEM Image (Leo 1530)
High resolution image of a frozen, hydrated yeast Uncoated chromite
Transmission Electron Microscope (TEM) Image (Leo 922 OMEGA)
Si[110] taken on LEO 922 Lattic spacings: [111] = 0.31nm, [200] = 0.27nm
Tunnelling device on the basis of a Si/Geheterostructure
SEM Images (Leo 1530 and JEOL Guide to SEM)
Toner x2,500
Eye of a fly x100
Gold particles x36,000 Integrated Circuit x720
Kosher Salt x75 Toilet Paper x500
SEM Images (Leo 1530 and JEOL Guide to SEM)
Black widow spider x500
Big Radiolarian x500 and x2,000
Cucumber skin x350 Staple in paper x35
Ceropia moth x350 and 15,000
SEM Imaging
~4 nm gap
Before Au55trapping
After Au55trapping
2 nmOptics

3
Image Through a Thin LensVarious Optical Ray Diagrams
1/f=1/u+1/v M=f/(u-f)=(v-f)/f
Two lens System and Magnification
M=(v1-f1)(v2-f2)/f1f2
Objective Projector
M1=(v1-f1)/f1 M2=(v2-f2)/f2
Light Sources
Transmission illumination
Reflected illumination
TEM
SEM
Spectral rangeResolutionThe smallest distance between two points which can be resolved The resolution depends on the lens ability to collect light (~1/f#) and inverse to the aperture number or Numerical Aperture (NA)
)sin(nsolutionRe
αλ
=
fD)sin( ≈α

4
Resolution … Airy Discs
Laser beam Diffraction through a pinhole
~84 %
d1~1/aperture-diameter
Rayleigh Resolution Criterion
R1= d1/2=0.61λ/nsin(α)= 0.61λ/NA
75 µm 100 µm
Diffraction limited Resolution
Thus the smallest separation is determined by the N.A. (1/2f#)
Typically the best objective has N.A ≈1.6 ⇒ resolution ≈150 nm
⇒ Decrease λ
UnresolvedPartially resolved
Resolved
For λ~400 nm (green light)
Electron Microscopy - Decreasing The Wavelength
Energy Conservation
P h=
λ
eVmpE ==⇒2
2
meVp 2=⇒
λ = = =⋅
⋅ ⋅ ⋅ ⋅ ⋅≈
−
− −
hp
hmeV
A2
66 102 91 10 16 10 50000
00534
31 19
.. .
.o
Resolution (50 kV): R1= 0.61λ/NA~(0.6.0.05)/1.6~0.2 Å
The Evolution of Resolution
Magnifications (YBCO)
Optical
SEMx70
x300
x1400
x2800
Depth of Focus
h=0.61λ/[nsin(α)tg(α)]Depth of focus, h, is the distance from the plane of optimum focus in which the beam diverges by no more than the spot diameter d1.
Depth of Field - the range of positions for the object for which our eye can detect no change in the sharpness of the image

5
SEM Structure
SEM Operation
Magnification = length of monitor screen/scanning length
SEM OperationSEM Ray DiagramsLarge WD:
• Demagnification decreases
• Spot size increases
• Divergence angle α decreased
Small WD Large WD
The decrease in demagnification is obtained when the lens current is decreased, which in turn increases the focal length f of the lens. The resolution of the specimen is decreased with an increased working distance, because the spot size is increased. Conversely, the depth of field is increased with an increased working distance, because the divergence angle is smaller.
Beam's Path through the ColumnLight vs. Electron Microscopes
6
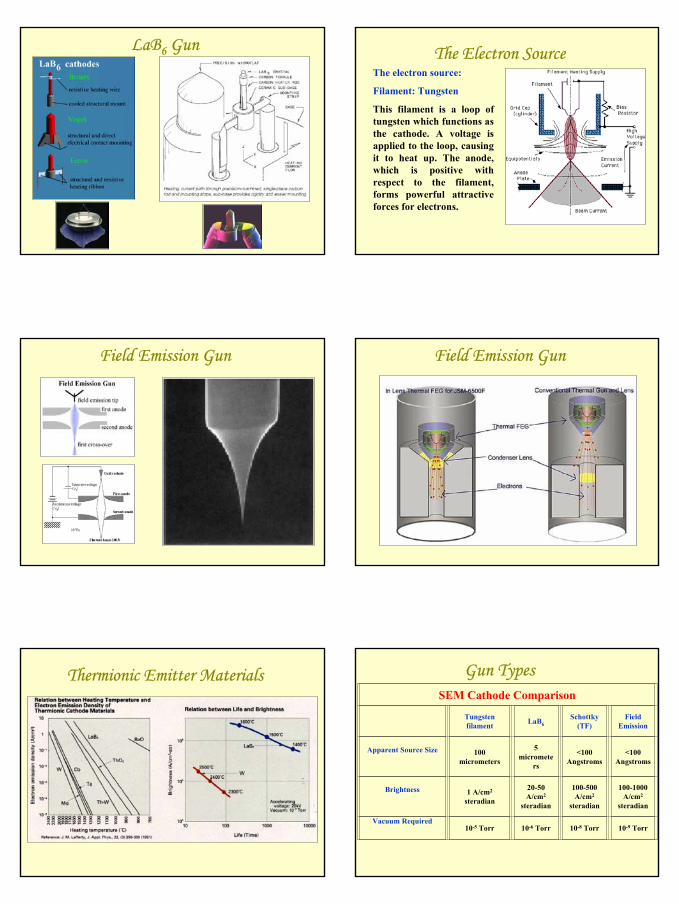
The Electron SourceThe electron source:
Filament: Tungsten
This filament is a loop of tungsten which functions as the cathode. A voltage is applied to the loop, causing it to heat up. The anode, which is positive with respect to the filament, forms powerful attractive forces for electrons.
LaB6 Gun
Field Emission GunField Emission Gun
Gun TypesSEM Cathode Comparison
Tungsten filament LaB6
Schottky(TF)
Field Emission
Apparent Source Size 100 micrometers
5 micromete
rs
<100 Angstroms
<100 Angstroms
Brightness 1 A/cm2
steradian
20-50 A/cm2
steradian
100-500 A/cm2
steradian
100-1000 A/cm2
steradian
Vacuum Required10-5 Torr 10-6 Torr 10-8 Torr 10-9 Torr
Thermionic Emitter Materials
7
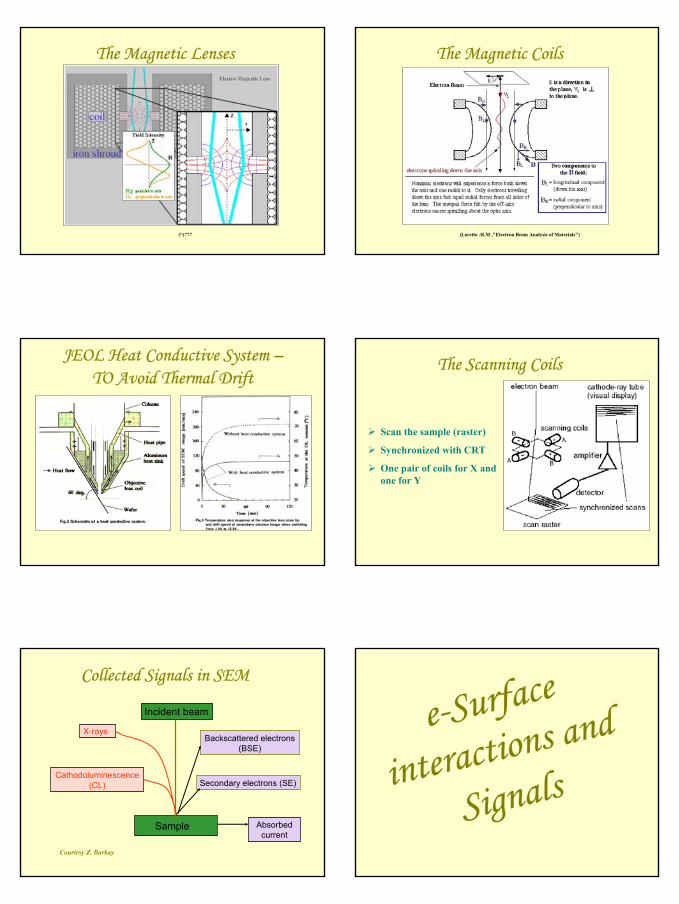
The Magnetic Coils
( )"Electron Beam Analysis of Materials" ,M.H .Loretto
The Magnetic Lenses
( )“ ???
The Scanning Coils
Scan the sample (raster)
Synchronized with CRT
One pair of coils for X and one for Y
JEOL Heat Conductive System –TO Avoid Thermal Drift
e-Surface
interactions and
Signals
Collected Signals in SEM
Sample
Incident beam
Secondary electrons (SE)
Backscattered electrons (BSE)
Cathodoluminescence(CL)
X-rays
Absorbed current
Courtesy Z. Barkay

8
Information from Electron Beam-Specimen Interactions
While all these signals are present in the SEM, not all of them are detected and used for information. The signals most commonly used are theSecondary Electrons, the Backscattered Electrons and X-rays
Signal Emission from Interaction Volume
Rp
Basic SEM Modes of Operation - SummarySignal/Mode Information Material Resolution Secondary
electrons (SE) Morphology All (*) ~1nm
Backscattered electrons (BSE)
Atomic number
All (*) 0.1-0.5µm(**)
X-ray (EDS or WDS)
Atomic composition
All (flat) ~1µm
(CL)Cathodo- luminescence
Bandgap, impurities, lifetimes
Insulators and semi- conductors
~ 1µm
(*) usually sizes of 1cm, dependent on SEM configuration
(**) voltage and Z dependent
Additional modes: Voltage contrast (VC) and EBIC - usually used in devices and p-n junctions. Courtesy Z. Barkay
Inelastic Scattering
During inelastic scattering, energy is transferred to the electrons surrounding the atoms and the kinetic energy of the energetic electron involved decreases. A single inelastic event can transfer various amounts of energy from the beam electron ranging from a fraction to many kilo-electron volts. The main processes include phonon excitation, plasmon excitation, secondary electron excitation, continuum X-ray generation, and ionization of inner shells. In all processes of inelastic scattering, energy is lost, though different processeslose energy at varying rates.
Secondary Electrons
1. Secondary electrons are predominantly produced by the interactions between energetic beam electrons and weakly bonded conduction-band electrons in metals or the valence electrons of insulators and semiconductors.
2. There is a great difference between the amount of energy contained by beam electrons compared to the specimen electrons and because of this, only a small amount of kinetic energy can be transferred to the secondary electrons.
Secondary Electrons and DetectionSE are specimen electrons that obtain energy by inelasticcollisions with beam electrons. They are defined as electrons emitted from the specimen with energy less than 50 eV
A broken surface of a piece of metal, formed using SEimaging

9
Elastic Scattering – Backscattering
As the name implies, elastic scattering results in little (<1eV) or no change in energy of the scattered electron, although there is a change in momentum. Since momentum, p=mv, and m doesn't change, the direction of the velocity vector must change. The angle of scattering can range from 0-180 degrees, with a typical value being about 5 degrees.
Elastic scattering occurs between the negative electron and the positive nucleus. This is essentially Rutherford scattering. Sometimes the angle is such that the electron comes back out of the sample. These are backscattered electrons.
Backscattering Detector
Elastic scattering occurs between the negative electron and the positive nucleus. This is essentially Rutherford scattering. Sometimes the angle is such that the electron comes back out of the sample. These are backscattered electrons.
Aluminum copper alloy formed using backscattered electron imaging.
The light area is mostly aluminum and the dark area is mostly copper
Energy distribution of SE and BSE
Courtesy Z. Barkay
DetectionAn electron detector is used with the SEM to convert the radiation of interest into an electrical signal for manipulation and display by signal processing electronics, which is much like a television. Most SEM's are equipped with an Everhart-Thornley (E-T) detector. It works in the following manner:
The scintillator material is struck by an energetic electron. This collision produces photons which are conducted by total internal reflection in a light guide to a photomultiplier. Thesephotons are now in the form of light so they can pass through a vacuum environment and a quartz glass window. The photon is then converted back into an electron current where a positive bias can attract the electrons and collect them so that they will be detected.
E-T Electron DetectorVacuum
When a SEM is used, the column must always be at a vacuum. There are many reasons for this. If the sample is in a gas filled environment, an electron beam cannot be generated or maintained because of a high instability in the beam. Gases could react with the electron source, causing it to burn out, or cause electrons in the beam to ionize, which produces random discharges and leads to instability in the beam. The transmission of the beam through the electron optic column would also be hindered by the presence of other molecules. Those other molecules, which could come from the sample or the microscope itself, could form compounds and condense on the sample. This would lower the contrast and obscure detail in the image.
A vacuum environment is also necessary in part of the sample preparation. One such example is the sputter coater. If the chamber isn't at vacuum before the sample is coated, gas molecules would get in the way of the argon and gold. This could lead to uneven coating, or no coating at all.
10
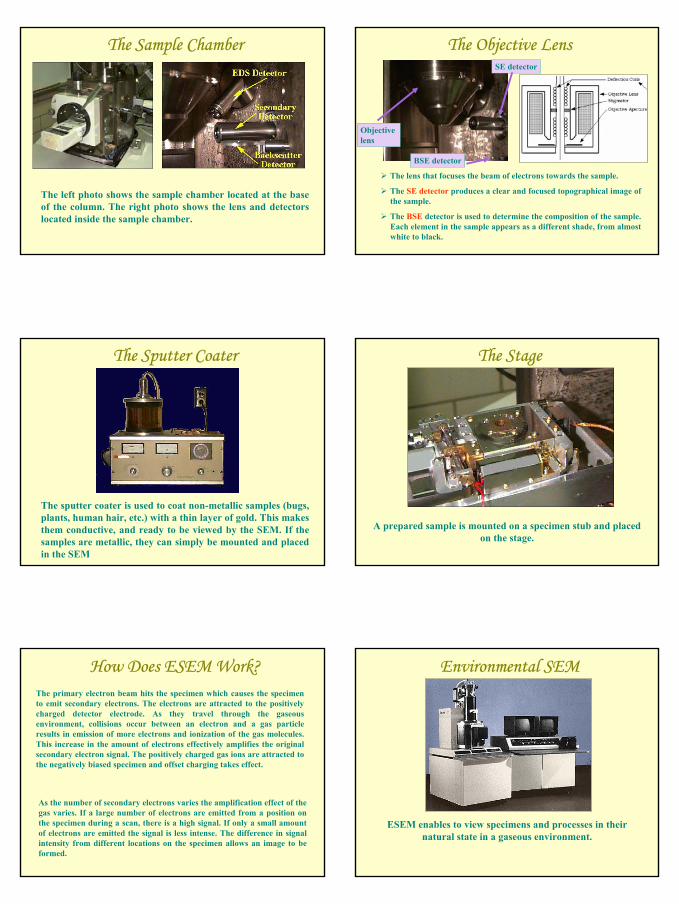
The Objective Lens
The lens that focuses the beam of electrons towards the sample.
The SE detector produces a clear and focused topographical image of the sample.
The BSE detector is used to determine the composition of the sample. Each element in the sample appears as a different shade, from almost white to black.
Objective lens
SE detector
BSE detector
The Sample Chamber
The left photo shows the sample chamber located at the base of the column. The right photo shows the lens and detectors located inside the sample chamber.
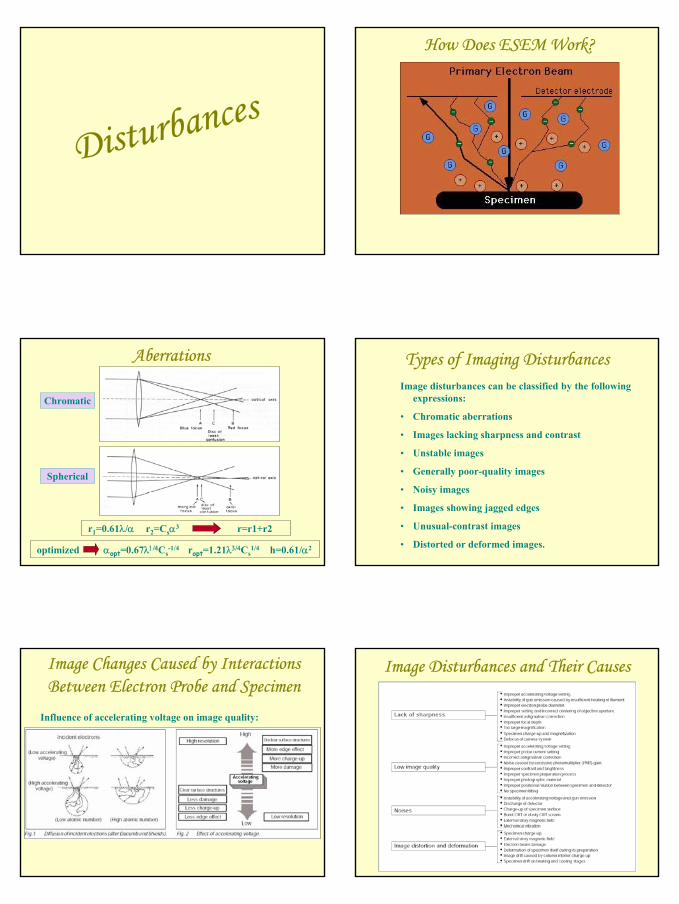
The Stage
A prepared sample is mounted on a specimen stub and placed on the stage.
The Sputter Coater
The sputter coater is used to coat non-metallic samples (bugs, plants, human hair, etc.) with a thin layer of gold. This makes them conductive, and ready to be viewed by the SEM. If the samples are metallic, they can simply be mounted and placed in the SEM
Environmental SEM
ESEM enables to view specimens and processes in their natural state in a gaseous environment.
How Does ESEM Work?The primary electron beam hits the specimen which causes the specimen to emit secondary electrons. The electrons are attracted to the positively charged detector electrode. As they travel through the gaseous environment, collisions occur between an electron and a gas particle results in emission of more electrons and ionization of the gas molecules. This increase in the amount of electrons effectively amplifies the original secondary electron signal. The positively charged gas ions are attracted to the negatively biased specimen and offset charging takes effect.
As the number of secondary electrons varies the amplification effect of the gas varies. If a large number of electrons are emitted from a position on the specimen during a scan, there is a high signal. If only a small amount of electrons are emitted the signal is less intense. The difference in signal intensity from different locations on the specimen allows an image to be formed.
11
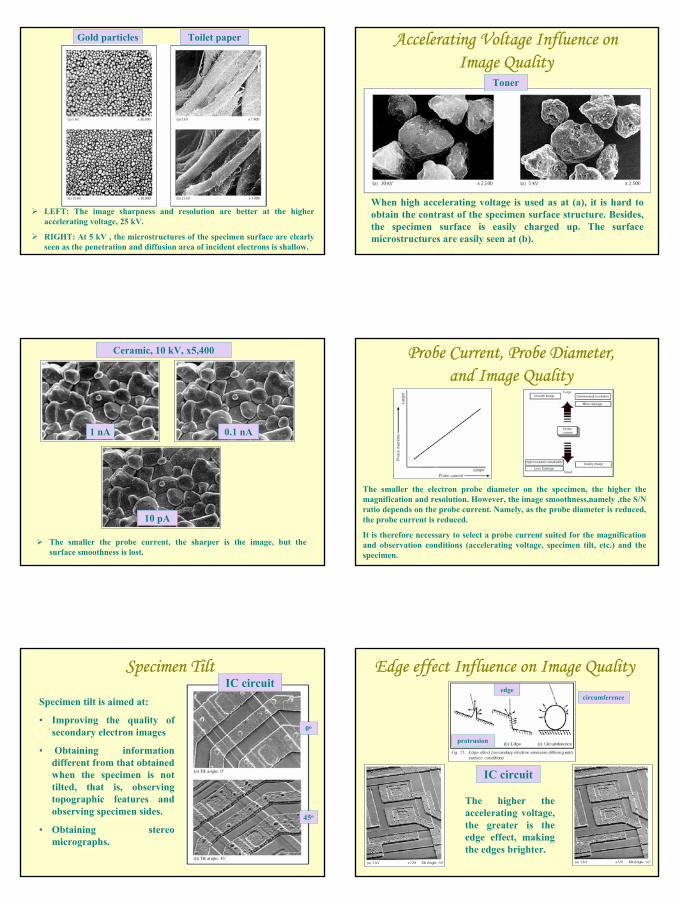
How Does ESEM Work?
Disturbances
Types of Imaging DisturbancesImage disturbances can be classified by the following
expressions:
• Chromatic aberrations
• Images lacking sharpness and contrast
• Unstable images
• Generally poor-quality images
• Noisy images
• Images showing jagged edges
• Unusual-contrast images
• Distorted or deformed images.
Aberrations
Chromatic
Spherical
optimized αopt=0.67λ1/4Cs-1/4 ropt=1.21λ3/4Cs
1/4 h=0.61/α2
r1=0.61λ/α r2=Csα3 r=r1+r2
Image Disturbances and Their CausesImage Changes Caused by Interactions Between Electron Probe and Specimen
Influence of accelerating voltage on image quality:
12
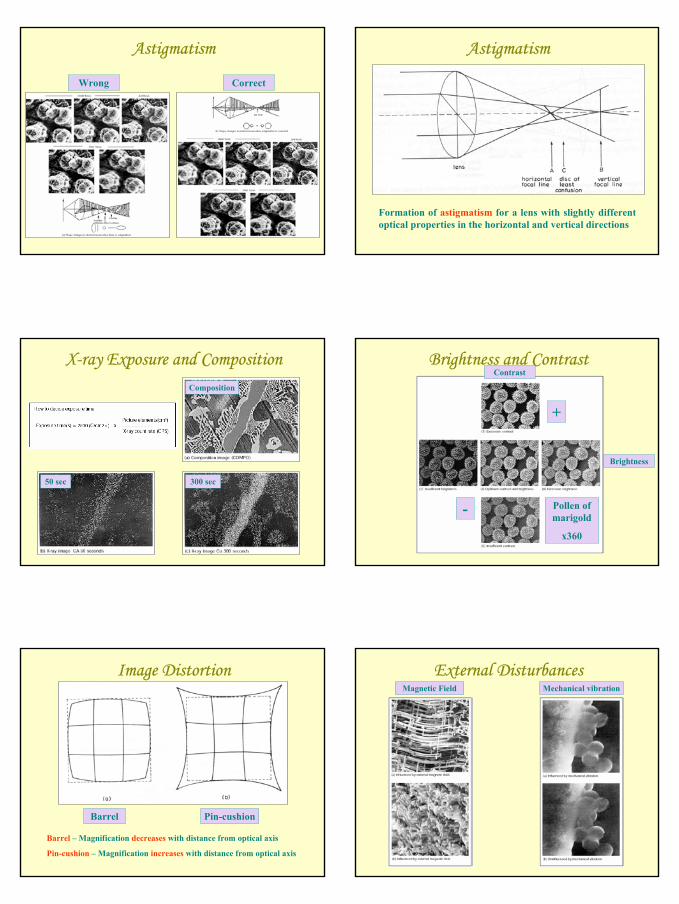
Accelerating Voltage Influence on Image Quality
When high accelerating voltage is used as at (a), it is hard to obtain the contrast of the specimen surface structure. Besides, the specimen surface is easily charged up. The surface microstructures are easily seen at (b).
Toner
LEFT: The image sharpness and resolution are better at the higher accelerating voltage, 25 kV.
RIGHT: At 5 kV , the microstructures of the specimen surface are clearly seen as the penetration and diffusion area of incident electrons is shallow.
Gold particles Toilet paper
Probe Current, Probe Diameter, and Image Quality
The smaller the electron probe diameter on the specimen, the higher the magnification and resolution. However, the image smoothness,namely ,the S/N ratio depends on the probe current. Namely, as the probe diameter is reduced, the probe current is reduced.
It is therefore necessary to select a probe current suited for the magnification and observation conditions (accelerating voltage, specimen tilt, etc.) and the specimen.
The smaller the probe current, the sharper is the image, but thesurface smoothness is lost.
Ceramic, 10 kV, x5,400
1 nA 0.1 nA
10 pA
Edge effect Influence on Image Quality
The higher the accelerating voltage, the greater is the edge effect, making the edges brighter.
protrusion
edgecircumference
IC circuit
Specimen Tilt
Specimen tilt is aimed at:
• Improving the quality of secondary electron images
• Obtaining information different from that obtained when the specimen is not tilted, that is, observing topographic features and observing specimen sides.
• Obtaining stereo micrographs.
0o
45o
IC circuit

13
Detector position and specimen direction
Fiber2
31
Composition of Signals
Composition of Signals - Slug 20 kV, x1,100
BSE
Topography
Composition
SE
X-ray (Si)
X-ray (Al)
Influence of Charge-Up on Image QualityResist Vinegar fly
1) Probe current, 2) Accelerating voltage, 3) Tilting angle
ContaminationITO
1) Dry and clean sample, 2) Low temp, 3) Small samples
Effect of Working Distance and Aperture Size
14
Astigmatism
Formation of astigmatism for a lens with slightly different optical properties in the horizontal and vertical directions
Astigmatism
Wrong Correct
Brightness and ContrastContrast
Brightness
Pollen of marigold
x360
+
-
X-ray Exposure and Composition
50 sec 300 sec
Composition
External DisturbancesMechanical vibrationMagnetic Field
Image Distortion
Pin-cushionBarrel
Barrel – Magnification decreases with distance from optical axis
Pin-cushion – Magnification increases with distance from optical axis
15
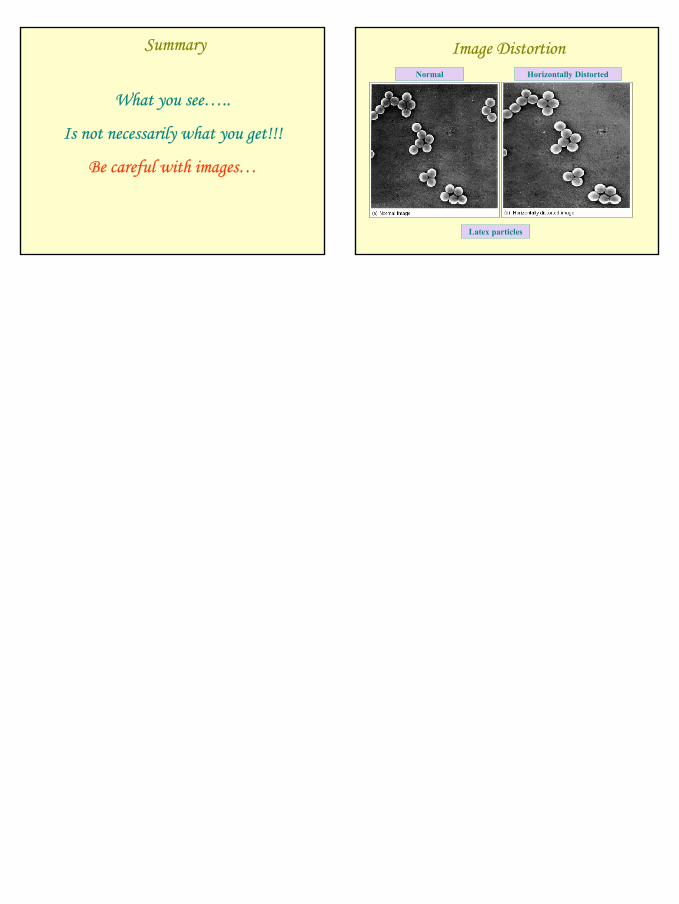
Image DistortionHorizontally DistortedNormal
Latex particles
Summary
What you see…..
Is not necessarily what you get!!!
Be careful with images…