Manual for Quantification of Malaria CommoditiesRapid Diagnostic Tests and Artemisinin-Based Combination Therapy for First-Line Treatment of Plasmodium Falciparum Malaria

2
This report is made possible by the generous support of the American people through the US Agency for International Development (USAID), under the terms of cooperative agreement number GHN-A-00-07-1012122-00. The contents are the responsibility of Management Sciences for Health (MSH) and do not necessarily reflect the views of USAID or the US Government.
Acknowledgments
This manual represents the combined efforts of a number of organizations. These contributors include the US Centers for Disease Control and Prevention, the USAID | DELIVER PROJECT implemented by John Snow Inc., the President’s Malaria Initiative, the Clinton Health Access Initiative, the William Davidson Institute, and Strengthening Pharmaceutical Systems Program.
Recommended Citation
This manual may be reproduced if credit is given to Strengthening Pharmaceutical Systems Program. Please use the following citation.
Strengthening Pharmaceutical Systems. 2011. Manual for Quantification of Malaria Commodities: Rapid Diagnostic Tests and Artemisinin-Based Combination Therapy for First-Line Treatment of Plasmodium Falciparum Malaria. Submitted to the US Agency for International Development by the Strengthening Pharmaceutical Systems Program. Arlington, VA: Management Sciences for Health.
Strengthening Pharmaceutical Systems Center for Pharmaceutical ManagementManagement Sciences for Health4301 North Fairfax Drive, Suite 400Arlington, VA 22203 USATelephone: 703.524.6575Fax: 703.524.7898E-mail: [email protected]: www.msh.org/sps
Contents 3
Contents
Acronyms ............................................................................................................................................................. 5
Acknowledgments .............................................................................................................................................6
Purpose and Objectives of this Manual ......................................................................................................7
Manual Outline ...................................................................................................................................................8
Section 1. Quantification of ACTs and RDTs and their Interaction ...................................................9Issues Related to ACTs That Affect Quantification ......................................................................................9Effect of Malaria Diagnostics on Case Management and Demand for ACTs ........................................ 10
Section 2. Introduction to Quantification ................................................................................................13The Quantification Process ............................................................................................................................13
Section 3. Planning for Quantification .......................................................................................................15Five Steps in Planning for Quantification ................................................................................................... 16
Section 4. Data Sources, Assumptions, and Proxy Data for Quantification of ACTs and RDTs ............................................................................................................................................ 19
Preparing to Use the Data .............................................................................................................................20
Section 5. Forecasting ......................................................................................................................................31Select Forecasting Method ............................................................................................................................ 32Consumption-Based Forecasting .................................................................................................................34Proxy Consumption-Based Forecasting ......................................................................................................39Morbidity-Based Forecasting ........................................................................................................................42
Section 6. Interpreting Results ....................................................................................................................49When the Consumption-Based Estimate is Greater than the Morbidity-Based Estimate ...................49When the Morbidity-Based Estimate is Greater than the Consumption-Based Estimate ...................50
Section 7. Supply Planning .............................................................................................................................51The Purpose of Supply Planning .................................................................................................................. 52
Section 8. Workbook for Quantification of ACTs and RDTs for the Consumption and Morbidity Methods of Forecasting .................................................................................................... 61
Forecasting ...................................................................................................................................................... 61
Glossary ..............................................................................................................................................................88
Bibliography .......................................................................................................................................................90
Annexes ..............................................................................................................................................................93Annex A. Software Tools and Programs for Quantification .....................................................................93Annex B. WHO Guidelines for Malaria and Standard Dosage Schedules for ACTs .............................94Annex C. Published Studies Reporting Adherence to RDT Results .......................................................98Annex D. Illustrative Quantification Timeline ......................................................................................... 100Annex E. Checklists for Planning for the Quantification Exercise ........................................................ 102Annex F. Blank Tables for Performing Consumption and Morbidity Forecasting .............................. 103Annex G. Procurement Timelines from Various Agencies .................................................................... 106Annex H. Evaluation of the Quantification Process ................................................................................. 115

4 Contents

Acronyms 5
Acronyms
ACT artemisinin-based combination treatmentAL artemether-lumefantrineAQ amodiaquineAS artesunateAS/AQ artesunate/amodiaquineBD bidding documentBU basic unitCIF cost, insurance, and freightCMS Central Medical StoreDHS Demographic and Health SurveysEML essential medicines listFDC fixed-dose combinationGlobal Fund Global Fund to Fight AIDS, Tuberculosis and MalariaHMIS health management information systemICB International Competitive Biddingkg kilogramLLIN long-lasting insecticide-treated netsLMIS logistics management information systemmg milligramMIS management information systemNMCP National Malaria Control ProgramPMI President’s Malaria InitiativePMIS pharmaceutical management information systemPP procurement periodQA quality assuranceRDT rapid diagnostic testRFQ request for quotationsSP sulfadoxine-pyrimethamineSPS Strengthening Pharmaceutical SystemsSTG standard treatment guidelineUNICEF United Nations Children’s FundUSAID US Agency for International DevelopmentUSD US dollarWB World BankWHO World Health OrganizationWHO/GMP [WHO] Global Malaria Programme

6 Acknowledgments
AcknowledgmentsThis manual was prepared by Rima Shretta at Strengthening Pharmaceutical Systems Program with valuable input from the following individuals and organizational affiliations—
Strengthening Pharmaceutical Systems ProgramFrancis Aboagye-NyameJane BriggsSeydou DoumbiaAndwele MwansasuChinwe OwunnaHelena Walkowiak
USAID/President’s Malaria InitiativeLarry BaratSonali Korde
WHO/Global Malaria ProgrammeAndrea Bosman
Medicines for Malaria VentureRenia Coghlan
Clinton Health Access InitiativeJustin M. CohenAaron M. Woolsey
USAID | DELIVER PROJECT Lisa HareNaomi Printz
Roll Back Malaria SecretariatJan van ErpsFrancois Jouberton
FIND DiagnosticsEvan Lee
William Davidson Institute, University of MichiganPrashant Yadav (formerly with the Massachusetts Institute of Technology/Zaragoza Logistics Program)
Purpose and Objectives of this Manual 7
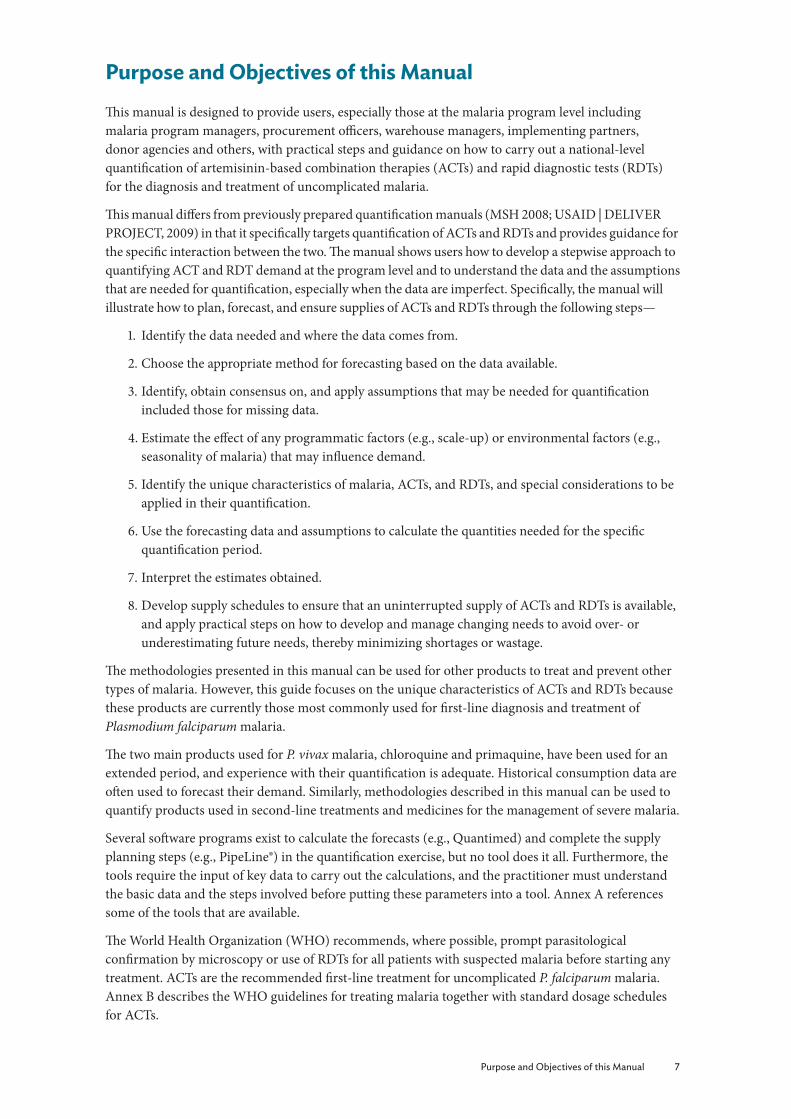
Purpose and Objectives of this ManualThis manual is designed to provide users, especially those at the malaria program level including malaria program managers, procurement officers, warehouse managers, implementing partners, donor agencies and others, with practical steps and guidance on how to carry out a national-level quantification of artemisinin-based combination therapies (ACTs) and rapid diagnostic tests (RDTs) for the diagnosis and treatment of uncomplicated malaria.
This manual differs from previously prepared quantification manuals (MSH 2008; USAID | DELIVER PROJECT, 2009) in that it specifically targets quantification of ACTs and RDTs and provides guidance for the specific interaction between the two. The manual shows users how to develop a stepwise approach to quantifying ACT and RDT demand at the program level and to understand the data and the assumptions that are needed for quantification, especially when the data are imperfect. Specifically, the manual will illustrate how to plan, forecast, and ensure supplies of ACTs and RDTs through the following steps—
1. Identify the data needed and where the data comes from.
2. Choose the appropriate method for forecasting based on the data available.
3. Identify, obtain consensus on, and apply assumptions that may be needed for quantification included those for missing data.
4. Estimate the effect of any programmatic factors (e.g., scale-up) or environmental factors (e.g., seasonality of malaria) that may influence demand.
5. Identify the unique characteristics of malaria, ACTs, and RDTs, and special considerations to be applied in their quantification.
6. Use the forecasting data and assumptions to calculate the quantities needed for the specific quantification period.
7. Interpret the estimates obtained.
8. Develop supply schedules to ensure that an uninterrupted supply of ACTs and RDTs is available, and apply practical steps on how to develop and manage changing needs to avoid over- or underestimating future needs, thereby minimizing shortages or wastage.
The methodologies presented in this manual can be used for other products to treat and prevent other types of malaria. However, this guide focuses on the unique characteristics of ACTs and RDTs because these products are currently those most commonly used for first-line diagnosis and treatment of Plasmodium falciparum malaria.
The two main products used for P. vivax malaria, chloroquine and primaquine, have been used for an extended period, and experience with their quantification is adequate. Historical consumption data are often used to forecast their demand. Similarly, methodologies described in this manual can be used to quantify products used in second-line treatments and medicines for the management of severe malaria.
Several software programs exist to calculate the forecasts (e.g., Quantimed) and complete the supply planning steps (e.g., PipeLine®) in the quantification exercise, but no tool does it all. Furthermore, the tools require the input of key data to carry out the calculations, and the practitioner must understand the basic data and the steps involved before putting these parameters into a tool. Annex A references some of the tools that are available.
The World Health Organization (WHO) recommends, where possible, prompt parasitological confirmation by microscopy or use of RDTs for all patients with suspected malaria before starting any treatment. ACTs are the recommended first-line treatment for uncomplicated P. falciparum malaria. Annex B describes the WHO guidelines for treating malaria together with standard dosage schedules for ACTs.
8 Manual Outline
Manual OutlineThis manual describes the overall quantification process for ACTs and RDTs from start to finish. It provides instructions for each step of the process and cites challenges and possible solutions to each situation.1 All readers should look at the framework to understand how the manual is organized to allow for rapid referral to the sections of interest.
Section 1. Quantification of ACTs and RDTs and Their Interaction outlines the challenges with quantification of ACTs and RDTs and how the interaction of these products affects their quantification.
Section 2. Introduction to Quantification describes the quantification process. It also provides the overall framework for the manual. Readers who are new to quantification should read this section.
Section 3. Planning for Quantification describes the preparatory steps needed when planning for quantification (common to all the methods).
Section 4. Data Sources, Assumptions, and Proxy Data for Quantification of ACTs and RDTs outlines the data needs and their sources as well as the assumptions to use when data are not available or are inaccurate.
Section 5. Forecasting describes how to forecast based on the methods described in section 2.
Section 6. Interpreting Results describes how to interpret the result of the forecasting exercise in section 5.
Section 7. Supply Planning describes the steps for supply and distribution planning (common to all the methods).
Section 8. Quantification Workbook is a step-by-step template for the calculations.
Annex A describes various software and tools that can be used to assist with the quantification exercise. While these are useful particularly for manipulating large sets of data, it is important to understand that the tools are only as effective as the data and assumptions used.
Annex B contains the WHO Guidelines for Malaria and Standard Dosage Schedules for ACTs.
Annex C contains published studies reporting adherence to RDT results that can be used as proxy data when country level data is not available.
Annex D is the illustrative quantification timeline mapping out the steps that must occur with hypothetical timelines.
Annex E contains checklists for planning for the quantification exercise.
Annex F are Blank Tables for Performing Consumption and Morbidity Forecasting.
Annex G is procurement timelines from various agencies.
Annex H is an evaluation of the quantification process after it has taken place.
1 This manual builds upon Management Sciences for Health’s (MSH) Quantification of Antimalarial Medicines—A Workbook (2005) and Estimating the Needs for Severe Malaria Medicines—A Practical Guide (2008).

Section 1. Quantification of ACTs and RDTs and their Interaction 9
sect
ion
1
Section 1. Quantification of ACTs and RDTs and their InteractionThe quantification of artemisinin-based combination therapies (ACTs) and rapid diagnostic tests (RDTs) is challenging for a variety of reasons. Requisite data required for quantification is often of poor quality. Furthermore, the World Health Organization (WHO) recommendations for case management of malaria now include diagnostic testing with microscopy or RDTs. Moreover, the epidemiology of malaria is rapidly changing due to the implementation of effective malaria control interventions. Several reviews have demonstrated that the scale-up of effective treatment such as ACTs and vector control measures such as indoor residual spraying and long-lasting insecticide-treated nets (LLINs), reduce parasite transmission malaria cases (particularly severe malaria cases) in public health facilities (Marchant et al. 2002; Lengeler 2004; Barnes et al. 2005; Thuma and Mharakurwa 2007; Rowe and Steketee 2007; WHO/Global Malaria Programme (GMP) 2008; Shaukat et al. 2010; Steketee and Campbell 2010).
Issues Related to ACTs That Affect QuantificationAlthough ACTs have been extensively used for more than five years, the market demand and supply have not yet reached equilibrium.
On the supply side—
■ There are few suppliers, resulting in the need for accurate lead time planning to ensure adequate supply.
■ Artemisinin is a natural plant product with a planting cycle of 18 months. Farmers, extractors, and manufacturers need accurate and timely information on forecasts (i.e., two years in advance)2 to ensure the needed amount of active pharmaceutical ingredients.
On the demand side, information needed for demand forecasting is still quite poor in some countries—
■ Quantification of ACTs requires estimating needs for each pack corresponding to a particular age or weight group;3 however, this is difficult because data on malaria morbidity by weight and age group is limited.
■ Health workers often break up ACT packs when the required pack size is not available; this gives an inaccurate picture of actual consumption by age group. For example, if four 1 × 6 packs are substituted for the one 4 × 6 pack needed for an adult, this could be mistaken as four children being treated rather than one adult. Children are also more likely to be seen in a public health facility compared with adults, who may prefer to self-treat from ACTs bought from the private sector, thus misrepresenting who has been treated.
■ ACTs also have a short shelf life of two or three years from the date of manufacture.4 Therefore, either short procurement periods (forecasting step) or flexible delivery schedules (supply planning step) are needed to ensure that the products do not expire.
Although WHO now recommends that suspected cases of malaria be diagnosed using either microscopy or RDTs, many cases of uncomplicated malaria are still treated on the basis of clinical symptoms alone. Also, the proportion of cases that undergo diagnostic testing are not well documented, making it difficult to estimate the demand for diagnostic tests and ACTs. In addition,
2 If the farmers do not perceive a demand for artemisinin or if prices drop significantly, they are likely to plant other crops instead.3 In an ideal situation, weight groups would be used, however, age groups are used as proxies for weight for all ACT dosage forms.4 This is also true of TB medicines and ARVs; however, the older generation of antimalarials (e.g., chloroqouine) have had a long
shelf life making overstock much less of a concern. Furthermore, the very low price of chloroquine made the lack of precision less consequential.

10 Section 1. Quantification of ACTs and RDTs and their Interaction
sec
tio
n 1
most countries’ disease surveillance systems do not disaggregate malaria cases confirmed by a diagnostic test from those that are based on clinical findings.
The burden of malaria depends on transmission rates of the disease and geographical and seasonal considerations, such as changes in rainfall patterns and emergencies such as floods. Some regions in the same country may need different quantities of ACTs and RDTs at different times of the year. These circumstances often leave quantification teams estimating projected consumption based on weak or incorrect information.
Effect of Malaria Diagnostics on Case Management and Demand for ACTsMany countries are just now scaling up diagnostic testing programs for malaria with microscopy or RDTs in line with WHO’s new recommendations that all patients undergo testing before being prescribed malaria treatment. The World Malaria Report (WMR 2011) estimates that only an estimated 20 percent of malaria cases in Africa are diagnosed parasitologically. Diagnostic testing of malaria will further reduce the need for treatment, particularly in low transmission areas or areas where transmission has been significantly reduced because of nets or spraying.5 However, the quantifiable short- and medium-term effect of this is unclear. While diagnostic scale-up will likely reduce ACT use in the medium- and long-term, especially in lower transmission areas, the rate of RDT scale-up is unlikely to be commensurate with the rate reductions of ACT consumption. In the short-term, diagnostics will likely increase sharply as countries implement scale-up activities. At the same time, ACT use may show little or no change. ACT use will probably begin to decline slowly and then more rapidly over the intermediate to long term, corresponding with provider training and other interventions aimed at improving case management of malaria.6
Estimating what proportion of health workers will actually use RDTs as a diagnostic tool is also difficult. Estimates of RDTs that will be used must be based on cases of fever according to WHO recommendations.
An additional variable is the proportion of health workers that will adhere to the test results and prescribe treatments accordingly. Several studies have demonstrated that over 40 percent of parasite-negative patients are prescribed antimalarials including ACTs (Zurovac et al. 2006, 2008c; Hamer et al. 2007; Williams et al. 2008; Nankabirwa et al. 2009; Skarbinki et al. 2009; Chandler et al. 2010; Chinkhumba et al. 2010; Kyabayinze et al. 2010; Memusi et al. 2010). (Annex C lists some published studies reporting adherence to RDT results.) Other research has shown that in areas that have had significant interventions aimed at improving health worker behavior change to improve case management using diagnosis, over prescribing decreased by almost 70 percent in some cases (Williams et al. 2008; UMSP 2010). Furthermore, anecdotal data suggests that RDT stock-outs have shown to result in increased ACT consumption and vice versa. Also to be considered is adjusting for over consumption of some ACT presentations due to stock-outs of other presentations. Experience in multiple countries also demonstrates that lower cadres of health workers tend to follow test results more closely, because they are only trained in algorithmic care.
5 In Rwanda, annual orders of ACTs have decreased by over 30% as a result of LLIN scale up (WMR, 2010)6 Experience has shown, though, that ACT consumption may be lag a few years behind a documented drop in prevalence or the
introduction of universal diagnostic testing for malaria.

Section 1. Quantification of ACTs and RDTs and their Interaction 11
sect
ion
1
Therefore, adjustments need to be based on health facilities’ data on—
■ The percentage of cases that are diagnosed with microscopy or RDT
■ The proportion of these cases that are negative for malaria parasites
■ The proportion of the negative malaria cases that are not treated with ACTs
An adjustment factor based on the above is then applied.
Even for mature programs with advanced interventions aimed at improving health worker behavior in place, forecasts should be based on the assumption that reflects the realities in their respective countries.
A case management algorithm and decision tree can help to visualize the process (figure 1-1).
Patient presents with fever
Treat with ACTs
Continue managementRefer to reference center
Administer antibiotic and antipyretic (follow national
guidelines)
Perform malaria RDT/microscopy
-VE (A%) +VE (B%)
NO IMPROVEMENT (D%) NO IMPROVEMENT (F%) IMPROVEMENT (E%)
VE CASES INCORRECTLY TREATED WITH ACTS (C%)
Figure 1-1. Case management algorithm for determining ACT and RDT use
Box 1-1. Summary of Examples of Measurable Impacts of Programmatic Changes § Several studies have demonstrated that over 40 percent of parasite-negative patients are prescribed
antimalarials including ACTs (annex C lists some published studies reporting adherence to RDT results).
§ In areas that have had significant interventions aimed at improving health workers’ behavior to improve case management using diagnosis, overprescribing decreased by almost 70 percent in some cases (Williams et al. 2008; UMSP 2010).
§ Anecdotal data suggests that RDT stock-outs have shown to result increased ACT consumption and vice versa. Also to be considered is adjusting for over consumption of some ACT presentations due to stock-outs of other presentations.
§ Data from Senegal indicates an overall reduction of ACT prescriptions by 17 percent corresponding to a scale-up of RDTs from 3.9 to 86.0 percent over a three-year period (Thiam et al. 2011). The prescription of ACTs dropped throughout this period from 72.9 percent of malaria-like febrile illness to 31.5 percent.
§ In Rwanda, annual orders of ACTs have decreased by over 30 percent as a result of LLIN scale- up (WMR 2010).

12 Section 1. Quantification of ACTs and RDTs and their Interaction
sec
tio
n 1
Case
s (%
)
100
80
60
40
20
0
2007
Jan.
Feb.
Mar
.A
pr.
May
Jun. Jul.
Aug
.Se
p.O
ct.
Nov
.D
ec.
2008Ja
n.Fe
b.M
ar.
Apr
.M
ayJu
n. Jul.
Aug
.Se
p.O
ct.
Nov
.D
ec.
2009
Jan.
Feb.
Mar
.A
pr.
May
Jun. Jul.
Aug
.Se
p.O
ct.
Nov
.D
ec.
Patients with malaria-like fever tested for malaria by RDTMalaria cases confirmed by RDTPatients treated with ACTs
Figure 1-2. Management of suspected malaria by Senegal public health services, 2007–2009 (Thiam et al. 2011)
Figure 1-2 illustrates the interaction between diagnosis with microscopy and RDTs and treatment with ACTs; it shows an overall reduction of ACT prescriptions by 17 percent corresponding to a scale-up of RDTs from 3.9 to 86.0 percent over a three-year period (adapted from Thiam et al. 2011).7
As countries scale-up their use of diagnostics, the quantification team will need to include an adjustment factor for ACT consumption over the forecast period. The team will need to look at its own data and trends, particularly if country-level data if available. In the absence of any data, the quantification team should consider a rapid review of records to determine how many patients were prescribed an ACT (with positive and negative tests for malaria). Alternatively, a prospective analysis of the trends could be performed. If such an analysis is not possible, proxy data from the above studies or other proxy data can be used.
As noted earlier, stock-outs of RDTs may lead to changes in ACT consumption. This trend calls for—
■ Approaching quantification comprehensively by using a case management model that takes diagnosis with RDTs and treatment with ACTs into account
■ Estimating needs of both products simultaneously
■ Ensuring the uninterrupted availability of both products at all times when cases are likely to be seen
7 The prescription of ACTs dropped throughout this period from 72.9 percent of malaria-like febrile illness to 31.5 percent.
Section 2. Introduction to Quantification 13
sect
ion
2
Section 2. Introduction to Quantification
The Quantification ProcessThe terms quantification and forecasting are often used interchangeably. For the purposes of this manual, the following definitions are used.
Quantification is the process used to estimate how much of a product is required for the purpose of procurement. Quantification involves estimating the quantities needed of a specific item, the funding required for purchasing the item, and when the products should be delivered to ensure an uninterrupted supply for the program. The quantification process has two parts—
■ Forecasting: Estimating the quantities of product required to meet customer demand that will actually be used during a particular time frame
■ Supply planning: Detailing the quantities required to fill the supply pipeline, costs, orders, and arrival dates of shipments—this is the final output of the quantification
Because of the seasonality of malaria, quantification for ACTs and RDTs should be done either annually (depending on the procurement cycle), during the planning for a new health program or project, or during development of a funding proposal based on the policy. The data should be reviewed annually. There are several methods used for forecasting antimalarial commodities. The three steps common to all methods are—
1. Planning. This includes all the preparatory steps including assessing the program, defining the scope and coverage of the quantification including the target population, and compiling the list of products to be quantified (Section 3. Planning for Quantification).
2. Forecasting. This includes obtaining the required data, building assumptions for missing or inaccurate data (Section 4. Data Sources, Assumptions, and Proxy Data for Quantification of ACTs and RDTs), selecting the forecasting method, and conducting the calculations for the forecast. The two primary methods for forecasting malaria commodity needs are the consumption method and the morbidity method. The proxy consumption method is an alternative form of the consumption method. Because they are the most widely used, this manual focuses on the consumption and the morbidity methods (Section 5. Forecasting).
3. Supply planning. This works hand in hand with forecasting to ensure an optimal procurement and delivery schedule. Once the total requirements have been defined and the product specifications have been agreed upon, the estimated requirements should be translated into actual orders, including the timing of the orders, by taking the existing pipeline and seasonality into account (Section 7. Supply Planning).
Annex D contains an illustrative timeline for the process of quantification.


Section 3. Planning for Quantification 15
sect
ion
3
Section 3. Planning for Quantification
FORECASTINGSelect Forecasting Method(s)
Consumption Based§ Build Assumptions§ Calculate Forecasted
Demand for ACTs and RDTs
Morbidity Based§ Build Assumptions§ Calculate Forecasted
Demand for ACTs and RDTs
PLANNING§ Describe the Program§ Define the Scope and Purpose of
the Quantification§ Define the Target Population§ Define What Data are Available
and Sources and Gaps
Collect Required DataOrganize and Analyze Data
Build Assumptions
Procure Quantities Required
Mobilize Additional Resources
Apply Cost ReductionStrategies and Review
Forecasting Assumptions
Collect Required DataOrganize and Analyze Data
Build Assumptions
SUPPLY PLANNING§ Enter Data on Monthly Consumption§ Determine Quantities Required§ Determine Quantities to Order§ Determine When to Place Order§ Compare Budget Available to Cost§ Validate Supply Plan§ Assess Risks and Troubleshoot
QU
AN
TIF
ICA
TIO
N
Funds Su�cient?Increase Funds?
YES YES
NO
NO
Adapted from USAID | DELIVER PROJECT, 2009
Figure 3-1. Steps in the quantification process: planning for quantification

16 Section 3. Planning for Quantification
sec
tio
n 3
Because the data and information needed for quantification come from various sources, annual national quantification is usually managed and validated by a team consisting of the malaria program in collaboration with the procurement department of the Ministry of Health, logistics managers, management information system managers, demographic specialists, donors, the Central Medical Store (CMS), and pharmacy staff. Conferring with public and private sector facilities, pharmacy and laboratory staff, as well as community health managers is crucial. In many countries, a smaller subgroup or a committee under an appropriate body carries out the quantification.
Five Steps in Planning for QuantificationPlanning for quantification involves five steps—
1. Describe the program.
2. Define the scope, coverage, and time frame of the quantification.
3. Define the target population.
4. Using standard treatment guidelines (STGs), compile the list of medicinal products to treat malaria and febrile illness.
5. Determine what data sources are available.
Preparing a preliminary written schedule for the quantification process, which includes travel schedules, appointments with key officials, and a preparation of final report to the program director and other responsible officers, is a useful exercise; revise this schedule as necessary.
1. Describe the ProgramThe first step in planning, describing the program, requires careful examination of certain parameters—
■ Assess the malaria and laboratory program. Visit key locations and community level programs to interview staff and collect data. List the data to be collected, preferably following the supply chain down several distribution channels. Use these visits to determine data quality and identify information gaps that must be filled before a forecast can be prepared.
■ Describe malaria’s epidemiology. Endemic, non-endemic, epidemic, and distribution of P. falciparum, P. vivax, or both.
■ Describe malaria’s seasonality. The burden of malaria depends on transmission rates and geographical and seasonal considerations and is likely to increase with a malaria epidemic and changes in climatic conditions including rainfall patterns and emergencies such as floods. Some regions in the same country may need different quantities at different times of the year.
■ Describe the policy for malaria case management. With regard to diagnosis and first-/second-/third-line therapies, some countries have two first-line therapies that will necessitate the estimation of the proportions of populations that will be treated with each; for example, Ghana has two first-line therapies. Review the recommendation of the policy with respect to negative diagnosis results.
■ Summarize the context and performance of case management in the country. This will include the program’s goals and objectives as well as short- and medium-term strategies. This should also include any projected change in the program that may influence future consumption. Scaling up RDTs in the community, for example, will increase demand for RDTs.
■ Determine the scale of the prevention activities. Knowing the scale of activities being carried out helps to make better estimates on any reductions in parasite transmission and cases of

Section 3. Planning for Quantification 17
sect
ion
3
malaria in public health facilities. To avoid overestimating quantities of diagnostic products and treatments needed, assumptions on potential reductions in the number of cases may need to be made (Section 4. Data Sources, Assumptions, and Proxy Data for Quantification of ACTs and RDTs).
■ Describe the supply chain. To determine capacity and what proportion of ACTs and RDTs will be required at each level, the supply chain needs to be understood from the port to the central medical store to regional distribution centers to the patient.
■ Identify the available budget. This includes sources (current and potential new sources), and timing of disbursements.
■ Determine the program targets. This analysis is particularly important when there is a new policy without reliable surveillance data so quantification may be based on scaling-up to program targets rather than actual need.
■ Determine actual behaviors with regard to case management. Adjust for actual practices and behaviors including factors such as health worker prescribing patterns. While quantification should be realistic, it should be accompanied with interventions to improve case management.
Part of the planning process will include discussions with key stakeholders as well as visiting some health facilities to determine how cases are being managed.
2. Define the Scope, Coverage, and Time Frame of the QuantificationThe second step is to define the population, the scope, and coverage of the quantification, and the current status of access, coverage, and use of ACTs and RDTs. Determine whether the quantification is to be conducted for national needs, for select geographical areas (e.g., selected districts), or for select types of facilities, or for a particular donor or a specific population group (e.g., children under five years of age). In most cases, it is useful to conduct a national-level quantification for ACT and RDT needs and then coordinate mobilizing resources for their procurement among donors or partners. This also enables early identification of gaps or unmet needs.
Quantification for malaria programs should cover a period of at least 12 months to allow for seasonal changes in demand. These changes include the quantities of ACTs and RDTs to be procured as well as time frames for procurement and delivery schedules that take lead times, buffer stock, and seasonal requirements into account. Then the quantification should be reviewed quarterly to make adjustments to both the procurement and supply plans.
Most commodities will be rolled out in phases. The rollout plan needs to define the target coverage of ACTs and RDTs.
3. Define the Target PopulationsThe third step in planning for quantification is to define the target populations, which may include—
■ Inpatients and outpatients by level of care in public hospitals, health centers, dispensaries, or health posts. The level of care will influence whether microscopy or RDTs are likely to be used for malaria diagnoses.
■ Patients receiving treatment at the community level
■ Patients receiving treatment in the private sector (if there is a policy supporting this)
■ Adults and children (age groups)
■ Special populations including migrants, displaced populations, refugees, and mobile populations

18 Section 3. Planning for Quantification
sec
tio
n 3
4. Compile the List of Medicinal ProductsThe fourth step is to compile a list of products. Get a copy of the most recent STGs for malaria. Prepare the list of ACTs and RDTs to be quantified, sort it into the order that will best facilitate data collection, and distribute it to those officials and facilities that will enter the data. Note the preference for fixed-dose combinations (FDCs) and pre-packaging for ACTs in patient packs that contain an entire course of treatment. Specifications for each product on the list should include—
■ ACTs• Description of ACT by type• Dosage form, such as tablet• Strength or concentration—for example, 250 milligrams (mg)• Basic unit (BU)8, for ACTs this is a pre-pack• Dispensing pack size in BUs9
• Projected purchase price per BU or per pack
■ RDTs• Description of RDT by type• Test format, such as dipstick, cassette, or card• BU, for RDTs this is a test10
• Pack size• Projected purchase price per BU or per pack
5. Determine What Data Sources Are AvailableThe fifth step is to compile a list of the data sources available for quantification (e.g., consumption data, morbidity data) and evaluating the quality and completeness of the data. Examples of data and data sources include the following—
■ Reliable inventory records ■ Data on population and patient attendance ■ Fever/suspected and confirmed malaria cases ■ Health facility data ■ Surveillance data on cases ■ Health management information system (HMIS) data ■ Standard malaria treatments (ideal and actual) ■ Records of supplier lead times
Planning ChecklistsOnce all five steps have been completed, the 20 questions in the checklist in annex E will help ensure that all required data have been assembled for quantification.
8 The BUs are the lowest unit of ordering and dispensing; these may be tablets, ampoules, test strips, etc. For ACTs, because they are pre-packaged for each weight band, the lowest unit of ordering would be one weight-specific pack and not a tablet. If, by nature of the product such as a pre-packaged treatment course of an ACT, the lowest unit of the product is dispensed by treatment course, the BU would be a treatment course or one pre-pack.
9 Some ACTs are then further packed into a dispensing carton which cannot be split and is therefore the minimum quantity. For example, artemether-lumefantrine (AL) made by Novartis is supplied in a dispensing carton containing 30 strips of the pre-packaged AL. Therefore, orders must be placed in multiples of 30 as the dispensing carton cannot be split for orders.
10 The lowest unit of an RDT that can be used is a single test; therefore, the BU is a test.
Section 4. Data Sources, Assumptions, and Proxy Data for Quantification of ACTs and RDTs 19
sect
ion
4
Section 4. Data Sources, Assumptions, and Proxy Data for Quantification of ACTs and RDTs
FORECASTINGSelect Forecasting Method(s)
Consumption Based§ Build Assumptions§ Calculate Forecasted
Demand for ACTs and RDTs
Morbidity Based§ Build Assumptions§ Calculate Forecasted
Demand for ACTs and RDTs
PLANNING§ Describe the Program§ Define the Scope and Purpose of
the Quantification§ Define the Target Population§ Define What Data are Available
and Sources and Gaps
Collect Required DataOrganize and Analyze Data
Build Assumptions
Procure Quantities Required
Mobilize Additional Resources
Apply Cost ReductionStrategies and Review
Forecasting Assumptions
Collect Required DataOrganize and Analyze Data
Build Assumptions
SUPPLY PLANNING§ Enter Data on Monthly Consumption§ Determine Quantities Required§ Determine Quantities to Order§ Determine When to Place Order§ Compare Budget Available to Cost§ Validate Supply Plan§ Assess Risks and Troubleshoot
QU
AN
TIF
ICA
TIO
N
Funds Su�cient?Increase Funds?
YES YES
NO
NO
Adapted from USAID | DELIVER PROJECT, 2009
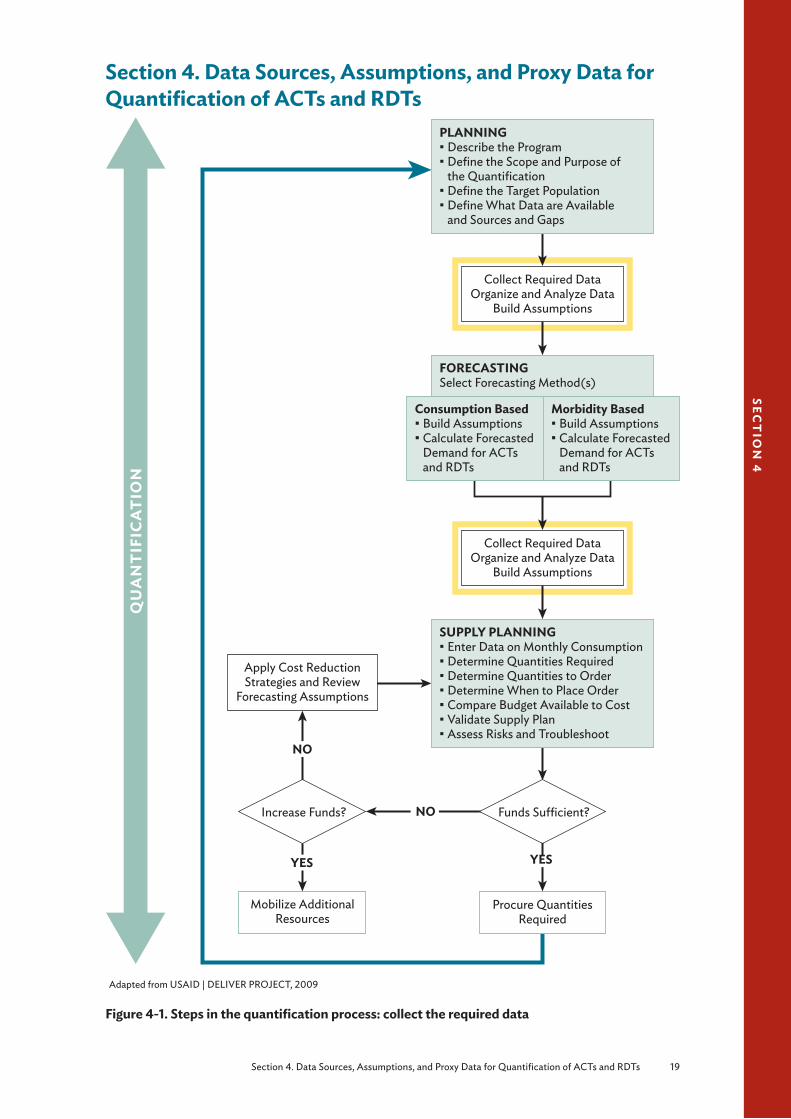
Figure 4-1. Steps in the quantification process: collect the required data
20 Section 4. Data Sources, Assumptions, and Proxy Data for Quantification of ACTs and RDTs
sec
tio
n 4
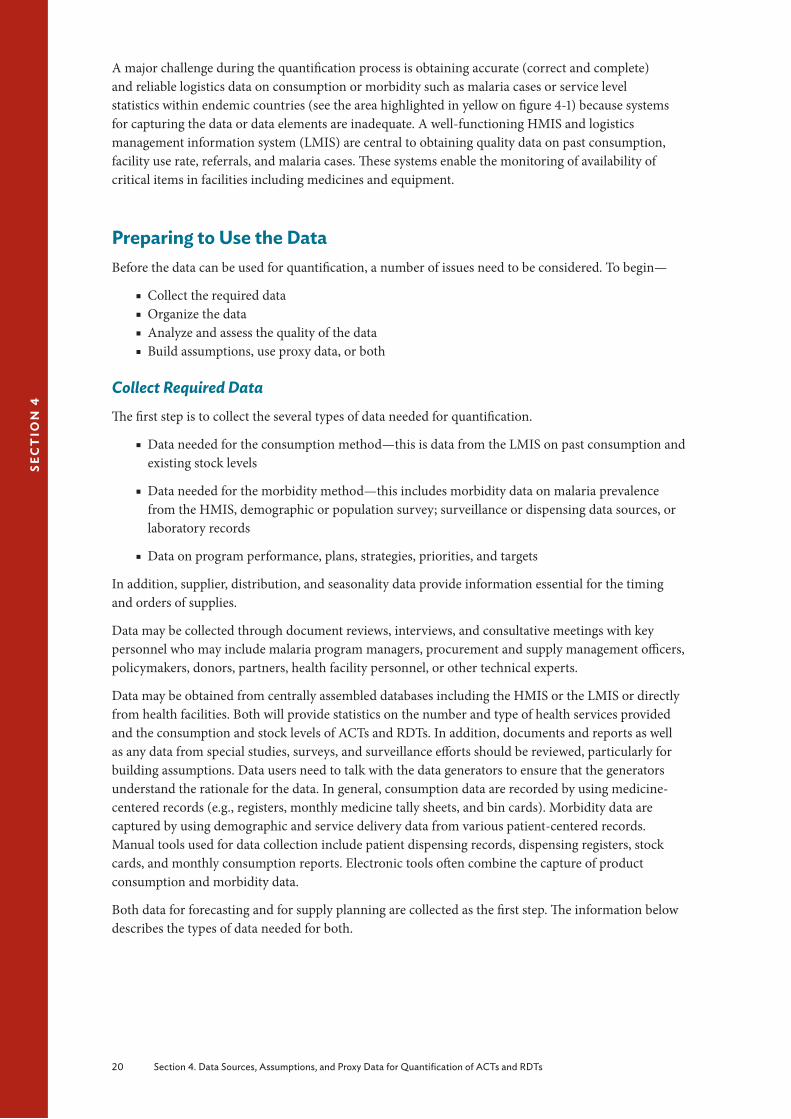
A major challenge during the quantification process is obtaining accurate (correct and complete) and reliable logistics data on consumption or morbidity such as malaria cases or service level statistics within endemic countries (see the area highlighted in yellow on figure 4-1) because systems for capturing the data or data elements are inadequate. A well-functioning HMIS and logistics management information system (LMIS) are central to obtaining quality data on past consumption, facility use rate, referrals, and malaria cases. These systems enable the monitoring of availability of critical items in facilities including medicines and equipment.
Preparing to Use the DataBefore the data can be used for quantification, a number of issues need to be considered. To begin—
■ Collect the required data ■ Organize the data ■ Analyze and assess the quality of the data ■ Build assumptions, use proxy data, or both
Collect Required DataThe first step is to collect the several types of data needed for quantification.
■ Data needed for the consumption method—this is data from the LMIS on past consumption and existing stock levels
■ Data needed for the morbidity method—this includes morbidity data on malaria prevalence from the HMIS, demographic or population survey; surveillance or dispensing data sources, or laboratory records
■ Data on program performance, plans, strategies, priorities, and targets
In addition, supplier, distribution, and seasonality data provide information essential for the timing and orders of supplies.
Data may be collected through document reviews, interviews, and consultative meetings with key personnel who may include malaria program managers, procurement and supply management officers, policymakers, donors, partners, health facility personnel, or other technical experts.
Data may be obtained from centrally assembled databases including the HMIS or the LMIS or directly from health facilities. Both will provide statistics on the number and type of health services provided and the consumption and stock levels of ACTs and RDTs. In addition, documents and reports as well as any data from special studies, surveys, and surveillance efforts should be reviewed, particularly for building assumptions. Data users need to talk with the data generators to ensure that the generators understand the rationale for the data. In general, consumption data are recorded by using medicine-centered records (e.g., registers, monthly medicine tally sheets, and bin cards). Morbidity data are captured by using demographic and service delivery data from various patient-centered records. Manual tools used for data collection include patient dispensing records, dispensing registers, stock cards, and monthly consumption reports. Electronic tools often combine the capture of product consumption and morbidity data.
Both data for forecasting and for supply planning are collected as the first step. The information below describes the types of data needed for both.

Section 4. Data Sources, Assumptions, and Proxy Data for Quantification of ACTs and RDTs 21
sect
ion
4
Data Needed for the Consumption MethodThe main source of consumption data is LMIS. This system contains data on consumption of ACTs and RDTs obtained from dispensing data from the health facilities (e.g., pharmacy, dispensing registers or other point-of-service registers). It also contains data on patients, laboratory, operations, and finance information.
Consumption data is typically retrospective data on the quantities of ACT and RDTs that have been dispensed to patients within a particular period. When these data are not available, reports of stocks of ACTs and RDTs issued or dispensed from the lowest level possible may be used. However, using issues data as a proxy for consumption data can result in an overestimate or underestimate, because the quantities issued (especially in a push system) may not correlate well with the actual quantities dispensed.
Consumption data may be reported monthly or quarterly, and may be aggregated with clinical and patient-specific data to enable observations on whether the consumption of ACTs or RDTs matches the number of cases of suspected malaria or fever. Aggregated consumption data can also be found in the monthly or annual reports to the intermediate (district) or central levels.
Consumption data that comes from large, well-established programs and supply systems that have a full pipeline of products is the most reliable and useful. When based on complete dispensed data (without extended periods of stock-outs or shortages), consumption data accurately reflects previous years’ consumption. Extended periods of stock-outs may cause underreporting because stock outs may influence provider behavior and dispensing (Henson et al. 2011) and consumption might have been much higher if the product had been continuously available; however, if stock-outs are minimal, adjustments can be made.
Similarly, reporting may be incomplete and extrapolation from incomplete data may introduce inaccuracies. Reporting rates of less than 50 percent should be considered unacceptable to use for quantification data. At very low levels of reporting (e.g., less than 50 percent), there will be serious inaccuracies, For example, if no reports are available from a district for an entire first quarter, it will be almost impossible to get accurate consumption data, especially if malaria is seasonal and consumption varies significantly throughout the year.
Data Needed for the Morbidity MethodMorbidity data are used to estimate national-level prevalence of malaria. They are usually available through routine information systems or surveillance or research and extrapolated to obtain national-level estimates. Morbidity data are usually expressed as fever or malaria episodes per 1,000 or 100,000 population, and are available from several sources.
■ Surveys—demographic health surveys (DHS) or malaria indicator surveys. These provide population-based data on patients with febrile episodes or demographic data which provide demographic trends and public health utilization rates. Although some recent surveys have asked whether a diagnostic test was done, these surveys cannot differentiate confirmed cases from clinical cases. Demographic data is collected through surveys and censuses; for example, DHSs are conducted every five years.
Demographic data can also be useful in new programs that have not had time to collect information through an HMIS. However, the data is based on surveys and censuses that may be out of date by the time they are available, so appropriate adjustments and projections must be made. Furthermore, these population-based estimates overestimate the malaria burden and utilization of the public health system and therefore represent the upper boundary of the potential demand of ACTs or RDTs for a program. Nevertheless, demographic data are sometimes the only data source to use when other sources are considered unreliable.

22 Section 4. Data Sources, Assumptions, and Proxy Data for Quantification of ACTs and RDTs
sec
tio
n 4
Malaria indicator surveys are national surveys similar to the DHS, but specific for malaria and include specific data on malaria indicators.
Additional surveys done for a variety of reasons by national or local governments, foreign donors, or others (e.g., malaria situational analysis) may also contain information on malaria indicators.
■ HMIS or pharmaceutical management information systems (PMIS). An HMIS integrates socioeconomic, demographic, mortality, and morbidity information and service statistics. It includes data from health facility records on patients attending the facility, diagnosis (malaria), age or age group, and treatment given. In most cases, this data includes both confirmed cases and clinical cases, and is very rarely disaggregated.
PMIS integrates pharmaceutical data collection, processing, and presentation of information that helps staff at all levels of a country’s health system make evidence-based decisions to manage pharmaceutical services. It includes LMIS.
The HMIS will also provide data on service statistics which is historical data on malaria or fever patients and their visits to health facilities. The information system includes data on the number of patients who received ACTs or the number of patients who were tested using microscopy or RDTs within a given period. This data can be found in malaria program monitoring reports, HMIS data, facility-level data on service utilization, outpatient attendance or inpatient admissions rates, or patient records. When medicines are not dispensed according to the national treatment guidelines, quantification based on service statistics may underestimate or overestimate the quantities issued to patients. For example, if patients with fever are not routinely tested with RDTs to confirm malaria, using data on the number of patients presenting with malaria rather than fever as a proxy for malaria at a health facility will underestimate the actual requirements for ACTs as the patients with fever will often be treated with ACTs. Furthermore, service statistics are often inaccurate or incomplete.
■ Dispensing and laboratory logs. Laboratory data are rarely captured by the HMIS or LMIS and often they are not even aggregated beyond the facility level. In many countries, the only way to collect these data is by manually going through the records at the facility level.
■ Sentinel site surveillance. Sentinel surveillance is the collection and analysis of data by facilities or communities selected for their geographic location, medical specialty, and ability to accurately diagnose and report high quality data on malaria incidence, morbidity, and mortality, progress in achieving goals, and changes in patterns of morbidity and mortality among different age groups in different geographical areas. For example, specific health facilities may be trained to collect data on medicine efficacy or resistance. Generally, because sentinel sites may not represent the general population, the collected data may not apply to the entire population.
■ Malaria strategic plans, Roll Back Malaria roadmaps, work plans, and policy and strategy documents. These documents contain data on program performance, plans, strategies, priorities, and targets that are useful in new situations when implementation is just beginning or when the forecast is for partial scale-up activities.
Data Needed for the Proxy Consumption MethodThis method uses data on malaria incidence, ACT or RDT consumption or use, expenditures from a “standard” supply system, or a combination of the three to extrapolate the consumption or use rate to the target supply system, taking into account population coverage or the service level to be provided.

Section 4. Data Sources, Assumptions, and Proxy Data for Quantification of ACTs and RDTs 23
sect
ion
4
Data Needed for Supply PlanningKey data needed for the supply planning step is the projected monthly consumption of ACTs and RDTs. Other data needed may include—
■ National, program, or regional inventory levels and their expiration dates (to assess whether they will be used before expiration)
■ Quantities on order (i.e., any quantities of products already on order but not yet received)
■ Procurement and supplier lead times
■ Shipment intervals and delivery schedule
■ Established national or program maximum and minimum inventory levels
■ ACT and RDT status—• Registration, prequalification• Are they on the essential medicines list (EML)• Product characteristics
■ Supplier information: prices, packs, shipping, and handling costs
■ Funding and budgetary information: source, timing, disbursement schedule
■ Seasonality
■ Storage capacity
■ Procurement information: procurement mechanisms (e.g., competitive international bidding or donor or national procurement) and their respective lead times.
■ Distribution information: customs clearance, storage and distribution costs, quality control testing costs
Data for forecasting and supply planning may be collected at the same time, such as during meetings or consultative workshops with stakeholders.
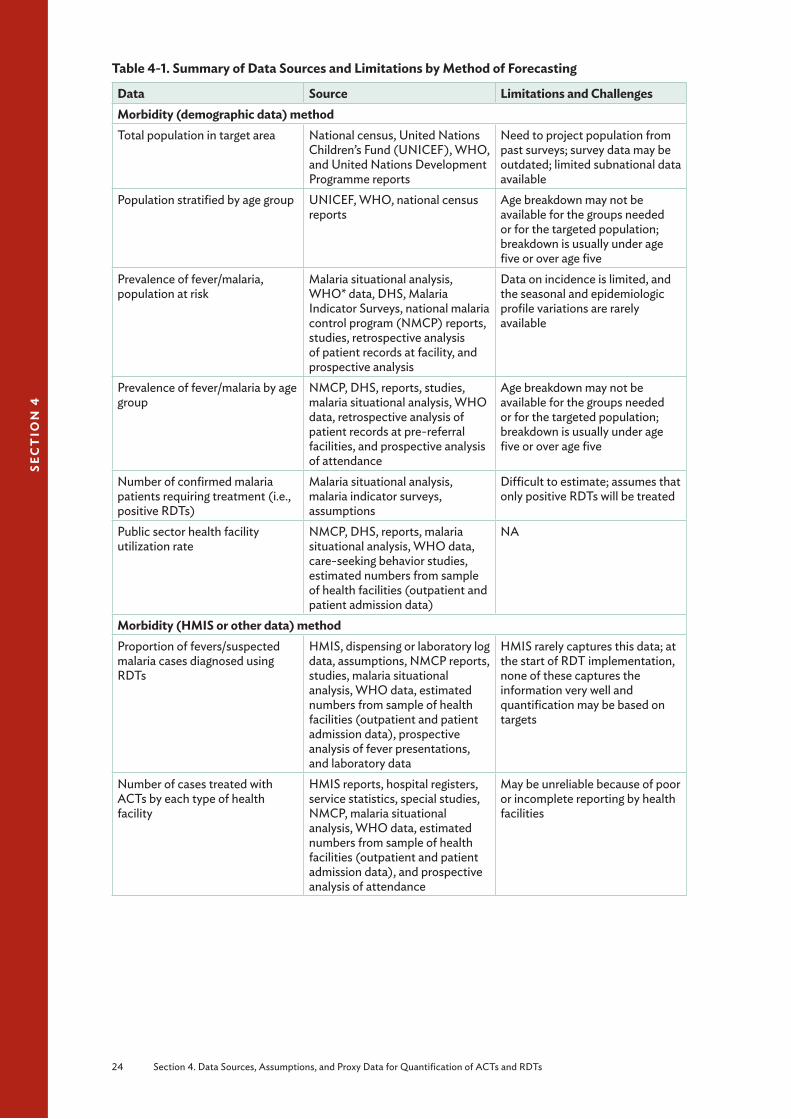
Tables 4-1 and 4-2 present the type of data needed for quantification of antimalarials, their potential sources, and their limitations and challenges.
Organize the DataOnce the data has been collected from the various sources (LMIS, HMIS, DHS, surveillance), the next step is to prepare it for use by organizing the data by type: consumption or morbidity. Program targets may also be included if available and relevant.
For a morbidity-based forecast, the data sources in order of preference are—
■ Data on the number of cases of malaria at the relevant level of care for ACTs or the number of fever cases for RDTs (first choice) from the following sources:
• In an ideal situation and under optimal systems of reporting, data on the actual number of cases requiring treatment at each level of care would be centrally assembled: HMIS, management information systems (MIS), malaria surveillance data.
• In the absence of central-level data, morbidity data may be obtained from a sample of health facilities. Many countries record patient morbidity data in individual health facilities. This is the second data source if the HMIS is not functioning. In this case, data on fever and malaria cases from a representative sample of health facilities may be used to project to the total target population.
24 Section 4. Data Sources, Assumptions, and Proxy Data for Quantification of ACTs and RDTs
sec
tio
n 4
Table 4-1. Summary of Data Sources and Limitations by Method of Forecasting
Data Source Limitations and ChallengesMorbidity (demographic data) methodTotal population in target area National census, United Nations
Children’s Fund (UNICEF), WHO, and United Nations Development Programme reports
Need to project population from past surveys; survey data may be outdated; limited subnational data available
Population stratified by age group UNICEF, WHO, national census reports
Age breakdown may not be available for the groups needed or for the targeted population; breakdown is usually under age five or over age five
Prevalence of fever/malaria, population at risk
Malaria situational analysis, WHO* data, DHS, Malaria Indicator Surveys, national malaria control program (NMCP) reports, studies, retrospective analysis of patient records at facility, and prospective analysis
Data on incidence is limited, and the seasonal and epidemiologic profile variations are rarely available
Prevalence of fever/malaria by age group
NMCP, DHS, reports, studies, malaria situational analysis, WHO data, retrospective analysis of patient records at pre-referral facilities, and prospective analysis of attendance
Age breakdown may not be available for the groups needed or for the targeted population; breakdown is usually under age five or over age five
Number of confirmed malaria patients requiring treatment (i.e., positive RDTs)
Malaria situational analysis, malaria indicator surveys, assumptions
Difficult to estimate; assumes that only positive RDTs will be treated
Public sector health facility utilization rate
NMCP, DHS, reports, malaria situational analysis, WHO data, care-seeking behavior studies, estimated numbers from sample of health facilities (outpatient and patient admission data)
NA
Morbidity (HMIS or other data) methodProportion of fevers/suspected malaria cases diagnosed using RDTs
HMIS, dispensing or laboratory log data, assumptions, NMCP reports, studies, malaria situational analysis, WHO data, estimated numbers from sample of health facilities (outpatient and patient admission data), prospective analysis of fever presentations, and laboratory data
HMIS rarely captures this data; at the start of RDT implementation, none of these captures the information very well and quantification may be based on targets
Number of cases treated with ACTs by each type of health facility
HMIS reports, hospital registers, service statistics, special studies, NMCP, malaria situational analysis, WHO data, estimated numbers from sample of health facilities (outpatient and patient admission data), and prospective analysis of attendance
May be unreliable because of poor or incomplete reporting by health facilities

Section 4. Data Sources, Assumptions, and Proxy Data for Quantification of ACTs and RDTs 25
sect
ion
4
Data Source Limitations and ChallengesMorbidity and consumption methodsSTGs (actual prescribing practice versus ideal)
National essential medicine program, WHO, Ministry of Health, NMCP, surveys
Guidelines may propose different medicines for the same condition; parenteral treatment duration varies between patients depending on clinical evolution; STGs not always used by health providers
Records of losses of antimalarials CMSs, health facilities, LMIS Data on losses are often not systematically recorded at central level, and facilities do not consistently report losses
Consumption methodAmount of product consumed; percentage increase in consumption and number of days out of stock (match the consumption for the procurement period (PP) with the same PP in previous year for seasonal usage
PMIS, LMIS Data may be limited
Proxy consumption methodAbove data from a comparison area or system with good per capita data on consumption, patient attendance, service level, and morbidity
As above Finding a comparison area or system that matches the target area
* World Malaria Reports
Table 4-2. Summary of Data Sources and Limitations for Supply Planning
Data Source Limitations and ChallengesSupplier and donor lead times Suppliers and donors May be difficult to get this
information accuratelyRecords of inventory position (stocks on hand, expiry date, shelf life, and on order), storage space
Central, district, and health facility stock cards, inventory management records, health facility stock cards
Data from stock cards may be lacking or inaccurate; reporting back to district and central level on stock levels maybe limited
Procurement period Procurement unit May be difficult to get this information

26 Section 4. Data Sources, Assumptions, and Proxy Data for Quantification of ACTs and RDTs
sec
tio
n 4
■ Data on the prevalence of uncomplicated malaria in the population (second choice):
■ When data is not available on the number of cases at each facility likely to treat malaria patients, the next option is to obtain data on the number of malaria cases in the entire population (from DHS or MIS). These data can be further broken down into the cases at public and private facilities. The calculation will require applying assumptions as explained in figure 4-4 and table 4-3.
■ Data on outpatient attendances (third choice): In the absence of all the above, the quantification team can use data on outpatient attendances and apply assumptions to estimate the proportion of outpatient attendances because of fever and malaria.
■ Data on the total population (fourth choice): If no data exist on the prevalence of uncomplicated malaria in the country, the total population may be used as the starting point. Assumptions may then be applied to calculate the uncomplicated malaria cases in the population presenting at all health facilities. The source of these assumptions can be a selected sample of facilities that can be considered representative on the proportion of outpatient attendances due to fever or from a country or area with a similar epidemiology and burden of malaria.
Figure 4-4 demonstrates the process depending on the data available including where assumptions need to be made.
A2
A3 A4 A5Fever cases in facilities
Possible data
Suspected malaria cases
Confirmed malaria cases
Number of ACTs
required
Number of ACT required by age group
A1
Fever cases in
population
Population
Legend
AssumptionA1 Fever prevalence (by age group)A2 Public sector use rateA3 Proportion of cases diagnosed using RDTsA4 Proportion of cases treated with ACTs A5 Treatment episodes by age group
Figure 4-2. Calculating need for the public sector based on the morbidity-based method
For a consumption-based forecast, the data sources in order of preference are—
1. Accurate dispensing level data from facilities
2. Lowest level data (aggregated) on stocks issued11 (e.g., from the district level)
3. Central-level data on stocks issued
Analyze and Assess the Data QualityA critical next step is to assess the quality of the data: can the data be used for the quantification and to assess the gaps? Some factors to consider in the assessment of data quality include—
11 Stocks issued from the central or district levels are often used as proxy for actual consumption.
Section 4. Data Sources, Assumptions, and Proxy Data for Quantification of ACTs and RDTs 27
sect
ion
4
■ Facility reporting rate. The data must be adjusted to account for imperfect reporting rates. For example, if 90 percent of facilities are reporting consumption of ACTs and RDTs (A), the forecast figure must be adjusted to account for 10 percent that are not reporting (A × 100/90).
■ Length of time of stock-outs. These data can be obtained from a sample of stock cards. If the program has experienced prolonged periods of stock-outs of ACTs or RDTs, historical consumption data will underestimate the future consumption and adjustments will be required for the stock-out periods. Stock-out periods of more than three months or occurring during periods of seasonal transmission are likely to render these data inadequate for use in quantification.
■ History of the program. Is the current performance of the program an accurate reflection of the future? Will this affect the future demand for ACTs or RDTs?
■ Rate of program scale-up, performance and targets. Estimates of the rate of scale up needs to be built into future estimates.
■ Age of data. In general, the older the data, the less likely it reflects the current status of the system.
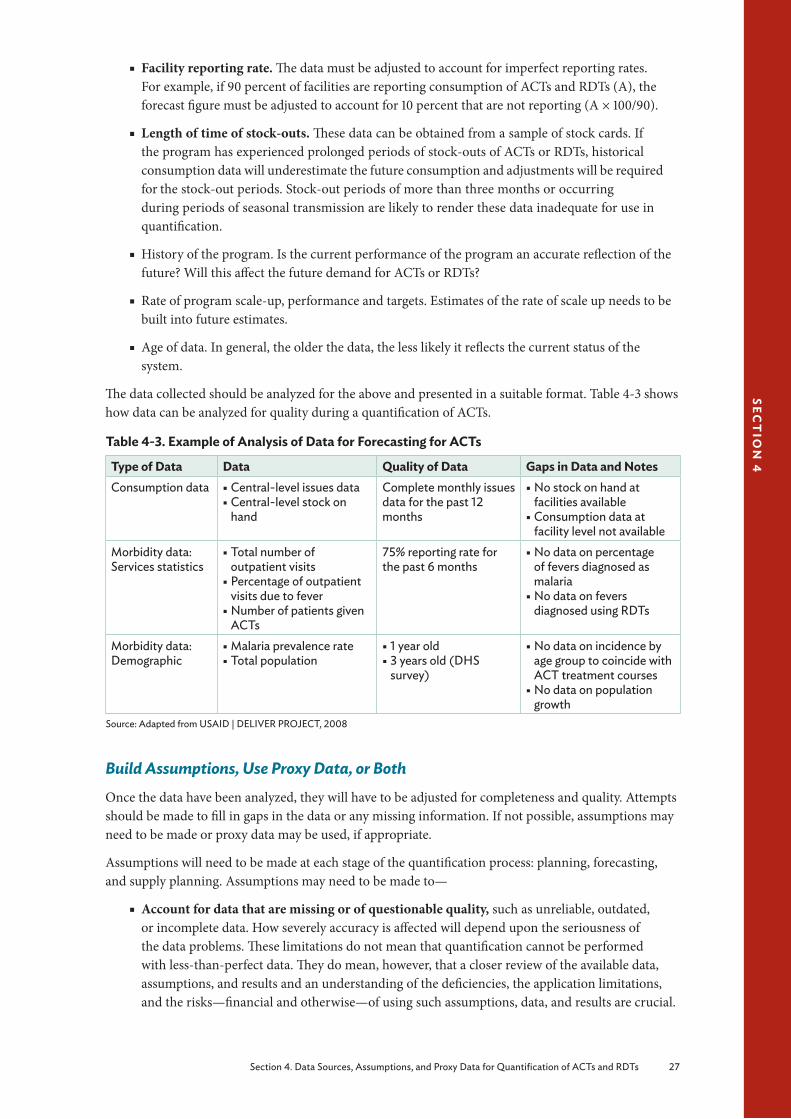
The data collected should be analyzed for the above and presented in a suitable format. Table 4-3 shows how data can be analyzed for quality during a quantification of ACTs.
Table 4-3. Example of Analysis of Data for Forecasting for ACTs
Type of Data Data Quality of Data Gaps in Data and NotesConsumption data § Central-level issues data
§ Central-level stock on hand
Complete monthly issues data for the past 12 months
§ No stock on hand at facilities available
§ Consumption data at facility level not available
Morbidity data: Services statistics
§ Total number of outpatient visits
§ Percentage of outpatient visits due to fever
§ Number of patients given ACTs
75% reporting rate for the past 6 months
§ No data on percentage of fevers diagnosed as malaria
§ No data on fevers diagnosed using RDTs
Morbidity data: Demographic
§ Malaria prevalence rate § Total population
§ 1 year old § 3 years old (DHS survey)
§ No data on incidence by age group to coincide with ACT treatment courses
§ No data on population growth
Source: Adapted from USAID | DELIVER PROJECT, 2008
Build Assumptions, Use Proxy Data, or BothOnce the data have been analyzed, they will have to be adjusted for completeness and quality. Attempts should be made to fill in gaps in the data or any missing information. If not possible, assumptions may need to be made or proxy data may be used, if appropriate.
Assumptions will need to be made at each stage of the quantification process: planning, forecasting, and supply planning. Assumptions may need to be made to—
■ Account for data that are missing or of questionable quality, such as unreliable, outdated, or incomplete data. How severely accuracy is affected will depend upon the seriousness of the data problems. These limitations do not mean that quantification cannot be performed with less-than-perfect data. They do mean, however, that a closer review of the available data, assumptions, and results and an understanding of the deficiencies, the application limitations, and the risks—financial and otherwise—of using such assumptions, data, and results are crucial.
28 Section 4. Data Sources, Assumptions, and Proxy Data for Quantification of ACTs and RDTs
sec
tio
n 4
■ Estimate the effect of key programmatic and environmental factors expected to influence the demand for commodities. The quantification team will need to develop and agree on assumptions about the factors and interventions that may affect future changes in demand for services and ACTs and RDTs, for example, population to be treated and scale-up goals.12
Making Assumptions for Forecasting of ACTs and RDTsThe quantification team will need to reach a consensus on the assumptions that will be used (see below). The more assumptions made in the quantification process, the less accurate the end result will be. In most cases, assumptions are made on the basis of empirical data from retrospective studies, prospective surveys, anecdotal data, or expert opinions.
Assumptions made to account for data that are incomplete or of questionable quality
Consumption-based method
■ Use stock issued as the proxy for consumption.
■ During periods of stock-outs, assume that consumption continues at the same rate and adjust.
■ Adjust for completeness of reporting based on (weighted) population and not based on reporting rate.
■ Assume that consumption will continue at the same level as during the review period or changes by a proportion.
Morbidity method
■ Prevalence of malaria. Data available through the HMIS or DHS includes both confirmed cases and clinical cases which are an overestimate of actual malaria cases and are often not available by age/weight group (HMIS data only provides data on children under the age of 18). Assumptions on morbidity breakdown by age can be applied to get estimates.
■ The weight/age bands for ACTs will further determine the needed population breakdown by cases. When projecting the number of malaria cases by age-group, the age/weight bands for ACTs must be correlated by age and weight of the cases or population and adjusted for patient growth.13
Assumptions made to estimate the effect of key programmatic and environmental factors
■ Rate of access or use of public health services. Access may increase or decrease with changes to public health services. For example, increased availability of ACTs in the public health sector will likely increase public health services use.
■ Adjustments for population change, distribution, decline, or movement (e.g., refugees, migrants, or displaced persons). A review of census data may provide information on the percentage of population growth anticipated as well as population distribution. These changes will affect both morbidity- and consumption-based calculations and, consequently, will affect forecast and supply planning.
■ Adjustments for changes in demand. Program plans that may change future demand need to be evaluated, including scale-up plans or potential reductions in malaria transmission.
■ Changes in malaria epidemiology. Any changes in malaria epidemiology and transmission patterns resulting from climate change, prevention scale-up, and treatment will need to be built into the assumptions.
12 Scaling up of programs generally roll out much slower than expected and decisions on these factors must be made.13 For the two lower age bands for AS/AQ, the team should determine if there have been significant stock-outs and may choose to
overestimate for these ACT products.

Section 4. Data Sources, Assumptions, and Proxy Data for Quantification of ACTs and RDTs 29
sect
ion
4
■ Changes in financing available for the procurement of ACTs and RDTs. While financing should not encourage countries to reduce or limit forecasts, accurate quantification can be used to advocate for funding gaps for procurement.
■ Anticipated rate of scale-up or rollout of ACTs and RDTs. Many programs are scaling up malaria diagnosis and rolling out the diagnosis and treatment strategies in the community. These changing needs must be estimated and accounted for.
■ Changes in national or site-level treatment guidelines. These changes may include the addition of RDTs, alternative first-line treatments (two ACTs used as first-line treatment depending on availability), or changing to FDC from pre-packaged product, dosages, or regimens. If changes are planned, get as much information on these changes as early as possible to incorporate changing demand.
■ Emergence of new products on the market, for example, the availability of dispersible AL for children.
■ Changes in the cost of products (e.g., availability to ACTs or RDTs for no charge is likely to increase the demand for them).
■ Seasonality of malaria. Changes in the demand for ACTs and RDTs throughout the year will affect the supply planning and delivery schedules for the year. If the quantification is performed annually, the quantities to be ordered and delivered will need to be adjusted to reflect the changing demand throughout the year.
■ Changes in rainfall patterns and epidemics. Malaria epidemics are likely to increase with changing climate conditions (e.g., rainfall patterns and floods, El Niño). Good epidemic surveillance may be able to predict these changes so corresponding adjustments may be made. In this case, the total forecasted amount for the year will change.
■ Prescribing practice and information, education, and communication. Training and behavior change interventions to improve prescribing practices or information, education, and communication messages to the community are likely to change the demand.
■ Changes in care-seeking behavior. Such changes are likely to influence the use of RDTs and ACTs.
■ Changes in the diagnostic criteria. Expanding the availability of diagnostics (i.e., microscopy and RDTs) is likely to reduce the number of ACT treatments in the medium and long term, provided the health worker has confidence in the tests. The treatment number can be estimated using data on the fever cases that turn out to be malaria using data from laboratory logs (from microscopy or RDTs) that record test results. The policy on what to do when a negative result is obtained must be accounted for as well as the proportion of health workers that will adhere to test results.14 Furthermore, the criteria for using the tests may change over time as the epidemiological profiles (endemic and epidemic) changes (e.g., moving from passive case detection to active case detection).
Using Proxy Data for the Forecasting of ACTs and RDTsIn the absence of any data on malaria cases or incidence/prevalence, the proxy incidence data in table 4-4 may be used (World Malaria Report 2008) for areas of high and low malaria transmission and for southern Africa. These estimates can then be applied to the population to obtain the estimated number of expected malaria cases.
14 The number of positive RDTs/blood slides to ACT prescriptions in selected health facilities will give an estimate of adherence to results

30 Section 4. Data Sources, Assumptions, and Proxy Data for Quantification of ACTs and RDTs
sec
tio
n 4
Table 4-4 Median Malaria Case Incidence Rates by Transmission Risk Category (Cases per Person per Year)
Age High Transmission Low Transmission Southern AfricaRuralUnder 5 years 1.424 0.182 0.0295–14 years 0.587 0.182 0.029≥15 years 0.107 0.091UrbanUnder 5 years 0.712 0.182 0.0295–14 years 0.587 0.182 0.029≥15 years 0.107 0.091 0.029
Making Assumptions for Supply Planning for ACTs and RDTsThese assumptions, common to all methods, will affect the amount of ACTs and RDTs that will be procured.
■ Timing of available funds and disbursements. Depending on the source of funding, this information can be obtained from the Ministry of Finance or from the donor. The Global Fund to Fight AIDS, Tuberculosis and Malaria (Global Fund) disbursements are made upon successful reporting of indictors for the previous quarter. The local fund agent and the fund portfolio manager may have this information.
■ Estimated arrival dates for ACTs and RDTs. Time needed for customs clearance, and delivery to the central warehouse will affect when the orders are placed.
■ Minimum and maximum stock levels at each level of the logistics system (central, intermediary, and facility levels). If these levels have not been established, assumptions will need to be made. In the absence of any evidence-based method for calculating minimum and maximum stock levels, using a minimum of six months of stock and a maximum of nine months is reasonable (Section 7. Supply Planning).
■ Cost of ACTs and RDTs. In the absence of actual cost data, from the CMS or the supplier, estimate the cost of antimalarials from other sources, such as the MSH International Drug Price Indicator Guide (MSH 2010) or other reliable guide.
■ Seasonal variations in the consumption of ACTs and RDTs or cases of malaria. Calculate the quarterly demand and set up the delivery schedule for ACTs and RDTs based on seasonality. The assumption is that historical trends in seasonality are a reflection of future trends, and hence, demand for ACTs and RDTs. Seasonal changes in demand can be estimated using plotted graphs on consumption or cases in facility throughout the year. Consumption of RDTs is likely to be less seasonal than ACTs, as fever prevalence can be relatively stable throughout the year independent of malaria seasons.
■ Procurement and supplier lead time. This information is an estimate and can be obtained from the supplier and includes the time taken for the following—• Ordering• Processing of order• Transportation• Customs clearance

Section 5. Forecasting 31
sect
ion
5
Section 5. Forecasting
FORECASTINGSelect Forecasting Method(s)
Consumption Based§ Build Assumptions§ Calculate Forecasted
Demand for ACTs and RDTs
Morbidity Based§ Build Assumptions§ Calculate Forecasted
Demand for ACTs and RDTs
PLANNING§ Describe the Program§ Define the Scope and Purpose of
the Quantification§ Define the Target Population§ Define What Data are Available
and Sources and Gaps
Collect Required DataOrganize and Analyze Data
Build Assumptions
Procure Quantities Required
Mobilize Additional Resources
Apply Cost ReductionStrategies and Review
Forecasting Assumptions
Collect Required DataOrganize and Analyze Data
Build Assumptions
SUPPLY PLANNING§ Enter Data on Monthly Consumption§ Determine Quantities Required§ Determine Quantities to Order§ Determine When to Place Order§ Compare Budget Available to Cost§ Validate Supply Plan§ Assess Risks and Troubleshoot
QU
AN
TIF
ICA
TIO
N
Funds Su�cient?Increase Funds?
YES YES
NO
NO
Adapted from USAID | DELIVER PROJECT, 2009
Figure 5-1. Steps in the quantification process for forecasting

32 Section 5. Forecasting
sec
tio
n 5
Select Forecasting MethodAfter organizing and analyzing the available data, the quantification team needs to select the forecasting method (figure 5-1).
Forecasting for both ACTs and RDTs can be done with either the consumption or the morbidity method—the choice depends on the data available. In practice, it will be a blend of both methods, especially if RDTs are being introduced for the first time.
The consumption method uses records of past consumption of individual medicines or products (adjusted for stock-outs and projected changes in use) to project future needs. In many instances, the consumption approach is the simplest method for quantifying pharmaceutical needs, provided the source data is complete, accurate, and properly adjusted for stock-out periods and anticipated changes in demand and use. However, this approach has the potential to perpetuate irrational use by continuing to supply quantities of medicines that may not be prescribed according to the standard diagnosis and treatment guidelines.
The proxy consumption method, a type of consumption method, uses data on malaria incidence, ACT or RDT consumption or use, expenditures from a “standard” supply system, or a combination of the three to extrapolate the consumption or use rate to the target supply system, taking into account population coverage or the service level to be provided. The proxy consumption method is generally used in the case of a severe information deficit and when consumption and the morbidity methods are not feasible (e.g., in new programs, with new treatment guidelines, or when data are simply not available due to poor information systems). The proxy consumption method can also be population-based, defining medicine use per 1,000 people; or service-based, defining medicine use per specified patient case, inpatient admission, or rural health center visits.
The morbidity method estimates the need for specific medicines or products on the basis of the incidence or prevalence of uncomplicated malaria (using demographic data), expected number of health care facility visits (using service delivery data), and standard treatment patterns for the disease (i.e., STGs). The morbidity-based quantification remains the best alternative for estimating procurement and budget needs in a supply system or facility in a new program with no previous consumption history or when the malaria treatment guidelines have been revised.
Table 5-1 presents a summary of the data needed by each method of quantification and the recommended applications.
Consumption data are often unreliable in many countries and malaria managers will most likely use the morbidity-based method to quantify for most malaria commodities (ACTs and RDTs) until information management systems can accurately capture, analyze and report actual consumption.
While the data needed for supply planning is the same no matter which method is used, in many cases, morbidity trends (cases) can be used to inform timing of supplies based on spikes. Irrespective of the forecasting method used, the results should be triangulated and validated with the other quantification methods, if possible, and the output of the forecast will be the projected quantity of ACTs and RDTs expected to be consumed during the defined quantification period.

Section 5. Forecasting 33
sect
ion
5
Table 5-1. Data Needed to Quantify ACTs and RDTs by Method
Method Applications Data Needed LimitationsConsumption Used when historical
consumption data are available and if the consumption pattern remains unchanged
Reliable inventory or consumption records of medicine used for uncomplicated malaria
§ Must have accurate consumption data
§ Can perpetuate irrational use
Proxyconsumption
§ Used when other methods are unreliable
§ Used in the case of extreme information deficit
§ Uses data from other areas and supply systems
Reliable inventory or consumption records of medicine used for uncomplicated malaria from a comparison area or system with good per capita data on consumption, patient attendance, service level, and morbidity
Finding a comparison area or system that matches the target area
Morbidity Used when no consumption data exists, particularly in new programs, new treatments, or in rapidly changing programs
Number of cases at health facilities, incidences in population and in facilities, patient attendance, and standard treatments (ideal, actual)
Morbidity data are not available for all diseasesAccurate attendance data are not availableStandard treatments may not really be used
Approaches for ACT and RDT ForecastingImplementation including stock outs and changes in consumption patterns of RDTs can directly impact subsequent ACT adjustments. Therefore, forecasting for ACTs and RDTs should begin with estimating the needs for RDTs.
The choice of an approach for ACT or RDT quantification will depend on whether an area has the following:
■ A new treatment or testing policy without reliable morbidity or consumption data (e.g., emergency deployment or new community care programs). In this case, the estimation of requirements will be based on the population to be served, implementation capacity (e.g., capacity to perform tests), or program targets. Data and estimations required include the population for the catchment area, the number of treatments to be dispensed, or tests expected to be performed each day. For RDTs, this would be based on national averages of the expected number of fever cases, or the number of qualified or trained personnel and their daily capacity for performing the tests or diagnostic targets. Alternatively, apply the proxy consumption method using data from a standard area.
■ Reliable morbidity (surveillance) data but no reliable RDT consumption data. In this case, there may be a new treatment policy with no consumption data or poor records of consumption. HMIS and malaria surveillance data will provide morbidity information on malaria prevalence or the number of reported fever or malaria cases in health facilities. In some cases, the tested cases as well as the number of positive cases (i.e., tested and confirmed malaria) may be available.15 These data provide information on the number of patients who are likely to be tested with RDTs. Estimates therefore have to be adjusted according to any plans for scale-up (or contraction) of microscopy services.
■ Reliable malaria morbidity and reliable consumption data. Use the consumption method, but validate with the morbidity method using malaria surveillance data. The minimum data needed for quantification will be historic records of actual monthly consumption for the RDTs
15 Only some HMIS systems collect this data, although it can be culled from laboratory logs.
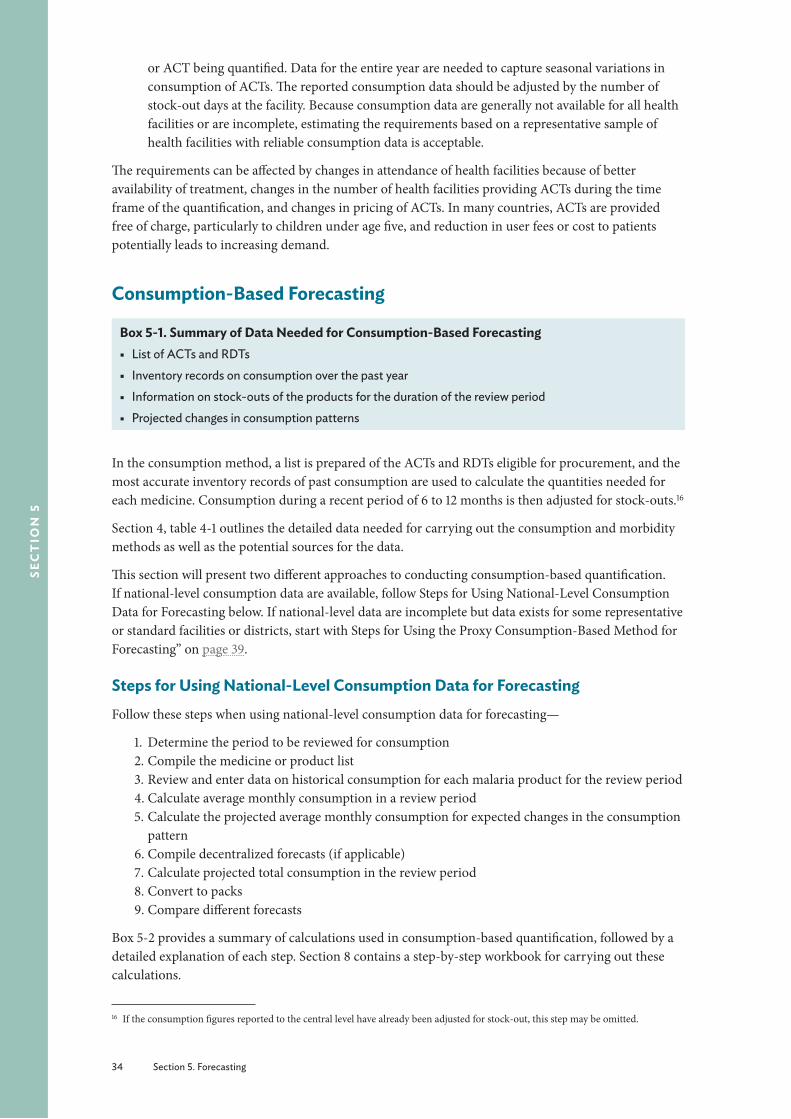
34 Section 5. Forecasting
sec
tio
n 5
or ACT being quantified. Data for the entire year are needed to capture seasonal variations in consumption of ACTs. The reported consumption data should be adjusted by the number of stock-out days at the facility. Because consumption data are generally not available for all health facilities or are incomplete, estimating the requirements based on a representative sample of health facilities with reliable consumption data is acceptable.
The requirements can be affected by changes in attendance of health facilities because of better availability of treatment, changes in the number of health facilities providing ACTs during the time frame of the quantification, and changes in pricing of ACTs. In many countries, ACTs are provided free of charge, particularly to children under age five, and reduction in user fees or cost to patients potentially leads to increasing demand.
Consumption-Based Forecasting
Box 5-1. Summary of Data Needed for Consumption-Based Forecasting § List of ACTs and RDTs
§ Inventory records on consumption over the past year
§ Information on stock-outs of the products for the duration of the review period
§ Projected changes in consumption patterns
In the consumption method, a list is prepared of the ACTs and RDTs eligible for procurement, and the most accurate inventory records of past consumption are used to calculate the quantities needed for each medicine. Consumption during a recent period of 6 to 12 months is then adjusted for stock-outs.16
Section 4, table 4-1 outlines the detailed data needed for carrying out the consumption and morbidity methods as well as the potential sources for the data.
This section will present two different approaches to conducting consumption-based quantification. If national-level consumption data are available, follow Steps for Using National-Level Consumption Data for Forecasting below. If national-level data are incomplete but data exists for some representative or standard facilities or districts, start with Steps for Using the Proxy Consumption-Based Method for Forecasting” on page 39.
Steps for Using National-Level Consumption Data for ForecastingFollow these steps when using national-level consumption data for forecasting—
1. Determine the period to be reviewed for consumption2. Compile the medicine or product list3. Review and enter data on historical consumption for each malaria product for the review period4. Calculate average monthly consumption in a review period5. Calculate the projected average monthly consumption for expected changes in the consumption
pattern6. Compile decentralized forecasts (if applicable)7. Calculate projected total consumption in the review period8. Convert to packs9. Compare different forecasts
Box 5-2 provides a summary of calculations used in consumption-based quantification, followed by a detailed explanation of each step. Section 8 contains a step-by-step workbook for carrying out these calculations.
16 If the consumption figures reported to the central level have already been adjusted for stock-out, this step may be omitted.
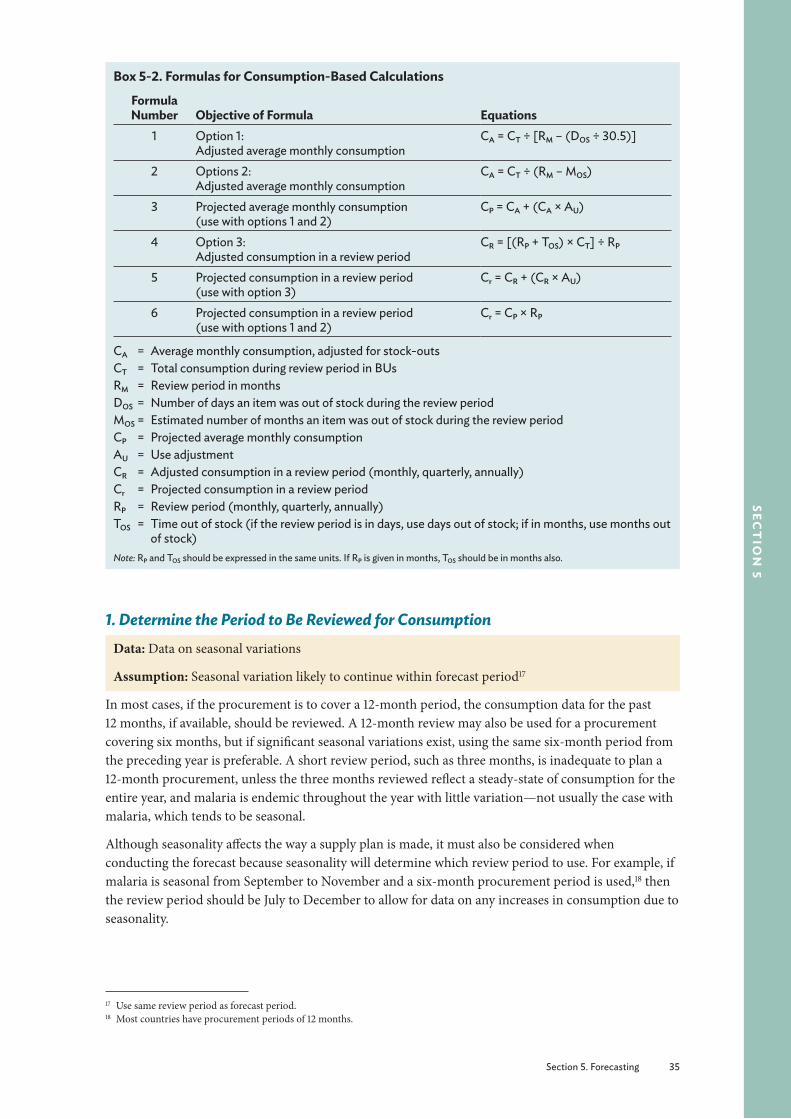
Section 5. Forecasting 35
sect
ion
5
Box 5-2. Formulas for Consumption-Based Calculations
Formula Number Objective of Formula Equations
1 Option 1: Adjusted average monthly consumption
CA = CT ÷ [RM – (DOS ÷ 30.5)]
2 Options 2:Adjusted average monthly consumption
CA = CT ÷ (RM – MOS)
3 Projected average monthly consumption (use with options 1 and 2)
CP = CA + (CA × AU)
4 Option 3:Adjusted consumption in a review period
CR = [(RP + TOS) × CT] ÷ RP
5 Projected consumption in a review period (use with option 3)
Cr = CR + (CR × AU)
6 Projected consumption in a review period (use with options 1 and 2)
Cr = CP × RP
CA = Average monthly consumption, adjusted for stock-outsCT = Total consumption during review period in BUsRM = Review period in monthsDOS = Number of days an item was out of stock during the review periodMOS = Estimated number of months an item was out of stock during the review periodCP = Projected average monthly consumptionAU = Use adjustmentCR = Adjusted consumption in a review period (monthly, quarterly, annually)Cr = Projected consumption in a review periodRP = Review period (monthly, quarterly, annually)TOS = Time out of stock (if the review period is in days, use days out of stock; if in months, use months out
of stock)Note: RP and TOS should be expressed in the same units. If RP is given in months, TOS should be in months also.
1. Determine the Period to Be Reviewed for ConsumptionData: Data on seasonal variations
Assumption: Seasonal variation likely to continue within forecast period17
In most cases, if the procurement is to cover a 12-month period, the consumption data for the past 12 months, if available, should be reviewed. A 12-month review may also be used for a procurement covering six months, but if significant seasonal variations exist, using the same six-month period from the preceding year is preferable. A short review period, such as three months, is inadequate to plan a 12-month procurement, unless the three months reviewed reflect a steady-state of consumption for the entire year, and malaria is endemic throughout the year with little variation—not usually the case with malaria, which tends to be seasonal.
Although seasonality affects the way a supply plan is made, it must also be considered when conducting the forecast because seasonality will determine which review period to use. For example, if malaria is seasonal from September to November and a six-month procurement period is used,18 then the review period should be July to December to allow for data on any increases in consumption due to seasonality.
17 Use same review period as forecast period.18 Most countries have procurement periods of 12 months.
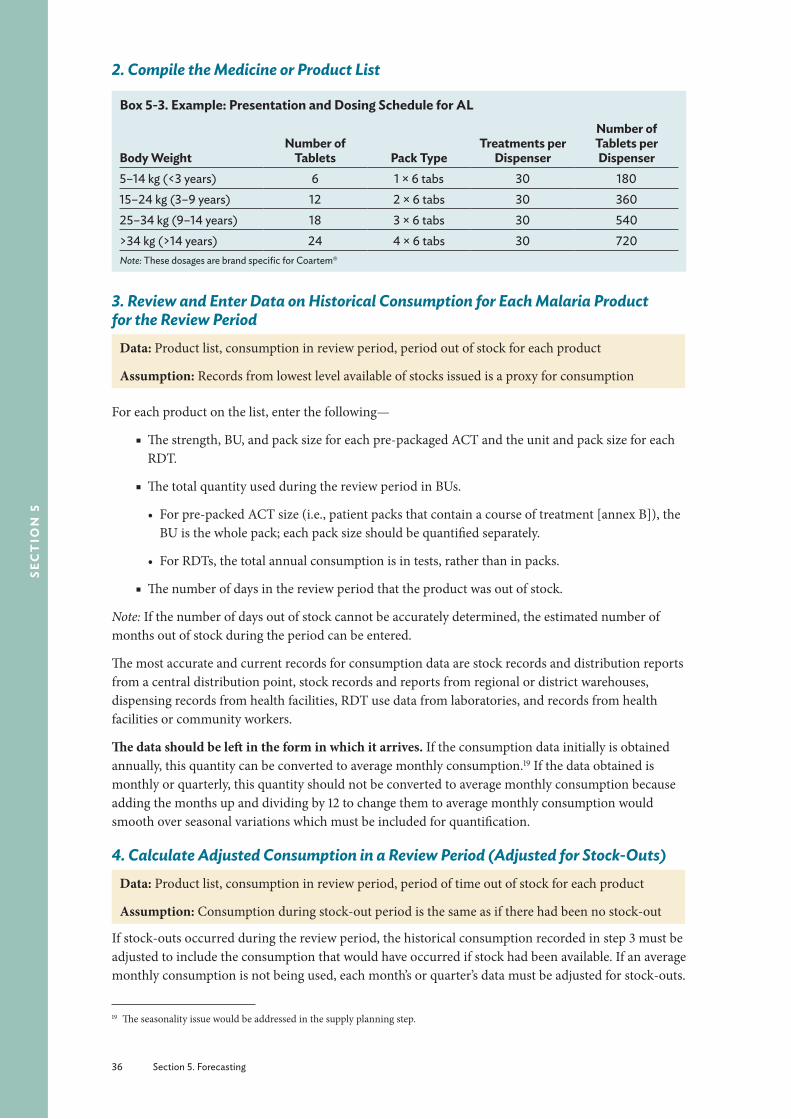
36 Section 5. Forecasting
sec
tio
n 5
2. Compile the Medicine or Product List
Box 5-3. Example: Presentation and Dosing Schedule for AL
Body WeightNumber of
Tablets Pack TypeTreatments per
Dispenser
Number of Tablets per Dispenser
5–14 kg (<3 years) 6 1 × 6 tabs 30 18015–24 kg (3–9 years) 12 2 × 6 tabs 30 36025–34 kg (9–14 years) 18 3 × 6 tabs 30 540>34 kg (>14 years) 24 4 × 6 tabs 30 720Note: These dosages are brand specific for Coartem®
3. Review and Enter Data on Historical Consumption for Each Malaria Product for the Review Period
Data: Product list, consumption in review period, period out of stock for each product
Assumption: Records from lowest level available of stocks issued is a proxy for consumption
For each product on the list, enter the following—
■ The strength, BU, and pack size for each pre-packaged ACT and the unit and pack size for each RDT.
■ The total quantity used during the review period in BUs.
• For pre-packed ACT size (i.e., patient packs that contain a course of treatment [annex B]), the BU is the whole pack; each pack size should be quantified separately.
• For RDTs, the total annual consumption is in tests, rather than in packs.
■ The number of days in the review period that the product was out of stock.
Note: If the number of days out of stock cannot be accurately determined, the estimated number of months out of stock during the period can be entered.
The most accurate and current records for consumption data are stock records and distribution reports from a central distribution point, stock records and reports from regional or district warehouses, dispensing records from health facilities, RDT use data from laboratories, and records from health facilities or community workers.
The data should be left in the form in which it arrives. If the consumption data initially is obtained annually, this quantity can be converted to average monthly consumption.19 If the data obtained is monthly or quarterly, this quantity should not be converted to average monthly consumption because adding the months up and dividing by 12 to change them to average monthly consumption would smooth over seasonal variations which must be included for quantification.
4. Calculate Adjusted Consumption in a Review Period (Adjusted for Stock-Outs)Data: Product list, consumption in review period, period of time out of stock for each product
Assumption: Consumption during stock-out period is the same as if there had been no stock-out
If stock-outs occurred during the review period, the historical consumption recorded in step 3 must be adjusted to include the consumption that would have occurred if stock had been available. If an average monthly consumption is not being used, each month’s or quarter’s data must be adjusted for stock-outs.
19 The seasonality issue would be addressed in the supply planning step.

Section 5. Forecasting 37
sect
ion
5
There are three options to adjust for stock-outs when computing average monthly consumption.
Method 1, which adjusts for stock-outs, is used if the data obtained was aggregated in an annual form. It is shown as formula 1 in box 5-2.
Enter the total consumption, and divide it by the number of months in the review period minus the result of the following calculation: the total number of days out of stock in the same period divided by 30.5 to convert to months. Therefore, the average monthly consumption is—
CA = CT ÷ [RM – (DOS ÷ 30.5)]
WhereCA = Average monthly consumption, adjusted for stock-outsCT = Total consumption during review period, in BUsRM = Total consumption review period, in monthsDOS = Number of days an item was out of stock during the review period
Method 2, which is simpler but less precise, uses the estimated number of months out of stock for adjusting consumption, thereby omitting the step of converting days to months. It is shown as formula 2 in box 5-2. The adjusted average monthly consumption is—
CA = CT ÷ (RM – MOS)
WhereCA = Average monthly consumption, adjusted for stock-outsCT = Total consumption during review period, in BUsRM = Total consumption review period, in monthsMOS = Estimated number of months an item was out of stock during the review period
In formulas 1 and 2, the average monthly consumption adjusted for stock-outs can then be multiplied by the review period to convert it to the adjusted consumption for the review period—
Cr = CP × RP
WhereCr = Projected consumption in a review periodCA = Average monthly consumption, adjusted for stock-outsRP = Review period (monthly, quarterly, annually)
Method 3, which calculates the adjusted consumption in a review period, is used if the data obtained was for monthly consumption, and if an average monthly consumption is not being used. In this case, each month’s or quarter’s data must be adjusted for stock-outs (formula 4).
CR = [(RP + TOS) × CT] ÷ RP
WhereCR = Adjusted consumption in a review period (monthly, quarterly, annual)CT = Total consumption during the review periodRP = Review period (months, quarter, annual)TOS = Time out of stock (if the review period is in days, use days out of stock; if in months, use
months out of stock)
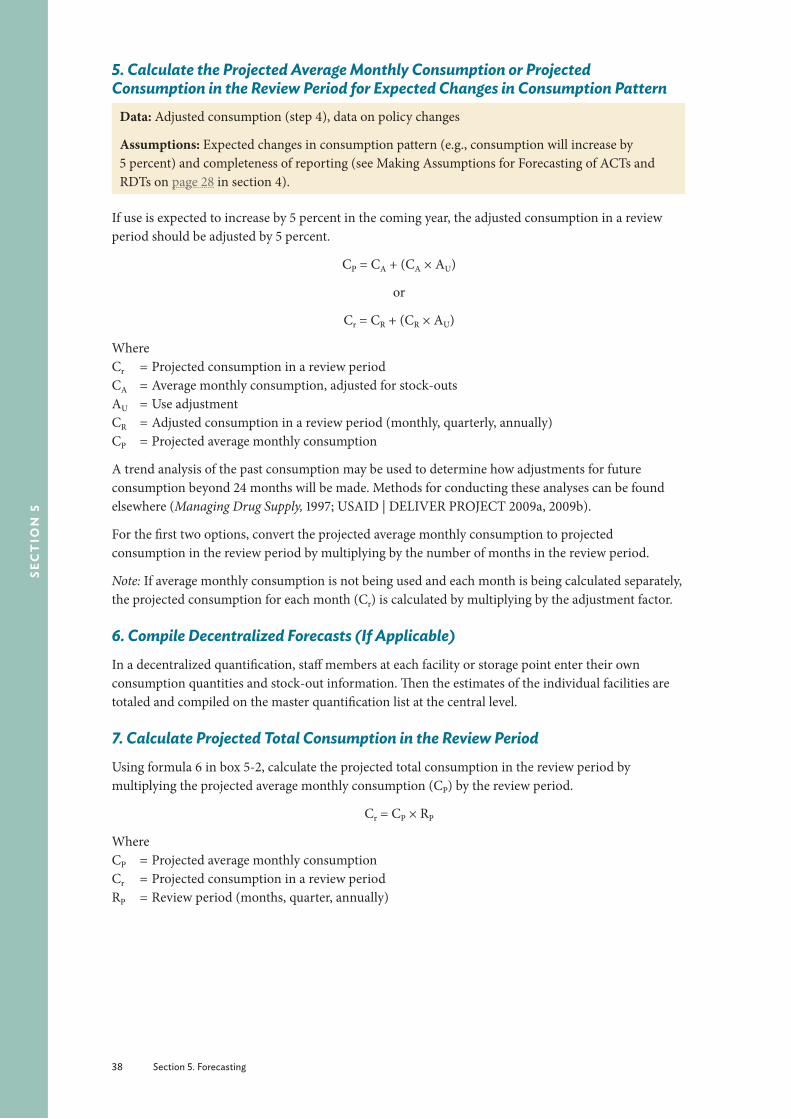
38 Section 5. Forecasting
sec
tio
n 5
5. Calculate the Projected Average Monthly Consumption or Projected Consumption in the Review Period for Expected Changes in Consumption Pattern
Data: Adjusted consumption (step 4), data on policy changes
Assumptions: Expected changes in consumption pattern (e.g., consumption will increase by 5 percent) and completeness of reporting (see Making Assumptions for Forecasting of ACTs and RDTs on page 28 in section 4).
If use is expected to increase by 5 percent in the coming year, the adjusted consumption in a review period should be adjusted by 5 percent.
CP = CA + (CA × AU)
or
Cr = CR + (CR × AU)
WhereCr = Projected consumption in a review periodCA = Average monthly consumption, adjusted for stock-outsAU = Use adjustmentCR = Adjusted consumption in a review period (monthly, quarterly, annually)CP = Projected average monthly consumption
A trend analysis of the past consumption may be used to determine how adjustments for future consumption beyond 24 months will be made. Methods for conducting these analyses can be found elsewhere (Managing Drug Supply, 1997; USAID | DELIVER PROJECT 2009a, 2009b).
For the first two options, convert the projected average monthly consumption to projected consumption in the review period by multiplying by the number of months in the review period.
Note: If average monthly consumption is not being used and each month is being calculated separately, the projected consumption for each month (Cr) is calculated by multiplying by the adjustment factor.
6. Compile Decentralized Forecasts (If Applicable)In a decentralized quantification, staff members at each facility or storage point enter their own consumption quantities and stock-out information. Then the estimates of the individual facilities are totaled and compiled on the master quantification list at the central level.
7. Calculate Projected Total Consumption in the Review PeriodUsing formula 6 in box 5-2, calculate the projected total consumption in the review period by multiplying the projected average monthly consumption (CP) by the review period.
Cr = CP × RP
WhereCP = Projected average monthly consumptionCr = Projected consumption in a review periodRP = Review period (months, quarter, annually)
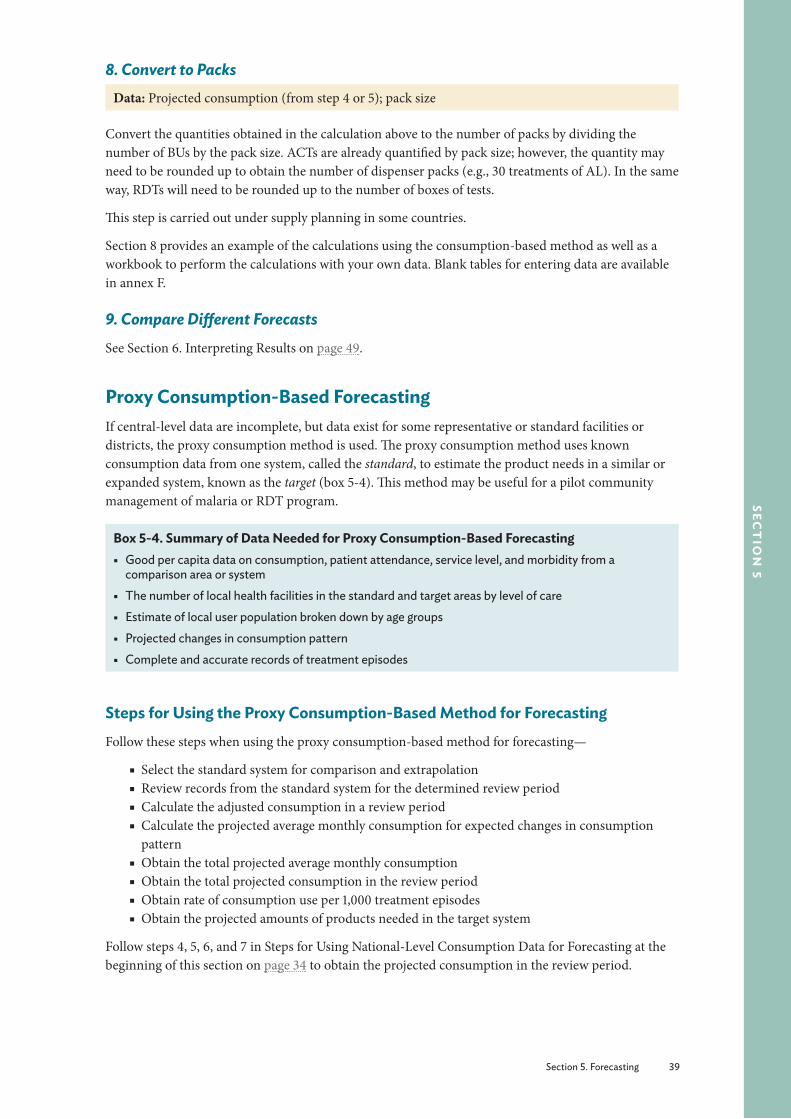
Section 5. Forecasting 39
sect
ion
5
8. Convert to PacksData: Projected consumption (from step 4 or 5); pack size
Convert the quantities obtained in the calculation above to the number of packs by dividing the number of BUs by the pack size. ACTs are already quantified by pack size; however, the quantity may need to be rounded up to obtain the number of dispenser packs (e.g., 30 treatments of AL). In the same way, RDTs will need to be rounded up to the number of boxes of tests.
This step is carried out under supply planning in some countries.
Section 8 provides an example of the calculations using the consumption-based method as well as a workbook to perform the calculations with your own data. Blank tables for entering data are available in annex F.
9. Compare Different ForecastsSee Section 6. Interpreting Results on page 49.
Proxy Consumption-Based ForecastingIf central-level data are incomplete, but data exist for some representative or standard facilities or districts, the proxy consumption method is used. The proxy consumption method uses known consumption data from one system, called the standard, to estimate the product needs in a similar or expanded system, known as the target (box 5-4). This method may be useful for a pilot community management of malaria or RDT program.
Box 5-4. Summary of Data Needed for Proxy Consumption-Based Forecasting § Good per capita data on consumption, patient attendance, service level, and morbidity from a
comparison area or system
§ The number of local health facilities in the standard and target areas by level of care
§ Estimate of local user population broken down by age groups
§ Projected changes in consumption pattern
§ Complete and accurate records of treatment episodes
Steps for Using the Proxy Consumption-Based Method for ForecastingFollow these steps when using the proxy consumption-based method for forecasting—
■ Select the standard system for comparison and extrapolation ■ Review records from the standard system for the determined review period ■ Calculate the adjusted consumption in a review period ■ Calculate the projected average monthly consumption for expected changes in consumption pattern
■ Obtain the total projected average monthly consumption ■ Obtain the total projected consumption in the review period ■ Obtain rate of consumption use per 1,000 treatment episodes ■ Obtain the projected amounts of products needed in the target system
Follow steps 4, 5, 6, and 7 in Steps for Using National-Level Consumption Data for Forecasting at the beginning of this section on page 34 to obtain the projected consumption in the review period.
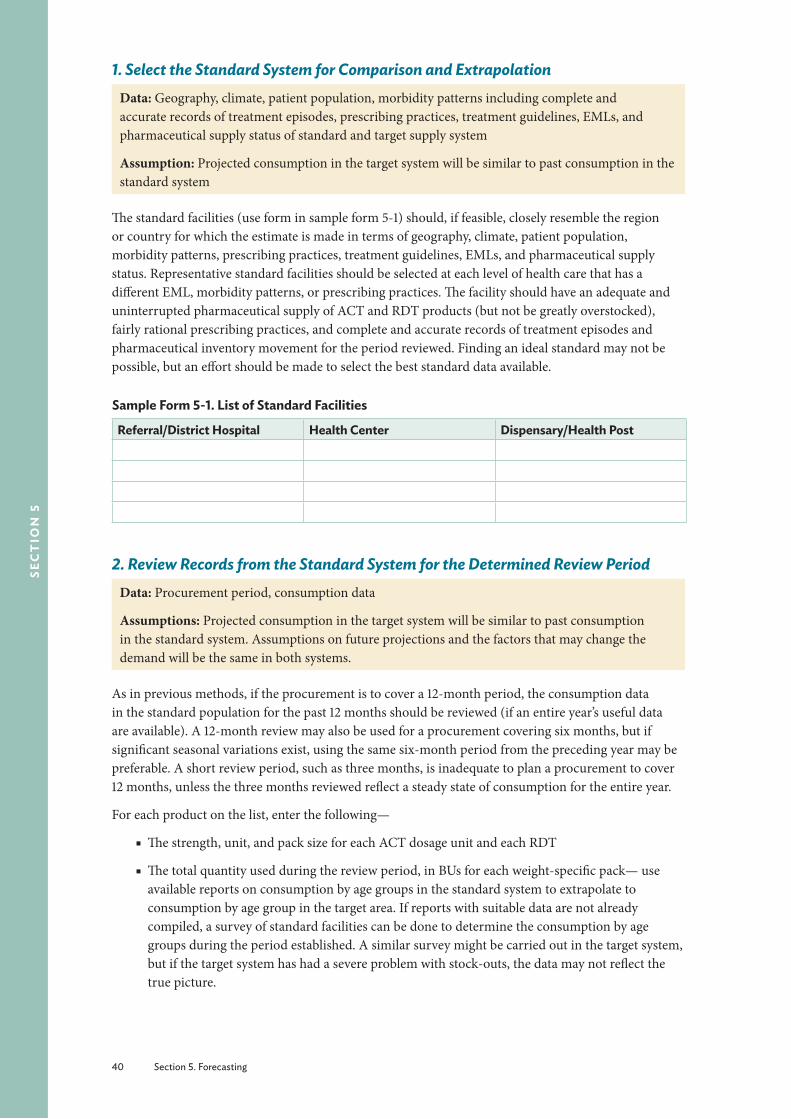
40 Section 5. Forecasting
sec
tio
n 5
1. Select the Standard System for Comparison and ExtrapolationData: Geography, climate, patient population, morbidity patterns including complete and accurate records of treatment episodes, prescribing practices, treatment guidelines, EMLs, and pharmaceutical supply status of standard and target supply system
Assumption: Projected consumption in the target system will be similar to past consumption in the standard system
The standard facilities (use form in sample form 5-1) should, if feasible, closely resemble the region or country for which the estimate is made in terms of geography, climate, patient population, morbidity patterns, prescribing practices, treatment guidelines, EMLs, and pharmaceutical supply status. Representative standard facilities should be selected at each level of health care that has a different EML, morbidity patterns, or prescribing practices. The facility should have an adequate and uninterrupted pharmaceutical supply of ACT and RDT products (but not be greatly overstocked), fairly rational prescribing practices, and complete and accurate records of treatment episodes and pharmaceutical inventory movement for the period reviewed. Finding an ideal standard may not be possible, but an effort should be made to select the best standard data available.
Sample Form 5-1. List of Standard Facilities
Referral/District Hospital Health Center Dispensary/Health Post
2. Review Records from the Standard System for the Determined Review PeriodData: Procurement period, consumption data
Assumptions: Projected consumption in the target system will be similar to past consumption in the standard system. Assumptions on future projections and the factors that may change the demand will be the same in both systems.
As in previous methods, if the procurement is to cover a 12-month period, the consumption data in the standard population for the past 12 months should be reviewed (if an entire year’s useful data are available). A 12-month review may also be used for a procurement covering six months, but if significant seasonal variations exist, using the same six-month period from the preceding year may be preferable. A short review period, such as three months, is inadequate to plan a procurement to cover 12 months, unless the three months reviewed reflect a steady state of consumption for the entire year.
For each product on the list, enter the following—
■ The strength, unit, and pack size for each ACT dosage unit and each RDT
■ The total quantity used during the review period, in BUs for each weight-specific pack— use available reports on consumption by age groups in the standard system to extrapolate to consumption by age group in the target area. If reports with suitable data are not already compiled, a survey of standard facilities can be done to determine the consumption by age groups during the period established. A similar survey might be carried out in the target system, but if the target system has had a severe problem with stock-outs, the data may not reflect the true picture.
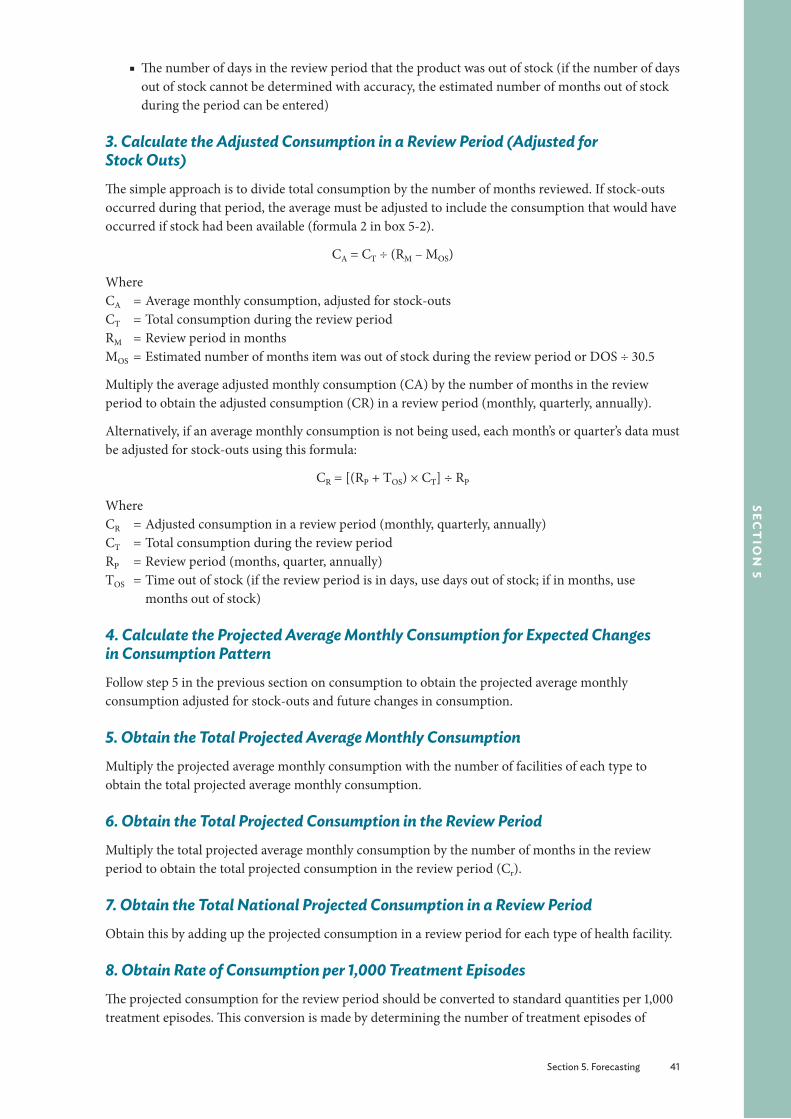
Section 5. Forecasting 41
sect
ion
5
■ The number of days in the review period that the product was out of stock (if the number of days out of stock cannot be determined with accuracy, the estimated number of months out of stock during the period can be entered)
3. Calculate the Adjusted Consumption in a Review Period (Adjusted for Stock Outs)The simple approach is to divide total consumption by the number of months reviewed. If stock-outs occurred during that period, the average must be adjusted to include the consumption that would have occurred if stock had been available (formula 2 in box 5-2).
CA = CT ÷ (RM – MOS)
WhereCA = Average monthly consumption, adjusted for stock-outsCT = Total consumption during the review periodRM = Review period in monthsMOS = Estimated number of months item was out of stock during the review period or DOS ÷ 30.5
Multiply the average adjusted monthly consumption (CA) by the number of months in the review period to obtain the adjusted consumption (CR) in a review period (monthly, quarterly, annually).
Alternatively, if an average monthly consumption is not being used, each month’s or quarter’s data must be adjusted for stock-outs using this formula:
CR = [(RP + TOS) × CT] ÷ RP
WhereCR = Adjusted consumption in a review period (monthly, quarterly, annually)CT = Total consumption during the review periodRP = Review period (months, quarter, annually)TOS = Time out of stock (if the review period is in days, use days out of stock; if in months, use
months out of stock)
4. Calculate the Projected Average Monthly Consumption for Expected Changes in Consumption PatternFollow step 5 in the previous section on consumption to obtain the projected average monthly consumption adjusted for stock-outs and future changes in consumption.
5. Obtain the Total Projected Average Monthly Consumption
Multiply the projected average monthly consumption with the number of facilities of each type to obtain the total projected average monthly consumption.
6. Obtain the Total Projected Consumption in the Review PeriodMultiply the total projected average monthly consumption by the number of months in the review period to obtain the total projected consumption in the review period (Cr).
7. Obtain the Total National Projected Consumption in a Review PeriodObtain this by adding up the projected consumption in a review period for each type of health facility.
8. Obtain Rate of Consumption per 1,000 Treatment EpisodesThe projected consumption for the review period should be converted to standard quantities per 1,000 treatment episodes. This conversion is made by determining the number of treatment episodes of

42 Section 5. Forecasting
sec
tio
n 5
malaria treated in facilities and dividing the projected consumption in a review period by the number of episodes in the review period.
9. Obtain the Projected Amounts of Products Needed in the Target SystemMultiply the consumption rate per 1,000 episodes by the estimated thousands of episodes in the standard area with the number of treatment episodes in the target area to obtain the projected amounts of products needed in the target system.
Sample Form 5-2. Projected Amounts of Products Needed
Type of product
Rate of Consumption per 1,000 Treatment
Episodes (CS)
Number of Malaria Treatment Episodes in
Target System ET
Projected Consumption (Quantity Required) in
Target System CTarget = CS * ET * 1,000
ACT (1 × 6)ACTRDT
Follow steps 6, 7, and 8 in Steps for Using National-Level Consumption Data for Forecasting at the beginning of this section on page 34 to obtain the projected consumption in the review period (Cr; box 5-2).
Morbidity-Based Forecasting
Box 5-5. Summary of Data Needed for Morbidity-Based Forecasting § List of ACTs and RDTs to be quantified (from malaria treatment guidelines)
§ Standard and average medicine treatment regimen or the quantity of each RDT and ACT needed for each episode of febrile illness or malaria (1 ACT treatment, 1 RDT test strip)
§ Number of suspected malaria episodes likely to be tested using an RDT
§ Number of reported malaria cases or treatment episodes
§ Expected projected changes in consumption (potential losses or scale-up in use)
§ Reporting rates
The forecasting formula involves multiplying the quantity of each ACT or RDT included in the malaria treatment guidelines by the number of projected diagnostic and treatment episodes (suspected cases tested with RDTs and confirmed cases treated with ACTs).
Steps for Using the Morbidity-Based Method for ForecastingFollow these steps when using the morbidity method for forecasting—
1. Establish standard or average treatment regimens for ACTs2. Calculate the number of fever episodes to determine the RDT needs3. Calculate the expected number of treatment episodes for each standard course of treatment for
ACTs4. Calculate the number of treatment episodes for each standard course of ACT by age/weight
group5. Calculate the quantity of each ACT product needed for the forecast period6. Adjust for programmatic changes7. Convert to packs8. Compare forecasts
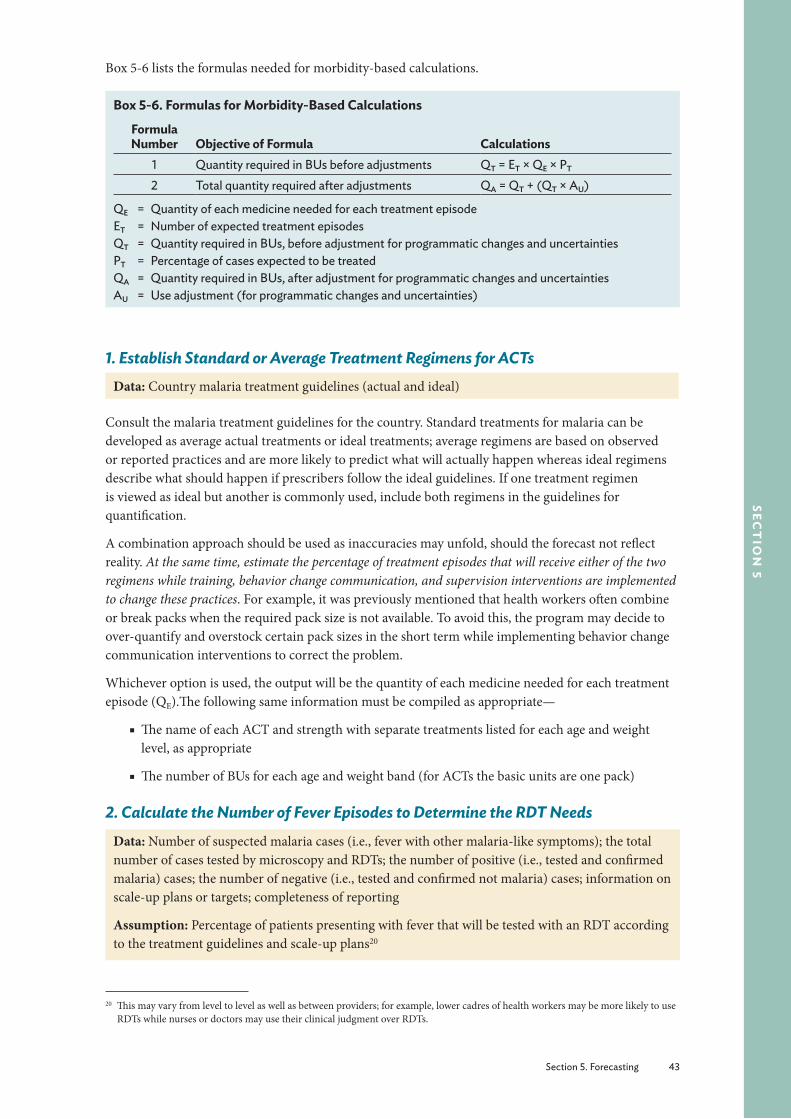
Section 5. Forecasting 43
sect
ion
5
Box 5-6 lists the formulas needed for morbidity-based calculations.
Box 5-6. Formulas for Morbidity-Based Calculations
Formula Number Objective of Formula Calculations
1 Quantity required in BUs before adjustments QT = ET × QE × PT
2 Total quantity required after adjustments QA = QT + (QT × AU)
QE = Quantity of each medicine needed for each treatment episodeET = Number of expected treatment episodesQT = Quantity required in BUs, before adjustment for programmatic changes and uncertaintiesPT = Percentage of cases expected to be treatedQA = Quantity required in BUs, after adjustment for programmatic changes and uncertaintiesAU = Use adjustment (for programmatic changes and uncertainties)
1. Establish Standard or Average Treatment Regimens for ACTsData: Country malaria treatment guidelines (actual and ideal)
Consult the malaria treatment guidelines for the country. Standard treatments for malaria can be developed as average actual treatments or ideal treatments; average regimens are based on observed or reported practices and are more likely to predict what will actually happen whereas ideal regimens describe what should happen if prescribers follow the ideal guidelines. If one treatment regimen is viewed as ideal but another is commonly used, include both regimens in the guidelines for quantification.
A combination approach should be used as inaccuracies may unfold, should the forecast not reflect reality. At the same time, estimate the percentage of treatment episodes that will receive either of the two regimens while training, behavior change communication, and supervision interventions are implemented to change these practices. For example, it was previously mentioned that health workers often combine or break packs when the required pack size is not available. To avoid this, the program may decide to over-quantify and overstock certain pack sizes in the short term while implementing behavior change communication interventions to correct the problem.
Whichever option is used, the output will be the quantity of each medicine needed for each treatment episode (QE).The following same information must be compiled as appropriate—
■ The name of each ACT and strength with separate treatments listed for each age and weight level, as appropriate
■ The number of BUs for each age and weight band (for ACTs the basic units are one pack)
2. Calculate the Number of Fever Episodes to Determine the RDT NeedsData: Number of suspected malaria cases (i.e., fever with other malaria-like symptoms); the total number of cases tested by microscopy and RDTs; the number of positive (i.e., tested and confirmed malaria) cases; the number of negative (i.e., tested and confirmed not malaria) cases; information on scale-up plans or targets; completeness of reporting
Assumption: Percentage of patients presenting with fever that will be tested with an RDT according to the treatment guidelines and scale-up plans20
20 This may vary from level to level as well as between providers; for example, lower cadres of health workers may be more likely to use RDTs while nurses or doctors may use their clinical judgment over RDTs.
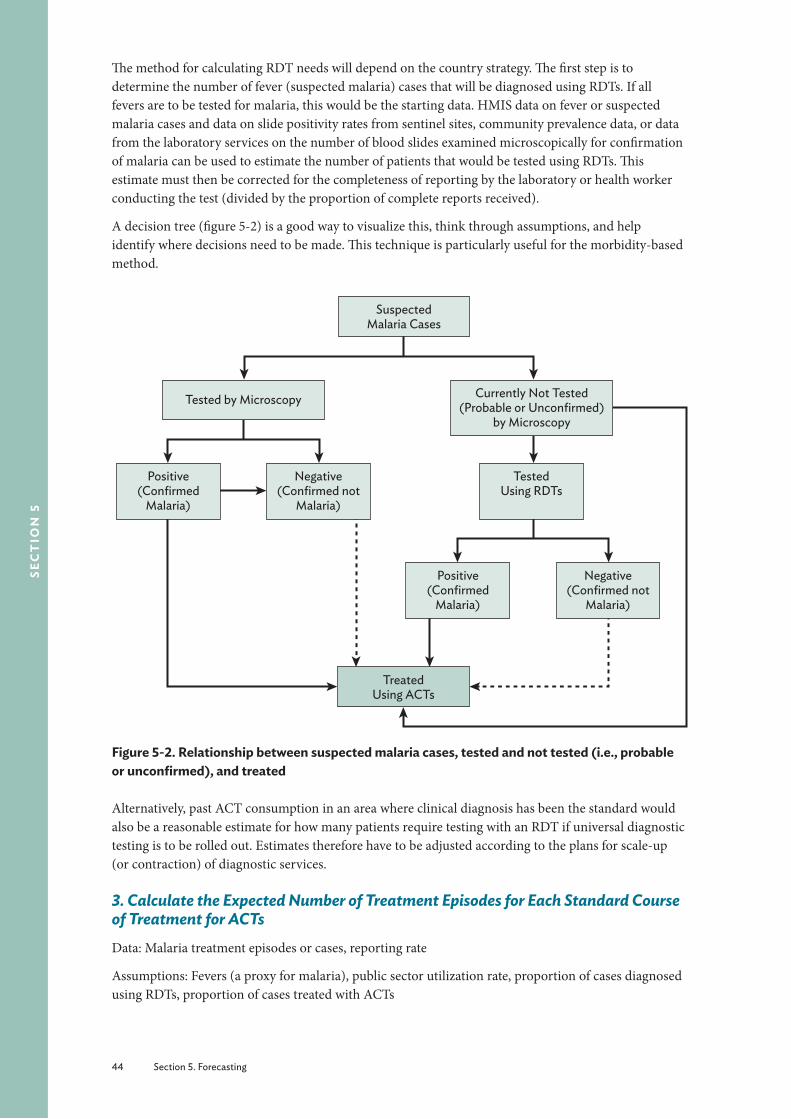
44 Section 5. Forecasting
sec
tio
n 5
The method for calculating RDT needs will depend on the country strategy. The first step is to determine the number of fever (suspected malaria) cases that will be diagnosed using RDTs. If all fevers are to be tested for malaria, this would be the starting data. HMIS data on fever or suspected malaria cases and data on slide positivity rates from sentinel sites, community prevalence data, or data from the laboratory services on the number of blood slides examined microscopically for confirmation of malaria can be used to estimate the number of patients that would be tested using RDTs. This estimate must then be corrected for the completeness of reporting by the laboratory or health worker conducting the test (divided by the proportion of complete reports received).
A decision tree (figure 5-2) is a good way to visualize this, think through assumptions, and help identify where decisions need to be made. This technique is particularly useful for the morbidity-based method.
Treated Using ACTs
Positive (Confirmed
Malaria)
Negative (Confirmed not
Malaria)
Positive (Confirmed
Malaria)
Negative (Confirmed not
Malaria)
Suspected Malaria Cases
Tested by Microscopy Currently Not Tested (Probable or Unconfirmed)
by Microscopy
Tested Using RDTs
Figure 5-2. Relationship between suspected malaria cases, tested and not tested (i.e., probable or unconfirmed), and treated
Alternatively, past ACT consumption in an area where clinical diagnosis has been the standard would also be a reasonable estimate for how many patients require testing with an RDT if universal diagnostic testing is to be rolled out. Estimates therefore have to be adjusted according to the plans for scale-up (or contraction) of diagnostic services.
3. Calculate the Expected Number of Treatment Episodes for Each Standard Course of Treatment for ACTsData: Malaria treatment episodes or cases, reporting rate
Assumptions: Fevers (a proxy for malaria), public sector utilization rate, proportion of cases diagnosed using RDTs, proportion of cases treated with ACTs
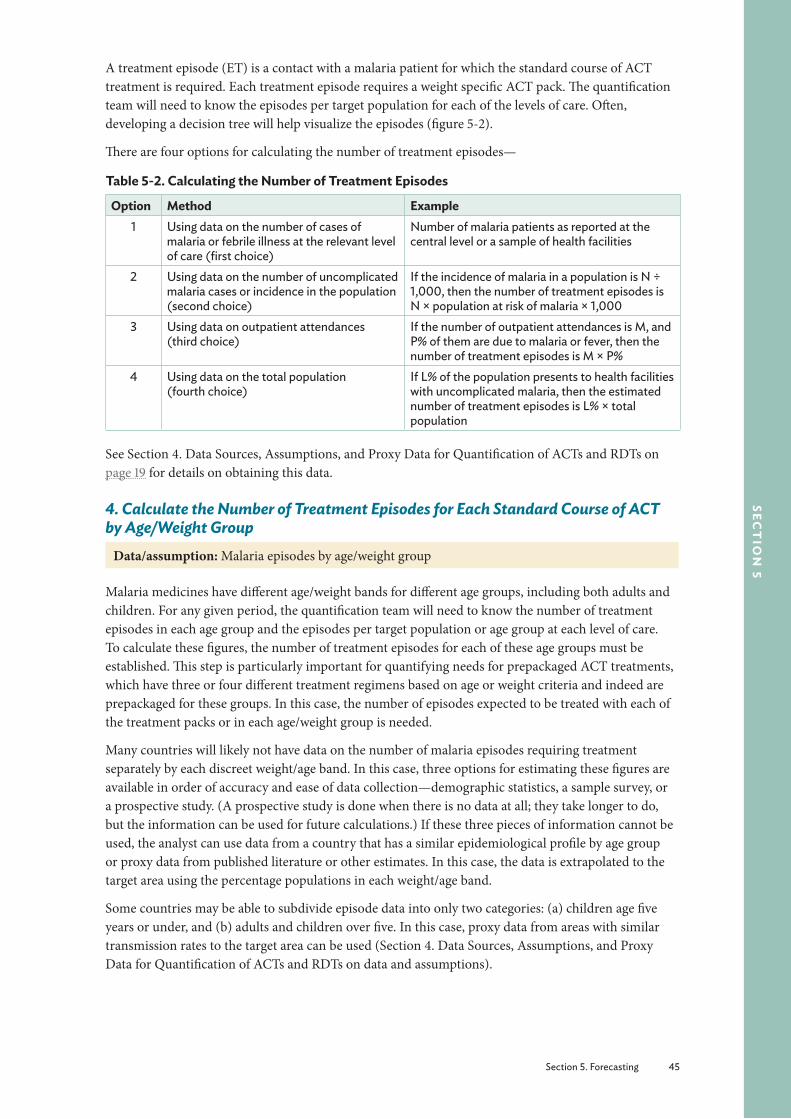
Section 5. Forecasting 45
sect
ion
5
A treatment episode (ET) is a contact with a malaria patient for which the standard course of ACT treatment is required. Each treatment episode requires a weight specific ACT pack. The quantification team will need to know the episodes per target population for each of the levels of care. Often, developing a decision tree will help visualize the episodes (figure 5-2).
There are four options for calculating the number of treatment episodes—
Table 5-2. Calculating the Number of Treatment Episodes
Option Method Example1 Using data on the number of cases of
malaria or febrile illness at the relevant level of care (first choice)
Number of malaria patients as reported at the central level or a sample of health facilities
2 Using data on the number of uncomplicated malaria cases or incidence in the population (second choice)
If the incidence of malaria in a population is N ÷ 1,000, then the number of treatment episodes is N × population at risk of malaria × 1,000
3 Using data on outpatient attendances (third choice)
If the number of outpatient attendances is M, and P% of them are due to malaria or fever, then the number of treatment episodes is M × P%
4 Using data on the total population (fourth choice)
If L% of the population presents to health facilities with uncomplicated malaria, then the estimated number of treatment episodes is L% × total population
See Section 4. Data Sources, Assumptions, and Proxy Data for Quantification of ACTs and RDTs on page 19 for details on obtaining this data.
4. Calculate the Number of Treatment Episodes for Each Standard Course of ACT by Age/Weight Group
Data/assumption: Malaria episodes by age/weight group
Malaria medicines have different age/weight bands for different age groups, including both adults and children. For any given period, the quantification team will need to know the number of treatment episodes in each age group and the episodes per target population or age group at each level of care. To calculate these figures, the number of treatment episodes for each of these age groups must be established. This step is particularly important for quantifying needs for prepackaged ACT treatments, which have three or four different treatment regimens based on age or weight criteria and indeed are prepackaged for these groups. In this case, the number of episodes expected to be treated with each of the treatment packs or in each age/weight group is needed.
Many countries will likely not have data on the number of malaria episodes requiring treatment separately by each discreet weight/age band. In this case, three options for estimating these figures are available in order of accuracy and ease of data collection—demographic statistics, a sample survey, or a prospective study. (A prospective study is done when there is no data at all; they take longer to do, but the information can be used for future calculations.) If these three pieces of information cannot be used, the analyst can use data from a country that has a similar epidemiological profile by age group or proxy data from published literature or other estimates. In this case, the data is extrapolated to the target area using the percentage populations in each weight/age band.
Some countries may be able to subdivide episode data into only two categories: (a) children age five years or under, and (b) adults and children over five. In this case, proxy data from areas with similar transmission rates to the target area can be used (Section 4. Data Sources, Assumptions, and Proxy Data for Quantification of ACTs and RDTs on data and assumptions).
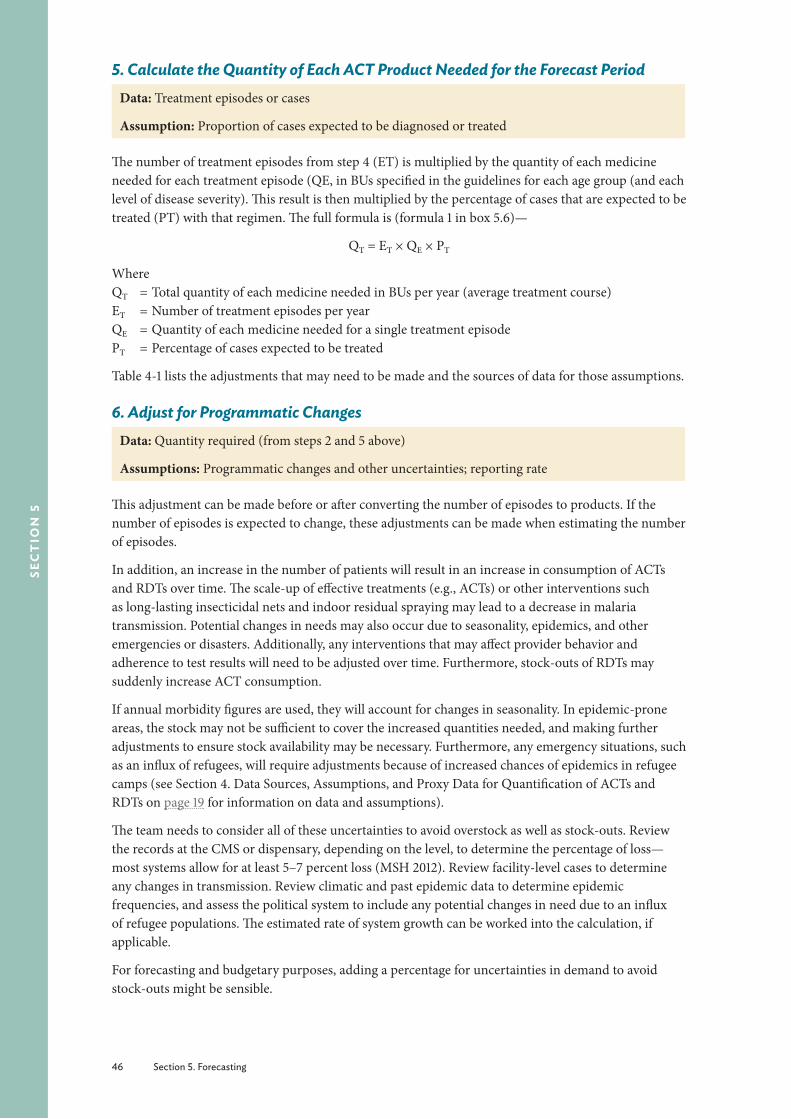
46 Section 5. Forecasting
sec
tio
n 5
5. Calculate the Quantity of Each ACT Product Needed for the Forecast PeriodData: Treatment episodes or cases
Assumption: Proportion of cases expected to be diagnosed or treated
The number of treatment episodes from step 4 (ET) is multiplied by the quantity of each medicine needed for each treatment episode (QE, in BUs specified in the guidelines for each age group (and each level of disease severity). This result is then multiplied by the percentage of cases that are expected to be treated (PT) with that regimen. The full formula is (formula 1 in box 5.6)—
QT = ET × QE × PT
WhereQT = Total quantity of each medicine needed in BUs per year (average treatment course)ET = Number of treatment episodes per yearQE = Quantity of each medicine needed for a single treatment episodePT = Percentage of cases expected to be treated
Table 4-1 lists the adjustments that may need to be made and the sources of data for those assumptions.
6. Adjust for Programmatic ChangesData: Quantity required (from steps 2 and 5 above)
Assumptions: Programmatic changes and other uncertainties; reporting rate
This adjustment can be made before or after converting the number of episodes to products. If the number of episodes is expected to change, these adjustments can be made when estimating the number of episodes.
In addition, an increase in the number of patients will result in an increase in consumption of ACTs and RDTs over time. The scale-up of effective treatments (e.g., ACTs) or other interventions such as long-lasting insecticidal nets and indoor residual spraying may lead to a decrease in malaria transmission. Potential changes in needs may also occur due to seasonality, epidemics, and other emergencies or disasters. Additionally, any interventions that may affect provider behavior and adherence to test results will need to be adjusted over time. Furthermore, stock-outs of RDTs may suddenly increase ACT consumption.
If annual morbidity figures are used, they will account for changes in seasonality. In epidemic-prone areas, the stock may not be sufficient to cover the increased quantities needed, and making further adjustments to ensure stock availability may be necessary. Furthermore, any emergency situations, such as an influx of refugees, will require adjustments because of increased chances of epidemics in refugee camps (see Section 4. Data Sources, Assumptions, and Proxy Data for Quantification of ACTs and RDTs on page 19 for information on data and assumptions).
The team needs to consider all of these uncertainties to avoid overstock as well as stock-outs. Review the records at the CMS or dispensary, depending on the level, to determine the percentage of loss—most systems allow for at least 5–7 percent loss (MSH 2012). Review facility-level cases to determine any changes in transmission. Review climatic and past epidemic data to determine epidemic frequencies, and assess the political system to include any potential changes in need due to an influx of refugee populations. The estimated rate of system growth can be worked into the calculation, if applicable.
For forecasting and budgetary purposes, adding a percentage for uncertainties in demand to avoid stock-outs might be sensible.
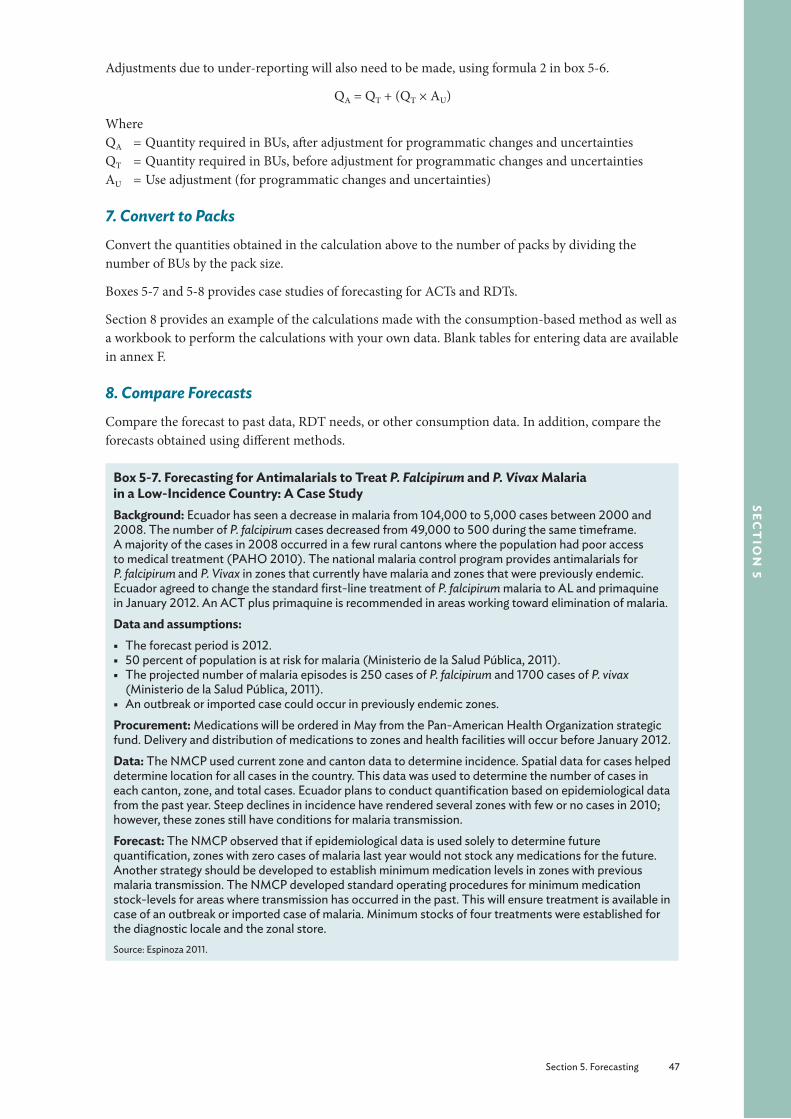
Section 5. Forecasting 47
sect
ion
5
Adjustments due to under-reporting will also need to be made, using formula 2 in box 5-6.
QA = QT + (QT × AU)
WhereQA = Quantity required in BUs, after adjustment for programmatic changes and uncertaintiesQT = Quantity required in BUs, before adjustment for programmatic changes and uncertaintiesAU = Use adjustment (for programmatic changes and uncertainties)
7. Convert to PacksConvert the quantities obtained in the calculation above to the number of packs by dividing the number of BUs by the pack size.
Boxes 5-7 and 5-8 provides case studies of forecasting for ACTs and RDTs.
Section 8 provides an example of the calculations made with the consumption-based method as well as a workbook to perform the calculations with your own data. Blank tables for entering data are available in annex F.
8. Compare ForecastsCompare the forecast to past data, RDT needs, or other consumption data. In addition, compare the forecasts obtained using different methods.
Box 5-7. Forecasting for Antimalarials to Treat P. Falcipirum and P. Vivax Malaria in a Low-Incidence Country: A Case StudyBackground: Ecuador has seen a decrease in malaria from 104,000 to 5,000 cases between 2000 and 2008. The number of P. falcipirum cases decreased from 49,000 to 500 during the same timeframe. A majority of the cases in 2008 occurred in a few rural cantons where the population had poor access to medical treatment (PAHO 2010). The national malaria control program provides antimalarials for P. falcipirum and P. Vivax in zones that currently have malaria and zones that were previously endemic. Ecuador agreed to change the standard first-line treatment of P. falcipirum malaria to AL and primaquine in January 2012. An ACT plus primaquine is recommended in areas working toward elimination of malaria.Data and assumptions:
§ The forecast period is 2012. § 50 percent of population is at risk for malaria (Ministerio de la Salud Pública, 2011). § The projected number of malaria episodes is 250 cases of P. falcipirum and 1700 cases of P. vivax
(Ministerio de la Salud Pública, 2011). § An outbreak or imported case could occur in previously endemic zones.
Procurement: Medications will be ordered in May from the Pan-American Health Organization strategic fund. Delivery and distribution of medications to zones and health facilities will occur before January 2012.Data: The NMCP used current zone and canton data to determine incidence. Spatial data for cases helped determine location for all cases in the country. This data was used to determine the number of cases in each canton, zone, and total cases. Ecuador plans to conduct quantification based on epidemiological data from the past year. Steep declines in incidence have rendered several zones with few or no cases in 2010; however, these zones still have conditions for malaria transmission.Forecast: The NMCP observed that if epidemiological data is used solely to determine future quantification, zones with zero cases of malaria last year would not stock any medications for the future. Another strategy should be developed to establish minimum medication levels in zones with previous malaria transmission. The NMCP developed standard operating procedures for minimum medication stock-levels for areas where transmission has occurred in the past. This will ensure treatment is available in case of an outbreak or imported case of malaria. Minimum stocks of four treatments were established for the diagnostic locale and the zonal store.Source: Espinoza 2011.
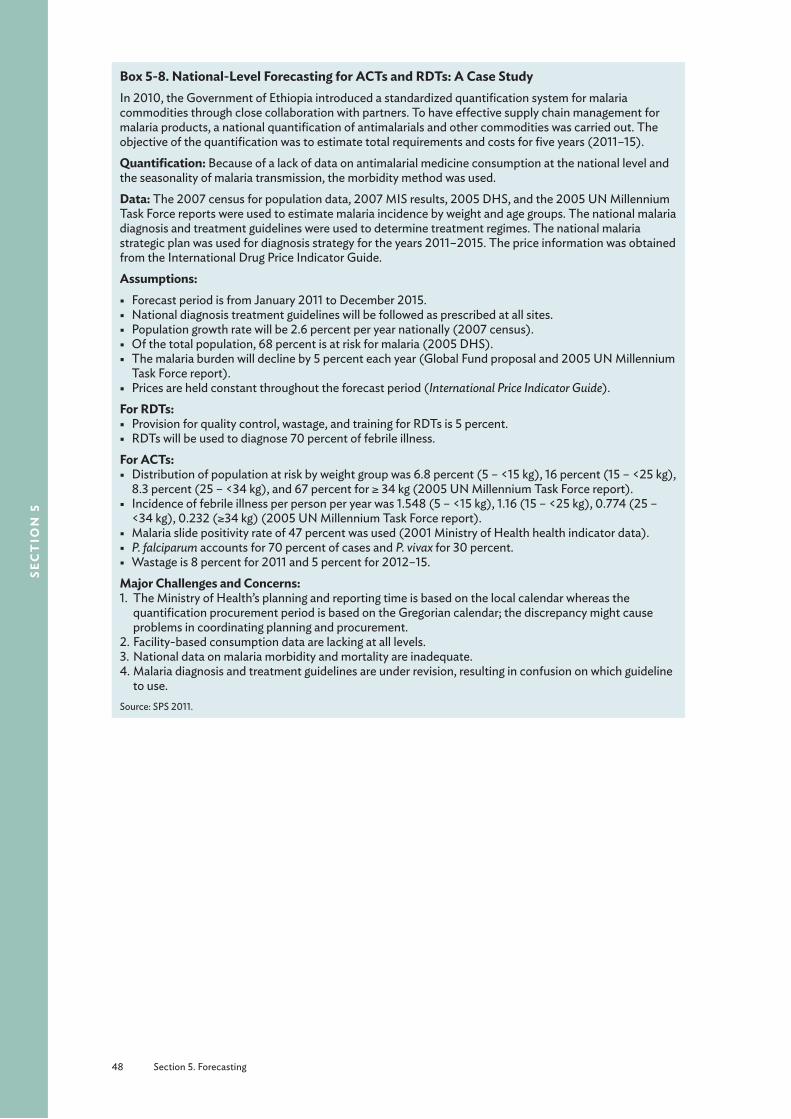
48 Section 5. Forecasting
sec
tio
n 5
Box 5-8. National-Level Forecasting for ACTs and RDTs: A Case StudyIn 2010, the Government of Ethiopia introduced a standardized quantification system for malaria commodities through close collaboration with partners. To have effective supply chain management for malaria products, a national quantification of antimalarials and other commodities was carried out. The objective of the quantification was to estimate total requirements and costs for five years (2011–15).Quantification: Because of a lack of data on antimalarial medicine consumption at the national level and the seasonality of malaria transmission, the morbidity method was used.Data: The 2007 census for population data, 2007 MIS results, 2005 DHS, and the 2005 UN Millennium Task Force reports were used to estimate malaria incidence by weight and age groups. The national malaria diagnosis and treatment guidelines were used to determine treatment regimes. The national malaria strategic plan was used for diagnosis strategy for the years 2011–2015. The price information was obtained from the International Drug Price Indicator Guide. Assumptions:
§ Forecast period is from January 2011 to December 2015. § National diagnosis treatment guidelines will be followed as prescribed at all sites. § Population growth rate will be 2.6 percent per year nationally (2007 census). § Of the total population, 68 percent is at risk for malaria (2005 DHS). § The malaria burden will decline by 5 percent each year (Global Fund proposal and 2005 UN Millennium
Task Force report). § Prices are held constant throughout the forecast period (International Price Indicator Guide).
For RDTs: § Provision for quality control, wastage, and training for RDTs is 5 percent. § RDTs will be used to diagnose 70 percent of febrile illness.
For ACTs: § Distribution of population at risk by weight group was 6.8 percent (5 – <15 kg), 16 percent (15 – <25 kg),
8.3 percent (25 – <34 kg), and 67 percent for ≥ 34 kg (2005 UN Millennium Task Force report). § Incidence of febrile illness per person per year was 1.548 (5 – <15 kg), 1.16 (15 – <25 kg), 0.774 (25 –
<34 kg), 0.232 (≥34 kg) (2005 UN Millennium Task Force report). § Malaria slide positivity rate of 47 percent was used (2001 Ministry of Health health indicator data). § P. falciparum accounts for 70 percent of cases and P. vivax for 30 percent. § Wastage is 8 percent for 2011 and 5 percent for 2012–15.
Major Challenges and Concerns:1. The Ministry of Health’s planning and reporting time is based on the local calendar whereas the
quantification procurement period is based on the Gregorian calendar; the discrepancy might cause problems in coordinating planning and procurement.
2. Facility-based consumption data are lacking at all levels.3. National data on malaria morbidity and mortality are inadequate. 4. Malaria diagnosis and treatment guidelines are under revision, resulting in confusion on which guideline
to use.Source: SPS 2011.
Section 6. Interpreting Results 49
sect
ion
6
Section 6. Interpreting ResultsThe last step in the forecasting process is to check the forecasts.21 Reconcile and validate the forecasted quantities required after adjustments by comparing them with any morbidity data, if available. Alternatively, the forecast and assumptions may be validated on a given base year when a full data set is available. For example, use data on actual orders, stock-outs, and consumption from a previous year to check the model for the forecast period, and then use or project the assumptions forward based on the algorithm used.
Morbidity- and consumption-based estimates will usually give two different results. Ideally, the estimates would produce very similar results, but in practice this rarely happens. In this situation, the quality of the source data used and the results obtained need to be reviewed to make an informed judgment on the best estimate of quantities required. Calculated quantities may also need to be adjusted to fit available funding.
Comparing morbidity and consumption results is still useful, however, even if the accuracy of the data is questionable and even if the comparison can be done only roughly and with difficulty. The comparison has the potential to catch large discrepancies and can force a reevaluation of preconceived notions about the data’s accuracy. Investigating the reasons for discrepancies often turns up important information that can significantly affect the forecast.
The scenarios that follow explain and suggest actions to take on the basis of the results of each method and depending on confidence in the data used. For the consumption method, there should be confidence in the accuracy and reliability of the LMIS that maintains data on consumption in contrast to stock movement, which in addition to the quantity consumed, may include losses caused by theft, expired stock, or both. A crucial factor to consider in any analysis is irrational use of medicines in the system.
When the Consumption-Based Estimate is Greater than the Morbidity-Based EstimateIf the consumption-based estimate is more than 50 percent greater than the morbidity-based estimate, a more detailed investigation of the data should be undertaken before proceeding with the quantification. Were data entry and transcription done correctly? Was the correct population and morbidity information obtained? Is there a possibility of large-scale leakage, diversion of supplies, or both? Are any special factors at work? Were patients with negative RDT results given ACTs? When the data are verified, proceed as follows.
21 Adapted from Quantimed, Rational Pharmaceutical Management Plus Program.

50 Section 6. Interpreting Results
sec
tio
n 6
If you are not confident in the quality of either the consumption or morbidity data—
■ Find comparative facilities, regions, or countries with reliable information systems and use their data as proxy data.
■ Try to judge the percentage of confidence in the accuracy, completeness, or reliability of the data, and adjust the results accordingly. This assessment can be made through interviews with health care personnel.
If you are more confident in the consumption data than the morbidity data—
■ Examine the morbidity data for underestimation of disease incidence.
■ Make sure the population data are current; ask whether any large movement of population into the area has occurred, such as refugees, seasonal workers, or employees of new industries.
■ Determine whether STGs are followed.
If you are more confident in the morbidity data than the consumption data—
■ Consider whether pilferage, expiration, or leakage of stock is high.
■ Ask whether stock-outs of other related pharmaceuticals caused higher consumption of this item (e.g., did a stock a stock-out of RDTs cause higher consumption of ACTs).
If you are confident in the quality of both the consumption and morbidity data, use the consumption-based estimate to avoid ordering too few pharmaceuticals and supplies.
When the Morbidity-Based Estimate is Greater than the Consumption-Based EstimateIf you are more confident in the consumption data than the morbidity data follow the steps above. In addition—
■ Consider whether program coverage is low, support services or diagnostics for health conditions are inadequate, or both.
If you have chosen to work with the morbidity data, also consider—
■ Is the LMIS inadequate and the data obtained either poor or incomplete?
■ Is the budget sufficient to meet the full needs of the population or if a proportion has gone untreated?
■ Is the program coverage poor, support services or diagnostics for health conditions inadequate, or both; and has access to these services been limited by unrest, strikes, or transportation problems?
■ Are products are being supplied from multiple sources not included in the quantification?
If the quality of both consumption and morbidity data is good, use the morbidity-based estimate so that you do not order too few medicines and supplies.
Discuss the forecast(s) with country program managers and, where appropriate, donor staff to obtain consensus on the selection of a reasonable forecast.
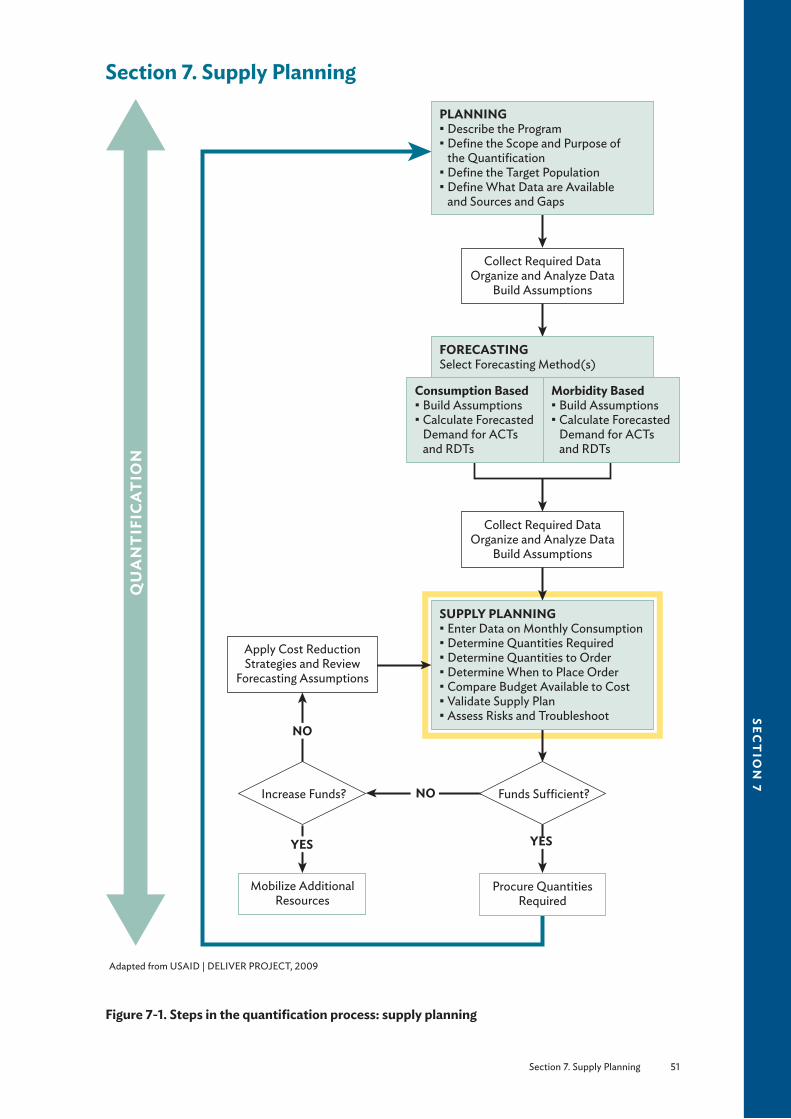
Section 7. Supply Planning 51
sect
ion
7
Section 7. Supply Planning
FORECASTINGSelect Forecasting Method(s)
Consumption Based§ Build Assumptions§ Calculate Forecasted
Demand for ACTs and RDTs
Morbidity Based§ Build Assumptions§ Calculate Forecasted
Demand for ACTs and RDTs
PLANNING§ Describe the Program§ Define the Scope and Purpose of
the Quantification§ Define the Target Population§ Define What Data are Available
and Sources and Gaps
Collect Required DataOrganize and Analyze Data
Build Assumptions
Procure Quantities Required
Mobilize Additional Resources
Apply Cost ReductionStrategies and Review
Forecasting Assumptions
Collect Required DataOrganize and Analyze Data
Build Assumptions
SUPPLY PLANNING§ Enter Data on Monthly Consumption§ Determine Quantities Required§ Determine Quantities to Order§ Determine When to Place Order§ Compare Budget Available to Cost§ Validate Supply Plan§ Assess Risks and Troubleshoot
QU
AN
TIF
ICA
TIO
N
Funds Su�cient?Increase Funds?
YES YES
NO
NO
Adapted from USAID | DELIVER PROJECT, 2009
Figure 7-1. Steps in the quantification process: supply planning

52 Section 7. Supply Planning
sec
tio
n 7
The steps required for supply planning are the same irrespective of the method of forecasting used (see the yellow highlighted area in figure 7-1).
The Purpose of Supply PlanningSupply planning is an essential step in quantification and works hand in hand with forecasting to ensure an optimal procurement and delivery schedule, so supply and demand are well coordinated. Effective supply planning allows for rapid changes to realign inventory, transport, manufacturing, and purchasing plans to address any changes in the supply chain. If a software tool such as PipeLine is being used, the forecast consumption would be input or transferred to the tool at this stage. PipeLine uses stock on hand, maximum and minimum stock levels, and total lead time to procure products to determine the optimal procurement and delivery schedule. A supply plan defines quantities to order, suppliers, and order and arrival dates in the country, all of which depend on the supplier, procurement agency, or donor. The timing of when to order will be determined by when the products are needed. Once the forecast numbers are obtained from the previous chapters, the quantification team may want to work backward from the date the products are expected to arrive to determine the best time to place orders.
Before completing the plan, the team will note the stocks that are available on hand and calculate how these translate to months of stock so that orders arrive when the stock level declines to the minimum stock level. A regularly updated supply plan would provide the right triggers for reordering. The shipment quantities should bring the stock level up to the established maximum.
Effective supply planning is actually a complicated process and is affected by several variables and risks, including procurement lead time (box 7-1). It is achieved through robust reporting that helps identify trends in demand. Malaria seasonality will determine when and what quantity of supplies should be replenished. Replenishment planning should be integrated into the overall supply chain planning at different points in the total distribution timeline; this will allow the most efficient use of resources in replenishing inventory in areas where the demand is greatest.
Factors to consider in supply planning include—
■ Projected monthly consumption ■ Minimum stock and reorder levels (i.e., the trigger for the need to reorder an item which includes safety stock)
■ Maximum stock level ■ Stock position (i.e., stock on hand and stock on order) ■ Procurement period or lead time ■ Seasonality ■ Supplier (influences lead time) ■ Other factors that may affect lead time (e.g., availability of raw material)
Box 7-1 outlines some of the factors that may affect procurement lead time. Data on supplier lead time can be obtained by discussions with the suppliers, procurement agencies, or through websites such as the Global Fund’s Price Price and Quality Reporting Tool. Annex G illustrates some timelines for some donors and suppliers.
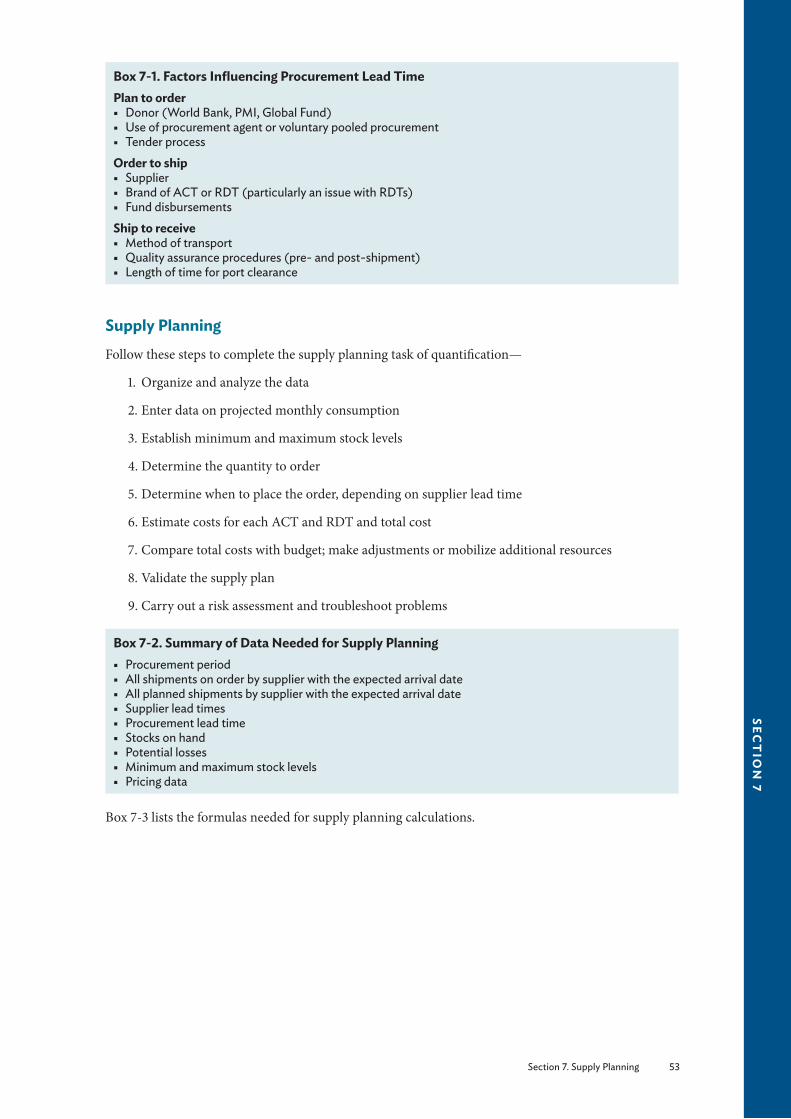
Section 7. Supply Planning 53
sect
ion
7
Box 7-1. Factors Influencing Procurement Lead TimePlan to order
§ Donor (World Bank, PMI, Global Fund) § Use of procurement agent or voluntary pooled procurement § Tender process
Order to ship § Supplier § Brand of ACT or RDT (particularly an issue with RDTs) § Fund disbursements
Ship to receive § Method of transport § Quality assurance procedures (pre- and post-shipment) § Length of time for port clearance
Supply PlanningFollow these steps to complete the supply planning task of quantification—
1. Organize and analyze the data
2. Enter data on projected monthly consumption
3. Establish minimum and maximum stock levels
4. Determine the quantity to order
5. Determine when to place the order, depending on supplier lead time
6. Estimate costs for each ACT and RDT and total cost
7. Compare total costs with budget; make adjustments or mobilize additional resources
8. Validate the supply plan
9. Carry out a risk assessment and troubleshoot problems
Box 7-2. Summary of Data Needed for Supply Planning § Procurement period § All shipments on order by supplier with the expected arrival date § All planned shipments by supplier with the expected arrival date § Supplier lead times § Procurement lead time § Stocks on hand § Potential losses § Minimum and maximum stock levels § Pricing data
Box 7-3 lists the formulas needed for supply planning calculations.

54 Section 7. Supply Planning
sec
tio
n 7
Box 7-3. Formulas for Supply Planning Calculations
Formula Number Objective of Formula Calculations
1 Basic safety stock requirements (in months)* SS = CP × LTSS = C × LTSS = 1/2 × RP
2 Minimum stock level (in months) SMIN = LT + SS 3 Maximum stock level (in months) SMAX = SMIN + PP4 Quantity required Q1 = SMAX × C5 Quantity to order QO = Q1 - (SOH + SOO)
SS = Quantity needed for safety stock*QA = Total quantity of each medicine needed after adjustments, in BUs (average treatment course;
product of morbidity-based forecast)LT = Average lead time (for projected supplier or worst case), in monthsSMIN = Minimum stock level, in monthsSMAX = Maximum stock level, in monthsQ1 = Quantity required, in BUsQO = Quantity to order, in BUsPP = Procurement period (number of months to be covered by order)SOH = Stock on hand, in BUsSOO = Stock on order, in BUsCr = Projected consumption in a review period (product of consumption-based forecast)CP = Projected average monthly consumption or QA/RP or Cr/RP
C = Consumption during a particular month (having taken seasonality into account)* The amount of SS required is usually a policy decision obtained after reaching consensus among the stakeholders. Any of the
formulae listed can be used to calculate SS; the second formula is more accurate than the first.
1. Organize and Analyze the DataThe following data need to be obtained—
■ Forecasted projected consumption for ACTs and RDTs in the review period22 (Section 5. Forecasting; QA or Cr)
■ All shipments on order by supplier with the expected arrival dates ■ All planned shipments by supplier with the expected arrival dates ■ Supplier lead times ■ Stocks on hand
Working with the DataOnce the data have been collected from the various sources (Section 4. Data Sources, Assumptions, and Proxy Data for Quantification of ACTs and RDTs, Box 5-1, and Section 5. Forecasting), they will need to be organized and analyzed.
Assumptions have already been factored into the determination of required quantities (section 5). However, when other supply planning data (shipments on order, arrival dates, lead times, stock on hand) are unavailable, incomplete, unreliable, or when significant future changes to the program are expected, additional assumptions will need to be made, proxy data will need to be used, or both.
In addition, financial resources available for procurement and delivery of the commodities, human resource capacity, storage capacity, and capacity of the health system to deliver services must be assessed at this stage.
22 Formulas 5 and 6 in box 5-2 (Cr = CR × AU and Cr = CP × RP, respectively) or formula 2 in box 5-6 [QA = QT + (QT × AU)].

Section 7. Supply Planning 55
sect
ion
7
Building the Supply Planning AssumptionsEach assumption and the source of information must be documented. Consensus on the assumptions must be reached within the quantification team. Assumptions that may need to be built for supply planning are outlined in section 4 under Making Assumptions for Supply Planning of ACTs and RDTs on page 30.
2. Enter Data on Projected Monthly ConsumptionData: Monthly consumption of ACTs and RDTs
Assumptions: Seasonality of malaria; proportion of cases expected to be diagnosed or treated
Start with the product QA from the forecasting exercise in section 5 (in the case of the morbidity-based forecast) or Cr (in the case of of the consumption-based forecast). If the forecasting exercise produced a monthly forecast, these data should be used as is because they already incorporate monthly changes in projected consumption due to factors such as seasonality, and this step should be skipped. If the product of the forecasting exercise was an annual (or semi-annual or quarterly) projected consumption of each ACT and RDT, these data will need to be divided into months which will need to take seasonality into account as follows.
Seasonal changes for malaria are relatively predictable; however, seasonal changes for ACTs and RDTs are less predictable. Although treatment with ACTs is likely to increase during the rainy or malaria season and decrease during the dry season, RDT use is not likely to drop and rise as drastically as ACTs because the number of patients presenting with fever for which a test will need to be performed will not show as many peaks and troughs.
Plot graphs of the previous year’s consumption (for ACTs and RDTs separately) or malaria cases in the last comparable season or endemic cycle by month to assess the trends in the variation of demand (figures 7-2 and 7-3).
Feve
r cas
es (p
er 1,
000
popu
latio
n)
Jan.
Feb.
Mar
.A
pr.
May
Jun. Jul.
Aug
.Se
p.O
ct.
Nov
.D
ec.
500
400
300
200
100
0
Jan.
Feb.
Mar
.A
pr.
May
Jun. Jul.
Aug
.Se
p.O
ct.
Nov
.D
ec.
500
400
300
200
100
0
ACT
cons
umpt
ion
(1,0
00 tr
eatm
ent c
ours
es)
Figure 7-2. Cases of fever by month (2010) Figure 7-3. Consumption of ACTs by month (2010)
The goal of this step is to determine the burden by the spike in cases or consumption, how many spikes there are, and the gradient of the spike. Ratios of expected (projected) consumption by month (C) can then be compiled for the procurement period to determine to what extent consumption will increase during these periods of higher incidence. In all cases, additional stocks should arrive in anticipation of the rise in the number of cases or consumption.
The output of this step will be projected consumption by month (C), taking seasonality into account.
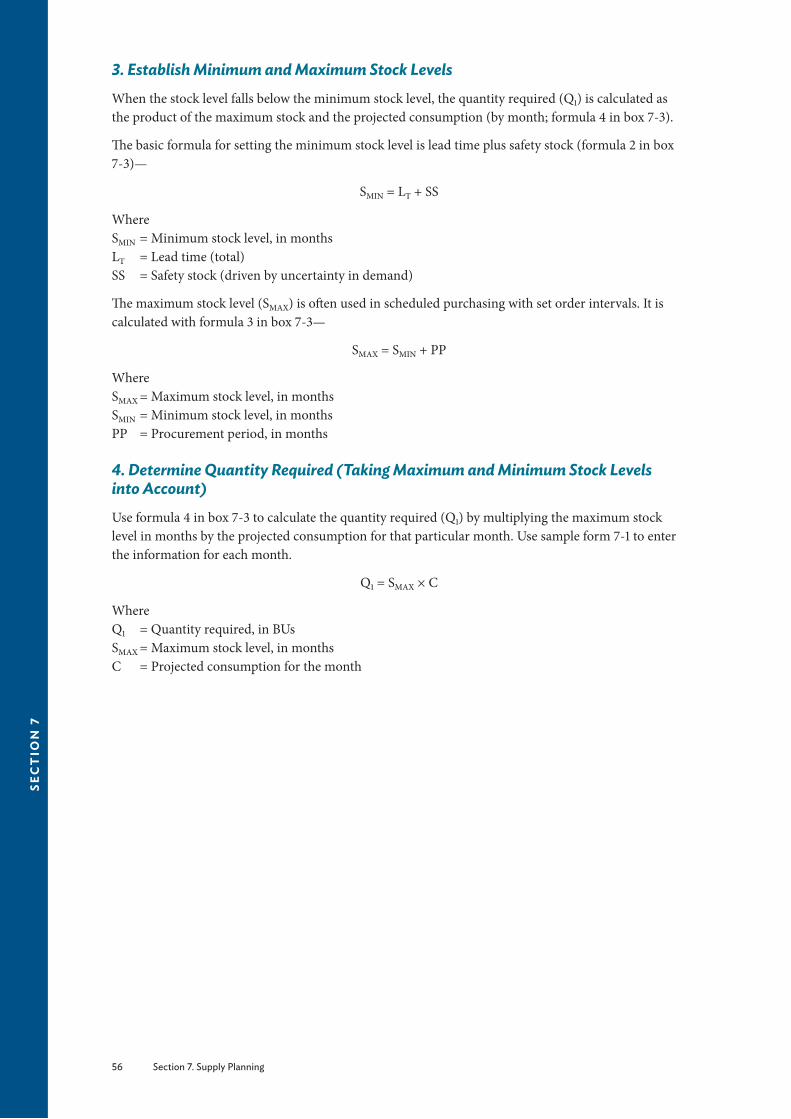
56 Section 7. Supply Planning
sec
tio
n 7
3. Establish Minimum and Maximum Stock LevelsWhen the stock level falls below the minimum stock level, the quantity required (Q1) is calculated as the product of the maximum stock and the projected consumption (by month; formula 4 in box 7-3).
The basic formula for setting the minimum stock level is lead time plus safety stock (formula 2 in box 7-3)—
SMIN = LT + SS
WhereSMIN = Minimum stock level, in monthsLT = Lead time (total)SS = Safety stock (driven by uncertainty in demand)
The maximum stock level (SMAX) is often used in scheduled purchasing with set order intervals. It is calculated with formula 3 in box 7-3—
SMAX = SMIN + PP
WhereSMAX = Maximum stock level, in monthsSMIN = Minimum stock level, in monthsPP = Procurement period, in months
4. Determine Quantity Required (Taking Maximum and Minimum Stock Levels into Account)Use formula 4 in box 7-3 to calculate the quantity required (Q1) by multiplying the maximum stock level in months by the projected consumption for that particular month. Use sample form 7-1 to enter the information for each month.
Q1 = SMAX × C
WhereQ1 = Quantity required, in BUsSMAX = Maximum stock level, in monthsC = Projected consumption for the month

Section 7. Supply Planning 57
sect
ion
7
Sam
ple
Form
7-1
. Sup
ply
Plan
ning
Mat
rix
Qua
ntity
Req
uire
dM
axim
um st
ock l
evel
:
Min
imum
stoc
k lev
el:
Mon
thPr
ojec
ted
Cons
umpt
ion
(C)
Stoc
k on
Han
d (S
OH
)St
ock
on O
rder
(SO
)Q
uant
ity R
equi
red
Q
1 = C
× S
MAX
Mon
ths o
f Sto
ck
MOS =
SOH
+ S
OO
Janu
ary
Febr
uary
Mar
chA
pril
May
June
July
Aug
ust
Sept
embe
rO
ctob
erN
ovem
ber
Dec
embe
r
Qua
ntity
to O
rder
Mon
thQ
uant
ity R
equi
red
(Q1)
Qua
ntity
to O
rder
Q
O =
Q1 -
(SOH
+ S
OO
)Su
pplie
r(s)
Ord
er P
lace
d (D
ate)
Endi
ng B
alan
ceSh
ipm
ent E
xpec
ted
Janu
ary
Febr
uary
Mar
chA
pril
May
June
July
Aug
ust
Sept
embe
rO
ctob
erN
ovem
ber
Dec
embe
r

58 Section 7. Supply Planning
sec
tio
n 7
5. Determine Quantity to Order (Taking the Existing Pipeline into Account)Data: Procurement period, quantity on hand and on order, expiry dates
Assumptions: Minimum and maximum stock levels
Obtain the quantity of stock (in packs) to order (Q1), taking minimum and maximum stock levels into account, and deduct the stock on hand (SOH) and the quantity on order (SOO) (formula 5 in box 7-3). SOH is the total stock in the pipeline, a quantity that may be obtained from the CMS or the procurement unit at the Ministry of Health. In addition, any products that expire before being used will also need to be subtracted. Consultation and coordination across different donors, partners, the Ministry of Health, and procurement mechanisms will need to be conducted to ensure that all the stocks being procured by various agencies are accounted for.
QO = Q1 – (SOH + SOO)
WhereQ1 = Quantity required after taking minimum and maximum stock levels and seasonality into
account QO = Quantity to order, in BUsSOH = Stock in inventory, in BUsSOO = Stock on order, in BUs
Figure 7-4 shows an ideal inventory control system where orders are placed when the stock levels reach the established minimum, and orders arrive before any of the safety stock is used up.
Note: When the stock levels reach the established minimum, the placing of an order will be required.
If a software program is not in use, a supply planning matrix may help the quantification team visualize all the data needed (sample form 7-1).
WorkingInventory
Time (months)
AverageStock
Safety Stock
Act
ual S
tock
ReceiptReorder
LeadTime Safety Stock
Receipt
Max.
Min.
Reorder
LeadTime
I
S
Figure 7-4. Ideal inventory control system
6. Determine When to Place the Order, Depending on Supplier Lead TimeThe procurement order quantity should be sufficient to last until the next procurement cycle is completed. The procurement process may take several months. In addition, after an order is placed, several more months are often required for the pharmaceuticals to arrive in the country, clear customs, and reach the central warehouse. The waiting period from the time an order is prepared until it arrives

Section 7. Supply Planning 59
sect
ion
7
in the country and is available for use is called the lead time. Step 4 in this section has already indicated that orders should be placed when stock levels fall below the minimum level, which is determined, in part, by lead time. The lead time can vary for each product, supplier, or both and must be monitored as part of supplier performance. When lead times are underestimated, the likely results are shortages and more expensive emergency purchases. Box 7-1 and annex G illustrate what factors influence lead times and potential lead times by donors and suppliers.
Note that RDTs have multiple brands and suppliers, so lead times are likely to vary significantly across the various brands.
For both ACTs and RDTs, staggered deliveries are preferable because of short shelf-life, stability issues, and the need for cool storage conditions. Plan for shipments to arrive before expected increases in malaria episodes from seasonality of transmission, for example, before the rainy season.
Remember, the orders should be placed so that the products arrive before the peaks in consumption or cases (figure 7-3). Prepare proposed shipping schedules (separately for each supplier) for quantities that must be procured.
Timely ordering is achieved through efficient pipeline monitoring, which includes—
■ Monitoring stock balances, in terms of quantities and MOS in the entire program (aggregate of stock at all levels)
■ Comparing stock balances to maximum and minimum stock levels
■ Identifying potential pipeline problems (quantities needed, stock-outs, balances below minimum or above maximum)
7. Estimate Costs for Each ACT and RDT and Total CostTo estimate the total procurement costs, multiply the quantities estimated for each product by the most accurate prediction of the expected next-purchase price (not the last purchase price).
In some cases, the pack price is used as the basis for making these projections, but in many cases, using the BU23 price is preferable, because combining information from different sources to arrive at an average allows for greater flexibility. The BU price is also preferable if it is unclear what pack sizes will be ordered or if projections are based on average international prices from a source such as the International Drug Price Indicator Guide (MSH 2010).
After the estimated procurement value has been calculated for each product, the next step will be to add up the estimated procurement values for all products to obtain the total expected cost for the procurement.
Estimates on the costs of insurance and freight, customs clearance, and import taxes as well as in-country storage and distribution costs may need to be added to the cost of the ACTs and RDTs if they are not included in the supplier costs. In addition, the costs of transport, security, and warehousing should be considered for each of the ACTs and RDTs (box 7-4). When using multiple sources of funds, check which costs are covered and what provisions are made for associated expenses such as customs clearance or distribution.
23 For ACTs, the BU is one pre-pack.

60 Section 7. Supply Planning
sec
tio
n 7
Box 7-4. Cost Components of ACTs and RDTs
§ Cost of ACT or RDT § Freight, insurance § Customs clearance § Taxes and tariffs (if applicable) § Transport
§ Security § Warehousing and storage § Distribution § Quality control
8. Compare Total Costs with Budget and Make Adjustments or Mobilize Additional ResourcesNote: Skip this step if writing a proposal for a grant (for example, to the Global Fund) and revisit if the proposal is not fully funded.
If the total expected procurement cost exceeds the available budget, the quantification team is faced with limited choices—identify funding gaps and advocate with other groups to obtain more funds, reduce the number or quantities, or do both, for the products ordered. Several approaches can be used to reduce the quantities, two of which are suitable for ACTs and RDTs—
■ Use the so-called equal misery approach whereby the total quantities are reduced by a proportion corresponding to the deficit in the budget.
■ Return to the forecasting assumptions, and reduce the number of malaria episodes that will be treated. This technique is the preferred one for ACTs and RDTs. The minimums and maximums should not be changed or revisited.
After adjusting the forecasting assumptions, the team will need to repeat the steps in the quantification process to obtain the quantity to order.
9. Validate the Supply PlanValidate the supply plan by discussing it with key stakeholders, and refine it as needed, taking into account sources of funds for the quantities needed to identify gaps or overlaps in resources.
10. Carry Out a Risk Assessment and Troubleshoot ProblemsAs always, contingency plans and emergency solutions may need to be developed to address vulnerabilities in the supply process. Some activities that may be especially risky are—
■ Inaccurate forecasted quantities ■ Delayed grant signature ■ Delayed disbursements ■ Long supplier lead-time ■ Delayed tender evaluation and award ■ Delayed customs clearance ■ Failed pre-shipment quality assessment
The confidence in forecasted levels decreases over time, and although forecasts may be prepared three to five years in advance for planning and budgetary purposes, orders should not be placed more frequently than annually.
The next step in the supply process is the development of a distribution plan to the intermediate levels and peripheral facilities. This step is beyond the scope of this manual.
The final step is to evaluate the quantification process. Instructions for how this may be done are provided in annex H.
Section 8. Workbook for Quantification of ACTs and RDTs for the Consumption and Morbidity Methods of Forecasting 61
sect
ion
8
Section 8. Workbook for Quantification of ACTs and RDTs for the Consumption and Morbidity Methods of ForecastingThis section lays out the steps for quantification in a stepwise fashion. Examples are included for illustration purposes. Users can fill in their own data and follow the steps to carry out their own quantification and compare their calculation with the sample calculations. A master table with all the calculations is also included at the end of each method, and blank master tables are available in annex F.
Forecasting ■ If central-level consumption data are available, follow steps outlined in Steps for Using National-Level Consumption Data for Forecasting in section 5 on page 34.
■ If central-level data are incomplete but data exists for some representative or standard facilities or districts, start with Steps for Using the Proxy Consumption-Based Method for Forecasting in section 5 on page 39.
■ If morbidity data are available, follow the steps in Steps for Using the Morbidity-Based Method for Forecasting in section 5 on page 42.
The sources of data and the detailed assumptions that must be made for conducting the quantification are discussed in detail in table 4-1 on page 24.
Steps for Using National-Level Consumption Data for ACT and RDT Forecasting
Planning
Before embarking on the consumption-based method of quantification, the following questions must be answered—
■ Are data on past consumption available? ■ Are the data accurate and complete? ■ How accurate (give a percentage, if possible) are the data?
Box 8-1. Summary of Data Needed for Consumption-Based Forecasting § List of all ACTs and RDTs § Inventory records on consumption over the past year § Information on stock-outs of the products for the duration of the review period § Projected changes in consumption patterns
SECT
ION
8

62 Section 8. Workbook for Quantification of ACTs and RDTs for the Consumption and Morbidity Methods of Forecasting
sec
tio
n 8
1. Determine the Period to be Reviewed for ConsumptionFor more details, refer to page 35 (Section 5. Forecasting).
Data: Data on seasonal variations
Assumption: Seasonal variation likely to continue within forecast period24
6 months ______12 months ______Other (specify) ______
Box 8-2. Example: Scenario Using the Consumption MethodThe recommended first-line treatment for uncomplicated malaria in a hypothetical country X1 is AL, available as a co-formulated tablet containing 20 mg of artemether and 120 mg of lumefantrine. The table below presents the available data for use in the calculations. You have been asked to carry out a forecast for 9 months (January-September 2013).Available Data from Hypothetical Country X1Parameter ValueConsumption period in months 9Average number of days per month 30.5Number of days out of stock 15Annual rate of growth 3%Procurement period in months 9Loss adjustment factor 5%Note: RDTs are being introduced during this period and the quantification committee decided to assume that 50% of cases would be diagnosed using RDTs. They also decided that the consumption of ACTs is not likely to change in the coming 9 months.
Box 8-3 lists the formulas needed for consumption-based calculations.
24 Use same review period as forecast period.
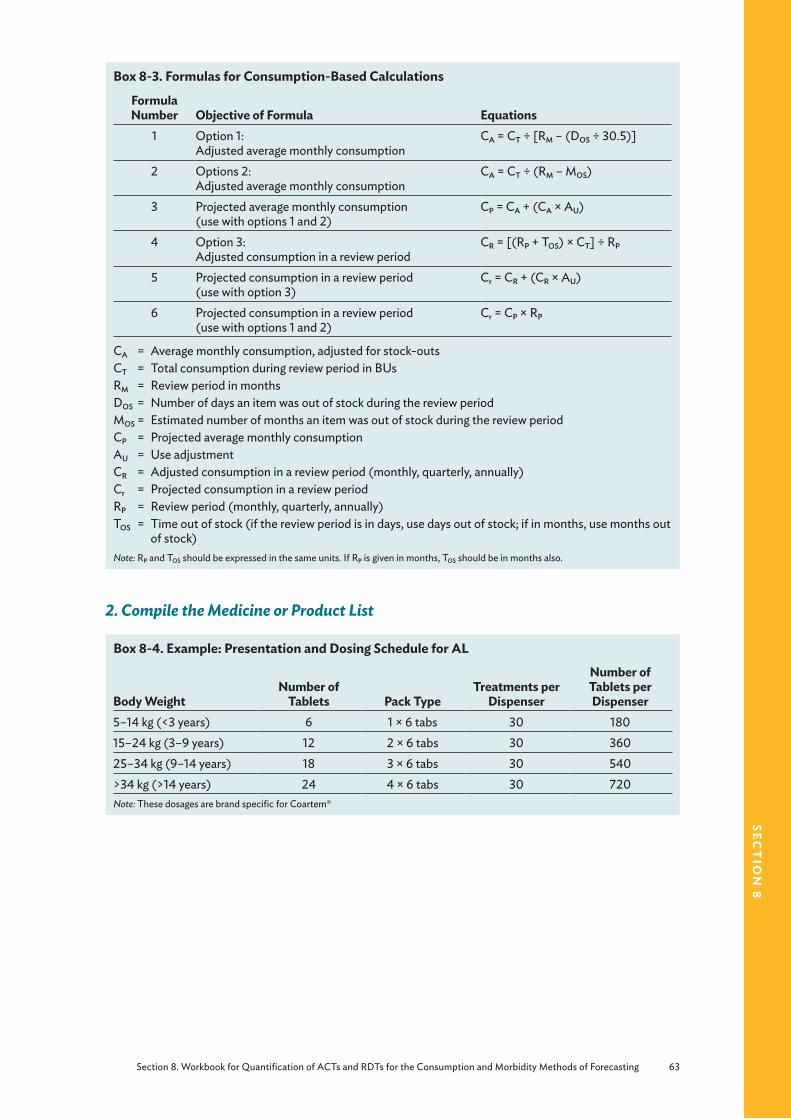
Section 8. Workbook for Quantification of ACTs and RDTs for the Consumption and Morbidity Methods of Forecasting 63
sect
ion
8
Box 8-3. Formulas for Consumption-Based Calculations
Formula Number Objective of Formula Equations
1 Option 1: Adjusted average monthly consumption
CA = CT ÷ [RM – (DOS ÷ 30.5)]
2 Options 2:Adjusted average monthly consumption
CA = CT ÷ (RM – MOS)
3 Projected average monthly consumption (use with options 1 and 2)
CP = CA + (CA × AU)
4 Option 3:Adjusted consumption in a review period
CR = [(RP + TOS) × CT] ÷ RP
5 Projected consumption in a review period (use with option 3)
Cr = CR + (CR × AU)
6 Projected consumption in a review period (use with options 1 and 2)
Cr = CP × RP
CA = Average monthly consumption, adjusted for stock-outsCT = Total consumption during review period in BUsRM = Review period in monthsDOS = Number of days an item was out of stock during the review periodMOS = Estimated number of months an item was out of stock during the review periodCP = Projected average monthly consumptionAU = Use adjustmentCR = Adjusted consumption in a review period (monthly, quarterly, annually)Cr = Projected consumption in a review periodRP = Review period (monthly, quarterly, annually)TOS = Time out of stock (if the review period is in days, use days out of stock; if in months, use months out
of stock)Note: RP and TOS should be expressed in the same units. If RP is given in months, TOS should be in months also.
2. Compile the Medicine or Product List
Box 8-4. Example: Presentation and Dosing Schedule for AL
Body WeightNumber of
Tablets Pack TypeTreatments per
Dispenser
Number of Tablets per Dispenser
5–14 kg (<3 years) 6 1 × 6 tabs 30 18015–24 kg (3–9 years) 12 2 × 6 tabs 30 36025–34 kg (9–14 years) 18 3 × 6 tabs 30 540>34 kg (>14 years) 24 4 × 6 tabs 30 720Note: These dosages are brand specific for Coartem®

64 Section 8. Workbook for Quantification of ACTs and RDTs for the Consumption and Morbidity Methods of Forecasting
sec
tio
n 8
3. Review and Enter Data on Historical Consumption for Each Malaria Product for the Review Period
Data: Product list, consumption in review period, period of time out of stock for each product
Assumption: Records of stocks issued from lowest level available is a proxy for consumption
For each product on the list, enter the following in sample form 8-1—
■ The strength, unit, and pack size for each ACT dosage unit
■ The unit and pack size for each RDT
■ The total quantity used during the review period in BUs
• For pre-packed ACTs (i.e., patient packs that contain a course of treatment), the BU is the whole pack; each pack size should be quantified separately
• Alternatively, enter this data in columns a, b, c, and d in master table 8-1
• For RDTs, the total annual consumption is in tests, rather than in packs.
Note: To obtain the quantity of packs, divide the total number of tests used by the pack size. To obtain the quantity of tests, multiply the total number of packs used by the number of tests in each pack.
Note: Leave the data in the form it arrived in—that is, if available as monthly data, keep as monthly data; if available as aggregated data for the year, leave as is.
■ The number of days in the review period that the product was out of stock.
Note: If the number of days out of stock cannot be accurately determined, the estimated number of months out of stock during the period can be entered.
Sample Form 8-1. Consumption Data
ACT or RDT
Strength (if applicable) BU
Pack Type
Review Period in Months (RM)*
Number of Days or Months out of
Stock (DOS)
Consumption Data for the
Review Period (CT)
* The same 9 months should be used as the review period for past consumption.
Box 8-5. Example: Consumption Data
The table below provides the consumption data in country X1.
ACT BU Pack TypeReview Period in
Months (RM)
Number of Days or Months out of
Stock (DOS)
Consumption Data for the Review
Period (CT)AL Pack 1 × 6 tabs 9 15 60,625AL Pack 2 × 6 tabs 9 15 45,350AL Pack 3 × 6 tabs 9 15 28,835AL Pack 4 × 6 tabs 9 15 112,049

Section 8. Workbook for Quantification of ACTs and RDTs for the Consumption and Morbidity Methods of Forecasting 65
sect
ion
8
4. Calculate Adjusted Consumption in a Review Period (Adjusted for Stock-Outs)Data: Product list, consumption in review period, period of time out of stock for each product
Assumption: Consumption during stock-out period is the same as if there had been no stock-out
Method 1: If days out of stock can be obtained, use the following method to adjust for stock outs.
Use formula 1 in box 8-3 to calculate the average monthly consumption. Enter the total consumption (CT) in sample form 8-2, and divide it by the number of months in the review period (RM) minus the result of the total number of days out of stock in the same period divided by 30.5 (to convert to months), that is—
CA = CT ÷ [RM – (DOS ÷ 30.5)]
WhereCA = Adjusted consumption (for stock-outs)CT = Total consumption during the review periodRM = Review period, in monthsDOS = Number of days item was out of stock during the review period
Sample Form 8-2. Average Monthly Consumption
ACT or RDTConsumption Data for the Review
Period CT
Average Monthly ConsumptionCA = CT ÷ [RM – (DOS ÷ 30.5)]
Method 2: If the days out of stock cannot be obtained, use the following alternative method (formula 2 in box 8-3), which is simpler but less precise.
CA = CT ÷ (RM – MOS)
WhereCA = Adjusted consumption, adjusted for stock-outsCT = Total consumption during the review periodRM = Review period in monthsMOS = Estimated number of months an item was out of stock during the review period
This method uses the estimated number of months out of stock for adjusting consumption, thereby omitting the step of converting days to months.
For both of the above methods, if the data was aggregated when it arrived, convert it back to the original form by multiplying by the number of months (formula 6 in box 8-3).
Cr = CP × RP
WhereCr = Projected consumption in a review periodCP = Projected average monthly consumptionRP = Review period (months, quarterly, annually)

66 Section 8. Workbook for Quantification of ACTs and RDTs for the Consumption and Morbidity Methods of Forecasting
sec
tio
n 8
Method 3: Alternatively, if an average monthly consumption is not being used, each month’s or quarter’s data must be adjusted for stock-outs (formula 4).
CR = [(RP + TOS) × CT] ÷ RP
WhereCR = Adjusted consumption in a review period (monthly, quarterly, annual)RP = Review period (months, quarter or annual)TOS = Time out of stock (if the review period is in days, use days out of stock; if in months, use
months out of stock)CT = Total consumption during the review period
Box 8-6. Example: Average Monthly Consumption
ACTConsumption Data
for Review Period (CT)Average Monthly Consumption
CA = CT ÷ [RM – (DOS ÷ 30.5)]AL 1 × 6 tabs 60,625 60,625 ÷ [9 – (15 ÷ 30.5)] = 7,123AL 2 × 6 tabs 45,350 45,350 ÷ [9 – (15 ÷ 30.5)] = 5,329AL 3 × 6 tabs 28,835 28,835 ÷ [9 – (15 ÷ 30.5)] = 3,388AL 4 × 6 tabs 112,049 112,049 ÷ [9 – (15 ÷ 30.5)] = 13,167
5. Calculate the Projected Average Monthly Consumption for Expected Changes in Consumption Pattern
Data: Adjusted consumption (step 3), data on policy changes
Assumption: Expected changes in consumption pattern (e.g., consumption will increase by 5 percent) and completeness of reporting (Making Assumptions for Forecasting of ACTs and RDTs in section 4)
If use is expected to increase by 5 percent in the coming year, the adjusted consumption in a review period should be adjusted by 5 percent.
Use formula 3 or 5 (box 8-3) to calculate the projected average monthly consumption:
CP = CA + (CA × AU)or
Cr = CR + (CR × AU)
WhereCP = Projected average monthly consumptionCA = Average monthly consumption, adjusted for stock outsCR = Adjusted consumption in a review period (monthly, quarterly, annually)Cr = Projected consumption in a review periodAU = Use adjustment
Multiply the adjusted consumption CA or CR with the adjustment factor AU to obtain the absolute increase in consumption or adjustment quantity. The projected consumption CP is the sum of CA or CR and the adjustment quantity (see sample form 8-3 and column g in master table 8-1).
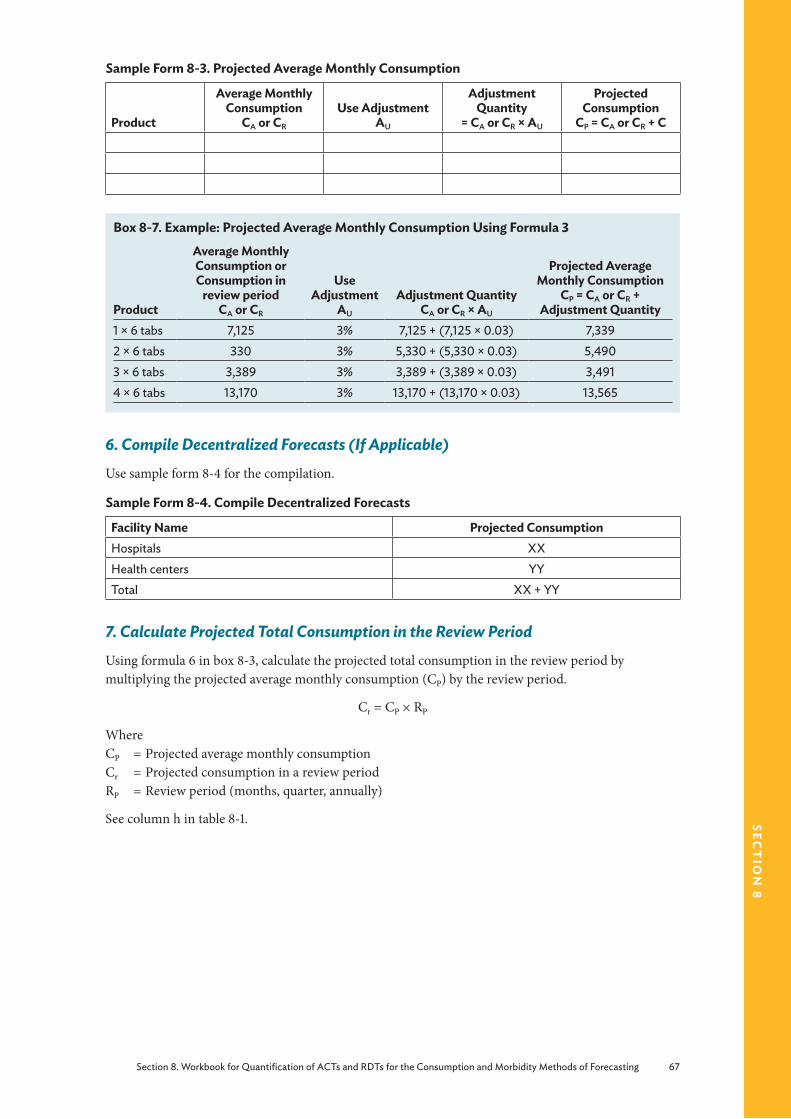
Section 8. Workbook for Quantification of ACTs and RDTs for the Consumption and Morbidity Methods of Forecasting 67
sect
ion
8
Sample Form 8-3. Projected Average Monthly Consumption
Product
Average Monthly Consumption
CA or CR
Use AdjustmentAU
Adjustment Quantity
= CA or CR × AU
Projected Consumption
CP = CA or CR + C
Box 8-7. Example: Projected Average Monthly Consumption Using Formula 3
Product
Average Monthly Consumption or Consumption in
review period CA or CR
Use Adjustment
AU
Adjustment Quantity CA or CR × AU
Projected Average Monthly Consumption
CP = CA or CR + Adjustment Quantity
1 × 6 tabs 7,125 3% 7,125 + (7,125 × 0.03) 7,3392 × 6 tabs 330 3% 5,330 + (5,330 × 0.03) 5,4903 × 6 tabs 3,389 3% 3,389 + (3,389 × 0.03) 3,4914 × 6 tabs 13,170 3% 13,170 + (13,170 × 0.03) 13,565
6. Compile Decentralized Forecasts (If Applicable)Use sample form 8-4 for the compilation.
Sample Form 8-4. Compile Decentralized Forecasts
Facility Name Projected ConsumptionHospitals XXHealth centers YYTotal XX + YY
7. Calculate Projected Total Consumption in the Review PeriodUsing formula 6 in box 8-3, calculate the projected total consumption in the review period by multiplying the projected average monthly consumption (CP) by the review period.
Cr = CP × RP
WhereCP = Projected average monthly consumptionCr = Projected consumption in a review periodRP = Review period (months, quarter, annually)
See column h in table 8-1.
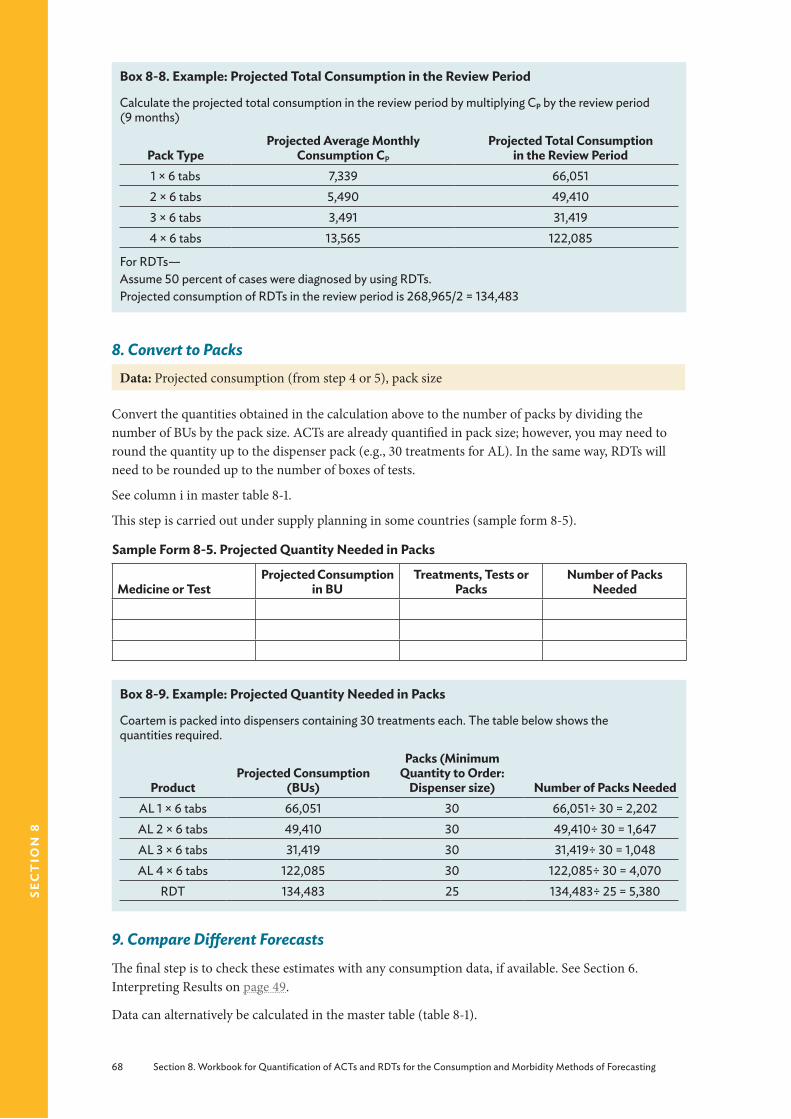
68 Section 8. Workbook for Quantification of ACTs and RDTs for the Consumption and Morbidity Methods of Forecasting
sec
tio
n 8
Box 8-8. Example: Projected Total Consumption in the Review Period
Calculate the projected total consumption in the review period by multiplying CP by the review period (9 months)
Pack TypeProjected Average Monthly
Consumption CP
Projected Total Consumption in the Review Period
1 × 6 tabs 7,339 66,0512 × 6 tabs 5,490 49,4103 × 6 tabs 3,491 31,4194 × 6 tabs 13,565 122,085
For RDTs—Assume 50 percent of cases were diagnosed by using RDTs.Projected consumption of RDTs in the review period is 268,965/2 = 134,483
8. Convert to PacksData: Projected consumption (from step 4 or 5), pack size
Convert the quantities obtained in the calculation above to the number of packs by dividing the number of BUs by the pack size. ACTs are already quantified in pack size; however, you may need to round the quantity up to the dispenser pack (e.g., 30 treatments for AL). In the same way, RDTs will need to be rounded up to the number of boxes of tests.
See column i in master table 8-1.
This step is carried out under supply planning in some countries (sample form 8-5).
Sample Form 8-5. Projected Quantity Needed in Packs
Medicine or TestProjected Consumption
in BUTreatments, Tests or
PacksNumber of Packs
Needed
Box 8-9. Example: Projected Quantity Needed in Packs
Coartem is packed into dispensers containing 30 treatments each. The table below shows the quantities required.
ProductProjected Consumption
(BUs)
Packs (Minimum Quantity to Order:
Dispenser size) Number of Packs NeededAL 1 × 6 tabs 66,051 30 66,051÷ 30 = 2,202AL 2 × 6 tabs 49,410 30 49,410÷ 30 = 1,647AL 3 × 6 tabs 31,419 30 31,419÷ 30 = 1,048AL 4 × 6 tabs 122,085 30 122,085÷ 30 = 4,070
RDT 134,483 25 134,483÷ 25 = 5,380
9. Compare Different ForecastsThe final step is to check these estimates with any consumption data, if available. See Section 6. Interpreting Results on page 49.
Data can alternatively be calculated in the master table (table 8-1).

Section 8. Workbook for Quantification of ACTs and RDTs for the Consumption and Morbidity Methods of Forecasting 69
sect
ion
8
Tabl
e 8-
1. Ca
lcul
atio
ns U
sing
the
Cons
umpt
ion-
Base
d M
etho
d: M
aste
r Tab
le
ab
cd
ef
gh
i
Med
icin
eSt
reng
thBU
Tota
l Co
nsum
ptio
n in
Pe
riod
(BU
) C T
Day
s out
of
Stoc
k D
OS
Adj
uste
d Av
erag
e M
onth
ly
Cons
umpt
ion
(BU
) C A
Proj
ecte
d Av
erag
e M
onth
ly
Cons
umpt
ion
(BU
) C P
Proj
ecte
d To
tal
Cons
umpt
ion
in th
e Re
view
Per
iod
(BU
) C r
Qua
ntity
Nee
ded
(box
es )
AL
20/1
20Pa
ck (1
× 6
)60
,625
157,1
237,
339
66,0
5166
,051
÷ 3
0 =
2,20
2A
L20
/120
Pack
(2 ×
6)
45,3
5015
5,32
95,
490
49,4
1049
,410
÷ 3
0 =
1,647
AL
20/1
20Pa
ck (3
× 6
)28
,835
153,
388
3,49
131
,419
31,4
19 ÷
30
= 1,0
48A
L20
/120
Pack
(4 ×
6)
112,
049
1513
,167
13,5
6512
2,08
512
2,08
5 ÷
30 =
4,0
70RD
TTe
st13
4,48
313
4,48
3 ÷
25 =
5,3
80N
ote:
A b
lank
tabl
e fo
r ent
erin
g dat
a is
avai
labl
e in
ann
ex F.

70 Section 8. Workbook for Quantification of ACTs and RDTs for the Consumption and Morbidity Methods of Forecasting
sec
tio
n 8
Steps for Using the Proxy Consumption-Based Method for ForecastingSee page 39 for more details on using the proxy consumption-based method.
Box 8-10. Example: Scenario Using the Proxy Consumption Method
The recommended first-line treatment for uncomplicated malaria in a hypothetical country X1 is AS/AQ, available as a co-formulated tablet. Consumption data from country X1 is not available. However, data from a nearby “standard” country that matches the epidemiological profile of country X1 is available. The table below presents the available data for use in the calculations. The requested forecast is for 9 months (January-September 2013).
Available Data from Hypothetical Standard Country X1
Parameter ValueConsumption period 9Average number of days per month 30.5Number of days out of stock 15Procurement period in months 9Expected growth and future change in consumption 5%
1. Select the Standard System for Comparison and ExtrapolationData: Geography, climate, patient population, morbidity patterns including complete and accurate records of treatment episodes, prescribing practices, treatment guidelines, EMLs, and pharmaceutical supply status of standard and target supply system
Assumption: Projected consumption in the target system will be similar to past consumption in the standard system
The standard facilities should, if feasible, closely resemble the region or country for which the estimate is made in terms of geography, climate, patient population, morbidity patterns, prescribing practices, treatment guidelines, EMLs, and pharmaceutical supply status.
Identify the standard facilities, that is, a sample of facilities that are representative of their levels of facility for representative workload, acceptable medicine supply, rational prescription, and consumption (sample form 8-6).
Sample Form 8-6. Examples of Standard Facilities
Type of Facility Number of FacilitiesHospitalHealth centerDispensary or health post
Box 8-11. Example of Standard Facilities from Standard System in Country XType of Facility Number of FacilitiesHospital 6Health center 24Dispensary or health post 36
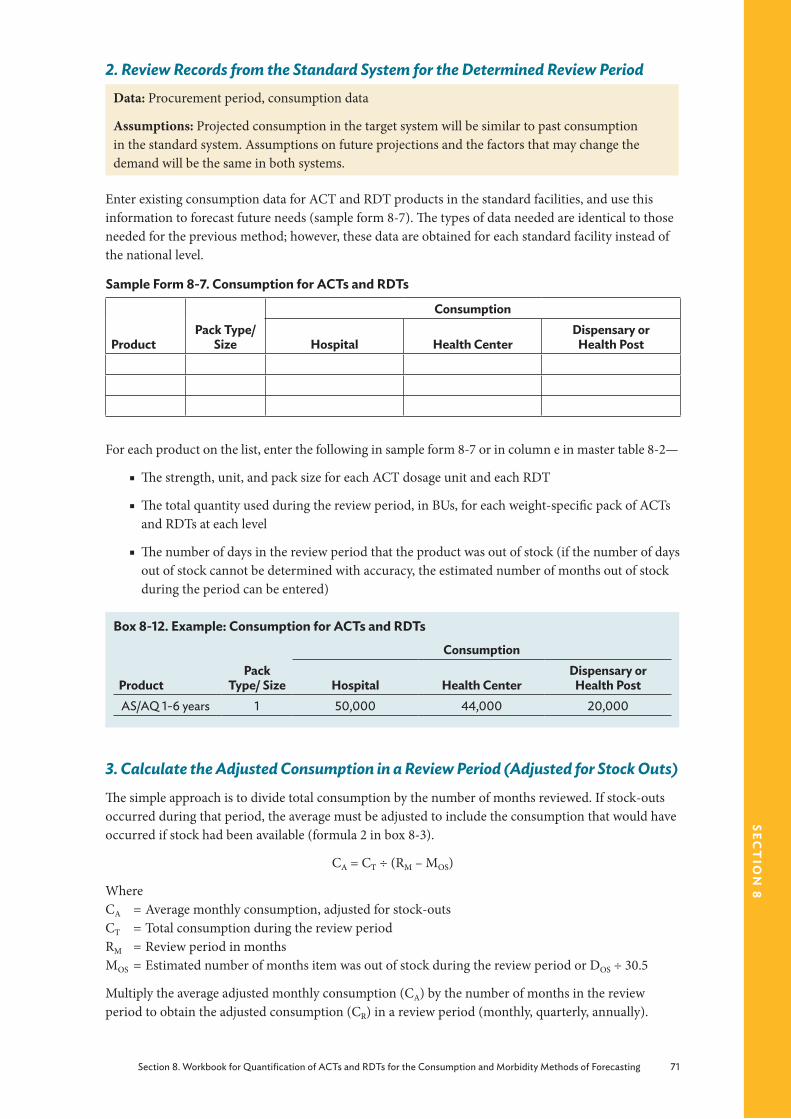
Section 8. Workbook for Quantification of ACTs and RDTs for the Consumption and Morbidity Methods of Forecasting 71
sect
ion
8
2. Review Records from the Standard System for the Determined Review PeriodData: Procurement period, consumption data
Assumptions: Projected consumption in the target system will be similar to past consumption in the standard system. Assumptions on future projections and the factors that may change the demand will be the same in both systems.
Enter existing consumption data for ACT and RDT products in the standard facilities, and use this information to forecast future needs (sample form 8-7). The types of data needed are identical to those needed for the previous method; however, these data are obtained for each standard facility instead of the national level.
Sample Form 8-7. Consumption for ACTs and RDTs
ProductPack Type/
Size
Consumption
Hospital Health CenterDispensary or
Health Post
For each product on the list, enter the following in sample form 8-7 or in column e in master table 8-2—
■ The strength, unit, and pack size for each ACT dosage unit and each RDT
■ The total quantity used during the review period, in BUs, for each weight-specific pack of ACTs and RDTs at each level
■ The number of days in the review period that the product was out of stock (if the number of days out of stock cannot be determined with accuracy, the estimated number of months out of stock during the period can be entered)
Box 8-12. Example: Consumption for ACTs and RDTs
ProductPack
Type/ Size
Consumption
Hospital Health CenterDispensary or
Health PostAS/AQ 1-6 years 1 50,000 44,000 20,000
3. Calculate the Adjusted Consumption in a Review Period (Adjusted for Stock Outs)The simple approach is to divide total consumption by the number of months reviewed. If stock-outs occurred during that period, the average must be adjusted to include the consumption that would have occurred if stock had been available (formula 2 in box 8-3).
CA = CT ÷ (RM – MOS)
WhereCA = Average monthly consumption, adjusted for stock-outsCT = Total consumption during the review periodRM = Review period in months MOS = Estimated number of months item was out of stock during the review period or DOS ÷ 30.5
Multiply the average adjusted monthly consumption (CA) by the number of months in the review period to obtain the adjusted consumption (CR) in a review period (monthly, quarterly, annually).

72 Section 8. Workbook for Quantification of ACTs and RDTs for the Consumption and Morbidity Methods of Forecasting
sec
tio
n 8
Alternatively, if an average monthly consumption is not being used, each month’s or quarter’s data must be adjusted for stock-outs using this formula:
CR = [(RP + TOS) × CT] ÷ RP
WhereCR = Adjusted consumption in a review period (monthly, quarterly, annually)CT = Total consumption during the review periodRP = Review period (months, quarter, annually)TOS = Time out of stock (if the review period is in days, use days out of stock; if in months, use
months out of stock)
4. Calculate the Projected Average Monthly Consumption for Expected Changes in Consumption PatternFollow step 4 in the previous section on consumption to obtain the projected average monthly consumption adjusted for stock-outs and future changes in consumption (column h in master table 8-2).
5. Obtain the Total Projected Average Monthly ConsumptionMultiply the projected average monthly consumption with the number of facilities of each type to obtain the total projected average monthly consumption (column j in master table 8-2).
6. Obtain the Total Projected Consumption in the Review PeriodMultiply the total projected average monthly consumption by the number of months in the review period to obtain the total projected consumption in the review period (column k in master table 8-2).
7. Obtain the Total National Projected Consumption in a Review PeriodObtain this by adding up the projected consumption in a review period for each type of health facility (column l in master table 8-2).
8. Obtain Rate of Consumption per 1,000 Treatment EpisodesThe projected consumption for the review period should be converted to standard quantities per 1,000 treatment episodes. This conversion is made by determining the number of treatment episodes of malaria treated in facilities and dividing the projected consumption in a review period by the number of episodes in the review period.
Sample Form 8-8. Rate of Consumption
Type of ProductProjected Consumption
in a Review Period CP
Number of Malaria Treatment Episodes in
Standard System ES
Rate of Consumption per 1,000 Treatment
Episodes (CS = (CP/E)/1,000)
ACT (1 × 6)ACTRDT
Box 8-13. Example: Rate of Consumption
Type of Product
National Projected Consumption in a Review Period CP
Number of Malaria Treatment Episodes in
Standard System ES
Rate of Consumption per 1,000 Treatment
Episodes (CS = [CP/E]/1,000)
AS/AQ (1-6 years) 3,842,775 3,000,000 1.28
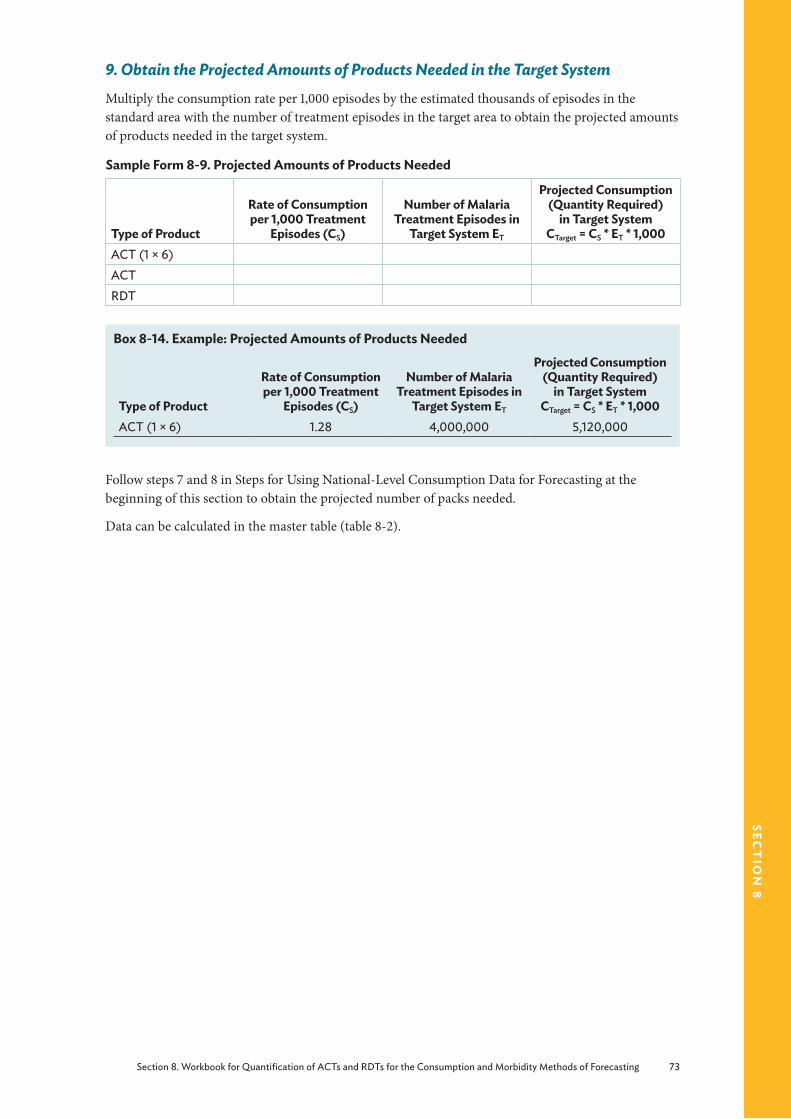
Section 8. Workbook for Quantification of ACTs and RDTs for the Consumption and Morbidity Methods of Forecasting 73
sect
ion
8
9. Obtain the Projected Amounts of Products Needed in the Target SystemMultiply the consumption rate per 1,000 episodes by the estimated thousands of episodes in the standard area with the number of treatment episodes in the target area to obtain the projected amounts of products needed in the target system.
Sample Form 8-9. Projected Amounts of Products Needed
Type of Product
Rate of Consumption per 1,000 Treatment
Episodes (CS)
Number of Malaria Treatment Episodes in
Target System ET
Projected Consumption (Quantity Required)
in Target System CTarget = CS * ET * 1,000
ACT (1 × 6)ACTRDT
Box 8-14. Example: Projected Amounts of Products Needed
Type of Product
Rate of Consumption per 1,000 Treatment
Episodes (CS)
Number of Malaria Treatment Episodes in
Target System ET
Projected Consumption (Quantity Required)
in Target System CTarget = CS * ET * 1,000
ACT (1 × 6) 1.28 4,000,000 5,120,000
Follow steps 7 and 8 in Steps for Using National-Level Consumption Data for Forecasting at the beginning of this section to obtain the projected number of packs needed.
Data can be calculated in the master table (table 8-2).

74 Section 8. Workbook for Quantification of ACTs and RDTs for the Consumption and Morbidity Methods of Forecasting
sec
tio
n 8
Tabl
e 8-
2. C
alcu
latio
ns U
sing
the
Prox
y Co
nsum
ptio
n M
etho
d: M
aste
r Tab
le
Dat
a fr
om S
tand
ard
Faci
litie
sa
bc
de
fg
hi
jk
Type
of
Stan
dard
Fa
cilit
yPr
oduc
tPa
ck
Size
BU
Tota
l Co
nsum
ptio
n in
Pe
riod
(BU
) CT
Day
s Out
of
Stoc
k D
OS
Adj
uste
d Av
erag
e M
onth
ly
Cons
umpt
ion
(BU
) CA
Proj
ecte
d Av
erag
e M
onth
ly
Util
izat
ion
(BU
) C P
Tota
l Num
ber
of F
acili
ties o
f Ea
ch T
ype
Tota
l Pro
ject
ed
Aver
age
Mon
thly
U
tiliz
atio
n
Tota
l Pro
ject
ed
Util
izat
ion
in th
e Re
view
Per
iod
(j*R
P)Re
ferra
lA
S/AQ
1 × 6
Pack
50,0
0034
10,2
3510
,747
664
,480
580,
320
Hea
lth ce
nter
AS/
AQ1 ×
6Pa
ck44
,000
308,
771
9,21
024
221,0
351,9
89,3
15H
ealth
pos
tA
S/AQ
1 × 6
Pack
20,0
0020
3,74
23,
929
3614
1,460
1,273
,140
Tota
l Con
sum
ptio
n fo
r Tar
get F
acili
ty C
alcu
late
d fr
om S
tand
ard
Faci
lity
Dat
a A
bove
lm
no
p
Prod
uct
Pack
Si
ze
Tota
l Nat
iona
l Ave
rage
Co
nsum
ptio
n in
the
Revi
ew P
erio
d*
C P
Num
ber o
f Mal
aria
Tr
eatm
ent E
piso
des i
n St
anda
rd S
yste
m E
S
Rate
of C
onsu
mpt
ion
per
1,000
Tre
atm
ent E
piso
des
(CS =
[CP/
E]/1
,000
)
Num
ber o
f Mal
aria
Tr
eatm
ent E
piso
des i
n Ta
rget
Sys
tem
E T
Proj
ecte
d Co
nsum
ptio
n (Q
uant
ity R
equi
red)
in
Targ
et S
yste
m
C Target =
CS *
ET *
1,00
0A
S/AQ
1 × 6
3,84
2,77
53,
000,
000
1.28
4,00
0,00
05,
120,
000
* Add
cons
umpt
ion
from
refe
rral, h
ealth
cent
er, a
nd h
ealth
pos
t fac
ilitie
s for
eac
h pr
oduc
t.
Not
e: A
bla
nk ta
ble
for e
nter
ing d
ata
is av
aila
ble
in a
nnex
F.
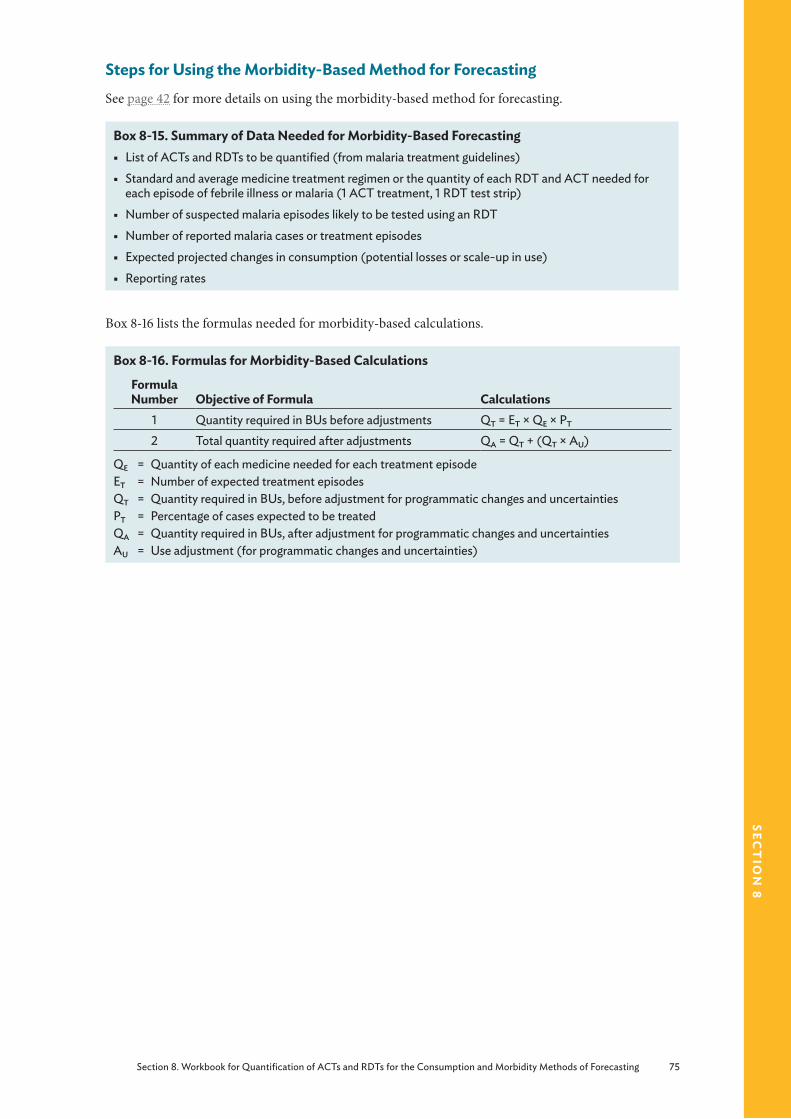
Section 8. Workbook for Quantification of ACTs and RDTs for the Consumption and Morbidity Methods of Forecasting 75
sect
ion
8
Steps for Using the Morbidity-Based Method for Forecasting See page 42 for more details on using the morbidity-based method for forecasting.
Box 8-15. Summary of Data Needed for Morbidity-Based Forecasting § List of ACTs and RDTs to be quantified (from malaria treatment guidelines)
§ Standard and average medicine treatment regimen or the quantity of each RDT and ACT needed for each episode of febrile illness or malaria (1 ACT treatment, 1 RDT test strip)
§ Number of suspected malaria episodes likely to be tested using an RDT
§ Number of reported malaria cases or treatment episodes
§ Expected projected changes in consumption (potential losses or scale-up in use)
§ Reporting rates
Box 8-16 lists the formulas needed for morbidity-based calculations.
Box 8-16. Formulas for Morbidity-Based Calculations
Formula Number Objective of Formula Calculations
1 Quantity required in BUs before adjustments QT = ET × QE × PT
2 Total quantity required after adjustments QA = QT + (QT × AU)
QE = Quantity of each medicine needed for each treatment episodeET = Number of expected treatment episodesQT = Quantity required in BUs, before adjustment for programmatic changes and uncertaintiesPT = Percentage of cases expected to be treatedQA = Quantity required in BUs, after adjustment for programmatic changes and uncertaintiesAU = Use adjustment (for programmatic changes and uncertainties)

76 Section 8. Workbook for Quantification of ACTs and RDTs for the Consumption and Morbidity Methods of Forecasting
sec
tio
n 8
Box 8-17. Example: Scenario Using the Morbidity Method
The following are excerpts from the STGs for malaria for hypothetical country X2. The recommended first-line treatment for uncomplicated malaria in country X2 is AS/AQ, which is currently available as a fixed-dose combination tablet. This tablet is administered as a three-dose regimen given over three days (see below).
Dosing Schedule for AS/AQ*
Body Weight/Age Number of Tablets Pack Type≥4.5 kg to <9 kg (2–11-month old infant) 3 3 × 25 tabs≥9 kg to <18 kg (1–5 year old child) 3 3 × 25 tabs≥18 kg to <36 kg (6–13 year old child) 3 3 × 25 tabs≥36 kg (14 and older; adult) 6 6 × 25 tabs*Brand specific
Data for Calculations
Total population 3,500,000Population distribution by age group—
<1 years <5 years 6–13 years >14 years
4% of under five population21%28%51%
Estimated number of malaria episodesChildren <5 yearsChildren >5 years
2 episodes per year1 episode per year
Expected annual rate of population increase 2.1%Adjustments for program change, transmission, emergencies
10%
Percentage use of facilities 65%Percentage treated by regimen 85%
PlanningBox 8-18 provides a checklist for using the morbidity method.
Box 8-18. Checklist for Planning for the Morbidity-Based Method § When was the last DHS?
§ What is the target population for the quantification (public, private, or Mission)?
§ Is there a breakdown of population by age group?
§ From where are estimates on disease burden obtained?
§ Are national estimates available? If not, are district-level estimates available? If not, are data available from a sample of health facilities?
§ Are the data accurate?
§ Is there a breakdown by age of disease burden? What are the age groups?
§ What is the evidence of adherence to the national treatment protocol?

Section 8. Workbook for Quantification of ACTs and RDTs for the Consumption and Morbidity Methods of Forecasting 77
sect
ion
8
1. Establish Standard or Average Treatment Regimens for ACTsData: Country malaria treatment guidelines (actual and ideal)
The following information must be compiled, as appropriate—
■ The name of each ACT and strength with separate treatments listed for each age and weight level, as appropriate
■ The number of BUs for each age and weight band (for ACTs, the basic units are one pack)
2. Calculate the Number of Fever Episodes to Determine the RDT NeedsData: Number of suspected malaria cases (i.e., fever with other malaria-like symptoms); the total number of cases tested by microscopy and RDTs; the number of positive (i.e., tested and confirmed malaria) cases; the number of negative (i.e., tested and confirmed not malaria) cases; information on scale-up plans or targets; completeness of reporting
Assumption: Percentage of patients presenting with fever that will be tested with an RDT according to the treatment guidelines and scale-up plans
Enter the available data in the columns. To calculate the number of fever episodes that will be diagnosed using RDTs, (not tested: NT) subtract CC from TM (sample form 8-10).
Sample Form 8-10. Number of Fever Episodes Diagnosed with RDTs
Test
Suspected Malaria Cases
CS
Number Tested by RDT
TR
Number Tested by Microscopy
TM
Confirmed Cases
(RDTs and Microscopy)
CC
Number not Tested
NT
Note: “Not tested” equals reported malaria cases minus confirmed malaria cases (by microscopy and RDT).
Develop a decision tree (see figure 5-2 page 44).
3. Calculate the Expected Number of Treatment Episodes for Each Standard Course of Treatment for ACTs
Data: Malaria treatment episodes or cases, reporting rate
Assumptions: Fevers (a proxy for malaria), public sector utilization rate, proportion of cases diagnosed using RDTs, proportion of cases treated with ACTs
A treatment episode is a contact with a malaria patient for which the standard course of treatment is required. The treatment episodes are calculated by using one of the options in master table 8-2.

78 Section 8. Workbook for Quantification of ACTs and RDTs for the Consumption and Morbidity Methods of Forecasting
sec
tio
n 8
Table 8-3. Number of Treatment Episodes
Option Method Example1 Using data on the number of cases of malaria
or febrile illness at the relevant level of careNumber of malaria patients as reported at the central level or a sample of health facilities
2 Using data on the number of uncomplicated malaria or incidence in the population
If the incidence of malaria in a population isN ÷ 1,000, then the number of treatment episodes is N × population at risk of malaria × 1,000
3 Using data on outpatient attendances If the number of outpatient attendance is M, and P% of them are due to malaria or fever, then the number of treatment episodes is M × P%
4 Using data on the total population If L% of the population presents to health facilities with uncomplicated malaria, then the estimated number of treatment episodes is L% × total population
4. Calculate the Number of Treatment Episodes for Each Standard Course of ACT by Age/Weight Group
Data/Assumption: Malaria episodes by age group
If the treatment episodes from step 3 are not stratified by age, then the use of one of the following options is proposed:
■ Demographic statistics ■ A sample survey ■ A prospective study ■ Data from a country that has a similar epidemiological profile by age group or proxy data from published literature
Box 8-19. Example of Population Estimates
Using population data for country X2, calculate population estimates by age group as shown.*
Population by Age Group
Age Group Calculation (proxy data) Population2–11 months 0.04 × (0.21 × 3,500,000) 29,4001–5 years [0.21 × 3,500,000] – [0.04 × (0.21 × 3,500,000)] 705,6006–13 years 3,500,000 × 0.28 980,00014 years and older 3,500,000 × 0.51 1,785,000
Calculate number of treatment episodes by age group as shown.
Treatment Episodes by Age Group
Age Group PopulationCalculation for
Number of CasesNumber of Cases in the Past Year
2–11 months 29,400 29,400 × 2 58,8001–5 years 705,600 705,600 × 2 1,411,2006–13 years 980,000 980,000 × 1 980,00014 years and older 1,785,000 1,785,000 × 1 1,785,000
Alternatively, enter the data in columns d and e in the master table 8-4.*Dosing schedule is for a specific brand of AS/AQ.

Section 8. Workbook for Quantification of ACTs and RDTs for the Consumption and Morbidity Methods of Forecasting 79
sect
ion
8
5. Calculate the Quantity of Each ACT Product Needed for the Forecast PeriodData: Treatment episodes or cases
Assumption: Proportion of cases expected to be diagnosed or treated
Use sample forms 8-11 and 8-12 to guide your calculations.
Sample Form 8-11. Quantities of RDTs Needed
Test
Suspected Malaria Cases
CS
Number Tested by
RDTTR
Number Tested by
Microscopy TM
Confirmed Cases
(RDTs and Microscopy)
CC
Number not
TestedNT
Reporting Rate
RR
Total RDT Quantity
Needed (BU) (NT + TR)/RR
The total requirements for RDTs are derived from adding together NT + TR. These requirements need to be adjusted by reporting rates RR.
RDT requirements = (NT + TR)/RR
Sample Form 8-12. Quantity of ACTs per Treatment Episode
Age Group
BU per DoseDCU
Number of Doses per
DayND
Treatment in Days
LD
Quantity per
Treatment Episode
QE
Number of Episodes
ET
Cases Treated
with Regimen
(%)PT
Total Quantity Needed
(BU)QT
The number of treatment episodes from step 4 is multiplied by the quantity of each medicine needed for a single treatment episode. This result is then multiplied by the percentage of cases that are expected to be treated. The full formula is—
QT = ET × QE × PT
WhereQT = Total quantity of each medicine needed in BUs per year (average treatment course)ET = Number of treatment episodes per monthQE = Quantity of each medicine needed for a single treatment episodePT = Percentage of cases expected to be treated by the regimen
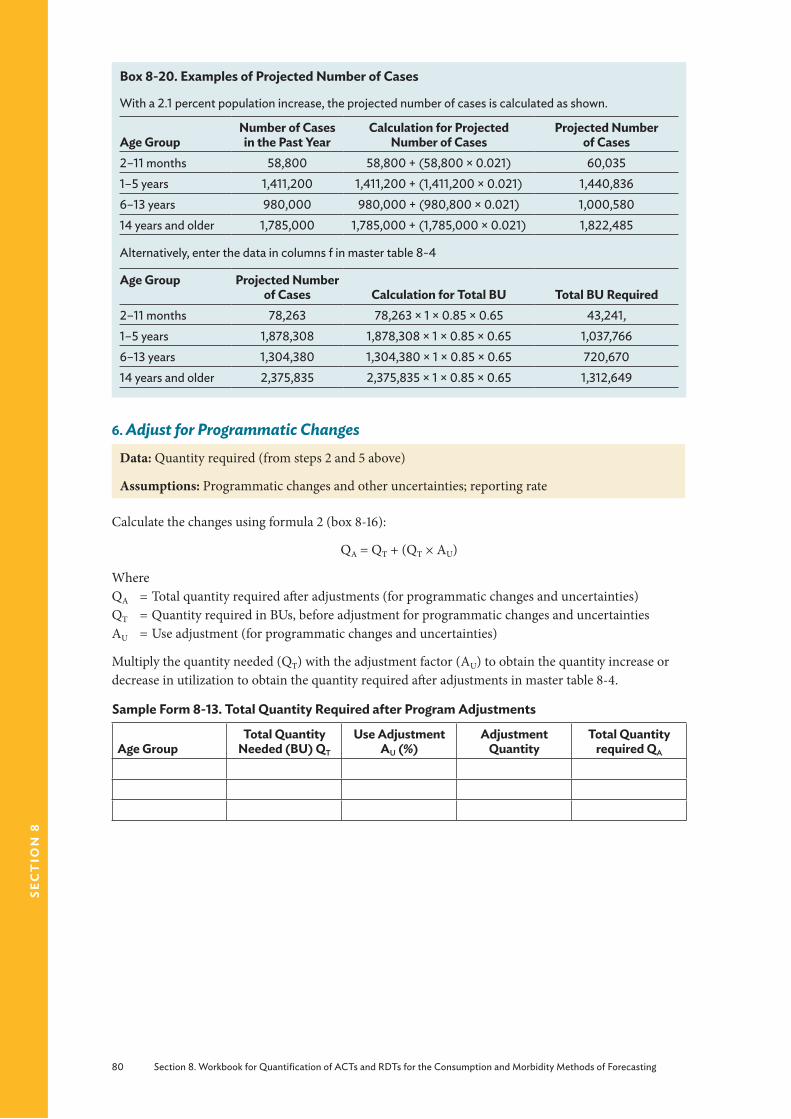
80 Section 8. Workbook for Quantification of ACTs and RDTs for the Consumption and Morbidity Methods of Forecasting
sec
tio
n 8
Box 8-20. Examples of Projected Number of Cases
With a 2.1 percent population increase, the projected number of cases is calculated as shown.
Age GroupNumber of Cases in the Past Year
Calculation for Projected Number of Cases
Projected Number of Cases
2–11 months 58,800 58,800 + (58,800 × 0.021) 60,0351–5 years 1,411,200 1,411,200 + (1,411,200 × 0.021) 1,440,8366–13 years 980,000 980,000 + (980,800 × 0.021) 1,000,58014 years and older 1,785,000 1,785,000 + (1,785,000 × 0.021) 1,822,485
Alternatively, enter the data in columns f in master table 8-4
Age Group Projected Number of Cases Calculation for Total BU Total BU Required
2–11 months 78,263 78,263 × 1 × 0.85 × 0.65 43,241,1–5 years 1,878,308 1,878,308 × 1 × 0.85 × 0.65 1,037,7666–13 years 1,304,380 1,304,380 × 1 × 0.85 × 0.65 720,67014 years and older 2,375,835 2,375,835 × 1 × 0.85 × 0.65 1,312,649
6. Adjust for Programmatic ChangesData: Quantity required (from steps 2 and 5 above)
Assumptions: Programmatic changes and other uncertainties; reporting rate
Calculate the changes using formula 2 (box 8-16):
QA = QT + (QT × AU)
WhereQA = Total quantity required after adjustments (for programmatic changes and uncertainties) QT = Quantity required in BUs, before adjustment for programmatic changes and uncertainties AU = Use adjustment (for programmatic changes and uncertainties)
Multiply the quantity needed (QT) with the adjustment factor (AU) to obtain the quantity increase or decrease in utilization to obtain the quantity required after adjustments in master table 8-4.
Sample Form 8-13. Total Quantity Required after Program Adjustments
Age GroupTotal Quantity
Needed (BU) QT
Use Adjustment AU (%)
Adjustment Quantity
Total Quantity required QA
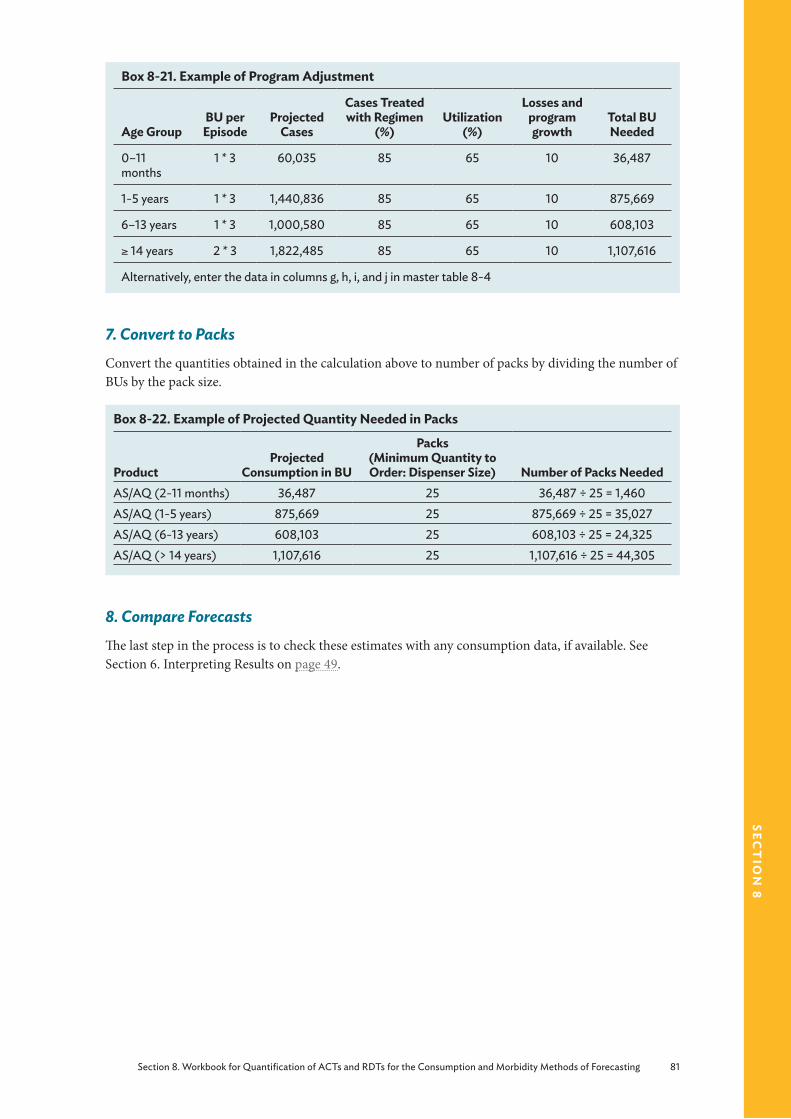
Section 8. Workbook for Quantification of ACTs and RDTs for the Consumption and Morbidity Methods of Forecasting 81
sect
ion
8
Box 8-21. Example of Program Adjustment
Age GroupBU per Episode
Projected Cases
Cases Treated with Regimen
(%)Utilization
(%)
Losses and program growth
Total BU Needed
0–11 months
1 * 3 60,035 85 65 10 36,487
1-5 years 1 * 3 1,440,836 85 65 10 875,669
6–13 years 1 * 3 1,000,580 85 65 10 608,103
≥ 14 years 2 * 3 1,822,485 85 65 10 1,107,616
Alternatively, enter the data in columns g, h, i, and j in master table 8-4
7. Convert to PacksConvert the quantities obtained in the calculation above to number of packs by dividing the number of BUs by the pack size.
Box 8-22. Example of Projected Quantity Needed in Packs
ProductProjected
Consumption in BU
Packs (Minimum Quantity to Order: Dispenser Size) Number of Packs Needed
AS/AQ (2-11 months) 36,487 25 36,487 ÷ 25 = 1,460AS/AQ (1-5 years) 875,669 25 875,669 ÷ 25 = 35,027AS/AQ (6-13 years) 608,103 25 608,103 ÷ 25 = 24,325AS/AQ (> 14 years) 1,107,616 25 1,107,616 ÷ 25 = 44,305
8. Compare ForecastsThe last step in the process is to check these estimates with any consumption data, if available. See Section 6. Interpreting Results on page 49.

82 Section 8. Workbook for Quantification of ACTs and RDTs for the Consumption and Morbidity Methods of Forecasting
sec
tio
n 8
Tabl
e 8-
4. C
alcu
latio
ns U
sing
the
Mor
bidi
ty-B
ased
Met
hod:
Mas
ter T
able
ab
cd
ef
gh
ij
Prod
uct
Age
/Wei
ght
Gro
upBU
per
Ep
isod
ePo
pula
tion
Num
ber o
f Ca
ses
Proj
ecte
d Ca
ses
Case
s Tr
eate
d w
ith
Regi
men
(%)
Util
izat
ion
(%)
Prog
ram
G
row
th a
nd
Loss
es (%
)To
tal B
U
Nee
ded
Min
imum
Ord
er
(Dis
pens
ers)
AS/
AQ0–
11 m
onth
s 1 *
329
,400
58,8
0060
,035
8565
1036
,487
36,4
87 ÷
25
= 1,4
60A
S/AQ
1-5
year
s1 *
370
5,60
01,4
11,2
001,4
40,8
3685
6510
875,
669
875,
669
÷ 25
= 3
5,02
7A
S/AQ
6–13
year
s 1 *
398
,000
98,0
001,0
00,5
8085
6510
608,
103
608,
103
÷ 25
= 2
4,32
5A
S/AQ
≥ 14
year
s 2
* 31,7
85,0
001,7
85,0
001,8
22,4
8585
6510
1,107
,616
1,107
,616
÷ 2
5 =
44,3
05
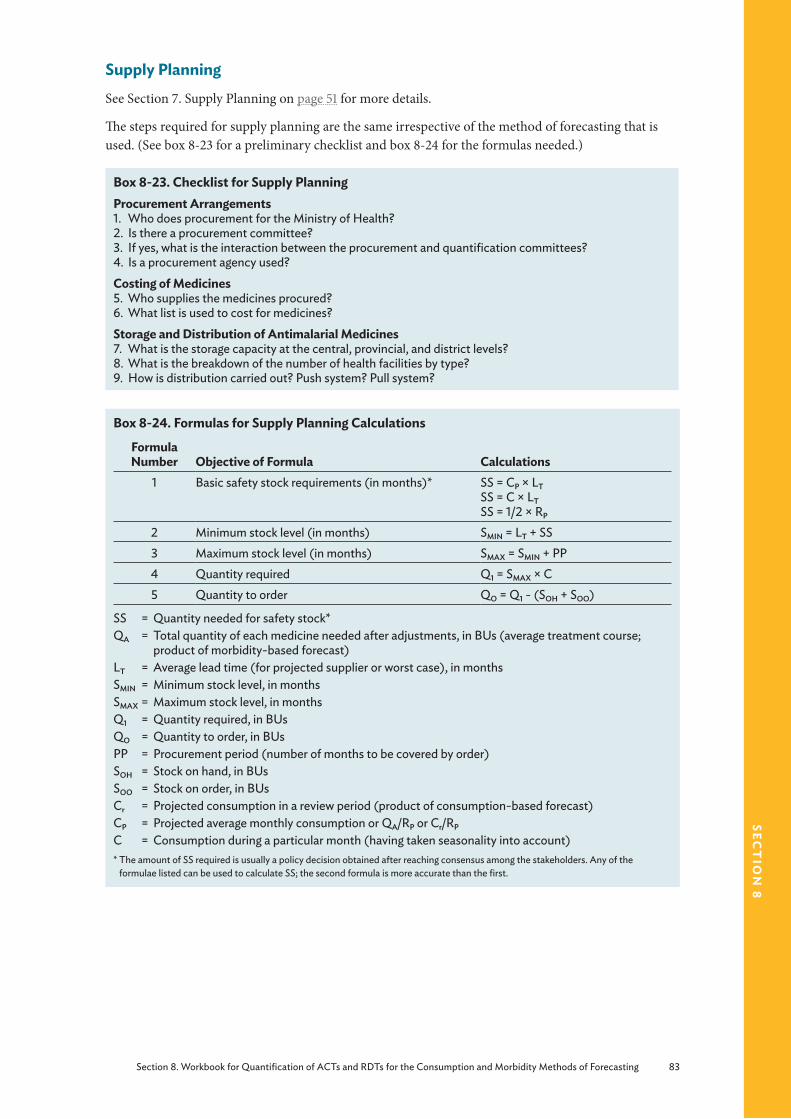
Section 8. Workbook for Quantification of ACTs and RDTs for the Consumption and Morbidity Methods of Forecasting 83
sect
ion
8
Supply PlanningSee Section 7. Supply Planning on page 51 for more details.
The steps required for supply planning are the same irrespective of the method of forecasting that is used. (See box 8-23 for a preliminary checklist and box 8-24 for the formulas needed.)
Box 8-23. Checklist for Supply PlanningProcurement Arrangements1. Who does procurement for the Ministry of Health?2. Is there a procurement committee?3. If yes, what is the interaction between the procurement and quantification committees?4. Is a procurement agency used?Costing of Medicines5. Who supplies the medicines procured?6. What list is used to cost for medicines?Storage and Distribution of Antimalarial Medicines7. What is the storage capacity at the central, provincial, and district levels?8. What is the breakdown of the number of health facilities by type?9. How is distribution carried out? Push system? Pull system?
Box 8-24. Formulas for Supply Planning Calculations
Formula Number Objective of Formula Calculations
1 Basic safety stock requirements (in months)* SS = CP × LTSS = C × LTSS = 1/2 × RP
2 Minimum stock level (in months) SMIN = LT + SS 3 Maximum stock level (in months) SMAX = SMIN + PP4 Quantity required Q1 = SMAX × C5 Quantity to order QO = Q1 - (SOH + SOO)
SS = Quantity needed for safety stock*QA = Total quantity of each medicine needed after adjustments, in BUs (average treatment course;
product of morbidity-based forecast)LT = Average lead time (for projected supplier or worst case), in monthsSMIN = Minimum stock level, in monthsSMAX = Maximum stock level, in monthsQ1 = Quantity required, in BUsQO = Quantity to order, in BUsPP = Procurement period (number of months to be covered by order)SOH = Stock on hand, in BUsSOO = Stock on order, in BUsCr = Projected consumption in a review period (product of consumption-based forecast)CP = Projected average monthly consumption or QA/RP or Cr/RP
C = Consumption during a particular month (having taken seasonality into account)* The amount of SS required is usually a policy decision obtained after reaching consensus among the stakeholders. Any of the
formulae listed can be used to calculate SS; the second formula is more accurate than the first.
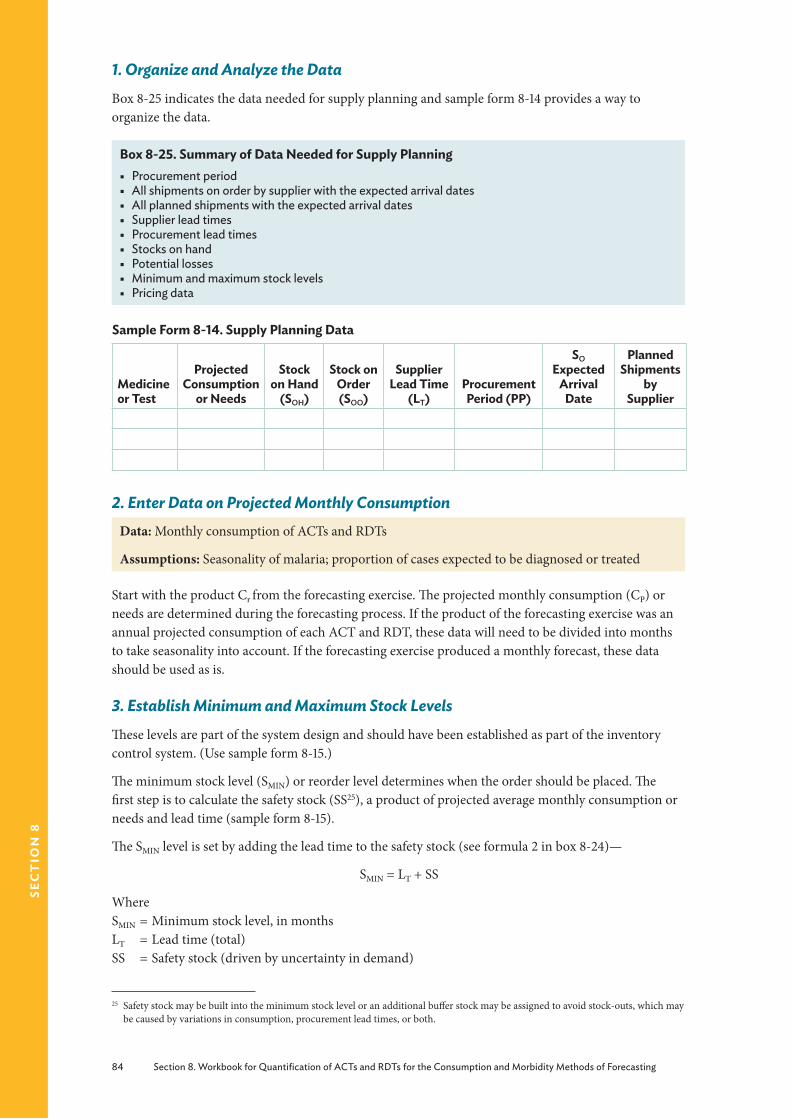
84 Section 8. Workbook for Quantification of ACTs and RDTs for the Consumption and Morbidity Methods of Forecasting
sec
tio
n 8
1. Organize and Analyze the DataBox 8-25 indicates the data needed for supply planning and sample form 8-14 provides a way to organize the data.
Box 8-25. Summary of Data Needed for Supply Planning § Procurement period § All shipments on order by supplier with the expected arrival dates § All planned shipments with the expected arrival dates § Supplier lead times § Procurement lead times § Stocks on hand § Potential losses § Minimum and maximum stock levels § Pricing data
Sample Form 8-14. Supply Planning Data
Medicine or Test
Projected Consumption
or Needs
Stock on Hand
(SOH)
Stock on Order (SOO)
Supplier Lead Time
(LT)Procurement Period (PP)
SO Expected
Arrival Date
Planned Shipments
by Supplier
2. Enter Data on Projected Monthly Consumption Data: Monthly consumption of ACTs and RDTs
Assumptions: Seasonality of malaria; proportion of cases expected to be diagnosed or treated
Start with the product Cr from the forecasting exercise. The projected monthly consumption (CP) or needs are determined during the forecasting process. If the product of the forecasting exercise was an annual projected consumption of each ACT and RDT, these data will need to be divided into months to take seasonality into account. If the forecasting exercise produced a monthly forecast, these data should be used as is.
3. Establish Minimum and Maximum Stock Levels These levels are part of the system design and should have been established as part of the inventory control system. (Use sample form 8-15.)
The minimum stock level (SMIN) or reorder level determines when the order should be placed. The first step is to calculate the safety stock (SS25), a product of projected average monthly consumption or needs and lead time (sample form 8-15).
The SMIN level is set by adding the lead time to the safety stock (see formula 2 in box 8-24)—
SMIN = LT + SS
WhereSMIN = Minimum stock level, in monthsLT = Lead time (total)SS = Safety stock (driven by uncertainty in demand)
25 Safety stock may be built into the minimum stock level or an additional buffer stock may be assigned to avoid stock-outs, which may be caused by variations in consumption, procurement lead times, or both.

Section 8. Workbook for Quantification of ACTs and RDTs for the Consumption and Morbidity Methods of Forecasting 85
sect
ion
8
Sample Form 8-15. Minimum and Maximum Stock Levels
Medicine or Test
Projected Consumption
or Needs
Supplier Lead Time
(LT)
Procurement Period
(PP)
Safety Stock (SS)
Minimum Stock Level
(SMIN)
Maximum Stock Level
(SMAX)
The maximum (SMAX) stock level is often used in scheduled purchasing with set order intervals.
It is calculated by adding SMIN to PP (see formula 3 in box 8-24)—
SMAX = SMIN + PP
WhereSMAX = Maximum stock level, in monthsSMIN = Minimum stock level, in monthsPP = Procurement period, in months
4. Determine Quantity Required (Taking Maximum and Minimum Stock Levels into Account)Use formula 4 (box 8-24) to calculate the quantity required and table 8-5 to enter the information—
Q1 = SMAX × C
WhereQ1 = Quantity required, in BUsSMAX = Maximum stock level, in monthsC = Projected consumption for the month
5. Determine Quantity to Order (Taking the Existing Pipeline into Account)Obtain the quantity of stock (Q1, in packs), taking minimum and maximum stock levels into account and deduct the stock on hand (SOH) and the quantity on order (SOO; formula 5 in box 8-24). In addition, any products that expire before being used will also need to be subtracted.
When stock levels reach the established minimum, an order will need to be placed.
QO = Q1 - (SOH + SOO)
WhereQO = Quantity to order, in BUsQ1 = Quantity required after taking minimum and maximum stock levels and seasonality into
accountSOH = Stock in inventory, in BUsSOO = Stock on order, in BUs
6. Determine When to Place the Order, Depending on Supplier Lead TimeThe procurement order quantity should be sufficient to last until the next procurement cycle is completed. Use master table 8-5 to help you outline an ordering plan.
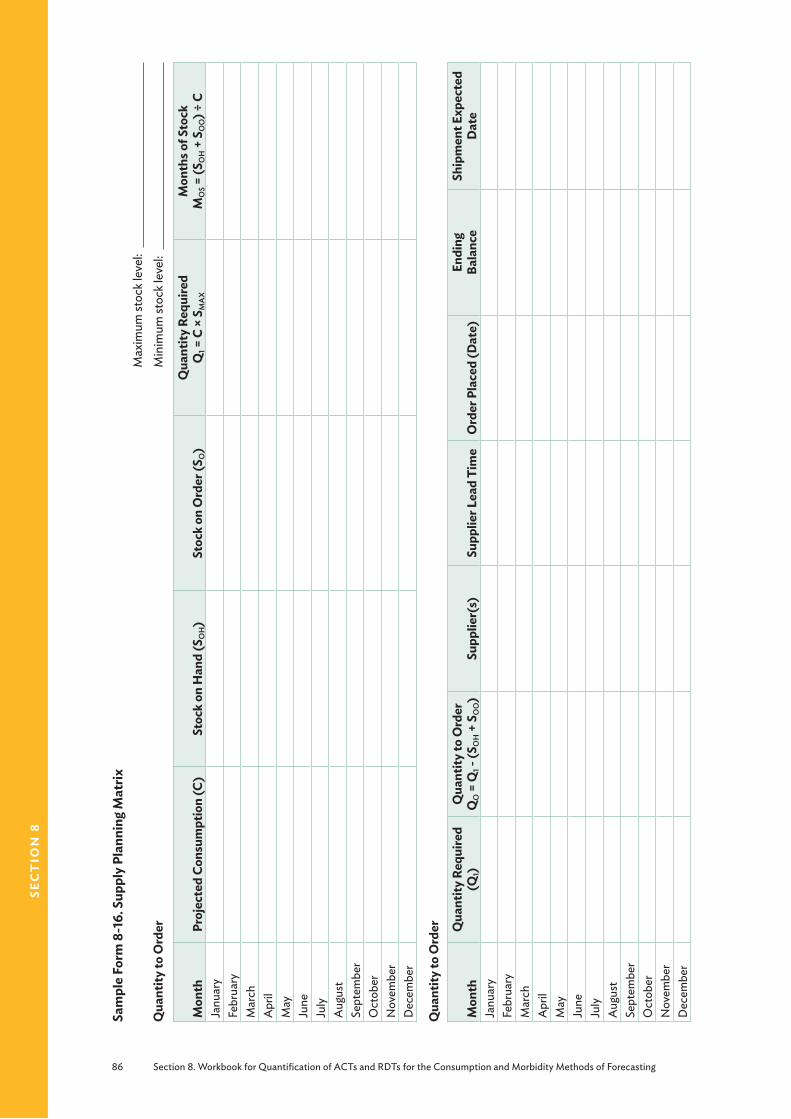
86 Section 8. Workbook for Quantification of ACTs and RDTs for the Consumption and Morbidity Methods of Forecasting
sec
tio
n 8
Sam
ple
Form
8-1
6. S
uppl
y Pl
anni
ng M
atrix
Qua
ntity
to O
rder
Max
imum
stoc
k lev
el:
M
inim
um st
ock l
evel
:
Mon
thPr
ojec
ted
Cons
umpt
ion
(C)
Stoc
k on
Han
d (S
OH
)St
ock
on O
rder
(SO
)Q
uant
ity R
equi
red
Q1 =
C ×
SMAX
Mon
ths o
f Sto
ck
MOS =
(SOH
+ S
OO
) ÷ C
Janu
ary
Febr
uary
Mar
chA
pril
May
June
July
Aug
ust
Sept
embe
rO
ctob
erN
ovem
ber
Dec
embe
r
Qua
ntity
to O
rder
Mon
thQ
uant
ity R
equi
red
(Q1)
Qua
ntity
to O
rder
Q
O =
Q1 -
(SOH
+ S
OO
)Su
pplie
r(s)
Supp
lier L
ead
Tim
eO
rder
Pla
ced
(Dat
e)En
ding
Ba
lanc
eSh
ipm
ent E
xpec
ted
Dat
eJa
nuar
yFe
brua
ryM
arch
Apr
ilM
ayJu
neJu
lyA
ugus
tSe
ptem
ber
Oct
ober
Nov
embe
rD
ecem
ber
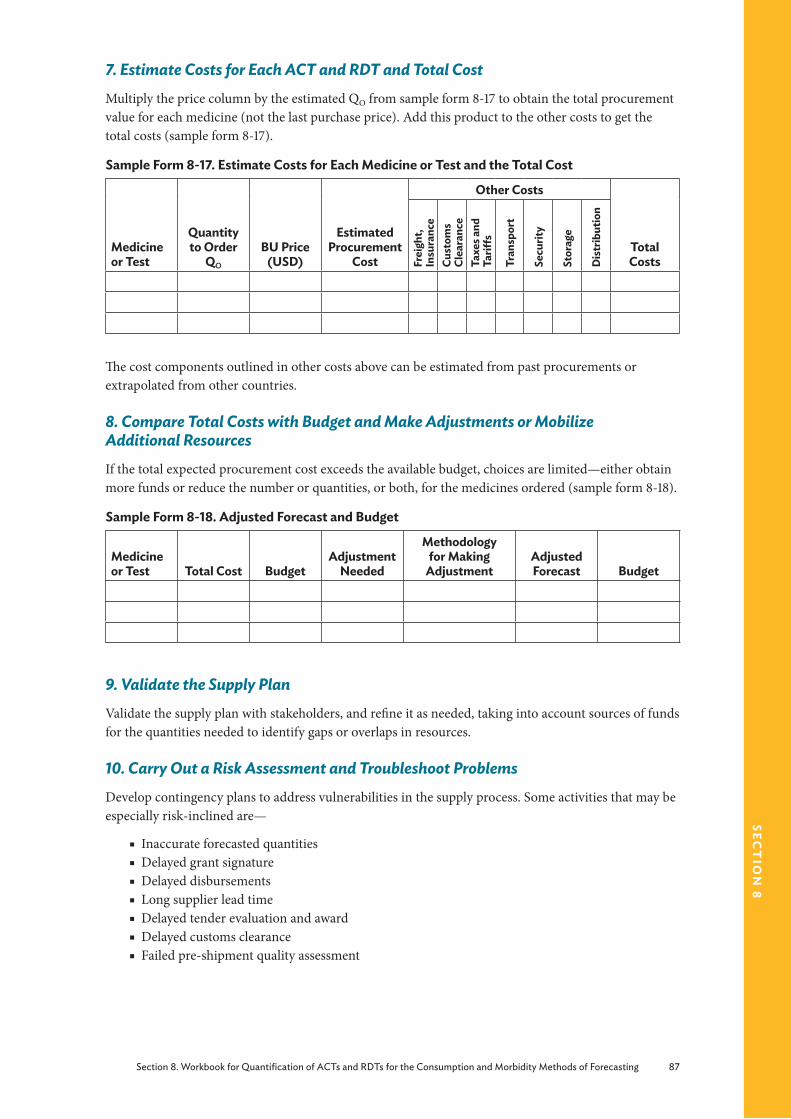
Section 8. Workbook for Quantification of ACTs and RDTs for the Consumption and Morbidity Methods of Forecasting 87
sect
ion
8
7. Estimate Costs for Each ACT and RDT and Total CostMultiply the price column by the estimated QO from sample form 8-17 to obtain the total procurement value for each medicine (not the last purchase price). Add this product to the other costs to get the total costs (sample form 8-17).
Sample Form 8-17. Estimate Costs for Each Medicine or Test and the Total Cost
Medicine or Test
Quantity to Order
QO
BU Price (USD)
Estimated Procurement
Cost
Other Costs
Total CostsFr
eigh
t, In
sura
nce
Cust
oms
Clea
ranc
eTa
xes a
nd
Tariff
s
Tran
spor
t
Secu
rity
Stor
age
Dis
trib
utio
n
The cost components outlined in other costs above can be estimated from past procurements or extrapolated from other countries.
8. Compare Total Costs with Budget and Make Adjustments or Mobilize Additional ResourcesIf the total expected procurement cost exceeds the available budget, choices are limited—either obtain more funds or reduce the number or quantities, or both, for the medicines ordered (sample form 8-18).
Sample Form 8-18. Adjusted Forecast and Budget
Medicine or Test Total Cost Budget
Adjustment Needed
Methodology for Making
AdjustmentAdjusted Forecast Budget
9. Validate the Supply PlanValidate the supply plan with stakeholders, and refine it as needed, taking into account sources of funds for the quantities needed to identify gaps or overlaps in resources.
10. Carry Out a Risk Assessment and Troubleshoot ProblemsDevelop contingency plans to address vulnerabilities in the supply process. Some activities that may be especially risk-inclined are—
■ Inaccurate forecasted quantities ■ Delayed grant signature ■ Delayed disbursements ■ Long supplier lead time ■ Delayed tender evaluation and award ■ Delayed customs clearance ■ Failed pre-shipment quality assessment
88 Glossary
GlossaryThese definitions are from Management Sciences for Health and World Health Organization. 1997. Managing Drug Supply, 2nd ed. Hartford, CT: Kumarian Press.
Term Definition
Annual purchasing An inventory control system in which pharmaceutical requirements are determined and orders are placed once each year
Average monthly consumption
A measure of the average amount of stock used (dispensed or distributed) per month, adjusted for consumption that would have occurred during stock-out periods
Basic unit (BU) The smallest unit in which a medicine can be conveniently dispensed or administered; used in quantification, reorder formulas, and comparison of prices of different packs or test units; typical BUs are tablet or pre-pack (for ACTs), single test (for RDTs)
Consumption The rate at which items are issued to clients or patients; also called demand (which is, in strict terms, the rate of requests or orders); usually measured in terms of units consumed within a specific period
Days or months out of stock
Estimated number of days or months an item was out of stock during the review period
Dose/dosage A quantity of medicine prescribed to be taken at one time
Dosage regimen A regulated course of treatment
Expiry date The date appearing on a medicine product and established by the manufacturer, beyond which the manufacturer will not guarantee the potency, purity, uniformity, or bioavailability of the product
Forecasting Estimating the quantity of malaria products required to meet customer demand for a future period of time beyond the next purchase order. It estimates the quantities of product that will actually be used during a particular time frame. It is an essential part of quantification
Lead time The time interval needed to complete the procurement cycle. It begins at the time the need for new stock is recognized and ends when that stock is received and available for issue. It is comprised of various lead times (donor lead times, procurement lead time, and county level distribution).
Number of months of stock on hand
Calculated by dividing the months of unexpired stock on hand by the average monthly consumption
Pack A package assembled by the manufacturer containing a specific number of units of product
Pipeline stock Stock that is in transit at various stages of the purchasing and distribution cycles (same as the inventory position)
Population-based estimate
Prediction of future pharmaceutical requirements based on the demographic composition of the population, disease patterns, and norms for treatment
Pre-pack A package assembled by the manufacturer containing the exact number of doses for a single treatment course for a particular age/weight group
President’s Malaria Initiative (PMI)
The President’s Malaria Initiative (PMI) is a five-year, $1.2 billion expansion of US Government resources launched in 2005 to scale up access to effective malaria control interventions. The 2008 Lantos-Hyde Act authorized expanding the PMI program for 2009-2013.
Glossary 89
Term Definition
Procurement The process of acquiring supplies, including those obtained by purchase and donation
Procurement period The period of time between an order to a supplier and the next scheduled order
Quantification Estimation of the quantities of specific medicines needed. Financial requirements for purchasing are also calculated.
Roll Back Malaria A WHO initiative (http://rbm.who.int/rbmmandate.html), the Roll Back Malaria Partnership is the global framework for implementing coordinated action against malaria by mobilizing resources and forging consensus
Safety stock Buffer or minimum stock kept on hand to protect against stock-outs; if there is no safety stock, stock-outs will occur when deliveries are delayed or when there is an unexpected increase in demand; in theory, the safety stock is separate from the working stock, but in practice, there is no distinction and sometimes safety stock must be issued
Shelf life The length of time a material may be stored without affecting its usability, safety, purity, or potency
Standard facility Typical facility that can be said to be representative of all facilities of that type
Stock The items stored in the warehouse, health facility, or health systemStock on hand The quantity of an item available for dispensing or distribution, including
safety stock. It is also called working stockStock on order Any stocks that have been ordered but have not yet arrived; these stocks
should be scheduled to arrive during the procurement periodTotal consumption during review period
A measure of how much has been used (dispensed or distributed) during a specific defined period

90 Bibliography
BibliographyBarat, L., J. Chipipa, M. Kolczak, and T. Sukwa. 1999. Does the Availability of Blood Slide Microscopy for Malaria at Health Centers Improve the Management of Persons with Fever in Zambia? American Journal of Tropical Medicine and Hygiene 60(6):1024–30.
Barnes, K. I., D. N. Durrheim, F. Little, et al. 2005. Effect of Artemether-Lumefantrine Policy and Improved Vector Control on Malaria Burden in KwaZulu–Natal, South Africa. Public Library of Science Medicine 2(11):e330.
Chandler, C. I., C. J. Whitty, and E. K. Ansah. 2010. How Can Malaria Rapid Diagnostic Tests Achieve Their Potential? A Qualitative Study of a Trial at Health Facilities in Ghana. Malaria Journal 9:95.
Chandler, C. I., R. Hall-Clifford, T. Asaph, et al. 2011. Introducing Malaria Rapid Diagnostic Tests at Registered Drug Shops in Uganda: Limitations of Diagnostic Testing in the Reality of Diagnosis. Social Science Medicine. 72(6):937-44. Epub.
Chinkhumba, J., J. Skarbinski, B. Chilima, et al. 2010. Comparative Field Performance and Adherence to Test Results of Four Malaria Rapid Diagnostic Tests among Febrile Patients More than Five Years of Age in Blantyre, Malawi. Malaria Journal 9:209.
Day, N., and A. M. Dondorp. 2007. The Management of Patients with Severe Malaria. American Journal of Tropical Medicine and Hygiene 77 (Supplement 6):29–35.
Espinoza, Henrry. 2011. Forecasting for antimalarials to treat P. Falciparum and P. Vivax malaria in a low incidence country: A case study. Arlington, VA: Strengthening Pharmaceutical Systems for the US Agency for International Development.
Espinoza, Henrry. 2011. Strengthening Pharmaceutical Systems: Informe de Viaje a Ecuador: 03 y 04 de Mayo de 2011. Arlington, VA: Strengthening Pharmaceutical Systems for the US Agency for International Development.
Family Planning Logistics Management (FPLM). 2000. Contraceptive Forecasting Handbook for Family Planning and HIV/AIDS Prevention Programs. Arlington, VA: FPLM/John Snow, Inc., for the US Agency for International Development.
Hamer, D. H., M. Ndhlovu, D. Zurovac, et al. 2007. Improved Diagnostic Testing and Malaria Treatment Practices in Zambia. Journal of the American Medical Association 297(20):2227–31.
Kyabayinze, D. J., C. Asiimwe, D. Nakanjako, et al. 2010. Use of RDTs to Improve Malaria Diagnosis and Fever Case Management at Primary Health Care Facilities in Uganda. Malaria Journal 9:200.
Lengeler, C. 2004. Insecticide-Treated Bed Nets and Curtains for Preventing Malaria. Cochrane Database of Systematic Review CD000363.
Marchant, T., J. A. Schellenberg, T. Edgar, et al. 2002. Socially Marketed Insecticide-Treated Nets Improve Malaria and Anemia in Pregnancy in Southern Tanzania. Tropical Medicine and International Health 7(2):149–58.
Memusi, D., A. Nyandigisi, A. Mbithi, et al. 2010. Monitoring Outpatient Malaria Case Management under the 2010 Diagnostic and Treatment Policy in Kenya. Baseline Results. Nairobi: Division of Malaria Control. Ministry of Public Health and Sanitation.
Ministerio de la Salud Pública (Ecuador). 2011. Situación de la malaria, tendencia actual y desafíos para su control en Ecuador. PowerPoint slides.
Ministry of Public Health and Sanitation. 2008. A Modus Operandi for the Annual National Quantification of Antimalarial Medicines in Kenya. Division of Malaria Control Republic of Kenya. Nairobi: Government of Kenya.

Bibliography 91
MSH. 2009. International Drug Price Indicator Guide. Cambridge, MA: MSH.
MSH. 2012. Managing Drug Supply. 3rd ed. www.mds-online.org
MSH/WHO. 1997. Managing Drug Supply. 2nd ed. West Hartford, CT: Kumarian Press.
Nankabirwa, J., D. Zurovac, J. N. Njogu, et al. 2009. Malaria Misdiagnosis in Uganda—Implications for Policy Change. Malaria Journal 8:66.
Okech, B. A., I. K. Mwobobia, A. Kamau., et al. 2008. Use of integrated malaria management reduces malaria in Kenya. PLoS One 3(12):e4050. Epub.
Pan American Health Organization (PAHO). 2010. Report on the Situation of Malaria in the Americas, 2008. Washington, DC: PAHO.
Rowe, A. K., and R. W. Steketee, Roll Back Malaria Monitoring and Evaluation Reference Group, et al. 2007. Viewpoint: evaluating the impact of malaria control efforts on mortality in sub-Saharan Africa. Tropical Medicine and International Health 12(12):1524-39.
Shaukat, A.M., J. G. Breman, and F. E. McKenzie. 2010. Using the entomological inoculation rate to assess the impact of vector control on malaria parasite transmission and elimination. Malaria Journal 12;9:122.
Shretta, R. 2005. Quantification of Antimalarial Medicines—A Workbook. Submitted to the US Agency for International Development by the Rational Pharmaceutical Management Plus (RPM Plus) Program. Arlington, VA: Management Sciences for Health.
Estimating the Need for Severe Malaria Medicines: A Practical Guide. Submitted to the US Agency for International Development by the Strengthening Pharmaceutical Systems Program. Arlington, VA: SPS.
Skarbinski, J., P. O. Ouma, L. M. Causer, et al. 2009. Effect of Malaria Rapid Diagnostic Tests on the Management of Uncomplicated Malaria with Artemether-Lumefantrine in Kenya: A Cluster Randomized Trial. American Journal of Tropical Medicine and Hygiene 80(6):919–26.
Steketee, R. W., and C. C. Campbell. 2010. Impact of national malaria control scale-up programmes in Africa: magnitude and attribution of effects. Malaria Journal 9:299.
Thiam, S., M. Thior, B. Faye, et al. 2011. Major reduction in anti-malarial drug consumption in Senegal after nation-wide introduction of malaria rapid diagnostic tests. PLoS One 6(4):e18419.
Thuma, P., and S. Mharakurwa. 2007. Report to Malaria Research Working Group from Malaria Institute at Macha. PowerPoint presentation (unpublished).
Uganda Malaria Surveillance Project (USMP). 2010. Sentinel Site Malaria Surveillance Report October 2010. Kampala, Uganda: Uganda Malaria Surveillance Project.
USAID | DELIVER PROJECT, Task Order 1. 2008. Quantification of Health Commodities: A Guide to Forecasting and Supply Planning for Procurement. Arlington, VA: USAID | DELIVER PROJECT, Task Order 1.
USAID | DELIVER PROJECT. 2009a. Quantification of Health Commodities: HIV Test Kit Companion Guide, Forecasting Consumption of HIV Test Kits. Arlington, VA: USAID | DELIVER PROJECT, Task Order 1.
USAID | DELIVER PROJECT, Task Order 1. 2009b. The Logistics Handbook: A Practical Guide for Supply Chain Managers in Family Planning and Health Programs. Arlington, VA: USAID/Deliver Project.
Wasunna, B.Z., D. Bruce, J. Jones, et al. 2010. Health Worker Performance in the Management of Paediatric Fevers Following In-service Training and Exposure to Job Aids in Kenya. Malaria Journal 9:261.

92 Bibliography
World Health Organization (WHO). 2000. Severe Falciparum Malaria, 3rd ed. Transactions of the Research Society for Tropical Medicine and Hygiene 94 (Supplement 1):S1–90.
WHO. 2005. Technical Updates of the Guidelines on the Integrated Management of Childhood Illness: Evidence and Recommendations for Further Adaptation. Geneva: WHO, Child and Adolescent Health.
WHO. 2006a. Guidelines for the Treatment of Malaria. Geneva: WHO.
WHO. 2006b. Integrated Management of Childhood Illness for High HIV Settings. Geneva: WHO, Child and Adolescent Health.
WHO. 2010a. Guidelines for the Treatment of Malaria. 2nd ed. Geneva: WHO.
WHO. 2008b. World Malaria Report 2008. Geneva: WHO
WHO. 2009. World Malaria Report 2009. Geneva: WHO.
WHO. 2010b. World Malaria Report 2010. Geneva: WHO.
WHO. 2011a. Good Practices for Selecting and Procuring Rapid Diagnostics Tests for Malaria. Geneva: WHO.
WHO, 2011b. World Malaria Report 2011. Geneva: WHO
WHO/Action Programme on Essential Drugs and Vaccines (DAP). 1988. Estimating Drug Requirements: A Practical Manual. Geneva: WHO/DAP.
WHO/Global Malaria Program Surveillance, Monitoring, and Evaluation Unit. 2008. Impact of Long-Lasting Insecticidal-Treated Nets (LLINs) and Artemisinin-Based Combination Therapies (ACTs) Measured Using Surveillance Data in Four African Countries; www.eac.int/health/index.php?option=com_docman&task=doc
Williams, H. A., L. Causer, E. Metta, et al. 2008. Dispensary Level Pilot Implementation of Rapid Diagnostic Tests: An Evaluation of RDT Acceptance and Usage by Providers and Patients--Tanzania 2005. Malaria Journal 19:239.
Zurovac, D., B. Midia, S. A. Ochola, et al. 2006. Microscopy and Outpatient Malaria Case Management among Older Children and Adults in Kenya. Tropical Medicine and International Health 11(4):432–40.
Zurovac, D. J,. K. Tibenderana, J. Nankabirwa , et al. 2008a. Malaria Case-Management under Artemether-Lumefantrine Treatment Policy in Uganda.” Malaria Journal 7:181.
Zurovac, D., B. A. Larson, J. Skarbinski, et al. 2008b. Modeling the Financial and Clinical Implications of Malaria Rapid Diagnostic Tests in the Case-Management of Older Children and Adults in Kenya. American Journal of Tropical Medicine and Hygiene 78(6):884–91.
Zurovac, D., J. Njogu, W. Akhwale, et al. 2008c. Translation of Artemether Lumefantrine Treatment Policy into Paediatric Clinical Practice: An Early Experience from Kenya. Tropical Medicine and International Health 13(1):99–107.
Zurovac, D., J. Njogu, W. Akhwale, et al. 2008d. Effects of Revised Diagnostic Recommendations on Malaria Treatment Practices across Age Groups in Kenya. Tropical Medicine and International Health 13(6):784–7.
Annexes 93
an
nex
es
Annex A. Software Tools and Programs for Quantification
Forecasting Tools
Quantimed
Quantimed is a software tool that supports the calculation of the estimated total cost of medicines, medical supplies, laboratory supplies, and reagents needed to provide services for health programs. It uses one of three primary quantification methods—past consumption, morbidity (including scaling-up patterns), or proxy consumption—or any combination of these. With appropriate data, Quantimed can be applied to determine needs for a single health facility, a national program, or a group of geographic or administrative areas.
Excel® SpreadsheetsExcel spreadsheets can be developed and formatted to follow the steps for forecasting. An example of Excel spreadsheets is given in this manual under the consumption-based and morbidity-based methods.
Supply Planning and Pipeline Monitoring Tools
PipeLine® Software
The Pipeline Monitoring and Procurement Planning System (PipeLine), a software tool, designed to help program managers monitor the status of their product pipelines and product procurement plans. PipeLine provides information needed to initiate and follow up actions to ensure the regular and consistent stock of products at the program or national level.
Annexes
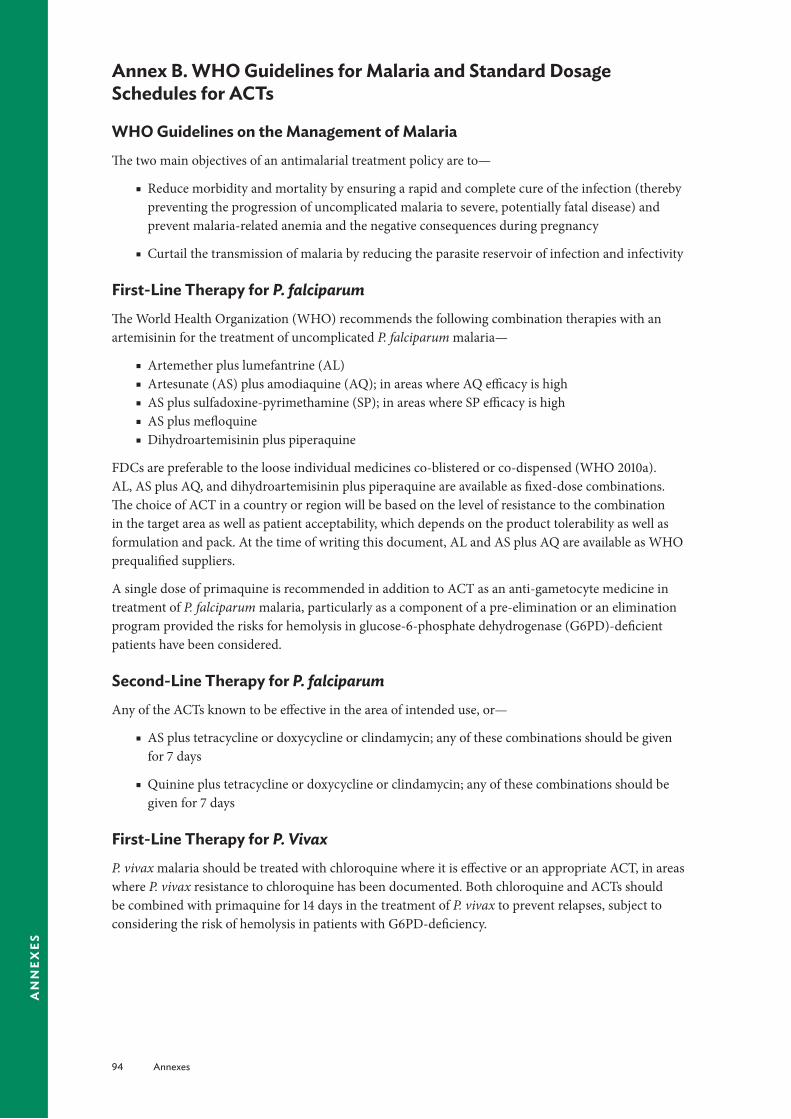
94 Annexes
an
nex
es
Annex B. WHO Guidelines for Malaria and Standard Dosage Schedules for ACTs
WHO Guidelines on the Management of MalariaThe two main objectives of an antimalarial treatment policy are to—
■ Reduce morbidity and mortality by ensuring a rapid and complete cure of the infection (thereby preventing the progression of uncomplicated malaria to severe, potentially fatal disease) and prevent malaria-related anemia and the negative consequences during pregnancy
■ Curtail the transmission of malaria by reducing the parasite reservoir of infection and infectivity
First-Line Therapy for P. falciparumThe World Health Organization (WHO) recommends the following combination therapies with an artemisinin for the treatment of uncomplicated P. falciparum malaria—
■ Artemether plus lumefantrine (AL) ■ Artesunate (AS) plus amodiaquine (AQ); in areas where AQ efficacy is high ■ AS plus sulfadoxine-pyrimethamine (SP); in areas where SP efficacy is high ■ AS plus mefloquine ■ Dihydroartemisinin plus piperaquine
FDCs are preferable to the loose individual medicines co-blistered or co-dispensed (WHO 2010a). AL, AS plus AQ, and dihydroartemisinin plus piperaquine are available as fixed-dose combinations. The choice of ACT in a country or region will be based on the level of resistance to the combination in the target area as well as patient acceptability, which depends on the product tolerability as well as formulation and pack. At the time of writing this document, AL and AS plus AQ are available as WHO prequalified suppliers.
A single dose of primaquine is recommended in addition to ACT as an anti-gametocyte medicine in treatment of P. falciparum malaria, particularly as a component of a pre-elimination or an elimination program provided the risks for hemolysis in glucose-6-phosphate dehydrogenase (G6PD)-deficient patients have been considered.
Second-Line Therapy for P. falciparumAny of the ACTs known to be effective in the area of intended use, or—
■ AS plus tetracycline or doxycycline or clindamycin; any of these combinations should be given for 7 days
■ Quinine plus tetracycline or doxycycline or clindamycin; any of these combinations should be given for 7 days
First-Line Therapy for P. VivaxP. vivax malaria should be treated with chloroquine where it is effective or an appropriate ACT, in areas where P. vivax resistance to chloroquine has been documented. Both chloroquine and ACTs should be combined with primaquine for 14 days in the treatment of P. vivax to prevent relapses, subject to considering the risk of hemolysis in patients with G6PD-deficiency.

Annexes 95
an
nex
es
Severe MalariaSevere malaria should be treated with parenteral AS or quinine to be followed by a complete course of an effective ACT as soon as the patient can take oral medications. The details of quantification are discussed in Quantification of Severe Malaria Medicines (Shretta, 2008).
DiagnosisIn 2009, WHO changed this recommendation to prompt parasitological confirmation by microscopy or RDTs for all patients with suspected malaria in all areas before any treatment is commenced. Treatment solely on the basis of clinical suspicion should be considered only when a parasitological diagnosis is not accessible.
RDTs are increasingly being used particularly in peripheral health facilities and in communities where there are no microscopes. RDTs (sometimes called malaria rapid diagnostic devices), facilitate the diagnosis of malaria by providing evidence about the presence of malaria-specific proteins (antigens) in human blood. Although many different products are available on the market, some RDTs can detect only one parasite (P. falciparum) whereas others detect multiple parasites (P. falciparum, P. vivax, P. malariae, and P. ovale) in different combinations.
Products Used for the Diagnosis and Treatment of MalariaThe following products should be included in the quantification exercise—
■ ACTs and other antimalarials according to the national level treatment protocols
■ Medication for treatment of anemia (e.g., iron supplements)
■ Antibiotics for the treatment of nonmalarial fevers, in accordance with the national policy and the Integrated Management of Childhood Illness guidelines
■ Intravenous glucose and other fluids
■ Needles and syringes
■ Cannulae and intravenous tubes
■ Gloves and other items used for protection
■ Diagnostic equipment: laboratory equipment and supplies (microscopes, slides, stains) and RDTs.
Many of these products are used for diseases other than malaria (e.g., intravenous fluids, gloves, needles, and syringes). Programs usually have data on consumption of these products, and these data should be adjusted according to planned scale-up of the interventions.
AL CombinationThis ACT is currently available only as co-formulated tablets containing 20 mg artemether and 120 mg lumefantrine. The total recommended treatment is a six-dose regimen of AL 1.5/12 mg/kg twice daily for three days.

96 Annexes
an
nex
es
Table B-1. Dosing Schedule for AL
Body WeightNumber of Tablets Recommended at Approximate Timing of Dosinga
0 Hour 8 Hours 24 Hours 36 Hours 48 Hours 60 Hours5–14 kg (<3 years) 1 1 1 1 1 115–24 kg (3–9 year) 2 2 2 2 2 225–34 kg (9–14 years) 3 3 3 3 3 3>34 kg (>14 years) 4 4 4 4 4 4
a The regimen can be expressed more simply for ease of use at the program level as follows: the second dose on the first day should be given anytime between 8 and 12 hours after the first dose. Dosage on the second and third days is twice a day (morning and evening).
Table B-2. Tablets per Dose by Body Weight
5 to <15 kg 1 tablet15 to <25 kg 2 tablets25 to <35 kg 3 tablets35 kg and over 4 tablets
* A total of 6 doses are given over 3 days
AS/AQ Combination This ACT is currently available as separate scored tablets containing 50 mg AS and 153 mg base AQ. The total recommended treatment is 4 mg/kg AS and 10 mg base/kg AQ given once daily for three days.
Table B-3. Dosing Schedule for AS/AQ
Age
Dose in mg (number of tablets)AS AQ
Day 1 Day 2 Day 3 Day 1 Day 2 Day 35–11 months 25 (½) 25 25 76.5 (½) 76.5 76.51–6 years 50 (1) 50 50 153 (1) 153 1537–13 years 100 (2) 100 100 306 (2) 306 306>13 years 200 (4) 200 200 612 (4) 612 612
The FDC is available in three formulations: 67.5 mg of AQ and 25 mg AS; artesunate 50 mg AS and 135 mg AQ; and an adult formulation containing 270 mg AQ and 100 mg AS.
Table B-4. FDC AS/AQ Blister Packs by Weight Band
Weight (kg) Tablet Strength Pack size4.5–9 AS 25 mg/AQ 67.5 mg 3 tablets9–18 AS 50 mg/AQ 135 mg 3 tablets18–36 AS 100 mg/AQ 270 mg 3 tablets> 36 AS 100 mg/AQ 270 mg 6 tablets

Annexes 97
an
nex
es
AS-SP CombinationThis ACT is currently available as separate scored tablets containing 50 mg AS and tablets containing 500 mg sulfadoxine and 25 mg pyrimethamine. (A similar medicine with tablets containing 500 mg sulfalene and 25 mg pyrimethamine is considered equivalent to SP.) The total recommended treatment is 4 mg/kg AS given once daily for three days and a single administration of SP 1.25/25 mg base/kg on day 1.
Table B-5. Dosing Schedule for AS-SP
Age
Dose in mg (number of tablets)AS SP
Day 1 Day 2 Day 3 Day 1 Day 2 Day 35–11 months 25 (½) 25 25 250/12.5 (½) — —1–6 years 50 (1) 50 50 500/25 (1) — —7–13 years 100 (2) 100 100 1,000/50 (2) — —>13 years 200 (4) 200 200 1,500/75 (3) — —
AS-Mefloquine CombinationThis ACT is currently available as separate scored tablets containing 50 mg AS and 250 mg base mefloquine. Co-formulated tablets are under development, but are not available at present. The total recommended treatment is 4 mg/kg AS given once daily for three days and 25 mg base/kg mefloquine, usually split over two or three days.
Table B-6. Dosing Schedule for AS-Mefloquine
Age
Dose in mg (number of tablets)AS Mefloquine
Day 1 Day 2 Day 3 Day 1 Day 2 Day 35–11 months 25 (½) 25 25 — 125 (½) —1–6 years 50 (1) 50 50 — 250 (1) —7–13 years 100 (2) 100 100 — 500 (2) 250 (1)>13 years 200 (4) 200 200 — 1,000 (4) 500 (2)
To reduce acute vomiting and optimize absorption, the 25 mg/kg dose is usually split and given either as 15 mg/kg (usually on the second day) followed by 10 mg/kg one day later, or as 8.3 mg/kg/day for three days. (Future co-formulated products will contain this dose.)
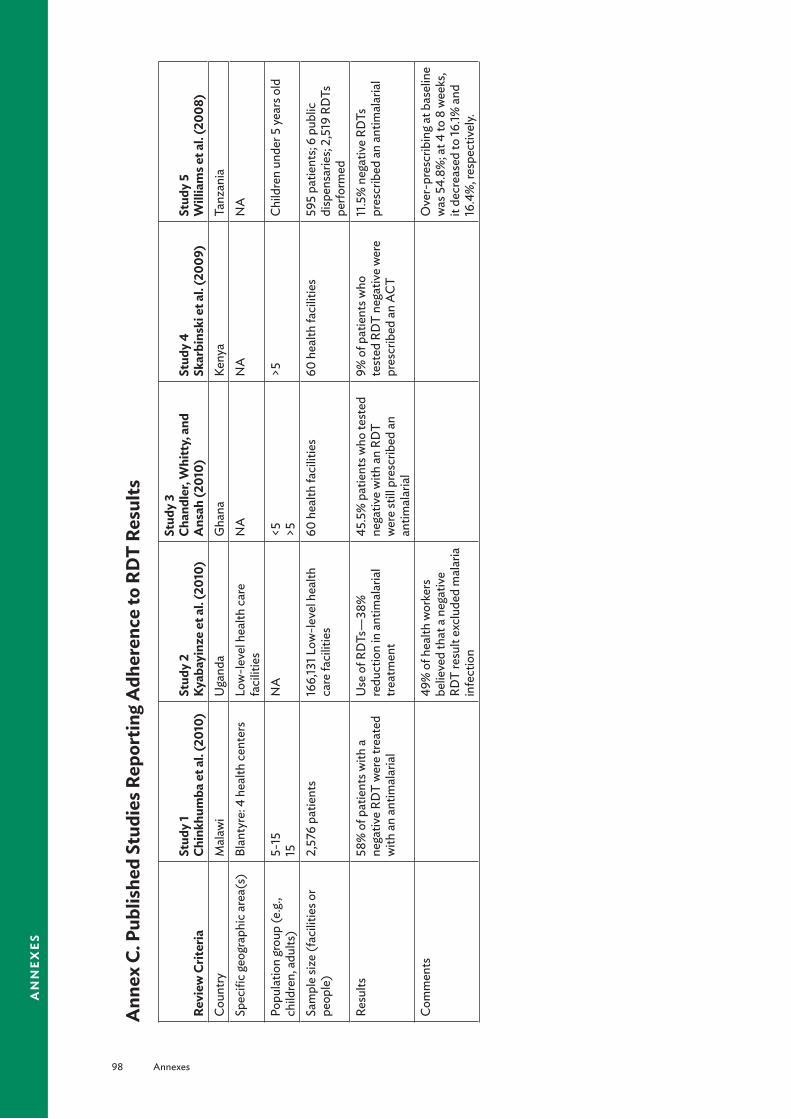
98 Annexes
an
nex
es
Ann
ex C
. Pub
lishe
d St
udie
s Rep
ortin
g A
dher
ence
to R
DT
Resu
lts
Revi
ew C
riter
iaSt
udy
1 Ch
inkh
umba
et a
l. (2
010)
Stud
y 2
Ky
abay
inze
et a
l. (2
010)
Stud
y 3
Ch
andl
er, W
hitt
y, a
nd
Ans
ah (2
010)
Stud
y 4
Sk
arbi
nski
et a
l. (2
009)
Stud
y 5
W
illia
ms e
t al.
(200
8)Co
untry
Mal
awi
Uga
nda
Gha
naKe
nya
Tanz
ania
Spec
ific g
eogr
aphi
c are
a(s)
Blan
tyre
: 4 h
ealth
cent
ers
Low
-leve
l hea
lth ca
re
faci
litie
s N
AN
AN
A
Popu
latio
n gr
oup
(e.g
., ch
ildre
n, a
dults
)5-
15
15N
A<5
>5
>5Ch
ildre
n un
der 5
year
s old
Sam
ple
size
(fac
ilitie
s or
peop
le)
2,57
6 pa
tient
s16
6,13
1 Low
-leve
l hea
lth
care
faci
litie
s60
hea
lth fa
cilit
ies
60 h
ealth
faci
litie
s59
5 pa
tient
s; 6
publ
ic
disp
ensa
ries;
2,51
9 RD
Ts
perfo
rmed
Resu
lts58
% o
f pat
ient
s with
a
nega
tive
RDT
wer
e tre
ated
w
ith a
n an
timal
aria
l
Use
of R
DTs
—38
%
redu
ctio
n in
ant
imal
aria
l tre
atm
ent
45.5
% p
atie
nts w
ho te
sted
ne
gativ
e w
ith a
n RD
T w
ere
still
pre
scrib
ed a
n an
timal
aria
l
9% o
f pat
ient
s who
te
sted
RD
T ne
gativ
e w
ere
pres
crib
ed a
n AC
T
11.5
% n
egat
ive
RDTs
pr
escr
ibed
an
antim
alar
ial
Com
men
ts49
% o
f hea
lth w
orke
rs
belie
ved
that
a n
egat
ive
RDT
resu
lt ex
clud
ed m
alar
ia
infe
ctio
n
Ove
r-pr
escr
ibin
g at b
asel
ine
was
54.
8%; a
t 4 to
8 w
eeks
, it
decr
ease
d to
16.1%
and
16
.4%
, res
pect
ivel
y.

Annexes 99
an
nex
es
Revi
ew C
riter
iaSt
udy
6
Mem
usi (
2010
)St
udy
7
Ham
er e
t al.
(200
7)St
udy
8
Zuro
vac e
t al.
(200
8c)
Stud
y 9
N
anka
birw
a et
al.
(200
9)St
udy
10
Zuro
vac e
t al.
(200
6)Co
untry
Keny
aZa
mbi
aKe
nya
Uga
nda
Keny
aSp
ecifi
c geo
grap
hic a
rea(
s)
NA
NA
NA
NA
NA
Popu
latio
n gr
oup
(e.g
., ch
ildre
n, a
dults
)<5
NA
<5
>5N
AN
A
Sam
ple
size
(fac
ilitie
s or
peop
le)
174
heal
th fa
cilit
ies
104
publ
ic fa
cilit
ies
706
febr
ile p
atie
nts
48 fa
cilit
ies
NA
Resu
lts10
0% o
f RD
T ne
gativ
e pa
tient
s and
35.
7% o
f blo
od
slide
neg
ativ
e pa
tient
s pr
escr
ibed
ACT
58.4
% n
egat
ive
bloo
d sm
ear t
ests
; 35.
5% w
ith a
ne
gativ
e RD
T re
sult
wer
e pr
escr
ibed
an
antim
alar
ial
in fa
cilit
ies w
ith A
L in
stoc
k,
30.4
% b
lood
smea
r neg
ativ
e an
d 26
.7%
RD
T ne
gativ
e pr
escr
ibed
AL
§>5
: AL
pres
crib
ed fo
r 9.7
%
neg
ativ
e te
st re
sults
and
10
.9%
with
out t
est
§<5
: 19.
2% w
ith n
egat
ive
test
s pre
scrib
ed A
L an
d 21
.6%
with
out t
ests
47.6
% o
f slid
e ne
gativ
e pa
tient
s tre
ated
for m
alar
ia79
.3%
mal
aria
mic
rosc
opy
nega
tive
patie
nts r
ecei
ved
antim
alar
ial (
mos
tly S
P);
14.7
% re
ceiv
ed q
uini
ne o
r am
odia
quin
e
Com
men
tsAt
leas
t one
ant
imal
aria
l m
edic
ine
was
pre
scrib
ed fo
r 75
.0%
of c
hild
ren
and
for
61.3
% o
f pat
ient
s ≥5
year
s w
ith a
neg
ativ
e te
st re
sult

100 Annexes
an
nex
es
Ann
ex D
. Illu
stra
tive
Qua
ntifi
catio
n Ti
mel
ine
Act
ivity
Sept
Oct
Nov
Dec
Jan
Feb
Mar
Apr
May
June
July
Aug
Esta
blish
men
t of a
nnua
l cyc
le fo
r nat
iona
l qua
ntifi
catio
n ac
tiviti
es
A
nnou
ncem
ent f
or q
uant
ifica
tion
proc
ess b
y the
offi
cial
(s) o
r offi
ce
that
will
man
age
the
proc
ess
Wor
king
grou
p re
view
s the
pas
t qua
ntifi
catio
n pr
oces
s and
cond
ucts
a
situa
tion
anal
ysis
of q
uant
ifica
tion
met
hods
, pro
cure
men
t, su
pply,
and
di
strib
utio
n of
ant
imal
aria
l med
icin
es
The
NM
CP d
efine
s the
obj
ectiv
es, c
over
age,
and
scop
e of
the
quan
tifica
tion
The
NM
CP d
evel
ops t
he lis
t of m
edic
ines
to b
e qu
antifi
ed, b
ased
on
stan
dard
trea
tmen
t gui
delin
es a
nd n
atio
nal n
eeds
Role
s and
resp
onsib
ilitie
s are
defi
ned
and
allo
cate
d fo
r eac
h re
pres
entin
g org
aniz
atio
n in
the
com
mitt
ee
Wor
king
grou
p m
eets
to d
evel
op a
wor
kpla
n w
ith ti
mel
ines
and
real
istic
de
adlin
es
Des
igna
ted
mem
bers
of t
he W
orki
ng G
roup
pre
pare
lists
and
form
ats
of d
ata
need
ed fo
r act
ivity
Trai
n (o
r re-
train
) rel
evan
t sta
ff in
the
appl
icab
le q
uant
ifica
tion
met
hod(
s) a
nd in
dat
a co
llect
ion,
colla
tion,
and
ana
lysis
Dist
ribut
e, co
llect
, and
colla
te d
ata
colle
ctio
n fo
rms
Colle
ct d
ata
from
site
s reg
ardi
ng co
nsum
ptio
n, st
ock o
n ha
nd, lo
sses
, an
d ad
just
men
ts
Wor
king
grou
p ex
amin
es th
e av
aila
ble
data
—fo
r acc
urac
y, co
mpl
eten
ess,
and
appl
icab
ility
Upd
ate
stoc
k sta
tus f
or q
uarte
r in
supp
ly p
lan
Upd
ate
stat
us o
f any
pla
nned
or o
rder
ed sh
ipm
ents
in su
pply
pla
n
U
pdat
e su
pplie
rs, p
rices
, and
oth
er d
ata
in su
pply
pla
n
A
rrang
e a
2-da
y Nat
iona
l Qua
ntifi
catio
n Ex
erci
se fo
r the
Wor
king
G
roup

Annexes 101
an
nex
es
Act
ivity
Sept
Oct
Nov
Dec
Jan
Feb
Mar
Apr
May
June
July
Aug
Calc
ulat
e qu
antit
ies o
f ant
imal
aria
l med
icin
es n
eede
d us
ing
appr
opria
te m
etho
ds fo
r qua
ntifi
catio
n
Revi
ew q
uant
ities
; adj
ust e
stim
ated
qua
ntiti
es a
s nee
ded
Esta
blish
qua
ntiti
es o
f ant
imal
aria
l med
icin
es a
s out
puts
of t
he e
xerc
ise
U
pdat
e fo
reca
sted
cons
umpt
ion
with
act
ual c
onsu
mpt
ion
for l
ast
quar
ter i
n su
pply
pla
n
Esta
blish
stre
ams o
f fun
ding
/don
or su
ppor
t for
pro
cure
men
t
D
evel
op p
lans
for c
omm
unic
atio
n of
qua
ntifi
catio
n re
sults
Revi
ew th
e ju
st-c
oncl
uded
qua
ntifi
catio
n pr
oces
s, w
ith
reco
mm
enda
tions
and
pla
ns to
impr
ove
the
proc
ess a
nd re
solv
e pr
oble
ms e
ncou
nter
ed
Esta
blish
trac
king
syst
em fo
r pos
tqua
ntifi
catio
n ac
tiviti
es, in
clud
ing
proc
urem
ent a
nd fu
ndin
g rea
rrang
emen
ts
Ass
ess n
atio
nal s
tock
stat
us a
nd ta
ke a
ctio
n as
nec
essa
ry
O
rgan
ize d
ata
from
pas
t six
mon
ths a
nd ve
rify a
ssum
ptio
ns m
ade
prev
ious
ly
Revi
ew a
nd u
pdat
e qu
antifi
catio
n as
requ
ired
Adj
ust s
uppl
y pla
n
O
rgan
ize d
ata
from
pas
t 12
mon
ths a
nd ve
rify a
ssum
ptio
ns m
ade
prev
ious
ly
Cond
uct m
ajor
revi
ew o
f pre
viou
s for
ecas
t; up
date
and
com
plet
e ne
xt
fore
cast
Inpu
t new
fore
cast
Crea
te su
pply
pla
n

102 Annexes
an
nex
es
Annex E. Checklists for Planning for the Quantification Exercise
Checklists on Data
Consumption Method of Quantification1. Are data available on past consumption?2. How accurate and complete (give a percentage, if possible) are the data?
Morbidity Method of Quantification3. When was the last Demographic and Health Survey (DHS)?4. What is the target population for the quantification (public, private, or Mission)?5. Is there a breakdown of target population by age group?6. From where are estimates on disease burden obtained?7. Are national estimates available? If not, are district-level estimates available? If not, are data available
from a sample of health facilities?8. Are the data accurate?9. Is there a breakdown by age of disease burden? What are the age groups?10. What is the evidence of adherence to the national treatment protocol by providers?
Checklist on Costing of Medicines11. Who supplies the medicines procured?12. What list is used to cost for medicines?
Checklist on Storage and Distribution of Antimalarial Medicines13. What is the storage capacity at the central, intermediary (provincial, district, state, region) levels?*14. What is the breakdown of the number of health facilities by type?15. How is distribution carried out? Push system? Pull system?
Other relevant information■ Who does procurement for the Ministry of Health?■ Is there a procurement committee?■ If yes, what is the interaction between the procurement and quantification committees?■ Is a procurement agency used?
* Limited storage availability could influence the supply plan.

Annexes 103
an
nex
es
Ann
ex F
. Bla
nk T
able
s for
Per
form
ing
Cons
umpt
ion
and
Mor
bidi
ty F
orec
astin
gTa
ble
F-1.
Calc
ulat
ion
Usi
ng th
e Co
nsum
ptio
n-Ba
sed
Met
hod
Med
icin
eSt
reng
thBU
Pack
Si
ze
Tota
l Co
nsum
ptio
n in
Per
iod
(BU
)
Day
s ou
t of
Stoc
k
Adj
uste
d Av
erag
e M
onth
ly
Cons
umpt
ion
(BU
)C A
= C
T ÷ [R
M –
(DOS
÷ 30
.5)]
Proj
ecte
d Av
erag
e M
onth
ly U
tiliz
atio
n (B
U)
C P =
CA
+ (C
A ×
AU
)
Stoc
k on
Han
d (B
U)
Stoc
k on
O
rder
(B
U)
Safe
ty
Stoc
k Le
vel
(BU
)
Proj
ecte
d Co
nsum
ptio
n in
a
Revi
ew P
erio
dC
= C P
× R
P
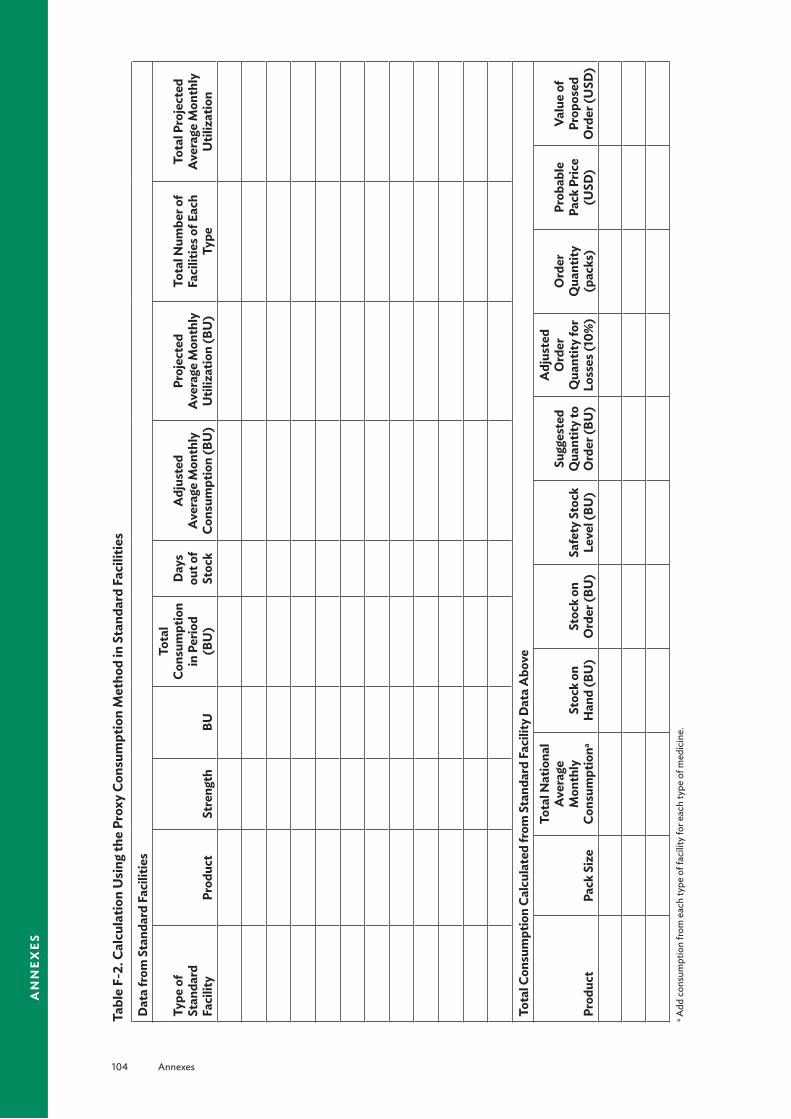
104 Annexes
an
nex
es
Tabl
e F-
2. C
alcu
latio
n U
sing
the
Prox
y Co
nsum
ptio
n M
etho
d in
Sta
ndar
d Fa
cilit
ies
Dat
a fr
om S
tand
ard
Faci
litie
s
Type
of
Stan
dard
Fa
cilit
yPr
oduc
tSt
reng
thBU
Tota
l Co
nsum
ptio
n in
Per
iod
(BU
)
Day
s ou
t of
Stoc
k
Adj
uste
d Av
erag
e M
onth
ly
Cons
umpt
ion
(BU
)
Proj
ecte
d Av
erag
e M
onth
ly
Util
izat
ion
(BU
)
Tota
l Num
ber o
f Fa
cilit
ies o
f Eac
h Ty
pe
Tota
l Pro
ject
ed
Aver
age
Mon
thly
U
tiliz
atio
n
Tota
l Con
sum
ptio
n Ca
lcul
ated
from
Sta
ndar
d Fa
cilit
y D
ata
Abo
ve
Prod
uct
Pack
Siz
e
Tota
l Nat
iona
l Av
erag
e M
onth
ly
Cons
umpt
iona
Stoc
k on
H
and
(BU
)St
ock
on
Ord
er (B
U)
Safe
ty S
tock
Le
vel (
BU)
Sugg
este
d Q
uant
ity to
O
rder
(BU
)
Adj
uste
d O
rder
Q
uant
ity fo
r Lo
sses
(10%
)
Ord
er
Qua
ntity
(p
acks
)
Prob
able
Pa
ck P
rice
(USD
)
Valu
e of
Pr
opos
ed
Ord
er (U
SD)
a Add
cons
umpt
ion
from
eac
h ty
pe o
f fac
ility
for e
ach
type
of m
edic
ine.
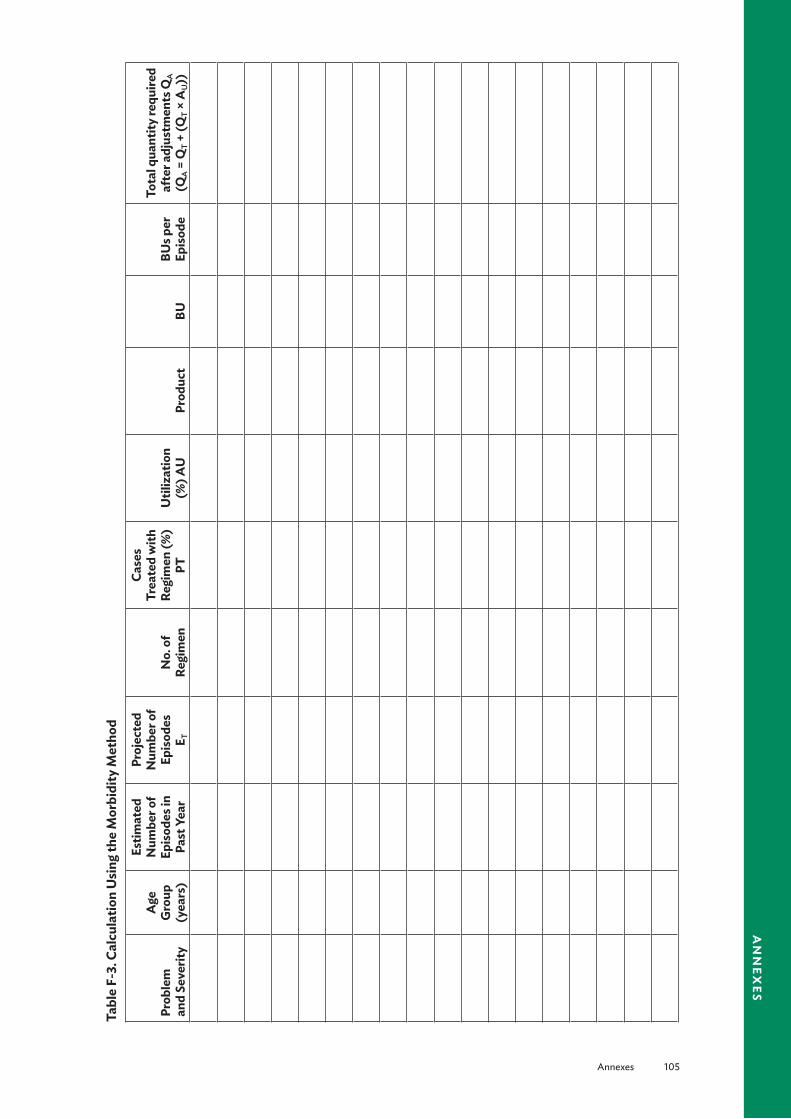
Annexes 105
an
nex
es
Tabl
e F-
3. C
alcu
latio
n U
sing
the
Mor
bidi
ty M
etho
d
Prob
lem
an
d Se
verit
y
Age
G
roup
(y
ears
)
Estim
ated
N
umbe
r of
Epis
odes
in
Past
Yea
r
Proj
ecte
d N
umbe
r of
Epis
odes
E T
No.
of
Regi
men
Case
s Tr
eate
d w
ith
Regi
men
(%)
PTU
tiliz
atio
n (%
) AU
Prod
uct
BUBU
s per
Ep
isod
e
Tota
l qua
ntity
requ
ired
afte
r adj
ustm
ents
QA
(Q
A =
QT +
(QT ×
AU
))
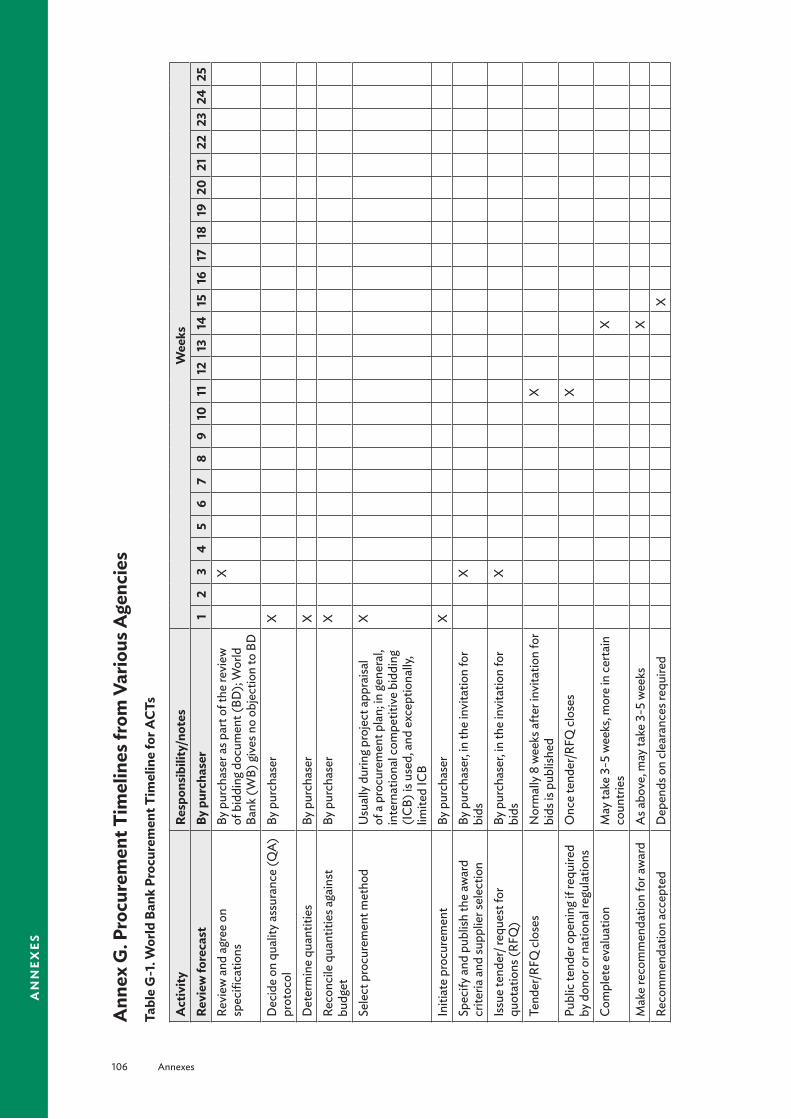
106 Annexes
an
nex
es
Ann
ex G
. Pro
cure
men
t Tim
elin
es fr
om V
ario
us A
genc
ies
Tabl
e G
-1. W
orld
Ban
k Pr
ocur
emen
t Tim
elin
e fo
r ACT
s
Act
ivity
Resp
onsi
bilit
y/no
tes
Wee
ksRe
view
fore
cast
By p
urch
aser
12
34
56
78
910
1112
1314
1516
1718
1920
2122
2324
25Re
view
and
agr
ee o
n sp
ecifi
catio
ns
By p
urch
aser
as p
art o
f the
revi
ew
of b
iddi
ng d
ocum
ent (
BD);
Wor
ld
Bank
(WB)
give
s no
obje
ctio
n to
BD
X
Dec
ide
on q
ualit
y ass
uran
ce (Q
A)
prot
ocol
By p
urch
aser
X
Det
erm
ine
quan
titie
sBy
pur
chas
erX
Reco
ncile
qua
ntiti
es a
gain
st
budg
etBy
pur
chas
erX
Sele
ct p
rocu
rem
ent m
etho
dU
sual
ly d
urin
g pro
ject
app
raisa
l of
a p
rocu
rem
ent p
lan;
in ge
nera
l, in
tern
atio
nal c
ompe
titiv
e bi
ddin
g (I
CB) i
s use
d, a
nd e
xcep
tiona
lly,
limite
d IC
B
X
Initi
ate
proc
urem
ent
By p
urch
aser
XSp
ecify
and
pub
lish
the
awar
d cr
iteria
and
supp
lier s
elec
tion
By p
urch
aser
, in th
e in
vita
tion
for
bids
X
Issu
e te
nder
/ req
uest
for
quot
atio
ns (R
FQ)
By p
urch
aser
, in th
e in
vita
tion
for
bids
X
Tend
er/R
FQ cl
oses
Nor
mal
ly 8
wee
ks a
fter i
nvita
tion
for
bids
is p
ublis
hed
X
Publ
ic te
nder
ope
ning
if re
quire
d by
don
or o
r nat
iona
l reg
ulat
ions
Onc
e te
nder
/RFQ
clos
esX
Com
plet
e ev
alua
tion
May
take
3-5
wee
ks, m
ore
in ce
rtain
co
untri
esX
Mak
e re
com
men
datio
n fo
r aw
ard
As a
bove
, may
take
3-5
wee
ksX
Reco
mm
enda
tion
acce
pted
Dep
ends
on
clea
ranc
es re
quire
dX

Annexes 107
an
nex
es
Act
ivity
Resp
onsi
bilit
y/no
tes
Wee
ksRe
view
fore
cast
By p
urch
aser
12
34
56
78
910
1112
1314
1516
1718
1920
2122
2324
25D
onor
app
rova
l Is
suan
ce o
f No
Obj
ectio
n by
WB;
us
ually
take
s les
s tha
n 2
wee
ksX
Cont
ract
awar
dFo
llow
s WB
No
Obj
ectio
n pr
ompt
ly,
alth
ough
this
may
take
long
er in
so
me
coun
tries
X
Cont
ract
pro
gres
s mon
itorin
gIm
pose
d in
BD
, usu
ally
2-4
mon
ths
Prod
uctio
n le
ad ti
me
Impo
sed
in B
D, u
sual
ly p
rior t
o sh
ipm
ent
Read
y for
insp
ectio
n (Q
A)Pu
rcha
se is
mad
e on
cost
, insu
ranc
e,
and
freig
ht (C
IF)/
com
mod
ity
impo
rt pr
ogra
m (C
IP) b
asis;
pre
-sh
ipm
ent i
nspe
ctio
n is
pres
crib
edRe
leas
ed fo
r shi
pmen
tSu
pplie
r’s re
spon
sibili
ty a
s pur
chas
e is
mad
e on
CIF
/CIP
bas
isBo
oked
for s
hipm
ent
Purc
hase
r’s re
spon
sibili
tyTr
ansit
tim
eD
epen
ds o
n co
untry
logi
stic
s, pu
rcha
ser’s
resp
onsib
ility
Arri
val a
t fina
l des
tinat
ion
Purc
hase
r’s re
spon
sibili
tyCl
ear c
usto
ms,
rece
ive,
coun
t and
ch
eck f
or lo
ss/d
amag
ePu
rcha
ser’s
resp
onsib
ility
und
er
CIF/
CIP
Paym
ent t
o su
pplie
rU
sual
ly b
y let
ter o
f cre
dit,
for t
he
mos
t par
t (80
%) a
t the
tim
e of
sh
ipm
ent
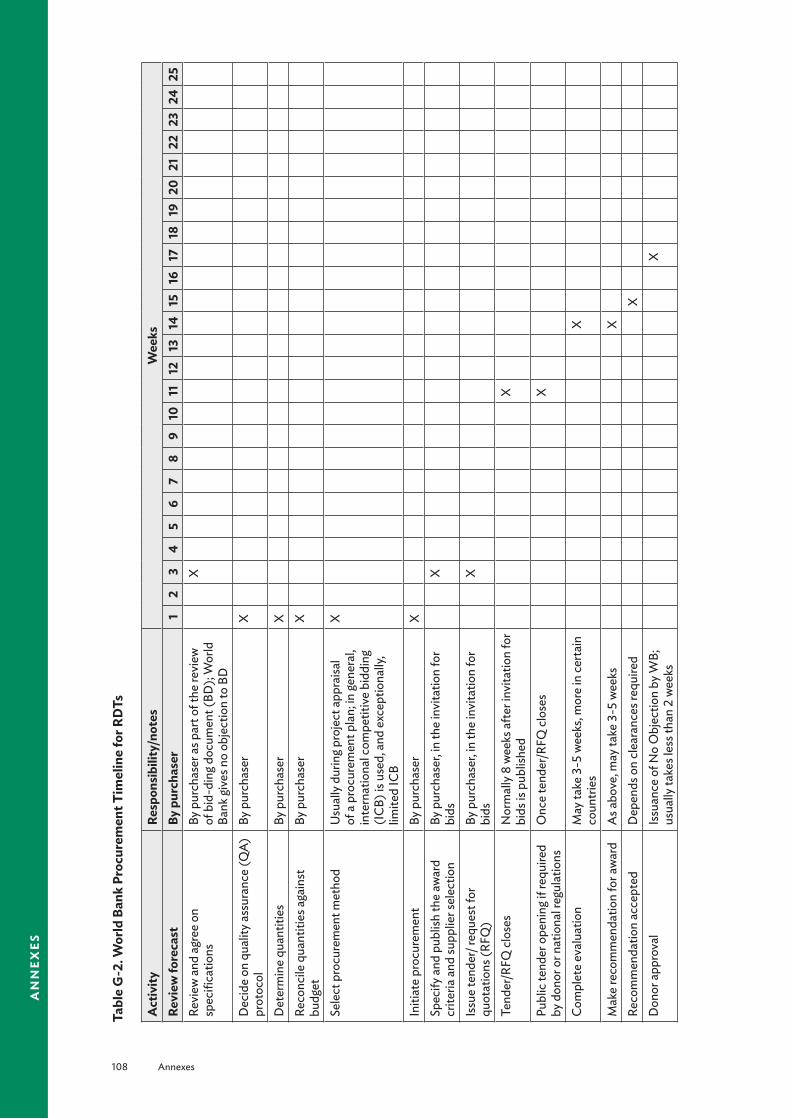
108 Annexes
an
nex
es
Tabl
e G
-2. W
orld
Ban
k Pr
ocur
emen
t Tim
elin
e fo
r RD
Ts
Act
ivity
Resp
onsi
bilit
y/no
tes
Wee
ksRe
view
fore
cast
By p
urch
aser
12
34
56
78
910
1112
1314
1516
1718
1920
2122
2324
25Re
view
and
agr
ee o
n sp
ecifi
catio
ns
By p
urch
aser
as p
art o
f the
revi
ew
of b
id-d
ing d
ocum
ent (
BD);
Wor
ld
Bank
give
s no
obje
ctio
n to
BD
X
Dec
ide
on q
ualit
y ass
uran
ce (Q
A)
prot
ocol
By p
urch
aser
X
Det
erm
ine
quan
titie
sBy
pur
chas
erX
Reco
ncile
qua
ntiti
es a
gain
st
budg
etBy
pur
chas
erX
Sele
ct p
rocu
rem
ent m
etho
dU
sual
ly d
urin
g pro
ject
app
raisa
l of
a p
rocu
rem
ent p
lan;
in ge
nera
l, in
tern
atio
nal c
ompe
titiv
e bi
ddin
g (I
CB) i
s use
d, a
nd e
xcep
tiona
lly,
limite
d IC
B
X
Initi
ate
proc
urem
ent
By p
urch
aser
XSp
ecify
and
pub
lish
the
awar
d cr
iteria
and
supp
lier s
elec
tion
By p
urch
aser
, in th
e in
vita
tion
for
bids
X
Issu
e te
nder
/ req
uest
for
quot
atio
ns (R
FQ)
By p
urch
aser
, in th
e in
vita
tion
for
bids
X
Tend
er/R
FQ cl
oses
Nor
mal
ly 8
wee
ks a
fter i
nvita
tion
for
bids
is p
ublis
hed
X
Publ
ic te
nder
ope
ning
if re
quire
d by
don
or o
r nat
iona
l reg
ulat
ions
Onc
e te
nder
/RFQ
clos
esX
Com
plet
e ev
alua
tion
May
take
3-5
wee
ks, m
ore
in ce
rtain
co
untri
esX
Mak
e re
com
men
datio
n fo
r aw
ard
As a
bove
, may
take
3-5
wee
ksX
Reco
mm
enda
tion
acce
pted
Dep
ends
on
clea
ranc
es re
quire
dX
Don
or a
ppro
val
Issu
ance
of N
o O
bjec
tion
by W
B;
usua
lly ta
kes l
ess t
han
2 w
eeks
X
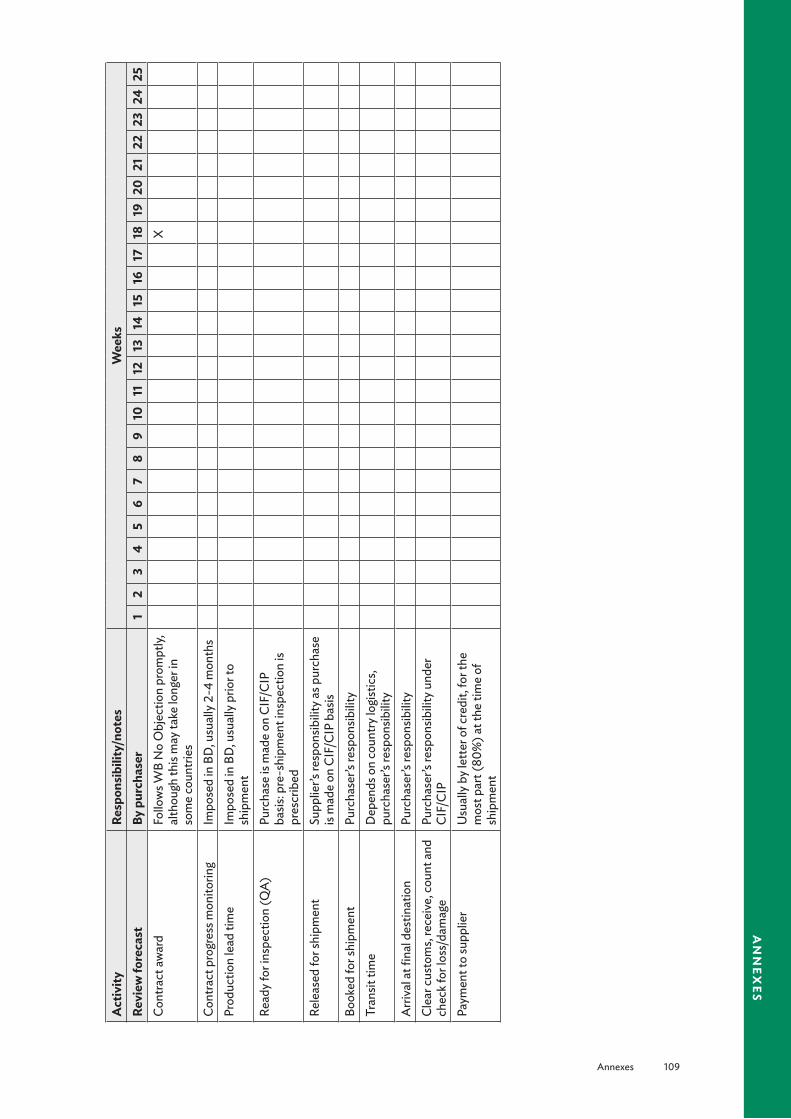
Annexes 109
an
nex
es
Act
ivity
Resp
onsi
bilit
y/no
tes
Wee
ksRe
view
fore
cast
By p
urch
aser
12
34
56
78
910
1112
1314
1516
1718
1920
2122
2324
25Co
ntra
ct aw
ard
Follo
ws W
B N
o O
bjec
tion
prom
ptly,
al
thou
gh th
is m
ay ta
ke lo
nger
in
som
e co
untri
es
X
Cont
ract
pro
gres
s mon
itorin
gIm
pose
d in
BD
, usu
ally
2-4
mon
ths
Prod
uctio
n le
ad ti
me
Impo
sed
in B
D, u
sual
ly p
rior t
o sh
ipm
ent
Read
y for
insp
ectio
n (Q
A)Pu
rcha
se is
mad
e on
CIF
/CIP
ba
sis: p
re-s
hipm
ent i
nspe
ctio
n is
pres
crib
edRe
leas
ed fo
r shi
pmen
tSu
pplie
r’s re
spon
sibili
ty a
s pur
chas
e is
mad
e on
CIF
/CIP
bas
isBo
oked
for s
hipm
ent
Purc
hase
r’s re
spon
sibili
tyTr
ansit
tim
eD
epen
ds o
n co
untry
logi
stic
s, pu
rcha
ser’s
resp
onsib
ility
Arri
val a
t fina
l des
tinat
ion
Purc
hase
r’s re
spon
sibili
tyCl
ear c
usto
ms,
rece
ive,
coun
t and
ch
eck f
or lo
ss/d
amag
ePu
rcha
ser’s
resp
onsib
ility
und
er
CIF/
CIP
Paym
ent t
o su
pplie
rU
sual
ly b
y let
ter o
f cre
dit,
for t
he
mos
t par
t (80
%) a
t the
tim
e of
sh
ipm
ent
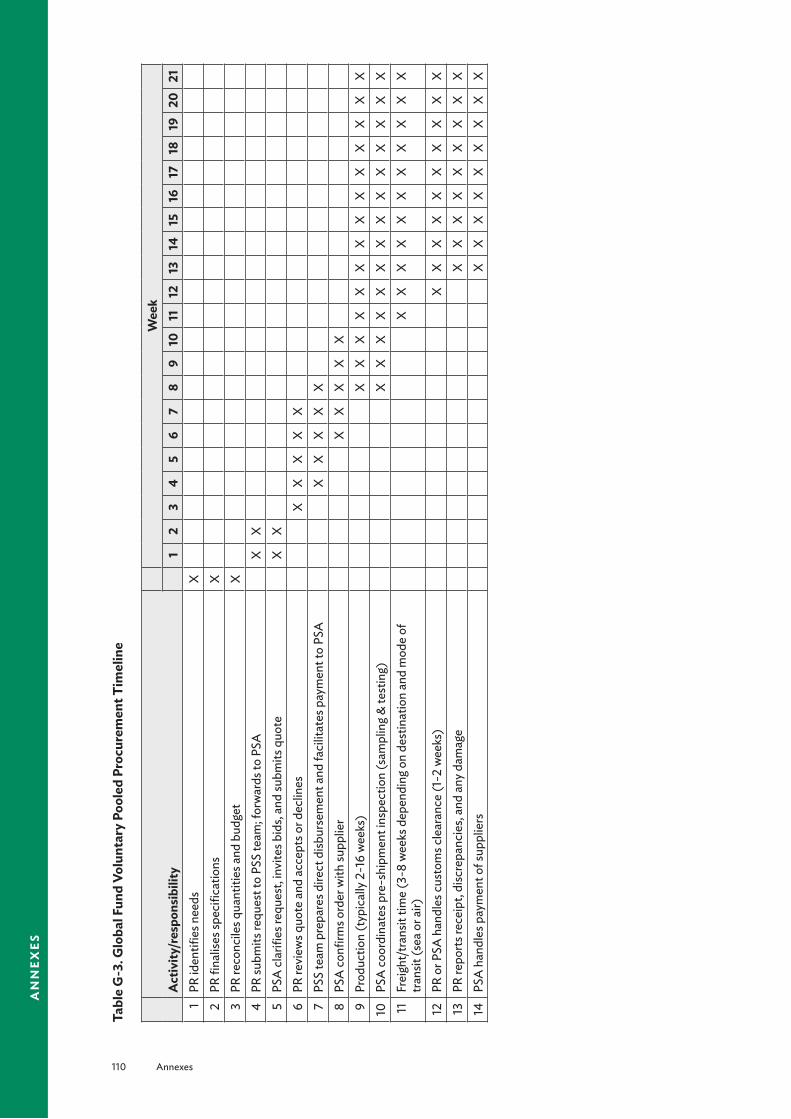
110 Annexes
an
nex
es
Tabl
e G
-3. G
loba
l Fun
d Vo
lunt
ary
Pool
ed P
rocu
rem
ent T
imel
ine
Act
ivity
/res
pons
ibili
tyW
eek
12
34
56
78
910
1112
1314
1516
1718
1920
211
PR id
entifi
es n
eeds
X2
PR fi
nalis
es sp
ecifi
catio
nsX
3PR
reco
ncile
s qua
ntiti
es a
nd b
udge
tX
4PR
subm
its re
ques
t to
PSS
team
; for
war
ds to
PSA
XX
5PS
A cl
arifi
es re
ques
t, in
vite
s bid
s, an
d su
bmits
quo
teX
X6
PR re
view
s quo
te a
nd a
ccep
ts o
r dec
lines
XX
XX
X7
PSS
team
pre
pare
s dire
ct d
isbur
sem
ent a
nd fa
cilit
ates
pay
men
t to
PSA
XX
XX
X8
PSA
confi
rms o
rder
with
supp
lier
XX
XX
X9
Prod
uctio
n (t
ypic
ally
2-1
6 w
eeks
)X
XX
XX
XX
XX
XX
XX
X10
PSA
coor
dina
tes p
re-s
hipm
ent i
nspe
ctio
n (s
ampl
ing &
test
ing)
XX
XX
XX
XX
XX
XX
XX
11Fr
eigh
t/tra
nsit
time
(3-8
wee
ks d
epen
ding
on
dest
inat
ion
and
mod
e of
tra
nsit
(sea
or a
ir)X
XX
XX
XX
XX
XX
12PR
or P
SA h
andl
es cu
stom
s cle
aran
ce (1
-2 w
eeks
)X
XX
XX
XX
XX
X13
PR re
ports
rece
ipt,
disc
repa
ncie
s, an
d an
y dam
age
XX
XX
XX
XX
X14
PSA
han
dles
pay
men
t of s
uppl
iers
XX
XX
XX
XX
X

Annexes 111
an
nex
esAct
ivity
/res
pons
ibili
tyW
eek
2223
2425
2627
2829
3031
3233
3435
3637
3839
4041
421
PR id
entifi
es n
eeds
2PR
fina
lises
spec
ifica
tions
3PR
reco
ncile
s qua
ntiti
es a
nd b
udge
t4
PR su
bmits
requ
est t
o PS
S te
am; f
orw
ards
to P
SA5
PSA
clar
ifies
requ
est,
invi
tes b
ids,
and
subm
its q
uote
6PR
revi
ews q
uote
and
acc
epts
or d
eclin
es7
PSS
team
pre
pare
s dire
ct d
isbur
sem
ent a
nd fa
cilit
ates
pay
men
t to
PSA
8PS
A co
nfirm
s ord
er w
ith su
pplie
r9
Prod
uctio
n (t
ypic
ally
2-1
6 w
eeks
)X
XX
XX
10PS
A co
ordi
nate
s pre
-shi
pmen
t ins
pect
ion
(sam
plin
g & te
stin
g)X
XX
XX
XX
11Fr
eigh
t/tra
nsit
time
(3-8
wee
ks d
epen
ding
on
dest
inat
ion
and
mod
e of
tra
nsit
(sea
or a
ir)X
XX
XX
XX
XX
XX
XX
XX
12PR
or P
SA h
andl
es cu
stom
s cle
aran
ce (1
-2 w
eeks
)X
XX
XX
XX
XX
XX
XX
XX
XX
13PR
repo
rts re
ceip
t, di
scre
panc
ies,
and
any d
amag
eX
XX
XX
XX
XX
XX
XX
XX
XX
X14
PSA
han
dles
pay
men
t of s
uppl
iers
XX
XX
XX
XX
XX
XX
XX
XX
XX
X
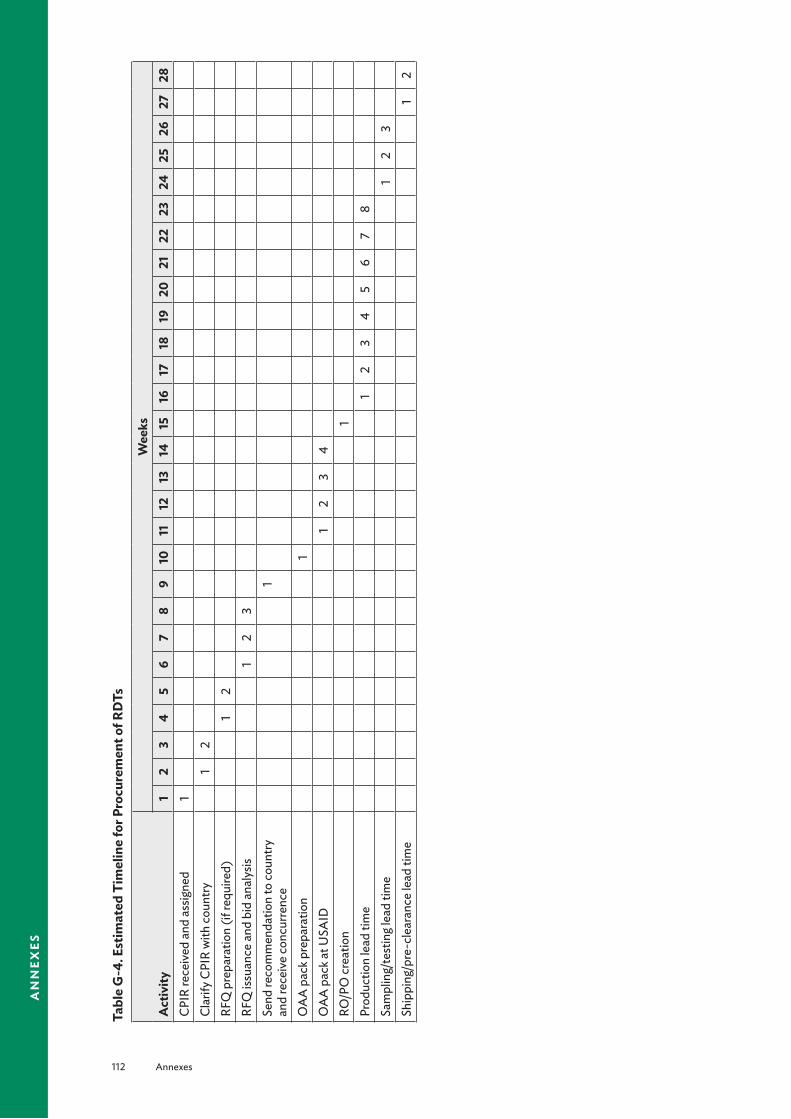
112 Annexes
an
nex
es
Tabl
e G
-4. E
stim
ated
Tim
elin
e fo
r Pro
cure
men
t of R
DTs
Act
ivity
Wee
ks1
23
45
67
89
1011
1213
1415
1617
1819
2021
2223
2425
2627
28CP
IR re
ceiv
ed a
nd a
ssig
ned
1Cl
arify
CPI
R w
ith co
untry
12
RFQ
pre
para
tion
(if re
quire
d)1
2RF
Q is
suan
ce a
nd b
id a
naly
sis1
23
Send
reco
mm
enda
tion
to co
untry
an
d re
ceiv
e co
ncur
renc
e1
OA
A p
ack p
repa
ratio
n1
OA
A p
ack a
t USA
ID1
23
4RO
/PO
crea
tion
1Pr
oduc
tion
lead
tim
e1
23
45
67
8Sa
mpl
ing/
test
ing l
ead
time
12
3Sh
ippi
ng/p
re-c
lear
ance
lead
tim
e1
2
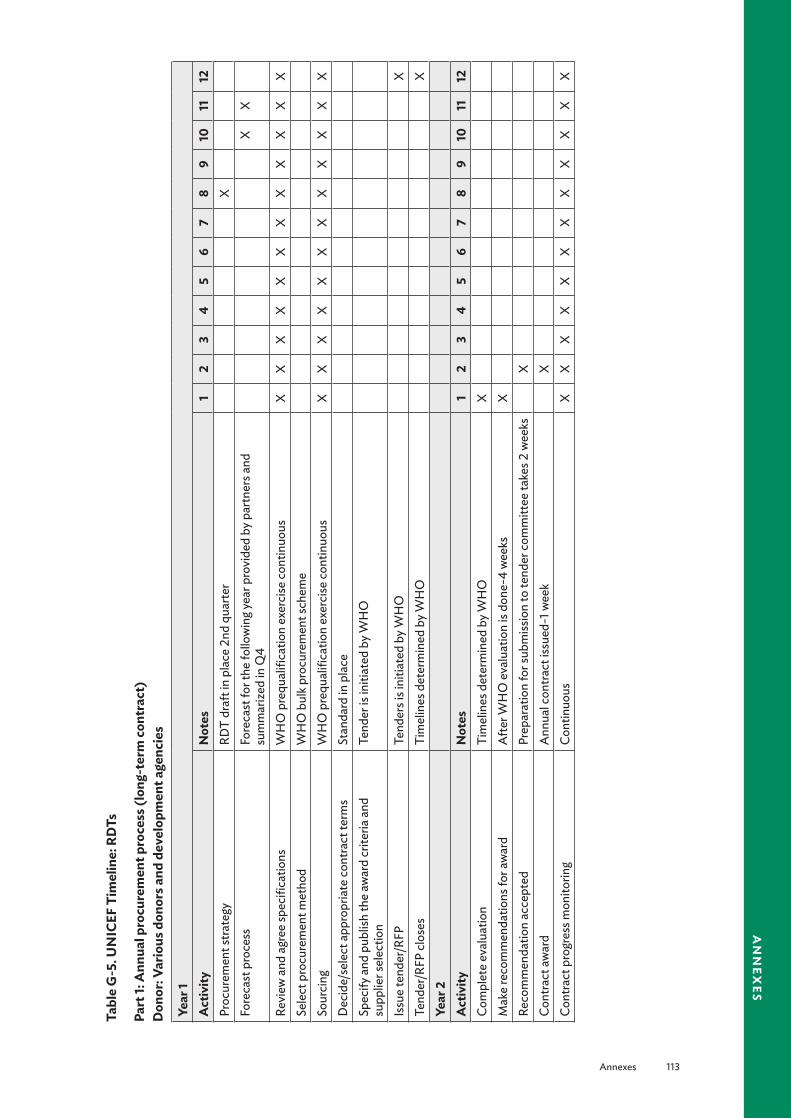
Annexes 113
an
nex
es
Tabl
e G
-5. U
NIC
EF T
imel
ine:
RD
Ts
Part
1: A
nnua
l pro
cure
men
t pro
cess
(lon
g-te
rm co
ntra
ct)
Don
or: V
ario
us d
onor
s and
dev
elop
men
t age
ncie
s
Year
1A
ctiv
ityN
otes
12
34
56
78
910
1112
Proc
urem
ent s
trate
gyRD
T dr
aft i
n pl
ace
2nd
quar
ter
XFo
reca
st p
roce
ssFo
reca
st fo
r the
follo
win
g yea
r pro
vide
d by
par
tner
s and
su
mm
arize
d in
Q4
XX
Revi
ew a
nd a
gree
spec
ifica
tions
W
HO
pre
qual
ifica
tion
exer
cise
cont
inuo
usX
XX
XX
XX
XX
XX
XSe
lect
pro
cure
men
t met
hod
WH
O b
ulk p
rocu
rem
ent s
chem
eSo
urci
ngW
HO
pre
qual
ifica
tion
exer
cise
cont
inuo
usX
XX
XX
XX
XX
XX
XD
ecid
e/se
lect
app
ropr
iate
cont
ract
term
sSt
anda
rd in
pla
ceSp
ecify
and
pub
lish
the
awar
d cr
iteria
and
su
pplie
r sel
ectio
nTe
nder
is in
itiat
ed b
y WH
O
Issu
e te
nder
/RFP
Tend
ers i
s ini
tiate
d by
WH
OX
Tend
er/R
FP cl
oses
Tim
elin
es d
eter
min
ed b
y WH
OX
Year
2A
ctiv
ityN
otes
12
34
56
78
910
1112
Com
plet
e ev
alua
tion
Tim
elin
es d
eter
min
ed b
y WH
OX
Mak
e re
com
men
datio
ns fo
r aw
ard
Afte
r WH
O e
valu
atio
n is
done
-4 w
eeks
XRe
com
men
datio
n ac
cept
edPr
epar
atio
n fo
r sub
miss
ion
to te
nder
com
mitt
ee ta
kes 2
wee
ksX
Cont
ract
awar
dA
nnua
l con
tract
issu
ed-1
wee
kX
Cont
ract
pro
gres
s mon
itorin
gCo
ntin
uous
XX
XX
XX
XX
XX
XX

114 Annexes
an
nex
es
Tabl
e G
-6. U
NIC
EF T
imel
ine:
RD
Ts
Part
2: E
xecu
tion
of in
divi
dual
pur
chas
e or
ders
Act
ivity
Not
esW
eeks
12
34
56
78
910
1112
1314
1516
1718
1920
2122
Plac
emen
t of i
ndiv
idua
l pur
chas
e or
ders
2–5
days
afte
r rec
eipt
if n
o de
viat
ion
from
spec
s X
Prod
uctio
n le
ad ti
me
2–3
wee
ks fo
r sm
all o
rder
s,
4–8
wee
ks fo
r lar
ge o
rder
s X
XX
XX
XX
Tran
sit ti
me
1-2
wee
ksX
XA
rriva
l and
clea
r cus
tom
s at fi
nal
dest
inat
ion
Diff
eren
t tim
elin
es fo
r cus
tom
s cl
eara
nce–
coun
try sp
ecifi
cX
Coun
t, ch
eck a
nd re
port
loss
/dam
age
With
in 14
day
s of a
rriva
lX
XIn
sura
nce
clai
m p
roce
dure
in th
e ev
ent
of a
ny lo
ss o
r dam
age
Insu
ranc
e pr
oced
ure
depe
ndin
g on
case
XX
X
Paym
ent t
o su
pplie
rW
ithin
30
days
from
del
iver
y dat
eX

Annexes 115
an
nex
es
Annex H. Evaluation of the Quantification ProcessThe entire process of preparation, forecasting, and supply planning including obtaining, distributing, and dispensing products should be monitored continuously, so the quantities to be procured and desired shipping schedules can be adjusted to ensure that the program’s needs are continuously met.
Evaluation ApproachesShortly after the annual quantification, the quantification team should review the preparations, the process, the actual activity, the results of the quantification, and the use of the results to obtain a better result in the following year. Actual consumption is always different from projected consumption. If the differences are significant, the reasons should be investigated.
Tools that can be used to evaluate the process include—
■ Questionnaire to cross-check on the various processes and activities
■ Qualitative reviews from stakeholders who took part in the exercise or to whom the results were disseminated
■ Of greatest importance, comparison of the quantity procured for the year relative to total country requirement. To make this comparison, the team needs to evaluate the magnitude of stock-outs and expiries against quantities consumed. Alternatively, a comparison of reported malaria cases against procured quantities can be carried out.
A conscious effort to improve the quality of the preparations, processes, and outcome must be in place.
Tracking System for Post-QuantificationTo ensure an uninterrupted supply of antimalarials, a tracking system must be instituted to prevent stock-outs and overstocking. A subcommittee can be made responsible for developing a delivery schedule based on projected monthly consumptions, maximum stock at central level, and stock on hand. This schedule should be communicated to the supplier by the procurement agency. A situational analysis to inform stakeholders of the existing stock position in the country should be continually carried out. Below is example of a checklist to assess the state of the quantification process in the country.

116 Annexes
an
nex
es
Box H-1. Checklist and Assessment GuideAvailability of Data
§ Do the medical stores and health facilities have current and accurate records of medicine usage?
§ What data and reports are maintained centrally (or at other levels of the health system) on outpatient attendances, inpatient bed-days, or other counts of patient contacts?
§ For how many diseases does reliable information exist on numbers of cases reported or treated annually?
§ Are there official STGs for certain diseases? If so, how many diseases are covered, and how is compliance monitored?
Management of Quantification § Do a formal work plan and schedule for quantification exist?
§ Does a quantification committee exist with representatives from health facilities (prescribers and pharmacy staff), government (heads of special disease programs and health information systems staff), CMS (or other group handling pharmaceutical distribution), and donors?
§ Is quantification done manually or by computer? If computers are used, which offices have computers, and what software program is used for quantification? Which levels of warehouses and facilities have computerized procurement and inventory records?
§ Is quantification decentralized or managed centrally? Which offices and levels of the system are responsible for quantification?
§ If quantification is decentralized, what training is or has been provided to responsible staff members at peripheral facilities?
§ Are preprinted quantification forms, data collection forms, or both distributed to the facilities?Quantification Methods
§ What quantification methods are used to forecast pharmaceutical and budget needs?
§ Are actual procurement quantities and costs compared at the end of each year against the initial quantification estimates?
§ Is the supply system pipeline functioning well, or have pharmaceutical shortages been frequent or widespread? If shortages have occurred, do only certain medicines present problems, or do shortages exist for many different medicines?
§ What information is used to predict procurement costs? If last year’s prices are used, how are they adjusted?
§ What standard formulas are used to calculate order quantities?
§ Is an EML or health system medicine formulary used for quantification? Is procurement limited to medicines on the list?
§ What techniques are used to adjust initial estimates to conform to budget realities?