PSI Malaria Health Impact Estimation Model Warren Stevens and David Jeffries Research & Metrics Population Services International May 2011

Welcome message from author
This document is posted to help you gain knowledge. Please leave a comment to let me know what you think about it! Share it to your friends and learn new things together.
Transcript

PSI Malaria Health Impact Estimation Model
Warren Stevens and David Jeffries Research & Metrics
Population Services International
May 2011

This document may be freely reviewed, quoted, reproduced or translated, in part or in full, provided the source is acknowledged:
Stevens W and Jeffries D (2011). PSI Malaria Health Impact Estimation Model. Washington, DC: Population Services International. Available at: http://www.psi.org/resources/publications
PSI shares its models with all interested individuals or organizations. Please note that the models are updated periodically based on the latest available epidemiological, demographic, intervention effectiveness, and utilization data. As a result, numbers used in this document should be considered illustrative only. They show how the model works, but they are likely to have changed since the time of writing.
For more information or the latest model updates, contact Amy Ratcliffe at [email protected].
© Population Services International, 2011
P S I ■■ | 2
Contents
Background ......................................................................................................................................................... 4
Section 1: Principles and Structure of the Model ............................................................................................... 5
Section 2: DALY Calculations for Nets ............................................................................................................... 10
Section 3: PermaNet Example for Tanzania...................................................................................................... 13
Section 4: DALY Calculations for Pre‐packaged Treatment (PPT) for Malaria .................................................. 17
Section 5: ACT Example for Tanzania ................................................................................................................ 18
Section 6: DALY Calculation for Rapid Diagnostic Test (RDT) Kits .................................................................... 20
Section 7: Rapid Diagnostic Test (RDT) Kit Example for Tanzania .................................................................... 21
Section 8: Malaria Equations ............................................................................................................................ 23
8.1 Burden of disease ............................................................................................................................... 23
8.2 Insecticide‐treated net (ITN) intervention ......................................................................................... 23
8.3 Pre‐packaged malaria treatment (PPT) intervention ......................................................................... 24
8.4 Rapid diagnostic test (RDT) kit intervention ...................................................................................... 24
Section 9: Access Calculator ............................................................................................................................. 26
References ........................................................................................................................................................ 27
P S I ■■ | 3

P S I ■■ | 4
Background
Population Services International (PSI) is a social marketing organization that promotes healthy behaviors in low‐income and vulnerable populations. PSI has programs in 65 countries (www.psi.org) and covers a wide range of health areas including malaria prevention and treatment. PSI malaria interventions focus on the distribution of 1) insecticide‐treated bed nets (ITNs) for nighttime protection from mosquitoes carrying Plasmodium falciparum; 2) pre‐packaged doses of artemisinin combination therapies (ACT) for treatment of malaria at the household level; and 3) rapid diagnostic test (RDT) kits for accurate diagnosis of malaria cases. Malaria communications campaigns emphasize the importance of correct and consistent use of insecticide‐treated nets (particularly by pregnant women and young children), prompt diagnosis of malaria symptoms, and treatment compliance when malaria is confirmed.
PSI uses the disability‐adjusted life year (DALY) as the metric for measuring the impact of interventions in health areas.1 A DALY model has been developed for each of PSI’s products, services, and behavior change communications (BCC) interventions. The DALY model presented here is the Malaria Health Impact Estimation Model for prevention, diagnosis, and treatment of malaria.
To date, PSI has delivered more than 100 million insecticide‐treated nets (ITNs) and 38 million pre‐packaged malaria treatment packets (PPTs) in more than 35 countries around the world. PSI estimates that 64 percent of the lives saved through use of ITNs and PPTs are the result of the distribution of free products (PSI, 2011a). ITNs account for 77% of free DALYs.
Malaria is a leading cause of sickness and death among people living in low‐income countries where the disease is endemic. Approximately 90% of malaria deaths worldwide occur in sub‐Saharan Africa, and the majority of those deaths are among pregnant women and children under five years of age (PSI, 2011b). The World Health Organization’s World Malaria Report 2010 reports however that the international campaign against malaria is having an impact. Although the estimated number of cases of malaria worldwide rose from 233 million in 2000 to 244 million in 2005, the number of malaria cases decreased to 225 million in 2009 (WHO, 2010). Likewise, the estimated number of deaths due to malaria worldwide decreased from 984,000 in 2000 to 781,000 in 2009 (WHO, 2010).
1 A DALY is defined as one healthy year of life lost (YLL) due to premature death and/or disability from a disease. It measures the gap between current health status and an ideal situation where everyone lives into old age free from disease and disability.
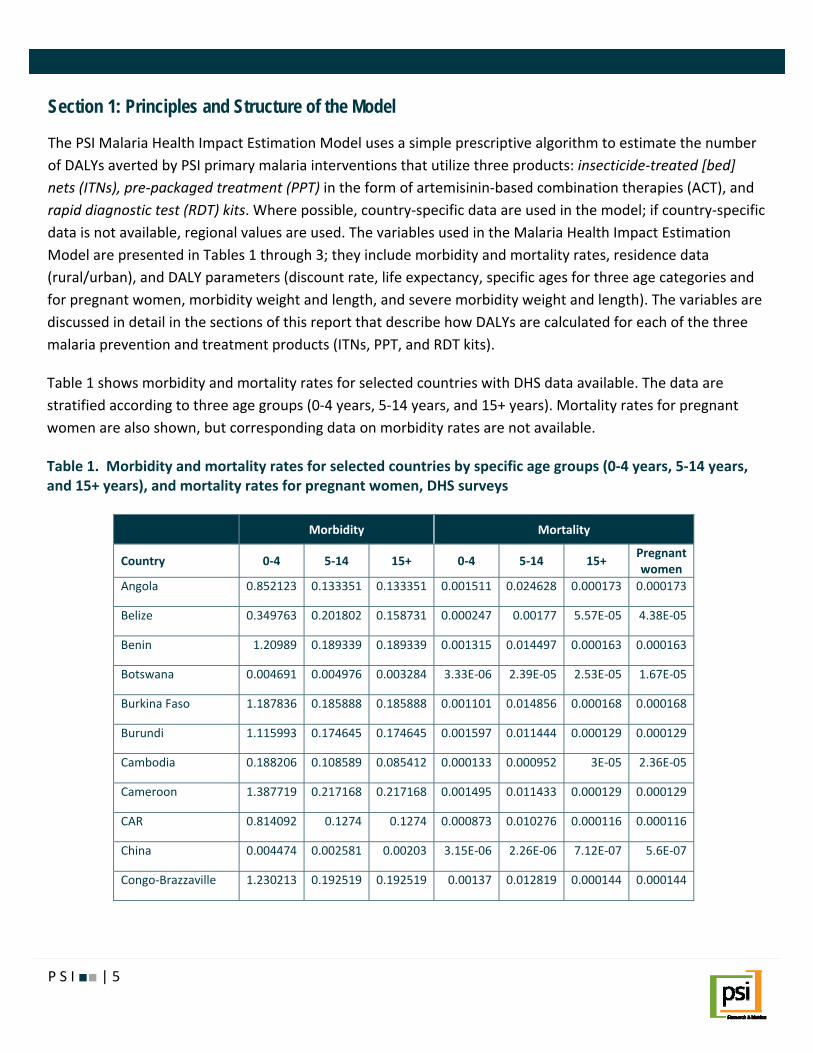
Section 1: Principles and Structure of the Model
The PSI Malaria Health Impact Estimation Model uses a simple prescriptive algorithm to estimate the number of DALYs averted by PSI primary malaria interventions that utilize three products: insecticide‐treated [bed] nets (ITNs), pre‐packaged treatment (PPT) in the form of artemisinin‐based combination therapies (ACT), and rapid diagnostic test (RDT) kits. Where possible, country‐specific data are used in the model; if country‐specific data is not available, regional values are used. The variables used in the Malaria Health Impact Estimation Model are presented in Tables 1 through 3; they include morbidity and mortality rates, residence data (rural/urban), and DALY parameters (discount rate, life expectancy, specific ages for three age categories and for pregnant women, morbidity weight and length, and severe morbidity weight and length). The variables are discussed in detail in the sections of this report that describe how DALYs are calculated for each of the three malaria prevention and treatment products (ITNs, PPT, and RDT kits).
Table 1 shows morbidity and mortality rates for selected countries with DHS data available. The data are stratified according to three age groups (0‐4 years, 5‐14 years, and 15+ years). Mortality rates for pregnant women are also shown, but corresponding data on morbidity rates are not available.
Table 1. Morbidity and mortality rates for selected countries by specific age groups (0‐4 years, 5‐14 years, and 15+ years), and mortality rates for pregnant women, DHS surveys
Morbidity Mortality
Country 0‐4 5‐14 15+ 0‐4 5‐14 15+ Pregnant women
Angola 0.852123 0.133351 0.133351 0.001511 0.024628 0.000173 0.000173
Belize 0.349763 0.201802 0.158731 0.000247 0.00177 5.57E‐05 4.38E‐05
Benin 1.20989 0.189339 0.189339 0.001315 0.014497 0.000163 0.000163
Botswana 0.004691 0.004976 0.003284 3.33E‐06 2.39E‐05 2.53E‐05 1.67E‐05
Burkina Faso 1.187836 0.185888 0.185888 0.001101 0.014856 0.000168 0.000168
Burundi 1.115993 0.174645 0.174645 0.001597 0.011444 0.000129 0.000129
Cambodia 0.188206 0.108589 0.085412 0.000133 0.000952 3E‐05 2.36E‐05
Cameroon 1.387719 0.217168 0.217168 0.001495 0.011433 0.000129 0.000129
CAR 0.814092 0.1274 0.1274 0.000873 0.010276 0.000116 0.000116
China 0.004474 0.002581 0.00203 3.15E‐06 2.26E‐06 7.12E‐07 5.6E‐07
Congo‐Brazzaville 1.230213 0.192519 0.192519 0.00137 0.012819 0.000144 0.000144
P S I ■■ | 5

Morbidity Mortality
Country 0‐4 5‐14 15+ 0‐4 5‐14 15+ Pregnant women
Congo‐Kinshasa 1.255074 0.19641 0.19641 0.001295 0.01552 0.000174 0.000174
Costa Rica 0.019193 0.011074 0.00871 1.35E‐05 9.71E‐05 3.06E‐06 2.4E‐06
Côte d’Ivoire 1.302878 0.203891 0.203891 0.001409 0.011016 0.000124 0.000124
Dominican Republic
0.129474 0.074702 0.058759 9.13E‐05 0.000131 2.06E‐05 1.62E‐05
El Salvador 2.98E‐05 1.72E‐05 1.35E‐05 2.1E‐08 1.51E‐07 4.75E‐09 3.73E‐09
Ethiopia 0.774347 0.12118 0.12118 0.001455 0.010101 8.73E‐05 8.73E‐05
Guatemala 0.016105 0.009292 0.007309 1.14E‐05 8.15E‐05 2.56E‐06 2.02E‐06
Guinea 1.332905 0.20859 0.20859 0.001292 0.129752 0.000183 0.000183
Haiti 0.081957 0.047287 0.037194 5.78E‐05 0.000415 1.31E‐05 1.03E‐05
Honduras 0.010785 0.006223 0.004895 7.6E‐06 5.46E‐05 1.72E‐06 1.35E‐06
India 0.247761 0.14295 0.11244 0.000175 0.000376 3.95E‐05 3.1E‐05
Kenya 1.29254 0.202273 0.202273 0.000987 0.007494 0.000106 0.000106
Laos 0.056 0.03231 0.025414 3.95E‐05 0.000283 8.92E‐06 7.01E‐06
Lesotho 0.000647 0.000686 0.000453 4.59E‐07 3.3E‐07 3.49E‐06 2.31E‐06
Liberia 0.854043 0.133651 0.133651 0.000912 0.014471 0.000163 0.000163
Madagascar 0.14438 0.022595 0.022595 0.000947 0.001168 1.75E‐05 1.75E‐05
Malawi 1.021999 0.159935 0.159935 0.001231 0.011548 0.0001 0.0001
Mali 1.190034 0.186231 0.186231 0.00127 0.020164 0.000227 0.000227
Mexico 0.002389 0.001379 0.001084 1.68E‐06 1.21E‐06 3.81E‐07 2.99E‐07
Mozambique 1.470998 0.2302 0.2302 0.001317 0.011554 0.00013 0.00013
Myanmar 0.293982 0.169618 0.133416 0.000207 0.004463 4.68E‐05 3.68E‐05
Namibia 0.159058 0.16871 0.111333 0.000113 0.000811 0.000858 0.000567
Nepal 0.007026 0.004054 0.003189 4.95E‐06 3.56E‐05 1.12E‐06 8.8E‐07
Nicaragua 0.008091 0.004668 0.003672 5.7E‐06 4.09E‐05 1.29E‐06 1.01E‐06
Nigeria 1.496306 0.234161 0.234161 0.001514 0.023352 0.0002 0.0002
Pakistan 0.02675 0.015434 0.01214 1.89E‐05 0.000135 4.26E‐06 3.35E‐06
P S I ■■ | 6
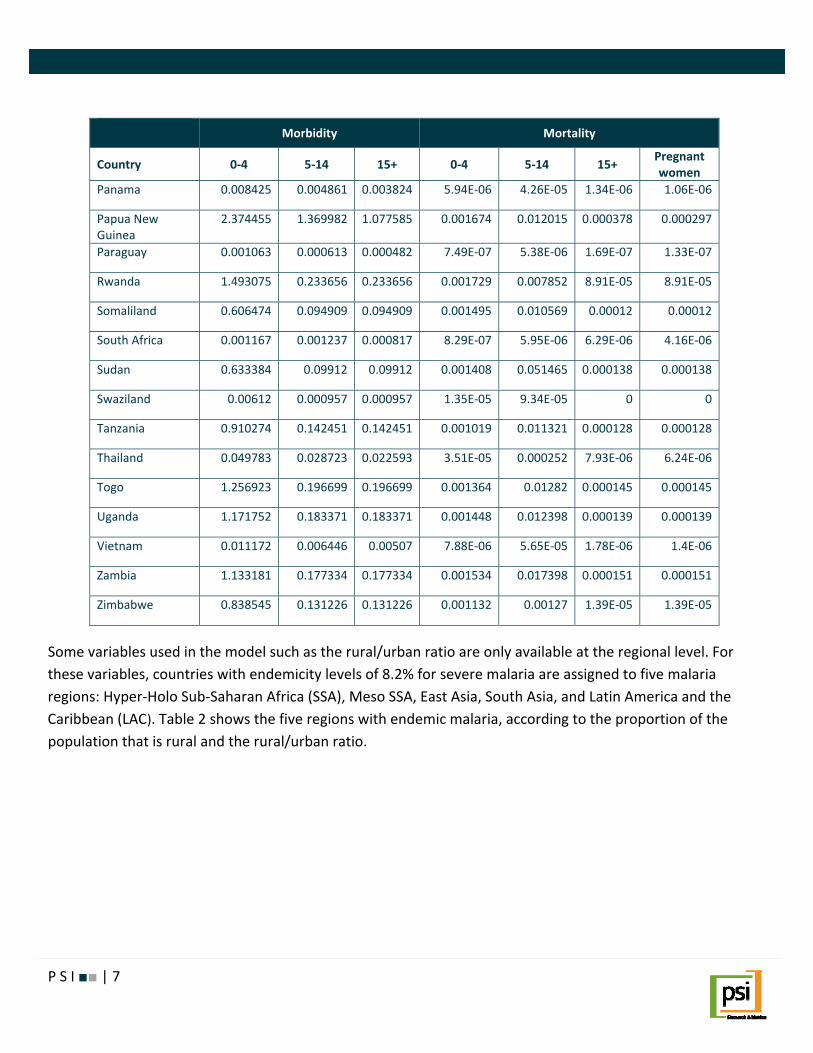
Morbidity Mortality
Country 0‐4 5‐14 15+ 0‐4 5‐14 15+ Pregnant women
Panama 0.008425 0.004861 0.003824 5.94E‐06 4.26E‐05 1.34E‐06 1.06E‐06
Papua New Guinea
2.374455 1.369982 1.077585 0.001674 0.012015 0.000378 0.000297
Paraguay 0.001063 0.000613 0.000482 7.49E‐07 5.38E‐06 1.69E‐07 1.33E‐07
Rwanda 1.493075 0.233656 0.233656 0.001729 0.007852 8.91E‐05 8.91E‐05
Somaliland 0.606474 0.094909 0.094909 0.001495 0.010569 0.00012 0.00012
South Africa 0.001167 0.001237 0.000817 8.29E‐07 5.95E‐06 6.29E‐06 4.16E‐06
Sudan 0.633384 0.09912 0.09912 0.001408 0.051465 0.000138 0.000138
Swaziland 0.00612 0.000957 0.000957 1.35E‐05 9.34E‐05 0 0
Tanzania 0.910274 0.142451 0.142451 0.001019 0.011321 0.000128 0.000128
Thailand 0.049783 0.028723 0.022593 3.51E‐05 0.000252 7.93E‐06 6.24E‐06
Togo 1.256923 0.196699 0.196699 0.001364 0.01282 0.000145 0.000145
Uganda 1.171752 0.183371 0.183371 0.001448 0.012398 0.000139 0.000139
Vietnam 0.011172 0.006446 0.00507 7.88E‐06 5.65E‐05 1.78E‐06 1.4E‐06
Zambia 1.133181 0.177334 0.177334 0.001534 0.017398 0.000151 0.000151
Zimbabwe 0.838545 0.131226 0.131226 0.001132 0.00127 1.39E‐05 1.39E‐05
Some variables used in the model such as the rural/urban ratio are only available at the regional level. For these variables, countries with endemicity levels of 8.2% for severe malaria are assigned to five malaria regions: Hyper‐Holo Sub‐Saharan Africa (SSA), Meso SSA, East Asia, South Asia, and Latin America and the Caribbean (LAC). Table 2 shows the five regions with endemic malaria, according to the proportion of the population that is rural and the rural/urban ratio.
P S I ■■ | 7

Table 2. For five regions with endemic malaria (severe malaria=8.2%), the proportion of the population that is rural, and the rural/urban ratio
Region Prevalence of
severe malaria (%) Proportionrural (%)
Ratio rural/urban
Hyper‐Holo SSA 8.2 67 1.39
Meso SSA 8.2 67 1.39
East Asia 8.2 69 1.41
South Asia 8.2 69 1.41
LAC 8.2 34 1.43
The percentage with severe malaria refers to the percentage of people whose malaria has progressed to the “severe” stage (≥ 8.2%), in populations that allow estimation of both “mild” and “severe” malaria. The second column shows the proportion of the population living in rural areas, and the third column shows the ratio of rural to urban population. The ratio is used to estimate morbidity and mortality in rural and urban areas. Using the morbidity and mortality rates presented in Table 1, regional morbidity and mortality rates by urban rural residence are calculated as follows: (1‐Proportion rural)*Rateurban+ Proportion rural*Raterural = Rateoverall Raterural/ Rateurban = ratio rural to urban Solving gives: Raterural = Rateoverall * (ratio rural to urban) *(n+1)/(1+n* ratio rural to urban) Rateurban = Rateoverall * (n+1)/(1+n* ratio rural to urban) Where, n = Proportion rural/(1‐ Proportion rural)
Table 3 shows the DALY parameters used for all three malaria products (ITNs, PPT, and RDT kits). The discount rate is universally taken as 3%, with a life expectancy of 81.25 years. The age categories used in the model (0‐4 years, 5‐14 years, and 15+ years) are represented by specific ages: 1.8 years, 8.4 years, 28 years, respectively, and 28 years for pregnant women in general.
P S I ■■ | 8
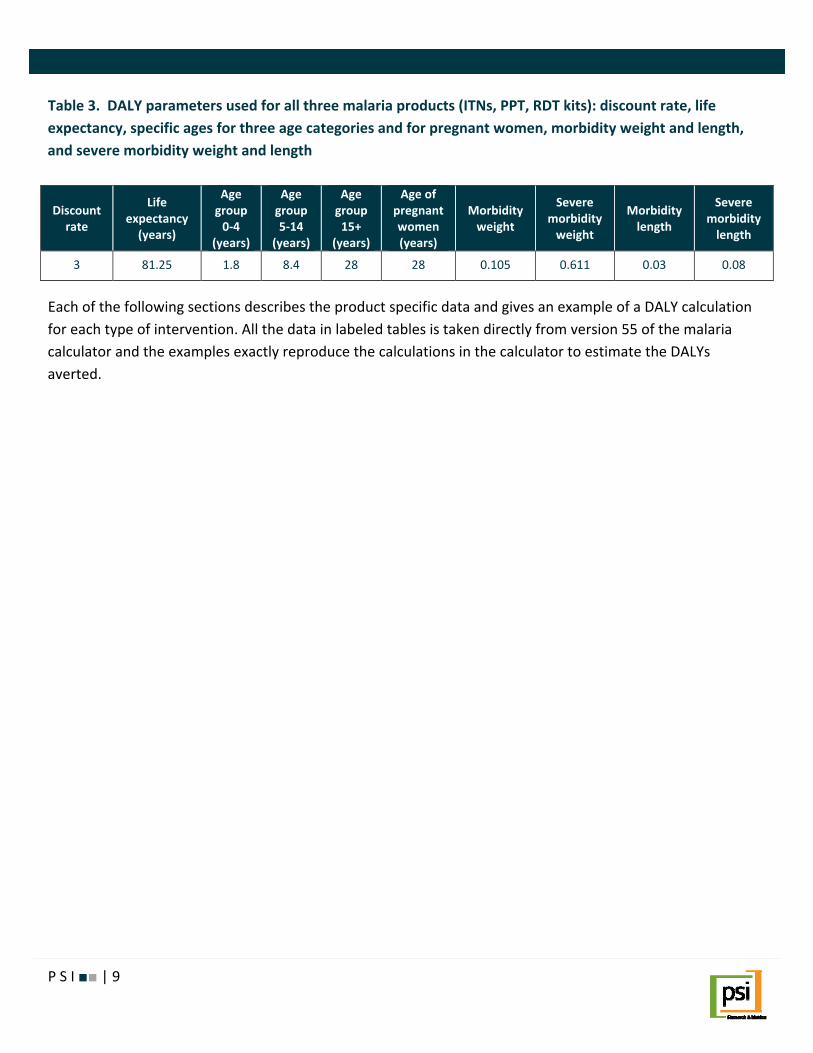
Table 3. DALY parameters used for all three malaria products (ITNs, PPT, RDT kits): discount rate, life expectancy, specific ages for three age categories and for pregnant women, morbidity weight and length, and severe morbidity weight and length
Discount rate
Life expectancy (years)
Age group 0‐4
(years)
Age group 5‐14
(years)
Age group 15+
(years)
Age of pregnant women (years)
Morbidity weight
Severe morbidity weight
Morbidity length
Severe morbidity length
3 81.25 1.8 8.4 28 28 0.105 0.611 0.03 0.08
Each of the following sections describes the product specific data and gives an example of a DALY calculation for each type of intervention. All the data in labeled tables is taken directly from version 55 of the malaria calculator and the examples exactly reproduce the calculations in the calculator to estimate the DALYs averted.
P S I ■■ | 9

Section 2: DALY Calculations for Nets
All calculations are based on the following equation:
Protection = (100‐waste)*utilization*efficacy*life span
The result is then multiplied by the morbidity or mortality rate to get case or deaths averted, from which the DALYs are calculated. The DALY calculations are age stratified, but aggregated to give an all‐risk coefficient. Without aggregation the individual coefficients could represent the effect of distribution to exclusively rural or urban areas. Currently, six net products are included. Table 4 gives their efficacies. Table 4. Net efficacy
Product Efficacy
ITN 0.4897
Olyset LLIN 0.4897
PermaNet LLIN 0.4897
Retreatment 0.3504
ITN123 0.4897
KO123 0.3504
Existing net use increases efficacy. This has been modeled by inflating efficacy with the following factor:
efficacyagenetexisting *cover11
−.
For example, net coverage for a net with a baseline efficacy of 48.97% increases as shown in Figure 1.
Figure 1. Net coverage for net with a baseline efficacy of 48.97%
0 10 20 30 40 5045
50
55
60
65
% existing net coverage
net c
over
age
P S I ■■ | 10

P S I ■■ | 11
Table 5 shows current net use in selected countries. Table 5. Country‐specific net use
Country Coverage Country Coverage
Angola 35 Madagascar 62
Belize 3 Malawi 54
Benin 30 Mali 46
Botswana 10 Mexico 0
Burkina Faso 42 Mozambique 42
Burundi 46 Myanmar 9
Cambodia 12 Namibia 41
Cameroon 46 Nepal 5
CAR 27 Nicaragua 8
China 1 Nigeria 21
Congo‐Brazzaville 45 Pakistan 1
Congo‐Kinshasa 24 Panama 0
Costa Rica 0 Papua New Guinea 23
Côte d’Ivoire 36 Paraguay 0
Dominican Republic 0 Rwanda 66
El Salvador 3 Somaliland 48
Ethiopia 52 South Africa 1
Guatemala 24 Sudan 23
Guinea 46 Swaziland 46
Haiti 4 Tanzania 38
Honduras 0 Thailand 4
India 2 Togo 54
Kenya 66 Uganda 41
Laos 29 Vietnam 1
Lesotho 4 Zambia 38
Liberia 19 Zimbabwe 17

Net use measures the number of persons protected by sleeping under a bed net, with no differentiation by rural/urban residence. Table 6 shows that within each age group, all the net products currently have the same net use values. Note that net use values are used to weight the categories rather than population weights. Table 6. Net use by age group, and for pregnant women
Category PermaNet
LLIN ITN
OlysetLLIN
ITN123 KO123 Retreatment
0 ‐ 4 years 0.45 0.45 0.45 0.45 0.45 0.45
5 ‐14 years 0.19 0.19 0.19 0.19 0.19 0.19
15 ‐ 44 years 0.75 0.75 0.75 0.75 0.75 0.75
Pregnant women 0.1 0.1 0.1 0.1 0.1 0.1
Table 7 shows the life span (in years) of each product. All DALYs are calculated according to the life span of the product, not per year. Table 7. Life span of net products in years
Product Brand Life span
Insecticide Retreatment 0.5
KO 123 bundled ITN123 3.0
KO 123 treatment KO123 3.0
Net treated (ITN) ITN 2.0
Olyset LLIN 5.0
PermaNet LLIN2 3.0
Note: Life span is discounted at 3% using an exponential decay. For example, for PermaNet, a 3‐year life span becomes:
1+exp(‐0.03*1)+exp(‐0.03*2) = 2.9122 years
Net wastage for all products is assumed to be 10% for all countries.
P S I ■■ | 12

Section 3: PermaNet Example for Tanzania
EXAMPLE: Insecticide‐treated nets (ITN)
This example shows how the PermaNet DALY coefficient for Tanzania is calculated. Step 1 Calculate protection Protection for 0‐4 years = (100‐waste)*utilization*efficacy*life span = 0.90*0.45*0.4897*2.9122 Protection for 5‐14 years = (100‐waste)*utilization*efficacy*life span = 0.90*0.19*0.4897*2.9122 Protection for over 15 years = (100‐waste)*utilization*efficacy*life span = 0.90*0.75*0.4897*2.9122
Protection for pregnant women = (100‐waste)*utilization*efficacy*life span = 0.90*0.1*0.4897*2.9122 Step 2 Inflate by existing net coverage Protection for 0‐4 years = 0.90*0.45*0.4897*2.9122*1/(1‐0.38*0.4897) Protection for 5‐14 years = 0.90*0.19*0.4897*2.9122*1/(1‐0.38*0.4897) Protection for over 15 years = 0.90*0.75*0.4897*2.9122*1/(1‐0.38*0.4897)
Protection for pregnant women = 0.90*0.1*0.4897*2.9122*1/(1‐0.38*0.4897)
Step 3 Calculate rural and urban morbidity and mortality
Obtain the morbidity and mortality data for Tanzania from Table 1 above.
Morbidity Mortality
Pregnant women
Country 0‐4 5‐14 15+ 0‐4 5‐11 15+
Tanzania 0.910274 0.142451 0.142451 0.001019 0.011321 0.000128 0.000128
Convert the Tanzania morbidity and mortality figures into rural and urban morbidity and mortality rates using the formulas presented above.
Morbidity Mortality
Tanzania 0‐4 5‐14 15+ 0‐4 5‐11 15+ Pregnantwomen
Rural 1.003156 0.1569868 0.1569868 1.247643E‐02 1.407473E‐04 1.407473E‐04 1.122525E‐03
Urban 0.721695 0.1129401 0.1129401 8.975850E‐03 1.012571E‐04 1.012571E‐04 8.075718E‐04
P S I ■■ | 13
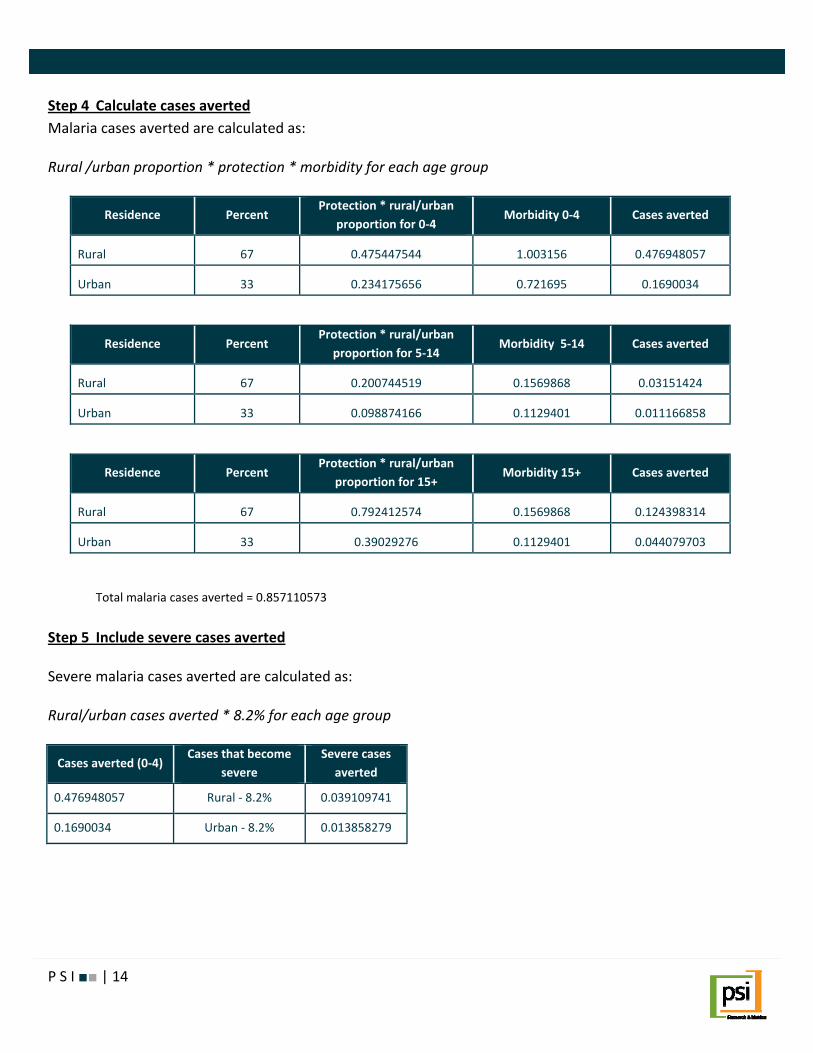
Step 4 Calculate cases averted Malaria cases averted are calculated as: Rural /urban proportion * protection * morbidity for each age group
Residence Percent Protection * rural/urban
proportion for 0‐4 Morbidity 0‐4 Cases averted
Rural 67 0.475447544 1.003156 0.476948057
Urban 33 0.234175656 0.721695 0.1690034
Residence Percent Protection * rural/urban
proportion for 5‐14 Morbidity 5‐14 Cases averted
Rural 67 0.200744519 0.1569868 0.03151424
Urban 33 0.098874166 0.1129401 0.011166858
Residence Percent Protection * rural/urban
proportion for 15+ Morbidity 15+ Cases averted
Rural 67 0.792412574 0.1569868 0.124398314
Urban 33 0.39029276 0.1129401 0.044079703
Total malaria cases averted = 0.857110573
Step 5 Include severe cases averted Severe malaria cases averted are calculated as: Rural/urban cases averted * 8.2% for each age group
Cases averted (0‐4) Cases that become
severe Severe cases
averted
0.476948057 Rural ‐ 8.2% 0.039109741
0.1690034 Urban ‐ 8.2% 0.013858279
P S I ■■ | 14

Cases averted (5‐14) Cases that become
severe Severe cases
averted
0.03151424 Rural ‐ 8.2% 0.002584168
0.011166858 Urban ‐ 8.2% 0.000915682
Cases averted (15+) Cases that become
severe Severe cases
averted
0.124398314 Rural ‐ 8.2% 0.010200662
0.044079703 Urban ‐ 8.2% 0.003614536
Total severe cases averted = 0.070283067
Step 6 Calculate deaths averted Malaria deaths averted are calculated as: Rural/urban proportion * protection * mortality for each age group
Residence Percent Protection * rural/urban proportion for
0‐4 age group Mortality for 0‐4 age group Deathsaverted
Rural 67 0.475447544 1.25E‐02 5.93E‐03
Urban 33 0.234175656 8.98E‐03 2.10E‐03
Residence Percent Protection * rural/urban proportion for
5‐14 age group Mortality for 5‐14 age group Deathsaverted
Rural 67 0.200744519 1.41E‐04 2.83E‐05
Urban 33 0.098874166 1.01E‐04 1.00E‐05
Residence Percent Protection * rural/urban proportion
for15+ age group Mortality for 15+ age group Deathsaverted
Rural 67 0.792412574 1.41E‐04 1.12E‐04
Urban 33 0.39029276 1.01E‐04 3.95E‐05
Residence Percent Protection * rural/urban proportion
forpregnant women Mortality for
pregnant women
Deathsaverted
Rural 67 0.10565501 1.12E‐03 1.19E‐04
Urban 33 0.052039035 8.08E‐04 4.20E‐05
P S I ■■ | 15
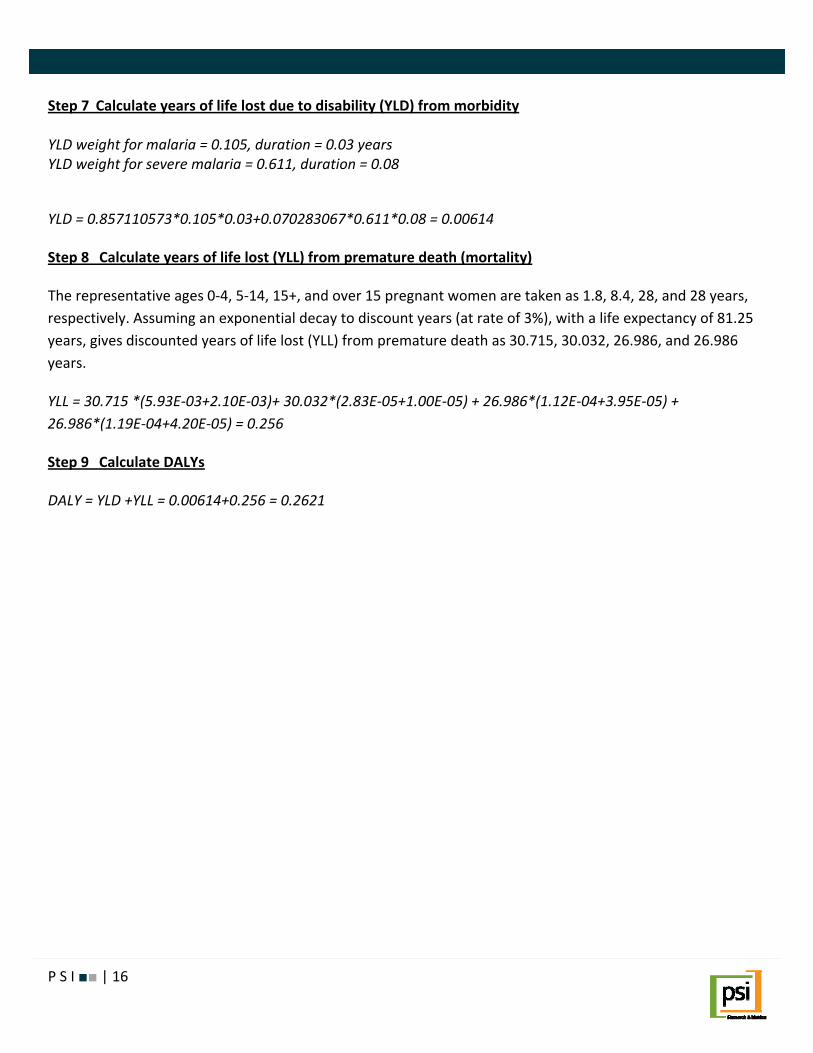
Step 7 Calculate years of life lost due to disability (YLD) from morbidity YLD weight for malaria = 0.105, duration = 0.03 years YLD weight for severe malaria = 0.611, duration = 0.08
YLD = 0.857110573*0.105*0.03+0.070283067*0.611*0.08 = 0.00614
Step 8 Calculate years of life lost (YLL) from premature death (mortality)
The representative ages 0‐4, 5‐14, 15+, and over 15 pregnant women are taken as 1.8, 8.4, 28, and 28 years, respectively. Assuming an exponential decay to discount years (at rate of 3%), with a life expectancy of 81.25 years, gives discounted years of life lost (YLL) from premature death as 30.715, 30.032, 26.986, and 26.986 years.
YLL = 30.715 *(5.93E‐03+2.10E‐03)+ 30.032*(2.83E‐05+1.00E‐05) + 26.986*(1.12E‐04+3.95E‐05) + 26.986*(1.19E‐04+4.20E‐05) = 0.256
Step 9 Calculate DALYs
DALY = YLD +YLL = 0.00614+0.256 = 0.2621
P S I ■■ | 16
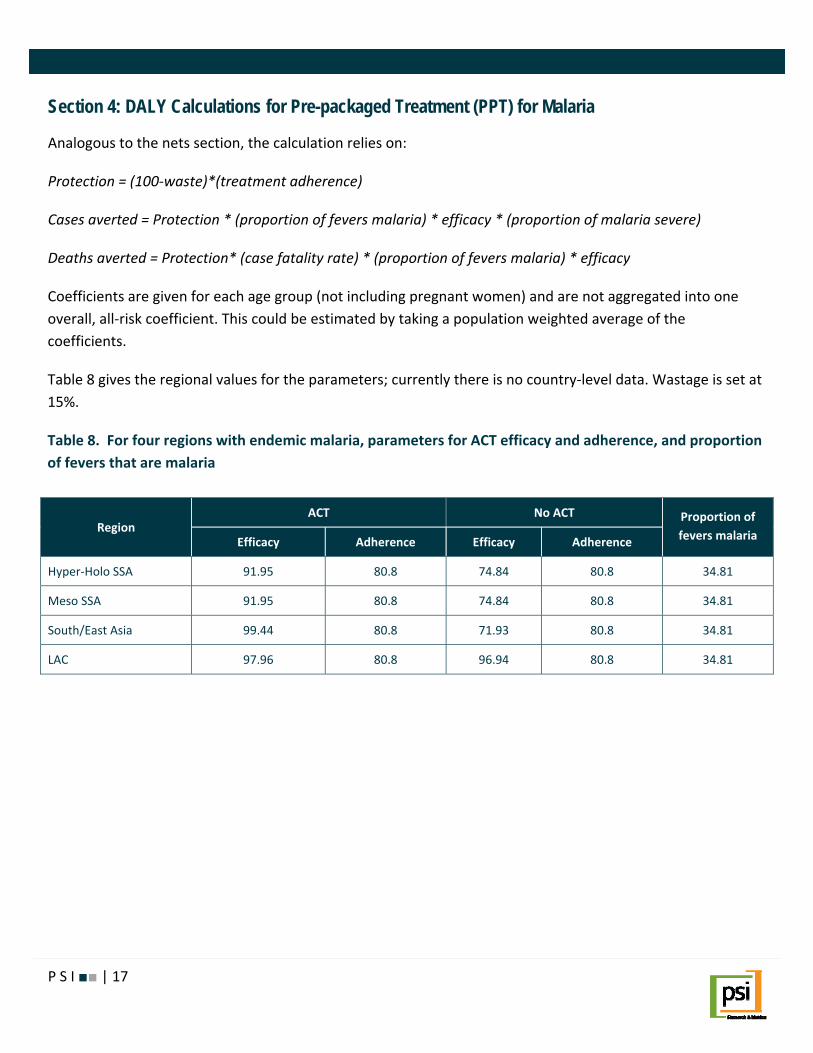
Section 4: DALY Calculations for Pre-packaged Treatment (PPT) for Malaria
Analogous to the nets section, the calculation relies on:
Protection = (100‐waste)*(treatment adherence)
Cases averted = Protection * (proportion of fevers malaria) * efficacy * (proportion of malaria severe)
Deaths averted = Protection* (case fatality rate) * (proportion of fevers malaria) * efficacy
Coefficients are given for each age group (not including pregnant women) and are not aggregated into one overall, all‐risk coefficient. This could be estimated by taking a population weighted average of the coefficients.
Table 8 gives the regional values for the parameters; currently there is no country‐level data. Wastage is set at 15%.
Table 8. For four regions with endemic malaria, parameters for ACT efficacy and adherence, and proportion of fevers that are malaria
Region ACT No ACT Proportion of
fevers malaria Efficacy Adherence Efficacy Adherence
Hyper‐Holo SSA 91.95 80.8 74.84 80.8 34.81
Meso SSA 91.95 80.8 74.84 80.8 34.81
South/East Asia 99.44 80.8 71.93 80.8 34.81
LAC 97.96 80.8 96.94 80.8 34.81
P S I ■■ | 17
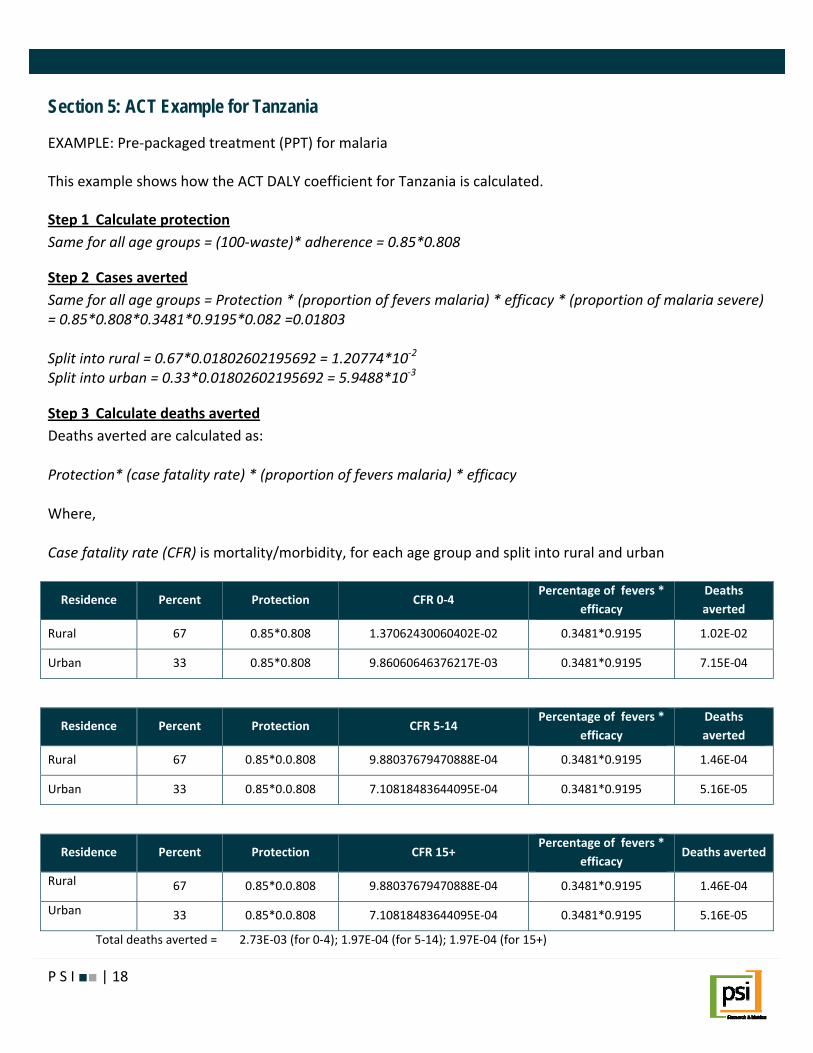
Section 5: ACT Example for Tanzania
EXAMPLE: Pre‐packaged treatment (PPT) for malaria
This example shows how the ACT DALY coefficient for Tanzania is calculated.
Step 1 Calculate protection Same for all age groups = (100‐waste)* adherence = 0.85*0.808
Step 2 Cases averted Same for all age groups = Protection * (proportion of fevers malaria) * efficacy * (proportion of malaria severe) = 0.85*0.808*0.3481*0.9195*0.082 =0.01803 Split into rural = 0.67*0.01802602195692 = 1.20774*10‐2
Split into urban = 0.33*0.01802602195692 = 5.9488*10‐3
Step 3 Calculate deaths averted Deaths averted are calculated as: Protection* (case fatality rate) * (proportion of fevers malaria) * efficacy Where, Case fatality rate (CFR) is mortality/morbidity, for each age group and split into rural and urban
Residence Percent Protection CFR 0‐4 Percentage of fevers *
efficacy Deathsaverted
Rural 67 0.85*0.808 1.37062430060402E‐02 0.3481*0.9195 1.02E‐02
Urban 33 0.85*0.808 9.86060646376217E‐03 0.3481*0.9195 7.15E‐04
Residence Percent Protection CFR 5‐14 Percentage of fevers *
efficacy Deathsaverted
Rural 67 0.85*0.0.808 9.88037679470888E‐04 0.3481*0.9195 1.46E‐04
Urban 33 0.85*0.0.808 7.10818483644095E‐04 0.3481*0.9195 5.16E‐05
Residence Percent Protection CFR 15+ Percentage of fevers *
efficacy Deaths averted
Rural 67 0.85*0.0.808 9.88037679470888E‐04 0.3481*0.9195 1.46E‐04
Urban 33 0.85*0.0.808 7.10818483644095E‐04 0.3481*0.9195 5.16E‐05
Total deaths averted = 2.73E‐03 (for 0‐4); 1.97E‐04 (for 5‐14); 1.97E‐04 (for 15+)
P S I ■■ | 18
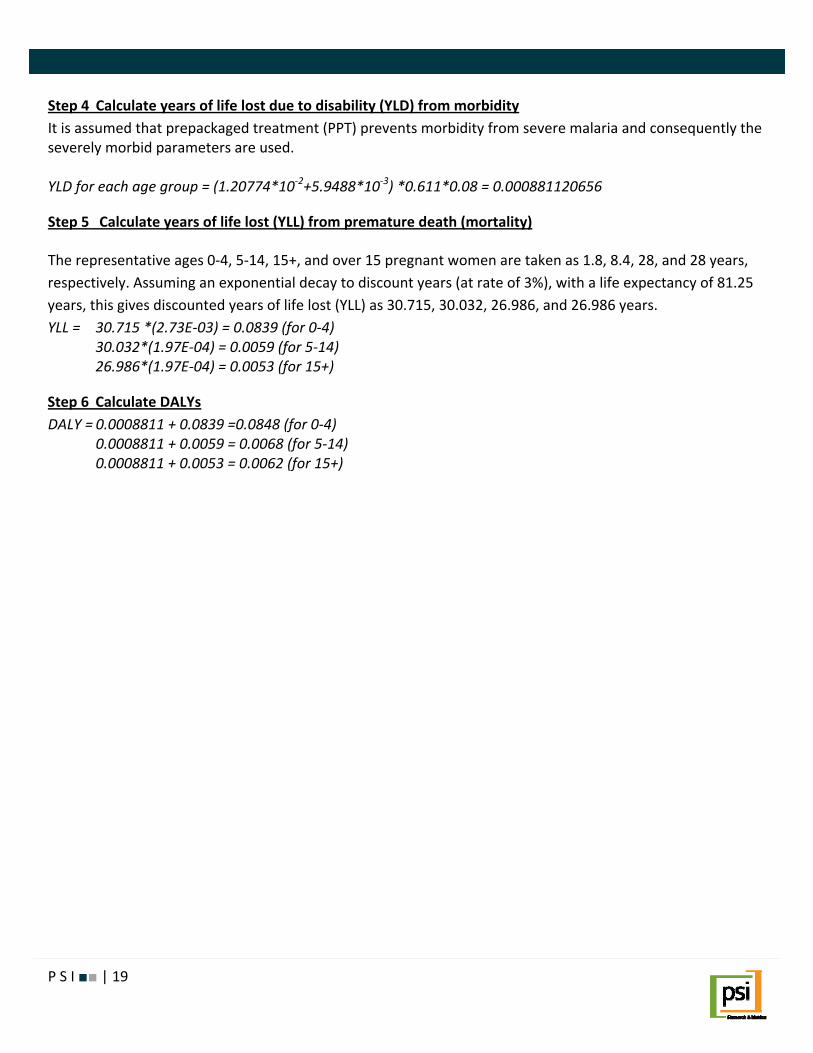
Step 4 Calculate years of life lost due to disability (YLD) from morbidity It is assumed that prepackaged treatment (PPT) prevents morbidity from severe malaria and consequently the severely morbid parameters are used. YLD for each age group = (1.20774*10‐2+5.9488*10‐3) *0.611*0.08 = 0.000881120656
Step 5 Calculate years of life lost (YLL) from premature death (mortality)
The representative ages 0‐4, 5‐14, 15+, and over 15 pregnant women are taken as 1.8, 8.4, 28, and 28 years, respectively. Assuming an exponential decay to discount years (at rate of 3%), with a life expectancy of 81.25 years, this gives discounted years of life lost (YLL) as 30.715, 30.032, 26.986, and 26.986 years. YLL = 30.715 *(2.73E‐03) = 0.0839 (for 0‐4) 30.032*(1.97E‐04) = 0.0059 (for 5‐14) 26.986*(1.97E‐04) = 0.0053 (for 15+)
Step 6 Calculate DALYs DALY = 0.0008811 + 0.0839 =0.0848 (for 0‐4) 0.0008811 + 0.0059 = 0.0068 (for 5‐14) 0.0008811 + 0.0053 = 0.0062 (for 15+)
P S I ■■ | 19

Section 6: DALY Calculation for Rapid Diagnostic Test (RDT) Kits Malaria cases averted = morbidity * (100‐waste) * benefit from RDT Deaths averted = mortality * (100‐waste) * benefit from RDT
The PPV and NPV for RDTs are known: PPV = positive predictive value = (# true positives)/ (RDT positive outcome) NPV = negative predictive value = (# true negatives)/ (RDT negative outcome).
The benefit of RDTs is estimated by comparing two populations, one with and one without RDTs.
No RDT probability of malaria = prevalence of malaria among subjects with fever
Post RDT probability of malaria = PPV
Comparing No RDT and Post RDT gives:
Additional cases detected = PPV – probability of malaria among fevers
This is moderated by the efficacy of and adherence to treatment, assumed to be ACT.
However, RDTs can yield false negatives, which must be included:
Probability of a false negative = 1‐NPV
So, the additional benefit of RDT is as follows:
(PPV – probability of malaria amongst fevers)*efficacy*adherence – (1‐NPV)
Table 9 shows the parameters of rapid diagnostic test (RDT) kits.
Table 9. Parameters for rapid diagnostic test (RDT) kits: wastage, positive predictive value (PPV), and negative predictive value (NPV)
Wastage PPV NPV
15% 79% 91%
P S I ■■ | 20

Section 7: Rapid Diagnostic Test (RDT) Kit Example for Tanzania
EXAMPLE: Rapid diagnostic test (RDT) kits
This example shows how the RDT DALY coefficient for Tanzania is calculated.
Step 1 Calculate rapid diagnostic test (RDT) kit benefit Benefit = (0.79‐0.3481)*0.9195*0.808 – (1‐0.91) = 0.23831229856815
Step 2 Calculate cases averted Cases averted = Benefit*proportion with severe morbidity (It is assumed that a positive RDT and successful treatment prevents progression to severe malaria.) For all age groups, Cases averted = 0.85*[(0.79‐0.3481)*0.9195*0.808 – (1‐0.91)]*0.082 = 0.0166
Step 3 Calculate deaths averted Deaths averted 0‐4, rural = % rural * (1‐Wastage)*CFR 0‐4 * Benefit = 0.67 *0.85 * 1.37062430060402E‐02* 0.23831229856815= 0.1860E‐02 Deaths averted 0‐4, urban = % urban * (1‐Wastage)*CFR 0‐4 * Benefit = 0.33 *0.85 * 9.86060646376217E‐03* 0.23831229856815= 0.6591E‐03 Deaths averted 5‐14, rural = % rural * (1‐Wastage)*CFR 0‐4 * Benefit = 0.67 *0.85 * 9.88037679470888E‐04* 0.23831229856815= 0.1341E‐03 Deaths averted 5‐14, urban = % urban * (1‐Wastage)*CFR 0‐4 * Benefit = 0.33 *0.85 * 7.10818483644095E‐04* 0.23831229856815= 0.4752E‐04 Deaths averted 15+, rural = % rural * (1‐Wastage)*CFR 0‐4 * Benefit = 0.67 *0.85 * 9.88037679470888E‐04* 0.23831229856815= 0.1341E‐03 Deaths averted 15+, urban = % urban * (1‐Wastage)*CFR 0‐4 * Benefit = 0.33 *0.85 * 7.10818483644095E‐04* 0.23831229856815= 0.4752E‐04
P S I ■■ | 21
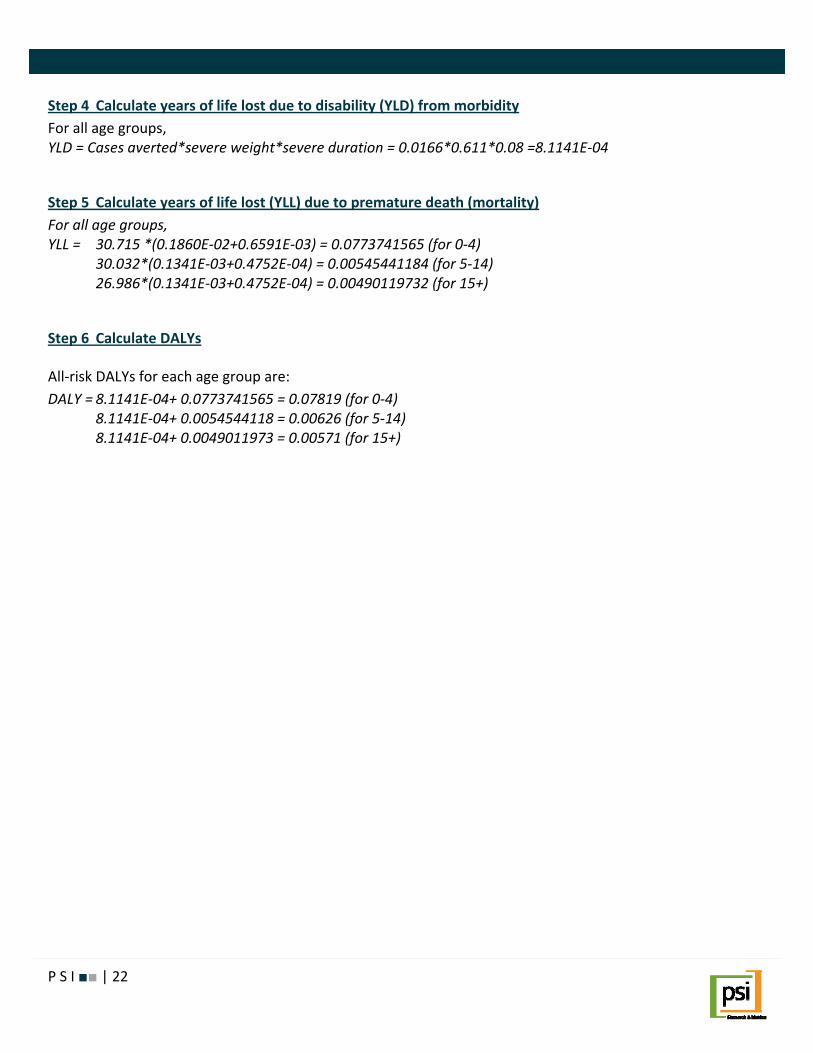
Step 4 Calculate years of life lost due to disability (YLD) from morbidity For all age groups, YLD = Cases averted*severe weight*severe duration = 0.0166*0.611*0.08 =8.1141E‐04
Step 5 Calculate years of life lost (YLL) due to premature death (mortality) For all age groups, YLL = 30.715 *(0.1860E‐02+0.6591E‐03) = 0.0773741565 (for 0‐4)
30.032*(0.1341E‐03+0.4752E‐04) = 0.00545441184 (for 5‐14) 26.986*(0.1341E‐03+0.4752E‐04) = 0.00490119732 (for 15+)
Step 6 Calculate DALYs
All‐risk DALYs for each age group are: DALY = 8.1141E‐04+ 0.0773741565 = 0.07819 (for 0‐4) 8.1141E‐04+ 0.0054544118 = 0.00626 (for 5‐14) 8.1141E‐04+ 0.0049011973 = 0.00571 (for 15+)
P S I ■■ | 22
Section 8: Malaria Equations Assuming the following notations: MR = mortality rate MO = morbidity CFR = case fatality rate A = representative group ages Dis(A,0.03,81.5) = discounted life years for life expectancy of 81.5 with a discount rate of 3% W = disability weight S = product sales E = product efficacy WA = proportion of product wasted Le = disease episode length in years AD = adherence PPV = positive predictive value NPV = negative predictive value The algorithms used to estimate DALYs in the Malaria Health Impact Model are summarized below:
8.1 Burden of disease
Years of life lost (YLL) due to premature death from malaria =
)5.81,03.0,(**2
1
3
1∑∑= =i j
jijij ADisMRpopulation
Years of life lost due to disability (YLD) from malaria =
∑∑= =
2
1
3
1***
i jijijmalaria
malariae MOpopulationWL
Where,
i=1 to 2 is rural and urban, j =1 to 3 is age groups 0‐4, 5‐15, over 15, and pregnant women
8.2 Insecticide-treated net (ITN) intervention
Deaths averted by use of ITNs =
( ) productjj
j LSWEfeverspropMRpropS *)1(******4
1−∑
=
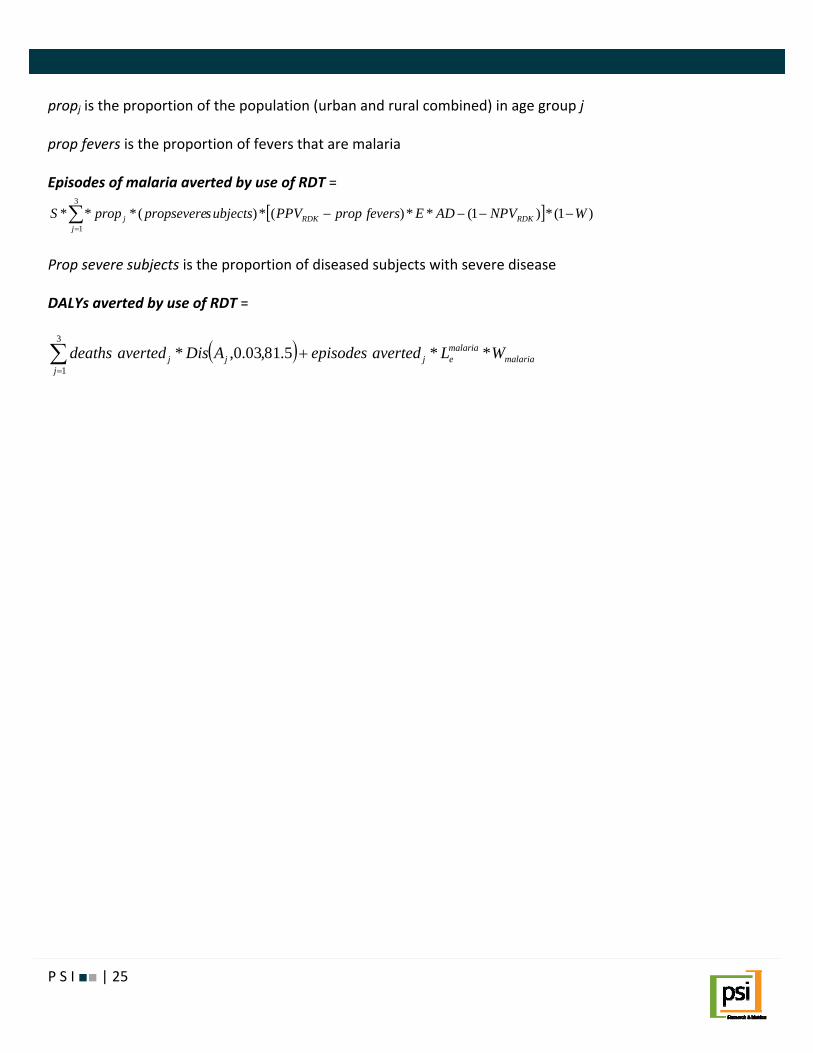
propj is the proportion of the population (urban and rural combined) in age group j
P S I ■■ | 23
prop fevers is the proportion of fevers that are malaria
LSproduct is the product life span in years
Episodes of malaria averted by use of ITNs =
( ) productjj
j LSWEfeverspropMOpropS *)1(******4
1−∑
=
DALYs averted by use of ITNs =
( ) malariamalariaej
jjj WLavertedepisodesADisaverteddeaths **5.81,03.0,*
4
1+∑
=
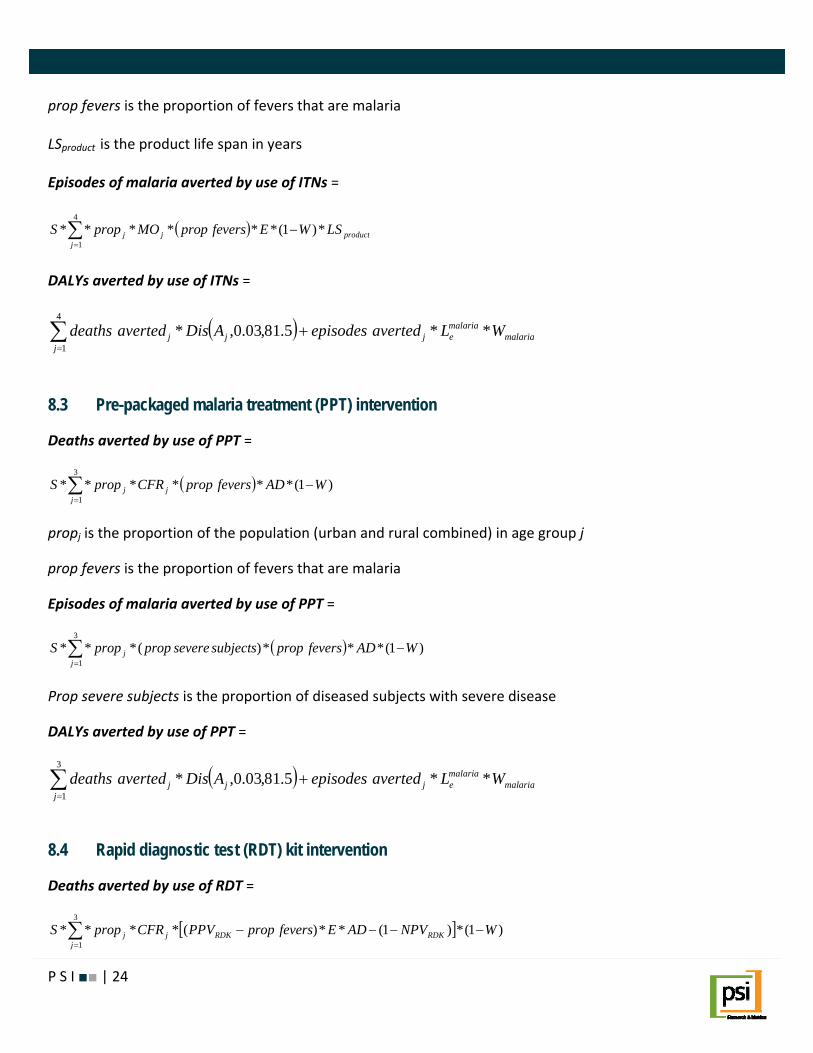
8.3 Pre-packaged malaria treatment (PPT) intervention
Deaths averted by use of PPT =
( ) )1(******3
1WADfeverspropCFRpropS j
jj −∑
=
propj is the proportion of the population (urban and rural combined) in age group j
prop fevers is the proportion of fevers that are malaria
Episodes of malaria averted by use of PPT =
( ) )1(***)(***3
1WADfeverspropsubjectssevereproppropS
jj −∑
=
Prop severe subjects is the proportion of diseased subjects with severe disease
DALYs averted by use of PPT =
( ) malariamalariaej
jjj WLavertedepisodesADisaverteddeaths **5.81,03.0,*
3
1+∑
=
8.4 Rapid diagnostic test (RDT) kit intervention
Deaths averted by use of RDT =
[ ] )1(*)1(**)(****3
1WNPVADEfeverspropPPVCFRpropS RDKRDKj
jj −−−−∑
=
P S I ■■ | 24
P S I ■■ | 25
propj is the proportion of the population (urban and rural combined) in age group j
prop fevers is the proportion of fevers that are malaria
Episodes of malaria averted by use of RDT =
[ ] )1(*)1(**)(*)(***1
WNPVADEfeverspropPPVubjectsspropseverepropS RDKRDKj
j −−−−∑=
3
Prop severe subjects is the proportion of diseased subjects with severe disease
DALYs averted by use of RDT =
( ) malariamalariaej
jjj WLavertedepisodesADisaverteddeaths **5.81,03.0,*
3
1+∑
=

P S I ■■ | 26
Section 9: Access Calculator
The calculator repeats exactly the operations described above for each stratum for each country, using visual basic for applications (VBA) code. The table below gives the name of the Access tables, stored within the calculator, that correspond to the tables of data (Tables 1‐9). Table No. Name of Access table Comments
1 country_epi_data
2 regional_demog_mal Ratio rural to urban in field prop_r_u
2 regional_epi_data Fields severe_per and mortaility_rate_ratio
3 daly_defaults
4 efficacy
5 country_epi_data Field coverage
6 tbl_utilisation_urban Note data is identical in tbl_utilisation_rural
7 life span_tab Life span stored as months
8 Region_demog_mal Fields clinical_eff_act, adherence_act, prop_of_fevers_act and same for noact – prop of fevers are the same
9 RDT parameters
Endemic populations that are used to estimate the burden of disease are in Table 8 (Regional Demography – Malaria).

References
Population Services International (PSI). 2011a. Why PSI uses social marketing: The evidence base. Washington, D.C.: Population Services International.
Population Services International (PSI). 2011b. PSI applauds U.S. passage of resolution to increase malaria prevention. Press release, July 1, 2011.
World Health Organization (WHO). 2010. World malaria report 2010. Geneva: World Health Organization.
P S I ■■ | 27
1120 19th Street, NW | Suite 600 Washington, DC 20036 psi.org | Twitter: @PSIHealthyLives | blog: psihealthylives.com
Related Documents