Punjab Basmati Rice: A Need Punjab Basmati Rice: A Need to Explore its Production and to Explore its Production and
Export PotentialExport Potential
Jagshand Singh Chhina, Bhupinder Singh and Narinderpal Singh*
(PAU, RRS, Gurdaspur and FASS, Amritsar)
IntroductionIntroduction
BasmatiBasmati rice is characterized by rice is characterized by superfine, extra long grains having a superfine, extra long grains having a length breadth ratio more than 3.5 with length breadth ratio more than 3.5 with extra elongation and least breadth wise extra elongation and least breadth wise swelling on cooking. Basmati grains swelling on cooking. Basmati grains contain 0.09 parts per million of the contain 0.09 parts per million of the chemical compound 2chemical compound 2--acetylacetyl--11--pyrroline, pyrroline, which is about 12 times more than which is about 12 times more than concentrations found in unscented rice concentrations found in unscented rice varieties, which gives it distinctive spicy varieties, which gives it distinctive spicy fragrance. fragrance.
Objectives of the studyObjectives of the study
•• To examine the production of Basmati To examine the production of Basmati
rice in the study area.rice in the study area.
•• To study the export potential of To study the export potential of
Basmati rice.Basmati rice.
•• To develop the policy implications.To develop the policy implications.
METHODOLOGYMETHODOLOGY
The study (2005The study (2005--06) was based on both 06) was based on both primary and secondary data and focused primary and secondary data and focused in districts of Amritsar and Gurdaspur. A in districts of Amritsar and Gurdaspur. A multi stage, random sampling technique multi stage, random sampling technique was adopted for selecting the study was adopted for selecting the study sample. Two blocks from each district sample. Two blocks from each district were selected and then three villages from were selected and then three villages from each block, resulting into choosing a total each block, resulting into choosing a total of 12 villages in all. of 12 villages in all.

Selection of sample in district Selection of sample in district Amritsar Amritsar
(Block)(Block)
AjnalaAjnala
(Village)(Village)
BhullarBhullarB. grower =78B. grower =78
Sample = 8Sample = 8
BhalapindBhalapindB. grower =54B. grower =54
Sample = 6Sample = 6
BoparaiBoparaiB. grower =54B. grower =54
Sample = 6Sample = 6
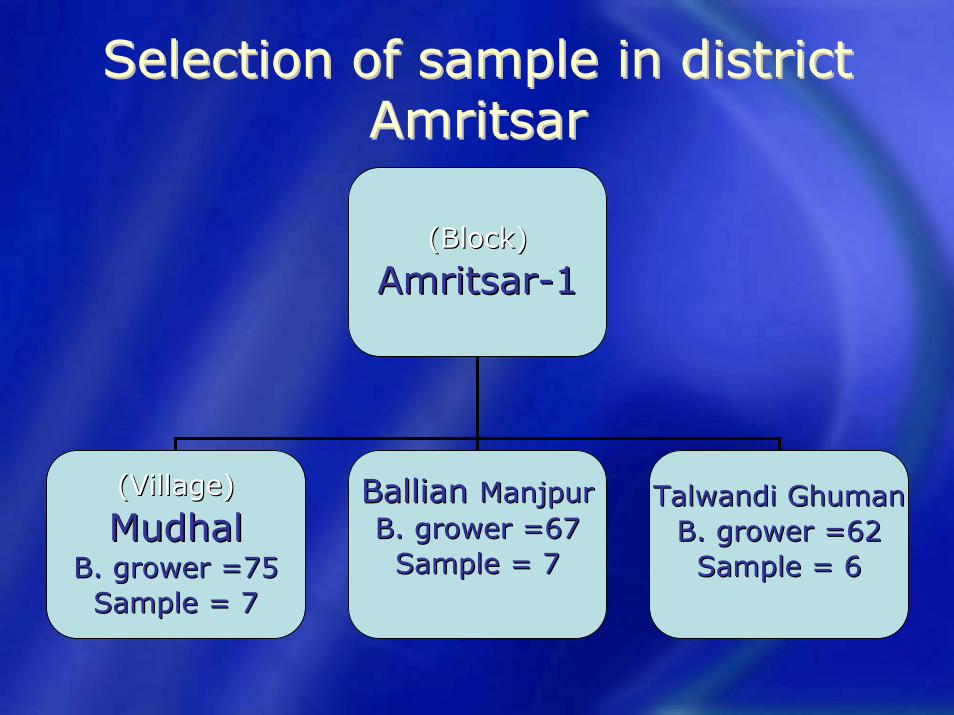
Selection of sample in district Selection of sample in district Amritsar Amritsar
(Block)(Block)
AmritsarAmritsar--11
(Village)(Village)
MudhalMudhalB. grower =75B. grower =75
Sample = 7Sample = 7
BallianBallian ManjpurManjpurB. grower =67B. grower =67
Sample = 7Sample = 7
TalwandiTalwandi GhumanGhumanB. grower =62B. grower =62
Sample = 6Sample = 6
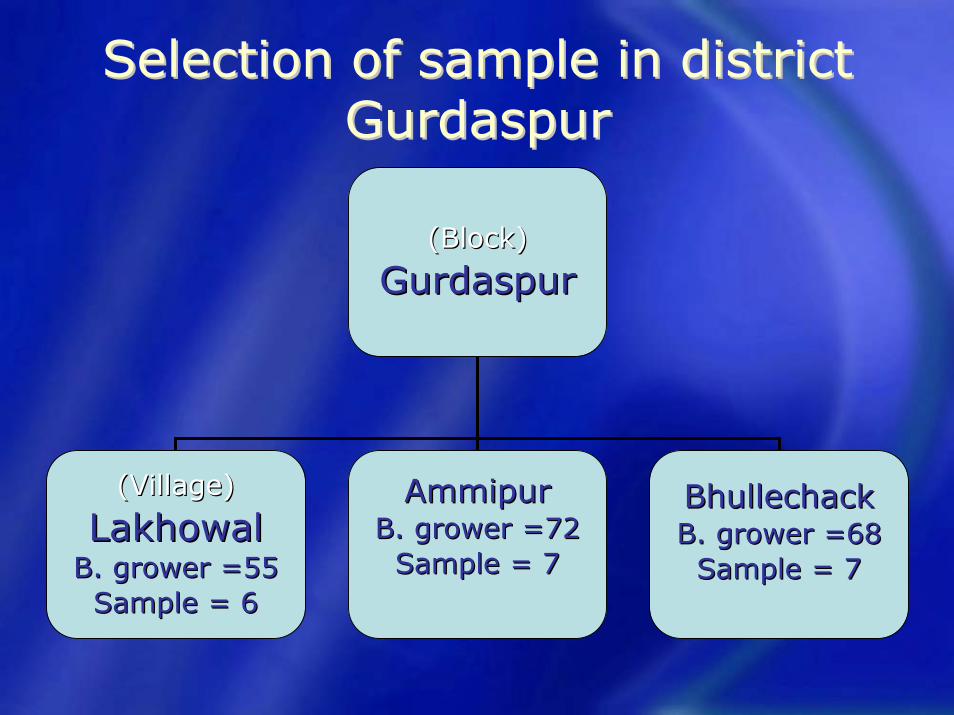
Selection of sample in district Selection of sample in district Gurdaspur Gurdaspur
(Block)(Block)
GurdaspurGurdaspur
(Village)(Village)
LakhowalLakhowalB. grower =55B. grower =55
Sample = 6Sample = 6
AmmipurAmmipurB. grower =72B. grower =72
Sample = 7Sample = 7
BhullechackBhullechackB. grower =68B. grower =68
Sample = 7Sample = 7
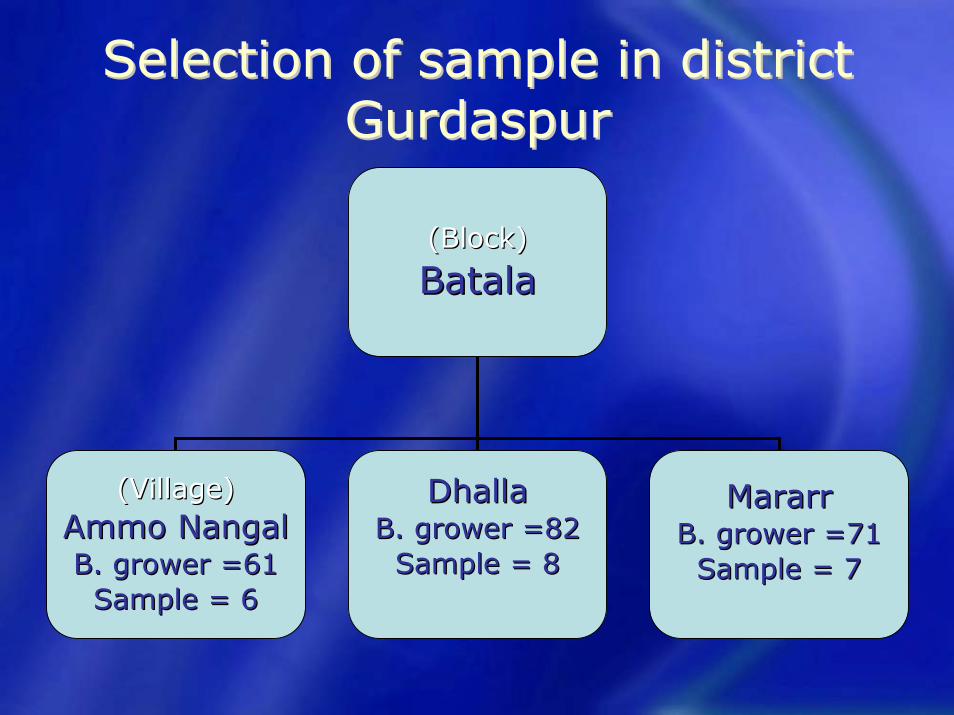
Selection of sample in district Selection of sample in district Gurdaspur Gurdaspur
(Block)(Block)
BatalaBatala
(Village)(Village)Ammo Ammo NangalNangalB. grower =61B. grower =61
Sample = 6Sample = 6
DhallaDhallaB. grower =82B. grower =82
Sample = 8Sample = 8
MararrMararrB. grower =71B. grower =71
Sample = 7Sample = 7
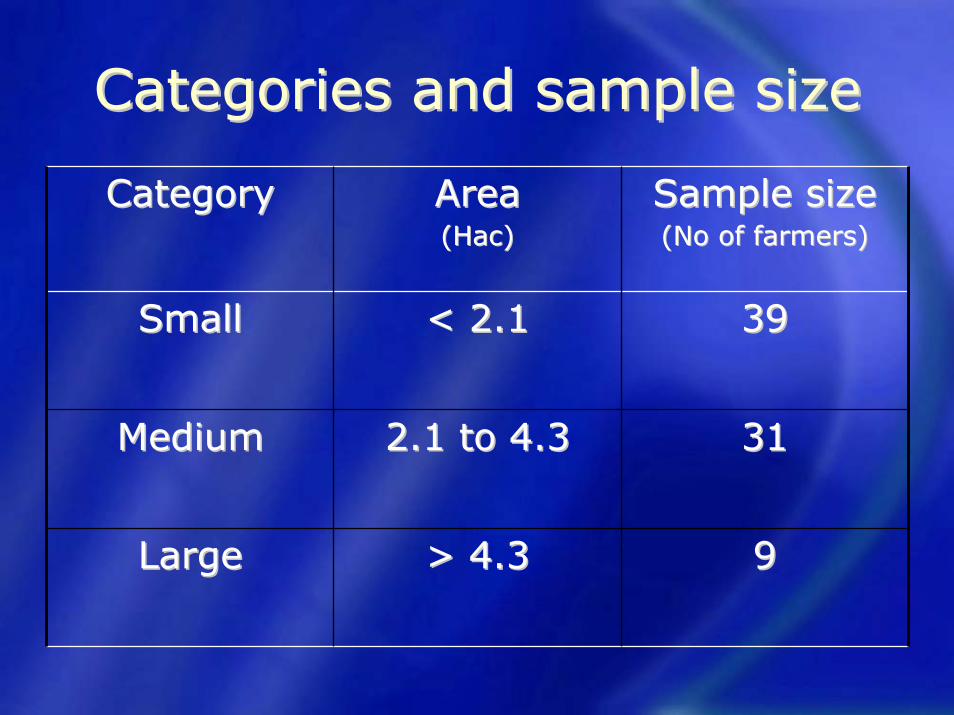
Categories and sample size Categories and sample size
99> 4.3> 4.3LargeLarge
31312.1 to 4.32.1 to 4.3MediumMedium
3939< 2.1< 2.1SmallSmall
Sample sizeSample size(No of farmers)(No of farmers)
Area Area ((HacHac))
CategoryCategory
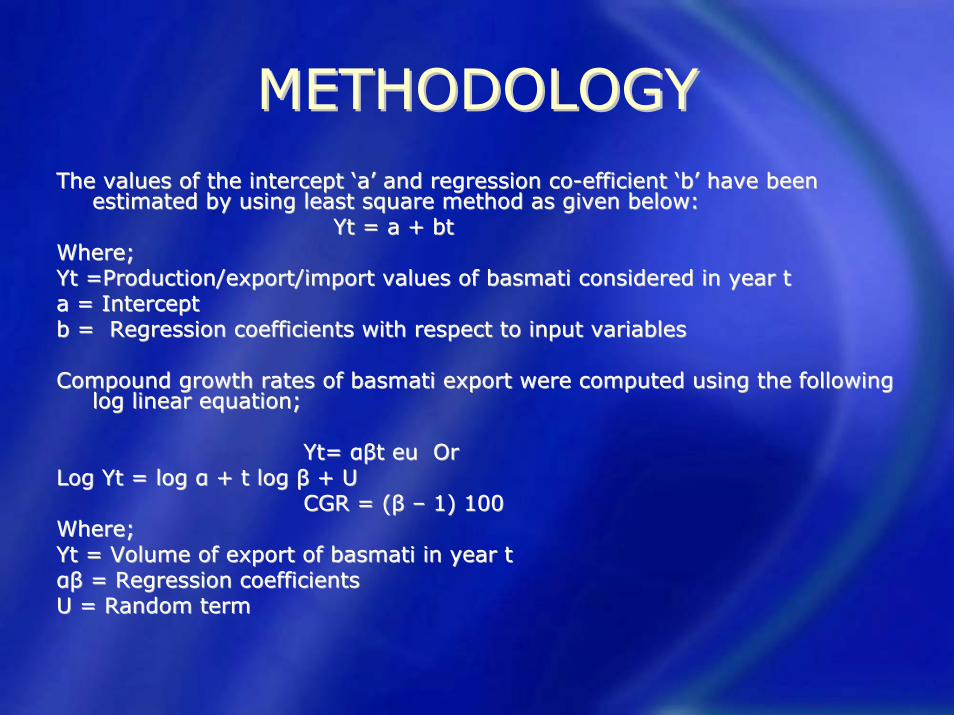
METHODOLOGYMETHODOLOGYThe values of the intercept ‘a’ and regression coThe values of the intercept ‘a’ and regression co--efficient ‘b’ have been efficient ‘b’ have been
estimated by using least square method as given below: estimated by using least square method as given below: YtYt = a + = a + btbt
Where;Where;YtYt =Production/export/import values of basmati considered in year =Production/export/import values of basmati considered in year tta = Intercept a = Intercept b = Regression coefficients with respect to input variablesb = Regression coefficients with respect to input variables
Compound growth rates of basmati export were computed using the Compound growth rates of basmati export were computed using the following following log linear equation;log linear equation;
YtYt= = αβtαβt eu eu OrOrLog Log YtYt = log α + t log β + U= log α + t log β + U
CGR = (β CGR = (β –– 1) 1001) 100Where;Where;YtYt = Volume of export of basmati in year t= Volume of export of basmati in year tαβαβ = Regression coefficients= Regression coefficientsU = Random termU = Random term
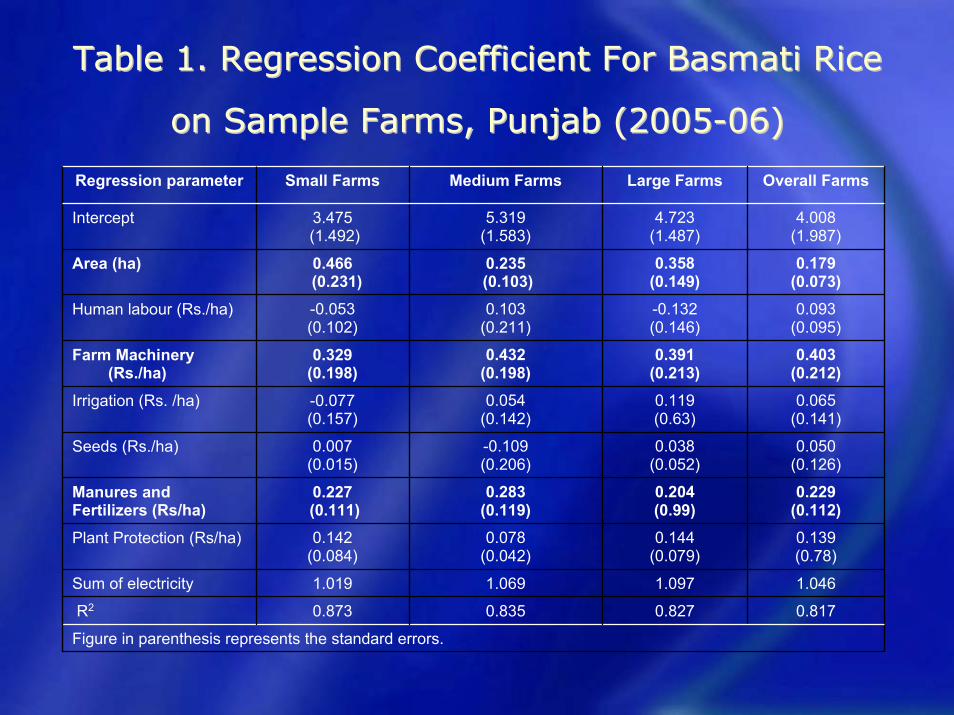
Table 1. Regression Coefficient For Basmati Rice Table 1. Regression Coefficient For Basmati Rice
on Sample Farms, Punjab (2005on Sample Farms, Punjab (2005--06)06)
Figure in parenthesis represents the standard errors.
0.8170.8270.8350.873R2
1.0461.0971.0691.019Sum of electricity
0.139(0.78)
0.144(0.079)
0.078(0.042)
0.142(0.084)
Plant Protection (Rs/ha)
0.229(0.112)
0.204(0.99)
0.283(0.119)
0.227(0.111)
Manures andFertilizers (Rs/ha)
0.050(0.126)
0.038(0.052)
-0.109(0.206)
0.007(0.015)
Seeds (Rs./ha)
0.065(0.141)
0.119(0.63)
0.054(0.142)
-0.077 (0.157)
Irrigation (Rs. /ha)
0.403(0.212)
0.391(0.213)
0.432(0.198)
0.329(0.198)
Farm Machinery (Rs./ha)
0.093(0.095)
-0.132(0.146)
0.103(0.211)
-0.053(0.102)
Human labour (Rs./ha)
0.179(0.073)
0.358(0.149)
0.235 (0.103)
0.466 (0.231)
Area (ha)
4.008(1.987)
4.723(1.487)
5.319(1.583)
3.475 (1.492)
Intercept
Overall FarmsLarge FarmsMedium FarmsSmall FarmsRegression parameter
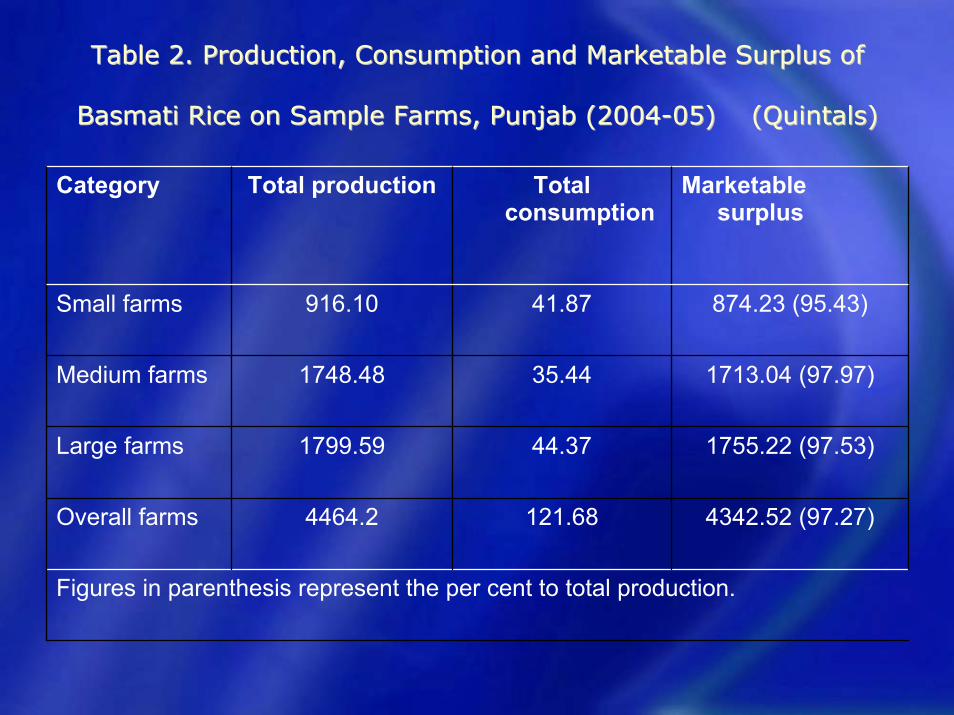
Table 2. Production, Consumption and Marketable Surplus of Table 2. Production, Consumption and Marketable Surplus of
Basmati Rice on Sample Farms, Punjab (2004Basmati Rice on Sample Farms, Punjab (2004--05) (Quintals)05) (Quintals)
Figures in parenthesis represent the per cent to total production.
4342.52 (97.27)121.684464.2Overall farms
1755.22 (97.53)44.371799.59Large farms
1713.04 (97.97)35.441748.48Medium farms
874.23 (95.43)41.87916.10Small farms
Marketable surplus
Total consumption
Total productionCategory
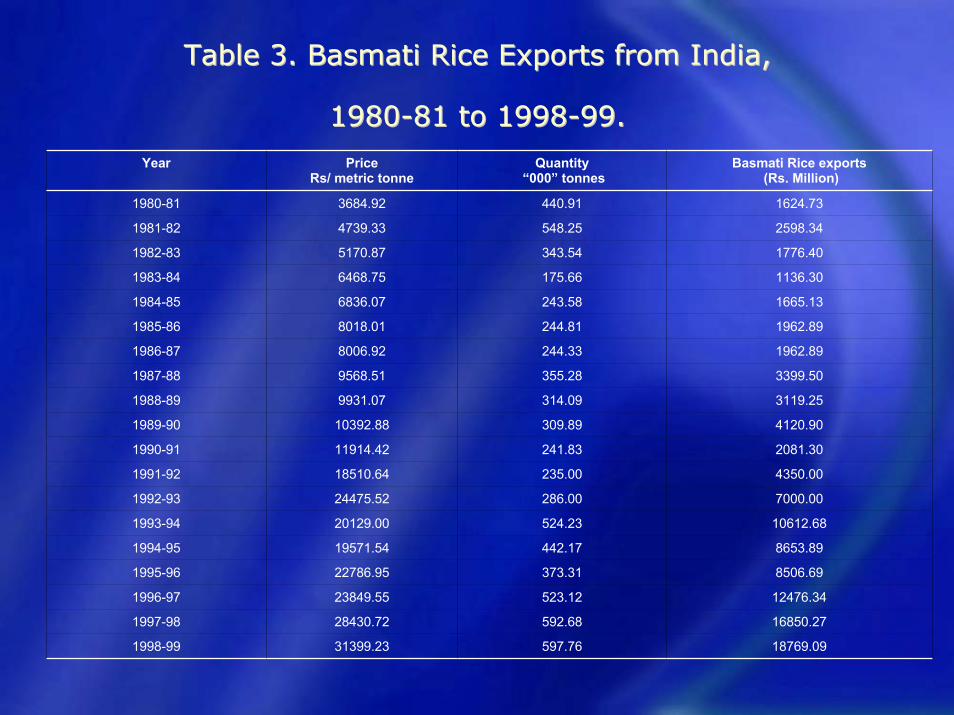
Table 3. Basmati Rice Exports from India, Table 3. Basmati Rice Exports from India,
19801980--81 to 199881 to 1998--99.99.
18769.09597.7631399.231998-99
16850.27592.6828430.721997-98
12476.34523.1223849.551996-97
8506.69373.3122786.951995-96
8653.89442.1719571.541994-95
10612.68524.2320129.001993-94
7000.00286.0024475.521992-93
4350.00235.0018510.641991-92
2081.30241.8311914.421990-91
4120.90309.8910392.881989-90
3119.25314.099931.071988-89
3399.50355.289568.511987-88
1962.89244.338006.921986-87
1962.89244.818018.011985-86
1665.13243.586836.071984-85
1136.30175.666468.751983-84
1776.40343.545170.871982-83
2598.34548.254739.331981-82
1624.73440.913684.921980-81
Basmati Rice exports (Rs. Million)
Quantity “000” tonnes
Price Rs/ metric tonne
Year
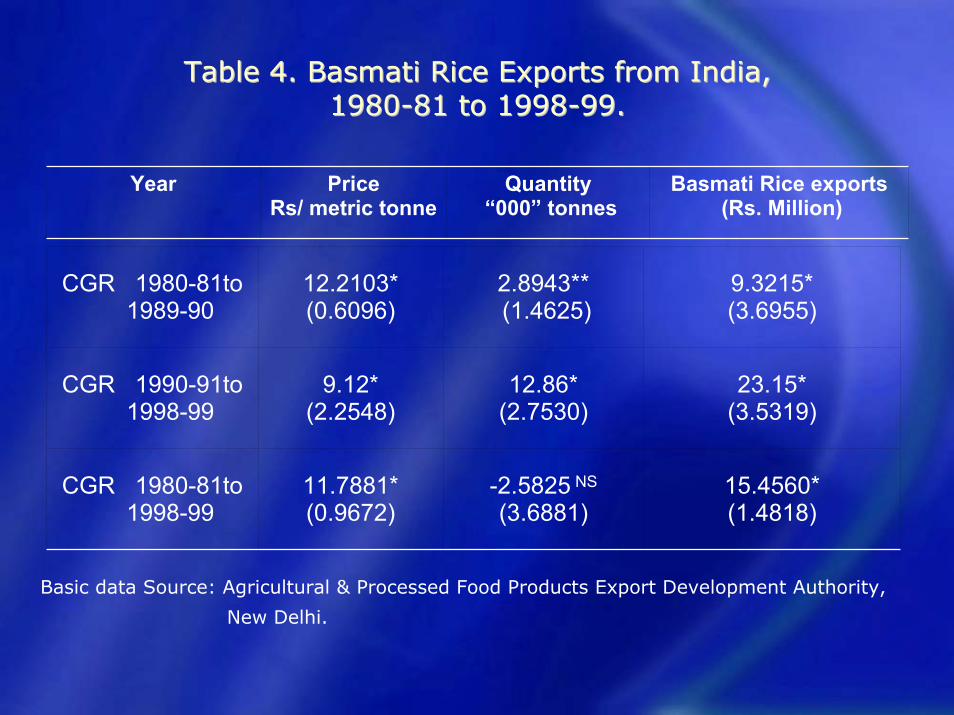
Table 4. Basmati Rice Exports from India, Table 4. Basmati Rice Exports from India, 19801980--81 to 199881 to 1998--99.99.
Basmati Rice exports (Rs. Million)
Quantity “000” tonnes
Price Rs/ metric tonne
Year
15.4560* (1.4818)
-2.5825 NS
(3.6881)11.7881* (0.9672)
CGR 1980-81to 1998-99
23.15* (3.5319)
12.86* (2.7530)
9.12* (2.2548)
CGR 1990-91to 1998-99
9.3215*(3.6955)
2.8943**(1.4625)
12.2103* (0.6096)
CGR 1980-81to 1989-90
Basic data Source: Agricultural & Processed Food Products Export Development Authority,
New Delhi.
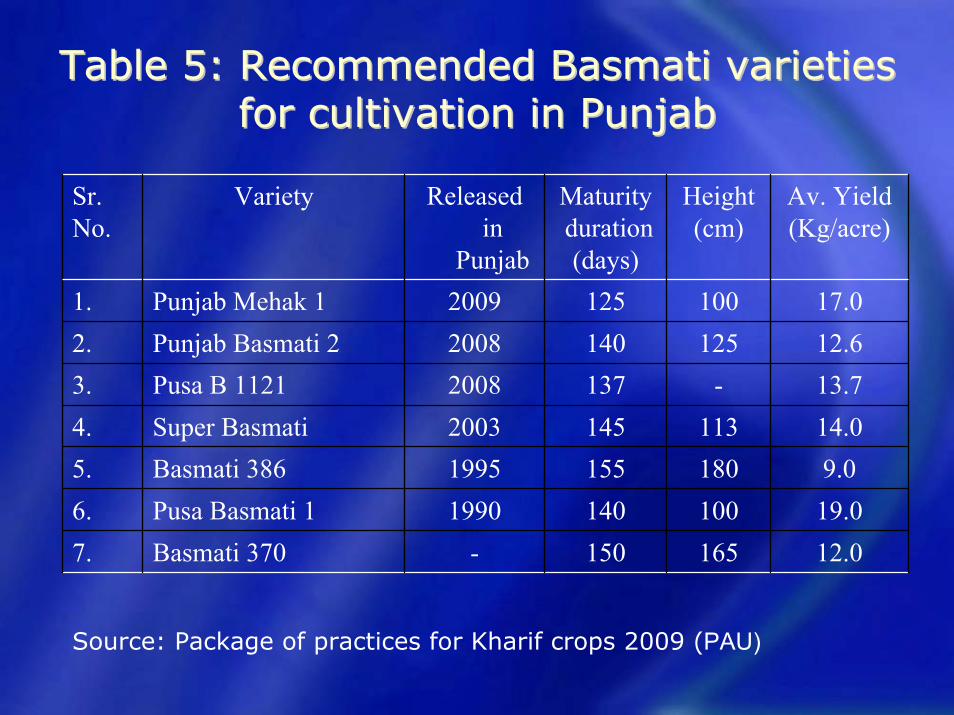
Table 5: Recommended Basmati varieties Table 5: Recommended Basmati varieties for cultivation in Punjabfor cultivation in Punjab
12.0165150-Basmati 3707.19.01001401990Pusa Basmati 16.9.01801551995Basmati 3865.
14.01131452003Super Basmati4.13.7-1372008Pusa B 11213.12.61251402008Punjab Basmati 22.17.01001252009Punjab Mehak 11.
Av. Yield(Kg/acre)
Height(cm)
Maturityduration(days)
Released in
Punjab
VarietySr.No.
Source: Package of practices for Kharif crops 2009 (PAU)
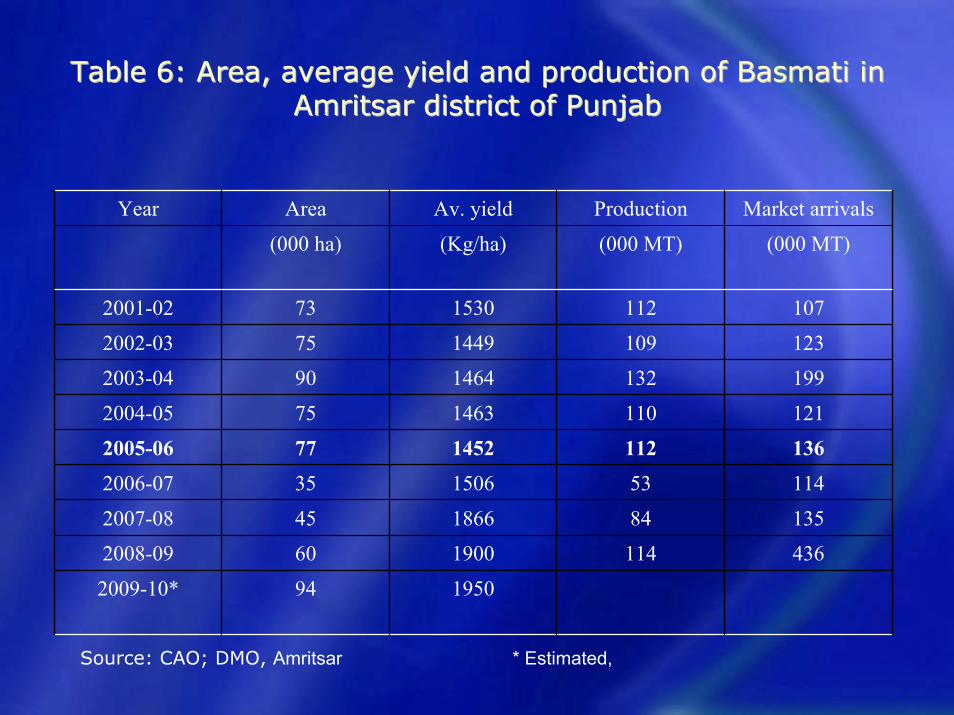
Table 6: Area, average yield and production of Basmati in Table 6: Area, average yield and production of Basmati in AmritsarAmritsar district of Punjabdistrict of Punjab
1950942009-10*
4361141900602008-09
135841866452007-08
114531506352006-07
1361121452772005-061211101463752004-05
1991321464902003-04
1231091449752002-03
1071121530732001-02
(000 MT)(000 MT)(Kg/ha)(000 ha)
Market arrivalsProductionAv. yieldAreaYear
Source: CAO; DMO, Amritsar * Estimated,
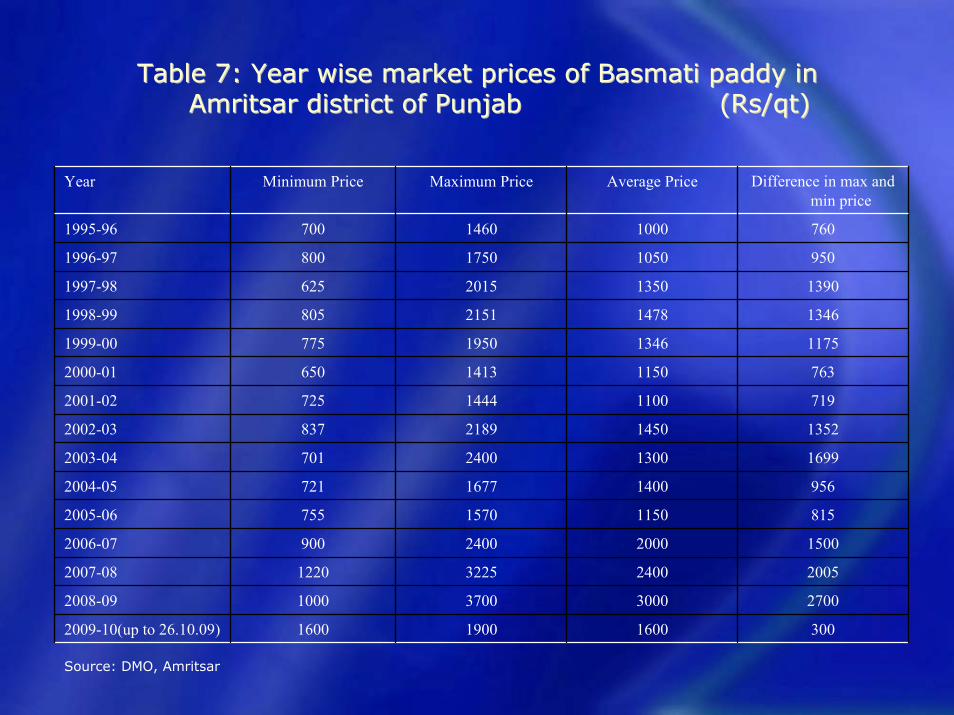
Table 7: Year wise market prices of Basmati paddy in Table 7: Year wise market prices of Basmati paddy in AmritsarAmritsar district of Punjab district of Punjab ((RsRs/qt)/qt)
3001600190016002009-10(up to 26.10.09)
27003000370010002008-09
20052400322512202007-08
1500200024009002006-07
815115015707552005-06
956140016777212004-05
1699130024007012003-04
1352145021898372002-03
719110014447252001-02
763115014136502000-01
1175134619507751999-00
1346147821518051998-99
1390135020156251997-98
950105017508001996-97
760100014607001995-96
Difference in max and min price
Average PriceMaximum PriceMinimum PriceYear
Source: DMO, Amritsar
Policy Implications Policy Implications
It is more remunerative to increase the area under basmati rice as it will increase the returns on the farms and will also help in reducing the exploitation of under ground water.Government can demarcate specific basmati zone for its promotion and which can be protected under GI.Special incentives for the export of Basmati rice can be considered under VKGUY/ VKUI as being given to various agricultural commodities.A Basmati development board in the area with necessary infrastructure and marketing information system can be developed.Gurdaspur and Batala should be brought under the jurisdiction of Amritsar office of DGFT instead of Ludhiana due to its close proximity.