1980 Biophysical Journal Volume 85 September 2003 1980–1995
Protein in Sugar Films and in Glycerol/Water as Examined by InfraredSpectroscopy and by the Fluorescence and Phosphorescenceof Tryptophan
Wayne W. Wright, Gregory T. Guffanti, and Jane M. VanderkooiJohnson Research Foundation, Department of Biochemistry and Biophysics, School of Medicine, University of Pennsylvania,Philadelphia Pennsylvania 19104
ABSTRACT Sugars are known to stabilize proteins. This study addresses questions of the nature of sugar and proteinsincorporated in solid sugar films. Infrared (IR) and Raman spectroscopy was used to examine trehalose and sucrose films andglycerol/water solvent. Proteins and indole-containing compounds that are imbedded in the sugar films were studied by IR andoptical (absorption, fluorescence, and phosphorescence) spectroscopy. Water is able to move in the sugar films in thetemperature range of 20–300 K as suggested by IR absorption bands of HOH bending and OH stretching modes that shiftcontinuously with temperature. In glycerol/water these bands reflect the glass transition at ;160 K. The fluorescence ofN-acetyl-L-tryptophanamide and tryptophan of melittin, Ca-free parvalbumin, and staphylococcal nuclease in dry trehalose/sucrose films remains broad and red-shifted over a temperature excursion of 20–300 K. In contrast, the fluorescence of thesecompounds in glycerol/water solvent shift to the blue as temperature decreases. The fluorescence of the buried tryptophan inCa-bound parvalbumin in either sugar film or glycerol/water remains blue-shifted and has vibronic resolution over the entiretemperature range. The red shift for fluorescence of indole groups exposed to solvent in the sugars is consistent with the motionof water molecules around the excited-state molecule that occurs even at low temperature, although the possibility of staticcomplex formation between the excited-state molecule and water or other factors is discussed. The phosphorescence yield forprotein and model indole compounds is sensitive to the matrix glass transition. Phosphorescence emission spectra are resolvedand shift little in different solvents or temperature, as predicted by the small dipole moment of the excited triplet state molecule.The conclusion is that the sugar film maintains the environment present at the glass formation temperature for surface Trp andamide groups over a wide temperature excursion. In glycerol/water these groups reflect local changes in the environment astemperature changes.
INTRODUCTION
Many extracellular proteins are glycosylated. Although
sugar groups of these proteins are often involved in
processes such as recognition in cell-cell communication
and in the immune system, they also serve a role in protein
stability (Helenius and Aebi, 2001). Stabilization of proteins
by sugar is seen in another situation in biology. A wide
variety of organisms use either the disaccharide a,a-
trehalose or sucrose to survive extreme temperatures and
dehydration. These species can be restored to activity after
rehydration (Crowe et al., 1992).
The mechanism by which sugars interact with proteins is,
therefore, of importance for the overall question of protein
stability. Trehalose has been shown to replace water
molecules that form hydrogen bonds to the surface of the
protein (Carpenter and Crowe, 1989; Prestrelski et al., 1993).
Sugar glasses can also be used as an experimental tool
because they provide a means to immobilize the protein,
allowing the internal dynamics of proteins to be studied
(Cordone et al., 1998; Gottfried et al., 1996; Khajehpour
et al., 2003; Prabhu et al., 2002).
We have recently shown that films made from a mixture of
trehalose and sucrose are stable and transparent, and that
proteins retain their structure when incorporated in them
(Wright et al., 2002). The glycerol/water solvent system has
been widely used as a cryosolvent for proteins (Douzou,
1977), and in the work here it serves as a comparison to
amorphous sugar films. In our study we wish to see how the
solvent matrix interacts with the protein. The first measure-
ment directly examines the sugar film and the protein by IR
spectroscopy. The basis of thismeasurement is that molecules
and groups rearrange to lower energy states, since lower-
ing temperature gives increasing H-bonding strengths. Con-
sequently, the IR absorption bands of groups involved in
H-bonding shift with temperature (Jeffrey, 1997) and the
temperature dependence of these bands permits us to infer
what motions are allowed in the sugar substrate. The second
measurement examines how the environment influences the
emission properties of the indole derivative N-acetyl-L-tryptophanamide (NATA) and Trp in single Trp-containing
proteins. It is widely understood that indole has a larger dipole
moment in the excited state than in the ground state (Hahn and
Callis, 1997). Time-resolved studies indicate that as water
molecules relax around the excited-state molecule there is
a shift to the red in the emission spectra (Brand and Toptygin,
2000; Hahn and Callis, 1997; Lakowicz and Cherek, 1980;
Submitted December 3, 2002, and accepted for publication June 11, 2003.
Address reprint requests to Jane Vanderkooi, Dept. of Biochemistry and
Biophysics, University of Pennsylvania, Philadelphia, PA 19104. Tel.: 215-
898-8783; Fax: 215-573-2042; E-mail: [email protected].
Abbreviations used: NATA, N-acetyl-L-tryptophanamide; TS, trehalose/
sucrose; AG, N-acetylglycine.
� 2003 by the Biophysical Society
0006-3495/03/09/1980/16 $2.00

Montoro et al., 1988). The red shift, therefore, could indicate
the movement of water molecules. Phosphorescence of Trp is
another emission parameter that is influenced by dynamics.
At high temperatures in fluid solutions, phosphorescence is
quenched by atmospheric O2 (Papp and Vanderkooi, 1989).
Phosphorescence yield is also influenced by the rigidity of
the solution: the more rigid the environment, the higher the
efficiency of phosphorescence (Gonnelli and Strambini,
1993). The excited triplet state has lower dipole moment
compared with the excited singlet state, and consequently
phosphorescence spectra are less sensitive than fluorescence
to a dipolar environment, but spectral shifts of phosphores-
cence can also indicate solvent effects.
MATERIALS AND METHODS
Materials
Sigma Chemical Co. (St. Louis, MO) supplied a�D-glucopyranosyl-a-D-
glucopyranoside (trehalose), a-D-glucopyranosyl-b-D-fructofuranoside
(sucrose), N-acetylglycine (AG), NATA, honeybee melittin, and staphylo-
coccal nuclease (micrococcal endonuclease) from Staphylococcus aureus.
Parvalbumin was prepared from frozen codfish (Sudhakar et al., 1995). D2O
and n-pentane (spectroscopic grade) were obtained from Aldrich Chemical
Co. (Milwaukee, WI).
Methods
IR spectra were obtained with a Bruker IFS 66 Fourier transform IR
instrument (Brookline, MA) as previously described (Kaposi et al., 1999).
All spectra were taken in the transmission mode, except for the crystals (Fig.
3) where the ATR mode was used. Raman spectra were taken with a Bruker
Raman-IR IFS 66V Fourier transform instrument. A Hitachi Perkin-Elmer
U-3000 (Newtown, PA) spectrophotometer was used to take visible
absorption spectra. Steady-state emission spectra were obtained with
a Fluorolog-3-21 Jobin-Yvon Spex instrument equipped with a R2658P
Hamamatsu photomultiplier and using front-face geometry (Edison, NJ).
Widths and maximal positions of spectral bands were determined using
PeakFit (Jandel Scientific Software, San Rafael, CA).
The sample temperature for IR and UV absorption and for fluorescence
was maintained using an APD closed cycle Helitran cryostat (Advanced
Research Systems, Allentown, PA). A holder for these windows was
constructed to minimize strain on the windows due to contraction at low
temperature (Research Instrumentation Shop, University of Pennsylvania
School of Medicine, Philadelphia, PA). For IR measurements, the outer
cryostat windows were made of CaF2. The inner cryostat windows, which
experience the temperature gradient, were 2 mm thick and were made of
ZnSe (Janos Technology, Townshend, VT). For UV absorption or
fluorescence measurements, the outer windows were made of quartz and
the inner windows were made of sapphire. The temperature was measured
with a silicon diode near the sample, and the temperature was controlled
using a Model 9650 temperature controller (Scientific Instruments, Palm
Beach, FL). Cryogenic temperature profiles were carried out from high to
low temperature, with the temperature being measured every 10 degrees.
Sugar film formation
Crystals can form during the course of an experiment in films made of pure
trehalose (Librizzi et al., 1999). A mixture of sugars alleviates this problem.
Sugar film was prepared as follows. For mixed sugar films (TS), trehalose
(300 mg) and sucrose (300 mg) were dissolved in 500 ml of distilled water to
form the stock sugar solution. For pure sugar films, 600 mg of the desired
sugar was dissolved in the water. The sugar solution was heated to;658C to
ensure complete dissolving of the sugar. The solution was cooled, and ;1
mg of dry protein or 5 ml of 4 mM NATA was added to 100 ml of the sugar
and 400 ml of 10 mM potassium phosphate, pH 7.0. A transparent film was
formed by evaporation of water from the sugar solutions. In one film
preparation that is suitable for UV/vis absorption measurements, 100 ml of
the stock sugar solution was added to 400 ml phosphate buffer (pH 7.0), and
the solution was pipetted to cover a 25-mm round quartz plate. Quartz plates
were obtained from Esco Products Inc. (Oak Ridge, NJ), and they were of
1 mm thickness. For IR measurements, 10 ml of the sugar solution was
diluted with water to 500 ml and the solution was plated on a CaF2 plate
(Janos Technology). This resulted in a thickness of the sugar film of ;6–20
m. The samples were allowed to dry at 658C. During drying, the sample
temperature was maintained using a VWR Scientific Products Heat Block.
The sugar films were hard to the touch and optically clear. Examination
of the films under crossed polarizers showed no indication of crystal
formation. The mole ratio of water to trehalose in the film was determined by
the extinction coefficients of water and trehalose. The extinction coefficient
of water was determined to be 21.4 M�1 cm�1 at 1641 cm�1 at 208C. This
value was obtained by measuring the absorption of water using a spacer that
was calibrated to be 6 m thick and is the absorptivity found by other workers
(Venyaminov and Prendergast, 1997). The spacers used were Teflon, and
since the spacing is influenced by the tightness of the screws holding the
plates, the actual spacing was determined by interference patterns as
described in textbooks (Stuart, 1996). The CH stretching frequency was used
to determine the trehalose and sucrose content. In this case a solution that
was 0.9 molar in trehalose and sucrose was examined for a sample at known
spacing as described for water. The extinction for the sugar at 1932 cm�1
was determined to be 24.7 M�1 cm�1. Beer’s Law was assumed to apply
when a mixture of sugar and water was used. The method used may have
systematic errors, but since the ratio of the two absorption peaks were used
to determine the water/sugar content, the errors will tend to cancel. Fig. 1
gives IR spectra of the TS film at two levels of hydration. Trehalose and
sucrose show similar bands in the C-H stretch region (;2930 cm�1). The
off-scale band at 3400 cm�1 represents absorption from the OH stretch mode
that arises from the sugar and water. The peaks marked nCH and sHOH are
the peaks used to determine the water/sugar ratio. A background correction
was applied to obtain the absorbance of the peaks.
After the film was formed, the hydration of the sugar was varied by
exposing the sample to an atmosphere of known humidity for 2 h for thin
samples and 24 h for thick samples. Since the films were typically 6–20 m
thick, this time was sufficient for hydration equilibration. The relative
humidity of air at 208C over saturated solutions of salts is as follows: pot-
assium sulfate, 97%; ammonium nitrate, 65%; potassium carbonate, 44%;
potassium acetate, 22%; lithium chloride, 12%. The original sources for these
values are given in the thesis of Gruner (1977). For the fluorescence mea-
surements at room temperature, where the time of measurement was rather
long, a solution of the saltswas placed in the cell compartment, so that the film
maintained hydration. For temperature-dependent measurements, the sample
was placed between two plates, so that it was not exposed to the surrounding
gases during the measurement. The variation of water content in the filmwith
exposure to air at given relative humidity is shown in Fig. 2. The molar ratio
scatter plot of water to sugar suggests that under usual atmospheric humidity
conditions, the amount of water in the trehalose film is ;2 mol of water per
mol of sugar. This amount of water also corresponds to the two molecules of
water of crystallization per molecule of trehalose (Akao et al., 2001).
To exchange the water of hydration of the film with D2O, the sugar was
initially dissolved in D2O, rather than in H2O. The D2O was evaporated at
708C and the film hydrated over D2O.
To obtain IR absorption from trehalose crystals, the trehalose solution
was placed on an ATR ZnSe IR plate and allowed to sit in the atmosphere
(40–60% relative humidity) for two days. The sample became noticeably
crystalline, which was confirmed by its absorption under crossed polarizers.
The absorption was measured in the ATR mode.
Solvent Effects on Protein 1981
Biophysical Journal 85(3) 1980–1995

RESULTS
Characterization of sugar films
In Fig. 3 we contrast IR spectra of trehalose in amorphous
and crystalline states. The absorption of crystalline sugar has
more fine structure than seen for the glassy sugar. The region
between 1000 and 1200 cm�1 is especially diagnostic. What
appears as one peak at 1050 cm�1 in the glass resolves into
two peaks in the crystal. The absorption of water in the
sample is indicated. The water content was slightly higher in
the crystal than in the sugar film, but this is a function of the
sample preparation and exposure to water vapor (see Fig. 2).
It is noteworthy that the absorption peak of nHOH is slightly
different in the two conditions. The peak of HOH bending is
at 1647 cm�1 in the glass and 1639 cm�1 in the crystal.
IR absorption spectra of trehalose and sucrose glassy films
are shown in Fig. 4. The spectra of the two sugars differ in
the region between ;1000–1200 cm�1. Trehalose/sucrose
(TS) film resembles the summed average of trehalose and
sucrose films taken separately. This fact is interpreted to
show that there are no specific interactions between
molecules, an observation consistent with the glassy (i.e.,
amorphous) nature of the sample.
Vibrational spectra of trehalose in water solution and in
film were next compared. Both IR and Raman spectra were
obtained. In the two types of spectroscopy the peaks occur at
the same position, but in the Raman spectrum, peaks of
vibrational modes with a strongly dipolar nature, such as the
OH stretch at 3400 cm�1, are relatively greatly reduced (Fig.
5, a and b). The Raman spectrum also allows for
examination at frequencies below 1000 cm�1. The Raman
peaks of the sugar in the solid films and in water solution are
very similar (Fig. 5, b and c), a result that is also consistent
with the amorphous nature of the sample.
Temperature dependence of IR bandsin TS films and glycerol/water
The sugar film sample is a solid, but it is well recognized that
groups within solids have a variety of motions. Fig. 6
FIGURE 1 IR spectra of TS amorphous film in two
humidity conditions. Trehalose/sucrose glass at 1/1 molar
ratio. Spacer: 6 m. Percent relative humidity: (a) 0%; (b)
65%. Temperature: 208C.
FIGURE 2 Water:sugar ratio in TS glass at different relative humidity.
Temperature: 208C.
1982 Wright et al.
Biophysical Journal 85(3) 1980–1995

summarizes the temperature dependence of the HOH bend
and OH stretch absorption for the TS film and the glycerol/
water solvent. The OH stretch absorption peaks are off-scale
so the midpoint value was used for a plot. (The OH region
has contributions from sugar or glycerol, as well as water,
and water, in turn, exhibits absorption from both symmetric
and antisymmetric modes). As temperature decreases, the
OH stretch midpoint absorption frequency goes lower and
the bend absorption band goes to higher frequency. The OH
stretch in trehalose film that is nearly devoid of water shifted
;20 cm�1 over the temperature range from 300 to 20 K.
Remarkably, even down to 40 K, there are changes with
temperature, indicating that the water in the film still has
motion at this low temperature. For glycerol/water, the shift
in the HOH bending mode has a break at ;160 K, the
temperature of the glass transition for this solvent. The shift
of the OH stretch midpoint of glycerol/water solvent was
;80 cm�1.
IR absorption of protein in TS film
We now examine the protein in TS film. IR spectra of
parvalbumin in TS film at 22% humidity are shown in Fig. 7
at 20 and 300 K. The absorbance in the region from 1000 to
1200 cm�1 is dominated by the sugars. In the first and second
derivative spectra, it can be seen that there is very little
change in the IR absorption over the temperature range of
almost 300 degrees. This region is sensitive to the condition
of the sugar (see Fig. 3), and therefore it can be concluded
that the film is stable over this temperature range.
The small peak at around 1585 cm�1 is at the position of
the antisymmetric stretch of �COO�(Nara et al., 1994). The
peak at 1650 cm�1 is identified as the amide I. The position
of the amide I band is indicative of folded protein. Previous
work by Carpenter and Crowe showed by IR that protein in
freeze-dried sugar had native-like conformation (Carpenter
and Crowe, 1989). The amide I band position has little
FIGURE 3 (a) Trehalose amorphous film at 44%
relative humidity; (b) trehalose crystal. HOH bending
absorption indicated. Temperature: 208C.
FIGURE 4 IR spectra of sugar films. Trehalose (T ), sucrose (S), and
mixed trehalose/sucrose (TS) glasses. Glasses made at 658C as described in
Materials andMethods. T1 S is the weighted sum of the individual trehalose
and sucrose spectra. Temperature: 208C.
Solvent Effects on Protein 1983
Biophysical Journal 85(3) 1980–1995

temperature dependence from 20 to 300 K. The constancy of
this region for parvalbumin in TS film shows that the protein
retains its overall folding over this temperature range. In the
derivative spectra for the protein in TS there can be seen
some changes in the IR spectrum in the amide I region, but
the overall positions of the major bands are maintained, and
the band is indicative of a folded protein. The measurements
also were repeated with a dry sample, and the same
conclusion was made.
The amide II peak occurs at 1550 cm�1. Close examination
of Fig. 7 reveals that this peak changes with temperature, as
was previously reported (Wright et al., 2002). The temper-
ature dependence of the peak position in TS film is shown in
Fig. 8, upper panel. The figure also shows that the amide II
peak of AG shifts in the same manner as in the protein. To
compare the amide peak in glycerol/water we used a deuter-
ated sample. The amide II9 of AG shifts 15 cm�1 to higher
frequency as temperature decreases (Fig. 8, lower panel). Theamide II peak is predominately due to an NH bending mode
and has similar temperature dependence as the HOH bending
mode (see Fig. 6).
Characterization of NATA and proteinsin sugars and glycerol
Absorption and fluorescence of indole and itsderivatives in solvents
We now examine how the glassy matrix influences the
absorption and emission of Trp in proteins and indole model
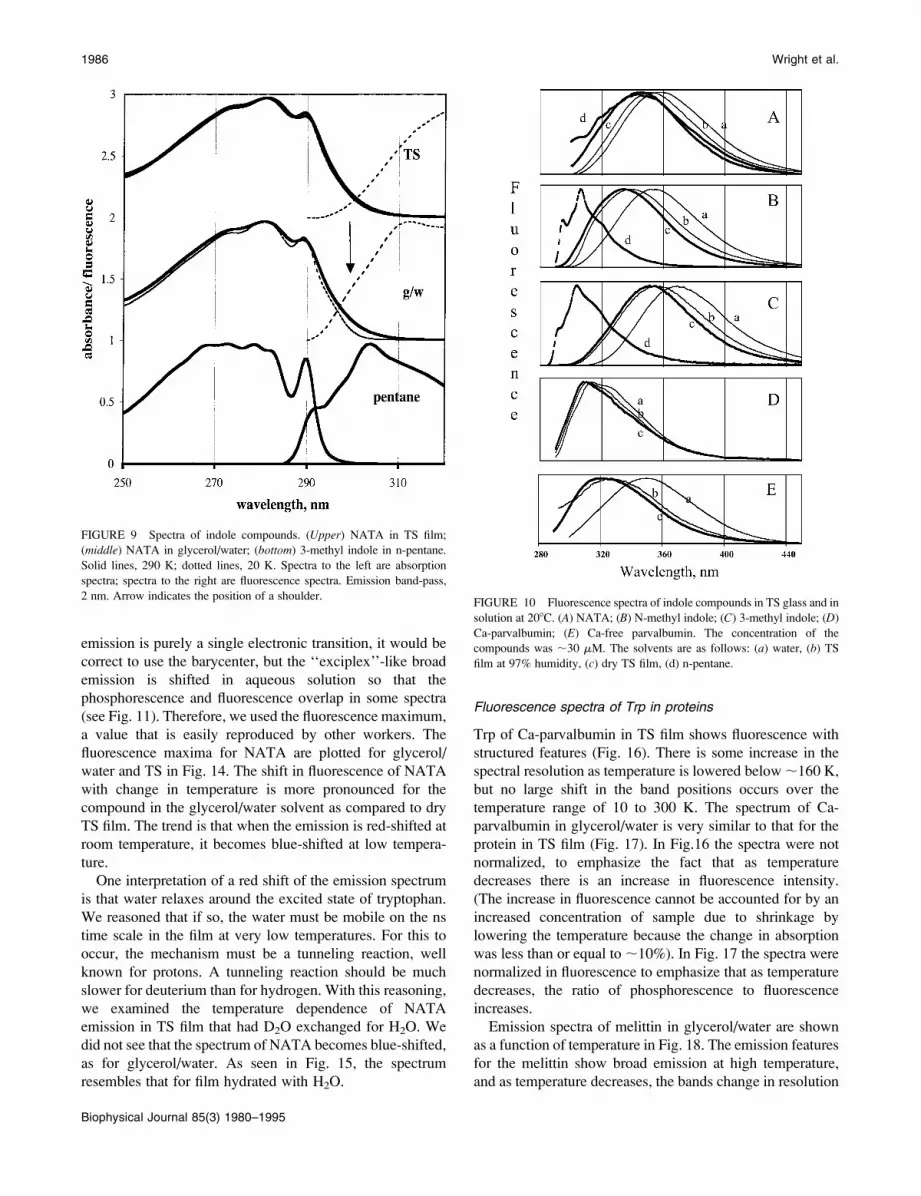
compounds. In Fig. 9 the absorption of NATA in TS film and
in glycerol/water solvent is given for room temperature and
20 K. The absorption of 3-methyl indole in pentane is also
given for comparison. The absorption band at 290 nm of
NATA narrows with lower temperature in TS, but the
narrowing was more pronounced in glycerol/water. The
absorbance band is narrowest for 3-methyl indole in pentane.
The highest energy fluorescence band coincides with the
absorption band, as has been reported before (Meech et al.,
1983). For NATA in glycerol/water, an arrow indicates
a shoulder on fluorescence peak, which would represent the
highest energy emission band. In this case, there is no
coincidence of absorption and emission, consistent with the
emission being from the 1La state.
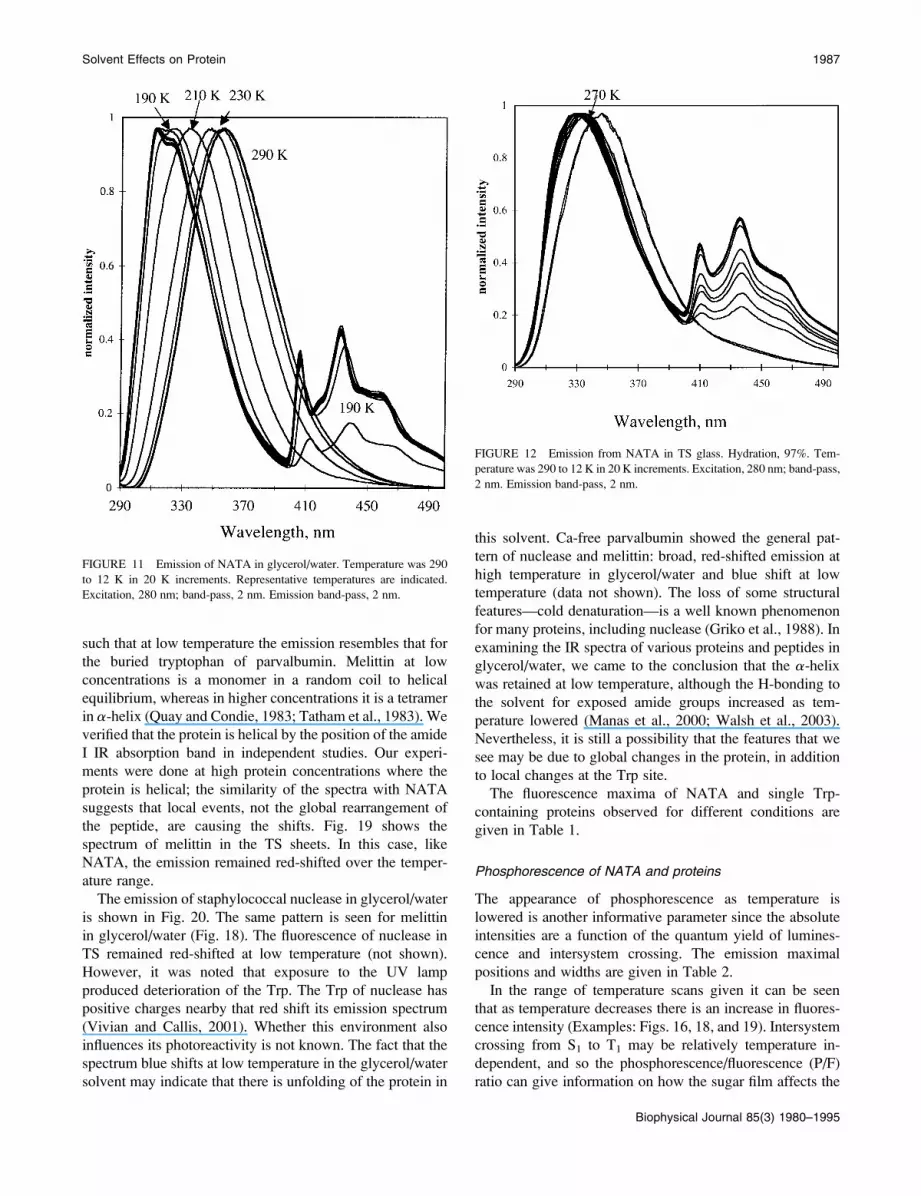
The emission spectra of NATA, N-methyl indole,
3-methyl indole, Ca-parvalbumin and Ca-free parvalbumin
in different solvents at room temperature are compared in
Fig. 10. The emission maximum of NATA, N-methyl indole,
and 3-methyl indole in water is at 358, 355, and 370 nm,
respectively, and the emission spectra are broad. The values
of the maximum in the TS film are somewhat blue-shifted
relative to those found for the compounds in glycerol/water.
When TS film is hydrated, the emission maximum is
intermediate between the aqueous glycerol solution and
totally dry film. In pentane, the fluorescence spectra of
FIGURE 5 IR and Raman spectra of trehalose and sugar in glass and in
solution. (a) IR absorption of TS glass at 22% relative humidity. (b) Raman
spectrum of TS film at 22% relative humidity on CaF2. (c) Raman spectrum
of 0.9 M trehalose and 0.9 M sucrose in H2O. All spectra taken at 208C. The
resolution of the Raman measurement was 1 cm�1 and a 3.5-mm aperture
was used. 2000 scans were averaged.
FIGURE 6 Temperature dependence of OH stretch and HOH bend
frequencies. Squares, TS film; Circles, glycerol/water.
1984 Wright et al.
Biophysical Journal 85(3) 1980–1995

N-methyl indole and 3-methyl indole are blue-shifted with
indication of vibronic structure (Fig. 10, B and C). The shiftto the blue for indole in hydrophobic solvent is well-known
(Konev, 1967).
Panels D and E show emission from Trp in parvalbumin.
The removal of Ca from parvalbumin induces large changes
in the protein conformation. The Trp fluorescence maximum
shifts from ;325 to ;350 nm when Ca is removed (Eftink
and Wasylewski, 1989; Ferreira, 1989; Permyakov et al.,
1980; Sudhakar et al., 1993, 1995). In the glass, the emission
of Ca-parvalbumin shows a blue-shifted emission spectrum
(Fig. 10 D), resembling 3-methyl indole in pentane. In
contrast, the emission of the Ca-free protein is broad in all
solvents. The emission shifts to the blue with dehydration in
the TS film (Fig. 10 E) but never becomes as resolved as the
emission of the buried Trp in Ca-parvalbumin.
Absorption, fluorescence, and phosphorescence spectraof NATA as a function of temperature
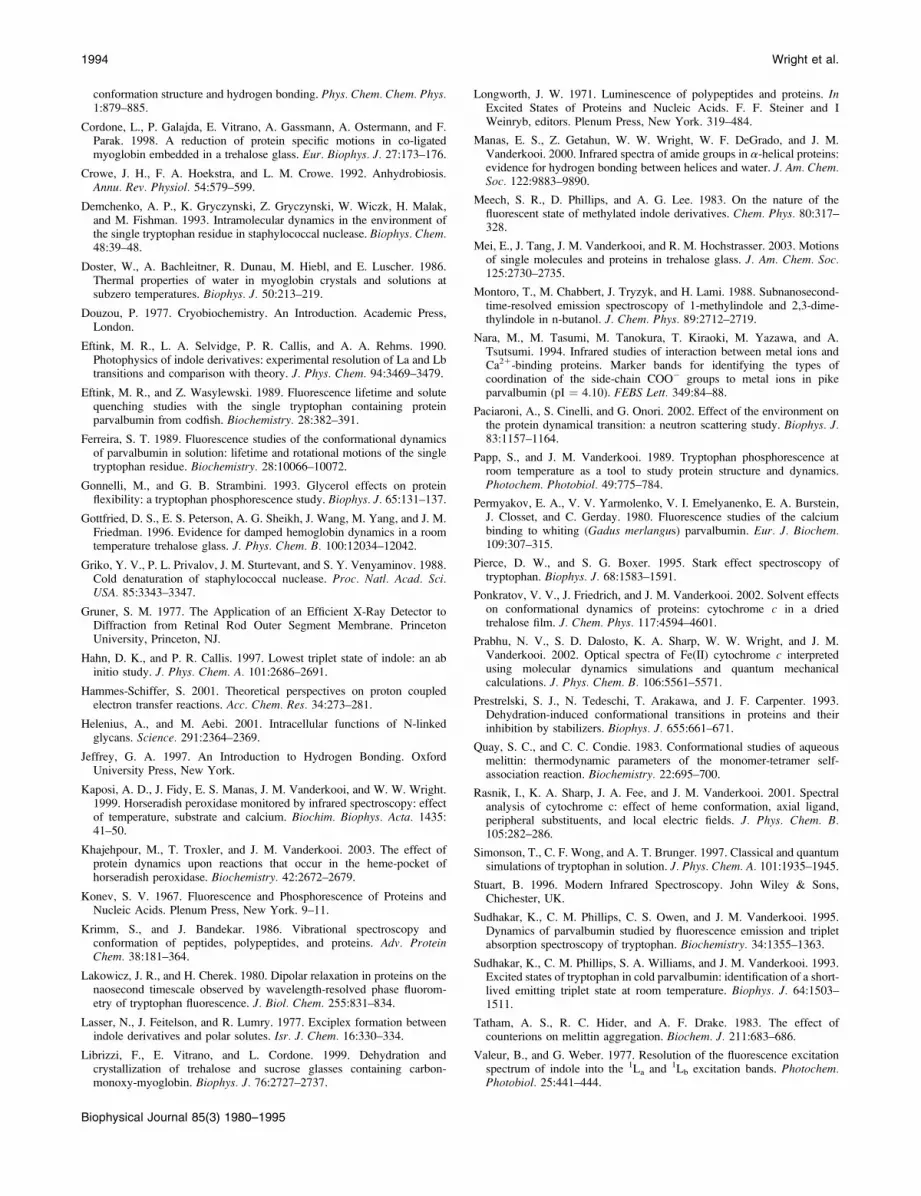
Fig. 11 shows the emission of NATA in glycerol/water at
temperatures ranging from room temperature to 20 K. The
fluorescence maximum of NATA shifts to lower wavelength
as the temperature decreases, and the emission band begins
to be structured. The difference in wavenumber between
the fluorescence maximum in fluid solution (359 nm) and at
20 K (312 nm) is 4200 cm�1. At low temperature the
fluorescence of NATA in glycerol/water manifests some
vibrational resolution although the resolution is still low. As
temperature decreases, the phosphorescence of the indole
group is apparent as vibronically-resolved emission bands
from 385 to 500 nm build in, with 190 K being the highest
temperature where phosphorescence was seen in the steady-
state emission spectrum.
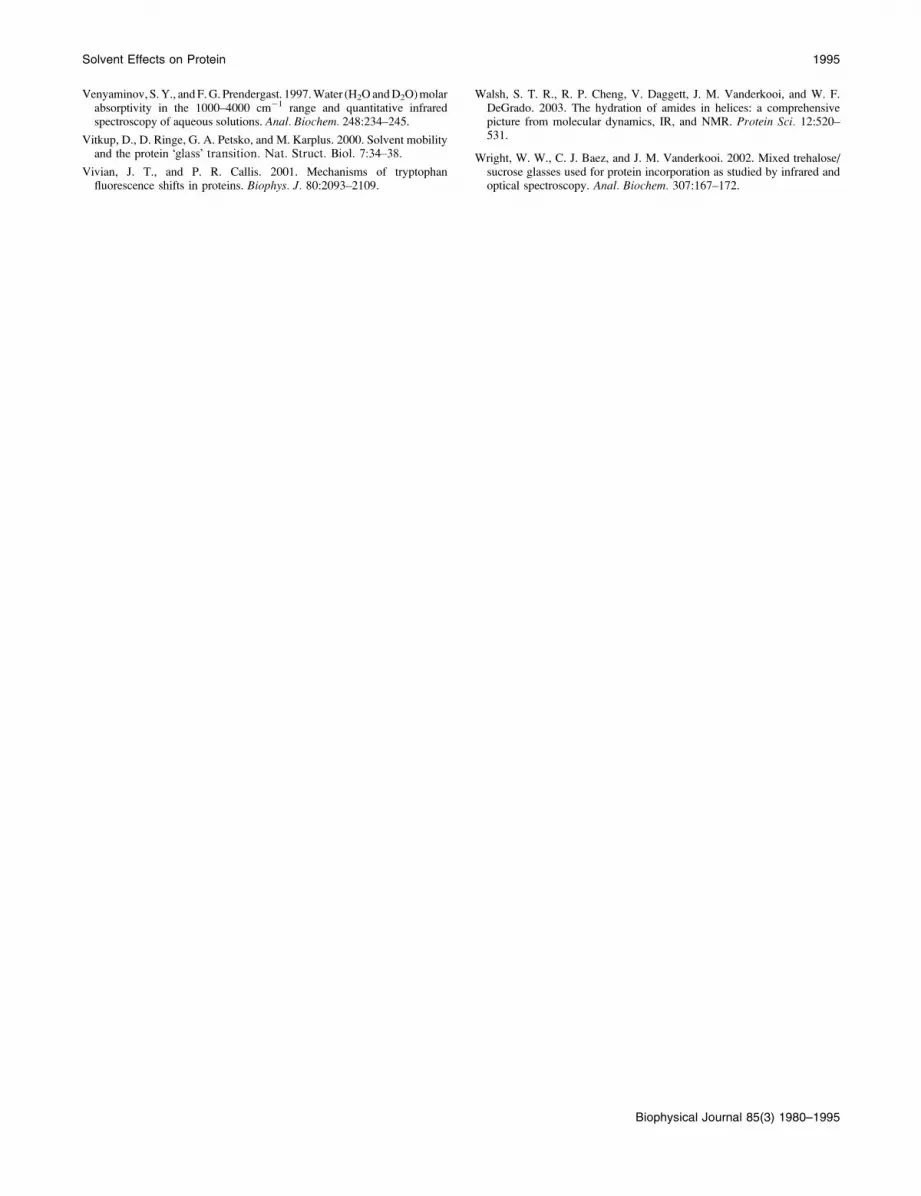
The emission spectrum of NATA in TS film was
examined at different hydration of the film. For hydrated
film the emission spectra are shown in Fig. 12. For dry film,
the emission is shown in Fig. 13. The fluorescence emission
remains red-shifted as temperature decreases for the dry film
with a small shift for the hydrated film. The red shift is in
contrast to the emission of NATA in glycerol/water (see Fig.
11). At higher temperature, the fluorescence maximum of
NATA is 359, 338, and 337 nm for glycerol/water, hydrated
TS, and dehydrated TS film, respectively. Phosphorescence
of NATA is apparent at room temperature in the steady-state
spectrum for the dry film (Fig. 13).
The shift of fluorescence is an important feature for us. We
considered several means to describe this. It would be most
reliable to plot the shift of the S0,0 transition. This transition
is unambiguously seen only in the hydrophobic environment
(see Fig. 9), and therefore it cannot be used. Where the
FIGURE 7 (a) Infrared spectra of Ca-parvalbumin. Ca-parvalbumin in TS
glass at 22% relative humidity at 20 K (blue) or 300 K (red); (b) first
derivative; (c) second derivative.
FIGURE 8 Frequency of IR absorption bands. (Upper) Square, Amide II
of bending mode for AG in TS film at 22% humidity; triangle, amide II
absorption band of Ca-parvalbumin in TS glass at 22% humidity. (Lower)
Amide II9 of AG in perdeuterated glycerol/D2O (60/40).
Solvent Effects on Protein 1985
Biophysical Journal 85(3) 1980–1995
emission is purely a single electronic transition, it would be
correct to use the barycenter, but the ‘‘exciplex’’-like broad
emission is shifted in aqueous solution so that the
phosphorescence and fluorescence overlap in some spectra
(see Fig. 11). Therefore, we used the fluorescence maximum,
a value that is easily reproduced by other workers. The
fluorescence maxima for NATA are plotted for glycerol/
water and TS in Fig. 14. The shift in fluorescence of NATA
with change in temperature is more pronounced for the
compound in the glycerol/water solvent as compared to dry
TS film. The trend is that when the emission is red-shifted at
room temperature, it becomes blue-shifted at low tempera-
ture.
One interpretation of a red shift of the emission spectrum
is that water relaxes around the excited state of tryptophan.
We reasoned that if so, the water must be mobile on the ns
time scale in the film at very low temperatures. For this to
occur, the mechanism must be a tunneling reaction, well
known for protons. A tunneling reaction should be much
slower for deuterium than for hydrogen. With this reasoning,
we examined the temperature dependence of NATA
emission in TS film that had D2O exchanged for H2O. We
did not see that the spectrum of NATA becomes blue-shifted,
as for glycerol/water. As seen in Fig. 15, the spectrum
resembles that for film hydrated with H2O.
Fluorescence spectra of Trp in proteins
Trp of Ca-parvalbumin in TS film shows fluorescence with
structured features (Fig. 16). There is some increase in the
spectral resolution as temperature is lowered below;160 K,
but no large shift in the band positions occurs over the
temperature range of 10 to 300 K. The spectrum of Ca-
parvalbumin in glycerol/water is very similar to that for the
protein in TS film (Fig. 17). In Fig.16 the spectra were not
normalized, to emphasize the fact that as temperature
decreases there is an increase in fluorescence intensity.
(The increase in fluorescence cannot be accounted for by an
increased concentration of sample due to shrinkage by
lowering the temperature because the change in absorption
was less than or equal to;10%). In Fig. 17 the spectra were
normalized in fluorescence to emphasize that as temperature
decreases, the ratio of phosphorescence to fluorescence
increases.
Emission spectra of melittin in glycerol/water are shown
as a function of temperature in Fig. 18. The emission features
for the melittin show broad emission at high temperature,
and as temperature decreases, the bands change in resolution
FIGURE 9 Spectra of indole compounds. (Upper) NATA in TS film;
(middle) NATA in glycerol/water; (bottom) 3-methyl indole in n-pentane.
Solid lines, 290 K; dotted lines, 20 K. Spectra to the left are absorption
spectra; spectra to the right are fluorescence spectra. Emission band-pass,
2 nm. Arrow indicates the position of a shoulder.FIGURE 10 Fluorescence spectra of indole compounds in TS glass and in
solution at 208C. (A) NATA; (B) N-methyl indole; (C) 3-methyl indole; (D)
Ca-parvalbumin; (E) Ca-free parvalbumin. The concentration of the
compounds was ;30 mM. The solvents are as follows: (a) water, (b) TS
film at 97% humidity, (c) dry TS film, (d) n-pentane.
1986 Wright et al.
Biophysical Journal 85(3) 1980–1995
such that at low temperature the emission resembles that for
the buried tryptophan of parvalbumin. Melittin at low
concentrations is a monomer in a random coil to helical
equilibrium, whereas in higher concentrations it is a tetramer
in a-helix (Quay and Condie, 1983; Tatham et al., 1983). We
verified that the protein is helical by the position of the amide
I IR absorption band in independent studies. Our experi-
ments were done at high protein concentrations where the
protein is helical; the similarity of the spectra with NATA
suggests that local events, not the global rearrangement of
the peptide, are causing the shifts. Fig. 19 shows the
spectrum of melittin in the TS sheets. In this case, like
NATA, the emission remained red-shifted over the temper-
ature range.
The emission of staphylococcal nuclease in glycerol/water
is shown in Fig. 20. The same pattern is seen for melittin
in glycerol/water (Fig. 18). The fluorescence of nuclease in
TS remained red-shifted at low temperature (not shown).
However, it was noted that exposure to the UV lamp
produced deterioration of the Trp. The Trp of nuclease has
positive charges nearby that red shift its emission spectrum
(Vivian and Callis, 2001). Whether this environment also
influences its photoreactivity is not known. The fact that the
spectrum blue shifts at low temperature in the glycerol/water
solvent may indicate that there is unfolding of the protein in
this solvent. Ca-free parvalbumin showed the general pat-
tern of nuclease and melittin: broad, red-shifted emission at
high temperature in glycerol/water and blue shift at low
temperature (data not shown). The loss of some structural
features—cold denaturation—is a well known phenomenon
for many proteins, including nuclease (Griko et al., 1988). In
examining the IR spectra of various proteins and peptides in
glycerol/water, we came to the conclusion that the a-helix
was retained at low temperature, although the H-bonding to
the solvent for exposed amide groups increased as tem-
perature lowered (Manas et al., 2000; Walsh et al., 2003).
Nevertheless, it is still a possibility that the features that we
see may be due to global changes in the protein, in addition
to local changes at the Trp site.
The fluorescence maxima of NATA and single Trp-
containing proteins observed for different conditions are
given in Table 1.
Phosphorescence of NATA and proteins
The appearance of phosphorescence as temperature is
lowered is another informative parameter since the absolute
intensities are a function of the quantum yield of lumines-
cence and intersystem crossing. The emission maximal
positions and widths are given in Table 2.
In the range of temperature scans given it can be seen
that as temperature decreases there is an increase in fluores-
cence intensity (Examples: Figs. 16, 18, and 19). Intersystem
crossing from S1 to T1 may be relatively temperature in-
dependent, and so the phosphorescence/fluorescence (P/F)
ratio can give information on how the sugar film affects the
FIGURE 11 Emission of NATA in glycerol/water. Temperature was 290
to 12 K in 20 K increments. Representative temperatures are indicated.
Excitation, 280 nm; band-pass, 2 nm. Emission band-pass, 2 nm.
FIGURE 12 Emission from NATA in TS glass. Hydration, 97%. Tem-
perature was 290 to 12 K in 20 K increments. Excitation, 280 nm; band-pass,
2 nm. Emission band-pass, 2 nm.
Solvent Effects on Protein 1987
Biophysical Journal 85(3) 1980–1995

indole chromophore transition T1 to S0. The phosphores-
cence intensity is much smaller than the fluorescence at room
temperature, so the phosphorescence is not apparent in the
steady-state spectra. The phosphorescence lifetime can be
measured, and NATA in glass has a phosphorescence
lifetime of ;30 ms in TS (Wright et al., 2002). The phos-
phorescence lifetimes of the indole compounds were all
5–6 s at low temperature. Fig. 21 gives the P/F ratios for
NATA and Ca-parvalbumin in three conditions. The
phosphorescence increases at the glass transition of glyc-
erol/water for both NATA and parvalbumin (Fig. 21 C). Incase of the TS, the film is stable over the temperature range,
but the phosphorescence increases as temperature decreases.
Focusing on the line at 200 K, one can see the differences in
the samples. The hydrated sample shows an increase in the
NATA P/F ratio below this temperature, whereas NATA in
the dry TS film exhibits phosphorescence at temperatures
above this.
DISCUSSION
The sugar films are hard to the touch, do not flow, and are
transparent. The sugar films are suitable for incorporation of
proteins, and therefore the condition of proteins in this form
of sugar is a subject of general interest. We show here that
the sugar film is stable and remains amorphous over a wide
temperature range. Although the glass appears physically
solid, motion occurs. In these films of amorphous sugar, the
OH stretch frequency shifts with lowering temperature even
to very low temperature. In glycerol/water, the OH stretch
frequency shifts with lowering temperature until the glass
transition; the shift is much larger in liquid glycerol/water
than for the sugar and residual water of the TS films (Fig. 6).
The bending mode of water is also temperature dependent,
and again the temperature dependence is stronger in the
liquid glycerol/water than in the TS glass. The results are
interpreted as follows. As thermal motion decreases, the
solvent rearranges to give favorable H-bonding angles and
distances. An increase in H-bonding strength with lowering
temperature would shift the peaks in the observed way. It
follows from the fact that the spectral bands shift with
temperature that there is motion within the glass to allow for
the more favorable H-bonding interactions at lower temper-
atures.
Protein interactions with the sugar
Because the glass water content is low, the amide I and II
bands of incorporated proteins can be examined without
significant water interference. The amide I band arises
primarily from the C¼O stretch of the amide group (Krimm
and Bandekar, 1986). The amide I band positions of the
protein parvalbumin in TS is nearly constant over the
temperature range (Fig. 7), although the peaks become
sharper at lower temperature. The frequency of the amide I
band depends upon its H-bonding, and in glycerol/water
there are large changes in the amide I region as a function of
FIGURE 13 Emission from NATA in TS glass. Hydration, dry.
Temperature was 295 K and then 290 K to 12 K in 20 K increments.
Excitation, 280 nm; band-pass, 2 nm. Emission band-pass, 2 nm.
FIGURE 14 Fluorescence peak positions for NATA in TS (squares) or in
60:40 v/v glycerol/water (circles).
1988 Wright et al.
Biophysical Journal 85(3) 1980–1995

temperature (Kaposi et al., 1999; Manas et al., 2000). As
thermal motion of water decreases with lowering of
temperature the H-bonding between water and the carbonyl
increases, resulting in a shift to lower frequency for the
amide I band (Walsh et al., 2003). H-bonding is highly
dependent upon angle, and so a rotation of the water group to
maximize the interaction as the temperature decreases will be
reflected in the amide I band shift to lower frequency.
The amide II band of protein incorporated into glass and
the HOH bending mode band go to higher frequency as
temperature decreases, and these bands have very similar
temperature dependence (Fig. 8). The amide II band consists
of NH in-plane bending combined with CH stretching
(Krimm and Bandekar, 1986). The band at 1650 is the nHOHbending mode. The implication is that there is still motion of
water and the protein within the film over a large temperature
range.
Fluorescence of indole
The fluorescence maximum of tryptophan in proteins ranges
from;310 to 360 nm depending upon exposure of the group
to water. Fluorescence lifetimes and quantum yields are also
very sensitive to the environment. The large fluorescence
spectral shift of Trp in different proteins and indole in
different solvents is related to the large difference in dipole in
the ground and excited state of the molecule. With the
availability of a sizeable dataset of protein structures, it
is possible to sort out the protein environmental effects
producing the Stokes shift. The charges in the protein and the
field of water both contribute to an internal electric field
(Pierce and Boxer, 1995; Vivian and Callis, 2001). The large
dipole moment of the excited-state molecule makes a dipolar
solvent more interactive with the excited-state than the
ground-state molecule. This interaction with solvent results
in very large shifts in the emission seen in proteins. We
should note that Trp has two emitting states, the La and Lb
states, which can complicate analysis. Many experiments
and calculations led to the conclusion that for all or nearly all
Trp in proteins the fluorescence emission is from the 1La state
(Callis, 1991; Callis et al., 1995; Eftink et al., 1990; Valeur
and Weber, 1977; Vivian and Callis, 2001). A red shift in
spectra maximum in fluid solution arises in dipolar solvents
when solvent molecules can rearrange around the excited
state. The fluorescence of Trp is a measure of how the
solvent responds to a change in the charge distribution of
indole upon excitation. Observed Stokes shifts are therefore
functions of both the field and the rearrangement of charged
groups around the molecule in response to the altered
electron density upon its excitation.
To summarize the results of Trp fluorescence:
1. For the buried Trp in Ca-parvalbumin, the emission
spectrum remains blue-shifted and shows vibronic
FIGURE 15 Fluorescence of NATA in deuterated TS film. Deuteration
was achieved as described in Materials and Methods.
FIGURE 16 Emission of Ca-parvalbumin in TS film taken at temper-
atures from 290 to 11 K in 20 K increments. Excitation, 280 nm; band-pass,
2 nm. Emission band-pass, 2 nm.
Solvent Effects on Protein 1989
Biophysical Journal 85(3) 1980–1995

resolution both in glycerol/water and in the solid TS film.
The spectrum changes very little with temperature. The
Trp in Ca-parvalbumin is buried, and therefore not
directly exposed to the solvent. It can be concluded that
both solvents leave the Trp buried in a hydrophobic
environment.
2. In glycerol/water, the fluorescence spectra of NATA and
proteins that have partially exposed Trp (Ca-free
parvalbumin, mellitin, and staphylococcal nuclease) are
blue-shifted at low temperature and red-shifted at high
temperature.
3. In contrast, for all of these samples in the TS sheet the
emission is broad and red-shifted. For very dry samples,
the peak position is constant with temperature; with sam-
ples containing more water, there is a shift with temp-
erature, but less than seen in the glycerol/water sample.
The conclusion seems to be that the TS glass maintains the
environment of the exposed indole chromophore over a wide
temperature range. How can this be, when the glycerol/water
system shows large shifts with temperature? There are
various ways to explain the results. We discuss them below.
First, we consider that the response of the solvent is due to
a dynamic rearrangement around the excited-state molecule.
As noted above, there is a large change in dipole moment
upon excitation for indole, and this causes the solvent
molecules to rearrange around the excited-state molecule and
produces a red shift. This explains the red shift at higher
temperatures for exposed Trp in glycerol/water, as seen in
NATA, Ca-parvalbumin, Ca-free parvalbumin, and melittin.
Longworth (1971) showed a similar fluorescence spectrum
for adrenocorticotropin. The Trp in nuclease is shown from
x-ray to be partly buried. Demchenko et al. (1993) and
Longworth (1971) have shown that the solvent is able to
relax around the Trp in staphylococcal nuclease.
But how can this explain why in the TS glass the
fluorescence of Trp is broad and red-shifted even at low
temperature? There is always water in the sample, and there
may be water located around the indole chromophore. The
sugars are larger and less flexible than glycerol. As TS glass
is formed, the smaller water molecules would remain at the
protein surface or around the surface of the model compound
NATA. Consequently, there may be a layer of fluid water
around the chromophore that rearranges upon excitation.
Relevant to the view that there is motion of water in the
glass, single molecules of a fluorescent cytochrome cderivative in trehalose films were found to undergo large
angular motions on the timescale of seconds, also supporting
the idea of motion of proteins incorporated into glass (Mei
et al., 2003).
For this model to work out, this water must have the
character of being mobile on the timescale of the excited
singlet state (ns) and the mobility must be temperature
FIGURE 17 Emission of Ca-parvalbumin in 60:40 v/v glycerol/water
taken at temperatures from 290 to 11 K in 20 K increments. Excitation, 280
nm; band-pass, 2 nm. Emission band-pass, 2 nm.
FIGURE 18 Emission of melittin taken at temperatures from 290 to 11 K
in 20 K increments. 50 mg protein/ml of 60:40 v/v glycerol/water. Excitation
at 275 nm, with 5-nm bandpass. Emission band pass, 1 nm.
1990 Wright et al.
Biophysical Journal 85(3) 1980–1995

independent down to the lowest temperatures studied (;20
K). It has been known for a long time that turning of the
protons around the oxygen atom in water is a low-energy step
(Bjerrum, 1952). The protons do not have to move very far to
change the orientation of the dipole. Since the fluorescence
spectrum of NATA in TS glass remains red-shifted and
temperature independent, a mechanism for motion at low
temperature may be tunneling (Hammes-Schiffer, 2001).
Tunneling effects on Trp in solution have been suggested by
quantum calculations (Simonson et al., 1997). In ice systems,
the dielectric relaxation is very sensitive to the isotope (Bruni
et al., 1993), as is the case for reactions involving tunneling of
hydrogen. In our case, substituting with D2O did not lead to
resolution (Fig. 15). This does not necessarily rule out the
solvent tunneling mechanism to explain the spectrum,
however, since we would need to monitor carefully the rates
of relaxation. The rotation of water in the sugar films remains
an intriguing possibility.
Second, we take another view and consider that the solvent
in the TS glass is static. In thismodel theOH residues from the
solvent are close enough to interact with the long lived (nsec)
excited-state molecule. In this model, we consider that there
are interactions with the electrons of neighboring groups,
without the requirement of diffusive atomic displacements.
Relevant to this model, we note that absorption and emission
are not reverse processes. The absorption of light is
a stimulated process. The observed fluorescence arises from
a spontaneous emission process. There is a loss of coherence
in the process, and the finite lifetime of the excited-state
molecule means that there is a different electron distribution
from the ground-state molecule, and the molecule can interact
with neighboring groups. The interaction of the excited-state
molecules with electrons of the surrounding groups has been
proposed as a mechanism for broadening of the emission of
indole compounds (Lassser et al., 1977), and this electric field
interaction would extend over distance.
A model without the rearrangement of the atoms around
FIGURE 19 Emission of melittin in TS glass taken at temperatures from
290 to 11 K in 20 K increments. Excitation at 275 nm, with 5-nm bandpass.
Emission band pass, 1 nm.
FIGURE 20 Emission of staphylococcal nuclease taken at temperatures
from 290 to 11 K in 20 K increments. 28 mg protein/ml of 60:40 v/v
glycerol/water. Excitation at 275 nm, with 6-nm bandpass. Emission band
pass, 1 nm.
TABLE 1 Fluorescence maxima, nm, of NATA and
single-Trp proteins
Compound Solvent/matrix 290 K 20 K
NATA TS glass, dry 337 325
TS glass, 97% 337 321
Glycerol/water 359 312
Ca-parvalbumin TS glass, dry 310 308
TS glass, 97% 310 308
Glycerol/water 312 312
Ca-free parvalbumin TS glass, dry 328 328
Glycerol/water 335 313
Melittin TS glass, 97% 331 332
Glycerol/water 344 314
Staphylococcal nuclease TS glass, 97% 316 316
Glycerol/water 337 313
97%: the sample was incubated at this relative humidity during preparation.
Solvent Effects on Protein 1991
Biophysical Journal 85(3) 1980–1995

the chromophore explains the TS glass results, since the
fluorescence spectrum of NATA in dry TS glass changes
very little with temperature.
But does this explain the fluorescence blue shift of NATA
in glycerol/water as temperature decreases? The concentra-
tion of OH is larger in glycerol/water than in TS solvent, and
if the solvent molecules are randomly arranged, then there
should also be the possibility for OH in the glycerol/water to
interact with the indole ring. For the static model to work, we
consider the possibility that the solvent around the ground-
state molecule changes. As temperature decreases, the liquid
solvent is expected to rearrange around the chromophore to
form the lowest, least energetic arrangement. Models of
glycerol indicate that the lowest energy form is such that one
side is hydrophobic (Challi et al., 1999). We speculate that
this side would tend to be exposed to the aromatic indole ring
as the lowest energy structure is obtained. A contributing
factor to this ordering effect around the chromophore would
be that as temperature decreases, the H-bonding between the
OH’s of water and glycerol would tend to increase, thereby
excluding the interaction between the glycerol OH and the
aromatic ring. This would increase the likelihood that the
environment around the indole becomes more hydrophobic.
For the solid, sugar film, the sugar is stable over the entire
range (Fig. 7), and so the likelihood of ‘‘complexes’’ existing
at room temperature is retained at low temperature.
Third, we consider ‘‘other’’ effects. Excess energy of
excitation must be accommodated by the surroundings. The
major peak of excitation is at 289 nm, and the apparent S0,0peak of emission is at 305 nm for NATA in glycerol and
water (Fig. 9). The energy difference is 1800 cm�1. Because
there are so many degrees of freedom in the solvent, this
vibrational energy is rapidly dissipated into the solvent bath,
as shown by examination of probe molecules at short times
(Castner et al., 1987). However, the energy dissipation may
be different in the two solvents. This was suggested by
spectral diffusion dynamics of cytochrome c in trehalose andglycerol/water at low temperature (Ponkratov et al., 2002).
The H-bonding is different in the two matrices, as indicated
by HOH bend and stretch frequencies (Fig. 6). The local
electric field at the indole ring may be different, which could
affect the excited-state geometry. This effect was invoked to
rationalize the spectrum of heme in cytochrome c (Rasnik
et al., 2001), although the smaller size of Trp relative to heme
may make this less significant.
The above possibilities are not mutually exclusive, and
there may be more than one factor causing the difference
between the two solvents.
The main observation of the fluorescence data remains:
NATA or Trp of proteins in TS at low temperature acts as if it
is held in an environment similar to that at room temperature.
Phosphorescence used to characterize theprotein interactions with sugar and glycerol:comparison with fluorescence andIR spectroscopy
The phosphorescence of all the indole-group molecules in
all the solvents studied shows resolution, and, unlike the
TABLE 2 Phosphorescence parameters: position and width
(half maximum)
Compound
Solvent/
matrix
Temperature,
K
Position,
nm
Width,
nm
NATA TS glass 270 412 7.0
12 410 8.3
Glycerol/water 190 413 10
11 406 6.6
Ca-parvalbumin TS glass 280 410 6.2
10 409 5.6
Glycerol/water 210 411 7.6
10 409 7.4
Melittin TS glass 270 412 7.4
12 409 4.9
Glycerol/water 200 412 7.5
20 410 6.0
Staphylococcal
nuclease
TS glass 295 408 4.3
11 406 3.5
Glycerol/water 200 407 4.5
13 406 4
FIGURE 21 Phosphorescence/ fluorescence (P/F) ratio for the indole-
containing compounds. NATA (squares) and Ca-parvalbumin (circles).
Upper: dry TS glass. Middle: TS at ;97% relative humidity. Bottom:
glycerol and water, 60:40 v/v. For parvalbumin in dry and 97% TS film, the
phosphorescence intensity at 410 nm was used to calculate the P/F ratio. For
other samples, the phosphorescence intensity maximum (436–440 nm) was
used for phosphorescence. The fluorescence maximum was used for the
fluorescence intensity.
1992 Wright et al.
Biophysical Journal 85(3) 1980–1995

fluorescence spectrum, lacks a large spectral shift under
different conditions. It is well known that the lesser sen-
sitivity of phosphorescence to solvent is due to the smaller
dipole for indole triplet state. The experimental dipole
moment for the indole in the 1So state is 2.13 D and in the 1La
state it is 5.4 D. The lowest triplet state of indole, 3La, has
a calculated dipole moment of ;1.5 D (Hahn and Callis,
1997). The low dipole moment means that the triplet state
does not interact strongly with the dipolar solvent.
In the absence of O2, the lifetime of excited-state
molecules is related to flexibility. This is also true for Trp
phosphorescence. The phosphorescence lifetime of Trp is
seconds long in a rigid environment but becomes only tens of
microseconds in a fluid environment (Bent and Hayon,
1975). The O2 molecule is a potent diffusional quencher of
phosphorescence from the indole group (Papp and Vander-
kooi, 1989). At low temperature in solid samples, O2 can no
longer diffuse and so its presence does not cause quenching.
Using O2-sensitive dyes it has been demonstrated that O2 can
not diffuse through the dry glass at room temperature
(Khajehpour et al., 2003). Phosphorescence from Trp can be
seen in sugar glasses without deoxygenation (Fig. 13). The
ratio of phosphorescence/fluorescence intensity of NATA in
glycerol water tracks the glass transition. As seen in Fig. 21,
bottom, the glass transition as seen by NATA and par-
valbumin for glycerol/water is at ;160 K, and very little
phosphorescence intensity can be seen above 200 K. At
200 K in the wet glass (Fig. 21, middle) the phosphorescenceis about half of what it is at low temperature. In dry glass
(Fig. 21, top) at 200 K, the phosphorescence is about
equivalent to what it is at low temperature. Motion of the
chromophore is still implied by the decrease of the
phosphorescence at high temperature.
It is concluded, then, that the phosphorescence yield
indicates motion in the glass at temperatures ranging from
200 to 300 K. Considering that the flexibility of the indole
ring appears related to its phosphorescence lifetime, it is
reasonable to consider that large-amplitude low-frequency
modes of the solvent influence phosphorescence lifetime.
The many weak bonds that determine protein structure
each have temperature dependencies that have overall
consequences on protein stability and function. Many studies
indicate that proteins behave like glasses in terms of varying
flexibility of groups and complexity of reaction kinetics.
There are suggestions that proteins may undergo a glass
transition, but also that dynamical features of the protein are
determined by the glass (Paciaroni et al., 2002; Prestrelski
et al., 1993; Vitkup et al., 2000). In the case of comparison
between TS and glycerol/water, the protein IR modes, for the
most part, resemble the matrix, but the phosphorescence data
also indicate motion within the protein that is independent of
the solvent (Fig. 21). Prahbu et al. (2000) examined the
influence of the glass on the absorbance of buried heme
groups in cytochrome c. When the temperature of glass
formation was high, the optical absorption band showed an
increase width, showing that the glass trapped the large-scale
fluctuations that occur at high temperature, but the major
contribution to the line-width was due to internal solvent-
independent motions. The retention of motion in heme
proteins in sugar glasses is also shown by the recombination
of CO after photodissociation (Doster et al., 1986). These
data would also support the idea that motion in the interior of
the protein is allowed in the interior of proteins, but this
motion is still influenced by the solvent matrix.
SUMMARY
Water in hydrated TS film shows temperature-dependent
features in its HOH bending and OH stretching modes. The
conclusion is that water in hydrated amorphous sugar has
flexibility. The fluorescence spectra of indole derivatives are
sensitive to the glass transition of glycerol/water and the
fluorescence shifts to the red at high temperature, consistent
with known relaxation of solvent molecules around the
excited-state molecule. The fluorescence of NATA in TS
glass remains relatively constant with change in temperature,
indicating that the glass maintains the same environment
over a wide range of temperatures.
The authors thank Drs. Bogumil Zelent, Kent Blaisie, Sergio Dalosto, Paul
Angiolillo, and Mazdak Khajehpour for helpful discussions. The authors
also thank Drs. K.S. Reddy and Chris Moser for help with the Raman
spectra.
This work was supported by National Institutes of Health grant PO1 GM
48130.
REFERENCES
Akao, K., Y. Okubo, N. Askawa, Y. Inoue, and M. Sukurai. 2001. Infraredspectroscopic study on the properties of the anhydrous form II oftrehalose. Implications for the functional mechanism of trehalose asa biostabilizer. Carbohydr. Res. 334:233–241.
Bent, D. V., and E. Hayon. 1975. Excited state chemistry of aromatic aminoacids and related peptides. III. Tryptophan. J. Am. Chem. Soc. 97:2612–2619.
Bjerrum, N. 1952. Structure and properties of ice. Science. 115:385–390.
Brand, L., and D. Toptygin. 2000. Spectrally and time-resolvedfluorescence emission of indole during solvent relaxation. A quantitativemodel. Chem. Phys. Lett. 322:492–502.
Bruni, F., G. Consolini, and G. Careri. 1993. Temperature dependence ofdielectric relaxation in H2O and D2O ice. A dissipative quantumtunneling approach. J. Chem. Phys. 99:538–547.
Callis, P. R. 1991. Molecular orbital theory of the 1Lb and 1La states ofindole. J. Chem. Phys. 95:4230–4240.
Callis, P. R., J. T. Vivian, and L. S. Slater. 1995. Ab initio calculation ofvibronic spectra for indole. Chem. Phys. Lett. 244:53–58.
Carpenter, J. F., and J. H. Crowe. 1989. An infrared spectroscopic study ofthe interactions of carbohydrates with dried proteins. Biochemistry.28:3916–3922.
Castner, E. W., Jr., J. Maroncelli, and G. R. Fleming. 1987. Subpicosecondresolution studies of solvation dynamics in polar aprotic and alcoholsolvents. J. Chem. Phys. 86:1090–1097.
Challi, R., P. Procacci, G. Cardini, and S. Califano. 1999. Glycerolcondensed phases. Part II. A molecular dynamics study of the
Solvent Effects on Protein 1993
Biophysical Journal 85(3) 1980–1995
conformation structure and hydrogen bonding. Phys. Chem. Chem. Phys.1:879–885.
Cordone, L., P. Galajda, E. Vitrano, A. Gassmann, A. Ostermann, and F.Parak. 1998. A reduction of protein specific motions in co-ligatedmyoglobin embedded in a trehalose glass. Eur. Biophys. J. 27:173–176.
Crowe, J. H., F. A. Hoekstra, and L. M. Crowe. 1992. Anhydrobiosis.Annu. Rev. Physiol. 54:579–599.
Demchenko, A. P., K. Gryczynski, Z. Gryczynski, W. Wiczk, H. Malak,and M. Fishman. 1993. Intramolecular dynamics in the environment ofthe single tryptophan residue in staphylococcal nuclease. Biophys. Chem.48:39–48.
Doster, W., A. Bachleitner, R. Dunau, M. Hiebl, and E. Luscher. 1986.Thermal properties of water in myoglobin crystals and solutions atsubzero temperatures. Biophys. J. 50:213–219.
Douzou, P. 1977. Cryobiochemistry. An Introduction. Academic Press,London.
Eftink, M. R., L. A. Selvidge, P. R. Callis, and A. A. Rehms. 1990.Photophysics of indole derivatives: experimental resolution of La and Lbtransitions and comparison with theory. J. Phys. Chem. 94:3469–3479.
Eftink, M. R., and Z. Wasylewski. 1989. Fluorescence lifetime and solutequenching studies with the single tryptophan containing proteinparvalbumin from codfish. Biochemistry. 28:382–391.
Ferreira, S. T. 1989. Fluorescence studies of the conformational dynamicsof parvalbumin in solution: lifetime and rotational motions of the singletryptophan residue. Biochemistry. 28:10066–10072.
Gonnelli, M., and G. B. Strambini. 1993. Glycerol effects on proteinflexibility: a tryptophan phosphorescence study. Biophys. J. 65:131–137.
Gottfried, D. S., E. S. Peterson, A. G. Sheikh, J. Wang, M. Yang, and J. M.Friedman. 1996. Evidence for damped hemoglobin dynamics in a roomtemperature trehalose glass. J. Phys. Chem. B. 100:12034–12042.
Griko, Y. V., P. L. Privalov, J. M. Sturtevant, and S. Y. Venyaminov. 1988.Cold denaturation of staphylococcal nuclease. Proc. Natl. Acad. Sci.USA. 85:3343–3347.
Gruner, S. M. 1977. The Application of an Efficient X-Ray Detector toDiffraction from Retinal Rod Outer Segment Membrane. PrincetonUniversity, Princeton, NJ.
Hahn, D. K., and P. R. Callis. 1997. Lowest triplet state of indole: an abinitio study. J. Phys. Chem. A. 101:2686–2691.
Hammes-Schiffer, S. 2001. Theoretical perspectives on proton coupledelectron transfer reactions. Acc. Chem. Res. 34:273–281.
Helenius, A., and M. Aebi. 2001. Intracellular functions of N-linkedglycans. Science. 291:2364–2369.
Jeffrey, G. A. 1997. An Introduction to Hydrogen Bonding. OxfordUniversity Press, New York.
Kaposi, A. D., J. Fidy, E. S. Manas, J. M. Vanderkooi, and W. W. Wright.1999. Horseradish peroxidase monitored by infrared spectroscopy: effectof temperature, substrate and calcium. Biochim. Biophys. Acta. 1435:41–50.
Khajehpour, M., T. Troxler, and J. M. Vanderkooi. 2003. The effect ofprotein dynamics upon reactions that occur in the heme-pocket ofhorseradish peroxidase. Biochemistry. 42:2672–2679.
Konev, S. V. 1967. Fluorescence and Phosphorescence of Proteins andNucleic Acids. Plenum Press, New York. 9–11.
Krimm, S., and J. Bandekar. 1986. Vibrational spectroscopy andconformation of peptides, polypeptides, and proteins. Adv. ProteinChem. 38:181–364.
Lakowicz, J. R., and H. Cherek. 1980. Dipolar relaxation in proteins on thenaosecond timescale observed by wavelength-resolved phase fluorom-etry of tryptophan fluorescence. J. Biol. Chem. 255:831–834.
Lasser, N., J. Feitelson, and R. Lumry. 1977. Exciplex formation betweenindole derivatives and polar solutes. Isr. J. Chem. 16:330–334.
Librizzi, F., E. Vitrano, and L. Cordone. 1999. Dehydration andcrystallization of trehalose and sucrose glasses containing carbon-monoxy-myoglobin. Biophys. J. 76:2727–2737.
Longworth, J. W. 1971. Luminescence of polypeptides and proteins. InExcited States of Proteins and Nucleic Acids. F. F. Steiner and IWeinryb, editors. Plenum Press, New York. 319–484.
Manas, E. S., Z. Getahun, W. W. Wright, W. F. DeGrado, and J. M.Vanderkooi. 2000. Infrared spectra of amide groups in a-helical proteins:evidence for hydrogen bonding between helices and water. J. Am. Chem.Soc. 122:9883–9890.
Meech, S. R., D. Phillips, and A. G. Lee. 1983. On the nature of thefluorescent state of methylated indole derivatives. Chem. Phys. 80:317–328.
Mei, E., J. Tang, J. M. Vanderkooi, and R. M. Hochstrasser. 2003. Motionsof single molecules and proteins in trehalose glass. J. Am. Chem. Soc.125:2730–2735.
Montoro, T., M. Chabbert, J. Tryzyk, and H. Lami. 1988. Subnanosecond-time-resolved emission spectroscopy of 1-methylindole and 2,3-dime-thylindole in n-butanol. J. Chem. Phys. 89:2712–2719.
Nara, M., M. Tasumi, M. Tanokura, T. Kiraoki, M. Yazawa, and A.Tsutsumi. 1994. Infrared studies of interaction between metal ions andCa21-binding proteins. Marker bands for identifying the types ofcoordination of the side-chain COO� groups to metal ions in pikeparvalbumin (pI ¼ 4.10). FEBS Lett. 349:84–88.
Paciaroni, A., S. Cinelli, and G. Onori. 2002. Effect of the environment onthe protein dynamical transition: a neutron scattering study. Biophys. J.83:1157–1164.
Papp, S., and J. M. Vanderkooi. 1989. Tryptophan phosphorescence atroom temperature as a tool to study protein structure and dynamics.Photochem. Photobiol. 49:775–784.
Permyakov, E. A., V. V. Yarmolenko, V. I. Emelyanenko, E. A. Burstein,J. Closset, and C. Gerday. 1980. Fluorescence studies of the calciumbinding to whiting (Gadus merlangus) parvalbumin. Eur. J. Biochem.109:307–315.
Pierce, D. W., and S. G. Boxer. 1995. Stark effect spectroscopy oftryptophan. Biophys. J. 68:1583–1591.
Ponkratov, V. V., J. Friedrich, and J. M. Vanderkooi. 2002. Solvent effectson conformational dynamics of proteins: cytochrome c in a driedtrehalose film. J. Chem. Phys. 117:4594–4601.
Prabhu, N. V., S. D. Dalosto, K. A. Sharp, W. W. Wright, and J. M.Vanderkooi. 2002. Optical spectra of Fe(II) cytochrome c interpretedusing molecular dynamics simulations and quantum mechanicalcalculations. J. Phys. Chem. B. 106:5561–5571.
Prestrelski, S. J., N. Tedeschi, T. Arakawa, and J. F. Carpenter. 1993.Dehydration-induced conformational transitions in proteins and theirinhibition by stabilizers. Biophys. J. 655:661–671.
Quay, S. C., and C. C. Condie. 1983. Conformational studies of aqueousmelittin: thermodynamic parameters of the monomer-tetramer self-association reaction. Biochemistry. 22:695–700.
Rasnik, I., K. A. Sharp, J. A. Fee, and J. M. Vanderkooi. 2001. Spectralanalysis of cytochrome c: effect of heme conformation, axial ligand,peripheral substituents, and local electric fields. J. Phys. Chem. B.105:282–286.
Simonson, T., C. F. Wong, and A. T. Brunger. 1997. Classical and quantumsimulations of tryptophan in solution. J. Phys. Chem. A. 101:1935–1945.
Stuart, B. 1996. Modern Infrared Spectroscopy. John Wiley & Sons,Chichester, UK.
Sudhakar, K., C. M. Phillips, C. S. Owen, and J. M. Vanderkooi. 1995.Dynamics of parvalbumin studied by fluorescence emission and tripletabsorption spectroscopy of tryptophan. Biochemistry. 34:1355–1363.
Sudhakar, K., C. M. Phillips, S. A. Williams, and J. M. Vanderkooi. 1993.Excited states of tryptophan in cold parvalbumin: identification of a short-lived emitting triplet state at room temperature. Biophys. J. 64:1503–1511.
Tatham, A. S., R. C. Hider, and A. F. Drake. 1983. The effect ofcounterions on melittin aggregation. Biochem. J. 211:683–686.
Valeur, B., and G. Weber. 1977. Resolution of the fluorescence excitationspectrum of indole into the 1La and 1Lb excitation bands. Photochem.Photobiol. 25:441–444.
1994 Wright et al.
Biophysical Journal 85(3) 1980–1995
Venyaminov, S.Y., and F.G. Prendergast. 1997.Water (H2O andD2O)molarabsorptivity in the 1000–4000 cm�1 range and quantitative infraredspectroscopy of aqueous solutions. Anal. Biochem. 248:234–245.
Vitkup, D., D. Ringe, G. A. Petsko, and M. Karplus. 2000. Solvent mobilityand the protein �glass� transition. Nat. Struct. Biol. 7:34–38.
Vivian, J. T., and P. R. Callis. 2001. Mechanisms of tryptophanfluorescence shifts in proteins. Biophys. J. 80:2093–2109.
Walsh, S. T. R., R. P. Cheng, V. Daggett, J. M. Vanderkooi, and W. F.DeGrado. 2003. The hydration of amides in helices: a comprehensivepicture from molecular dynamics, IR, and NMR. Protein Sci. 12:520–531.
Wright, W. W., C. J. Baez, and J. M. Vanderkooi. 2002. Mixed trehalose/sucrose glasses used for protein incorporation as studied by infrared andoptical spectroscopy. Anal. Biochem. 307:167–172.
Solvent Effects on Protein 1995
Biophysical Journal 85(3) 1980–1995