All rights reserved. For Permissions, please email: [email protected] © The Author 2011. Published by Oxford University Press on behalf of the Society of Toxicology.
Promotion of Hepatocarcinogenesis by Perfluoroalkyl Acids in Rainbow Trout
Abby D. Benninghoff*, Gayle A. Orner†, Clarissa H. Buchner‡, Jerry D. Hendricks‡,
Aaron M. Duffy§ and David E. Williams†‡¶
* Department of Animal, Dairy and Veterinary Sciences and the Graduate Program in
Toxicology, Utah State University, 4815 Old Main Hill, Logan, UT, 84322, USA. † Linus Pauling Institute, Oregon State University, 307 Linus Pauling Science Center, Corvallis,
OR 97331, USA. ‡ Department of Environmental and Molecular Toxicology, Oregon State University, 1007
Agricultural and Life Sciences Building, Corvallis, OR, 97331, USA. § Department of Biology, Utah State University, 5305 Old Main Hill, Logan, UT, 84322, USA. ¶ Superfund Basic Research Center, Oregon State University, 435 Weniger Hall, Corvallis, OR
97331, USA.
Corresponding author:
Name: Abby D. Benninghoff, Ph.D.
Address: Animal, Dairy and Veterinary Sciences
Utah State University
4815 Old Main Hill
Logan, UT 84322-4815
Email: [email protected]
Phone: 435-797-8649
Fax: 435-979-2118
Short title: Promotion of hepatocarcinogenesis by PFAAs
Key words: Estradiol, hepatocarcinogenesis, perfluoroalkyl acid, perfluorooctanoic acid,
perfluorooctane sulfonate, tumor promotion, microarray, transcript profiling
Page 1
ToxSci Advance Access published October 9, 2011 at Pennsylvania State U
niversity on September 16, 2016
http://toxsci.oxfordjournals.org/D
ownloaded from

ABSTRACT
Previously, we reported that perfluorooctanoic acid (PFOA) promotes liver cancer in
manner similar to that of 17β-estradiol (E2) in rainbow trout. Also, other perfluoroalkyl acids
(PFAAs) are weakly estrogenic in trout and bind the trout liver estrogen receptor (ER). The
primary objective of this study was to determine whether multiple PFAAs enhance hepatic
tumorigenesis in trout, an animal model that represents human insensitivity to peroxisome
proliferation. A two-stage chemical carcinogenesis model was employed in trout to evaluate
PFOA, perfluorononanoic acid (PFNA), perfluorodecanoic acid (PFDA), perfluorooctane
sulfonate (PFOS) and 8:2 fluorotelomer alcohol (8:2FtOH) as complete carcinogens or
promoters of aflatoxin B1 (AFB1)- and/or N-methyl-N'-nitro-N-nitrosoguanidine (MNNG)-
induced liver cancer. A custom trout DNA microarray was used to assess hepatic transcriptional
response to these dietary treatments in comparison to E2 and the classic peroxisome proliferator
clofibrate (CLOF). Incidence, multiplicity and size of liver tumors in trout fed diets containing
E2, PFOA, PFNA and PFDA were significantly higher compared to AFB1-initiated animals fed
control diet, whereas PFOS caused a minor increase in liver tumor incidence. E2 and PFOA also
enhanced MNNG-initiated hepatocarcinogenesis. Pearson correlation analyses, unsupervised
hierarchical clustering and principal components analyses showed that the hepatic gene
expression profiles for E2 and PFOA, PFNA, PFDA and PFOS were overall highly similar,
though distinct patterns of gene expression were evident for each treatment, particularly for
PFNA. Overall, these data suggest that multiple PFAAs can promote liver cancer and that the
mechanism of promotion may be similar to that for E2.
Page 2
at Pennsylvania State University on Septem
ber 16, 2016http://toxsci.oxfordjournals.org/
Dow
nloaded from
INTRODUCTION
Polyfluorinated chemicals (PFCs) have been manufactured by either electrochemical
fluorination to produce mixtures of branched eight-carbon isomers or telomerization to
synthesize linear fluorotelomers. Perfluoroalkyl acids (PFAAs) are intermediates or by-products
formed during the production or breakdown of these fluoropolymers, widely used as surfactants,
surface protectors, paper and textile coatings, polishes and fire-retardant foams (Fromme et al.,
2009). Biotransformation of fluorotelomers, such as polyfluoroalkyl phosphate esters, used to
coat paper packaging that comes into contact with food, may also be a significant source of
human exposure to PFAAs (D'eon and Mabury, 2011). Perfluorooctanoic acid (PFOA) and
perfluorooctane sulfonate (PFOS) are members of the broader class of PFAAs, which are
structurally characterized by a hydrophobic fluorinated carbon chain of varying length with
either a carboxylic or sulfonic acid end group (Supplemental Figure 1). Blood levels of PFOA
and PFOS in U.S. residents are estimated to be about 4 and 20 ppb, respectively, though these
levels have declined in recent years (Calafat et al., 2007; Olsen et al., 2003). Other PFAAs have
also been detected in humans and wildlife worldwide, including perfluorononanoic acid (PFNA)
and perfluorodecanoic acid (PFDA) (Calafat, et al., 2007; Kannan et al., 2004; Martin et al.,
2004). The residence time of PFOA varies among species, ranging from hours in the female rat
to days in canine and rainbow trout (Hanhijarvi et al., 1988; Martin et al., 2003b). In contrast,
humans have very limited capacity for elimination of PFAAs, as the estimated half-lives of
PFOA and PFOS are 3.8 and 5.4 years, respectively (Olsen et al., 2007).
PFOA and other PFAAs are peroxisome proliferators (PPs), a class of chemicals that also
includes some plasticizers, hypolipidemic drugs, herbicides, solvents and certain long chain fatty
Page 3
at Pennsylvania State University on Septem
ber 16, 2016http://toxsci.oxfordjournals.org/
Dow
nloaded from

acids. Many biological responses to PPs are mediated by interaction with the peroxisome
proliferator-activated receptor α (PPARα), which is highly expressed in the liver (Holden and
Tugwood, 1999). PFOA and other PPs are non-genotoxic hepatocarcinogens or promoters of
hepatocarcinogenesis in rodents (reviewed in Abdellatif et al., 1991; Lai, 2004), though
differences in susceptibility have been observed among species. Mice and rats are highly
susceptible to liver toxicity and cancer caused by peroxisome proliferating chemicals, whereas
humans and non-human primates are insensitive or non-responsive (Holden and Tugwood, 1999;
Lai, 2004). The weak response of humans to PPs has been attributed to the low level of PPARα
expression in human liver (Palmer et al., 1998). New evidence showing that the environmental
PPARα agonist di(2-ethylhexyl) phthalate (DEHP) significantly increased liver cancer incidence
in PPARα null mice (Ito et al., 2007) suggests that some PPs may act via PPARα-independent
modes of action to increase risk of hepatocarcinogenesis.
Recently, our laboratory utilized the rainbow trout (Oncorhynchus mykiss) as an animal
model that mimics human insensitivity to peroxisome proliferation to investigate alternative
mechanisms of action for PFAAs. Chronic dietary exposure to PFOA enhanced liver cancer in
trout and elicited changes in hepatic gene expression indicative of estrogen exposure, whereas
the classic peroxisome proliferator clofibrate (CLOF) was ineffective (Tilton et al., 2008). Thus,
we deduced that the cancer-enhancing effects of PFOA in trout were due to novel mechanisms
related to estrogen signaling, rather than the typical peroxisome proliferator response observed
for this chemical in rodent models. Subsequently, we reported that multiple PFAAs, including
PFOA, PFNA, PFDA and PFOS, are weakly estrogenic in rainbow trout based upon induction of
the estrogen-sensitive biomarker plasma protein vitellogenin (Vtg) and evidence for direct
interaction of these compounds with the trout liver estrogen receptor (ER) (Benninghoff et al.,
Page 4
at Pennsylvania State University on Septem
ber 16, 2016http://toxsci.oxfordjournals.org/
Dow
nloaded from

2011). Moreover, none of these compounds elicited a typical peroxisome proliferator response
in trout liver. The estrogen-like action of these compounds is likely not restricted to trout, as
multiple PFAAs increase activity of a human ERα gene reporter and were demonstrated to
effectively dock in silico to the ligand-binding domain of the human and mouse ERα
(Benninghoff, et al., 2011).
The objective of the present study was to determine the impact of multiple PFAAs with
reported estrogen-like activity on hepatic tumorigenesis in rainbow trout, a well-established
model used for chemically induced liver cancer in humans (Bailey et al., 1996). A two-stage
chemical carcinogenesis model was employed to evaluate PFOA, PFNA, PFDA, PFOS and 8:2
fluorotelomer alcohol (8:2FtOH) as potential complete carcinogens and promoters of aflatoxin
B1 (AFB1)- and/or N-methyl-N'-nitro-N-nitrosoguanidine (MNNG)-induced liver cancer. A
toxicogenomics approach was utilized to evaluate mechanisms of chemical hepatocarcinogenesis
in PFAA-exposed trout compared to 17β-estradiol (E2) and the classic peroxisome proliferator
CLOF. We hypothesized that PFAAs, identified previously as weak xenoestrogens, would
enhance liver carcinogenesis and produce a hepatic gene expression profile indicative of an
estrogen-like transcriptional response.
METHODS
Materials
Analytical grade AFB1, E2, PFOA, PFNA, PFDA and 8:2FtOH were obtained from
Sigma-Aldrich (St. Louis, MO). PFOS and CLOF were purchased from Fluka Chemical Corp
(St. Louis, MO). MNNG was obtained from ChemService (West Chester, PA). All other
reagents were purchased from Sigma-Aldrich or other general laboratory suppliers and were of
Page 5
at Pennsylvania State University on Septem
ber 16, 2016http://toxsci.oxfordjournals.org/
Dow
nloaded from

the highest purity available. Chemical structures for compounds tested as tumor promoters are
provided in Supplemental Figure 1.
Animals
Mt. Shasta strain rainbow trout were hatched and reared at the Sinnhuber Aquatic
Research Laboratory at Oregon State University in Corvallis, Oregon. Fish were maintained in
flow-through 375-l tanks at 12 °C with activated carbon water filtration on a 12:12 hr light:dark
cycle. All procedures for treatment, handling, maintenance and euthanasia of animals used in this
study were approved by the Oregon State University Institutional Animal Care and Use
Committee.
Tumor study, necropsy and histopathology
An overview of the study design is provided in Supplemental Figure 2. Approximately
3500 fry were initiated at 10 weeks post spawn with an aqueous exposure to 10 ppb AFB1 or
0.01% EtOH (non-initiated sham controls) for 30 min; a second cohort of about 1000 fry was
AFB1- or sham-initiated at 15 weeks of age. To determine whether the expected tumor-
promoting effects of PFOA and related compounds are carcinogen- or target organ-dependent, a
third cohort of about 1000 fry was initiated at 10 weeks post spawn with a 30-min aqueous
exposure to 35 ppm MNNG, a multi-organ carcinogen in trout (Hendricks et al., 1995), or 0.01%
DMSO (non-initiated sham control). After initiation, fry were fed Oregon Test Diet, a semi-
purified casein-based diet, for one month (Lee et al., 1991). Then, within each initiation cohort,
trout were randomly distributed into dietary treatment groups with 125 animals assigned to
duplicate tanks (250 fish/treatment) (Supplemental Figure 2). In the first cohort, fish were fed
experimental diets containing 5 ppm E2, 2000 ppm PFOA (approximately 50 mg/kg bw/day),
2000 ppm FtOH or 2000 ppm CLOF ad libitum (2.8-5.6% of body weight) five days per week
Page 6
at Pennsylvania State University on Septem
ber 16, 2016http://toxsci.oxfordjournals.org/
Dow
nloaded from

for six months. PFNA and PFDA experimental diets were initially administered at 2000 ppm
based upon prior testing of PFOA without significant mortality (Tilton, et al., 2008; unpublished
observations). Due to an unexpected number of mortalities in the PFNA and PFDA treatment
groups early in the study, diet concentrations were reduced to 200 ppm PFDA (5 mg/kg/day) or
1000 ppm PFNA (25 mg/kg/day) for the remainder of the exposure period. In the second cohort
(AFB1 at 15 weeks), trout were fed 100 ppm PFOS (2.5 mg/kg/day); this lower test concentration
of PFOS was selected based upon observed lethal toxicity at the 2000 ppm diet level
(unpublished data). Finally, MNNG-initiated trout were fed 5 ppm E2 or 2000 ppm PFOA. All
experimental diets were prepared monthly, stored frozen at -20°C and then thawed to 4°C a few
days prior to feeding. Most test compounds were added directly to the oil portion of the OTD
diet, though 8:2FtOH was incorporated into the diet via an oil-in-water emulsification. At
conclusion of the 6-month promotion diet period, animals were once again fed standard OTD for
the remainder of the study.
At 12.5 months post spawn, juvenile trout were euthanized with an overdose (250 ppm)
of tricane methanesulfonate (MS-222) and necropsied over a one-week period. Livers, kidneys,
stomachs and swim bladders were preserved in Bouin’s solution for up to seven days for
histologic examination of tumors by hematoxylin and eosin staining. Neoplasms were classified
according to the criteria described by Hendricks et al. (1984). The effect of experimental diets
on tumor incidence was modeled by logistic regression (LOGISTIC procedure, SAS version 9.2,
SAS Institute, Cary, NC); analyses included diet treatment, sex, body weight and replicate tank
as experimental factors. Firth’s bias correction was used as the likelihood penalty when a
maximum likelihood estimate was not obtained. Some fish in this study showed symptoms of a
liver disease of unknown origin, which was characterized by pale or jaundiced livers. To
Page 7
at Pennsylvania State University on Septem
ber 16, 2016http://toxsci.oxfordjournals.org/
Dow
nloaded from

determine whether this idiopathic disease impacted the study outcome, logistic regression
analyses were performed using two data sets: all subjects included all experimental subjects,
males and females, regardless of disease symptoms; final subjects excluded any fish that showed
symptoms of idiopathic liver disease. Data, statistical analyses and conclusions presented in this
manuscript are for the final subjects data set, unless noted otherwise, while information and
analysis of the all subjects data set is available in the supplemental materials. Tumor multiplicity
(number of tumors per tumor-bearing animal) and size data were analyzed by the Kruskal-Wallis
test with Dunnett’s with post-hoc test for multiple comparisons (GraphPad Prism 5, La Jolla,
CA).
Microarray experiment
Two weeks after the start of experimental diets, 24 fry (sex undetermined) from each of
the sham-exposed treatment groups were removed from the study (12 fish/duplicate tank),
euthanized by MS-222 and randomly distributed to create three pools of eight livers (n = 3).
Total hepatic RNA was extracted from pooled whole liver samples using TRIzol reagent (Sigma-
Aldrich), purified using the RNeasey Mini kit (Qiagen, Valencia, CA) and evaluated for quality
using the Bioanalyzer 2100 (Agilent, Palo Alto, CA). A reference RNA pool was made by
combining equal amounts of RNA from all control RNA samples. Because PFOS trout were
treated at a later age, a separate time-matched reference RNA pool was prepared for competitive
hybridization of PFOS samples.
Details on the development, manufacture and quality control assessment of the OSUrbt
version 5.0 microarray have been provided previously (Benninghoff and Williams, 2008; Tilton
et al., 2005) (Gene Expression Omnibus [GEO] platform accession ID: GPL5478). For
detection of gene expression on the OSUrbt-v5 array, the Genisphere 3DNA Array 900 kit
Page 8
at Pennsylvania State University on Septem
ber 16, 2016http://toxsci.oxfordjournals.org/
Dow
nloaded from

(Hatfield, PA) was used according to the supplier’s protocol in a standard dye-swap, reference
sample design as previously described (Benninghoff and Williams, 2008). Note that the RNA
reference for competitive hybridization of PFOS samples was a separate, time-matched pool of
RNA obtained from sham-initiated, control-fed trout at 15 weeks. Each reverse transcription
reaction also included spiked-in mRNA corresponding to SpotReport Alien Oligo control
features (Stratagene, La Jolla, CA). Hybridization of cDNA and capture reagents to the OSUrbt
arrays was performed using the Hybex Microarray Incubation system (SciGene Corporation,
Sunnyvale, CA) as described previously (Benninghoff and Williams, 2008). Within 24 hr of
hybridization, array images at a resolution of 5 μm were obtained using the Axon GenePix Pro
4200A scanner (Molecular Devices Corp., Sunnyvale, CA) at 543 nm and 633 nm excitation
wavelengths for Cy3 and Cy5, respectively, with saturation tolerance set at 1% and laser power
set at 90%.
Array image files were processed with ratio-centering, and spot intensities were
quantified using GenePix Pro software (Molecular Devices). Protocols for the maintenance,
processing and filtering of raw data sets (technical replication and fold-change criteria) were
detailed previously (Benninghoff and Williams, 2008). All data files associated with this
experiment are available at the GEO online data repository (Accession ID: GSE31085).
Statistical analyses of gene expression were performed using the normalized, geometric mean
expression values for each biological replicate to compare each individual experimental
treatment to the control (MultiExperiment Viewer [MeV]) (Saeed et al., 2003); a statistically
significant change in gene expression was inferred when p < 0.05 (Welch’s t-test, between
subjects and assuming unequal variances). Unsupervised, bidirectional hierarchical clustering
Page 9
at Pennsylvania State University on Septem
ber 16, 2016http://toxsci.oxfordjournals.org/
Dow
nloaded from
and principal components analyses were performed using MeV. Normalized data were also
exported to Prism 5 for pairwise Pearson correlation analyses of gene expression profiles.
Gene annotation and ontology analysis
Manual annotation of differentially regulated array features was performed as previously
described (Benninghoff and Williams, 2008). For the proteins encoded by the putative trout
homolog mRNAs, functional information was inferred from annotations in the Gene Ontology,
Online Mendelian Inheritance in Man (OMIM) and SwissProt Protein Knowledgebase databases.
Automatic annotation of the entire OSUrbt-v5 array was performed using traditional basic local
alignment search tool (BLAST) in a two-step process, as follows. First, the array 70mer oligo
sequences were queried against the NCBI expressed sequence tag (EST) databases for rainbow
trout, salmon (Salmo salar) and zebrafish (Danio rerio). Of the 1676 features on the OSUrbt-v5
array, 1384 EST matches were obtained. The resulting top EST hit (E < 10-4) for each array
feature was then used for a translated blastx search against the NCBI non-redundant protein
sequence (nr) database. The resulting top hit (E < 10-6), excluding hypothetical proteins, was
considered the best match for array feature identification; 1103 gene matches were obtained from
the NCBI nr database. NCBI accession numbers for the top hits were used to obtain gene
symbols for each array feature using BioThesaurus (Liu et al., 2006).
Gene ontology enrichment analysis was performed using High Throughput GoMiner
(Zeeberg et al., 2005). For each treatment, the list of differentially regulated genes
(Supplemental Table 5) was compared to an auto-generated list derived from gene ontologies for
rainbow trout (NCBI taxonomy ID 8022), zebrafish (ID:7095) and human (ID:9606). Because
the OSUrbt-v5 array is a medium-sized array (about 1450 genes) with probes focused on
processes involved in carcinogenesis, reproduction, toxicological response and stress physiology,
Page 10
at Pennsylvania State University on Septem
ber 16, 2016http://toxsci.oxfordjournals.org/
Dow
nloaded from

it was necessary to automatically generate a global list of genes to avoid potential pathway bias
inherent in a targeted array. All available database resources were searched, and all evidence
levels were included in the analysis. A minimum of two genes per category was set for
generation of category statistics, and 100 randomizations were used for the enrichment analysis.
A significant effect of dietary treatment on GO term category (biological process) enrichment
was inferred when p < 0.05, as determined by a one-sided Fisher’s exact test after false discovery
rate (FDR) correction. Cluster Image Maps (CIM) for biological processes over- and under-
represented in treatment gene lists were generated using CIMminer (Weinstein, 2004) with GO
categories clustered by Euclidian distance method with average linkage. To visualize and
compare relationships among differentially regulated GO categories associated with dietary E2
and PFNA, differentially-regulated gene lists were subjected to analysis in AgriGO (Du et al.,
2010) using the singular enrichment analysis (SEA) tool against the zebrafish gene ontology
database.
Real-time qRT-PCR
To validate changes in gene expression detected on the OSUrbt array, mRNA levels of
select genes were evaluated by the quantitative real time reverse transcriptase polymerase chain
reaction (qRT-PCR) as described previously (Benninghoff and Williams, 2008), with a few
modifications. Total RNA (1 μg) was reverse transcribed (Superscript II, Invitrogen) according
to the supplier’s protocol with oligo d(T)18 primer and a final reaction volume of 50 μl. Primer
sequences are provided in Supplemental. Table 1, and qRT-PCR was performed using the
PerfeCta SYBR Green FastMix (Quanta Biosciences, Gaithersburg, MD) on a Mastercycler ep
Realplex (Eppendorf, Hauppauge, NY). PCR standards for each target gene were prepared by
gel-purification of PCR products (QIAX II, Qiagen, Valencia, CA), quantified using the
Page 11
at Pennsylvania State University on Septem
ber 16, 2016http://toxsci.oxfordjournals.org/
Dow
nloaded from

PicoGreen dsDNA Quantification Kit (Molecular Probes, Eugene, OR) and serially diluted for
final concentrations ranging from 0.001 to 100 ng DNA. All qRT-PCR expression values were
normalized by the geometric mean fold change of four housekeeping genes (actb, gapdh, top2a
and atp5b). Then, for comparison to microarray expression values, log2 fold change ratios were
calculated for treated samples compared to the same reference pool that was utilized in the
microarray study. qRT-PCR data were analyzed by one-way ANOVA with Dunnett’s post-hoc
test for multiple comparisons, and a significant change in gene expression was inferred when
p<0.05.
RESULTS
Promotion of AFB1- or MNNG-initiated hepatocarcinogenesis by PFAAs
Initiation with 10 ppb AFB1 resulted in a moderate rate of liver tumor incidence (13%) in
12 month-old trout (Table 1; Figure 1A), whereas no tumors were observed in sham-initiated
animals. The 5 ppm E2 promotion diet markedly enhanced liver tumor incidence to 83% (p <
0.0001), increased liver tumor multiplicity (p < 0.001) and doubled the average liver tumor size
(p < 0.001) (Figure 1A,D). Post-initiation exposure to experimental diets containing PFOA,
PFNA or PFDA resulted in a hepatic tumor response similar to that of E2, and PFDA was the
most potent promoting agent tested in this study. Interestingly, 200 ppm PFDA increased liver
tumor incidence to a greater extent (26% higher) than did a 10-fold higher diet concentration of
PFOA. Dietary PFOA, PFNA and PFDA also significantly increased tumor multiplicity and size
in a manner similar to that of E2 (Figure 1D). In contrast, post-initiation dietary exposure to
8:2FtOH or the classic peroxisome proliferator compound CLOF did not change liver tumor
incidence, burden or size. Liver tumor incidence in trout initiated with AFB1 at 15 weeks was
only substantially lower at 1% (Table 1); dietary PFOS increased the liver cancer rate to 13% (p
Page 12
at Pennsylvania State University on Septem
ber 16, 2016http://toxsci.oxfordjournals.org/
Dow
nloaded from

= 0.0014), though tumor burden and multiplicity remained unchanged compared to time-matched
controls (Figure 1B, E). Logistic regression analyses for the E2, PFOA, PFNA, PFDA and
PFOS treatment groups showed that the experimental diet was the primary factor driving tumor
response (p-values ranging from 0.0014 to <0.0001); reduced body weight was a minor factor
associated with tumor outcome, while fish sex, replicate tank or idiopathic liver disease did not
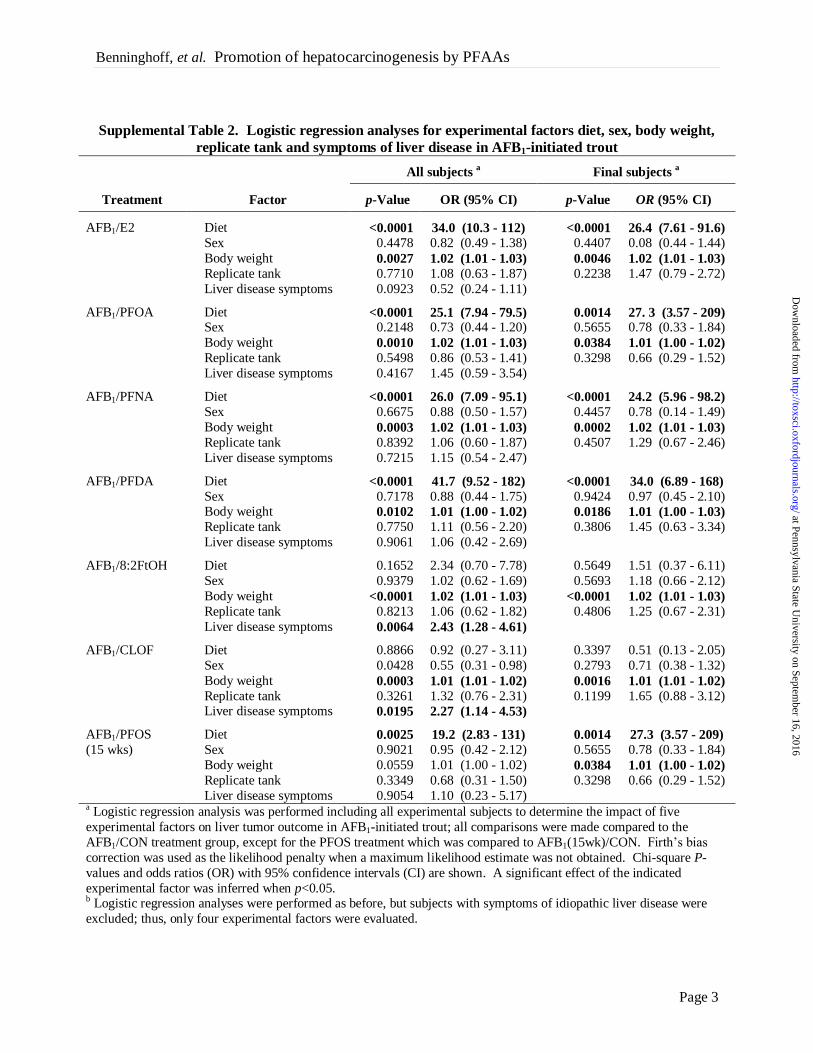
impact tumor outcome (Supplemental Table 2; Supplemental Figure 3). Dietary treatment with
E2, PFOA, PFNA, PFDA or PFOS significantly increased relative liver weight, though this
observation could be partially attributed to lower body weight in some of these treatment groups
(Supplemental Figure 4).
A third cohort of trout was initiated with 35 ppm MNNG to determine whether the
tumor-promoting effects of dietary PFOA was specific to hepatocarcinogenesis or dependent
upon the initiating carcinogen. Initiation with the multi-organ carcinogen MNNG resulted in
tumorigenesis of the liver, kidney, stomach and swim bladder (Table 2). Dietary exposure to 5
ppm E2 and 2000 ppm PFOA significantly increased liver tumor incidence (p < 0.0001),
multiplicity (p <0.001) and size (p <0.001) compared to control diet (Figure 1C, F). Kidney and
stomach carcinogenesis were not significantly affected by E2 or PFOA (Table 2), and the
apparent impact of these compounds on swim bladder tumor incidence was confounded by
significant over-dispersion among the replicate tanks (Supplemental Figure 5). Logistic
regression analyses for MNNG-initiated groups showed that experimental diet was the primary
factor impacting liver tumor outcome (p < 0.0001), and there was not a significant effect of fish
sex, replicate tank or idiopathic liver disease on liver carcinogenesis (Supplemental Table 3).
Histological evaluation of tumors in 12.5-month old trout confirmed previous
observations from our laboratory that the predominant liver tumor type in AFB1- or MNNG-
Page 13
at Pennsylvania State University on Septem
ber 16, 2016http://toxsci.oxfordjournals.org/
Dow
nloaded from

initiated animals was mixed carcinoma (MC) with hepatocellular adenoma (HCA) and
hepatocellular carcinoma (HCC) as secondary tumor types (Tables 1-2). Tumor type profiles
were not noticeably different among the various tumor promotion diets, though cholangiocellular
tumors (adenoma and carcinoma) were more common in AFB1-initiated trout fed E2 or PFAA
promotion diets.
Perfluoroalkyl modulation of hepatic gene expression
In the present study, we used the trout OSUrbt-v5 microarray to examine hepatic
transcriptional responses to several structurally related polyfluorinated compounds in
comparison to E2 and CLOF (GEO accession GSE31085). Quality control analysis of array data
showed that intra- and inter-array variability was generally low and that hybridization was
consistent and reproducible (Supplemental Figure 6). Multiple criteria were used to reduce the
original raw data sets to a subset of array features considered significantly regulated by any one
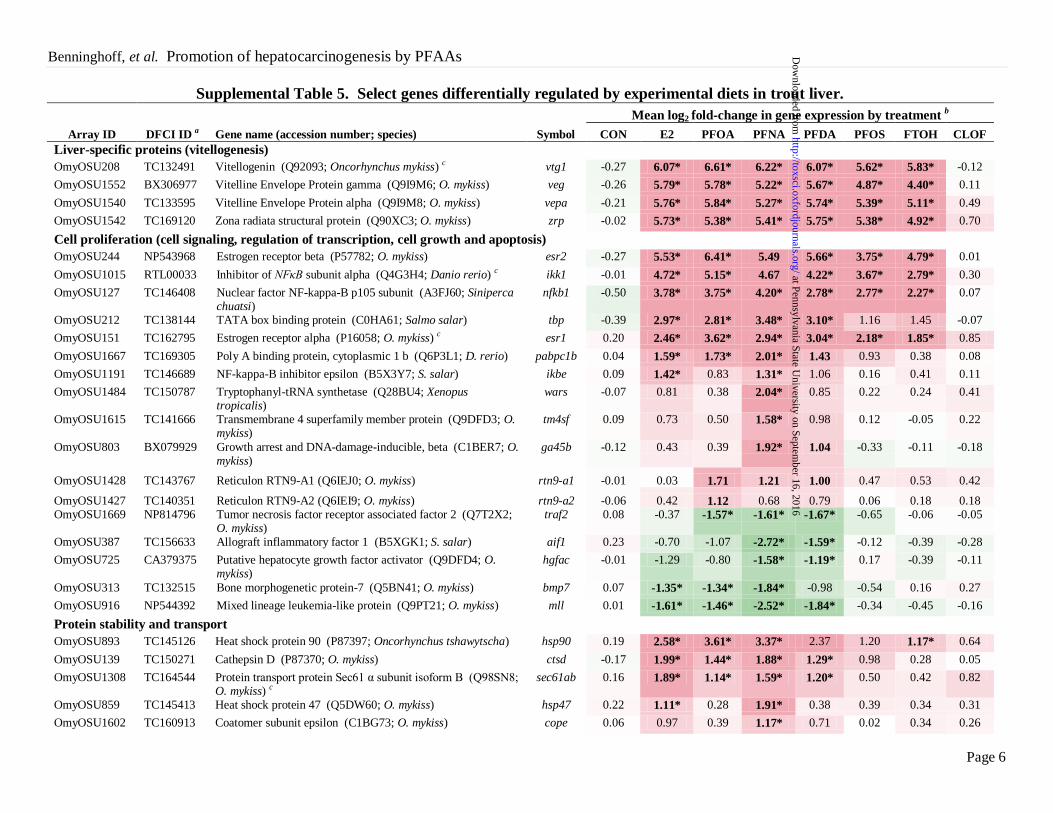
of the experimental treatments (Supplemental Table 4). Average expression values, accession
numbers and gene annotations for select array features that passed all stringency criteria are
shown in Supplemental Table 5. The impact of E2, PFOA and CLOF on hepatic gene expression
was very similar to prior observations in our laboratory (Figure 2) (Tilton, et al., 2008). Dietary
PFOA, PFNA and PFDA commonly altered expression of 54 genes, of which many were shared
with the E2 group. Genes regulated by PFOS and FtOH were somewhat similar to E2 and the
perfluoroalkyl acids, whereas CLOF had very little effect on liver gene expression in trout.
Several analytical approaches were utilized to compare PFAA gene expression profiles to E2, a
model estrogen, and CLOF, a classic peroxisome proliferator. Pairwise Pearson correlation
analyses for significantly regulated genes revealed strong correlations among E2, PFOA, PFNA,
PFDA treatments (r ≥ 0.84), whereas the E2, PFOS and FtOH groups were modestly similar (r
Page 14
at Pennsylvania State University on Septem
ber 16, 2016http://toxsci.oxfordjournals.org/
Dow
nloaded from

values from 0.66 to 0.83) (Figure 3A; Supplemental Table 6). Principal components analysis
(PCA) was employed to reduce the dimensionality of the data set so that general relationships
between the promotion diets could be discerned more easily (Figure 3B). Transcript profiles for
E2, PFOA and PFDA treatments were highly similar, indicated by close proximity in the PCA
plot, whereas PFOS and FtOH were moderately similar (within the same quadrant); all
treatments were distinct from CLOF and CON groups. Also, the expression profile for PFNA
was sufficiently unique to form a separate cluster distant from all other treatment groups.
Bidirectional clustering of genes differentially regulated by at least one of the experimental diets
showed distinct patterns of expression corresponding to two primary nodes in the sample tree,
with one node encompassing all polyfluorinated chemicals and E2 and the second node including
CLOF and control groups (Figure 4A). Distinct patterns of gene expression were evident for
each experimental condition, particularly for PFNA, which formed a separate sub-node within
the estrogen group. These patterns remained consistent when this analysis was applied to the
entire array dataset (Supplemental Figure 7).
Transcripts differentially regulated by the estrogen-like treatments, including E2, PFOA,
PFNA and PFDA, represent biological processes involved in cell proliferation; apoptosis; signal
transduction; transcription; protein translation, modification and transport; phase I and II
metabolism; redox regulation; and adaptive immune response (Supplemental Tables 5, 7-8;
Supplemental Figures 8-9). Overall, the estrogenic transcriptional profile observed in this study
is highly similar to previous trout experiments in our laboratory, as a similar set of estrogen
biomarker genes were differentially regulated, including vtg, ctds, esr1, rtn9-a1, sec61ab, vhsv4,
and ikk1, among others (Benninghoff and Williams, 2008; Tilton, et al., 2008). Moreover,
typical gene markers indicative of a typical transcriptional response to peroxisome proliferators,
Page 15
at Pennsylvania State University on Septem
ber 16, 2016http://toxsci.oxfordjournals.org/
Dow
nloaded from
such as crot and acat1, were not significantly regulated by E2, the polyfluorinated compounds
tested in this study or the classic PPAR agonist CLOF; however, catalase expression was
significantly repressed by PFNA (Supplemental Table 5). Also of note, dietary exposure to all of
the fluorochemicals tested caused significant enrichment of GO categories response to estradiol
stimulus and estrogen receptor signaling pathway. Though the transcriptional profiles for E2
and the polyfluorinated chemicals examined in this study were broadly similar, some distinctions
were evident (Figure 4B; Supplemental Tables 7-8). In particular, the perfluoroalkyl carboxylic
acids significantly suppressed expression of several genes involved in regulation of the blood
coagulation cascade and the complement pathway; E2 similarly repressed genes in these
pathways, though to a lesser extent. Additionally, several genes associated with phase I and II
metabolism (gstp1, cyp3a27, mgst1 and cbr1) were differentially regulated by dietary PFOS
and/or FtOH, but not E2 or the perfluoroalkyl carboxylic acids.
Expression of select genes differentially induced or repressed was verified by qRT-PCR,
including a2m, ctsd, cyp1a, cyp2k5, hpx, pgds, tcpbp, trx and vtg. Generally, qRT-PCR values
followed a pattern similar to that acquired using the microarray (Supplemental Figure 10).
However, the magnitude of change in gene expression detected by qRT-PCR was occasionally
greater compared to the microarray data (e.g., vtg) due to saturation beyond the linear range of
detection on the array. Overall, results of these analyses confirm that our strategy for
identification of differentially regulated genes from the OSUrbt-v5 data set resulted in the
detection of meaningful changes in gene expression.
DISCUSSION
We report for the first time that multiple PFAAs enhance hepatocarcinogenesis via an
estrogen-like mechanism in rainbow trout, an animal model that recapitulates human
Page 16
at Pennsylvania State University on Septem
ber 16, 2016http://toxsci.oxfordjournals.org/
Dow
nloaded from

insensitivity to peroxisome proliferation. Previously, we demonstrated that dietary exposure to
the ubiquitous environmental contaminant PFOA enhanced AFB1-initiated liver tumorigenesis in
trout (Tilton, et al., 2008). Subsequent in vitro and in vivo experiments showed that several
perfluoroalkyl carboxylic acids and sulfonates have weak estrogen activity, likely via direct
interaction with the ER (Benninghoff, et al., 2011); moreover, in this animal model, PFAAs did
not elicit the typical peroxisome proliferator response expected for PPARα ligands. In the
present study, we tested the hypothesis that PFAAs structurally related to PFOA would similarly
impact liver tumorigenesis. We determined that chronic exposure to three different PFAAs via
the diet, including PFOA, PFNA and PFDA, markedly increased hepatocarcinogenesis in trout in
a manner similar the prototypical estrogen, E2. Also, tumor promotion by PFOA was restricted
to the liver, but not dependent upon the initiating carcinogen. Dietary exposure to PFOS caused
a modest increase in liver tumor incidence, possibly due to the lower diet concentration selected
for this compound or the slightly older age of these fish at initiation and start of dietary
treatment.
Although the diet concentrations of PFAAs tested in this study (100 to 2000 ppm, or 2.5
to 50 mg/kg bw/day) are typical for peroxisome proliferator cancer studies in rodents, these
levels were substantially greater than would be expected from a typical human environmental
exposure (Fromme, et al., 2009). Extrapolation from a two-week dietary dose-response study in
trout with PFOA and PFDA (Benninghoff, et al., 2011) suggests that the diet concentrations
employed in this tumor promotion study result in blood levels in the micromolar range,
considerably higher than the nanomolar range reported for these compounds in human blood
(Calafat, et al., 2007; Olsen, et al., 2003). Evidence from a previous limited dose-response
tumor study with PFOA in trout suggested that a lower dietary exposure to PFAAs may not
Page 17
at Pennsylvania State University on Septem
ber 16, 2016http://toxsci.oxfordjournals.org/
Dow
nloaded from

substantially increase liver cancer risk in animals that are insensitive to peroxisome proliferation
(Tilton, et al., 2008). However, the observation from the present study that 200 ppm PFDA
increased tumor incidence to an even greater extent than 2000 ppm PFOA (88% and 62%
incidence, respectively) points to the need for further studies utilizing a comprehensive dose-
response approach with individual PFAAs to appropriately assess cancer risk for these
compounds. Moreover, because multiple members of this chemical class are often detected in
blood and tissue samples (Calafat, et al., 2007; Lau et al., 2007), the potential for additive or
synergistic effects of PFAA mixtures in promoting liver carcinogenesis should not be ignored.
The liver gene expression profiles obtained by the trout custom DNA microarray were
highly similar among E2 and PFAA treatments, suggesting that these compounds likely act via a
common mechanism of action to promote hepatocarcinogenesis in trout. Previously, we
identified a set of 17 hepatic genes as biomarkers of estrogen exposure (Benninghoff and
Williams, 2008), of which, 13 were differentially regulated by PFAAs in trout. Although the
specific mechanism for promotion of liver cancer by estrogens in trout is not known, results of
this and previous gene expression profiling experiments (Benninghoff and Williams, 2008;
Tilton et al., 2006; Tilton, et al., 2008) point to the involvement of genes associated with cell
growth, apoptosis, cell signaling, regulation of transcription, protein stability and transport and
immune response. For example, E2- or PFAA-dependent promotion of hepatocarcinogenesis
may involve disruption of the NFκB signaling pathway (e.g., nfkb1, ikk1, ikbe) or suppression of
innate immune response (e.g., C-3, C-9, mbl) (Sun and Karin, 2008; Vainer et al., 2008).
Interestingly, the gene expression profiles for PFAAs obtained from the trout microarray are
generally similar to profiles reported by Wei et al. (2007; 2009) following aqueous exposures of
PFOA, PFOS and various mixtures of PFAAs in rare minnow (Gobiocypris rarus). In rat liver,
Page 18
at Pennsylvania State University on Septem
ber 16, 2016http://toxsci.oxfordjournals.org/
Dow
nloaded from
the transcriptional response to an oral gavage of PFOA or PFOS was dominated by genes
associated with lipid metabolism and transport, including genes in the peroxisomal fatty acid
oxidation pathway (e.g., Acat1) (Guruge et al., 2006; Hu et al., 2005). However, few transcripts
associated with the metabolism and transport of lipids and cholesterol were significantly altered
by PFAA exposure in trout (<3% of all regulated features), and several of these were also
regulated by E2. These observations, along with the recent discovery that PFOA, PFNA, PFDA
and PFOS competitively bind to the trout ER (Benninghoff, et al., 2011), provide further
evidence that PFAAs promote hepatic cancer in this species via an estrogen-like mechanism
involving activation of the ER, rather than via interaction with PPARα and induction of
peroxisomal proliferation.
At the time liver tissues were collected for the microarray study, all three perfluoroalkyl
carboxylic acids had been administered at the same diet concentration (2000 ppm) for two-
weeks. Thus, apparent distinctions in transcriptional profiles among PFOA, PFNA and PFDA
may reflect chemical-specific responses, differences in the strength of interaction with molecular
targets mediating the transcription response or possible differences in uptake, distribution or
elimination of these chemicals in vivo. Martin et al. (2003a; 2003b) reported that values for
bioconcentration and residence time of PFAAs in trout liver generally increased with increasing
length of the fluorinated carbon chain (half-life of 5 days for PFOA compared to 14 days for
PFDA). However, the high similarity in transcriptional response to PFOA and PFDA observed
in this study did not reflect these apparent differences in chemical pharmacokinetics, most likely
due to the daily dietary exposure protocol employed. Dietary PFNA altered hepatic expression
of 175 transcripts (65 induced, 110 repressed), nearly twice the number for PFOA and PFDA;
however, many of these array features were similarly induced or repressed by all three
Page 19
at Pennsylvania State University on Septem
ber 16, 2016http://toxsci.oxfordjournals.org/
Dow
nloaded from

carboxylic acids and E2, though to differing extent. A case in point is PFNA-induced
dysregulation of the blood coagulation pathway, a reported side-effect of pharmacological
estrogen exposure (Sherif, 1999).
Only a few definitive chemical-specific gene targets were identified in this study, most
notably st2s2 and cyp3a7 for PFOS and gstp1 for 8:2FtOH. Additionally, the modest
transcriptional response to PFOS as compared to the carboxylic acids tested should be
considered in the context of the lower dietary exposure (200 ppm). Dietary 8:2FtOH (2000 ppm)
modified relatively few transcripts, most of which were highly sensitive estrogen biomarker
genes (e.g., vtg, zrp, esr1). Previously, we determined that 8:2FtOH was not overtly estrogenic
in trout and does not interact with the ER (Benninghoff, et al., 2011); it is possible that the
transcriptional activity of this chemical observed in this study may be due to in vivo metabolism
of 8:2FtOH to PFOA or other estrogenic derivative (Brandsma et al., 2011). Other laboratories
have also reported estrogen-like activity of PFAAs and some fluorotelomers, although
inconsistencies among these reports suggest that some species are more responsive to one
compound class than the other (Ishibashi et al., 2008; Liu et al., 2007; Maras et al., 2006).
In conclusion, we report the important finding that multiple PFAAs, including PFOA,
PFNA, PFDA and PFOS enhance liver tumorigenesis in trout, an animal model that is not
responsive to peroxisome proliferation. Evidence from gene expression profiling suggests that
the mechanism of action for PFAA-dependent promotion of hepatocarcinogenesis likely involves
interaction with the hepatic ER. Finally, this study highlights the use of an alternative animal
model to reveal novel estrogen-like action of multiple PFAAs in modulating chemical
carcinogenesis.
Page 20
at Pennsylvania State University on Septem
ber 16, 2016http://toxsci.oxfordjournals.org/
Dow
nloaded from

SUPPLEMENTARY DATA
Supplementary data are available online at www.toxsci.oupjournals.org as a single Adobe
PDF file, which includes graphical presentation of all trout morphometric and tumor data as well
the detailed results of the statistical analyses performed. Also provided are figures and tables
detailing the results of the microarray study as well as the gene ontology analyses performed.
For a complete list of figures and tables, see the supplemental data file table of contents.
FUNDING
This work was supported in part by the National Institute of Environmental Health
Sciences (P30 ES03850, T32 ES07060, P30 ES00210, P42 ES016465 and R01 ES013534) and
the Utah Agricultural Experiment Station.
ACKNOWLEDGEMENTS
The authors wish to acknowledge the assistance of Eric Johnson and Greg Gonnerman at
the Sinnhuber Aquatic Research Laboratory (SARL) for care of the animals used in this study.
The technical assistance of Marilyn Henderson, Lisbeth Siddens, Trevor Fish and Brittany
Packard is also gratefully acknowledged.
Page 21
at Pennsylvania State University on Septem
ber 16, 2016http://toxsci.oxfordjournals.org/
Dow
nloaded from

LITERATURE CITED
Abdellatif, A., Prest, V., Taper, H. and Roberfroid, M. (1991). The modulation of rat liver
carcinogenesis by perfluorooctanoic acid, a peroxisome proliferator. Toxicol. Appl.
Pharmacol. 111, 530-537.
Bailey, G. S., Williams, D. E. and Hendricks, J. D. (1996). Fish models for environmental
carcinogenesis: the rainbow trout. Environ. Health Perspect. 104 Suppl 1, 5-21.
Benninghoff, A. D., Bisson, W. H., Koch, D. C., Ehresman, D. J., Kolluri, S. K. and Williams,
D. E. (2011). Estrogen-like activity of perfluoroalkyl acids in vivo and interaction with
human and rainbow trout estrogen receptors in vitro. Toxicol. Sci. 120, 42-58.
Benninghoff, A. D. and Williams, D. E. (2008). Identification of a transcriptional fingerprint of
estrogen exposure in rainbow trout liver. Toxicol. Sci. 101, 65-80.
Brandsma, S. H., Smithwick, M., Solomon, K., Small, J., de Boer, J. and Muir, D. C. (2011).
Dietary exposure of rainbow trout to 8:2 and 10:2 fluorotelomer alcohols and
perfluorooctanesulfonamide: Uptake, transformation and elimination. Chemosphere 82, 253-
8.
Calafat, A. M., Wong, L. Y., Kuklenyik, Z., Reidy, J. A. and Needham, L. L. (2007).
Polyfluoroalkyl chemicals in the U.S. population: data from the National Health and
Nutrition Examination Survey (NHANES) 2003-2004 and comparisons with NHANES
1999-2000. Environ. Health Perspect. 115, 1596-602.
D'eon, J. C. and Mabury, S. A. (2011). Exploring indirect sources of human exposure to
perfluoroalkyl carboxylates (PFCAs): evaluating uptake, elimination, and biotransformation
Page 22
at Pennsylvania State University on Septem
ber 16, 2016http://toxsci.oxfordjournals.org/
Dow
nloaded from

of polyfluoroalkyl phosphate esters (PAPs) in the rat. Environ. Health Perspect. 119, 344-
50.
Du, Z., Zhou, X., Ling, Y., Zhang, Z. and Su, Z. (2010). agriGO: a GO analysis toolkit for the
agricultural community. Nucleic Acids Res 38, W64-70.
Fromme, H., Tittlemier, S. A., Volkel, W., Wilhelm, M. and Twardella, D. (2009).
Perfluorinated compounds--exposure assessment for the general population in Western
countries. Int. J. Hyg. Environ. Health 212, 239-70.
Guruge, K. S., Yeung, L. W., Yamanaka, N., Miyazaki, S., Lam, P. K., Giesy, J. P., Jones, P. D.
and Yamashita, N. (2006). Gene expression profiles in rat liver treated with
perfluorooctanoic acid (PFOA). Toxicol. Sci. 89, 93-107.
Hanhijarvi, H., Ylinen, M., Haaranen, T. and Nevalainen, T. (1988). A proposed species
difference in the renal excretion of perfluorooctanoic acid in the beagle dog and rat (A. C.
Beynen and H. A. Solleveld, Eds.), pp. 409-412. Martinus Nijhoff Publishers, Dordrecht,
Netherlands.
Hendricks, J. D., Meyers, T. R. and Shelton, D. W. (1984). Histological progression of hepatic
neoplasia in rainbow trout (Salmo gairdneri). Natl. Cancer Inst. Monogr. 65, 321-36.
Hendricks, J. D., Shelton, D. W., Loveland, P. M., Pereira, C. B. and Bailey, G. S. (1995).
Carcinogenicity of dietary dimethylnitrosomorpholine, N-methyl-N'-nitro-N-
nitrosoguanidine, and dibromoethane in rainbow trout. Toxicol. Pathol. 23, 447-57.
Holden, P. R. and Tugwood, J. D. (1999). Peroxisome proliferator-activated receptor alpha: role
in rodent liver cancer and species differences. J. Mol. Endocrinol. 22, 1-8.
Hu, W., Jones, P. D., Celius, T. and Giesy, J. P. (2005). Identification of genes responsive to
PFOS using gene expression profiling. Environ. Toxicol. Pharmacol. 19, 57-70.
Page 23
at Pennsylvania State University on Septem
ber 16, 2016http://toxsci.oxfordjournals.org/
Dow
nloaded from

Ishibashi, H., Yamauchi, R., Matsuoka, M., Kim, J. W., Hirano, M., Yamaguchi, A., Tominaga,
N. and Arizono, K. (2008). Fluorotelomer alcohols induce hepatic vitellogenin through
activation of the estrogen receptor in male medaka (Oryzias latipes). Chemosphere 71,
1853-9.
Ito, Y., Yamanoshita, O., Asaeda, N., Tagawa, Y., Lee, C. H., Aoyama, T., Ichihara, G.,
Furuhashi, K., Kamijima, M., Gonzalez, F. J. and Nakajima, T. (2007). Di(2-
ethylhexyl)phthalate induces hepatic tumorigenesis through a peroxisome proliferator-
activated receptor alpha-independent pathway. J. Occup. Health 49, 172-82.
Kannan, K., Corsolini, S., Falandysz, J., Fillmann, G., Kumar, K. S., Loganathan, B. G., Mohd,
M. A., Olivero, J., Van Wouwe, N., Yang, J. H. and Aldoust, K. M. (2004).
Perfluorooctanesulfonate and related fluorochemicals in human blood from several
countries. Environ. Sci. Technol. 38, 4489-95.
Lai, D. Y. (2004). Rodent carcinogenicity of peroxisome proliferators and issues on human
relevance. J. Environ. Sci. Health, Pt. C 22, 37-55.
Lau, C., Anitole, K., Hodes, C., Lai, D., Pfahles-Hutchens, A. and Seed, J. (2007). Perfluoroalkyl
acids: a review of monitoring and toxicological findings. Toxicol. Sci. 99, 366-94.
Lee, B. C., Hendricks, J. D. and Bailey, G. S. (1991). Toxicity of mycotoxins in the feed of fish
(J. E. Smith, Eds.), pp. 607-626. CRC Press, Boca Raton.
Liu, C., Du, Y. and Zhou, B. (2007). Evaluation of estrogenic activities and mechanism of action
of perfluorinated chemicals determined by vitellogenin induction in primary cultured tilapia
hepatocytes. Aquat. Toxicol. 85, 267-77.
Liu, H., Hu, Z. Z., Zhang, J. and Wu, C. (2006). BioThesaurus: a web-based thesaurus of protein
and gene names. Bioinformatics 22, 103-5.
Page 24
at Pennsylvania State University on Septem
ber 16, 2016http://toxsci.oxfordjournals.org/
Dow
nloaded from
Maras, M., Vanparys, C., Muylle, F., Robbens, J., Berger, U., Barber, J. L., Blust, R. and De
Coen, W. (2006). Estrogen-like properties of fluorotelomer alcohols as revealed by mcf-7
breast cancer cell proliferation. Environ. Health Perspect. 114, 100-5.
Martin, J. W., Mabury, S. A., Solomon, K. R. and Muir, D. C. (2003a). Bioconcentration and
tissue distribution of perfluorinated acids in rainbow trout (Oncorhynchus mykiss). Environ.
Toxicol. Chem. 22, 196-204.
Martin, J. W., Mabury, S. A., Solomon, K. R. and Muir, D. C. (2003b). Dietary accumulation of
perfluorinated acids in juvenile rainbow trout (Oncorhynchus mykiss). Environ. Toxicol.
Chem. 22, 189-95.
Martin, J. W., Smithwick, M. M., Braune, B. M., Hoekstra, P. F., Muir, D. C. and Mabury, S. A.
(2004). Identification of long-chain perfluorinated acids in biota from the Canadian Arctic.
Environ. Sci. Technol. 38, 373-80.
Olsen, G. W., Burris, J. M., Ehresman, D. J., Froehlich, J. W., Seacat, A. M., Butenhoff, J. L.
and Zobel, L. R. (2007). Half-life of serum elimination of perfluorooctanesulfonate,
perfluorohexanesulfonate, and perfluorooctanoate in retired fluorochemical production
workers. Environ. Health Perspect. 115, 1298-305.
Olsen, G. W., Church, T. R., Miller, J. P., Burris, J. M., Hansen, K. J., Lundberg, J. K.,
Armitage, J. B., Herron, R. M., Medhdizadehkashi, Z., Nobiletti, J. B., O'Neill, E. M.,
Mandel, J. H. and Zobel, L. R. (2003). Perfluorooctanesulfonate and other fluorochemicals
in the serum of American Red Cross adult blood donors. Environ. Health Perspect. 111,
1892-901.
Palmer, C. N., Hsu, M. H., Griffin, K. J., Raucy, J. L. and Johnson, E. F. (1998). Peroxisome
proliferator activated receptor-alpha expression in human liver. Mol. Pharmacol. 53, 14-22.
Page 25
at Pennsylvania State University on Septem
ber 16, 2016http://toxsci.oxfordjournals.org/
Dow
nloaded from

Saeed, A. I., Sharov, V., White, J., Li, J., Liang, W., Bhagabati, N., Braisted, J., Klapa, M.,
Currier, T., Thiagarajan, M., Sturn, A., Snuffin, M., Rezantsev, A., Popov, D., Ryltsov, A.,
Kostukovich, E., Borisovsky, I., Liu, Z., Vinsavich, A., Trush, V. and Quackenbush, J.
(2003). TM4: a free, open-source system for microarray data management and analysis.
Biotechniques 34, 374-8.
Sherif, K. (1999). Benefits and risks of oral contraceptives. Am. J. Obstet. Gynecol. 180, S343-8.
Sun, B. and Karin, M. (2008). NF-kappaB signaling, liver disease and hepatoprotective agents.
Oncogene 27, 6228-44.
Tilton, S., Gerwick, L., Hendricks, J., Rosato, C., Corley-Smith, G., Givan, S., Bailey, G.,
Bayne, C. and Wililams, D. (2005). Use of a rainbow trout oligonucleotide microarray to
determine transcriptional patterns in aflatoxin B1-induced hepatocellular carcinoma
compared to adjacent liver. Toxicol. Sci. 88, 319-330.
Tilton, S. C., Givan, S. A., Pereira, C. B., Bailey, G. S. and Williams, D. E. (2006).
Toxicogenomic profiling of the hepatic tumor promoters indole-3-carbinol, 17β-estradiol
and β-naphthoflavone in rainbow trout. Toxicol. Sci. 90, 61-72.
Tilton, S. C., Orner, G. A., Benninghoff, A. D., Carpenter, H. M., Hendricks, J. D., Pereira, C. B.
and Williams, D. E. (2008). Genomic profiling reveals an alternate mechanism for hepatic
tumor promotion by perfluorooctanoic acid in rainbow trout. Environ. Health Perspect. 116,
1047-55.
Vainer, G. W., Pikarsky, E. and Ben-Neriah, Y. (2008). Contradictory functions of NF-kappaB
in liver physiology and cancer. Cancer Lett. 267, 182-8.
Page 26
at Pennsylvania State University on Septem
ber 16, 2016http://toxsci.oxfordjournals.org/
Dow
nloaded from

Wei, Y., Dai, J., Liu, M., Wang, J., Xu, M., Zha, J. and Wang, Z. (2007). Estrogen-like
properties of perfluorooctanoic acid as revealed by expressing hepatic estrogen-responsive
genes in rare minnows (Gobiocypris rarus). Environ. Toxicol. Chem. 26, 2440-7.
Wei, Y., Shi, X., Zhang, H., Wang, J., Zhou, B. and Dai, J. (2009). Combined effects of
polyfluorinated and perfluorinated compounds on primary cultured hepatocytes from rare
minnow (Gobiocypris rarus) using toxicogenomic analysis. Aquat Toxicol 95, 27-36.
Weinstein, J. N. (2004). Integromic analysis of the NCI-60 cancer cell lines. Breast Dis 19, 11-
22.
Zeeberg, B. R., Qin, H., Narasimhan, S., Sunshine, M., Cao, H., Kane, D. W., Reimers, M.,
Stephens, R. M., Bryant, D., Burt, S. K., Elnekave, E., Hari, D. M., Wynn, T. A.,
Cunningham-Rundles, C., Stewart, D. M., Nelson, D. and Weinstein, J. N. (2005). High-
Throughput GoMiner, an 'industrial-strength' integrative gene ontology tool for
interpretation of multiple-microarray experiments, with application to studies of Common
Variable Immune Deficiency (CVID). BMC Bioinformatics 6, 168.
Page 27
at Pennsylvania State University on Septem
ber 16, 2016http://toxsci.oxfordjournals.org/
Dow
nloaded from

Table 1. Impact of dietary PFCs on AFB1-induced liver carcinogenesis
Tumor class (%)b
Treatment a Incidence (%) HCA HCC MA MC CCA CCC
Initiated at 10 weeks
Sham/CON 0 0 0 0 0 0 0
Sham/E2 7* 0 58 0 33 8 0
Sham/PFOA 0 0 0 0 0 0 0
Sham/PFNA 0 0 0 0 0 0 0
Sham/PFDA 5 0 0 0 100 0 0
Sham/FtOH 0 0 0 0 0 0 0
Sham/CLOF 1 0 0 0 100 0 0
AFB1/CON 13 26 23 2 47 0 2
AFB1/E2 83#### 6 22 4 65 1 2
AFB1/PFOA 62## 10 27 1 54 4 5
AFB1/PFNA 72#### 5 17 0 68 3 8
AFB1/PFDA 88#### 7 24 1 63 1 4
AFB1/FtOH 23 12 29 3 52 2 2
AFB1/CLOF 15 11 29 6 41 5 8
Initiated at 15 weeks
Sham/CON 0 0 0 0 0 0 0
Sham/PFOS 0 0 0 0 0 0 0
AFB1/CON 1 0 29 0 71 0 0
AFB1/PFOS 13†† 5 10 5 68 3 10 a Treatment groups are indicated as initiation/diet (see Methods for complete details). b Abbreviations: HCA, hepatocellular adenoma; HCC, hepatocellular carcinoma; MA, mixed
adenoma; MC, mixed carcinoma; CCA, cholangiocellular adenoma; CCC, cholangiocellular
carcinoma.
*, p < 0.05 compared to Sham/CON; ##, p < 0.01; ####, p<0.0001compared to AFB1/CON; ††,
p<0.01 compared to AFB1/CON (15 weeks) as determined by logistic regression analysis.
Page 28
at Pennsylvania State University on Septem
ber 16, 2016http://toxsci.oxfordjournals.org/
Dow
nloaded from

Table 2. Impact of dietary PFCs on MNNG-induced multi-organ carcinogenesis
Incidence (%) Liver tumor class b
Treatment a Stomach Kidney SB Liver HCA HCC MA MCC CCA CCC
Sham/CON 0 0 0 0 0 0 0 0 0 0
MNNG/CON 99 37 45 51 25 28 3 39 2 3
MNNG/E2 99 49 51 97**** 33 13 1 51 1 1
MNNG/PFOA 99 29 34 86**** 26 11 4 55 3 1 a Treatment groups are indicated as initiation/diet (see Methods for complete details). b Abbreviations: SB, swimbladder; HCA, hepatocellular adenoma; HCC, hepatocellular
carcinoma; MA, mixed adenoma; MC, mixed carcinoma; CCA, cholangiocellular adenoma;
CCC, cholangiocellular carcinoma.
****, p<0.0001 compared to MNNG
Page 29
at Pennsylvania State University on Septem
ber 16, 2016http://toxsci.oxfordjournals.org/
Dow
nloaded from

FIGURE LEGENDS
Figure 1. Perfluoroalkyls increase liver tumor incidence, multiplicity and size in AFB1-
and MNNG-initiated trout. (A-C) Liver tumor incidence and multiplicity (males and females).
(D-F) Average liver tumor size ± SE. Trout were initiated with 10 ppm AFB1 at 10 (A, D) or 15
weeks of age (B, E) or with 35 ppm MNNG at 10 weeks (C, F). Details on experimental diets
are provided in Methods. **, p < 0.01 and ****, p < 0.0001, significant difference in tumor
incidence compared to CON diet (within each initiation group) as determined by logistic
regression analysis (complete results in Supplemental Tables 2-3). #, p < 0.05 and ###, p <
0.001, significant difference in tumor multiplicity or size compared to CON diet (within each
initiation group) as determined by the Kruskal-Wallis test with Dunnett’s post-hoc test for
multiple comparisons. A color version of this figure is available in the online version of the
article.
Figure 2. Venn diagrams depicting overlap of differentially regulated genes among
experimental treatments. The total number of genes differentially regulated induced by the
experimental treatment is indicated for each intersection. A color version of this figure is
available in the online version of the article.
Figure 3. Dietary exposure to PFAAs induces an estrogen-like hepatic gene expression
profile in trout. (A) Pairwise correlation of hepatic gene expression profiles. Values shown are
the log2 geometric mean of fold change for each array feature ± SE (n = 3). Pearson correlation
coefficients (r) are indicated for each comparison, and overlay lines indicate results of least-
squares linear regression analysis. A color version of this figure is available in the online version
of this article. (B) Principal components analysis (PCA) on experimental condition. PC1 and
PC2 are shown and account for 57.9% and 9.6% of experiment variance, respectively. Symbols
Page 30
at Pennsylvania State University on Septem
ber 16, 2016http://toxsci.oxfordjournals.org/
Dow
nloaded from

represent biological replicates (n = 3), and dashed circles represent overlap, or lack thereof,
among treatment groups. A color version of this figure is available in the online version of the
article.
Figure 4. Bi-directional hierarchical clustering of gene expression data and Cluster Image
Maps (CIM) showing impact of treatment diet on enrichment of biological process GO
terms. (A) Unsupervised bi-directional hierarchical cluster analysis. The heat map shows
expression data (geometric mean of Log2 values, n = 3) for genes differentially regulated two-
fold up or down (p < 0.05 by Welch’s t-test) in at least one treatment group clustered by array
feature (top tree) and treatment (left tree). (B) Gene ontology enrichment analysis was performed
using GoMiner, and unsupervised cluster analyses of GO categories were performed using
CIMminer as described above. Scale bars represent the range of FDR-corrected p-values: orange
for biological process categories induced by experimental diets, blue for those repressed and
white for unchanged. The indicated numbers for GO term categories correspond to rows in
Supplemental Tables 7-8. A significant effect of dietary treatment on enrichment of the GO term
category (biological process) was inferred p < 0.05 as determined by a one-sided Fisher’s exact
test after false discovery rate (FDR) correction.
Page 31
at Pennsylvania State University on Septem
ber 16, 2016http://toxsci.oxfordjournals.org/
Dow
nloaded from

at Pennsylvania State University on Septem
ber 16, 2016http://toxsci.oxfordjournals.org/
Dow
nloaded from

at Pennsylvania State University on Septem
ber 16, 2016http://toxsci.oxfordjournals.org/
Dow
nloaded from

at Pennsylvania State University on Septem
ber 16, 2016http://toxsci.oxfordjournals.org/
Dow
nloaded from

at Pennsylvania State University on Septem
ber 16, 2016http://toxsci.oxfordjournals.org/
Dow
nloaded from

SUPPLEMENTAL MATERIALS
Promotion of Hepatocarcinogenesis by Perfluoroalkyl Acids in Rainbow Trout
Abby D. Benninghoff, Gayle A. Orner, Clarissa H. Buchner, Jerry D. Hendricks,
Aaron M. Duffy and David E. Williams
TABLE OF CONTENTS Page
Supplemental Tables
1. Primer set sequences for real-time RT-PCR validation of gene expression ..................... 2
2. Logistic regression analyses for experimental factors diet, sex, body
weight, replicate tank and symptoms of liver disease in AFB1-initiated trout ................. 3
3. Logistic regression analyses for experimental factors diet, sex, body weight,
replicate tank and symptoms of liver disease in MNNG-initiated trout .......................... 4
4. Summary of array data following application of selection filters for
significance, level of response and feature consistency .................................................. 5
5. Select genes differentially regulated by experimental diets in trout liver ........................ 6
6. Pearson correlation coefficients (r) for pair-wise comparisons by treatment group ....... 11
7. Over-represented Gene Ontology biological process annotations associated
with genes induced by the indicated dietary treatments ............................................... 12
8. Over-represented Gene Ontology biological process annotations associated
with genes repressed by the indicated dietary treatments .............................................. 13
Supplemental Figures
1. Chemical structures of compounds tested for promotion of hepatocarcinogenesis
in rainbow trout .......................................................................................................... 20
2. Outline of AFB1 and MNNG tumor studies in trout with dietary
polyfluorinated chemicals ........................................................................................... 21
3. Lack of effect of sex, experimental tank or idiopathic liver disease on
AFB1-induced liver carcinogenesis .............................................................................. 22
4. Impact of promotion diets on morphological parameters in trout ................................. 24
5. Lack of effect of sex, experimental tank or idiopathic liver disease on
MNNG-induced carcinogenesis .................................................................................. 25
6. Quality control analysis of array hybridization ............................................................ 26
7. Unsupervised bidirectional hierarchical cluster analysis of hepatic gene
expression profiles ....................................................................................................... 27
8. Directed acyclic graph for enriched GO terms associated with dietary E2 .................... 28
9. Directed acyclic graph (DAG) for selected enriched GO terms associated
with dietary PFNA ....................................................................................................... 29
10. Validation of treatment-induced changes in hepatic gene expression determined by
microarray analysis using qRT-PCR ........................................................................... 30
Supplemental References ....................................................................................................... 31
at Pennsylvania State University on Septem
ber 16, 2016http://toxsci.oxfordjournals.org/
Dow
nloaded from

Benninghoff, et al. Promotion of hepatocarcinogenesis by PFAAs
Page 2
SUPPLEMENTAL TABLES
Supplemental Table 1. Primer set sequences for real-time RT-PCR validation of gene expression
Gene name (symbol) Array feature Forward primer (5’ to 3’) Reverse primer (5’ to 3’) Size (bp) OAT (°C)f
Genes of interest
Alpha-3-macroglobulin (a2m) OmyOSU8 ACAAGGCTCGGGGAATACTT CTCCAGCATTGAAGCAGTGA 235 60
Cathepsin D (ctsd) a OmyOSU139 TCCACTATCCATCATCTACC AGATCAGTGCATTTCAACTC 272 56-58
Cytochrome P450 1A1 (cyp1a1) b,c OmyOSU396 TCAACTTACCTCTGCTGGAAGC GGTGAACGGCAGGAAGGA 85 60
Cytochrome P450 2K5 (cyp2k5) a OmyOSU1389 GTGTCAACTCTAATCTAGTGCCC CCGTCCCTGATTGAAGTGAC 368 58-60
Hemopexin (hpx) OmyOSU699 GCAGCAGAAGCAAAACATCA CAGCACATTCAGAGGGACAA 161 55
Prostaglandin D synthase (pgds) a OmyOSU1395 CATAATGGGAGTTCTGCTGTG TGGGATGTCAGTCTTCTTGG 293 57
Trout c-polysaccharide binding protein
(tcpbp) e OmyOSU1478 GGCCAAAGGAGACATCGTTT TCCCAACCTACACCCTGACC 155 62-64
Thioredoxin (thx) OmyOSU1422 TCCCAACAGCATTGCTCTAA CCATGCCTCTAAATCCTCCA 122 55
Vitellogenin (vtg1) e OmyOSU203 TTGCCTTTGCCAACATCGAC CGGACATTGACGTATGCTTT 238 54
Genes for normalization
β-actin (actb) a OmyOSU205 GTGCGGGATTATATCATTTACCCT CCACGTAGCTGTCTTTCTGG 221 58-60
Glyceraldehyde-3-phosphate
dehydrogenase (gapdh) a
OmyOSU229 CCAACCAAACGCTACCGAAC CCAGATTCCATCTCACCTT 173 60
DNA topoisomerase 2 (top2a) OmyOSU1644 CTGCAGCAGTCCCTCACTT CAAAGAAATCCCTCAGCACA 100 55
ATP synthase subunit beta (atp5b) OmyOSU1585 GCCCATGGTGGTTACTCTGT AGGTGTCGTCCTTCAGGTTG 112 55
a Benninghoff and Williams (2008).
b Primer pair does not surround the sequence for the corresponding 70mer oligonucleotide on the OSUrbt array. c Rees and Li (2004). d Mortensen et al. (2006). e Tilton et al. (2006). f Measured optimal annealing temperature (OAT).
at Pennsylvania State University on Septem
ber 16, 2016http://toxsci.oxfordjournals.org/
Dow
nloaded from
Benninghoff, et al. Promotion of hepatocarcinogenesis by PFAAs
Page 3
Supplemental Table 2. Logistic regression analyses for experimental factors diet, sex, body weight,
replicate tank and symptoms of liver disease in AFB1-initiated trout
All subjects a Final subjects
a
Treatment Factor p-Value OR (95% CI) p-Value OR (95% CI)
AFB1/E2 Diet <0.0001 34.0 (10.3 - 112) <0.0001 26.4 (7.61 - 91.6)
Sex 0.4478 0.82 (0.49 - 1.38) 0.4407 0.08 (0.44 - 1.44)
Body weight 0.0027 1.02 (1.01 - 1.03) 0.0046 1.02 (1.01 - 1.03)
Replicate tank 0.7710 1.08 (0.63 - 1.87) 0.2238 1.47 (0.79 - 2.72)
Liver disease symptoms 0.0923 0.52 (0.24 - 1.11)
AFB1/PFOA Diet <0.0001 25.1 (7.94 - 79.5) 0.0014 27. 3 (3.57 - 209) Sex 0.2148 0.73 (0.44 - 1.20) 0.5655 0.78 (0.33 - 1.84)
Body weight 0.0010 1.02 (1.01 - 1.03) 0.0384 1.01 (1.00 - 1.02)
Replicate tank 0.5498 0.86 (0.53 - 1.41) 0.3298 0.66 (0.29 - 1.52)
Liver disease symptoms 0.4167 1.45 (0.59 - 3.54)
AFB1/PFNA Diet <0.0001 26.0 (7.09 - 95.1) <0.0001 24.2 (5.96 - 98.2)
Sex 0.6675 0.88 (0.50 - 1.57) 0.4457 0.78 (0.14 - 1.49)
Body weight 0.0003 1.02 (1.01 - 1.03) 0.0002 1.02 (1.01 - 1.03)
Replicate tank 0.8392 1.06 (0.60 - 1.87) 0.4507 1.29 (0.67 - 2.46)
Liver disease symptoms 0.7215 1.15 (0.54 - 2.47)
AFB1/PFDA Diet <0.0001 41.7 (9.52 - 182) <0.0001 34.0 (6.89 - 168)
Sex 0.7178 0.88 (0.44 - 1.75) 0.9424 0.97 (0.45 - 2.10) Body weight 0.0102 1.01 (1.00 - 1.02) 0.0186 1.01 (1.00 - 1.03)
Replicate tank 0.7750 1.11 (0.56 - 2.20) 0.3806 1.45 (0.63 - 3.34)
Liver disease symptoms 0.9061 1.06 (0.42 - 2.69)
AFB1/8:2FtOH Diet 0.1652 2.34 (0.70 - 7.78) 0.5649 1.51 (0.37 - 6.11)
Sex 0.9379 1.02 (0.62 - 1.69) 0.5693 1.18 (0.66 - 2.12)
Body weight <0.0001 1.02 (1.01 - 1.03) <0.0001 1.02 (1.01 - 1.03)
Replicate tank 0.8213 1.06 (0.62 - 1.82) 0.4806 1.25 (0.67 - 2.31)
Liver disease symptoms 0.0064 2.43 (1.28 - 4.61)
AFB1/CLOF Diet 0.8866 0.92 (0.27 - 3.11) 0.3397 0.51 (0.13 - 2.05)
Sex 0.0428 0.55 (0.31 - 0.98) 0.2793 0.71 (0.38 - 1.32)
Body weight 0.0003 1.01 (1.01 - 1.02) 0.0016 1.01 (1.01 - 1.02)
Replicate tank 0.3261 1.32 (0.76 - 2.31) 0.1199 1.65 (0.88 - 3.12) Liver disease symptoms 0.0195 2.27 (1.14 - 4.53)
AFB1/PFOS
(15 wks)
Diet 0.0025 19.2 (2.83 - 131) 0.0014 27.3 (3.57 - 209)
Sex 0.9021 0.95 (0.42 - 2.12) 0.5655 0.78 (0.33 - 1.84)
Body weight 0.0559 1.01 (1.00 - 1.02) 0.0384 1.01 (1.00 - 1.02)
Replicate tank 0.3349 0.68 (0.31 - 1.50) 0.3298 0.66 (0.29 - 1.52)
Liver disease symptoms 0.9054 1.10 (0.23 - 5.17) a Logistic regression analysis was performed including all experimental subjects to determine the impact of five
experimental factors on liver tumor outcome in AFB1-initiated trout; all comparisons were made compared to the
AFB1/CON treatment group, except for the PFOS treatment which was compared to AFB1(15wk)/CON. Firth’s bias
correction was used as the likelihood penalty when a maximum likelihood estimate was not obtained. Chi-square P-
values and odds ratios (OR) with 95% confidence intervals (CI) are shown. A significant effect of the indicated
experimental factor was inferred when p<0.05. b Logistic regression analyses were performed as before, but subjects with symptoms of idiopathic liver disease were
excluded; thus, only four experimental factors were evaluated.
at Pennsylvania State University on Septem
ber 16, 2016http://toxsci.oxfordjournals.org/
Dow
nloaded from

Benninghoff, et al. Promotion of hepatocarcinogenesis by PFAAs
Page 4
Supplemental Table 3. Logistic regression analyses for experimental factors diet, sex, body weight, replicate tank and symptoms of liver disease in
MNNG-initiated trout
Liver tumors c
Kidney tumors c
Stomach tumors c
Swim bladder tumors c
Treatment
Factor p-Value OR (95% CI) p-Value OR (95% CI) p-Value OR (95% CI) p-Value OR (95% CI)
Including all subjects a
MNNG/E2 Diet <0.0001 17.7 (4.98 – 62.6) 0.1946 2.00 (0.70 - 5.70) 0.0512 190 (0.97 - ∞) 0.0134 3.76 (1.32 - 10.7)
Sex 0.0861 1.58 (0.94 – 2.68) 0.7165 1.09 (0.70 - 1.70) 0.5341 1.74 (0.30 - 9.93) 0.0079 1.84 (1.17 - 2.88) Body weight 0.1702 1.01 (1.00 - 1.01) 0.3607 1.00 (1.00 - 1.01) 0.4075 0.99 (0.97 - 1.01) 0.0044 1.01 (1.00 - 1.02) Tank 0.6588 0.88 (0.50 – 1.56) 0.3450 0.80 (0.49 - 1.28) 0.0523 0.07 (0.01 - 1.03) 0.0139 0.55 (0.34 - 0.89) Liver disease symptoms 0.1007 0.58 (0.30 – 1.11) 0.0201 0.51 (0.29 - 0.90) 0.2097 0.25 (0.03 - 2.21) 0.3785 1.28 (0.74 - 2.22)
MNNG/PFOA Diet <0.0001 17.1 (5.04 - 57.9) 0.8457 0.90 (0.30 - 2.68) 0.3915 0.13 (0.00 - 14.4) <0.0001 12.3 (3.92 -38.4) Sex 0.5145 1.18 (0.71 - 1.97) 0.8797 1.04 (0.65 - 1.66) 0.2572 3.65 (0.39 - 34.4) 0.5430 1.42 (0.88 - 2.31)
Body weight 0.1001 1.01 (1.00 - 1.01) 0.1867 1.01 (1.00 - 1.01) 0.5701 0.99 (0.97 - 1.02) 0.0005 1.01 (1.01 - 1.02) Tank 0.2723 0.75 (0.44 - 1.26) 0.8432 0.95 (0.59 - 1.55) 0.8590 1.18 (0.18 - 7.60) <0.0001 0.29 (0.17 - 0.47)
Liver disease symptoms 0.3296 0.70 (0.34 - 1.44) 0.7962 0.92 (0.48 - 1.75) 0.1657 0.18 (0.02 - 2.04) 0.1813 1.58 (0.81 - 3.06)
Final subjects b
MNNG/E2 Diet <0.0001 18.9 (4.37 – 82.2) 0.1127 2.58 (0.80 – 8.36) 0.3497 14.0 (0.06 - ∞) 0.0083 5.05 (1.52 – 16.8) Sex 0.2360 1.47 (0.78 – 2.77) 0.7898 1.07 (0.64 - 1.79) 0.7729 1.33 (0.20 – 8.94) 0.0857 1.58 (0.94 – 2.67) Body weight 0.1525 1.01 (1.00 – 1.02) 0.7820 1.00 (0.99 – 1.01) 0.5054 0.99 (0.97 - 1.02) 0.0677 1.01 (1.00 - 1.02) Tank 0.9725 0.99 (0.52 – 1.88) 0.3355 0.78 (0.46 – 1.30) 0.3316 0.28 (0.02 – 3.64) 0.0230 0.55 (0.33 – 0.92)
MNNG/PFOA Diet <0.0001 17.0 (4.47 – 64.4) 0.4424 0.63 (0.19 – 2.07) 0.3163 0.05 (0.00 – 18.5) <0.0001 12.47 (3.59 – 43.4) Sex 0.8812 0.96 (0.54 – 1.69) 0.8380 0.95 (0.56 – 1.61) 0.5522 2.11 (0.18 – 24.7) 0.5034 1.20 (0.70 – 2.07)
Body weight 0.0213 1.01 (1.00 – 1.02) 0.7580 1.00 (0.99 - 1.01) 0.2675 0.98 (0.95 - 1.01) 0.0074 1.01 (1.00 – 1.02) Tank 0.5656 0.85 (0.48 – 1.50) 0.7980 1.07 (0.63 – 1.83) 0.4622 2.56 (0.21 – 31.4) <0.0001 0.28 (0.17 – 0.50) a Logistic regression analysis was performed including all experimental subjects to determine the impact of five experimental factors on liver tumor outcome in
MNNG-initiated trout; all comparisons were made compared to the MNNG/CON treatment group. Firth’s bias correction was used as the likelihood penalty
when a maximum likelihood estimate was not obtained. b Logistic regression analyses were performed as before, but subjects with symptoms of idiopathic liver disease were excluded; thus, only four experimental
factors were evaluated. c Chi-square P-values and odds ratios (OR) with 95% confidence intervals (CI) are shown. A significant effect of the indicated experimental factor was inferred
when p<0.05.
at Pennsylvania State University on Septem
ber 16, 2016http://toxsci.oxfordjournals.org/
Dow
nloaded from

Benninghoff, et al. Promotion of hepatocarcinogenesis by PFAAs
Page 5
Supplemental Table 4. Summary of array data following application of selection filters
for significance, level of response and feature consistency
Number of features passing indicated criterion
Treatment
Welch’s
t-test a
Mean 2-fold
change b
Spot
consistency c
All
criteria d
Portion of array
differentially regulated (%)
CON N/A 3 0 0 0 E2 266 103 107 60 3.8
PFOA 205 109 118 88 5.3
PFNA 342 266 241 175 10.8 PFDA 230 139 132 91 5.6
PFOS 204 115 73 44 2.8
8:2FtOH 99 35 33 26 1.7
CLOF 101 21 21 5 0.30 a Number of array features that were identified as significantly regulated by the Welch’s t-test (p <
0.05) when comparing each experimental treatment to CON (n = 3). b Number of array features for which a minimum 2-fold change in the geometric mean of expression
values was observed. c Number of array features for which 9 out of 10 spots (including all technical and biological
replicates) were differentially regulated >1.5-fold. d Number of array features that passed all filtering criteria.
at Pennsylvania State University on Septem
ber 16, 2016http://toxsci.oxfordjournals.org/
Dow
nloaded from
Benninghoff, et al. Promotion of hepatocarcinogenesis by PFAAs
Page 6
Supplemental Table 5. Select genes differentially regulated by experimental diets in trout liver. Mean log2 fold-change in gene expression by treatment
b
Array ID DFCI ID a
Gene name (accession number; species)
Symbol CON E2 PFOA PFNA PFDA PFOS FTOH CLOF
Liver-specific proteins (vitellogenesis)
OmyOSU208 TC132491 Vitellogenin (Q92093; Oncorhynchus mykiss) c vtg1 -0.27 6.07* 6.61* 6.22* 6.07* 5.62* 5.83* -0.12
OmyOSU1552 BX306977 Vitelline Envelope Protein gamma (Q9I9M6; O. mykiss) veg -0.26 5.79* 5.78* 5.22* 5.67* 4.87* 4.40* 0.11
OmyOSU1540 TC133595 Vitelline Envelope Protein alpha (Q9I9M8; O. mykiss) vepa -0.21 5.76* 5.84* 5.27* 5.74* 5.39* 5.11* 0.49
OmyOSU1542 TC169120 Zona radiata structural protein (Q90XC3; O. mykiss) zrp -0.02 5.73* 5.38* 5.41* 5.75* 5.38* 4.92* 0.70
Cell proliferation (cell signaling, regulation of transcription, cell growth and apoptosis)
OmyOSU244 NP543968 Estrogen receptor beta (P57782; O. mykiss) esr2 -0.27 5.53* 6.41* 5.49 5.66* 3.75* 4.79* 0.01
OmyOSU1015 RTL00033 Inhibitor of NFκB subunit alpha (Q4G3H4; Danio rerio) c ikk1 -0.01 4.72* 5.15* 4.67 4.22* 3.67* 2.79* 0.30
OmyOSU127 TC146408 Nuclear factor NF-kappa-B p105 subunit (A3FJ60; Siniperca chuatsi)
nfkb1 -0.50 3.78* 3.75* 4.20* 2.78* 2.77* 2.27* 0.07
OmyOSU212 TC138144 TATA box binding protein (C0HA61; Salmo salar) tbp -0.39 2.97* 2.81* 3.48* 3.10* 1.16 1.45 -0.07
OmyOSU151 TC162795 Estrogen receptor alpha (P16058; O. mykiss) c esr1 0.20 2.46* 3.62* 2.94* 3.04* 2.18* 1.85* 0.85
OmyOSU1667 TC169305 Poly A binding protein, cytoplasmic 1 b (Q6P3L1; D. rerio) pabpc1b 0.04 1.59* 1.73* 2.01* 1.43 0.93 0.38 0.08
OmyOSU1191 TC146689 NF-kappa-B inhibitor epsilon (B5X3Y7; S. salar) ikbe 0.09 1.42* 0.83 1.31* 1.06 0.16 0.41 0.11
OmyOSU1484 TC150787 Tryptophanyl-tRNA synthetase (Q28BU4; Xenopus tropicalis)
wars -0.07 0.81 0.38 2.04* 0.85 0.22 0.24 0.41
OmyOSU1615 TC141666 Transmembrane 4 superfamily member protein (Q9DFD3; O. mykiss)
tm4sf 0.09 0.73 0.50 1.58* 0.98 0.12 -0.05 0.22
OmyOSU803 BX079929 Growth arrest and DNA-damage-inducible, beta (C1BER7; O. mykiss)
ga45b -0.12 0.43 0.39 1.92* 1.04 -0.33 -0.11 -0.18
OmyOSU1428 TC143767 Reticulon RTN9-A1 (Q6IEJ0; O. mykiss) rtn9-a1 -0.01 0.03 1.71 1.21 1.00 0.47 0.53 0.42
OmyOSU1427 TC140351 Reticulon RTN9-A2 (Q6IEI9; O. mykiss) rtn9-a2 -0.06 0.42 1.12 0.68 0.79 0.06 0.18 0.18 OmyOSU1669 NP814796 Tumor necrosis factor receptor associated factor 2 (Q7T2X2;
O. mykiss) traf2 0.08 -0.37 -1.57* -1.61* -1.67* -0.65 -0.06 -0.05
OmyOSU387 TC156633 Allograft inflammatory factor 1 (B5XGK1; S. salar) aif1 0.23 -0.70 -1.07 -2.72* -1.59* -0.12 -0.39 -0.28
OmyOSU725 CA379375 Putative hepatocyte growth factor activator (Q9DFD4; O. mykiss)
hgfac -0.01 -1.29 -0.80 -1.58* -1.19* 0.17 -0.39 -0.11
OmyOSU313 TC132515 Bone morphogenetic protein-7 (Q5BN41; O. mykiss) bmp7 0.07 -1.35* -1.34* -1.84* -0.98 -0.54 0.16 0.27
OmyOSU916 NP544392 Mixed lineage leukemia-like protein (Q9PT21; O. mykiss) mll 0.01 -1.61* -1.46* -2.52* -1.84* -0.34 -0.45 -0.16
Protein stability and transport
OmyOSU893 TC145126 Heat shock protein 90 (P87397; Oncorhynchus tshawytscha) hsp90 0.19 2.58* 3.61* 3.37* 2.37 1.20 1.17* 0.64
OmyOSU139 TC150271 Cathepsin D (P87370; O. mykiss) ctsd -0.17 1.99* 1.44* 1.88* 1.29* 0.98 0.28 0.05
OmyOSU1308 TC164544 Protein transport protein Sec61 α subunit isoform B (Q98SN8; O. mykiss) c
sec61ab 0.16 1.89* 1.14* 1.59* 1.20* 0.50 0.42 0.82
OmyOSU859 TC145413 Heat shock protein 47 (Q5DW60; O. mykiss) hsp47 0.22 1.11* 0.28 1.91* 0.38 0.39 0.34 0.31
OmyOSU1602 TC160913 Coatomer subunit epsilon (C1BG73; O. mykiss) cope 0.06 0.97 0.39 1.17* 0.71 0.02 0.34 0.26
at Pennsylvania State University on Septem
ber 16, 2016http://toxsci.oxfordjournals.org/
Dow
nloaded from

Benninghoff, et al. Promotion of hepatocarcinogenesis by PFAAs
Page 7
Supplemental Table 5. Select genes differentially regulated by experimental diets in trout liver. Mean log2 fold-change in gene expression by treatment
b
Array ID DFCI ID a
Gene name (accession number; species)
Symbol CON E2 PFOA PFNA PFDA PFOS FTOH CLOF
OmyOSU85 TC132785 Proteasome subunit beta type (B5XAY5; S. salar) psb7 0.32 0.52 0.74 1.43* 1.03* 0.61 0.49 0.40
OmyOSU861 TC161889 60 kDa Heat shock protein, mitochondrial (C0HBF1; S. salar) ch60 0.16 0.32 0.20 1.78* 0.52 1.14* 0.62 0.17
OmyOSU216 BX315865 40S Ribosomal protein S11 (Q9DF27; S. salar) rs11 -0.28 0.21 0.71 1.09* 0.35 -0.10 -0.15 -0.01
OmyOSU910 TC132590 Proteasome subunit beta type 9 precursor (Q9PT26; O. mykiss)
psmb9 -0.24 -0.11 0.51 1.37* 0.16 -0.20 -0.09 0.37
OmyOSU1042 BX879214 Ubiquitin B (B9EQM0; S. salar) ubb -0.17 -0.13 0.13 0.13 0.34 1.09* 0.16 1.02*
Phase I and II metabolism
OmyOSU1380 TC150232 Cytochrome P450 2k1 (Q92090; O. mykiss) c cyp2k1 0.15 1.41 3.68* 3.27* 3.04 3.11 0.25 0.81
OmyOSU754 TC146311 Microsomal glutathione S-transferase (C1BFV1; O. mykiss) mgst 0.16 -0.10 0.23 1.39 0.58 1.01* 1.89* 1.27
OmyOSU396 TC158463 Cytochrome P450 1a1 (Q92110; O. mykiss) c cyp1a1 0.43 -0.26 -1.58* -2.44* -0.59 -0.07 -0.42 -0.35
OmyOSU993 TC147595 Glutathione S-transferase Mu 3 (C1BZU6; Esox lucius) gstm3 0.22 -0.27 -0.48 -2.47* -0.89 -0.66 0.10 -0.28
OmyOSU1134 TC143007 Cytosolic sulfotransferase 2 (B5X695; S. salar) st2s2 0.04 -0.31 0.48 -0.15 0.39 1.19* 0.23 0.48
OmyOSU1203 BX306987 Microsomal glutathione S-transferase 1 (C1BM45; Osmerus mordax)
gst1 0.25 -0.34 0.01 -1.62* -0.46 0.14 0.59 0.40
OmyOSU1507 BX085479 Glutathione S-transferase (Q9W647; Oncorhynchus nerka) gstp1 0.25 -0.35 -0.32 0.05 -0.45 0.07 1.19* 0.65
OmyOSU829 BX085279 Carbonyl reductase (Q9PT38; O. mykiss) cbr1 -0.06 -0.35 0.53 0.31 0.24 1.26* 1.20* 0.94
OmyOSU115 BX310129 Glutathione S-transferase P (B5XC10; S. salar) gstp1 0.21 -0.36 -0.12 -0.63 -0.29 -0.25 3.03* 0.20
OmyOSU398 TC139996 Cytochrome P450 3a27 (O42563; O. mykiss) c cyp3a27 0.06 -0.96 0.58 0.58 -0.27 2.07* -0.05 0.69
OmyOSU356 TC150068 Cytochrome P450 2j24 (Q5TZ75; D. rerio) cyp2j24 -0.08 -1.24* -0.55 -2.32* -1.07* 0.59 -0.04 0.04
OmyOSU460 TC134882 3-Oxo-5-beta-steroid 4-dehydrogenase (B9EMZ1; S. salar) ark1d1 -0.15 -1.41 -1.94* -3.74* -1.75* -0.23 -0.18 -0.47
OmyOSU1389 TC133687 Cytochrome P450 2k5 (Q9IAT1; O. mykiss) c cyp2k5 -0.10 -1.58* 1.39* 0.15 0.76 2.82* -0.08 1.67*
OmyOSU392 CB491885 Cytochrome P450 2m1 (Q92088; O. mykiss) c cyp2m1 0.19 -1.77* -2.27* -2.61* -1.42* -0.08 0.16 0.10
Redox regulation
OmyOSU245 TC152739 Succinate dehydrogenase complex subunit A flavoprotein (B5DFZ8; S. salar)
sdha 0.22 1.98 1.88 1.88 2.62 1.26 1.15 0.36
OmyOSU238 TC147716 Glutathione peroxidase (D2CKK9; D. rerio) gpx4a 0.08 1.21 1.61 2.29 2.22 0.03 0.57 0.14
OmyOSU1490 TC135270 Cytochrome c oxidase subunit 3 (P69218; O. nerka) cox3 -0.18 1.20 1.49 1.75 1.26 0.40 0.16 0.02
OmyOSU32 TC132824 Glutathione peroxidase (B5RI90; S. salar) gpx4b -0.07 0.32 0.40 1.08 0.36 0.07 -0.11 0.16
OmyOSU55 TC143718 Peroxiredoxin-5, mitochondrial (B5X5Q6; S. salar) prdx5 0.42 0.26 0.69 1.56 0.89 0.36 0.60 0.92
OmyOSU1633 CA373161 Cytochrome C-1 (Q3B7R0; D. rerio) cyc1 0.10 0.23 0.48 1.72 0.84 0.45 0.08 0.20
OmyOSU92 BX074038 Cu/Zn-superoxide dismutase (C1BFL3; O. mykiss) sod1 0.29 0.21 0.50 1.01 0.46 0.07 -0.03 0.33
OmyOSU572 TC156955 Cytochrome c oxidase polypeptide Via (O13085; O. mykiss) coxa 0.12 0.05 0.03 -1.86 -0.46 0.16 -0.09 0.20
OmyOSU566 CU068081 Peroxisomal carnitine O-octanoyltransferase (Q503F8; D. rerio)
crot -0.14 -0.02 0.20 -0.29 -0.24 0.31 -0.18 -0.11
at Pennsylvania State University on Septem
ber 16, 2016http://toxsci.oxfordjournals.org/
Dow
nloaded from

Benninghoff, et al. Promotion of hepatocarcinogenesis by PFAAs
Page 8
Supplemental Table 5. Select genes differentially regulated by experimental diets in trout liver. Mean log2 fold-change in gene expression by treatment
b
Array ID DFCI ID a
Gene name (accession number; species)
Symbol CON E2 PFOA PFNA PFDA PFOS FTOH CLOF
OmyOSU325 TC146929 Acetyl-CoA acetyltransferase, mitochondrial (Q6AZA0; D. rerio)
acat1 -0.22 -0.03 -0.10 -0.20 -0.04 0.22 -0.25 -0.13
OmyOSU1422 TC147703 Thioredoxin (C1BH85; O. mykiss) trx -0.68 -0.41 -0.07 2.48 0.27 0.59 1.54 0.34
OmyOSU37 TC141467 Catalase (C0HAV1; S. salar) cat 0.04 -0.75 -0.76 -1.38 -1.00 0.02 -0.07 -0.23
Extracellular matrix and vascularization factors
OmyOSU1557 TC135220 Secreted protein acidic and rich in cysteine protein (Q9YGD9; O. mykiss)
sparc -0.03 -0.79 -0.68 -1.21* -0.18 -0.52 -0.31 -0.28
OmyOSU419 CA356156 Angiogenin (B5XAZ0; S. salar) ang1 -0.23 -1.44* -1.70* -1.95* -1.50* 0.03 -0.28 0.11
Immune response
OmyOSU1564 TC140147 VHSV4 (Q8QGB4; O. mykiss) vhsv4 0.04 5.62* 6.32* 5.57* 6.11* 4.90* 4.26* -0.13
OmyOSU1566 TC132651 VHSV6 (Q8QGB2; O. mykiss) vhsv6 0.15 3.88* 3.90* 3.36* 3.78* 1.92* 1.93 0.02
OmyOSU582 TC167667 P-selectin (B5X3V6 ; S. salar) lyam3 0.18 1.65* 0.99 0.99 0.62 0.55 -0.13 0.54
OmyOSU1590 TC132541 VHSV-induced protein 2 (Q9DD73; O. mykiss) vhsv2 -0.16 0.83 0.58 1.08* 0.30 0.13 -0.17 0.10
OmyOSU148 TC161751 Differentially regulated trout protein 1 (Q9DFD5; O. mykiss)c drtp1 -0.04 0.71 0.16 4.02* 2.55 -0.56 0.33 0.40
OmyOSU634 TC162804 CD209-like protein (Q64HY2; O. mykiss) cd209 0.09 0.67 -0.12 1.12* 0.67 0.46 0.34 0.07
OmyOSU15 BX311693 Complement component C3-3 (Q98977; O. mykiss) c3-3 0.20 -0.06 -1.24* -2.39* -0.94 -0.15 -0.07 -0.81
OmyOSU44 BX306395 Complement component C3-4 (Q9DDV9; O. mykiss) c3-4 0.08 -0.10 -1.39* -2.60* -0.92 0.08 -0.18 -0.84
OmyOSU411 BX882784 Complement C9 (Q4QZ25; O. mykiss) c9 0.14 -0.13 -0.39 -1.18* -0.20 -0.08 0.09 -0.10
OmyOSU348 TC149604 CD59-like protein (B5X604; S. salar) cd59 0.41 -0.14 -1.52* -1.61* -1.31* -2.19* -0.11 -0.94
OmyOSU371 TC159535 C1q-like adipose specific protein (Q8JI26; Salvelinus fontinalis)
c1q -0.18 -0.29 -1.54 -2.67* -1.84* -0.04 -0.25 -0.97
OmyOSU1147 TC152823 Pentraxin (P79899; O. mykiss) c ptx -0.08 -0.41 -2.97* -2.60* -1.51* -0.32 0.01 -0.13
OmyOSU638 TC137183 C-type mannose-binding lectin (Q8JJ68; O. mykiss) mbl-1 -0.17 -0.51 -1.21* -1.49* -1.56* -0.58 -0.36 -0.41
OmyOSU636 TC138355 C-type MBL-2 protein (Q4LAN6; O. mykiss) mbl 0.23 -0.54 -1.35* -1.49* -1.68 -0.88 -0.21 -0.16
OmyOSU34 TC141865 C1 inhibitor (Q70W32; O. mykiss) c1 inh 0.03 -0.58 -0.55 -1.33* -0.42 0.34 -0.13 0.11
OmyOSU76 TC132971 Complement receptor-like protein 1 (Q2PDG0; O. mykiss) crlp1 -0.05 -0.67 -0.86 -1.21* -0.75 -0.14 -0.12 0.34
OmyOSU1426 TC142005 Complement factor H protein (Q4QZ18; O. mykiss) cfh 0.11 -0.74 -0.26 -1.09* -0.76 0.23 -0.10 0.26
OmyOSU1469 TC167824 Cathepsin S (C0HDJ6; S. salar) cats -0.09 -0.96 -1.87 -4.59* -1.69* -0.08 -0.48 -0.03
OmyOSU878 CA383049 Chemotaxin (Q9DFJ1; O. mykiss) ctx -0.08 -1.16* -2.04* 4.00* -0.13 -0.71 0.48 0.76
OmyOSU866 TC148069 Hemagglutinin/amebocyte aggregation factor (B5XF94; S. salar)
haaf 0.06 -1.31* -2.00* -1.87* -1.80 -0.89 -0.41 -1.62
OmyOSU1 CA347121 CD80-like protein (A1IMH7; O. mykiss) cd80 -0.18 -1.95 -1.73* -3.75* -2.37* -0.35 -0.45 -0.71
OmyOSU1477 TC139517 Trout C-polysaccharide binding protein 1 (Q9DFE5; O. mykiss) c
tcpbp 0.55 -2.11* -2.60* -3.66* -2.48* 0.36 -0.69 0.21
at Pennsylvania State University on Septem
ber 16, 2016http://toxsci.oxfordjournals.org/
Dow
nloaded from

Benninghoff, et al. Promotion of hepatocarcinogenesis by PFAAs
Page 9
Supplemental Table 5. Select genes differentially regulated by experimental diets in trout liver. Mean log2 fold-change in gene expression by treatment
b
Array ID DFCI ID a
Gene name (accession number; species)
Symbol CON E2 PFOA PFNA PFDA PFOS FTOH CLOF
Blood factors and coagulation
OmyOSU723 TC138894 Plasminogen (Q5DVP8; O. mykiss) plg 0.04 -0.34 -0.16 -1.05* -0.50 0.44 -0.23 -0.06
OmyOSU90 TC157215 Beta-2-glycoprotein 1 (C0H7U1; S. salar) apoh 0.03 -0.57 -0.70 -1.11* -0.66 -0.09 -0.18 -0.30
OmyOSU649 TC145770 Coagulation factor VIII (Q804W6; Takifugu rubripes) c f8 0.11 -0.62 -0.44 -1.71* -0.93 -0.02 -0.25 0.17
OmyOSU665 TC149137 Alpha-globin I (Q98973; O. mykiss) hbaa1 0.07 -0.65 -0.86 -1.72* -0.59 -0.94 -0.20 -0.27
OmyOSU775 TC139629 Protein C (Q7T3B6; D. rerio) proc -0.25 -0.68 -0.23 -1.07* -0.51 0.41 -0.31 -0.19
OmyOSU1338 TC143725 Antithrombin (Q9PTA8; S. salar) c at 0.12 -0.70 -0.52 -1.25* -0.78 0.37 -0.29 -0.09
OmyOSU667 CU064560 Hemoglobin subunit alpha-1 (Q98974; O. mykiss) hba1 0.26 -0.72 -1.32* -2.74* -1.72* -1.08 0.09 -0.23
OmyOSU219 TC135277 Complement factor Bf-1 (Q9YGE7; O. mykiss) cfb1 -0.15 -0.72 -1.21* -1.85* -1.24* 0.20 -0.22 -0.03
OmyOSU355 TC172297 Serum albumin 1 (P21848; S. salar) c alb1 0.06 -0.76 -0.71 -3.48* -1.86* -0.07 -0.24 0.00
OmyOSU677 TC151435 Fibrinogen (Q9DFD8; O. mykiss) fgg 0.16 -1.07* -1.08* -0.49 -1.10* -0.14 -0.26 -0.16
OmyOSU8 TC164674 Alpha 2 macroglobulin (C1K6P9; Perca flavescens) c a2m 0.13 -1.19 -1.10* -2.67* -1.30* 0.05 -0.22 -0.42
OmyOSU1502 TC132862 Tissue factor (Q90W13; O. mykiss) f3a 0.68 -1.49 -1.14 -2.26* -1.75* 0.17 -0.59 0.03
Lipid and cholesterol, metabolism and transport
OmyOSU449 TC151125 Apolipoprotein B (C3UZW7; P. flavescens) apob 0.03 1.17* -0.21 0.27 0.60 0.55 0.33 -0.26
OmyOSU721 TC145590 Fatty acid binding protein, heart (O13008; O. mykiss) fabp3 0.09 1.07* 1.50* 0.40 1.21* 0.45 0.23 0.88
OmyOSU153 TC162807 Fatty acid binding protein (Q9DFE6; O. mykiss) fabp 0.27 0.88 2.53* 4.83* 3.57* -1.02 -0.48 0.35
OmyOSU904 TC132457 Lipoprotein lipase (Q9W6Y2; O. mykiss) lpl 0.00 -0.77 -0.57 -1.24* -0.87 0.00 -0.26 -0.27
OmyOSU908 TC148996 Epidermis-type lipoxygenase 3 (B5X0R4 ; S. salar) loxe3 0.04 -0.82 -1.08* -2.11* -1.36* -0.12 -0.29 -0.40
OmyOSU453 BX073289 Apolipoprotein A-I-1 (O57523; O. mykiss) apo-AI-1 -0.09 -1.05* -1.37* -0.83 -1.01 -0.02 -0.42 -0.05
OmyOSU1652 TC161762 Apolipoprotein E (Q9PT02; O. mykiss) c apoE -0.17 -1.36 -1.61* 0.00 -1.43* 0.11 -0.46 -0.40
Ion binding and transport
OmyOSU1020 TC165296 Metallothionein B (P68501; O. mykiss) c mt-b -0.32 1.18* 1.23* 3.29* 1.34* 0.88 1.33* 0.82
OmyOSU846 TC147024 Transferrin (Q9PT13; O. mykiss) c tf 0.05 -0.23 -0.98 -2.72* -0.61 0.23 0.09 0.25
OmyOSU657 TC169785 Haptoglobin 1 (Q9DFG1; O. mykiss) c hp1 -0.15 -0.41 -0.82 -1.60* -0.04 -0.04 0.06 -0.20
OmyOSU685 BX073517 Ferritin (P79823; O. mykiss) c ft -0.29 -1.20* -1.78* -1.11* -1.56* -0.96 -0.22 -0.31
OmyOSU699 TC169206 Hemopexin (P79825; O. mykiss) hpx -0.24 -1.99* -2.08* -3.28* -2.50* -0.57 -0.78 -0.90
Glycolysis and carbohydrate metabolism
OmyOSU1241 TC152596 6-Phosphofructokinase type C (C0HAA0; S. salar) k6pp -0.09 2.43* 0.91 1.72* 1.69 -0.25 -0.05 -0.02
OmyOSU875 CU072064 Glucokinase (O93314; O. mykiss) gk -0.27 2.32* 1.10 0.98 -0.81 2.30* -0.30 -0.10
OmyOSU1149 TC132998 Phosphoenolpyruvate carboxykinase (Q98T97; O. mykiss) pck 0.04 -0.12 -0.68 -1.30* -0.63 0.33 0.18 0.05
OmyOSU116 TC150193 Phosphorylase (C0PUK4; S. salar) pygm 0.31 -0.75 -0.75 -1.69* -0.76 0.35 -0.04 -0.05
at Pennsylvania State University on Septem
ber 16, 2016http://toxsci.oxfordjournals.org/
Dow
nloaded from

Benninghoff, et al. Promotion of hepatocarcinogenesis by PFAAs
Page 10
Supplemental Table 5. Select genes differentially regulated by experimental diets in trout liver. Mean log2 fold-change in gene expression by treatment
b
Array ID DFCI ID a
Gene name (accession number; species)
Symbol CON E2 PFOA PFNA PFDA PFOS FTOH CLOF
Nucleoside Metabolism
OmyOSU252 TC152774 Hypoxanthine phosphoribosyltransferase 1 (Q7ZV49; D. rerio)
hprt1 0.28 2.50 2.04 2.22 2.45 1.16 0.43 0.20
OmyOSU1518 TC171662 Uridine phophorylase (B5X227; S. salar) upp1 -0.04 2.53 2.32 2.23 2.08 1.01 1.08 0.03
Miscellaneous
OmyOSU343 TC141079 Biotinidase (Q8AV84; T. rubripes) btd -0.13 -2.41 -2.57 -3.58 -2.44 -0.72 -0.24 -0.04
a Manual array feature annotation was performed by querying the DFCI R.trout Gene Index (http://compbio.dfci.harvard.edu/tgi/) for the closest EST match to the array 70-mer
sequence. Matching EST sequences were then BLASTX queried in the NCBI genome database. The top hit (lowest E-score) was selected as the matching gene. If an EST had no
significant (E-value <10-6) BLASTX hit, then the most significant BLASTN hit is shown. b Log2 geometric mean fold change values are shown (N = 3) and represent background corrected, ratio-centered and Lowess-normalized signal ratios. Values in bold and marked
with an asterisk are considered statistically significant (P ≤ 0.05 by Welch’s t-test) and passed all stringency criteria. Color scales are provided to indicate visually the similarities
or differences in gene expression among treatment groups (red, induced; green, repressed; white, no change). c Unique array features targeted the same gene in some cases, though a single representative array feature is shown in this table.
at Pennsylvania State University on Septem
ber 16, 2016http://toxsci.oxfordjournals.org/
Dow
nloaded from

Benninghoff, et al. Promotion of hepatocarcinogenesis by PFAAs
Page 11
Supplemental Table 6. Pearson correlation coefficients (r) for pair-wise
comparisons by treatment group.
PFOA PFNA PFDA PFOS FtOH CLOF
Differentially regulated genes a
E2 0.93 0.84 0.93 0.78 0.83 0.30
PFOA 0.86 0.95 0.82 0.82 0.39
PFNA 0.91 0.66 0.73 0.45
PFDA 0.78 0.83 0.41
PFOS 0.83 0.42
8:2FtOH 0.30
All array features
E2 0.85 0.75 0.83 0.61 0.50 0.25
PFOA 0.73 0.83 0.62 0.68 0.27
PFNA 0.83 0.53 0.61 0.40
PFDA 0.63 0.74 0.38
PFOS 0.70 0.46
8:2FtOH 0.35
a Correlation analysis were performed using a data subset including OSUrbt array features that
were determined to be significantly differentially regulated in any one of the experimental
treatments.
at Pennsylvania State University on Septem
ber 16, 2016http://toxsci.oxfordjournals.org/
Dow
nloaded from

Benninghoff, et al. Promotion of hepatocarcinogenesis by PFAAs
Page 12
Suppl. Table 7. Over-represented Gene Ontology biological process annotations associated with genes induced by the indicated dietary treatmentsa
E2 PFOA PFNA PFDA PFOS 8:2FtOH CLOF
# b
Accession Biological Process E FDR E FDR E FDR E FDR E FDR E FDR E FDR
1 GO:0032355 response to estradiol stimulus 178.6 0.030 202.4 <0.001 86.7 0.040 151.8 <0.001 189.8 0.040 303.6 <0.001 1518.0 0.210
2 GO:0030520 estrogen receptor signaling pathway 259.8 0.020 294.4 <0.001 126.2 0.030 220.8 <0.001 276.0 <0.001 441.6 <0.001 2208.0 0.220
3 GO:0006914 autophagy 75.2 0.080 85.2 0.027 36.5 0.073 63.9 0.048 39.9 0.165 0.0 0.996 0.0 0.982
4 GO:0046651 lymphocyte proliferation 14.9 0.352 0.0 0.976 21.7 0.040 12.7 0.360 31.6 0.071 0.0 0.905 0.0 0.584
5 GO:0070661 leukocyte proliferation 14.4 0.352 0.0 0.997 21.0 0.031 12.3 0.358 30.7 0.065 0.0 1.000 0.0 0.999
6 GO:0032943 mononuclear cell proliferation 14.4 0.352 0.0 0.997 21.0 0.031 12.3 0.358 30.7 0.065 0.0 1.000 0.0 0.999
7 GO:0032602 chemokine production 0.0 0.965 0.0 0.974 40.8 0.306 0.0 0.958 178.6 0.027 0.0 0.988 0.0 0.985
8 GO:0009719 response to endogenous stimulus 18.2 0.073 13.7 0.308 8.8 0.250 15.4 0.056 19.3 0.025 20.6 0.455 102.9 0.503
9 GO:0010033 response to organic substance 11.5 0.060 6.5 0.386 5.6 0.248 7.4 0.206 12.3 0.015 9.8 0.656 49.1 0.528
10 GO:0001816 cytokine production 7.9 0.379 8.9 0.481 7.7 0.309 6.7 0.399 25.2 0.020 0.0 0.999 0.0 0.994
11 GO:0001818 negative regulation of cytokine production 47.6 0.325 54.0 0.377 23.1 0.338 40.5 0.291 101.2 0.020 0.0 0.995 0.0 0.978
12 GO:0030522 intracellular receptor-mediated signaling pathway
32.8 0.151 37.2 0.193 16.0 0.261 27.9 0.095 34.9 0.071 55.8 0.031 279.2 0.362
13 GO:0048545 response to steroid hormone stimulus 37.6 0.068 42.6 0.069 18.3 0.254 32.0 0.105 39.9 0.039 63.9 0.030 319.6 0.382
14 GO:0030518 steroid hormone receptor signaling
pathway
43.3 0.051 49.1 0.050 21.0 0.188 36.8 0.051 46.0 0.033 73.6 0.032 368.0 0.375
15 GO:0043627 response to estrogen stimulus 64.9 0.068 73.6 0.030 31.5 0.090 55.2 0.051 69.0 0.027 110.4 0.013 552.0 0.390
16 GO:0009410 response to xenobiotic stimulus 55.0 0.063 62.3 0.028 26.7 0.110 46.7 0.063 58.4 0.026 93.4 0.035 467.1 0.363
a Gene ontology enrichment analysis was performed using High Throughput GoMiner. A significant enrichment of the GO term category was inferred when p<0.05 as determined by a one-sided Fisher’s exact test after false discovery rate (FDR) correction. Significantly enriched GO terms are indicated in bold with yellow or orange highlight. b Number (#) corresponds to position in Cluster Image Map presented in Figure 4. Abbreviations: E, enrichment value; FDR, false discovery rate-corrected p-value.
at Pennsylvania State University on Septem
ber 16, 2016http://toxsci.oxfordjournals.org/
Dow
nloaded from

Benninghoff, et al. Promotion of hepatocarcinogenesis by PFAAs
Page 13
Suppl. Table 8. Over-represented Gene Ontology biological process annotations associated with genes repressed by the indicated dietary treatmentsa
E2 PFOA PFNA PFDA PFOS 8:2FtOH CLOF
#b
Accession Biological Process E FDR E FDR E FDR E FDR E FDR E FDR E FDR
1 GO:0002440 production of molecular mediator of immune response 32 0.236 55 0.007 25 0.020 55 0.008 0 1.000 0 0.998 0 1.000
2 GO:0009967 positive regulation of signal transduction 12 0.172 16 0.008 10 0.010 16 0.008 0 0.999 9 0.557 0 1.000
3 GO:0010647 positive regulation of cell communication 12 0.173 15 0.009 9 0.012 15 0.010 0 1.000 8 0.548 0 1.000
4 GO:0031347 regulation of defense response 30 0.056 40 0.002 18 0.008 40 0.002 0 0.999 0 0.995 0 1.000
5 GO:0002700 regulation of production of molecular mediator of immune response
51 0.205 89 0.006 41 0.012 89 0.004 0 1.001 0 0.981 0 1.000
6 GO:0032623 interleukin-2 production 58 0.199 101 0.005 46 0.012 101 0.004 0 0.996 0 0.992 0 1.000
7 GO:0010033 response to organic substance 7 0.239 12 0.006 7 0.009 12 0.005 0 0.999 10 0.456 0 1.000
8 GO:0032663 regulation of interleukin-2 production 64 0.186 112 0.004 51 0.009 112 0.003 0 1.000 0 0.994 0 1.000
9 GO:0048583 regulation of response to stimulus 13 0.047 23 0.000 16 0.000 23 0.000 0 0.999 0 0.992 0 1.000
10 GO:0002526 acute inflammatory response 36 0.046 47 0.001 43 0.000 47 0.002 0 0.965 0 0.769 0 1.000
11 GO:0002250 adaptive immune response 32 0.045 43 0.002 26 0.000 43 0.002 0 1.000 0 0.995 0 1.000
12 GO:0002460 adaptive immune response based on somatic recombination of immune receptors built from immunoglobulin superfamily
domains
33 0.046 43 0.002 26 0.000 43 0.002 0 1.000 0 1.000 0 1.000
13 GO:0002702 positive regulation of production of molecular mediator of immune response
173 0.130 304 0.001 139 0.002 304 0.003 0 0.985 0 0.971 0 1.000
14 GO:0048584 positive regulation of response to stimulus 16 0.132 29 0.001 20 0.000 29 0.003 0 1.000 0 0.973 0 1.000
15 GO:0002253 activation of immune response 18 0.296 48 0.001 37 0.000 48 0.002 0 1.000 0 0.997 0 1.000
16 GO:0050778 positive regulation of immune response 28 0.070 48 0.000 33 0.000 48 0.002 0 0.976 0 0.834 0 1.000
17 GO:0002252 immune effector process 19 0.112 33 0.000 22 0.000 33 0.002 0 1.000 0 0.980 0 1.000
18 GO:0045087 innate immune response 18 0.112 24 0.006 18 0.000 24 0.004 0 1.000 0 0.998 0 1.000
19 GO:0002699 positive regulation of immune effector process 53 0.205 92 0.006 63 0.000 92 0.004 0 1.000 0 0.995 0 1.000
20 GO:0002824 positive regulation of adaptive immune response based on somatic recombination of immune receptors built from immunoglobulin superfamily domains
75 0.176 132 0.004 91 0.000 132 0.004 0 1.000 0 0.990 0 1.000
21 GO:0002705 positive regulation of leukocyte mediated immunity 67 0.185 117 0.004 80 0.000 117 0.003 0 1.000 0 1.000 0 1.000
22 GO:0002708 positive regulation of lymphocyte mediated immunity 67 0.185 117 0.004 80 0.000 117 0.003 0 1.000 0 1.000 0 1.000
23 GO:0006954 inflammatory response 10 0.198 17 0.003 13 0.000 21 0.003 0 1.000 0 0.998 0 1.000
24 GO:0002821 positive regulation of adaptive immune response 72 0.180 127 0.004 87 0.000 127 0.004 0 0.995 0 0.990 0 1.000
25 GO:0051605 protein maturation by peptide bond cleavage 23 0.273 40 0.010 37 0.000 40 0.011 0 1.000 0 0.999 0 1.000
26 GO:0002703 regulation of leukocyte mediated immunity 36 0.223 63 0.007 43 0.001 63 0.007 0 1.000 0 0.998 0 1.000
at Pennsylvania State University on Septem
ber 16, 2016http://toxsci.oxfordjournals.org/
Dow
nloaded from

Benninghoff, et al. Promotion of hepatocarcinogenesis by PFAAs
Page 14
Suppl. Table 8. Over-represented Gene Ontology biological process annotations associated with genes repressed by the indicated dietary treatmentsa
E2 PFOA PFNA PFDA PFOS 8:2FtOH CLOF
#b
Accession Biological Process E FDR E FDR E FDR E FDR E FDR E FDR E FDR
27 GO:0006956 complement activation 39 0.219 69 0.006 63 0.000 69 0.007 0 1.000 0 0.973 0 1.000
28 GO:0002706 regulation of lymphocyte mediated immunity 39 0.219 69 0.006 47 0.000 69 0.007 0 1.000 0 0.973 0 1.000
29 GO:0002541 activation of plasma proteins involved in acute inflammatory response
36 0.223 63 0.007 58 0.000 63 0.007 0 1.000 0 0.998 0 1.000
30 GO:0080134 regulation of response to stress 0 0.969 20 0.007 15 0.000 20 0.007 0 0.999 0 0.936 0 1.000
31 GO:0006826 iron ion transport 72 0.009 63 0.007 29 0.018 63 0.007 0 1.000 0 0.998 0 1.000
32 GO:0045088 regulation of innate immune response 89 0.007 78 0.006 36 0.015 78 0.006 0 1.000 0 1.000 0 1.000
33 GO:0050731 positive regulation of peptidyl-tyrosine phosphorylation 81 0.009 71 0.006 32 0.015 71 0.007 0 0.999 0 0.997 0 1.000
34 GO:0002682 regulation of immune system process 15 0.018 21 0.000 16 0.000 21 0.004 0 0.999 0 0.986 0 1.000
35 GO:0002697 regulation of immune effector process 42 0.018 56 0.001 34 0.000 56 0.002 0 1.000 0 1.000 0 1.000
36 GO:0006959 humoral immune response 40 0.018 53 0.001 40 0.000 53 0.002 0 0.999 0 0.992 0 1.000
37 GO:0000041 transition metal ion transport 55 0.000 48 0.001 22 0.005 48 0.002 258 0.773 0 0.997 0 1.000
38 GO:0030005 cellular di- tri-valent inorganic cation homeostasis 29 0.000 32 0.000 15 0.000 32 0.000 103 0.811 0 0.990 0 1.000
39 GO:0006879 cellular iron ion homeostasis 122 0.000 107 0.000 49 0.000 107 0.000 426 1.127 0 0.922 0 1.000
40 GO:0055072 iron ion homeostasis 0 0.976 100 0.000 46 0.000 100 0.000 398 0.880 0 0.995 0 1.000
41 GO:0002920 regulation of humoral immune response 434 0.000 380 0.001 173 0.001 380 0.003 0 1.000 0 0.980 0 1.000
42 GO:0055080 cation homeostasis 0 0.965 25 0.000 12 0.001 25 0.002 81 0.637 0 0.974 0 1.000
43 GO:0055066 di- tri-valent inorganic cation homeostasis 0 0.997 31 0.000 14 0.000 31 0.003 99 0.732 0 0.993 0 1.000
44 GO:0030003 cellular cation homeostasis 27 0.000 29 0.000 13 0.000 29 0.003 93 0.676 0 0.986 0 1.000
45 GO:0050801 ion homeostasis 17 0.005 18 0.000 8 0.004 18 0.002 58 0.591 0 0.995 0 1.000
46 GO:0006873 cellular ion homeostasis 19 0.007 20 0.000 9 0.003 20 0.003 65 0.666 0 0.986 0 1.000
47 GO:0055082 cellular chemical homeostasis 0 0.701 20 0.000 9 0.003 20 0.003 63 0.624 0 0.968 0 1.000
48 GO:0002684 positive regulation of immune system process 25 0.008 37 0.000 24 0.000 37 0.000 0 0.972 0 0.810 0 1.000
49 GO:0050776 regulation of immune response 27 0.008 40 0.000 26 0.000 40 0.000 0 0.999 0 0.970 0 1.000
50 GO:0002819 regulation of adaptive immune response 77 0.009 101 0.000 62 0.000 101 0.003 0 0.995 0 0.783 0 1.000
51 GO:0002822 regulation of adaptive immune response based on somatic
recombination of immune receptors built from immunoglobulin superfamily domains
79 0.009 104 0.000 63 0.000 104 0.003 0 1.000 0 0.973 0 1.000
52 GO:0001934 positive regulation of protein amino acid phosphorylation 43 0.018 37 0.011 17 0.062 37 0.012 0 0.987 0 0.990 0 1.000
53 GO:0050730 regulation of peptidyl-tyrosine phosphorylation 57 0.016 50 0.008 23 0.037 50 0.009 0 1.000 0 0.995 0 1.000
54 GO:0031399 regulation of protein modification process 25 0.008 22 0.006 10 0.037 22 0.006 0 0.976 0 0.992 0 1.000
at Pennsylvania State University on Septem
ber 16, 2016http://toxsci.oxfordjournals.org/
Dow
nloaded from

Benninghoff, et al. Promotion of hepatocarcinogenesis by PFAAs
Page 15
Suppl. Table 8. Over-represented Gene Ontology biological process annotations associated with genes repressed by the indicated dietary treatmentsa
E2 PFOA PFNA PFDA PFOS 8:2FtOH CLOF
#b
Accession Biological Process E FDR E FDR E FDR E FDR E FDR E FDR E FDR
55 GO:0010627 regulation of protein kinase cascade 7 0.368 13 0.066 9 0.049 13 0.070 0 0.973 10 0.525 0 1.000
56 GO:0002888 positive regulation of myeloid leukocyte mediated immunity 0 0.992 0 0.981 347 0.036 0 0.983 0 1.000 0 0.993 0 1.000
57 GO:0001796 regulation of type IIa hypersensitivity 0 0.992 0 0.981 347 0.036 0 0.983 0 1.000 0 0.993 0 1.000
58 GO:0008065 establishment of blood-nerve barrier 0 0.992 0 0.981 347 0.036 0 0.983 0 1.000 0 0.993 0 1.000
59 GO:0007597 blood coagulation intrinsic pathway 0 0.992 0 0.981 347 0.036 0 0.983 0 1.000 0 0.993 0 1.000
60 GO:0002445 type II hypersensitivity 0 0.992 0 0.981 347 0.036 0 0.983 0 1.000 0 0.993 0 1.000
61 GO:0034392 negative regulation of smooth muscle cell apoptosis 0 0.992 0 0.981 347 0.036 0 0.983 0 1.000 0 0.993 0 1.000
62 GO:0002892 regulation of type II hypersensitivity 0 0.992 0 0.981 347 0.036 0 0.983 0 1.000 0 0.993 0 1.000
63 GO:0002894 positive regulation of type II hypersensitivity 0 0.992 0 0.981 347 0.036 0 0.983 0 1.000 0 0.993 0 1.000
64 GO:0001794 type IIa hypersensitivity 0 0.992 0 0.981 347 0.036 0 0.983 0 1.000 0 0.993 0 1.000
65 GO:0001798 positive regulation of type IIa hypersensitivity 0 0.992 0 0.981 347 0.036 0 0.983 0 1.000 0 0.993 0 1.000
66 GO:0016064 immunoglobulin mediated immune response 26 0.257 23 0.112 21 0.038 23 0.118 0 0.999 0 0.997 0 1.000
67 GO:0045765 regulation of angiogenesis 0 0.947 0 0.789 22 0.037 0 0.797 0 1.000 0 0.997 0 1.000
68 GO:0051271 negative regulation of cell motion 0 0.994 25 0.108 23 0.037 25 0.113 0 1.000 0 1.000 0 1.000
69 GO:0051240 positive regulation of multicellular organismal process 10 0.341 17 0.052 12 0.017 17 0.055 0 1.000 0 0.998 0 1.000
70 GO:0010740 positive regulation of protein kinase cascade 11 0.336 19 0.050 13 0.015 19 0.052 0 0.997 0 0.834 0 1.000
71 GO:0046486 glycerolipid metabolic process 0 0.988 9 0.154 12 0.015 9 0.171 0 1.000 0 0.995 0 1.000
72 GO:0050818 regulation of coagulation 0 0.630 38 0.094 35 0.015 38 0.099 0 0.990 0 0.833 0 1.000
73 GO:0043542 endothelial cell migration 0 0.748 37 0.095 34 0.015 37 0.100 0 1.000 0 0.971 0 1.000
74 GO:0006953 acute-phase response 48 0.208 42 0.092 39 0.013 42 0.097 0 0.998 0 0.977 0 1.000
75 GO:0050819 negative regulation of coagulation 0 0.968 47 0.088 43 0.012 47 0.094 0 0.998 0 0.990 0 1.000
76 GO:0030193 regulation of blood coagulation 0 0.994 46 0.090 42 0.012 46 0.095 0 1.000 0 0.995 0 1.000
77 GO:0002455 humoral immune response mediated by circulating immunoglobulin
53 0.205 46 0.090 42 0.012 46 0.095 0 1.000 0 0.995 0 1.000
78 GO:0030336 negative regulation of cell migration 0 0.861 28 0.104 25 0.020 28 0.109 0 1.000 0 0.998 0 1.000
79 GO:0042440 pigment metabolic process 36 0.223 32 0.100 29 0.018 32 0.105 0 1.000 0 0.998 0 1.000
80 GO:0016525 negative regulation of angiogenesis 0 0.920 0 0.986 56 0.009 0 0.987 0 0.996 0 0.998 0 1.000
81 GO:0030195 negative regulation of blood coagulation 0 0.993 58 0.080 53 0.009 58 0.086 0 1.000 0 1.000 0 1.000
82 GO:0010594 regulation of endothelial cell migration 0 0.973 69 0.074 63 0.007 69 0.080 0 0.995 0 0.983 0 1.000
83 GO:0002889 regulation of immunoglobulin mediated immune response 83 0.173 72 0.073 66 0.007 72 0.079 0 1.000 0 0.995 0 1.000
at Pennsylvania State University on Septem
ber 16, 2016http://toxsci.oxfordjournals.org/
Dow
nloaded from

Benninghoff, et al. Promotion of hepatocarcinogenesis by PFAAs
Page 16
Suppl. Table 8. Over-represented Gene Ontology biological process annotations associated with genes repressed by the indicated dietary treatmentsa
E2 PFOA PFNA PFDA PFOS 8:2FtOH CLOF
#b
Accession Biological Process E FDR E FDR E FDR E FDR E FDR E FDR E FDR
84 GO:0002712 regulation of B cell mediated immunity 83 0.173 72 0.073 66 0.007 72 0.079 0 1.000 0 0.995 0 1.000
85 GO:0010596 negative regulation of endothelial cell migration 0 0.972 117 0.063 107 0.003 117 0.067 0 1.000 0 0.989 0 1.000
86 GO:0042730 fibrinolysis 0 0.970 0 0.953 77 0.004 0 0.955 0 1.000 0 0.981 0 1.000
87 GO:0042060 wound healing 8 0.359 14 0.061 13 0.003 14 0.065 0 1.000 0 0.973 0 1.000
88 GO:0002673 regulation of acute inflammatory response 108 0.159 95 0.067 87 0.003 95 0.072 0 1.000 0 0.919 0 1.000
89 GO:0020027 hemoglobin metabolic process 108 0.159 95 0.067 87 0.003 95 0.072 0 1.000 0 0.919 0 1.000
90 GO:0006957 complement activation alternative pathway 0 0.956 101 0.066 139 0.000 101 0.070 0 1.000 0 0.990 0 1.000
91 GO:0051918 negative regulation of fibrinolysis 0 0.979 0 0.945 278 0.000 0 0.948 0 0.999 0 0.986 0 1.000
92 GO:0006641 triglyceride metabolic process 0 0.943 36 0.097 50 0.000 36 0.101 0 1.000 0 0.997 0 1.000
93 GO:0051917 regulation of fibrinolysis 0 0.733 0 0.547 154 0.002 0 0.563 0 0.999 0 0.903 0 1.000
94 GO:0006639 acylglycerol metabolic process 0 0.880 32 0.100 44 0.001 32 0.104 0 0.994 0 0.997 0 1.000
95 GO:0018904 organic ether metabolic process 0 0.963 30 0.102 41 0.001 30 0.106 0 1.000 0 0.984 0 1.000
96 GO:0006638 neutral lipid metabolic process 0 0.990 32 0.100 43 0.001 32 0.105 0 1.000 0 0.998 0 1.000
97 GO:0006662 glycerol ether metabolic process 0 0.975 30 0.102 42 0.001 30 0.106 0 0.999 0 0.971 0 1.000
98 GO:0050878 regulation of body fluid levels 11 0.335 19 0.050 17 0.002 19 0.052 0 0.996 0 0.837 0 1.000
99 GO:0002714 positive regulation of B cell mediated immunity 217 0.114 190 0.052 173 0.001 190 0.055 0 1.000 0 0.980 0 1.000
100 GO:0002891 positive regulation of immunoglobulin mediated immune response
217 0.114 190 0.052 173 0.001 190 0.055 0 1.000 0 0.980 0 1.000
101 GO:0007599 hemostasis 13 0.325 23 0.042 21 0.001 23 0.044 0 1.000 0 0.972 0 1.000
102 GO:0032101 regulation of response to external stimulus 13 0.325 22 0.042 20 0.001 22 0.044 0 1.000 0 0.936 0 1.000
103 GO:0050817 coagulation 13 0.325 22 0.042 20 0.001 22 0.044 0 1.000 0 0.936 0 1.000
104 GO:0007596 blood coagulation 13 0.325 23 0.038 21 0.000 23 0.040 0 1.000 0 1.000 0 1.000
105 GO:0051604 protein maturation 14 0.326 24 0.039 28 0.000 24 0.041 0 0.999 0 0.934 0 1.000
106 GO:0002449 lymphocyte mediated immunity 17 0.304 30 0.026 21 0.006 30 0.025 0 1.000 0 0.984 0 1.000
107 GO:0016485 protein processing 15 0.316 27 0.032 31 0.000 27 0.034 0 0.999 0 0.992 0 1.000
108 GO:0002443 leukocyte mediated immunity 15 0.318 26 0.032 18 0.009 26 0.034 0 0.951 0 0.937 0 1.000
109 GO:0050727 regulation of inflammatory response 28 0.252 48 0.008 22 0.037 48 0.009 0 1.000 0 0.984 0 1.000
110 GO:0030162 regulation of proteolysis 35 0.225 62 0.007 14 0.213 62 0.007 0 0.989 0 0.994 0 1.000
111 GO:0019220 regulation of phosphate metabolic process 8 0.224 14 0.005 5 0.142 14 0.004 0 0.998 0 0.991 0 1.000
112 GO:0051174 regulation of phosphorus metabolic process 8 0.224 14 0.005 5 0.142 14 0.004 0 0.998 0 0.991 0 1.000
at Pennsylvania State University on Septem
ber 16, 2016http://toxsci.oxfordjournals.org/
Dow
nloaded from

Benninghoff, et al. Promotion of hepatocarcinogenesis by PFAAs
Page 17
Suppl. Table 8. Over-represented Gene Ontology biological process annotations associated with genes repressed by the indicated dietary treatmentsa
E2 PFOA PFNA PFDA PFOS 8:2FtOH CLOF
#b
Accession Biological Process E FDR E FDR E FDR E FDR E FDR E FDR E FDR
113 GO:0051247 positive regulation of protein metabolic process 18 0.125 24 0.006 7 0.151 24 0.004 0 0.946 0 0.984 0 1.000
114 GO:0032270 positive regulation of cellular protein metabolic process 19 0.113 25 0.005 8 0.147 25 0.004 0 1.000 0 0.996 0 1.000
115 GO:0042325 regulation of phosphorylation 8 0.220 14 0.004 5 0.135 14 0.003 0 0.998 0 0.986 0 1.000
116 GO:0050865 regulation of cell activation 11 0.330 30 0.003 9 0.123 30 0.003 0 1.000 0 0.999 0 1.000
117 GO:0031348 negative regulation of defense response 72 0.180 127 0.004 29 0.158 127 0.004 0 0.995 0 0.990 0 1.000
118 GO:0050870 positive regulation of T cell activation 26 0.259 45 0.009 20 0.050 45 0.010 0 1.000 0 0.986 0 1.000
119 GO:0051251 positive regulation of lymphocyte activation 21 0.281 37 0.010 17 0.062 37 0.013 0 1.000 0 1.000 0 1.000
120 GO:0042176 regulation of protein catabolic process 24 0.265 43 0.009 10 0.243 43 0.011 0 0.999 0 0.992 0 1.000
121 GO:0048585 negative regulation of response to stimulus 24 0.265 43 0.009 10 0.243 43 0.011 0 0.999 0 0.992 0 1.000
122 GO:0001869 negative regulation of complement activation lectin pathway 867 0.055 759 0.027 347 0.036 759 0.027 0 1.000 0 0.993 0 1.000
123 GO:0015886 heme transport 867 0.055 759 0.027 347 0.036 759 0.027 0 1.000 0 0.993 0 1.000
124 GO:0045627 positive regulation of T-helper 1 cell differentiation 867 0.055 759 0.027 347 0.036 759 0.027 0 1.000 0 0.993 0 1.000
125 GO:0060760 positive regulation of response to cytokine stimulus 0 0.997 759 0.027 347 0.036 759 0.027 0 1.000 0 0.993 0 1.000
126 GO:0001868 regulation of complement activation lectin pathway 867 0.055 759 0.027 347 0.036 759 0.027 0 1.000 0 0.993 0 1.000
127 GO:0002369 T cell cytokine production 0 0.993 253 0.048 116 0.082 253 0.049 0 1.000 0 0.992 0 1.000
128 GO:0032743 positive regulation of interleukin-2 production 0 0.993 253 0.048 116 0.082 253 0.049 0 1.000 0 0.992 0 1.000
129 GO:0010875 positive regulation of cholesterol efflux 0 0.993 253 0.048 0 0.967 253 0.049 0 1.000 0 0.992 0 1.000
130 GO:0032604 granulocyte macrophage colony-stimulating factor production 289 0.097 253 0.048 116 0.082 253 0.049 0 1.000 0 0.992 0 1.000
131 GO:0042253 granulocyte macrophage colony-stimulating factor biosynthetic process
289 0.097 253 0.048 116 0.082 253 0.049 0 1.000 0 0.992 0 1.000
132 GO:0002724 regulation of T cell cytokine production 0 0.993 253 0.048 116 0.082 253 0.049 0 1.000 0 0.992 0 1.000
133 GO:0010953 regulation of protein maturation by peptide bond cleavage 289 0.097 253 0.048 116 0.082 253 0.049 0 1.000 0 0.992 0 1.000
134 GO:0034447 very-low-density lipoprotein particle clearance 0 0.993 253 0.048 0 0.967 253 0.049 0 1.000 0 0.992 0 1.000
135 GO:0002694 regulation of leukocyte activation 12 0.328 21 0.048 10 0.120 21 0.048 0 1.000 0 0.983 0 1.000
136 GO:0009991 response to extracellular stimulus 12 0.329 21 0.048 10 0.123 21 0.048 166 0.728 0 1.000 0 1.000
137 GO:0032645 regulation of granulocyte macrophage colony-stimulating factor
production
347 0.083 304 0.042 139 0.072 304 0.044 0 0.999 0 0.986 0 1.000
138 GO:0002726 positive regulation of T cell cytokine production 0 0.979 304 0.042 139 0.072 304 0.044 0 0.999 0 0.986 0 1.000
139 GO:0045939 negative regulation of steroid metabolic process 0 0.979 304 0.042 0 0.997 304 0.044 0 0.999 0 0.986 0 1.000
140 GO:0030240 muscle thin filament assembly 0 0.979 304 0.042 139 0.072 304 0.044 0 0.999 0 0.986 0 1.000
at Pennsylvania State University on Septem
ber 16, 2016http://toxsci.oxfordjournals.org/
Dow
nloaded from

Benninghoff, et al. Promotion of hepatocarcinogenesis by PFAAs
Page 18
Suppl. Table 8. Over-represented Gene Ontology biological process annotations associated with genes repressed by the indicated dietary treatmentsa
E2 PFOA PFNA PFDA PFOS 8:2FtOH CLOF
#b
Accession Biological Process E FDR E FDR E FDR E FDR E FDR E FDR E FDR
141 GO:0031641 regulation of myelination 347 0.083 304 0.042 139 0.072 304 0.044 0 0.999 0 0.986 0 1.000
142 GO:0045423 regulation of granulocyte macrophage colony-stimulating factor
biosynthetic process
347 0.083 304 0.042 139 0.072 304 0.044 0 0.999 0 0.986 0 1.000
143 GO:0010894 negative regulation of steroid biosynthetic process 0 0.979 304 0.042 0 0.997 304 0.044 0 0.999 0 0.986 0 1.000
144 GO:0034382 chylomicron remnant clearance 0 0.979 304 0.042 0 0.997 304 0.044 0 0.999 0 0.986 0 1.000
145 GO:0034380 high-density lipoprotein particle assembly 0 0.979 304 0.042 0 0.997 304 0.044 0 0.999 0 0.986 0 1.000
146 GO:0042159 lipoprotein catabolic process 0 0.979 304 0.042 0 0.997 304 0.044 0 0.999 0 0.986 0 1.000
147 GO:0060333 interferon-gamma-mediated signaling pathway 0 0.986 304 0.042 139 0.072 304 0.044 0 0.999 0 0.986 0 1.000
148 GO:0051249 regulation of lymphocyte activation 14 0.326 24 0.039 11 0.114 24 0.041 0 1.000 0 0.991 0 1.000
149 GO:0031667 response to nutrient levels 14 0.326 24 0.038 11 0.114 24 0.040 190 0.797 0 0.799 0 1.000
150 GO:0002921 negative regulation of humoral immune response 434 0.071 380 0.038 173 0.062 380 0.040 0 0.995 0 0.968 0 1.000
151 GO:0045063 T-helper 1 cell differentiation 434 0.071 380 0.038 173 0.062 380 0.040 0 0.995 0 0.968 0 1.000
152 GO:0042508 tyrosine phosphorylation of Stat1 protein 434 0.071 380 0.038 173 0.062 380 0.040 0 0.995 0 0.968 0 1.000
153 GO:0060334 regulation of interferon-gamma-mediated signaling pathway 0 0.926 380 0.038 173 0.062 380 0.040 0 0.995 0 0.968 0 1.000
154 GO:0002825 regulation of T-helper 1 type immune response 434 0.071 380 0.038 173 0.062 380 0.040 0 0.995 0 0.968 0 1.000
155 GO:0030825 positive regulation of cGMP metabolic process 0 0.917 380 0.038 0 0.706 380 0.040 0 0.995 0 0.968 0 1.000
156 GO:0045624 positive regulation of T-helper cell differentiation 434 0.071 380 0.038 173 0.062 380 0.040 0 0.995 0 0.968 0 1.000
157 GO:0010544 negative regulation of platelet activation 0 0.917 380 0.038 0 0.706 380 0.040 0 0.995 0 0.968 0 1.000
158 GO:0045824 negative regulation of innate immune response 434 0.071 380 0.038 173 0.062 380 0.040 0 0.995 0 0.968 0 1.000
159 GO:0002923 regulation of humoral immune response mediated by circulating immunoglobulin
434 0.071 380 0.038 173 0.062 380 0.040 0 0.995 0 0.968 0 1.000
160 GO:0030828 positive regulation of cGMP biosynthetic process 0 0.917 380 0.038 0 0.706 380 0.040 0 0.995 0 0.968 0 1.000
161 GO:0002922 positive regulation of humoral immune response 578 0.057 506 0.032 231 0.050 506 0.034 0 1.000 0 0.989 0 1.000
162 GO:0045425 positive regulation of granulocyte macrophage colony-stimulating factor biosynthetic process
578 0.057 506 0.032 231 0.050 506 0.034 0 1.000 0 0.989 0 1.000
163 GO:0042511 positive regulation of tyrosine phosphorylation of Stat1 protein 578 0.057 506 0.032 231 0.050 506 0.034 0 1.000 0 0.989 0 1.000
164 GO:0010955 negative regulation of protein maturation by peptide bond cleavage
578 0.057 506 0.032 231 0.050 506 0.034 0 1.000 0 0.989 0 1.000
165 GO:0002925 positive regulation of humoral immune response mediated by circulating immunoglobulin
578 0.057 506 0.032 231 0.050 506 0.034 0 1.000 0 0.989 0 1.000
166 GO:0002639 positive regulation of immunoglobulin production 578 0.057 506 0.032 231 0.050 506 0.034 0 1.000 0 0.989 0 1.000
167 GO:0045916 negative regulation of complement activation 578 0.057 506 0.032 231 0.050 506 0.034 0 1.000 0 0.989 0 1.000
at Pennsylvania State University on Septem
ber 16, 2016http://toxsci.oxfordjournals.org/
Dow
nloaded from

Benninghoff, et al. Promotion of hepatocarcinogenesis by PFAAs
Page 19
Suppl. Table 8. Over-represented Gene Ontology biological process annotations associated with genes repressed by the indicated dietary treatmentsa
E2 PFOA PFNA PFDA PFOS 8:2FtOH CLOF
#b
Accession Biological Process E FDR E FDR E FDR E FDR E FDR E FDR E FDR
168 GO:0030449 regulation of complement activation 578 0.057 506 0.032 231 0.050 506 0.034 0 1.000 0 0.989 0 1.000
169 GO:0045625 regulation of T-helper 1 cell differentiation 578 0.057 506 0.032 231 0.050 506 0.034 0 1.000 0 0.989 0 1.000
170 GO:0042510 regulation of tyrosine phosphorylation of Stat1 protein 578 0.057 506 0.032 231 0.050 506 0.034 0 1.000 0 0.989 0 1.000
171 GO:0001961 positive regulation of cytokine-mediated signaling pathway 578 0.057 506 0.032 231 0.050 506 0.034 0 1.000 0 0.989 0 1.000
172 GO:0060759 regulation of response to cytokine stimulus 0 0.990 506 0.032 231 0.050 506 0.034 0 1.000 0 0.989 0 1.000
173 GO:0031401 positive regulation of protein modification process 31 0.057 27 0.032 12 0.091 27 0.034 0 1.001 0 0.922 0 1.000
174 GO:0050863 regulation of T cell activation 17 0.305 29 0.032 13 0.083 29 0.034 0 0.999 0 0.990 0 1.000
175 GO:0009894 regulation of catabolic process 17 0.307 29 0.032 7 0.290 29 0.034 0 0.972 0 0.981 0 1.000
176 GO:0045541 negative regulation of cholesterol biosynthetic process 0 0.986 506 0.032 0 0.899 506 0.034 0 1.000 0 0.989 0 1.000
177 GO:0032803 regulation of low-density lipoprotein receptor catabolic process 0 0.986 506 0.032 0 0.899 506 0.034 0 1.000 0 0.989 0 1.000
178 GO:0032802 low-density lipoprotein receptor catabolic process 0 0.986 506 0.032 0 0.899 506 0.034 0 1.000 0 0.989 0 1.000
179 GO:0018212 peptidyl-tyrosine modification 37 0.046 33 0.026 15 0.071 33 0.026 0 0.994 0 0.989 0 1.000
180 GO:0045937 positive regulation of phosphate metabolic process 38 0.048 33 0.026 15 0.071 33 0.026 0 1.000 0 0.998 0 1.000
181 GO:0010562 positive regulation of phosphorus metabolic process 38 0.048 33 0.026 15 0.071 33 0.026 0 1.000 0 0.998 0 1.000
182 GO:0018108 peptidyl-tyrosine phosphorylation 38 0.048 33 0.026 15 0.071 33 0.026 0 1.000 0 0.998 0 1.000
183 GO:0002696 positive regulation of leukocyte activation 19 0.294 33 0.026 15 0.071 33 0.026 0 1.000 0 0.998 0 1.000
184 GO:0031644 regulation of neurological system process 18 0.301 31 0.026 7 0.282 31 0.026 0 0.974 0 0.986 0 1.000
185 GO:0050867 positive regulation of cell activation 18 0.296 32 0.026 15 0.071 32 0.026 0 1.000 0 0.997 0 1.000
186 GO:0051969 regulation of transmission of nerve impulse 0 0.999 32 0.026 7 0.278 32 0.026 0 1.000 0 0.997 0 1.000
187 GO:0042327 positive regulation of phosphorylation 39 0.054 34 0.027 16 0.072 34 0.027 0 1.000 0 0.971 0 1.000
188 GO:0001775 cell activation 5 0.411 13 0.027 4 0.234 13 0.027 0 1.000 0 0.995 0 1.000
189 GO:0007584 response to nutrient 21 0.281 37 0.027 17 0.062 37 0.027 293 0.876 0 0.995 0 1.000
a Gene ontology enrichment analysis was performed using High Throughput GoMiner. A significant enrichment of the GO term category was inferred when p<0.05 as determined by a one-sided Fisher’s exact test after false discovery rate (FDR) correction. Significantly enriched GO terms are indicated in bold with yellow or orange highlight. b Number (#) corresponds to position in Cluster Image Map presented in Figure 4. Abbreviations: E, enrichment value; FDR, false discovery rate-corrected p-value.
at Pennsylvania State University on Septem
ber 16, 2016http://toxsci.oxfordjournals.org/
Dow
nloaded from

Benninghoff, et al. Promotion of hepatocarcinogenesis by PFAAs
Page 20
Supplemental Figure 1. Chemical structures of compounds tested for promotion of
hepatocarcinogenesis in rainbow trout.
at Pennsylvania State University on Septem
ber 16, 2016http://toxsci.oxfordjournals.org/
Dow
nloaded from

Benninghoff, et al. Promotion of hepatocarcinogenesis by PFAAs
Page 21
Supplemental Figure 2. Outline of AFB1 and MNNG tumor studies in trout with dietary
polyfluorinated chemicals. Fry were initiated at 10 weeks of age post spawn with 10 ppb AFB1
(A) or 35 ppm MNNG (C), though one cohort of animals were initiated with AFB1 at a slightly
delayed age of 14 weeks (B). Four weeks after initiation, animals were fed the indicated
experimental diets ad libitum (2.8-5.6% of body weight ration) for 6 months. PFOS was also
initially tested at a diet concentration of 2000 ppm, though this exposure level was lethal in trout
(data not shown). Consequently, a second cohort of trout fry (B) was initiated with a month
delay compared to the other initiated groups, and a much lower diet concentration of 100 ppm
PFOS was tested; as in the other treatment groups, the length of diet exposure was 6 months for
PFOS-exposed trout. Necropsies for all treatment groups were performed at 12.5 months of age
and were completed within one week.
at Pennsylvania State University on Septem
ber 16, 2016http://toxsci.oxfordjournals.org/
Dow
nloaded from

Benninghoff, et al. Promotion of hepatocarcinogenesis by PFAAs
Page 22
Supplemental Figure 3. Legend on following page.
CON E2 PFOA PFNA PFDA FtOH CLOF0
20
40
60
80
100
Treatment
Tu
mo
r in
cid
ence
(% o
f fis
h w
ith tu
mo
rs)
CON PFOS0
20
40
60
80
100
Sham - Females
Sham - Males
Sham - Total
AFB1 - Females
AFB1 - Males
AFB1 - Total
Treatment
BA
CON E2 PFOA PFNA PFDA FtOH CLOF0
20
40
60
80
100
Treatment
Exc
lud
ed s
ub
ject
s
(% o
f to
tal)
CON PFOS0
20
40
60
80
100
Sham - Females
Sham - Males
Sham - Total
AFB1 - Females
AFB1 - Males
AFB1 - Total
Treatment
DC
CON E2 PFOA PFNA PFDA FtOH CLOF0
20
40
60
80
100
Treatment
Tu
mo
r in
cid
ence
(% o
f fis
h w
ith tu
mo
rs)
CON PFOS0
20
40
60
80
100
Sham - Final subjects
AFB1 - Final subjects
Sham - All subjects
AFB1 - All subjects
Treatment
FE
at Pennsylvania State University on Septem
ber 16, 2016http://toxsci.oxfordjournals.org/
Dow
nloaded from
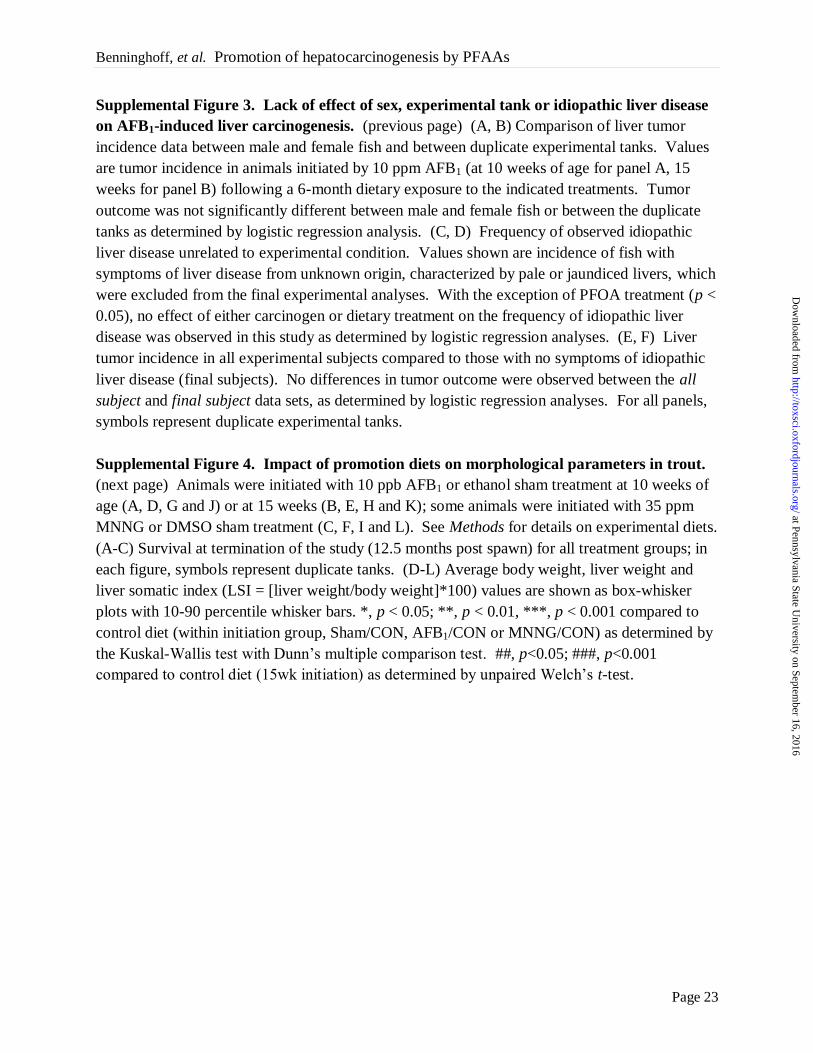
Benninghoff, et al. Promotion of hepatocarcinogenesis by PFAAs
Page 23
Supplemental Figure 3. Lack of effect of sex, experimental tank or idiopathic liver disease
on AFB1-induced liver carcinogenesis. (previous page) (A, B) Comparison of liver tumor
incidence data between male and female fish and between duplicate experimental tanks. Values
are tumor incidence in animals initiated by 10 ppm AFB1 (at 10 weeks of age for panel A, 15
weeks for panel B) following a 6-month dietary exposure to the indicated treatments. Tumor
outcome was not significantly different between male and female fish or between the duplicate
tanks as determined by logistic regression analysis. (C, D) Frequency of observed idiopathic
liver disease unrelated to experimental condition. Values shown are incidence of fish with
symptoms of liver disease from unknown origin, characterized by pale or jaundiced livers, which
were excluded from the final experimental analyses. With the exception of PFOA treatment (p <
0.05), no effect of either carcinogen or dietary treatment on the frequency of idiopathic liver
disease was observed in this study as determined by logistic regression analyses. (E, F) Liver
tumor incidence in all experimental subjects compared to those with no symptoms of idiopathic
liver disease (final subjects). No differences in tumor outcome were observed between the all
subject and final subject data sets, as determined by logistic regression analyses. For all panels,
symbols represent duplicate experimental tanks.
Supplemental Figure 4. Impact of promotion diets on morphological parameters in trout.
(next page) Animals were initiated with 10 ppb AFB1 or ethanol sham treatment at 10 weeks of
age (A, D, G and J) or at 15 weeks (B, E, H and K); some animals were initiated with 35 ppm
MNNG or DMSO sham treatment (C, F, I and L). See Methods for details on experimental diets.
(A-C) Survival at termination of the study (12.5 months post spawn) for all treatment groups; in
each figure, symbols represent duplicate tanks. (D-L) Average body weight, liver weight and
liver somatic index (LSI = [liver weight/body weight]*100) values are shown as box-whisker
plots with 10-90 percentile whisker bars. *, p < 0.05; **, p < 0.01, ***, p < 0.001 compared to
control diet (within initiation group, Sham/CON, AFB1/CON or MNNG/CON) as determined by
the Kuskal-Wallis test with Dunn’s multiple comparison test. ##, p<0.05; ###, p<0.001
compared to control diet (15wk initiation) as determined by unpaired Welch’s t-test.
at Pennsylvania State University on Septem
ber 16, 2016http://toxsci.oxfordjournals.org/
Dow
nloaded from
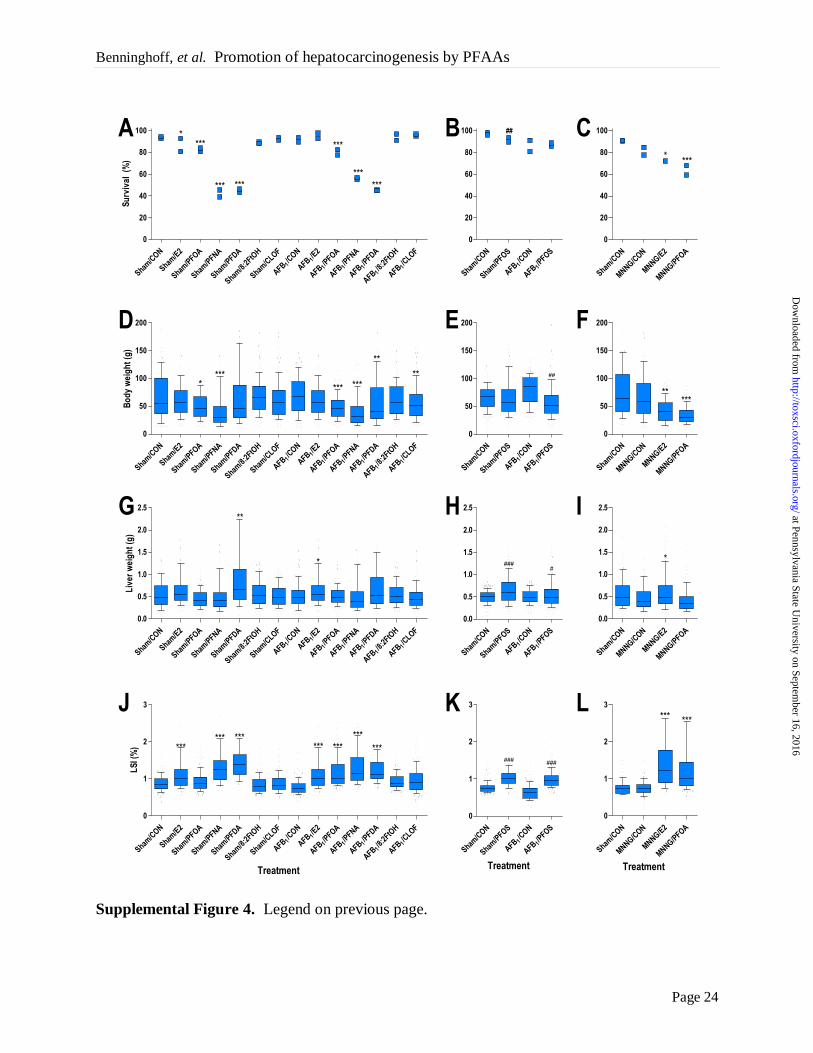
Benninghoff, et al. Promotion of hepatocarcinogenesis by PFAAs
Page 24
Sham/C
ON
Sham/E
2
Sham/P
FOA
Sham/P
FNA
Sham/P
FDA
Sham/8
:2FtO
H
Sham/C
LOF/C
ON
1
AFB
/E2
1
AFB /PFOA
1
AFB/P
FNA
1
AFB/P
FDA
1
AFB /8:2
FtOH
1
AFB
/CLOF
1
AFB
0
50
100
150
200
*********
**
***
Bo
dy
we
igh
t (g
)
Sham/C
ON
Sham/P
FOS/C
ON
1
AFB /PFOS
1
AFB
0
50
100
150
200
##
Sham/C
ON
Sham/E
2
Sham/P
FOA
Sham/P
FNA
Sham/P
FDA
Sham/8
:2FtO
H
Sham/C
LOF/C
ON
1
AFB
/E2
1
AFB /PFOA
1
AFB/P
FNA
1
AFB/P
FDA
1
AFB /8:2
FtOH
1
AFB
/CLOF
1
AFB
0.0
0.5
1.0
1.5
2.0
2.5
**
*
Liv
er
we
igh
t (g
)
Sham/C
ON
Sham/P
FOS/C
ON
1
AFB /PFOS
1
AFB
0.0
0.5
1.0
1.5
2.0
2.5
####
Sham/C
ON
Sham/E
2
Sham/P
FOA
Sham/P
FNA
Sham/P
FDA
Sham/8
:2FtO
H
Sham/C
LOF/C
ON
1
AFB
/E2
1
AFB /PFOA
1
AFB/P
FNA
1
AFB/P
FDA
1
AFB /8:2
FtOH
1
AFB
/CLOF
1
AFB
0
1
2
3
******
****** *** ***
***
Treatment
LS
I (%
)
Sham/C
ON
Sham/P
FOS/C
ON
1
AFB /PFOS
1
AFB
0
1
2
3
######
Treatment
D E
G H
J K
Sham/C
ON
MNNG/C
ON
MNNG/E
2
MNNG/P
FOA
0
50
100
150
200
*****
Sham/C
ON
MNNG/C
ON
MNNG/E
2
MNNG/P
FOA
0.0
0.5
1.0
1.5
2.0
2.5
*
Sham/C
ON
MNNG/C
ON
MNNG/E
2
MNNG/P
FOA
0
1
2
3
******
Treatment
F
I
L
Sham/C
ON
Sham/E
2
Sham/P
FOA
Sham/P
FNA
Sham/P
FDA
Sham/8
:2FtO
H
Sham/C
LOF/C
ON
1
AFB
/E2
1
AFB /PFOA
1
AFB/P
FNA
1
AFB/P
FDA
1
AFB /8:2
FtOH
1
AFB
/CLOF
1
AFB
0
20
40
60
80
100 ****
*** ***
***
******
Su
rviv
al
(%)
Sham/C
ON
Sham/P
FOS/C
ON
1
AFB /PFOS
1
AFB
0
20
40
60
80
100 ##
Sham/C
ON
MNNG/C
ON
MNNG/E
2
MNNG/P
FOA
0
20
40
60
80
100
****
A B C
Supplemental Figure 4. Legend on previous page.
at Pennsylvania State University on Septem
ber 16, 2016http://toxsci.oxfordjournals.org/
Dow
nloaded from

Benninghoff, et al. Promotion of hepatocarcinogenesis by PFAAs
Page 25
Sham/C
ON
MNNG/C
ON
MNNG/E
2
MNNG/P
FOA
0
20
40
60
80
100
Treatment
Liv
er tu
mo
r in
cid
ence
(% o
f fis
h w
ith tu
mo
rs)
Sham/C
ON
MNNG/C
ON
MNNG/E
2
MNNG/P
FOA
0
20
40
60
80
100
Females (all subjects)
Males (all subjects)
Total (all subjects)
Females (final subjects)
Total (final subjects)
Males (final subjects)
TreatmentS
tom
ach
tum
or
inci
den
ce
(% o
f fis
h w
ith tu
mo
rs)
A B
Sham/C
ON
MNNG/C
ON
MNNG/E
2
MNNG/P
FOA
0
20
40
60
80
100
Treatment
Kid
ney
tum
or
inci
den
ce
(% o
f fis
h w
ith tu
mo
rs)
Sham/C
ON
MNNG/C
ON
MNNG/E
2
MNNG/P
FOA
0
20
40
60
80
100
Treatment
Sw
im b
lad
der
tum
or
inci
den
ce
(% o
f fis
h w
ith tu
mo
rs)
C D
Supplemental Figure 5. Lack of effect of sex, experimental tank or idiopathic liver disease
on MNNG-induced carcinogenesis. Comparisons of tumor incidence data for liver (A),
stomach (B), kidney (C) and swim bladder (D) tumors between male and female fish and
between duplicate experimental tanks. Values are tumor incidence in animals initiated by 35
ppm MNNG following a 6-month dietary exposure to the indicated treatments (see Methods). In
each figure, symbols represent duplicate experimental tanks, and values for all experimental
subjects and final subjects (no symptoms of idiopathic liver disease) are shown. For all tumor
types, tumor outcome was not significantly different between male and female fish, between the
duplicate tanks or between the all subjects and final subjects data groups; the single exception to
this observation was for swim bladder tumors in MNNG/PFOA treatment group, where
significant over-dispersion between experimental tanks was observed (p = 0.003).
at Pennsylvania State University on Septem
ber 16, 2016http://toxsci.oxfordjournals.org/
Dow
nloaded from

Benninghoff, et al. Promotion of hepatocarcinogenesis by PFAAs
Page 26
0 2 4 60
2
4
6
Array 15R
2=0.984
y = 0.94x + 0.28
Log10 Intensity Ch1
Lo
g1
0 I
nte
ns
ity
Ch
2
1 2 3 4 5 6 7 8 9 101
2
3
4
5
Array 15
Alien oligo #
A
1 2 3 4 5 6 7 8 9 10-1.0
-0.5
0.0
0.5
1.0
Array 15
Alien oligo #
M
0 2 4 60
2
4
6
All dataR
2=0.978
y = 0.99x + 0.018
Log10 Intensity Ch1
Lo
g1
0 I
nte
ns
ity
Ch
2
1 2 3 4 5 6 7 8 9 101
2
3
4
5
All data
Alien oligo #
A
1 2 3 4 5 6 7 8 9 10-1.0
-0.5
0.0
0.5
1.0
All data
Alien oligo #
M
F
B C
D E
A
Supplemental Figure 6. Quality control analysis of array hybridization. Data for each
SpotReport Alien Oligo feature for a representative array (A-C; N = 16 spots per olio per array)
or for all arrays hybridized in this study (D-F; N = 640) are shown. Pairwise correlation analyses
of Ch1 and Ch2 intensities are shown for all SpotReport Alien features (A) or those for a
representative array (D). Box and whiskers (10-90 confidence interval) plots of values for mean
intensity (panels B and E; A = log10(sqrt(Ch1*Ch2)) and the ratio of intensities (panels C and F;
M = log2(Ch1/Ch2) are also shown for the entire array and for array 15. In summary, non-
specific hybridization to buffer spots was not detected, background fluorescence was consistently
low across the array and there was no apparent spatial bias on these arrays. As expected, a very
strong correlation between Ch1 and Ch2 intensities was observed with slopes of the linear
regression trend lines of 0.94 and 0.99 for array 15 or all arrays, respectively, indicating that the
potential problem of dye bias was eliminated by ratio-centering and Lowess-normalization of the
raw data. The quality control analysis shows that these arrays can detect changes in gene
expression across a broad range of signal intensities (three orders of magnitude) and that
hybridization to the OSUrbt array was consistent and reproducible.
at Pennsylvania State University on Septem
ber 16, 2016http://toxsci.oxfordjournals.org/
Dow
nloaded from

Benninghoff, et al. Promotion of hepatocarcinogenesis by PFAAs
Page 27
Supplemental Figure 7. Unsupervised bidirectional hierarchical cluster analysis of hepatic
gene expression profiles. Bidirectional hierarchical clustering analysis was performed using
sample data for either all array features; log2 fold change expression values are shown for each
biological replicate (n = 3). Patterns of gene expression were clustered in two directions, by
gene (left tree) and treatment (top tree), using the Euclidean distance method with average
linkage.
at Pennsylvania State University on Septem
ber 16, 2016http://toxsci.oxfordjournals.org/
Dow
nloaded from

Benninghoff, et al. Promotion of hepatocarcinogenesis by PFAAs
Page 28
Supplemental Figure 8. Directed acyclic graph for selected enriched GO terms associated with dietary E2. GO term enrichment was
performed using agriGO singular enrichment analysis tool against the zebrafish gene ontology database. The scale bar indicates level of significance
(FDR-corrected p-value) for enriched GO terms, and the inset legend indicates the type of relationship between terms as depicted by different arrow
types.
<1e-09
<0.05
FDR p value Relationship
at Pennsylvania State University on Septem
ber 16, 2016http://toxsci.oxfordjournals.org/
Dow
nloaded from

Benninghoff, et al. Promotion of hepatocarcinogenesis by PFAAs
Page 29
Supplemental Figure 9. Directed acyclic graph (DAG) for selected enriched GO terms associated with dietary PFNA. GO term enrichment
was performed using agriGO singular enrichment analysis tool against the zebrafish gene ontology database. Because of the extensive network of
GO terms associated with PFNA exposure, only a portion of the DAG is shown for comparison to the E2 DAG shown in Suppl. Fig. 8. The scale bar
indicates level of significance (FDR-corrected p-value) for enriched GO terms, and the inset legend indicates the type of relationship between terms
as depicted by different arrow types. Best viewed using Adobe PDF viewer.
<1e-09
<0.05
FDR p value Relationship
at Pennsylvania State University on Septem
ber 16, 2016http://toxsci.oxfordjournals.org/
Dow
nloaded from

Benninghoff, et al. Promotion of hepatocarcinogenesis by PFAAs
Page 30
Supplemental Figure 10. Validation of treatment-induced changes in hepatic gene
expression determined by microarray analysis using qRT-PCR. Values from qRT-PCR
(open circles) are expressed as mean fold change (log2) normalized to expression of
housekeeping genes actb, atp5b, gapdh and top2a in a reference pool of cDNA from control
treatments; values from the OSUrbt microarray (black squares) are expressed as mean fold
change (log2) compared to the control reference pool + SEM (N = 3) for select genes including
(A) a2m, (B) ctsd, (C) cyp1a, (D) cyp2k5, (E) hpx, (F) pgds, (G) tcpbp, (H) trx and (I) vtg. qRT-
PCR values for the PFOS treatment were normalized to the appropriate time-matched reference
pool to correctly reflect array hybridization conditions for this treatment group. Light gray
shading in the plot area indicates regions of two-fold induction or repression of gene expression.
Asterisks indicate that the qRT-PCR expression value is significantly different (*, p < 0.05; **, p
< 0.01; ***, p < 0.001) from control treatment (CON) as determined by the Kruskal-Wallis test
with Dunnett’s test for multiple comparisons. Results of statistical analyses of microarray data
are provided in Supplementary Table 6.
at Pennsylvania State University on Septem
ber 16, 2016http://toxsci.oxfordjournals.org/
Dow
nloaded from

Benninghoff, et al. Promotion of hepatocarcinogenesis by PFAAs
Page 31
Supplemental References
Mortensen, A. S., Tolfsen, C. C. and Arukwe, A. (2006). Gene expression patterns in estrogen
(nonylphenol) and aryl hydrocarbon receptor agonists (PCB-77) interaction using
rainbow trout (Oncorhynchus mykiss) primary hepatocyte culture. J. Toxicol. Environ.
Health A 69, 1-19.
Rees, C. B. and Li, W. (2004). Development and application of a real-time quantitative PCR
assay for determining CYP1A transcripts in three genera of salmonids. Aquat. Toxicol.
66, 357-68.
Tilton, S. C., Givan, S. A., Pereira, C. B., Bailey, G. S. and Williams, D. E. (2006).
Toxicogenomic profiling of the hepatic tumor promoters indole-3-carbinol, 17-estradiol
and -naphthoflavone in rainbow trout. Toxicol. Sci. 90, 61-72.
at Pennsylvania State University on Septem
ber 16, 2016http://toxsci.oxfordjournals.org/
Dow
nloaded from


![Comparison of extraction methods for per- and …...acids (e.g., dodecalfluoro-3H-4,8-dioxanonanoate (ADONA)), were detected in human serum [23] and perfluoroalkyl ether carboxylic](https://static.cupdf.com/doc/110x72/60f7a15e23a8573a3e7e5d09/comparison-of-extraction-methods-for-per-and-acids-eg-dodecalfluoro-3h-48-dioxanonanoate.jpg)