Process monitoring in biogas plants
Bernhard Drosg

Process monitoring in biogas plants
Process monitoring in biogas plantsTechnical Brochure written by:Bernhard Drosg
Published by IEA Bioenergy
DisclaimerIEA Bioenergy, also known as the Implementing Agreement for a Programme of Research, Development and Demonstration on Bioenergy, functions within a Framework created by the International Energy Agency (IEA). Views, findings and publications of IEA Bioenergy do not necessarily represent the views or policies of the IEA Secretariat or of its individual Member countries.
Copyright © 2013 IEA Bioenergy. All rights reserved.First electronic edition produced in 2013 A catalogue record for this technical brochure is available from the British Library.IsBN 978-1-910154-03-8 (electronic version)
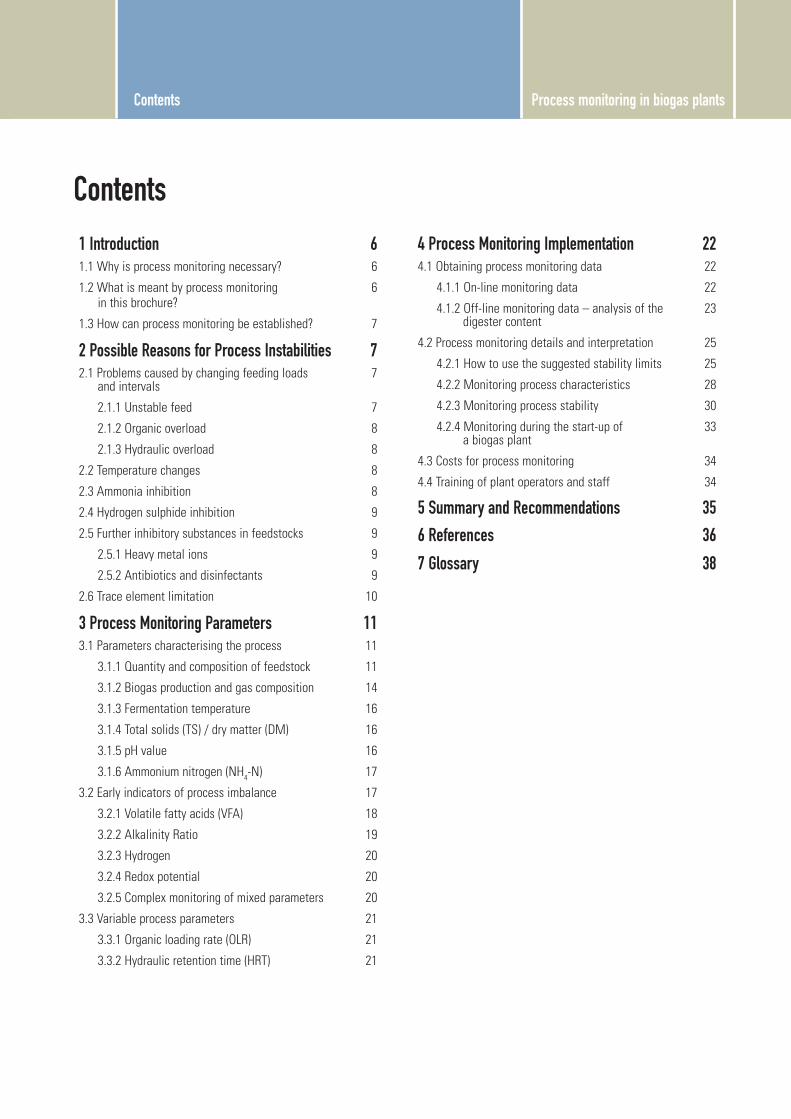
Contents
Process monitoring in biogas plants Contents
1 Introduction 61.1 Why is process monitoring necessary? 6
1.2 What is meant by process monitoring in this brochure?
6
1.3 How can process monitoring be established? 7
2 Possible Reasons for Process Instabilities 72.1 Problems caused by changing feeding loads
and intervals7
2.1.1 Unstable feed 7
2.1.2 organic overload 8
2.1.3 Hydraulic overload 8
2.2 Temperature changes 8
2.3 Ammonia inhibition 8
2.4 Hydrogen sulphide inhibition 9
2.5 Further inhibitory substances in feedstocks 9
2.5.1 Heavy metal ions 9
2.5.2 Antibiotics and disinfectants 9
2.6 Trace element limitation 10
3 Process Monitoring Parameters 113.1 Parameters characterising the process 11
3.1.1 Quantity and composition of feedstock 11
3.1.2 Biogas production and gas composition 14
3.1.3 Fermentation temperature 16
3.1.4 Total solids (Ts) / dry matter (DM) 16
3.1.5 pH value 16
3.1.6 Ammonium nitrogen (NH4-N) 17
3.2 Early indicators of process imbalance 17
3.2.1 Volatile fatty acids (VFA) 18
3.2.2 Alkalinity ratio 19
3.2.3 Hydrogen 20
3.2.4 redox potential 20
3.2.5 Complex monitoring of mixed parameters 20
3.3 Variable process parameters 21
3.3.1 organic loading rate (oLr) 21
3.3.2 Hydraulic retention time (HrT) 21
4 Process Monitoring Implementation 224.1 obtaining process monitoring data 22
4.1.1 on-line monitoring data 22
4.1.2 off-line monitoring data – analysis of the digester content
23
4.2 Process monitoring details and interpretation 25
4.2.1 How to use the suggested stability limits 25
4.2.2 Monitoring process characteristics 28
4.2.3 Monitoring process stability 30
4.2.4 Monitoring during the start-up of a biogas plant
33
4.3 Costs for process monitoring 34
4.4 Training of plant operators and staff 34
5 Summary and Recommendations 356 References 36
7 Glossary 38

Process monitoring in biogas plants Introduction
6
1. Introduction
1.1 Why is process monitoring necessary?Biogas plants are biological systems involving vari-
ous interacting microorganisms that anaerobically
degrade organic matter. The main product is biogas, a
gas rich in methane (CH4) that can be used as a renew-
able fuel for vehicles or to generate heat or electricity for
local use or for use via energy distribution grids. The
degradation involves four consecutive biological pro-
cesses: hydrolysis, acidogenesis, acetogenesis and metha-
nogenesis (see Figure 1). If one of these processes is
negatively affected in any way there is an immediate
influence on the other processes and the biogas plant can
become unstable. Typical process failures include, among
others, organic overload, hydraulic overload and ammo-
nia inhibition (see section 2 for details).
Process monitoring can help to understand what
happens in a biogas plant and help to maintain a stable
process. In many cases, a strongly inhibited microorgan-
ism population or a total crash of the whole plant can
have severe financial consequences for the biogas plant
operator.
In general, process monitoring can help to:
give an overall picture of the biogas process
identify upcoming instabilities in anaerobic
digesters before a crash happens
accompany a successful start-up or re-start
of a plant
The costs of basic monitoring are often much lower
than the costs and lost revenue associated with re-estab-
lishing a biologically destabilised plant. For example, if a
biogas plant has totally crashed it may have to be emp-
tied and filled again with new inoculum. This, together
with the necessary start-up period, means that several
months can be lost during which the plant could have
operated at full load (Henkelmann et al., 2010). The
financial consequences can be devastating for the plant
operator.
1.2 What is meant by process monitoring in this brochure?This brochure focuses on the monitoring of param-
eters that are concerned with stability of the anaerobic
degradation process. These
parameters are mainly driv-
en by biological interactions
and as a result the monitor-
ing of a biogas plant is very
different from many other
industrial processes. This
brochure describes the dif-
ferent monitoring methods,
the way they are applied and
how monitoring data are
obtained. In addition, advice
Figure 1 Degradation steps in anaerobic digestion (adapted from speece, 1996)

Process monitoring in biogas plants Possible Reasons for Process Instabilities
7
regarding the amount and frequency of monitoring is
given.
In addition to the biological parameters, there are also
technical parameters that need to be monitored in a
biogas installation. This means a regular check of the
functionality of equipment (e.g. pumps, valves, CHP –
combined heat and power plant, etc.). Another impor-
tant point to take into account is the monitoring of plant
safety, for example emissions of explosive gas mixtures
and toxic gases (e.g. hydrogen sulphide). Whilst impor-
tant, monitoring of technical equipment and safety is not
described in this brochure.
Another aspect not covered in this brochure is detailed
process optimisation of, for example, gas production and
economic performance.
1.3 How can process monitoring be established?Every biogas plant develops its own unique process
conditions and as a result there is no single value for each
process parameter that can be referenced to all plants. For
each plant it is therefore important that values of relevant
process parameters, such as temperature and pH, are
established during stable operation. By recording these
process parameters over the life of the plant, any change
from “normal” can be identified quickly. Apart from
recording these parameters, general process information
such as mass of input, organic loading rate and opera-
tional problems should be documented (Schriewer,
2011). Whilst much of this information is recorded auto-
matically in automated plants, it is recommended to keep
a manual operational logbook.
Apart from the off-line analysis of parameters, which
means analysis of samples in a laboratory, a minimum of
on-line process monitoring equipment will have to be
installed in every biogas plant. In general, the level of
investment in on-line equipment should always be made
in relation with the economic risks in the biogas plant
(Henkelmann et al., 2010).
2 Possible Reasons for Process Instabilities
In order to better understand the reasons for imple-
menting biological process monitoring, the possible
causes for process instabilities in biogas plants are sum-
marised in this section. These causes can include feeding
problems, temperature variations, lack of trace elements
that support a healthy community of microorganisms
and the presence of inhibitory or toxic substances. As the
microbial community within each digester is able to
adapt to changes to a certain extent, it is often not possi-
ble to state definitive stability limits.
Before going into detail, it should be stated that many
process imbalances can be avoided by good operation
practice. Therefore, adequate training of the operating
staff of a biogas plant is an important matter (see section
4.4). The following general recommendations are given
so that a biogas plant operator can avoid process imbal-
ances (Clemens, 2012):
Continuous feeding rate
Consistent feedstock mix (e.g. manure and
biowaste)
Gradual and careful change of feedstock mixes
when required
Avoid temperature changes
Constant intervals and intensity of stirring or
agitating
Continuous process monitoring and control
2.1 Problems caused by changing feeding loads and intervals
2.1.1 Unstable feedIf large variations of the daily organic loading rate
(see section 3.3.1) to the biogas occur, this will result in
variable rates of gas production. Whilst this is often not a
real problem with regard to process stability, it can result
in decreased productivity of the biogas plant. In addition,
if the energy contents of two different batches of feed-
stock, for example grass silage, are different, biogas pro-
duction will change, although the nominal feeding rate
has not been changed. Another aspect can be interrup-

Process monitoring in biogas plants Possible Reasons for Process Instabilities
8
tions of the feed to the biogas plant. Depending on the
feedstock and the specific plant, feeding interruptions of
some days (Gallert and Winter, 2008; Drosg, 2012) or
sometimes even hours (according to Forstner and
Schlachter, 2012) can cause considerable problems with
process stability. This is, however, very plant-specific,
depending on feedstock and process.
2.1.2 Organic overloadAn organic overload occurs when the amount of
organic matter fed to the biogas plant exceeds the total
degradation capacity of the microbes to produce biogas.
As a consequence the organic matter is only partially
degraded to volatile fatty acids (VFA) which then accu-
mulate in the reactor. In this situation, methane concen-
tration in the biogas normally declines. If the concentra-
tion of the accumulated VFA exceeds the buffer capacity
in the reactor, acidification of the digester occurs and the
pH decreases. If no countermeasures are taken, acidifica-
tion will reduce biogas production to a point where it is
zero. In practice, typical causes of organic overload (and
consequently acidification) are changes in feedstock
mixture and composition, incorrectly measured inputs
or increased mixing which suddenly leads to inclusion of
unreacted material (e.g. floating layers) into the diges-
tion process (Schriewer, 2011).
2.1.3 Hydraulic overloadIn addition to organic overload, hydraulic overload is
also a possible cause of process instability. If the hydrau-
lic retention time (see section 3.3.2) does not allow
enough time for multiplication of the anaerobic
microbes, their concentration will decline and they will
gradually be washed out of the reactor. This will logi-
cally pose a problem as biogas production is directly
proportional to the concentration of the anaerobic
microbes. Hydraulic overload is especially problematic
in anaerobic processes because some of the microorgan-
isms involved can have very long reproduction times.
Methane-forming microbes can show doubling times
(doubling of the population) up to 30 days (Gerardi,
2003), and if inhibition is involved doubling time will
even increase beyond that. The washing-out of microbes
will finally lead to accumulation of VFA in a manner
similar to organic overload, as acidifying microbes grow
faster than methanogens. Washing out will finally result
in biogas production ceasing. It is therefore important
that all liquid inputs, as well as solid inputs, to a digester
are measured and recorded.
2.2 Temperature changesIn general, microbes and microbial consortia operate
optimally at specific temperatures. In biogas plants,
where mixed cultures are involved, the composition of
the different microbes will adapt to the fermentation
temperature. For this reason it is necessary that the fer-
mentation temperature is kept stable and no major vari-
ations occur during the process. According to Gerardi
(2003) it is recommended to keep daily temperature
variations <1°C for thermophilic biogas processes and
within 2-3°C for mesophilic processes. For the start-up
of a biogas plant, an inoculum should be used that is
already adapted to the future operation temperature, in
order to reduce the adaptation time, and by that the
duration of the start-up.
In contrast to the conditions described above, a stra-
tegic increase in process temperature, for example from
psychrophilic (<25°C) to mesophilic (36 to 43°C) tem-
peratures, can make sense. This is because a mesophilic
process is much more efficient. If a planned increase in
temperature is carried out, feeding rate should be
reduced as temperature sensitivity increases with load-
ing rate (Speece, 1996). In addition, microbes normally
need a time span of several weeks to adapt to the new
temperature. Such a strategic temperature shift should
be a very rare event, and afterwards temperature must be
kept stable again. For more data on temperature shifts,
see Lindorfer et al. (2008).
2.3 Ammonia inhibitionAmmonium nitrogen (NH
4-N) is produced by the
degradation of proteins during anaerobic digestion of
feedstocks containing nitrogen. In an aqueous environ-
ment such as in a digester, NH4-N is present as ammo-
nium ions (NH4
+) and as free ammonia (NH3(aq)
). With
rising pH or temperature, the percentage of NH4-N
present as free ammonia (NH3(aq)
) increases. The free
ammonia (NH3(aq)
) is considered to be the main cause of
Process monitoring in biogas plants Possible Reasons for Process Instabilities
9
inhibition since it freely passes through the cell mem-
brane of the microbes (Chen et al., 2008). Several mecha-
nisms for inhibition have been proposed, including a
change in the intracellular pH, an increase in mainte-
nance energy required for metabolism and inhibition of
a microbial enzyme reaction (Chen et al., 2008).
In addition to the influence of temperature and pH
on ammonia inhibition, adaptation of the microbes to
high ammonia concentrations is an important factor. In
practice, high nitrogen feedstocks can frequently pose
problems on process stability in biogas plants. Rapid
changes from low nitrogen feedstocks to high nitrogen
feedstocks can be especially problematic. As this depends
on the specific mixed culture and its adaptation to
ammonia, it is very difficult to define stability limits.
Consequently, in the literature very different inhibitory
concentrations of ammonium nitrogen are given. Accord-
ing to Bischofsberger et al. (2005), inhibition starts at 1.5
to 3.0 g NH4-N L-1. However, there are other reports that
inhibition starts at substantially higher concentrations:
5.0 g NH4-N L-1 (Braun, 1982), 8.5 g NH
4-N L-1 (Speece,
1996) and 14 g NH4-N L-1 (Chen et al., 2008). The diffi-
culty of defining stability limits for NH4-N is also dis-
cussed in section 4.2.1 and Table 4. According to Drosg
(2013), for a stable anaerobic process at high ammonia
concentrations, the following parameters are a prerequi-
site: sufficient adaptation time for the microbes (adapta-
tion can take several weeks and is done at low organic
loading rate), good trace element availability (see section
2.6) and low to medium hydrogen sulphide concentra-
tions (see section 2.4).
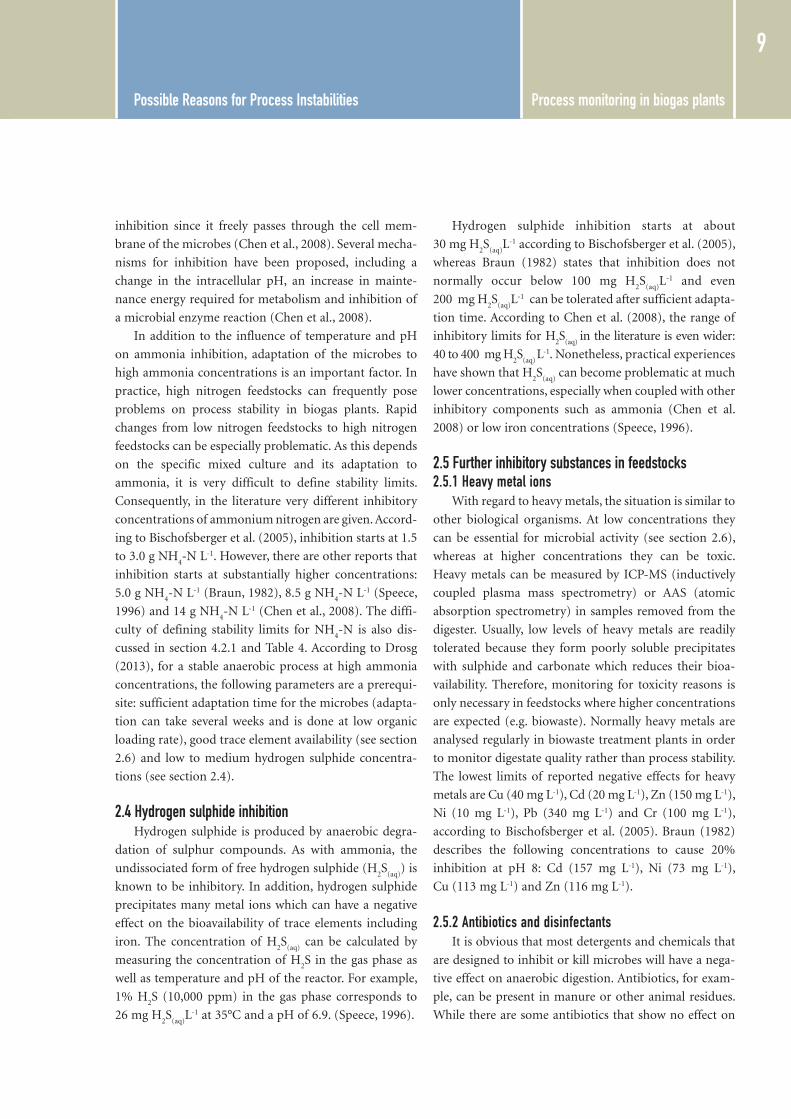
2.4 Hydrogen sulphide inhibitionHydrogen sulphide is produced by anaerobic degra-
dation of sulphur compounds. As with ammonia, the
undissociated form of free hydrogen sulphide (H2S
(aq)) is
known to be inhibitory. In addition, hydrogen sulphide
precipitates many metal ions which can have a negative
effect on the bioavailability of trace elements including
iron. The concentration of H2S
(aq) can be calculated by
measuring the concentration of H2S in the gas phase as
well as temperature and pH of the reactor. For example,
1% H2S (10,000 ppm) in the gas phase corresponds to
26 mg H2S
(aq)L-1 at 35°C and a pH of 6.9. (Speece, 1996).
Hydrogen sulphide inhibition starts at about
30 mg H2S
(aq)L-1 according to Bischofsberger et al. (2005),
whereas Braun (1982) states that inhibition does not
normally occur below 100 mg H2S
(aq)L-1 and even
200 mg H2S
(aq)L-1 can be tolerated after sufficient adapta-
tion time. According to Chen et al. (2008), the range of
inhibitory limits for H2S
(aq) in the literature is even wider:
40 to 400 mg H2S
(aq) L-1. Nonetheless, practical experiences
have shown that H2S
(aq) can become problematic at much
lower concentrations, especially when coupled with other
inhibitory components such as ammonia (Chen et al.
2008) or low iron concentrations (Speece, 1996).
2.5 Further inhibitory substances in feedstocks2.5.1 Heavy metal ions
With regard to heavy metals, the situation is similar to
other biological organisms. At low concentrations they
can be essential for microbial activity (see section 2.6),
whereas at higher concentrations they can be toxic.
Heavy metals can be measured by ICP-MS (inductively
coupled plasma mass spectrometry) or AAS (atomic
absorption spectrometry) in samples removed from the
digester. Usually, low levels of heavy metals are readily
tolerated because they form poorly soluble precipitates
with sulphide and carbonate which reduces their bioa-
vailability. Therefore, monitoring for toxicity reasons is
only necessary in feedstocks where higher concentrations
are expected (e.g. biowaste). Normally heavy metals are
analysed regularly in biowaste treatment plants in order
to monitor digestate quality rather than process stability.
The lowest limits of reported negative effects for heavy
metals are Cu (40 mg L-1), Cd (20 mg L-1), Zn (150 mg L-1),
Ni (10 mg L-1), Pb (340 mg L-1) and Cr (100 mg L-1),
according to Bischofsberger et al. (2005). Braun (1982)
describes the following concentrations to cause 20%
inhibition at pH 8: Cd (157 mg L-1), Ni (73 mg L-1),
Cu (113 mg L-1) and Zn (116 mg L-1).
2.5.2 Antibiotics and disinfectantsIt is obvious that most detergents and chemicals that
are designed to inhibit or kill microbes will have a nega-
tive effect on anaerobic digestion. Antibiotics, for exam-
ple, can be present in manure or other animal residues.
While there are some antibiotics that show no effect on

Process monitoring in biogas plants
10
anaerobic digestion (e.g. erythromycin), there are others
that show partial inhibitory effects (e.g. aminoglyco-
sides) or others that show strong effects (e.g. chlortetra-
cycline) (Sanz et al., 1996). Disinfectants are often used
on farms or in the food industry. According to Poels et
al. (1984) disinfectant doses should not be higher than
recommended for farm use and only low-toxicity anti-
microbial agents should be used in order to minimise
possible digester failures. Concentrations of antibiotics
and disinfectants in feedstock are not usually monitored.
2.6 Trace element limitationA lack of micro elements / trace elements can be
responsible for decreasing performance in biogas plants,
which is then called “trace element limitation”. Figure 2
illustrates how a single essential trace element can
become the limiting factor of microbial activity if its
availability is too low. Essential trace elements in a
biogas process can be Ni, Co, Mb, Se according to Hen-
kelmann et al. (2010), but also iron (Fe) has to be avail-
able for a stable process. Trace elements are often neces-
sary for the build-up of enzymes, and are therefore
essential for the microbes. The presence of certain trace
elements in the fermentation broth can be determined,
similar to heavy metal measurements (see section 2.5.1).
However, apart from their physical presence in the reac-
tor, they also need to be biologically available for the
microbes.
In order to be bioavailable trace elements first have
to be soluble, and secondly they should neither be pre-
sent in the form of precipitates (e.g. sulphides, carbon-
ates) nor adsorbed. According to Ortner (2012) for
analysis with regard to estimations on bioavailability,
different solvents can be applied one after another to the
digester samples. Subsequently, the presence of the dif-
ferent trace elements in the different solvents is analysed,
which indicates their bioavailability.
A lack of trace elements is more likely to occur in
mono-digestion (e.g. the by-product stillage from etha-
nol fermentation), but it can also occur in co-digestion.
Normally, if a high percentage of manure is used as
feedstock, a lack of trace elements rarely arises (Schriewer,
2011). Testing for trace element limitation is not regu-
larly carried out, so it has not been added to the list of
process monitoring parameters presented in this bro-
chure (see section 3). If a plant shows problems with
process stability and VFA concentrations increase, the
first and most obvious reasons for process imbalances
(see section 2.1 to 2.5) have to be checked and elimi-
nated. If the symptoms remain, it pays to have a look at
trace element availability so that appropriate trace ele-
ments can be added. However, as mentioned above (sec-
tion 2.5.1), if trace elements are added at too high an
amount they can become inhibitory. In addition, land
application of digestate can become problematic if trace
element concentrations in the digestate exceed legal
application limits in the digestate.
Possible Reasons for Process Instabilities
Figure 2 This barrel illustrates the problem of trace element limitation. Microbial growth is indicated by the water level and trace element availability is indicated by the pieces of wood of the barrel. one trace element (in this case cobalt) can limit microbial growth, even if the other elements are in excess (reproduced with the kind permission of schriewer Biogas Consulting).
Process monitoring in biogas plants Process Monitoring Parameters
11
3 Process Monitoring Parameters
In this section the methods and the background of
the different monitoring parameters are given. As pro-
cess monitoring is quite complex and potentially expen-
sive, the details with regard to frequency of measure-
ments and preferable ranges of parameters will be dis-
cussed separately in section 4.2.
All together, the most important parameters for pro-
cess monitoring and control can be put into the follow-
ing groups (according to Weiland, 2008):
Parameters characterising the process (section 3.1)
Early indicators of process imbalance (section 3.2)
Variable process parameters (section 3.3)
3.1 Parameters characterising the processParameters characterising the process which are considered:
Quantity and composition of feedstock
Biogas production and gas composition
Fermentation temperature
Total solids / dry matter
pH value
Ammonium nitrogen
These parameters describe the state of the overall
biogas process. It is necessary to monitor them to iden-
tify the possible reasons for changes in process stability.
However, they cannot be used as early indicators of pro-
cess imbalance (Weiland, 2008). The reason is that, for
example, decreases in gas production or in pH are fre-
quent signs of already occurring process instability.
Other parameters, such as changes in H2 or VFA concen-
tration happen before the process becomes unstable and
allow the plant operator to counteract the situation
before a process imbalance happens.
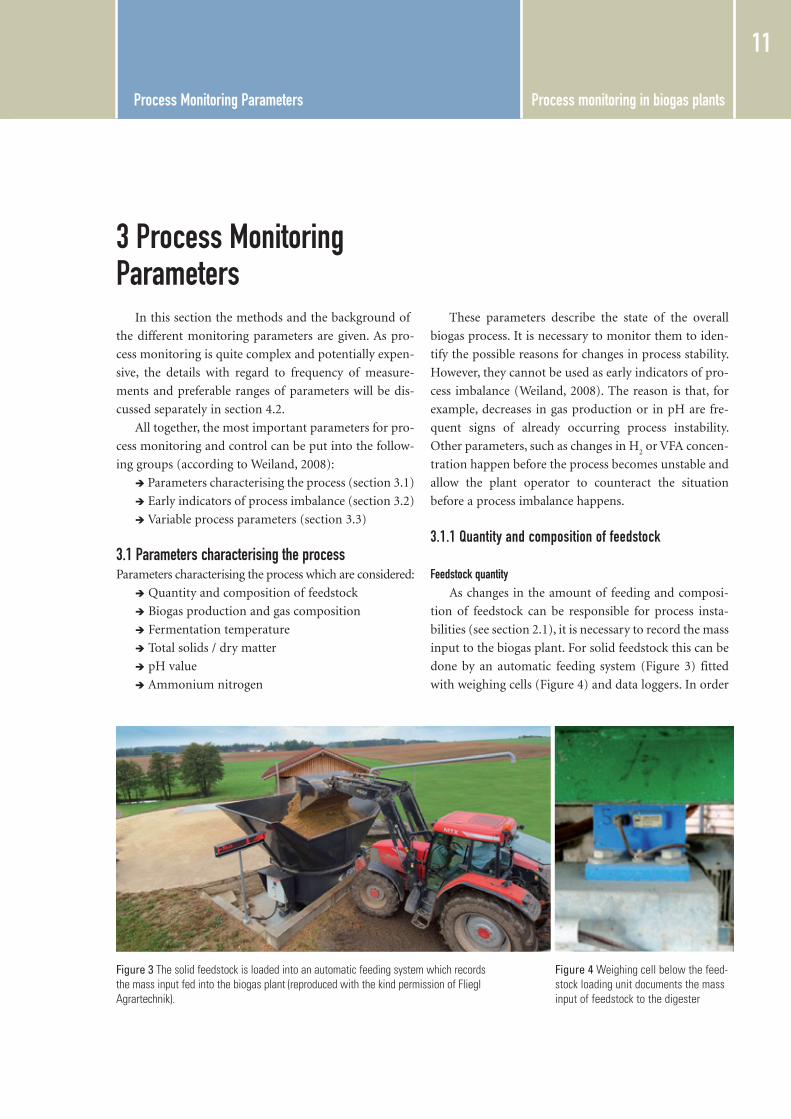
3.1.1 Quantity and composition of feedstock
Feedstock quantityAs changes in the amount of feeding and composi-
tion of feedstock can be responsible for process insta-
bilities (see section 2.1), it is necessary to record the mass
input to the biogas plant. For solid feedstock this can be
done by an automatic feeding system (Figure 3) fitted
with weighing cells (Figure 4) and data loggers. In order
Figure 3 The solid feedstock is loaded into an automatic feeding system which records the mass input fed into the biogas plant (reproduced with the kind permission of Fliegl Agrartechnik).
Figure 4 Weighing cell below the feed-stock loading unit documents the mass input of feedstock to the digester

Process monitoring in biogas plants Process Monitoring Parameters
12
to protect the feeding system from damage by loading
machinery, a small barrier should be placed in front of it
(Schwieger, 2011) (see Figure 3). Although not very
accurate, in less sophisticated biogas plants, the daily
numbers of shovel loads, for example by a wheel loader,
can provide valuable information. Feed reduction can
lead to a lower biogas production and feed increase can
lead to acidification, and consequently to process insta-
bility (see section 2.1).
In addition to solid feedstocks, liquid feedstocks
should be recorded for two reasons. The first reason is
that if they contain high amounts of organic matter they
will contribute to the daily feed of organic matter to the
biogas plant. The second is that high amounts of liquids
(e.g. rain water) in feedstock lower the retention time
and can lead to hydraulic overload (see section 2.1.3).
Many existing biogas plants use weighing equipment
for measuring the input of solid feedstock. For liquid
feedstock, often no quantification takes place. According
to FNR (2009), almost 50% of the German biogas plants
investigated do not measure input of liquid feedstock or
process water. Since practically all biogas plants are con-
tinuously stirred tank reactors (CSTR) which have no
special retention system for microbes, the daily input of
solid and liquid feedstock determines the retention time
of the microorganisms (see HRT, section 3.3.2). As the
input of liquids to the digester is often not documented
as indicated above, operators of such biogas plants do
not know the real retention time in the plant. According
to the LfL (2007), measurement of the quantity of liquid
feedstock is best carried out by flow meters. Recording
the levels of storage tanks can be also useful. Recording
pumping time is another alternative; this will give inex-
act information because pump flow rate depends on the
composition of the respective feedstock as well as on
gradual wear of the pump (LfL, 2007).
Feedstock CharacterisationIn addition to quantifying feedstock, characterisa-
tion of feedstock is very important. This is especially the
case for waste treatment plants, where a large variety of
different feedstocks are used. It is thus essential to mon-
itor the specific feedstocks that enter the plant. If the
feedstock in a biogas plant is always quite similar (e.g.
manure) and the plant is working well, feedstock charac-
terisation is normally less important. For biogas plant
monitoring, a comprehensive list of the most relevant
feedstock parameters can be found in Table 1, as well as
the corresponding methods for analysis.
Feedstock pH is important to know, as an excess of
highly acidic or alkaline feedstock can cause a deviation
of the digester from its favourable pH range of pH 7-8.
In this case, addition of caustic (or acid) is necessary.
Nonetheless, in practice a wide pH-range of feedstocks is
acceptable due to the buffering capacity of a biogas
digester.
As another feedstock parameter, the volatile solids
(VS) represent the organic matter which is the source
from which biogas is produced and is therefore very
important. In many feedstocks the ash content is quite
low, so in practice total solids (TS) content can provide
sufficient information (TS equals VS plus ash). For liq-
uid feedstocks like wastewater, VS (or TS) are often not
good parameters to try and follow because the volatile
substances present (acetic acid, ethanol, etc.) cannot be
determined. In these cases a COD (chemical oxygen
demand) measurement is applied. COD measurements
are rarely applied for solid feedstocks as the analysis is
more complex than the VS measurement and the repro-
ducibility is quite poor for a solid or inhomogeneous
feedstock.
The total Kjeldahl nitrogen (TKN) indicates the
nitrogen content of a feedstock. Monitoring TKN con-
tent of feedstocks can be important because a change
from nitrogen-poor to nitrogen-rich feedstock mixtures
can cause severe process instabilities. The reason for this
is that nitrogen-rich feedstocks will lead to ammonia
accumulation in the digester which can cause ammonia
inhibition (see section 2.3).
Carrying out a BMP test (biochemical methane
potential or biomethane potential, see Figure 5) for a
feedstock gives important information on how much
biogas will be produced from the feedstock and how fast
the degradation process will be. As BMP tests are rather
time consuming they are applied in special cases, for
example, if a completely new feedstock should be evaluated.

Process monitoring in biogas plants Process Monitoring Parameters
13
Table 1 Overview on relevant parameters and methods of analysis for the characterisation of biogas feedstocks (adapted from Drosg et al., 2013)
a) VDI – Verein Deutscher Ingenieure, Düsseldorf, Germany; ISO – International Organisation of Standardization, Geneva, Switzerland; EN – European Committee for Standardisation, Brussels, Belgium; APHA – American Public Health Association, Washington DC, USA; DIN – Deutsches Institut für Normung e. V., Berlin, Germany
Analysis Standarda) Title
pH value EN 12 176 Characterization of sludge – Determination of pH value
APHA 4500-H+ B pH value “Electrometric method”
Total solids (TS) / Dry matter (DM)
EN 12 880 Characterization of sludges – Determination of dry residue and water content
APHA 2540 B Total solids dried at 103 –105°C
Volatile solids (VS) / Organic dry matter (oDM)
EN 12 879 Characterization of sludges – Determination of the loss on ignition of dry mass
APHA 2540 E Fixed and volatile solids ignited at 550°C
Chemical oxygen demand (COD)
DIN 38 414 (s9) german standard methods for the examination of water, wastewater and sludge – sludge and sediments (group s) – Determination of the chemical oxygen demand (CoD) (s9)
APHA 5220 B Chemical oxygen demand (CoD) “open reflux method“
Total Kjeldahl nitrogen (TKN)
Iso 5663 Water quality – Determination of Kjeldahl nitrogen – Method after mineralisation with selenium
Iso 11261 soil quality – Determination of total nitrogen – Modified Kjeldahl method
APHA 4500-Norg B Nitrogen (organic) “Macro-Kjeldahl method”
Biochemical methane potential / Biomethane potential (BMP)
EN 11734 Water Quality – Evaluation of the “ultimate” anaerobic degradability of organic compounds in digested sludge – Method by measurement of the biogas production
DIN 38414 (s8) german standard methods for the examination of water, wastewater and sludge – sludge and sediments (group s) – Determination of the amenability to anaerobic digestion (s8)
VDI 4630 Fermentation of organic materials – Characterisation of the substrate, sampling, collection of material data, fermentation tests
Figure 5 set-up of a simplified test for measuring the biochemical methane potential (BMP). In a temperature-regulated environment (e.g. under meso-philic temperature) a fermenter flask with a mix of inoculum and feedstock is set up. The produced biogas passes a bottle of a NaoH solution, where the Co2 is retained. The gas which passes is considered to be CH4 and is measured by water displacement (for details see Drosg et al., 2013).
CO2 + CH4 water displacementCH4 ΔV measuring volume

Process monitoring in biogas plants Process Monitoring Parameters
14
3.1.2 Biogas production and gas compositionAs usual in biotechnological processes, the detailed
monitoring of the fermentation product, in this case
biogas, provides valuable information. Therefore, it is
recommended to monitor both the volume of gas pro-
duced and gas composition. With regard to process
monitoring, a change in either gas production or gas
composition can be an indicator of process imbalance.
Biogas production (biogas volume)In general, a large variety of devices can be applied for
measuring biogas production/volume:
Ultrasonic flow meters
Fluidistor oscillator probes
Turbine flow meters
Vortex flow meters
Dynamic pressure probes
Thermal flow meters
Diaphragm gas meters / bellows gas meters
In practice, as biogas is of variable gas composition,
dirty, corrosive, wet, and produced at low pressure,
measuring biogas volume accurately is one of the most
challenging parameters at a biogas plant. An overview of
the advantages and disadvantages of the different meas-
uring systems is given in Table 2. In general, gas flow
meters should be placed in a way that enables easy
removal and cleaning. Another important point is that
the complexity of the sensor (data transfer, calculation
effort, etc.) should suit the purpose of the plant.
Table 2 Overview of advantages and disadvantages of different sensors for gas volume measurement (adapted from Keitlinghaus, 2011 and Vaßen, 2012)
Sensor Type + -Ultrasonic flow meters • good results at low pressure
• No moving parts• Very reliable even at changing
process conditions
• Long straight measuring distance needed (15 times the diameter)
Fluidistor oscillator • No moving parts • High accuracy • Low cost • Easy handling, exchange and
cleaning
• Complex calculation to norm cubic meters • Error of 1.5% • sensitive to vibrations in the biogas caused by e.g. piston
compressors
Turbine flow meters • robust technology • Deposits can become problematic • Moving parts
Vortex flow meter • No moving parts • High durability • resistant to corrosion • Low pressure loss
• sensitive to disturbances in flow • Long straight measuring distance needed (30 times the diameter)
Dynamic pressure probes • Long durability • Dirty gas has little influence • Pressure fluctuations have no
negative effect on accuracy
• Works better at higher gas pressure • Large calibration effort • Error of 1.5-5% • For calculation of Nm³ the density (gas composition) is needed • Long measuring distance needed
Thermal flow meters • Easy handling • good for mobile applications • Direct measurement of Nm³/mass • Exact Measurement also at pres-
sure fluctuations
• No dirty biogas measurement possible • Measurement error of 3-5% (increases rapidly if gas is dirty) • Extremely sensitive to humidity • Long straight measuring distance needed • Calibration once a year
Diaphragm gas meters / bellows gas meters
• simple and cheap • Direct volume measurement • robust technology
• Corrosion, fouling or deterioration of gas meter by biogas compo-nents and particles
• Increased utilization time decreases accuracy of measurements • External calibration and maintenance

Process monitoring in biogas plants Process Monitoring Parameters
14
According to Vaßen (2012) the best options for meas-
uring raw biogas are ultrasonic flow meters (see Figure 6)
and fluidistor oscillator meters becauses water and cor-
rosive components in the biogas can be managed and
accurate measurements at low gas pressures are possible.
In addition, turbine flow meters, vortex flow meters and
dynamic pressure probes are useful options. However,
deposits or biofilms can pose problems in long-term
operation so that regular maintenance and cleaning
should be facilitated. In less sophisticated or rather small-
scale biogas plants diaphragm meters or bellows meters
are in use (Clemens, 2012). However, in the long run
such mechanical gas meters can pose considerable prob-
lems due to corrosion, fouling or general deterioration
when measuring raw biogas. Biogas can also be measured
after cleaning and drying in order to avoid problems
caused by humidity or corrosion. However, in this case
the direct on-line information of gas production is lost
and this is of great interest for process monitoring. Gas
drying and cleaning is a prerequisite if for example ther-
mal flow meters are used.
Apart from monitoring the fermentation product, the
biogas volume measurement can be used to calculate the
biogas yield, per unit of mass input of organic material,
which is an important parameter (e.g. Nm³ t-1 VS). For
obtaining accurate biogas yields, measurements should
be made over a period of about a week and during a time
where feedstock mix and OLR remain constant. This
parameter gives a good overall view of the performance
of the degradation process. As a comparison, measured
biogas yields are in the range of 200-500 Nm³ t-1 VS for
cow manure, 450-700 Nm³ t-1 VS for corn silage and
200-500 Nm³ t-1 VS for food
waste (FNR, 2004).
Maximum theoretical biogas yields possible are
746 Nm³ t-1 VS for carbohydrates, 1390 Nm³ t-1 VS for
lipids and 800 Nm³ t-1 VS for proteins (VDI 4630, 2006).
Biogas compositionMany biogas plant operators install on-line measur-
ing devices for gas composition (see Figure 7), but port-
able gas composition measuring devices are also in use
(FNR, 2004). Gas composition measurements include
CH4 and CO
2, which are measured by infrared or thermal
conductivity sensors, as well as in most cases H2S and O
2,
which are determined by electrochemical sensors (LfL,
2007).
Biogas composition is a useful parameter for process
monitoring. A decrease in methane content can be a first
sign of organic overload (see section 2.1.2), provided that
the feedstock mix has not recently changed. Similarly, a
sudden increase in H2S can provoke process instability.
Yet, as changes in biogas production and composition
can have various causes (not always process stability
problems) they should always be interpreted together
with the early indicators of process imbalance (parame-
ters such as alkalinity ratio, VFA concentrations, etc., see
section 3.2.1). In some cases H2 is also measured within
gas composition measurements. However, as H2 concen-
tration is considered a
very early indicator of
process imbalance it
is therefore described
separately in section 3.2.1.
Figure 6 Automated ultrasonic flow meter for biogas volume measurement (reproduced with the kind permission of Endress+Hauser).
Figure 7 on-line measurement system for biogas composition (reproduced with the kind permission of Awite Bioenergie).

Process monitoring in biogas plants Process Monitoring Parameters
16
3.1.3 Fermentation temperatureIt is essential to control process temperature in the
biogas digester, as a stable temperature is necessary for a
high performance of the microbes (see section 2.2). The
optimal fermentation temperature mainly depends on
the microbes involved and lies between 36 and 43°C for
mesophilic degradation and between 50 and 65°C for
thermophilic degradation. In addition, fermentation
temperature has an influence on other parameters such
as the dissociation of ammonia, for example, and its
inhibitory effect. At higher temperature the concentra-
tion of the undissociated form of ammonia (NH3(aq)
)
increases and thermophilic fermentation is therefore
disadvantageous when degrading protein-rich feed-
stocks.
For temperature measurements, Pt100 thermome-
ters are normally used which are common industrial
thermometers applied in food or biotech industry (see
Figure 8). As faulty temperature measurements tend to
occur, Weiland (2008) recommends measuring the tem-
perature at different locations in a digester.
3.1.4 Total solids (TS) / dry matter (DM)The TS content in a digester (for methods of analysis
see Table 1) can be used as an indicator of the viscosity
of the fermentation broth in the reactor. In CSTR reac-
tors the viscosity should not increase a certain level
because then stirring problems can occur or the digester
content cannot be pumped anymore. In wet fermenta-
tion systems which represent the majority of the existing
biogas processes, TS concentration should normally not
exceed 10% (LfL, 2007). This will ensure ease of pump-
ing and mixing of digester contents. If fibrous feedstocks
are involved (e.g. grass silage), an increased TS concen-
tration can lead to stirring problems. In these cases, dilu-
tion with fresh water, digestate, liquid feedstock or pro-
cess water is often necessary (Resch et al., 2008). Moni-
toring the TS in the digester can give feedback to the
plant operator on the sufficiency of dilution. It can also
be useful to measure and compare TS and VS of feed-
stock and digestate to determine the proportion of feed-
stock TS and VS degraded (see section 3.1.1). The liquid
fraction of digestate can be used as process water, for
example the liquid after separation by screw press sepa-
rators or centrifuges.
3.1.5 pH valueThe pH value gives an approximate indication on the
state of the fermentation process. Due to the buffer
capacity in biogas plants, which is dependent on dis-
solved CO2, carbonate and ammonia, a detectable pH
change takes place only after process instability has
started. Therefore the measurement of the pH value is
not suitable as early indicator of process imbalance, but
gives important information for process monitoring.
In most biogas plants the pH is measured off-line
after taking samples from the digester by a laboratory
pH-meter (see Figure 9). The reason is that on-line pH-
measurement is problematic due to rapid fouling of the
electrode and subsequent requirement for regular clean-
ing and calibration. This requires special adapters which
allow the removal of the electrode without causing leaks.
In practice off-line pH measurements are often not as
accurate as on-line measurements due to the effects
from variability of sampling, sample storage and sample
temperature during measurement. If possible, the off-
line pH measurements should always be carried out at
similar temperatures, in order to achieve comparability.
Figure 9 Laboratory pH meter (reproduced with the kind permission of Mettler-Toledo).
Figure 8 on-line Pt100 temperature sensor (reproduced with the kind permission of JUMo Meß- und regelgeräte).

Process monitoring in biogas plants Process Monitoring Parameters
17
3.1.6 Ammonium nitrogen (NH4-N)Ammonium nitrogen (NH
4-N) is one of the digestion
products in anaerobic digestion. If nitrogen-rich feed-
stocks are used, inhibition by ammonia is often the rea-
son for a process imbalance (see section 2.3). Therefore,
monitoring NH4-N concentrations in the digester helps
to estimate if ammonia inhibition is causing the process
imbalance.
The NH4-N can be analysed by automated laboratory
systems (see Figure 10) according to US-American stand-
ard “APHA 4500-NH3-Nitrogen” (APHA, 1998) or the
German industry standard DIN 38406-5:1983-10 (1983).
Based on NH4-N concentration, it is also possible to cal-
culate the free ammonia (NH3(aq)
) which is the inhibitory
form of NH4-N. For NH
3(aq) calculation according to the
following formula (Hansen et al., 1998), the pH and tem-
perature in the digester are needed:
Within this brochure it is recommended to use the
directly measurable NH4-N (and not NH
3(aq)) as the
monitoring parameter. The reason is that the calculation
of NH3(aq)
is strongly dependent on a very accurate deter-
mination of the pH inside the digester. As indicated in
section 3.1.5, in practice the pH is often measured off-
line, which makes the determination of the exact pH
inside the digester very difficult. As a consequence, even
a slight deviation of the pH (e.g. 0.2 pH units) can have a
big influence on the calculated NH3(aq)
. On the contrary,
the measurement of NH4-N in the digester is very exact.
It is noted that very skilled biogas plant operators may
manage to establish their own monitoring system based
on calculating NH3(aq)
from NH4-N.
3.2 Early indicators of process imbalanceParameters that are considered early indicators of
process imbalance are:
Volatile fatty acids (total VFA, individual VFA)
Alkalinity ratio (FOS/TAC)
Hydrogen
Redox potential
Complex monitoring of mixed parameters (NIRS
or electronic nose)
These parameters can indicate in advance if a process
imbalance is impending. Yet, they do not give direct
information of the cause for the process imbalance. For
an interpretation of the process imbalance, the recorded
parameters characterising the process (see section 3.1)
are to be used. In general, only one (or two) of the follow-
ing parameters are used in one monitoring scheme.
[NH3(aq)
] = [NH4-N] / (1 + 10–pH / 10– (0.09018+(2729.92/T)))
[NH3(aq)
] Concentration of free ammonia in mg L-1
[NH4-N] Concentration of total ammoniacal nitrogen
(free ammonia + ammonium) in mg L-1
pH pH valueT Temperature in K
Figure 10 Automated distillation laboratory system for measuring ammonium nitrogen (NH4-N), Total Kjeldahl nitrogen (TKN) can also be determined after a sample pre-treatment (© Markus ortner, IFA Tulln)

Process monitoring in biogas plants Process Monitoring Parameters
18
3.2.1 Volatile fatty acids (VFA)Volatile fatty acids (VFA) are short-chained volatile
organic acids such as acetic acid, propionic acid, butyric
acid and valeric acid or branched isomers of them (iso-
butyric acid, etc.). They are intermediate metabolites in
the anaerobic digestion process that are produced dur-
ing the acidification step (acidogenesis) and are precur-
sors of methane (see Figure 1). As a consequence, if they
accumulate this often means that methanogenesis, the
biological transformation to methane, is inhibited. In
general, according to Buchauer (1997) various methods
can be applied for VFA measurement, such as steam
distillation, colorimetric methods, chromatographic
methods or titrimetric methods. This brochure will
focus on the methods most commonly applied. In gen-
eral, for biogas process monitoring, two VFA parameters
are used: individual VFA concentration and total VFA
concentration.
Individual VFA - measured by external high performance laboratoryMonitoring the concentrations of the individual
volatile fatty acids (individual VFA) in the digester gives
the best information on the state of the process. Their
analysis can give direct feedback on the interaction and
inhibition of the different groups of micro-organisms in
the reactor. A moderate accumulation of acetic acid in
the digester is normal, as acetic acid is the final precursor
to methane. Slight accumulation of propionic acid is
tolerable. The ratio of acetic acid to propionic acid is an
especially good indicator of process stability (Weiland,
2008; Marchaim and Krause, 1993). The accumulation
of butyric or valeric acid, and especially of their branched
isomers, is normally a sign of severe process instability.
The measurement of individual VFA is carried out by
chromatography methods such as HPLC (high pressure
liquid chromatography, see Figure 11) or GC (gas chro-
matography) analysis. For details of these methods see
Liebetrau et al., 2012. As chromatography equipment is
very expensive, such analyses are normally carried out by
external laboratories. In order to obtain reliable results
good sample handling, transport and storage are essen-
tial (see section 4.1.2).
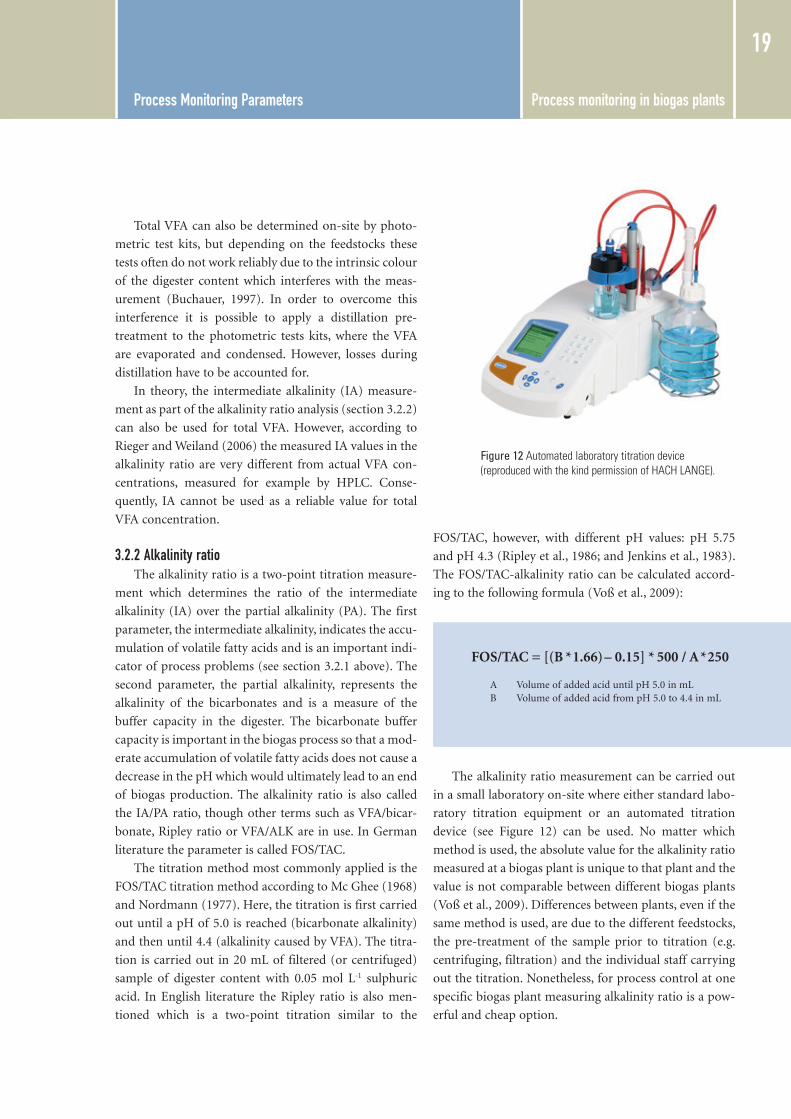
Total VFA - measurement at an on-site laboratory possibleThe parameter total VFA represents the concentra-
tion of the sum of all VFAs present. Total VFA can be
determined by titration methods, photometric methods
or, of course, by summing up the individual VFA (details
indicated above). In general, titration methods are rec-
ommended for total VFA determination because they
are cheap, robust and quick to carry out. An automated
titration device is shown in Figure 12.
In the literature (Buchauer, 1997; Buchauer, 1998;
Liebetrau et al., 2012) the titration method according to
Kapp (1984) is recommended. In this method the sam-
ple has to be free of suspended solids which is achieved
either by filtering the sample through a 0.45 μm mem-
brane filter (Buchauer, 1997) or centrifuging the sample
at 10,000g for 10 min (Liebetrau et al, 2012). Then,
20 mL of this sample is put through a three-point titra-
tion with 0.05 mol L-1 of sulphuric acid for pHs of 5.0,
4.3 and 4.0 (for details see Buchauer, 1998). Total VFA
can be calculated according to the following formula
(Liebetrau et al., 2012):
Total VFA [mg L-1] = [131,340 * (VpH4.0 – VpH5.0
) * NH2SO4 / Vsample] – [3.08 * VpH4.3
*NH2SO4/ Vsample *1,000] – 10.9
VpH4.0 Volume of added acid until pH=4.0 in mL
VpH4.3 Volume of added acid until pH=4.3 in mL
VpH5.0 Volume of added acid until pH=5.0 in mL
Figure 11 High pressure liquid chromatography (HPLC) measuring system for the determination of individual VFA
Vsample Volume of titration sample (recommended 20 mL, see Buchauer, 1997)NH2SO4
Normality of used acid (0.1 in case of 0.05 mol L-1 sulphuric acid)
Process monitoring in biogas plants Process Monitoring Parameters
19
Total VFA can also be determined on-site by photo-
metric test kits, but depending on the feedstocks these
tests often do not work reliably due to the intrinsic colour
of the digester content which interferes with the meas-
urement (Buchauer, 1997). In order to overcome this
interference it is possible to apply a distillation pre-
treatment to the photometric tests kits, where the VFA
are evaporated and condensed. However, losses during
distillation have to be accounted for.
In theory, the intermediate alkalinity (IA) measure-
ment as part of the alkalinity ratio analysis (section 3.2.2)
can also be used for total VFA. However, according to
Rieger and Weiland (2006) the measured IA values in the
alkalinity ratio are very different from actual VFA con-
centrations, measured for example by HPLC. Conse-
quently, IA cannot be used as a reliable value for total
VFA concentration.
3.2.2 Alkalinity ratioThe alkalinity ratio is a two-point titration measure-
ment which determines the ratio of the intermediate
alkalinity (IA) over the partial alkalinity (PA). The first
parameter, the intermediate alkalinity, indicates the accu-
mulation of volatile fatty acids and is an important indi-
cator of process problems (see section 3.2.1 above). The
second parameter, the partial alkalinity, represents the
alkalinity of the bicarbonates and is a measure of the
buffer capacity in the digester. The bicarbonate buffer
capacity is important in the biogas process so that a mod-
erate accumulation of volatile fatty acids does not cause a
decrease in the pH which would ultimately lead to an end
of biogas production. The alkalinity ratio is also called
the IA/PA ratio, though other terms such as VFA/bicar-
bonate, Ripley ratio or VFA/ALK are in use. In German
literature the parameter is called FOS/TAC.
The titration method most commonly applied is the
FOS/TAC titration method according to Mc Ghee (1968)
and Nordmann (1977). Here, the titration is first carried
out until a pH of 5.0 is reached (bicarbonate alkalinity)
and then until 4.4 (alkalinity caused by VFA). The titra-
tion is carried out in 20 mL of filtered (or centrifuged)
sample of digester content with 0.05 mol L-1 sulphuric
acid. In English literature the Ripley ratio is also men-
tioned which is a two-point titration similar to the
FOS/TAC, however, with different pH values: pH 5.75
and pH 4.3 (Ripley et al., 1986; and Jenkins et al., 1983).
The FOS/TAC-alkalinity ratio can be calculated accord-
ing to the following formula (Voß et al., 2009):
The alkalinity ratio measurement can be carried out
in a small laboratory on-site where either standard labo-
ratory titration equipment or an automated titration
device (see Figure 12) can be used. No matter which
method is used, the absolute value for the alkalinity ratio
measured at a biogas plant is unique to that plant and the
value is not comparable between different biogas plants
(Voß et al., 2009). Differences between plants, even if the
same method is used, are due to the different feedstocks,
the pre-treatment of the sample prior to titration (e.g.
centrifuging, filtration) and the individual staff carrying
out the titration. Nonetheless, for process control at one
specific biogas plant measuring alkalinity ratio is a pow-
erful and cheap option.
Total VFA [mg L-1] = [131,340 * (VpH4.0 – VpH5.0
) * NH2SO4 / Vsample] – [3.08 * VpH4.3
*NH2SO4/ Vsample *1,000] – 10.9
VpH4.0 Volume of added acid until pH=4.0 in mL
VpH4.3 Volume of added acid until pH=4.3 in mL
VpH5.0 Volume of added acid until pH=5.0 in mL
FOS/TAC = [(B *1.66)– 0.15] * 500 / A *250
A Volume of added acid until pH 5.0 in mLB Volume of added acid from pH 5.0 to 4.4 in mL
Figure 12 Automated laboratory titration device (reproduced with the kind permission of HACH LANgE).

Process monitoring in biogas plants Process Monitoring Parameters
20
3.2.3 HydrogenHydrogen is an intermediate metabolite and is pro-
duced at various stages of the anaerobic digestion pro-
cess (Figure 1). Even a slight increase of H2 concentra-
tion can be sufficient to impede degradation of volatile
fatty acids (especially propionic acid) in the biogas pro-
cess (Speece, 1996). For this reason in a stable digestion
process hydrogen concentration has to be kept very low,
typically at <100 ppm (Speece, 1996). This is also neces-
sary, as according to the chemical conditions hydrogen
utilising microbes can only gain energy at such low con-
centrations.
As a consequence, hydrogen concentration can be
valuable information for process monitoring, especially
as a change in hydrogen concentration occurs before
VFA or alkalinity ratio measurements indicate changes.
Yet, in practice accurate hydrogen measurement in
biogas is challenging1 and therefore it is currently not
recommended to rely solely on hydrogen for process
monitoring. Nevertheless a few biogas plants exist which
rely solely on H2 measurements for monitoring process
stability. In these cases the biogas plant operator should
be experienced and it is very important to check the reli-
ability of the H2 measurements over time.
Currently, if hydrogen is monitored at a biogas plant,
it is measured by electrochemical sensors in the gas
phase together with standard biogas composition meas-
urements (see section 3.1.2). In future, the measurement
of dissolved H2 inside the digester by an electrode could
become an interesting alternative (Zosel et al. 2008,
Liebetrau et al. 2012).
3.2.4 Redox potentialAs opposed to aerobic microbes, anaerobic microbes
need a negative redox potential for their metabolism. In
the case of strict anaerobic microbes, which are present
in a biogas plant, the redox potential should be lower
than -300 mV. The redox potential is measured by a
redox electrode which determines the voltage between
oxidising substances (electron donors) and reducing
substances (electron acceptors) that are dissolved in the
digester content (Rieger and Weiland, 2006).
For process monitoring the redox potential is a very
sensitive parameter to changes in the digester. According
to Weiland (2008), the redox potential reacts faster to an
impending process imbalance than, for example, the
alkalinity ratio. However, changes in the feedstock mix
or in the pH will cause a change in the redox potential,
although no process imbalance is impending (Weiland,
2008). In addition, due to fouling problems the electrode
will have to be taken out and cleaned frequently (Rieger
and Weiland, 2006). Due to the problems mentioned
and the complexity of redox measurements, redox elec-
trodes are seldom applied in biogas plants.
3.2.5 Complex monitoring of mixed parametersDifferent methods exist for on-line process monitor-
ing, where no single substances or parameters are meas-
ured, but an overall process signal which is a mixture of
different influencing parameters. Such approaches are
near-infrared spectroscopy (NIRS) or an “electronic
nose”. Up to now such methods have not often been in
use at biogas plants. However, these methods have the
big advantage of being on-line and data can be down-
loaded for monitoring at any time on any interfaced
computer.
Near infra-red spectrometry (NIRS)A transmitter of near infra-red radiation (800-2500
nm wavelength) is installed in a pipe of the reactor outlet
or input. The transmitted radiation is partially absorbed
by mainly organic molecules and depending on their
molecular structure (O-H, N-H, C-H or COOH bond-
ing) radiation with specific wave lengths are re-emitted.
This radiation spectrum is measured by a detector and
analysed. By comparison with known spectra of specific
substances of known concentration the measured spec-
tra are analysed using multivariate statistical methods. A
range of monitoring parameters can be estimated by
NIRS measurements, such as TS, VS, COD, total VFA,
acetic acid, propionic acid, pH, alkalinity, etc. (Andree et
al., 2008)
1 Unfortunately, in practice the hydrogen measurement in the biogas is often problematic due to cross sensitivity with hydrogen sulphide. There-fore, for H
2 measuring systems H
2S must be removed before the measurement. Further possible drawbacks are: increased response time due to
the large headspace volumes in biogas plants, undefined reduction of the H2 concentration by microbial activity (headspace or desulphurization
unit), diffusion of hydrogen through sealing material, and reduced partial pressure due to delayed hydrogen mass transfer from the fermentation broth into the gas phase. (Liebetrau et al., 2012)

Process monitoring in biogas plants Process Monitoring Parameters
21
NIRS technology is already successfully applied in
chemical and pharmaceutical industries (Andree et al.,
2008). According to Ward et al. (2008) NIRS shows
promise as an on-line monitoring technique in anaerobic
digestion because the high water content does not inter-
fere with the spectra and several parameters can be meas-
ured together with one single instrument and no sample
preparation is needed. Nonetheless, until now NIRS
technology has been applied to only a limited number of
biogas plants. The biggest disadvantage is the substantial
effort which is needed to calibrate the equipment, apart
from considerable investment costs.
An intensive learning process is required to use a
NIRS system, where a large number of samples are taken
during operation of the plant. These samples are analysed
off-line in a laboratory and then compared to the NIRS
spectra taken on-line at the plant. In addition, a NIRS
system has to be adapted to changes in feedstocks or
measuring environment (Andree et al., 2008).
Electronic noseAccording to Gilles (2013) an electronic nose is an
electronic device which is composed of an array of non-
specific gas sensors (e.g. metal oxide semi-conductors)
which is used for the detection and recognition of spe-
cific compounds that are associated with odours. This
device can be used on-line to detect process disorders in
the digestion process. Using an electronic nose for pro-
cess control has shown promising results at research scale
(Gilles, 2013), but up to now it is not applied in biogas
plants.
3.3 Variable process parametersParameters considered as variable process parameters
are:
Organic loading rate
Hydraulic retention time
These parameters can be influenced by the plant
operator. Yet, in a biogas plant that is running at full load
these parameters are often not altered as a constant rate
of biogas production or high throughput rates of feed-
stock in the process are required. In practice, these
parameters are altered if a change in feedstock mix occurs
or process instability demands a reduction of feed.
3.3.1 Organic loading rate (OLR)The organic loading rate is a measure of the quantity
of organic matter fed into a digester per unit volume of
digester (normally given as kg VS m-3 d-1 or kg COD m-3 d-1).
During start-up of a biogas plant the OLR is normally
increased slowly to working conditions in order to adapt
the microorganisms to the operating environment. The
critical issue with the OLR is that if it is too low the pro-
ductivity of the biogas plant is low and if it is too high it
can lead to organic overload and acidification (see sec-
tion 2.1.2). The average organic loading rate in meso-
philic agricultural CSTR digesters is 3.0 kg VS m-3 d-1
(FNR, 2009).
3.3.2 Hydraulic retention time (HRT)The hydraulic retention time (HRT) is the average
time during which the feedstock remains in the biogas
digester. In practice, the large majority of existing biogas
plants are CSTR reactors and do not have special reten-
tion systems for the microbes. The retention time of the
microbes in such systems can be assumed equal to the
HRT. For the calculation of the retention time all input
(feedstocks and water) to the digester has to be considered:
In more complicated biogas plants characterised by
designs used for wastewater treatment, the aim is to
retain microbes in the reactor so that the microbe reten-
tion time (also called solids retention time) is much
larger than the hydraulic retention time (retention time
of the liquid). Such a reactor design is the up-flow anaer-
obic sludge blanket (UASB) reactor or the anaerobic filter.
Low HRT can lead to hydraulic overload (see section
2.1.3), which leads to the washing out of the microbes
whereas a HRT which is too high leads to a low produc-
tivity (Nm³ biogas m-3 of digester volume) of the biogas
plant. If solid feedstocks are used, the retention time can
be regulated by the amount of fresh water or process
water used (e.g. process water can be the liquid fraction
of digestate after solid-liquid separation, for example by
HRT (d) = V
digester / V
input
Vdigester
Total digester volume (m3)V
input Total daily input to digester (m³ d-1)

Process monitoring in biogas plants Process Monitoring Implementation
22
screw presses or centrifuges). However, since in many
biogas plants TS values must be kept low because of
potential stirring problems at high viscosity, the possi-
bilities of varying the retention time are limited. Apart
from low productivity, an excessively-diluted fermenta-
tion broth produces high amounts of digestate, com-
pared to no or moderate dilution, with the consequence
that larger digestate storage facilities may be needed.
4 Process Monitoring Implementation
In this section a description is given how a process
monitoring scheme can be introduced. First, monitoring
data have to be obtained (either on-line or off-line),
which largely depends on the plant infrastructure. Then,
stability limits for different monitoring parameters are
presented and recommended intervals for their
measurement. Finally, monitoring costs are given and
the importance of training plant operators is emphasised.
4.1 Obtaining process monitoring data Monitoring data can either be obtained on-line,
which means that the measurement is done directly in
the process with no time difference between the sam-
pling and the analysis, or off-line which means labora-
tory analysis is carried out after sampling. The quality of
on-line data is better than off-line data because process
information can be derived without a loss in time and
countermeasures can be taken quickly. Nevertheless,
even in highly sophisticated biogas plants, some process
parameters are still commonly measured off-line by
sampling the digester contents.
4.1.1 On-line monitoring dataMany biogas plants have automat-
ed operating systems and on-line
monitoring of process information
(e.g. mass input, biogas production,
gas composition and temperature)
and other parameters (e.g. tank levels
etc.) (Figure 13). Consideration of
process monitoring in Germany where
there are more than 9,000 medium- to
Figure 13 View of the monitor of the operating system in a biogas plant (such operating systems record data such as mass input, fermentation temperature, digester filling levels and biogas flow automatically. reproduced with the kind permission of r(o)HKrAFT).
Process monitoring in biogas plants Process Monitoring Implementation
23
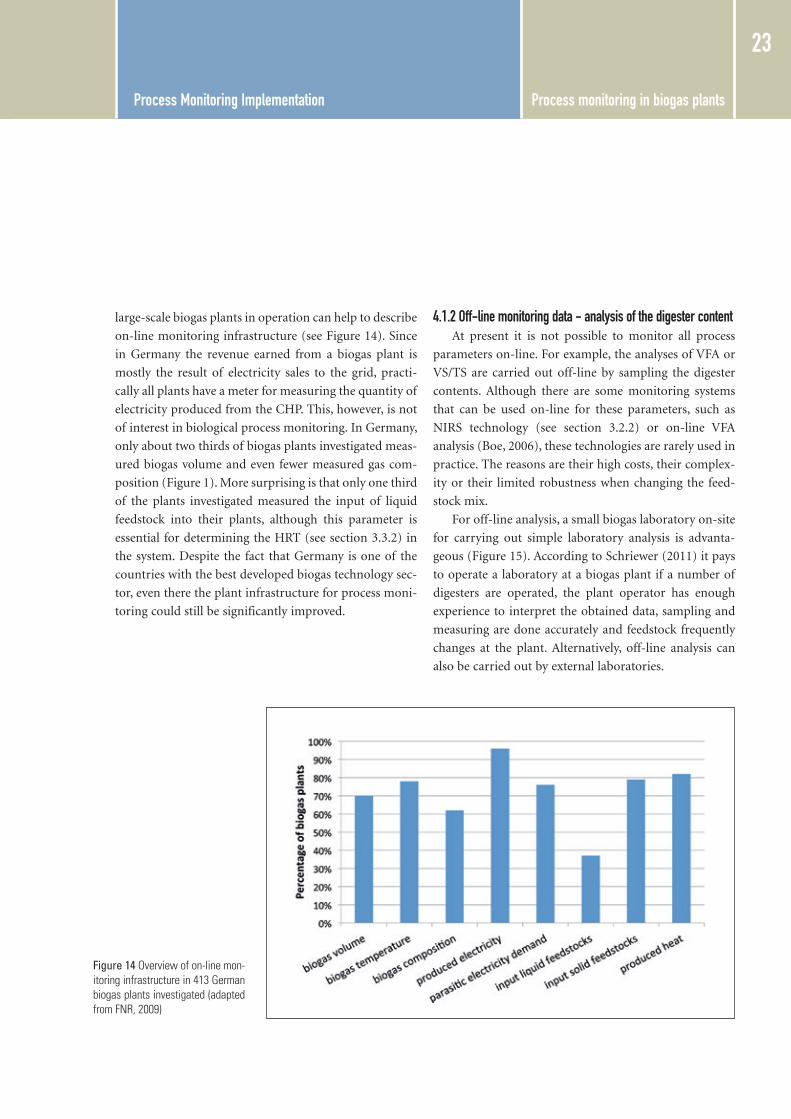
large-scale biogas plants in operation can help to describe
on-line monitoring infrastructure (see Figure 14). Since
in Germany the revenue earned from a biogas plant is
mostly the result of electricity sales to the grid, practi-
cally all plants have a meter for measuring the quantity of
electricity produced from the CHP. This, however, is not
of interest in biological process monitoring. In Germany,
only about two thirds of biogas plants investigated meas-
ured biogas volume and even fewer measured gas com-
position (Figure 1). More surprising is that only one third
of the plants investigated measured the input of liquid
feedstock into their plants, although this parameter is
essential for determining the HRT (see section 3.3.2) in
the system. Despite the fact that Germany is one of the
countries with the best developed biogas technology sec-
tor, even there the plant infrastructure for process moni-
toring could still be significantly improved.
4.1.2 Off-line monitoring data - analysis of the digester contentAt present it is not possible to monitor all process
parameters on-line. For example, the analyses of VFA or
VS/TS are carried out off-line by sampling the digester
contents. Although there are some monitoring systems
that can be used on-line for these parameters, such as
NIRS technology (see section 3.2.2) or on-line VFA
analysis (Boe, 2006), these technologies are rarely used in
practice. The reasons are their high costs, their complex-
ity or their limited robustness when changing the feed-
stock mix.
For off-line analysis, a small biogas laboratory on-site
for carrying out simple laboratory analysis is advanta-
geous (Figure 15). According to Schriewer (2011) it pays
to operate a laboratory at a biogas plant if a number of
digesters are operated, the plant operator has enough
experience to interpret the obtained data, sampling and
measuring are done accurately and feedstock frequently
changes at the plant. Alternatively, off-line analysis can
also be carried out by external laboratories.
Figure 14 overview of on-line mon-itoring infrastructure in 413 german biogas plants investigated (adapted from FNr, 2009)

Process monitoring in biogas plants Process Monitoring Implementation
24
Sampling of digester contentIn order to obtain accurate data, representative sam-
ples, correct sample handling and accurate measure-
ments are essential. Standard methods are available for
the sampling of sludge and wastewater (e.g. ISO 5667-13
(2011)) and for biogas digesters (e.g. VDI 4630 (2006)).
To illustrate the importance of sampling and sample
treatment, the effect of the different steps of an analysis
on the accuracy of a result is shown in Figure 16. It can
be seen clearly that the biggest error occurs during sam-
ple taking. The second biggest influence on error is sam-
ple treatment and preparation. The analysis itself nor-
mally causes the smallest error. So in practice, if a result
does not seem plausible it should be checked for any
possible sampling and analysis errors. If doubts still
remain, a new sample should be taken and analysed.
For biological process monitoring samples are taken
directly from the digester and not the final storage tank.
In the case of two-step fermentation, either the final
digester or both digesters are sampled. Clean re-sealable
vials made of inert plastic, glass or steel should be used
as sample vials. A sample size of 0.5 L is generally suffi-
cient for a representative analysis due to the homogene-
ity of the material. Normally, the sample can be taken
from sampling valves or after a discharge pump. In order
to ensure that the sample is of fresh digestate, the first
amounts of digester content should be discarded before
collecting the sample (Figure 17), as the residual mate-
rial in the pipes and valves is usually not representative.
The samples should be immediately cooled to 4°C as
they are not biologically stable, and should remain at
4°C during transport and storage. For digester samples,
good sample handling and storage is important. For
example, VFA concentration can change dramatically if the
sample is not cooled during transport or storage. If
longer storage times (>1-2 weeks) are expected, for accu-
rate results the samples should be frozen before storage.
Figure 15 small-scale laboratory at an Austrian biogas plant. Minimum laboratory equipment consists of a pH-meter, a drying oven and a muffle furnace. Additional instrumentation for determination of NH4-N and titra-tion systems (alkalinity ratio or total VFA) are recommended (reproduced with the kind permission of r(o)HKrAFT).
Figure 16 Influence of different steps in the analysis of a sample on the total error (adapted from schwedt g, 2007)

Process monitoring in biogas plants Process Monitoring Implementation
25
As the digestate can be stored for up to several
months in the final storage tank before use as a fertiliser,
it does not make sense to sample it for biological process
monitoring. In addition, taking representative samples
from the final digestate storage tank can be quite compli-
cated, since it is often not stirred and as a consequence,
heavy particles sink to the bottom or light particles/fibres
remain on the surface. In practice, sampling the final
storage tank is used to determine the fertiliser value of
digestate and to help ensure efficient use of digestate as a
biofertiliser.
4.2 Process monitoring details and interpretationThe monitoring approaches presented are based on
experiences from an Austrian biogas plant monitoring
laboratory serving 30-50 biogas plants per year, inter-
views with biogas plant operators and literature. The
stability limits shown are derived from typical European
biogas plants processing for example biowaste, manure
or energy crops. They can in general be applied to meso-
philic CSTR (continuously stirred tank reactor) digesters
for wet fermentation (in the case of two-step fermenta-
tion, the stability limits correspond to the 2nd digester). As
with the presentation of the process parameters (see sec-
tion 3), the process monitoring interpretation will also be
divided in the following sections:
Monitoring process characteristics
Monitoring process stability
The approaches presented serve as a starting point
guideline for a biogas plant operator who is interested in
establishing process monitoring at a biogas plant. In
order to achieve a good monitoring scheme they will
need adaptation to their specific plant conditions. In
general, the intensity of biogas monitoring which should
be applied at a biogas plant depends on the following fac-
tors:
Frequency of changes in feedstock type and com-
position
Current state of the biogas plant (stable, unstable)
Digestion / reactor type (simple versus high perfor-
mance)
4.2.1 How to use the suggested stability limitsAs already pointed out in section 2, process stability
in biogas plants is influenced by a large number of inter-
dependent factors, such as: temperature, pH, buffer
capacity, ammonia concentration, composition and
adaptation of microbial consortia, bioavailability of trace
elements and retention time (see section 2). Therefore it
is difficult to give clear limits for single parameters that
define a stable plant.
Defining stability limitsFigure 18 illustrates why it is difficult to define clear
monitoring stability limits. An ideal stability limit (Figure
18a) would indicate that all processes with lower values
than the stability limit are stable, whereas processes with
higher values are unstable. In-field monitoring data
(Laaber, 2011) which are shown in Figure 18 demonstrate
why the definition of stability limits is not so easy in
practice. The presented data originate from monitoring
the digesters of 51 biogas plants, over a longer period of
time (in total, 273 values). According to Laaber (2011),
Figure 17 sampling of the digester content at a biogas plant. At the sampling valve the first output of the digester is discharged and then the sample is taken. Adequate clothing and gloves should be used during sampling (© IFA Tulln).

Process monitoring in biogas plants Process Monitoring Implementation
26
digesters were considered stable if during the period of
sampling according to the biogas operator no indica-
tions of process instability had occurred. On the con-
trary, digesters were considered unstable if either the
biogas plant operator had contacted the biogas labora-
tory directly due to process problems (mainly reduction
of biogas production) or the authorities had declared the
plant unstable due to excessive odour emissions caused
by incompletely digested biogas slurries.
Figure 18b shows that stable digesters had a total
VFA-concentration up to 4,300 mg L-1, while unstable
digesters showed VFA-concentrations from 1,100 mg L-1
upwards. In between, there existed stable as well as
unstable plants (the overall relation of stable to unstable
data points was 1.3:1, the ratio of stable to unstable data
points in the grey area was 1.9:1). So, in practice the
stability limit for e.g. total VFA concentration, which is
considered to be a good monitoring parameter, is not a
single value but is a range from 1,100-4,300 mg L-1
(see Figure 18b). As a simplification, a range from
1,000 – 4,000 mg L-1 is used for the stability limits in
Table 6.
For NH4-N the range of concentrations in the grey
area is even greater than for VFA (Figure 18c). This is
despite the fact that increased NH4-N concentrations
will lead to increased NH3(aq)
which is considered inhibi-
tory (see section 2.3). This large range is explained first
of all by the fact that the concentration of the inhibitory
NH3(aq)
is dependent not only on NH4-N concentration,
but also on temperature and pH. Secondly, anaerobic
microbes exhibit the ability to adapt to high NH4-N
concentrations (see section 2.3). For example, if a biogas
plant is accustomed to low or moderate NH4-N concen-
tration (< 3,000 mg L-1) a sudden and rapid increase to
e.g. 5,000 mg L-1 could lead to process instabilities,
whereas if the anaerobic microbes are adapted slowly,
stable digestion processes could take place even beyond
5,000 mg L-1. For all these reasons NH4-N is not consid-
ered suitable for monitoring process stability, but for
monitoring process characteristics (see section 3.1).
Figure 18 stability limits between stable and unstable fermentation processes (data provided by Laaber, 2011) – line and grey areas indi-cate stability limits. (a) ideal situation where processes with values below a single stability limit are stable and those above are unstable, (b) measured total VFA concentrations in 51 biogas plants - values are found in a wide range, values of stable and unstable digesters over-lap, (c) NH4-N concentration values of stable and unstable fermenta-tion processes
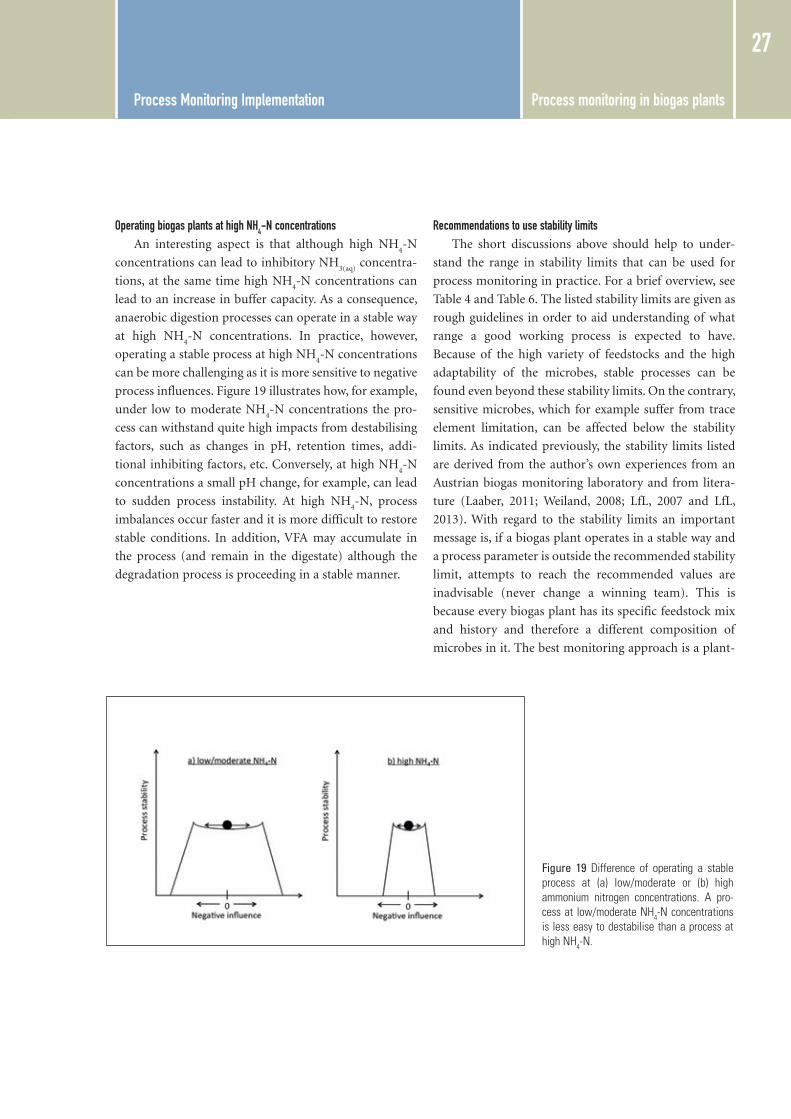
Process monitoring in biogas plants Process Monitoring Implementation
27
Operating biogas plants at high NH4-N concentrationsAn interesting aspect is that although high NH
4-N
concentrations can lead to inhibitory NH3(aq)
concentra-
tions, at the same time high NH4-N concentrations can
lead to an increase in buffer capacity. As a consequence,
anaerobic digestion processes can operate in a stable way
at high NH4-N concentrations. In practice, however,
operating a stable process at high NH4-N concentrations
can be more challenging as it is more sensitive to negative
process influences. Figure 19 illustrates how, for example,
under low to moderate NH4-N concentrations the pro-
cess can withstand quite high impacts from destabilising
factors, such as changes in pH, retention times, addi-
tional inhibiting factors, etc. Conversely, at high NH4-N
concentrations a small pH change, for example, can lead
to sudden process instability. At high NH4-N, process
imbalances occur faster and it is more difficult to restore
stable conditions. In addition, VFA may accumulate in
the process (and remain in the digestate) although the
degradation process is proceeding in a stable manner.
Recommendations to use stability limitsThe short discussions above should help to under-
stand the range in stability limits that can be used for
process monitoring in practice. For a brief overview, see
Table 4 and Table 6. The listed stability limits are given as
rough guidelines in order to aid understanding of what
range a good working process is expected to have.
Because of the high variety of feedstocks and the high
adaptability of the microbes, stable processes can be
found even beyond these stability limits. On the contrary,
sensitive microbes, which for example suffer from trace
element limitation, can be affected below the stability
limits. As indicated previously, the stability limits listed
are derived from the author’s own experiences from an
Austrian biogas monitoring laboratory and from litera-
ture (Laaber, 2011; Weiland, 2008; LfL, 2007 and LfL,
2013). With regard to the stability limits an important
message is, if a biogas plant operates in a stable way and
a process parameter is outside the recommended stability
limit, attempts to reach the recommended values are
inadvisable (never change a winning team). This is
because every biogas plant has its specific feedstock mix
and history and therefore a different composition of
microbes in it. The best monitoring approach is a plant-
Figure 19 Difference of operating a stable process at (a) low/moderate or (b) high ammonium nitrogen concentrations. A pro-cess at low/moderate NH4-N concentrations is less easy to destabilise than a process at high NH4-N.
Process monitoring in biogas plants Process Monitoring Implementation
28
specific approach. Therefore, it is necessary to continu-
ously measure and document process parameters, in
order to have a history of parameters with which to
compare. Only in this way it is possible to establish real-
istic stability limits for each biogas plant for stable
operation and to detect in advance if a process imbal-
ance is impending.
4.2.2 Monitoring process characteristicsMonitoring of process characteristics is the first part
of a good monitoring scheme. The data of the plant his-
tory are gathered and changes of process parameters are
documented. First, an upcoming process instability is
detected by monitoring the parameters of process stabil-
ity (see section 3.1 and section 4.2.3). Then, the cause for
the upcoming instability can be found by analysing
changes of the parameters characterising the process.
Consequently, the plant operator has a hint how he/she
can act to prevent the instability.
Table 3 shows the parameters which can potentially
be used for monitoring process characteristics and Table
4 gives rough guidelines in which parameter range a
stable process is expected to be. In addition, Table 3 gives
recommended frequencies of analysis as well as addi-
tional information for using the parameters. The recom-
mended frequency of measurement is divided into the
following three scenarios, depending on the needs of the
specific biogas plant:
Minimum monitoring
Standard monitoring
Advanced monitoring
Minimum monitoring is considered for domestic or small-
scale biogas plants (to a size of about 50 kWe CHP; 500
cows). Here, financial returns limit the level of invest-
ment and it is usual to apply a minimum of monitoring,
either on-line or off-line. Nevertheless, it is important
that some monitoring is carried out. This should include
daily feedstock inputs, daily gas production, daily digest-
er temperature and weekly pH.
Standard monitoring should be applied in many small to
middle-scale biogas plants in an agricultural context
which use quite similar feedstocks all year round. Such
plants are normally less prone to process instability,
especially if manures are used, as these add new micro-
organisms as well as trace elements to the process.
Another stabilising factor is a long hydraulic retention
time (> 50 d) which reduces the possible occurrence of
process instabilities.
Advanced monitoring is required if a high frequency of
changes of the feedstock mix occurs at the plant because
the risk of process instability is much higher. Feedstock
changes at least once per week and large variation of
composition mean high frequency can be considered.
Such frequent feedstock changes are especially the case
in waste treatment plants. In addition, advanced process
monitoring is beneficial if a high performance biogas
process is to be established. This is either the case in
mono-digestion of industrial by-products or in large-
scale digesters where a slight increase in performance
can result in a considerable increase in revenue.

Process monitoring in biogas plants Process Monitoring Implementation
29
PARAMETERFREQUENCY
COMMENTSmin. stand. adv.
INPU
T
Mass of feedstock input (liquid, solid)
daily / on-line
daily / on-line
daily / on-line
If no balances (e.g. weigh cells) are available a different way of estimating mass or volume of feedstock has to be established: filling levels, shovels, etc.
Characterisation of new feed-stocks (pH, TKN, Ts, Vs)
- -
depen-ding on occur-rence
The characterisation of new feedstocks can help to prevent destabilisation of the process; if quite similar feedstocks are always used, feedstock characterisation is not advantageous.
Biogas potential of new feed-stock (BMP)
- -
depen-ding on impor-tance
A BMP test can give information if a feedstock is anaerobically degradable and a biogas plant is an adequate treatment system. In addition, a first hint on the content of toxic substances in a feedstock can be given. According to the BMP test a realistic gas potential can be assumed.
PRO
CESS
PA
RAM
ETER
S
gas production daily dailyconti-nuous
Biogas is the final product of the anaerobic degra-dation process and should therefore be monitored. If neither a sudden change in feedstock quantity nor quality has occurred, a decrease in biogas production can indicate process instability. In any case, as biogas is the final product of the complex digestion process, if the process becomes unstab-le a decrease in biogas production will ultimately occur.
Biogas quality (CH4, Co2, H2s) -daily (min.
2x per week)
conti-nuous
Changes in methane or hydrogen sulphide concentration can give additional information for investigating process instabilities. A decline in methane concentration for example may indicate an upcoming process imbalance if feedstock mix has remained unchanged. The recommended measuring frequency depends on the infra-structure. If on-line gas composition analysis is available, measurements can be carried out more frequently.
Temperature in the reactor dailyconti-nuous
conti-nuous
Ideally temperature should be kept stable in a biogas process. If no heating is applied in the reactors (psychrophilic fermentation) normally no temperature measurement is necessary.
NH4-N - -1-2x per month
The recording of NH4-N helps to detect rapid changes in ammonia concentrations which can provoke process inhibition.
Ts, Vs - -1-2x per month
The determination of Ts, Vs in the process can help to monitor sufficient water content for pum-ping and stirring as well as overall degradation performance.
pH1x per week
daily (min. 2x per week)
daily
The pH value should be quite stable in an anae-robic digester. If strong deviations occur (e.g. pH decline due to acidification), the process is nor-mally already considered unstable. For this reason the pH value cannot be used as early indicator of process imbalance.
Table 3 Overview of proposed parameters for monitoring process characteristics in a biogas plant (number of parameters and frequency of measurement depend on intensity of monitoring required: minimum (min.) – standard (stand.) – advanced (adv.))

Process monitoring in biogas plants
30
4.2.3 Monitoring process stabilityMonitoring process stability is the second and core
part of a monitoring scheme. This part functions as an
alarm system that indicates in advance an impending
process instability. Together with the monitoring data of
process characteristics (section 4.2.2) the plant operator
has to decide which measures to take in order to avoid a
process instability.
For the establishment of a monitoring scheme the
plant operator should select one (or two) from the pre-
sented parameters for monitoring process stability (see
section 3.2 and Table 5). The most apropriate parameter
is dependent on the local conditions of the biogas plants.
Table 5 shows advantages and disadvantages of the dif-
ferent parameters as well as recommended frequencies
of their measurement. In general, either alkalinity ratio,
total VFA or individual VFA are the most common
parameters for monitoring process stability. The latter,
individual VFA, gives the best process information. It is,
however, also the most difficult to obtain due to the
expensive laboratory infrastructure needed. For this rea-
son, analysis in an external laboratory is required. In any
case, if a process imbalance is indicated by e.g. alkalinity
ratio, a one-off individual VFA measurement can also be
carried out to gain a more detailed picture of the process.
As an alternative, the H2 concentration in the process
also serves as a good monitoring indicator, as it is the
fastest indicator of an impending process imbalance.
However, due to possible measuring problems (see sec-
tion 3.2.1), it is not recommended to rely only on H2
measurements unless the plant operator is very skilled
and accurate measurements can be guaranteed.
Table 4 Important stability limits for parameters characterising the biogas process - data for mesophilic CSTR reactors and 2nd digester in the case of a two-step fermentation system (adapted from Laaber, 2011; Clemens, 2012 and LfL, 2007)
Range of parameter
Interpretation
NH
4-N
<5,000 mg L-1
In some cases NH4-N concentrations of 3,000-5,000 mg L-1 can already pose stability problems. A stable process up to 5,000 mg L-1 is commonly achievable especially if nitrogen concentration is increased slowly in order to allow microorganisms to adapt or an inoculum already adapted to high nitrogen concentrations is used for inoculation.
>5,000 mg L-1
It is possible to operate stable degradation processes beyond 5,000 mg L-1, however, it is often not an easy task. Microorganisms have to be adapted and in good condition (e.g. no lack in trace elements). The exact limit up to which a stable degradation process is possible depends on temperature, pH and the performance of the microor-ganisms. VFA will often be accumulated in the biogas plant, although the degradation process operates in a stab-le manner. High amounts of NH4-N increase the buffering capacity which supports a stable process. Nevertheless, the process is less robust against additional process problems and if an imbalance emerges it can be more drastic than at low nitrogen concentrations.
pH
7 - 8A stable biogas process is normally operated between pH 7 and 8. Yet, it is important to know that in practice temperature, sampling and storage can have an influence on pH measurement. The pH itself influences the disso-ciation of ammonia, hydrogen sulphide and volatile acids and by that their inhibitory effect.
< 7If volatile fatty acids accumulate (e.g. by organic overload) and exceed the buffering capacity, this will lead to a decline in pH. At pH values below 7 the activity of the microorganisms which degrade volatile fatty acids is reduced so that biogas production stops.
> 8
Increased alkalinity will lead to process instabilities. one reason is the pH-influence on the dissociation equilib-rium of NH3 and NH4
+. High pH values and increased temperature conditions favour the accumulation of NH3(aq), which is able to pass through microbial membranes, affecting the cellular osmoregulation and thus inhibits microbial performance.
TS
< 10 In CsTr reactors Ts concentration normally needs to be below 10% in order to prevent stirring problems.
> 10Ts values higher than 10% can lead to stirring problems in CsTr reactors. In other reactor types higher Ts concentrations are possible.
Process Monitoring Implementation

Process monitoring in biogas plants Process Monitoring Implementation
31
Nevertheless, hydrogen measurements can provide very
valuable additional information when monitoring by
VFA or alkalinity ratio.
The more complex approaches such as redox meas-
urement and NIRS can also be used for monitoring pro-
cess stability. In these cases it is necessary to guarantee
that they are working reliably at the biogas plant.
In practice, due to their complexity (and costs) they are
rarely applied.
For the interpretation of the obtained monitoring
data with regard to process stability the stability limits in
Table 6 can be used. For their usage, the indications on
how these stability limits have been established and as a
consequence how they should be used (see section 4.2.1)
should be kept in mind.
Parameter Definition Frequency Advantage Disadvantage
Total VFA [mg L-1] Concentration of the sum of the volatile fatty acids
2-4x per month
• simple, robust methods availa-ble (e.g. titration)
• Can be carried out in on-site laboratory
• suspended solids in the sample can negatively influence the analysis (high removal efficiency necessary e.g. by centrifuging)
• Intrinsic colour of sample can be-come problematic for photometric test kits
Individual VFA [mg L-1]Concentration of single volatile fatty acids
1-2x per month
• Best process information • relation of acetic acid to propi-
onic acid very good indicator • Accumulation of longer
chained VFA (and especially branched isomers) indicate severe process problems
• Very expensive laboratory equip-ment needed (e.g. HPLC)
• Carried out in external laboratories (several days of waiting time)
Alkalinity ratioa) [-]
relation of the alkali-nity of volatile fatty acids to bicarbonate alkalinity
2-4x per month
• simple, robust method • Can be carried out in on-site
laboratory • Takes buffer capacity into
account • Very commonly applied
• Value is not directly comparable between different plants
• Indication of process imbalance takes place later than with other parameters (shorter time to react)
H2 [ppm] Hydrogen on-line
• Earliest indicator of process imbalance (even faster than VFA)
• Any sudden and large change (even if not measured accura-tely) is a good indicator
• representative and accurate measurements cannot always be guaranteed
Redox [-] redox potential on-line• Fast indicator of process
imbalance
• Complex parameter • redox potential is also influenced
by other parameters (e.g. change in pH or feedstock mix)
NIRS [-] Near infrared spectrometry
on-line
• Fast and on-line (!) indicator of process imbalance
• several parameters can be measured with the same measurement
• Very high calibration effort is needed (consisting of establishing a data base of monitoring para-meters measured off-line)
• If radical changes occur (other feedstock types) system has to be recalibrated
• High costs
a) In german called Fos/TAC. In English also called IA/PA ratio, VFA/bicarbonate, VFA/ALK or ripley ratio.
Table 5 Overview of possible parameters for monitoring process stability in a biogas plant and the recommended frequency of their measurement

Process monitoring in biogas plants Process Monitoring Implementation
32
Range of the parameter Interpretation
Tota
l VFA
[mg
L-1]
<1,000 mg L-1 stable process
1,000–4,000 mg L-1
range in which stable as well as unstable processes are possible. In biogas processes using feedstocks relatively hard to digest (e.g. energy crops with high Ts content) where the rate limiting step is the hydrolysis step, the concentration of total VFA is normally lower than in waste digesters where the feedstock is readily degradable. Increased VFA concentrations can also be an indication of a lack of trace elements.
>4,000 mg L-1
High VFA concentrations are normally an indication of process problems, espe-cially if VFA concentrations are increasing rapidly. Yet, also stable degradation processes are possible at higher VFA concentrations, e.g. at higher ammonia concentrations. The concentration of VFA which will lead to a decrease in pH and consequently to process problems depends on the buffer capacity and is plant specific.
Indi
vidu
al V
FA
Acetic acid
<1,000 mg L-1 stable process
1,000–4,000 mg L-1 stable as well as unstable processes are possible
>4,000 mg L-1 High probability of unstable process
Propionic acid
<250 mg L-1 stable process
250–1,000 mg L-1 stable as well as unstable processes are possible
>1,000 mg L-1 High probability of unstable process
Longer chained VFA (butyric, valeric)
<50 mg L-1 stable process
>50 mg L-1If longer chained VFA (and especially branched isomers) accumulate, severe process problems occur
Ratio acetic/propionic acid
>2 stable process
1-2 stable as well as unstable processes are possible
<1 High probability of unstable process
Alk
alin
ity ra
tio
(FO
S/TA
C)
<0.3 Alkalinity ratios below 0.3 are in general considered to indicate stable processes
0.3–0.8
As alkalinity ratios are not comparable between different biogas plants it is very difficult to generalise. stability limits have to be defined for every specific biogas plant. The maximum limits reported in literature for stable processes range from 0.3 to 0.8.
>0.8 Unstable process
H2
<100 ppm stable process
100-500 ppm
In practice, it is quite difficult to guarantee accurate H2 measurements. For this reason the range where stable as well as unstable processes are possible is assumed to be quite big. If at a biogas plant accurate H2 measurements can be guaranteed, a smaller range of stability limits can be defined.
>500 ppm Unstable process
Table 6 Important stability limits for early indicators of process imbalance – data for mesophilic CSTR reactors and 2nd digester in the case of a two-step fermentation system (data adapted from Laaber, 2011; LfL, 2013; Weiland, 2008 and Clemens, 2012)

Process monitoring in biogas plants Process Monitoring Implementation
33
4.2.4 Monitoring during the start-up of a biogas plantThe start-up of a biogas plant is a very sensitive pro-
cess. Due to slow multiplication of some of the micro-
organisms involved in anaerobic sludges and the conse-
quent risk of hydraulic overload (see section 2.1.3), the
start-up of a biogas plant can take much longer than in
other biotechnological processes. A start-up time of
1-2 months is nothing exceptional in biogas plants. The
start-up has two main functions. First, the number of
microorganisms has to multiply from the seed material
to the necessary amounts in the biogas plant. Second, the
microorganisms have to adapt to the process conditions,
and especially to the properties of the specific feedstock.
A successful start-up is the pre-requisite for a well-func-
tioning biogas plant. Therefore, the effort in process
monitoring has to be highest during start-up. If the start-
up is too fast, a sub-optimal biogas process can be the
consequence because the most favourable microorgan-
isms have not multiplied in the biogas plant. In contrast,
a slow start-up can cause a possible loss of income as
time is taken to reach full load capacity. For monitoring
process stability during the start-up phase similar
approaches should be used as indicated in section 4.2.3.
Yet, the frequency of the measurements should be
increased during this crucial process step.
Example of using individual VFA for monitoring during start-upAs individual VFA give the best process information,
this parameter is used to illustrate how a start-up of a
pilot-scale anaerobic digester has been carried out. In
practice, however, the frequency of the measurements
will be much lower, and it will often not be possible to
obtain individual VFA, so that e.g. total VFA or alkalinity
ratio will be used.
In Figure 20 experimental data on individual VFA are
shown for the start-up of a pilot-scale digester (0.5 m³)
operated with the industrial by-product thin stillage as
feedstock. As the process is an industrial mono-digestion
and no changes in feedstock mix occur, it was aimed at
achieving a very stable degradation process and conse-
quently very low VFA concentrations. During the
1st start-up because the ratio of acetic to propionic acid
was decreasing and finally lay below 1, which is not rec-
ommended as can be seen in Table 6, it was decided to
undertake a second start-up. After the second start-up, by
increasing the amounts of iron and trace elements added
to the process, a very stable process with total VFA con-
centrations below 400 mg L-1 could be achieved.
Range of the parameter Interpretation
Tota
l VFA
[mg
L-1]
<1,000 mg L-1 stable process
1,000–4,000 mg L-1
range in which stable as well as unstable processes are possible. In biogas processes using feedstocks relatively hard to digest (e.g. energy crops with high Ts content) where the rate limiting step is the hydrolysis step, the concentration of total VFA is normally lower than in waste digesters where the feedstock is readily degradable. Increased VFA concentrations can also be an indication of a lack of trace elements.
>4,000 mg L-1
High VFA concentrations are normally an indication of process problems, espe-cially if VFA concentrations are increasing rapidly. Yet, also stable degradation processes are possible at higher VFA concentrations, e.g. at higher ammonia concentrations. The concentration of VFA which will lead to a decrease in pH and consequently to process problems depends on the buffer capacity and is plant specific.
Indi
vidu
al V
FA
Acetic acid
<1,000 mg L-1 stable process
1,000–4,000 mg L-1 stable as well as unstable processes are possible
>4,000 mg L-1 High probability of unstable process
Propionic acid
<250 mg L-1 stable process
250–1,000 mg L-1 stable as well as unstable processes are possible
>1,000 mg L-1 High probability of unstable process
Longer chained VFA (butyric, valeric)
<50 mg L-1 stable process
>50 mg L-1If longer chained VFA (and especially branched isomers) accumulate, severe process problems occur
Ratio acetic/propionic acid
>2 stable process
1-2 stable as well as unstable processes are possible
<1 High probability of unstable process
Alk
alin
ity ra
tio
(FO
S/TA
C)
<0.3 Alkalinity ratios below 0.3 are in general considered to indicate stable processes
0.3–0.8
As alkalinity ratios are not comparable between different biogas plants it is very difficult to generalise. stability limits have to be defined for every specific biogas plant. The maximum limits reported in literature for stable processes range from 0.3 to 0.8.
>0.8 Unstable process
H2
<100 ppm stable process
100-500 ppm
In practice, it is quite difficult to guarantee accurate H2 measurements. For this reason the range where stable as well as unstable processes are possible is assumed to be quite big. If at a biogas plant accurate H2 measurements can be guaranteed, a smaller range of stability limits can be defined.
>500 ppm Unstable process
Figure 20 Acetic and propionic acid concentrations and organ-ic loading rate during experi-mental period of a 0.5m³ pilot-scale digester operated with thin stillage, a by-product in bioethanol production.As butyric and valeric acid (or its branched isomers) were practically not present during fermentation, they are not shown in this figure. (Drosg, 2012)
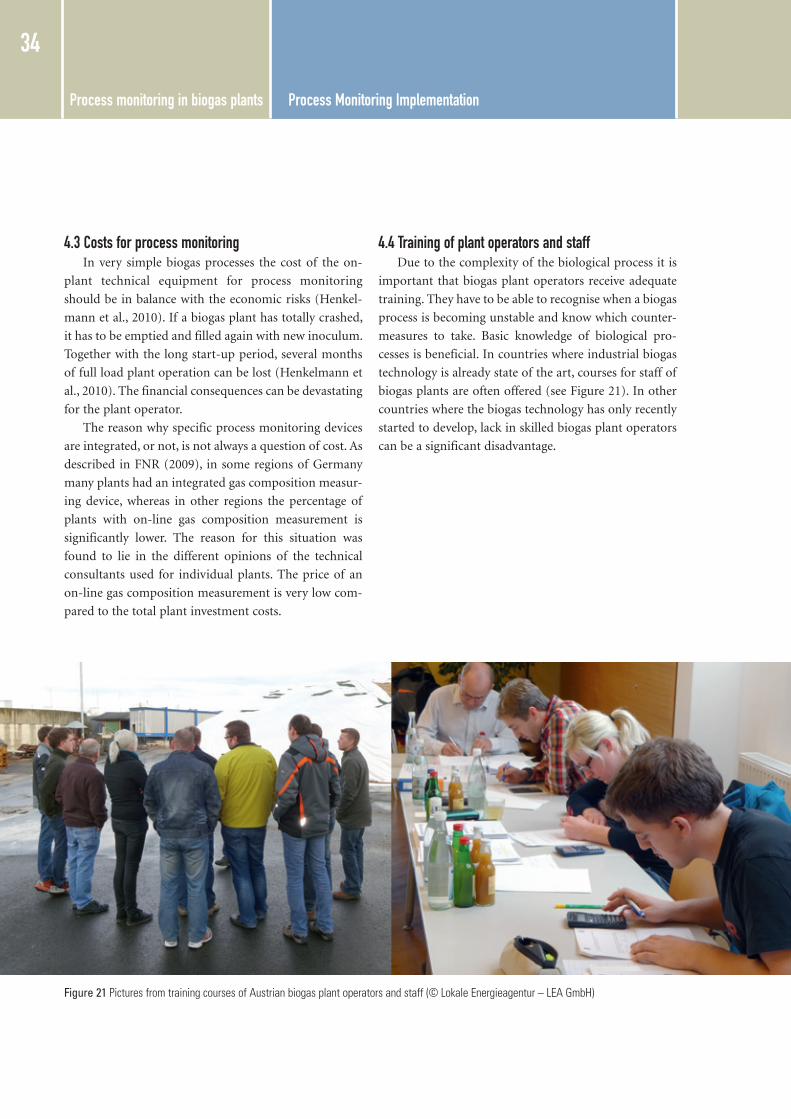
Process monitoring in biogas plants Process Monitoring Implementation
34
4.3 Costs for process monitoringIn very simple biogas processes the cost of the on-
plant technical equipment for process monitoring
should be in balance with the economic risks (Henkel-
mann et al., 2010). If a biogas plant has totally crashed,
it has to be emptied and filled again with new inoculum.
Together with the long start-up period, several months
of full load plant operation can be lost (Henkelmann et
al., 2010). The financial consequences can be devastating
for the plant operator.
The reason why specific process monitoring devices
are integrated, or not, is not always a question of cost. As
described in FNR (2009), in some regions of Germany
many plants had an integrated gas composition measur-
ing device, whereas in other regions the percentage of
plants with on-line gas composition measurement is
significantly lower. The reason for this situation was
found to lie in the different opinions of the technical
consultants used for individual plants. The price of an
on-line gas composition measurement is very low com-
pared to the total plant investment costs.
4.4 Training of plant operators and staffDue to the complexity of the biological process it is
important that biogas plant operators receive adequate
training. They have to be able to recognise when a biogas
process is becoming unstable and know which counter-
measures to take. Basic knowledge of biological pro-
cesses is beneficial. In countries where industrial biogas
technology is already state of the art, courses for staff of
biogas plants are often offered (see Figure 21). In other
countries where the biogas technology has only recently
started to develop, lack in skilled biogas plant operators
can be a significant disadvantage.
Figure 21 Pictures from training courses of Austrian biogas plant operators and staff (© Lokale Energieagentur – LEA gmbH)

Process monitoring in biogas plants Summary and Recommendations
35
5 Summary and Recommendations
As biogas production is a complex biological process,
where a mixed culture of microorganisms is involved and
various consecutive reaction steps take place, biological
process monitoring is essential to ensure a stable anaerobic
digestion process. Different factors can influence the inten-
sity of process monitoring required, e.g. scale of biogas
plant, economic risk of process instability, frequency of
changes in feedstock types, etc.
Among the process monitoring parameters, there are
two different groups. The first group of parameters are
early indicators of a process imbalance and they allow the
biogas plant operator to react in time before a process
imbalance happens. The second group are the parameters
which characterise the process and can often help to detect
and eliminate the cause of the imbalance. Although gen-
eral guidelines for stability limits of different process
parameters can be given, it is always necessary to adapt the
monitoring strategy to the specific biogas plant and its
feedstock.
The approaches displayed in this brochure should in
principle help to achieve a stable digestion process. Never-
theless, some stability problems like for example trace ele-
ment limitations will demand a more intensive optimisa-
tion effort and specialised expertise will be needed.
Many biogas plants will demand detailed process opti-
misation apart from pure process monitoring, which was
however not possible to cover in this brochure. Neverthe-
less, standard monitoring of a biogas plant is a pre-requi-
site before process optimisation can be addressed. Last but
not least, a very important factor for stable operation is
that well-trained people are used to operate biogas plants.
While this brochure describes the state of the art for
anaerobic digestion process monitoring (in 2013), it is
clear that the monitoring techniques and equipment avail-
able will continue to be developed and refined. Potential
users of monitoring equipment obviously need to take this
into account.

Process monitoring in biogas plants References
36
6 ReferencesANDREE, H., JACOBI, F. AND HARTUNG, E. (2008). Online-NIRS-
Messung an Biogasanlagen. In: Fachagentur Nachwachsende Rohst-offe e.V. – FNR (eds.), Gülzower Fachgespräche, Band 27, Messen, Steuern, Regeln bei der Biogaserzeugung, 84-99.
APHA (1998) Standard Methods for the Examination of Water and Waste-water. American Public Health Association, Washington DC, USA.
BISCHOFSBERGER, W., DICHTL, N., ROSENWINKEL, K.H., SEY-FRIED, C.F., BÖHNKE, B. (2005). Anaerobtechnik. Springer, Berlin, Germany.
BOE, K. (2006). Online monitoring and control of the biogas process. PhD at the Technical University of Denmark - Institute of Environment & Resources.
BRAUN, R. (1982). Biogas - Methangärung organischer Abfallstoffe. Springer, Berlin, Germany.
BUCHAUER, K. (1997). Titrationsverfahren in der Abwasser- und Schlam-manalytik zur Bestimmung von flüchtigen organischen Säuren. Das Gas- und Wasserfach (gwf) Wasser Abwasser, 138 (6), 313–320.
BUCHAUER, K. (1998). A comparison of two simple titration procedures to determine volatile fatty acids in influents to waste-water and sludge treatment processes. In: Water S. A. Vol. 24(1), 49-56.
CHEN, Y., CHENG, J.J., CREAMER, K.S. (2008). Inhibition of anaerobic digestion process: A review. Bioresource Technology, Vol. 99(10), 4044-4064.
CLEMENS, J. (2012). How to Optimize the Biogas Process according to Process Control Monitoring Data in Biogas Plants. (http://www.biogas-china.org/index.php?id=41&cid=38&fid=23&task=download&option=com_flexicontent&Itemid=19&lang=en, accessed on April 13, 2012).
DIN 38406-5:1983-10 (1983). German standard methods for the examina-tion of water, wastewater and sludge; cations (group E) determination of ammonia-nitrogen (E5), Deutsches Institut für Normung e. V., Berlin, Germany.
DROSG, B. (2012). Energy recovery in grain bioethanol production by anaerobic digestion of stillage fractions. PhD Thesis at University of Natural Resources and Life Sciences, Institute for environmental biotechnology.
DROSG, B., AL SAEDI, T., BRAUN, R., AND BOCHMANN, G. (2013). Analysis and Characterisation of Biogas Feedstocks. In: The Biogas Handbook: Science, production and applications, Wellinger, A., Murphy, J.D. and Baxter, D. (eds), Woodhead Publishing Limited, Cambridge, UK.
FNR – Fachagentur Nachwachsende Rohstoffe e.V. (2004). Handreichung Biogasgewinnung und -nutzung, Leipzig, Germany.
FNR – Fachagentur Nachwachsende Rohstoffe e.V. (2009). Biogas-Messprogramm II – 61 Biogasanlagen im Vergleich, Gülzow, Germany, ISBN 978-3-9803927-8-5.
FORSTNER, U. AND SCHLACHTER, F. (2012). Automating Biogas Plants: Diagnostics and Monitoring Increase Yields. Renewable Energy World. (http://www.renewableenergyworld.com/rea/news/article/2012/09/automating-biogas-plants).
GALLERT, C. AND WINTER, J. (2008). Propionic acid accumulation and degradation during restart of a full scale anaerobic biowaste digester. Bioresource Technology 99, 170-178.
GERARDI, M. H. (2003). The microbiology of anaerobic digesters. John Wiley & Sons, Hoboken, US.
GILLES, A. (2013). Evaluation of Electronic Nose Technology for Early-warning of Bio-methanation Process Disturbance. PhD Thesis at Université de Liége - Département des sciences et gestion de l’environnement(http://bictel.ulg.ac.be/ETD-db/collection/available/ULgetd- 05022013-114124/).
HANSEN, K.H., ANGELIDAKI, I., AHRING, B.K. (1998). Anaerobic digestion of swine manure: Inhibition by ammonia. Wat. Res. 32(1), 5-12.
HENKELMANN, G., MEYER, Z.U., KÖCKER, K., GÖTZ, J., AND BECK, J. (2010). Schlüsselparameter zur Kontrolle des Gärprozesses und Moti-vation, Voraussetzung und Möglichkeiten für die Prozessüberwachung, published by LfL – Bayerische Landesanstalt für Landwirtschaft, ISSN 1611-4159 (http://www.lfl.bayern.de/publikationen/daten/schriftenreihe/ p_40100.pdf).
ISO 5667-13 (2011). Water quality - Sampling - Part 13: Guidance on sampling of sludges from sewage and water treatment works, ISO, International Organization for Standardization, Geneva, Switzer-land.
JENKINS, S.R., MORGAN, J.M. AND SAWYER, C.L. (1983). Measuring anaerobic sludge digestion and growth by a simple alkalimetric titra-tion. Water Pollut. Control Fed. 55(5), 448-453.
KAPP, H. (1984). Schlammfaulung mit hohem Feststoffgehalt. Stuttgarter Berichte zur Siedlungswasserwirtschaft, Bd. 86, Oldenbourg Verlag, München.
KEITLINGHAUS, H. (2011). Gasmengen und -durchflussmessung – Konzepte und Eignung für Biogasanlagen. 6. Fachtagung Biogas 2011 – Energieträger der Zukunft. 08.-09.06.2011, Braunschweig, Germany.
LAABER, M. (2011). Gütesiegel Biogas – Evaluierung der technischen, ökologischen und sozioökonomischen Rahmenbedingungen für eine Ökostromproduktion aus Biogas. PhD thesis at the University of Natural Resources and Life Sciences, Vienna.

Process monitoring in biogas plants References
37
LfL - Bayerische Landesanstalt für Landwirtschaft (2013). Arbeits-schwerpunkt “Regenerative Energien” - Methodik der Datenerfassung und Bewertung. (http://www.lfl.bayern.de/arbeitsschwerpunkte/as_biogas/15736, accessed on March 07, 2013).
LfL - Bayerische Landesanstalt für Landwirtschaft (2007). Biogashand-buch Bayern. (http://www.lfu.bayern.de/abfall/biogashandbuch/doc/kap1bis15.pdf).
LIEBETRAU, J., PFEIFFER, D. AND THRÄN, D. (2012). Messmethoden-sammlung Biogas – Methoden zur Bestimmung von analytischen und prozessbeschreibenden Parametern im Biogasbereich. Schriftenreihe des BMU-Förderprogrammes „Energetische Biomassenutzung“ – Band 7, DBFZ, Leipzig, Germany. (http://www.energetische-biomassenutzung.de/fileadmin/user_upload/Downloads/Ver%C3%B6ffentlichungen/07_Messmethod-ensamm_Biogas_web.pdf).
LINDORFER, H., WALTENBERGER, R., KÖLLNER, K., BRAUN, R. AND KIRCHMAYR, R. (2008). New data on temperature optimum and temperature changes in energy crop digesters. Bioresource Tech-nology 99, 7011-7019.
MARCHAIM, U. AND KRAUSE, C. (1993). Propionic to Acetic Acid Ratios in Overloaded Anaerobic Digestion. Bioresource Technology 43 (3), 195-203.
MC GHEE, T.J. (1968). A method for approximation of the volatile acid concentrations in anaerobic digesters. Water and Sewage Works, Vol 115, 162-166.
NORDMANN, W. (1977). Die Überwachung der Schlammfaulung. KA-Informationen für das Betriebspersonal, Beilage zur Korrespondenz Abwasser 3/77.
ORTNER, M. (2012). Bioverfügbarkeit von Spurenelementen messen. Biogas Journal 2, p 82-86. ISSN:1619-8913.
POELS, J., VAN ASSCHE, P. AND VERSTRAETE, W. (1984). Effects of disinfectants and antibiotics on the anaerobic digestion of piggery waste. Agricultural Wastes 9(4), 239-247.
RESCH, C., BRAUN, R. AND KIRCHMAYR, R. (2008). The influence of energy crop substrates on the mass-flow analysis and the residual methane potential at a rural anaerobic digestion plant. Water Sci Technol. 57(1), 73-81.
RIEGER, C.H. AND WEILAND, P. (2006). Prozessstörungen frühzeitig erkennen. Biogas Journal 4/2006, 18-20.
RIPLEY, L.E., BOYLE, J.C. AND CONVERSE, J.C. (1986). Improved alkalimetric monotoring for anaerobic digestion of high strength wastes. Journal of the Water Pollution Control Federation, 1986, vol. 58, no. 5, 406-411.
SANZ, J.L., RODRIGUEZ, N. AND AMILS, R. (1996). The action of antibiotics on the anaerobic digestion process. Appl. Microbial Bio-technology 46, 587-592.
SCHRIEWER, M. (2011). Prozessführung und Überwachung der Prozessstabilität im Fermenter. 2. Göttinger Weiterbildung zum Energiewirt – Fachrichtung Biogas, March 2-11, Göttingen, Germany. (http://www.schriewer-biogas-consulting.com/SBC2010/Down-load/Vortrag_Prozessfuehrung_und_Ueberwachung.pdf).
SCHWEDT, G. (2007). Taschenatlas der Analytik. Wiley-VCH, Weinheim, Germany.
SPEECE, R.E. (1996). Anaerobic biotechnology for industrial wastewaters. Archae Press, Nashville, Tennessee, USA.
VASSEN, P. (2012). Gasmengen und -durchflussmessung – Konzepte und Eignung für Biogasanlagen. 2. VDI Konferenz – Prozessmesstechnik an Biogasanlagen. 09.-10.10.2012, Fulda, Germany.
VDI 4630 (2006). Fermentation of organic materials - Characterisation of the substrate, sampling, collection of material data, fermentation tests. VDI, Verein Deutscher Ingenieure, Düsseldorf, Germany.
VOSS, E., WEICHGREBE, D. AND ROSENWINKEL, K.H. (2009). FOS/TAC-Deduction, Methods, Application and Significance, Inter-nationaleWissenschaftskonferenz. Biogas Science 2009 – Science meets Practice”, LfL-Bayern, 2-4. 12.09, Erding. (http://www.ve-gmbh.de/_cms/images/stories/vegmbh_docu-ments/FOS-TAC-DeductionMethodsApplicationSignificance-E-Voss.pdf, accessed on February 25, 2013).
WARD, A.J., HOBBS, P.J., HOLLIMAN, P.J. AND JONES, D.L. (2008). Optimisation of the anaerobic digestion of agricultural resources. Bioresource Technology 99, 7928-7940.
WEILAND, P. (2008). Wichtige Messdaten für den Prozessablauf und Stand der Technik in der Praxis. In: Fachagentur Nachwachsende Rohstoffe e.V. – FNR (eds.), Gülzower Fachgespräche, Band 27, Messen, Steuern, Regeln bei der Biogaserzeugung, 17-31.
ZOSEL, J., OELSSNER, W., GUTH, U., ZIMMERMANN, P., PETERS-SON, E. AND SENSEL, K. (2008). Entwicklung eines Wasserstoff-Sensors für die Flüssigphase von Biogasanlagen. In: Fachagentur Nachwachsende Rohstoffe e.V. – FNR (eds.), Gülzower Fach-gespräche, Band 27, Messen, Steuern, Regeln bei der Biogaserzeu-gung, 58-71.

Process monitoring in biogas plants Glossary
38
BMP Tests for measuring the biochemical methane potential (or biometh-ane potential) are mainly used to determine the possible methane yield of a feedstock. These tests also provide information on the anaerobic degradability of a feedstock, including the degradation rate. In addition, a first rough evaluation of the presence of inhibi-tory components can be made.
CSTR Continuously stirred tank reactor. This is a type of digester which is regularly stirred and the substrate as well as the microbe concentra-tion should be the same throughout the entire reactor. The design concept of a CSTR is different to that of, for example, a plug flow reactor.
COD The chemical oxygen demand (COD) is a parameter which indicates the total chemically oxidisable material in the sample and therefore a parameter which indicates the energy content (or organic pollu-tion) of a feedstock. In this analysis the sample is refluxed in a boiling mixture of sulphuric acid and potassium dichromate (K2Cr2O7). In the next step, the remaining unreduced potassium dichromate is titrated with ferrous ammonium sulphate, which allows the determi-nation of the equivalent oxygen consumed.
DM Dry matter (DM); see total solids
Alkalinity ratio The Alkalinity ratio is a titration measurement with sulphuric acid and determines the ratio of the intermediate alkalinity (IA) caused by organic acids over the partial alkalinity (PA) caused by the bicarbonates. In the English literature it is called the IA/PA ratio, however, also other terms such as VFA/bicarbonate, VFA/ALK or Ripley ratio are in use. In German literature the param-eter is called FOS/TAC.
Mono-digestion The term mono-digestion means that only a single feedstock is used in a biogas plant. Typical mono-digestions is carried for industrial residues such as sugar beet pulp, or for example in Ger-many energy crops like maize.
Mesophilic A mesophilic biogas process normally takes place between 36-43°C.
NH4-N The ammonium nitrogen (NH4-N) determination can be carried
out using a distillation apparatus. A base is added to the sample and ammonia is distilled from the alkaline solution to an acid solution (usually boric acid) where ammonia is absorbed quantitatively and measured.
Nm³ Normal cubic meter (at norm temperature and norm pressure)
oDM Organic dry matter (oDM); see volatile solids (VS)
Off-line An off-line measurement is made when a sample first has to be taken from the digester and then the analysis is carried out in a labo-ratory. A considerable time elapses between the sampling and the analysis.
On-line An on-line measurement is carried out directly in the biogas plant and there is practically no time difference between the sampling and the analysis. Biogas volume and digester temperature are parameters which are practically always measured on-line. For on-line measure-ments no manual sampling is necessary.
OLR The organic loading rate (OLR) is given in kg VS m-3 d-1 or kg COD m-3 d-1, and stands for the amount of organic material which is fed daily to the biogas plant. The critical issue with this parameter is that with increased OLR the possibility of acidification by organic overload increases.
pH The pH value determines the acidity or basicity of an aqueous solu-tion. Its unit is the negative logarithm of the concentration of hydro-nium (H+) ions. The pH value can be determined in a liquid feed-stock with a standard potentiometric electrode.
Psychrophilic A psychrophilic biogas process normally takes place below 25°C.
HRT The hydraulic retention time (HRT) is the average time during which the feedstock remains in the biogas digester. As in practice, the large majority of existing plants are CSTR reactors and do not show special retention systems for microbial biomass, the retention time of the microbes in the system can be assumed equal to the HRT.
Stability limit In the text the value of a monitoring parameter above which a process is considered unstable is referred to as the stability limit. In practice, the stability limit is however a value range rather than a fixed value.
TKN The nitrogen content of a feedstock can be determined approxi-mated by the total Kjeldahl nitrogen (TKN) determination. In this analysis, organic nitrogen is converted to ammonium nitrogen by boiling the feedstock sample in the presence of sulphuric acid and a catalyst. After that, similar to the NH
4-N analysis, a base is added and
ammonia is distilled from the alkaline solution to an acid solution (usually boric acid) where ammonia is absorbed quantitatively and measured.
TS For the estimation of the water content of a feedstock the total solids (TS) are determined; this parameter is also called dry matter (DM). Analysis involves drying the sample to constant weight in a drying chamber at 103 to 105°C.
Thermophilic A thermophilic biogas process normally takes place between 50-65°C.
VFA Volatile fatty acids (acetic acid, propionic acid, butyric acid, valeric acid,…) are intermediate metabolites of the anaerobic digestion process. Therefore, their accumulation can give direct feedback on the interaction of the different groups of micro-organisms in the reactor.
VS In order to determine the amount of organic material in a sample the volatile solids (VS) are determined, this parameter is also called organic dry matter (oDM). In general, this determination is carried out together with the TS/DM determination described above. The sample is dried to constant weight in a drying chamber at 103 to 105°C. Then the sample is ignited to constant weight in a muffle furnace at 550°C. The VS is calculated by subtracting the ash from the total solids.
7 Glossary
Process monitoring in biogas plants
Task 37 – Energy from Biogas
IEA Bioenergy aims to accelerate the use of environmentally sustainable and cost competitive bioenergy that will contribute to future low-carbon energy demands. This report is the result of work carried out by IEA Bioenergy Task 37: Energy from Biogas.
The following countries are members of Task 37, in the 2013 – 2015 Work Programme:
Austria Bernhard Drosg, [email protected] günther BoCHMANN, [email protected] Brazil Cícero JAYME BLEY, [email protected] Denmark Teodorita AL sEADI, [email protected] European Commission (Task Leader) David BAXTEr, [email protected] Finland Jukka rINTALA, [email protected] France olivier THÉoBALD, [email protected] guillaume BAsTIDE, [email protected] germany Bernd LINKE, [email protected] Jerry MUrPHY, [email protected] Mathieu DUMoNT, [email protected] roald sØrHEIM, [email protected],sweden Tobias PErssoN, [email protected] Nathalie BACHMANN, [email protected] south Korea Ho KANg, [email protected] Kingdom Clare LUKEHUrsT, [email protected] Charles BANKs, [email protected]
WRITTEN BY: Bernhard DROSGIFA-TullnBoKU – University of Natural resources and Life science, ViennaInstitute for Environmental BiotechnologyKonrad Lorenz strasse 20A-3430 TullnAustria
EDITED BY:Peter FROSTUnited KingdomAgri-Food and Biosciences InstituteHillsboroughCounty DownNorthern Ireland BT26 8DrUnited Kingdom
David BAXTEREuropean CommissionJrC Institute for Energy and Transport1755 LE PettenThe Netherlands
PUBLISHED BY IEA BIOENERGY, December 2013
IMPRESSUM: Coverphoto: IFA Tulln, graphic Design: susanne AUEr IsBN 978-1-910154-03-8

ISBN 978-1-910154-03-8