Prediction of Auditory and Visual P300 Brain-ComputerInterface AptitudeSebastian Halder1,2,3*, Eva Maria Hammer1, Sonja Claudia Kleih1, Martin Bogdan3,5,
Wolfgang Rosenstiel3, Niels Birbaumer2,4, Andrea Kubler1,2
1 Institute of Psychology, University of Wurzburg, Wurzburg, Germany, 2 Institute of Medical Psychology and Behavioral Neurobiology, University of Tubingen, Tubingen,
Germany, 3 Wilhelm-Schickard Institute for Computer Science, University of Tubingen, Tubingen, Germany, 4 Ospedale San Camillo, Istituto di Ricovero e Cura a Carattere
Scientifico, Venezia, Italy, 5 Computer Engineering, University of Leipzig, Leipzig, Germany
Abstract
Objective: Brain-computer interfaces (BCIs) provide a non-muscular communication channel for patients with late-stagemotoneuron disease (e.g., amyotrophic lateral sclerosis (ALS)) or otherwise motor impaired people and are also used formotor rehabilitation in chronic stroke. Differences in the ability to use a BCI vary from person to person and from session tosession. A reliable predictor of aptitude would allow for the selection of suitable BCI paradigms. For this reason, weinvestigated whether P300 BCI aptitude could be predicted from a short experiment with a standard auditory oddball.
Methods: Forty healthy participants performed an electroencephalography (EEG) based visual and auditory P300-BCIspelling task in a single session. In addition, prior to each session an auditory oddball was presented. Features extractedfrom the auditory oddball were analyzed with respect to predictive power for BCI aptitude.
Results: Correlation between auditory oddball response and P300 BCI accuracy revealed a strong relationship betweenaccuracy and N2 amplitude and the amplitude of a late ERP component between 400 and 600 ms. Interestingly, the P3amplitude of the auditory oddball response was not correlated with accuracy.
Conclusions: Event-related potentials recorded during a standard auditory oddball session moderately predict aptitude inan audiory and highly in a visual P300 BCI. The predictor will allow for faster paradigm selection.
Significance: Our method will reduce strain on patients because unsuccessful training may be avoided, provided the resultscan be generalized to the patient population.
Citation: Halder S, Hammer EM, Kleih SC, Bogdan M, Rosenstiel W, et al. (2013) Prediction of Auditory and Visual P300 Brain-Computer Interface Aptitude. PLoSONE 8(2): e53513. doi:10.1371/journal.pone.0053513
Editor: Mitsunobu R. Kano, Okayama University, Japan
Received July 17, 2012; Accepted November 30, 2012; Published February 14, 2013
Copyright: � 2013 Halder et al. This is an open-access article distributed under the terms of the Creative Commons Attribution License, which permitsunrestricted use, distribution, and reproduction in any medium, provided the original author and source are credited.
Funding: Funded by Deutsche Forschungsgemeinschaft (DFG) KU 1453/3-1 and BI 195/58-1. This work is supported by the European ICT Programme ProjectFP7-224631, SFB 550/B5 and C6, BMBF (Bundesministerium fur Bildung und Forschung) Bernstein Center for Neurocomputation (Nr 01GQ0831) and the EuropeanResearch Council Grant (ERC 227632-BCCI). The research leading to these results has also received funding from the European Community’s, Seventh FrameworkProgramme FP7/2007–2013, BackHome project grant agreement number 288566. This publication was funded by the German Reasearch Foundation (DFG) andthe University of Wurzburg in the funding programme Open Access Publishing. The funders had no role in study design, data collection and analysis, decision topublish, or preparation of the manuscript.
Competing Interests: The authors have declared that no competing interests exist.
* E-mail: [email protected]
Introduction
Brain injuries or neurological diseases (e.g. amyotrophic lateral
sclerosis, ALS) can lead to complete motor paralysis. Depending
on the degree of impairment caused by the injury or the
progression of the disease communication can become very
difficult and even impossible. This loss of communicative abilities
can be overcome with interfaces that bypass the need for muscular
control and detect the user’s intentions directly from signals
recorded from the brain. These brain-computer interfaces (BCIs)
are currently not only used for communication but also for
restoration of motor control [1,2,3,4].
In all variations of BCIs a control signal must be recorded from
the user’s brain. Most often this signal is extracted from the
electroencephalogram (EEG). The EEG has the advantage of
reliable, economic and portable recording devices. Disadvantages
are the strong attenuation of the neural signals by the skull and
skin and long preparation times if many EEG electrodes (w32) are
applied. Despite these disadvantages, up to now for working with
severely paralyzed patients EEG, remains the most practical
method.
One commonly used control signal in the EEG is a positive
deflection designated as P300. It is elicited by unexpected stimuli
with variations in latency between 250 and 700 ms on central to
parietal locations [5]. BCIs using the P300 as control signal have
been evaluated extensively with ALS patients in several indepen-
dent studies [6,7,8,9,10,11]. Typically, the user focuses on an
element in a matrix with for example 666 symbols. In one run,
rows and columns of the matrix flash randomly. The user focuses
on the desired item (target) and a P300 is elicited whenever the
target row or column are flashing. This experimental design has
PLOS ONE | www.plosone.org 1 February 2013 | Volume 8 | Issue 2 | e53513
not only been used for spelling but also for control of internet
browsers [12], painting [13], control of standard assistive devices
[11] and wheelchair control [14]. A negative side effect of using
row and column based flashing patterns is that errors may occur
by selecting a wrong letter in either the correct column or row
which may be compensated by using e.g. a checkerboard based
flashing pattern [15] or online error correction [16].
When considering the applicability of a BCI to enhance or
restore communication it is important to differentiate between
various states of impairment. Particularly, the distinction between
the locked-in state (LIS) and the complete locked-in state (CLIS) is
important when considering the application of a P300 BCI [17].
The ability of the user to control gaze, which is lost in late-stage
ALS and by definition in CLIS, is required by most common
implementations of this BCI, some approaches work around this
[18,19,20]. The limitation of visual P300 BCIs to patients with
functional gaze control is addressed by P300 BCI implementations
that use auditory or tactile instead of visual stimulation. Control of
a visual P300 BCI is possible without direct fixation of the target
but this substantially decreases accuracies [21]. Addtionally, it may
be possible that patients have uncontrollable eye drifts preventing
them from fixating any point in space. It is possible to transfer the
P300 speller to the auditory domain by using defined auditory
stimuli instead of flashing for each row and column. These
auditory stimuli can be either words or sounds [22,23,24]. Another
approach is to reduce the number of possible choices to make
selection faster [8]. Load can be reduced by approaches using very
distinct auditory stimuli instead of words [25,26]. By stimulation
from different spatial directions the number of classes and thus
communication speed can be increased [27,28]. [22] pointed out
differences between the P300 elicited by the visual and the
auditory P300 BCI. The latencies of the P300 elicited by the
auditory BCI were increased compared to the latencies elicited by
the visual P300 BCI. Peak amplitudes were identical but the
maximum peak of the auditory P300 BCI occured on posterior
instead of central electrodes.
Considering that BCIs are currently primarily intended for
patients who are diagnosed with severe diseases that not only lead
to motor impairment but also to reduced attention span it would
be advantageous to be able to quickly choose a suitable BCI and
training strategy that best fits the patients needs [3]. For this
reason reliable predictors of aptitude with a particular BCI are
necessary. Ideally, data for prediction should be collected quickly
and without the active participation of the user. This is particularly
important if the user cannot respond or communicate because of
CLIS. Such a predictor has been presented for sensorimotor
rhythm (SMR) based BCIs [29]. The amplitude of the SMR peak
while the user is resting was used as a neurophysiological predictor
which correlated highly with BCI aptitude in a sample of healthy
individuals (Pearson’s r~0:53). It is important to note that this
predictor was obtained when the participant was not performing
the motor imagery task, and thus the predictor was independent of
any mental strategy applied for later cursor control. Therefore,
and most importantly the data necessary for SMR-BCI aptitude
prediction can be obtained from non-responsive patients.
Furthermore, psychological variables such as the ability to
concentrate and visuo-motor coordination also predicted SMR
BCI aptitude [30]. Likewise, a high correlation has been shown
between BCI aptitude and the hemodynamic response in the
dorsolateral prefrontal cortex, an area known to be involved in
task monitoring [31].
Studies with users of BCIs controlled by regulation of slow
cortical potentials (SCP) demonstrated the predictive power of
accuracy in early sessions for later accuracy [32]. More
specifically, the number of sessions needed to achieve significant
cursor control correlated moderately with the number of sessions
required to achieve criterion level control (above 70%, [33]). The
implicit learning capacity also appeared to influence the ability to
use SCP BCIs [34]. Concerning P300 BCIs, it has recently been
shown that motivation may impact accuracy achieved in a
subsequent BCI session [35]. Due to a ceiling effect in BCI
accuracy (an average accuracy of 99% was achieved by N = 33
participants) the effects of motivation on online accuracy could not
be studied due to a lack of variance, but P300 amplitude was
reduced in the least as compared to the highest motivated
participants. [36] deomonstrated that heart rate variability (HRV)
recorded during a 10 minutes rest period without any task and
EEG recording moderately predicted later P300 BCI performance
in healthy subjects. HRV is a correlate of cortical inhibition and
more globally, of self-regulatory capacity.
Thus, to date no strong predictor of P300-BCI aptitude is
available. In the current study we propose to predict auditory
AND visual P300-BCI aptitude from a single auditory standard
oddball measurement. An auditory as opposed to a visual oddball
was used because it can be applied to patients without gaze
control. The type of auditory oddball used (one rare target tone,
one frequent non-target tone with different physical properties) is
by design in fact more similar to the visual P300 BCI experiment
in which the user attends a single element of the matrix which
flashes infrequently and is dark most of the time than to the
auditory P300 BCI experiment. Thus, there is also an infrequent
target and a frequent target distinguished by physical properties.
In case of the auditory P300 BCI the target and non-targets are
distinguished by attention to the semantic meaning of the target
word whereas the physical properties of targets and non-targets
are more similar. The goal of this study was to determine how
strongly the amplitude and waveform of the P300 elicited by the
auditory standard oddball would correlate with subsequent BCI
aptitude. We recorded an auditory standard oddball session from
each subject, followed by a single visual P300 BCI and auditory
P300 BCI session. Subsequently the amplitude of auditory
standard oddball response was correlated with BCI accuracy.
Methods
ParticipantsForty healthy participants (21 male, 19 female, mean age
25.8 years, SD 8.46 years, range 17–58) took part in the study
which was approved by the Ethical Review Board of the Medical
Faculty, University of Tubingen. Each participant was informed
about the purpose of the study and signed informed consent prior
to the experimental session.
Experimental designThe participants were seated in a comfortable chair approxi-
mately 1 m away from a digital computer screen (43 cm diameter).
Conventional headphones were used to present the auditory
stimuli. Participants were cued about the beginning and the end of
a run (see below) by the German word ‘‘Warte . . .’’ (engl.:
‘‘Waiting . . .’’) and ‘‘Zeit abgelaufen!’’ (engl.: ‘‘Time out!’’). The
screen was blank while the auditory oddball was presented,
displayed a visual support matrix (see Figure 1) during the auditory
or flashing rows and columns during the visual P300 BCI
experiment. Figure 2 depicts an overview of all parts of the
experiment.
Prediction P300 Brain-Computer Interface Aptitude
PLOS ONE | www.plosone.org 2 February 2013 | Volume 8 | Issue 2 | e53513

Auditory oddballAuditory stimuli were standard tones (duration 160 ms;
overlapping 517 Hz, 646 Hz and 775 Hz tones) and deviants
(the oddball; duration 160 ms; a 517 Hz tone) with a ratio of 4:1.
The tones were two distinct harmonic oscillations each consisting
of three frequencies instead of pure sine tones. Such complex tones
have been shown to elicit a larger P300 [37]. Stimuli were
presented to the user in sequences of five tones, namely four
standards and a deviant. Each run comprised 20 sequences,
wherein the order of stimuli was randomized. Each run was
repeated three times resulting in a total of 60 deviant and 240
standard tones. A group of three runs will be referred to as a
session. Participants were instructed to count the deviants and
after each run were asked for the number of deviants. The inter-
stimulus interval was set to 800 ms. Thus, one run lasted 96 s. In
between runs participants were asked if they were ready to
continue, and if yes the next run commenced. Altogether the
session lasted 288 s (4 min 48 s). The data (see below) of this
experiment was used to predict the aptitude of the participants in
the following two experiments.
Visual P300 BCIDuring the visual P300 BCI experiment participants were
presented with a 565 matrix containing the letters of the latin
alphabet excluding the letter Z to make it compatible to the
auditory P300 BCI experiment [22]. One sequence comprised 10
flashes (one for each row and column) of 80 ms duration followed
by a 160 ms inter-flash interval. To select a letter 15 sequences
were required followed by 2.4 s breaks in which the signal was
classified and the selected letter was presented to the participant.
In total, a single letter selection required 38.4 s. This relativly long
letter selection time is caused by the use of 15 sequences per
selection which were needed to make the visual P300 BCI
comparable to the auditory paradigm. With differing sequence
numbers some of the analysis methods used would not have been
possible. Offline performance was recalculated for each partici-
pant to obtain a measure of individualized performance (see
Section ‘‘Offline performance measure’’). One run comprised
selection of five letters and participants performed 6 runs (30
letters). In the first two runs participants spelled the words BRAIN
and POWER and no feedback of results was provided; this data
was used to train the classifier and participants were grouped into
high aptitude and low aptitude users according to the accuracy
achieved in runs 3 to 6 with feedback (alternating the words
BRAIN and POWER). Accuracy was measured as percentage of
correctly selected letters.
Auditory P300 BCIThe auditory matrix was identical to the visual P300 BCI
described above (see Figure 1). Instead of flashes, auditory stimuli
were presented to the participant. Each row and column was
coded by the number presented at the top of the columns and left
to the rows (see Figure 1). The auditory stimuli were the
corresponding pre-recorded, spoken number. The 565 matrix
with corresponding numbers was displayed on the screen
throughout auditory stimulus presentation, but no flashing of
rows and columns occurred. The stimulus presentation time was
450 ms as in [22] but the inter stimulus interval (ISI) was increased
Figure 1. Visual support matrix displayed on a computerscreen to the participant during the auditory P300-BCIexperiment [22]. The matrix was identical to the visual P300 BCImatrix. The speakers displayed at the top left corner of the matrixindicate the auditory presentation of numbers and were not displayedduring the actual experiment.doi:10.1371/journal.pone.0053513.g001
Figure 2. Every participant was presented with an auditory oddball, and performed a visual and auditory P300 BCI session. For bothvisual and auditory P300 BCI online feedback was provided. Performance was reevaluated offline by calculating the number of repetitions perstimulus the user needed to reach 70% accuracy. This performance measure was correlated with features extracted from the auditory oddball sessionto assess whether it can be used to predict BCI aptitude.doi:10.1371/journal.pone.0053513.g002
Prediction P300 Brain-Computer Interface Aptitude
PLOS ONE | www.plosone.org 3 February 2013 | Volume 8 | Issue 2 | e53513
from 175 to 550 ms because preliminary results indicated this
would increase accuracy of spelling and higher ISIs would be
needed by patients [38,39,40]. To reduce cognitive load, rows and
columns were sequentially selected: within a sequence first the
rows and then the columns were presented to the participant. As in
the visual P300 BCI experiment each letter selection consisted of
15 sequences with intervals of 2.4 s between each selection. Thus,
time needed for selection of one letter were 150 s. Again the words
BRAIN and POWER were presented three times each with the
first ten letters being used for classifier training without presenting
feedback to the participant. Subsequently, selected letters (20) were
presented to the subject. Again, accuracy was defined as the
percentage of correctly selected letters.
It is not possible to operate the auditory P300 BCI used in this
study (which is based on spoken numbers as stimuli) with speeds
identical to those of the visual P300 BCI. It would also not have
been realistic to operate the visual P300 BCI with ISIs identical to
those of the auditory P300 BCI. Thus, using an identical number
of sequences appeared to be the best way to allow for a certain
measure of comparability. The high number of sequences also
ensured that the point at which 70% accuracy were achieved
could be calculated for most participants.
Data acquisitionAll aspects of data collection were controlled by the BCI2000
software system [41]. The EEG was recorded with Ag/AgCl
elctrodes in a 128-channel cap (Easycap GmbH) of which 63 EEG
and 4 electrooculography (EOG) channels were used. The
electrodes were located at the following positions with the channel
number in parentheses: FP1(1), Fpz(2), FP2(3), F7(4), F3(5), Fz(6),
F4(7), F8(8), FT9(9), FT7(10), FC5(11), FC3(12), FC1(13), FCz(14),
FC2(15), FC4(16), FC6(17), FT8(18), FT10(19), T7(20), C5(21),
C3(22), C1(23), Cz(24), C2(25), C4(26), C6(27), T8(28), TP9(29),
TP7(30), CP5(31), CP3(32), CP1(33), CPz(34), CP2(35), CP4(36),
CP6(37), TP8(38), TP10(39), P9(40), P7(41), P5(42), P3(43), P1(44),
Pz(45), P2(46), P4(47), P6(48), P8(49), P10(50), PO7(51), P05(52),
P01(53), POz(54), P06(55), P02(56), PO8(57), O1(58), Oz(59),
O2(60), O9(61), Iz(62), O10(63). The locations of the electrodes
were based on the modified 10–20 system of the American
Electroencephalographic Society [42].
Each channel was referenced to the tip of the nose and
grounded to a position between Fz and Fpz. Eye movement and
blinks were recorded using two vertical EOG channels with
electrodes placed above and below the right eye (superior and
inferior orbital fossa), and two horizontal EOG channels with
electrodes placed at the outer canthi of the eyes. Impedances were
kept below 5 kV. The EEG was recorded using a BrainAmp DC
Amplifier (Brainproducts GmbH), notch-filtered at 50 Hz and
sampled at 500 Hz. The resolution was set to 0:1mV=bit. With this
setting the amplifier samples with a rate of 5 kHz with an internal
low-pass at 1 kHz; such oversampling prevents aliasing. The
decimation to the recording frequency (in this case 500 Hz) is
performed within the Brainvision Recorder software provided by
the amplifier manufacturer. No additional filtering was applied to
the online recording. Data processing, storage and online display
were performed on a conventional PC (Intel Core 2 Quad Q6600
2.40 Ghz, 4 GB RAM, Microsoft Windows XP Professional SP2
32-bit).
Offline processingThe data acquired during presentation of the auditory oddball
were high-pass filtered at 0.5 Hz and then low-pass filtered at
20 Hz using two-way least-squares finite impulse response (FIR)
filtering with a function from the EEGLAB toolbox [43].
The blind source separation (BSS) algorithm AMUSE was used
to isolate and remove ocular artifacts [44,45]. It has been shown to
be superior to higher order statistics BSS algorithms in both speed
and separation performance [46]. For offline analysis the nose
reference was replaced with a common average reference (CAR).
After segmenting the data into individual epochs (0–800 ms), they
were baseline corrected by subtracting from every epoch the mean
amplitudes in the 2100 to 0 ms pre-stimulus interval.
ClassificationWe used stepwise linear discriminant analysis (SWLDA) for
online and offline classification. This method, an extension of
Fisher’s linear discriminant analysis, is an established classification
method for visual and auditory P300 BCIs [6,22,47,48,49]. The
spatiotemporal features (the channel by sample matrix) of each
trial were smoothed with a moving average filter, with a width of
25 samples, and then decimated by a factor of 25 prior to feature
selection and classification. The algorithm starts with adding the
most significant feature to the model (at least pv0:1, otherwise the
model generation fails). It then iterates across the remaining
features in order of their significance. Each time a feature proves
significant it is added to the model. Addtionally, a backward
stepwise regression is performed to remove features above the
predefined significance threshold (pw0:15). This continues until a
maximum of 60 iterations have been performed or no more
features meet the significance threshold for inclusion (pv0:1).
For online classification of P300 signals the model was applied
to the trials of each row and column separately. The row and the
column which yielded the maximum score after model application
were selected by the classifier. This meant that for classification of
the P300 responses in the BCI no bias term was required.
Offline performance measureDue to a ceiling effect of online visual P300 BCI performance
(100% accuracy for 28 of 40 participants) the data was reclassified
offline using all six runs of each participant in a leave-one-run-out
cross validation loop. To prevent the reoccurance of ceiling effects
not the overall accuracy after 15 stimulus repetitions was used but
the number of sequences needed to achieve 70% accuracy (the
criterion level of control). The number of repetitions was linearly
interpolated to non-integer numbers.
Information transfer rateInformation transfer rate in BCIs is commonly assessed using
bits/min as defined by [50]. In P300 BCIs on the basis of flashing
matrices this formula is not valid due to unevenly distributed error
probabilities [51]. The probability of selecting a neighbor row or
column is higher than that for selecting more distant rows and
columns. Therefore, it has been suggested to use mutual
information to calculate the information transfer rate [52,53].
All error probabilities were calculated based on the selections of
the 40 participants of this study.
CorrelationsFor comparisons the group was split at the median of sequences
needed to achieve 70% accuracy and rank correlations were
performed according to [54].
Results
BCI performanceMean accuracy was 94.5% (SD 14.7, range 35–100, N = 40) for
the visual and 62.9% (SD 38, range 0–100, N = 38) for the
auditory P300-BCI. Two participants had to be excluded from the
Prediction P300 Brain-Computer Interface Aptitude
PLOS ONE | www.plosone.org 4 February 2013 | Volume 8 | Issue 2 | e53513

auditory P300 BCI study due to technical problems during the
online recording. One of these two participants could be
reclassified offline. Therefore the aptitude prediction for the
auditory P300 BCI is based on N = 39 participants. T-test for
dependent samples proved significant (t76~30:67, pv0.001)
indicating that participants performed worse with auditory
presentation of stimuli.
An ITR of 4.7 bits/min was achieved for the visual P300-BCI
with 15 sequences and of 18.4 bits/min for three sequences offline.
With 0.8 bits/min the performance of the auditory P300-BCI with
15 sequences was lower. The spatial distribution of errors is
visualized in Figure 3.
For each experiment we used median split to form groups of
high and low aptitude users based on the performance calculated
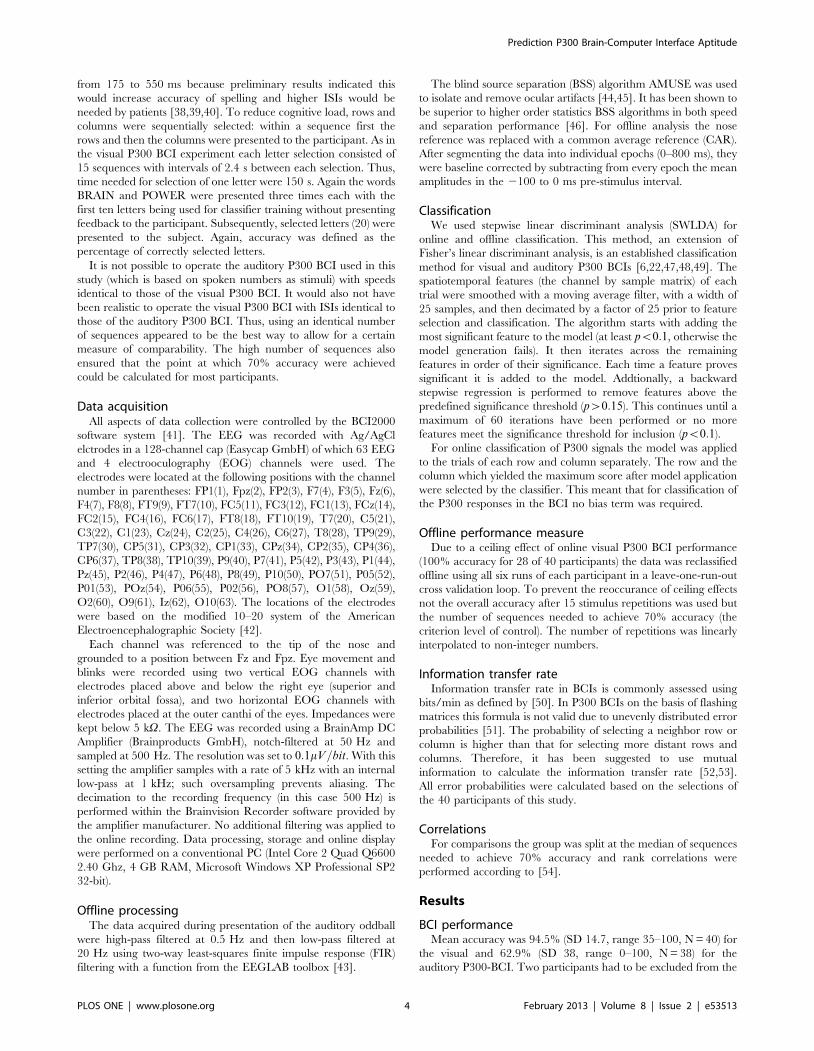
offline, i.e. the number of stimulus repetitions needed to reach
70% accuracy. This measure was calculated for each participant
and experiment (visual or auditory P300 BCI) separately. Auditory
and visual P300 online and offline BCI performance correlated
moderately (online r~0:56, pv0:001; offline r~0:45, pv0:01).
On average 3.41 repetitions (10 seconds, 6 selections/min) were
needed to achieve 70% with the visual P300 BCI whereas 9.01
(92.5 seconds, 0.64 selections/min) were needed with the auditory
P300 BCI. Low aptitude visual P300 BCI users needed 5.10
repetitions (14.6 seconds, 4.1 selections/min) and auditory 12.80
(130.4 seconds, 0.46 selections/min). High aptitude visual P300
BCI users needed 1.73 sequences (6.5 seconds, 9.1 selections/min)
and auditory 4.11 (43.5 seconds, 1.4 selections/min). The
distribution of performance across particpants is shown in
Figure 4. The mean offline accuracy achieved as a function of
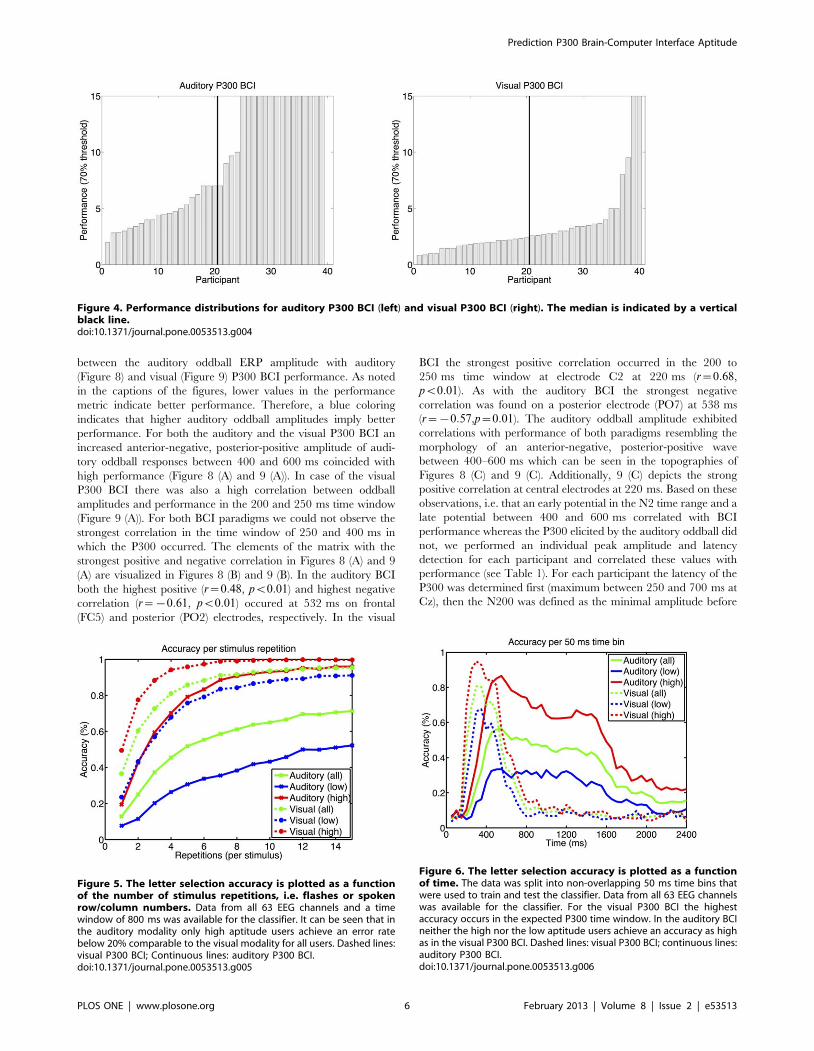
stimulus repetitions is shown in Figure 5.
Besides determining the dependency of accuracy on the number
of stimulus repetitions we determined which time segments
provide the best classification accuracy (see Figure 6). The data
was segmented into windows of 50 ms length that were classified
individually. With the visual P300 BCI high aptitude user achieved
best performance (94.83% accuracy) around 300 ms. Low
aptitude users achieved the maximum performance (67.53%
accuracy) in the window around 350 ms. With the auditory P300
BCI performance peaked around 550 ms for both groups. High
aptitude users had an accuracy of 86.55% and low aptitude users
of 33.48%. The visual P300 BCI accuracy dropped to chance level
at around 950 ms whereas the auditory P300 BCI data could be
classified well above chance until about 1700 ms.
Event-related potentialsFigure 7 shows a comparison of the ERPs elicited by the
auditory oddball (A), the visual P300 BCI (B) and the auditory
P300 BCI (C). The top row shows the color-coded differences in
amplitude between target and non-target responses. The auditory
oddball elicited the strongest responses with differences between
targets and non-targets beginning at 100 ms. In response to the
auditory oddball a clear N1-P2-complex can be seen which is not
present in the auditory P300 BCI. The latency of the P300 event-
related potential was much higher and the amplitude lower in the
auditory P300 BCI. The mean P3 amplitude and latency (4:38mVat 363 ms) did not differ between high (4:34mV at 385 ms) and low
aptitude users (4:44mV at 346 ms; amplitudes t37~{0:11,
p~0:91; and latency: t37~1:29, p~0:21).
In the visual P300 BCI the mean amplitude but not latency
(2:14mV at 309 ms) of high (2:68mV at 297 ms) and of low
(1:60mV at 319 ms) aptitude users differed significantly (amplitude:
t38~4:79, pv0:01; latency: t38~{1:32, p~0:19).
The latencies of the ERPs elicited by the auditory P300 BCI
task have the lowest amplitudes and longest latencies of all
investigated tasks (1:46mV at 508 ms). Again the amplitudes of the
high aptitude users (1:94mV ) differ significantly from those of the
low aptitude users (1:08mV ; t37~2:41, pv0:05). Again, latencies
do not differ between high (516 ms) and low aptitude users
(502 ms; t37~0:33, p~74).
Both the auditory oddball and the auditory P300 BCI elicited
an anterior-negative, posterior-positive distribution of amplitude
differences whereas the visual P300 BCI elicited an anterior-
positive, posterior-negative distribution.
Correlation of auditory oddball response with BCIperformance
The main goal of this experiment was to determine the
predictive power of the auditory oddball on visual and auditory
P300 BCI performance. Figures 8 and 9 depict the correlation
Figure 3. Probability of selecting the target matrix element (center) or a matrix element around the target is color coded on alogarithmic scale. The x-axis shows how many columns to the left (negative) or to the right (positive) an error occurs. Correspondingly, the y-axisshows the probabilities for errors for rows above or below the target. Both in the visual P300 BCI (left) and the auditory P300 BCI (right) errors occurwith a much higher probability on the same row or column as the target. This unequal distribution of the error probability was the motivation forapplying mutual information to measure bitrate.doi:10.1371/journal.pone.0053513.g003
Prediction P300 Brain-Computer Interface Aptitude
PLOS ONE | www.plosone.org 5 February 2013 | Volume 8 | Issue 2 | e53513
between the auditory oddball ERP amplitude with auditory
(Figure 8) and visual (Figure 9) P300 BCI performance. As noted
in the captions of the figures, lower values in the performance
metric indicate better performance. Therefore, a blue coloring
indicates that higher auditory oddball amplitudes imply better
performance. For both the auditory and the visual P300 BCI an
increased anterior-negative, posterior-positive amplitude of audi-
tory oddball responses between 400 and 600 ms coincided with
high performance (Figure 8 (A) and 9 (A)). In case of the visual
P300 BCI there was also a high correlation between oddball
amplitudes and performance in the 200 and 250 ms time window
(Figure 9 (A)). For both BCI paradigms we could not observe the
strongest correlation in the time window of 250 and 400 ms in
which the P300 occurred. The elements of the matrix with the
strongest positive and negative correlation in Figures 8 (A) and 9
(A) are visualized in Figures 8 (B) and 9 (B). In the auditory BCI
both the highest positive (r~0:48, pv0:01) and highest negative
correlation (r~{0:61, pv0:01) occured at 532 ms on frontal
(FC5) and posterior (PO2) electrodes, respectively. In the visual
BCI the strongest positive correlation occurred in the 200 to
250 ms time window at electrode C2 at 220 ms (r~0:68,
pv0:01). As with the auditory BCI the strongest negative
correlation was found on a posterior electrode (PO7) at 538 ms
(r~{0:57,p~0:01). The auditory oddball amplitude exhibited
correlations with performance of both paradigms resembling the
morphology of an anterior-negative, posterior-positive wave
between 400–600 ms which can be seen in the topographies of
Figures 8 (C) and 9 (C). Additionally, 9 (C) depicts the strong
positive correlation at central electrodes at 220 ms. Based on these
observations, i.e. that an early potential in the N2 time range and a
late potential between 400 and 600 ms correlated with BCI
performance whereas the P300 elicited by the auditory oddball did
not, we performed an individual peak amplitude and latency
detection for each participant and correlated these values with
performance (see Table 1). For each participant the latency of the
P300 was determined first (maximum between 250 and 700 ms at
Cz), then the N200 was defined as the minimal amplitude before
Figure 4. Performance distributions for auditory P300 BCI (left) and visual P300 BCI (right). The median is indicated by a verticalblack line.doi:10.1371/journal.pone.0053513.g004
Figure 5. The letter selection accuracy is plotted as a functionof the number of stimulus repetitions, i.e. flashes or spokenrow/column numbers. Data from all 63 EEG channels and a timewindow of 800 ms was available for the classifier. It can be seen that inthe auditory modality only high aptitude users achieve an error ratebelow 20% comparable to the visual modality for all users. Dashed lines:visual P300 BCI; Continuous lines: auditory P300 BCI.doi:10.1371/journal.pone.0053513.g005
Figure 6. The letter selection accuracy is plotted as a functionof time. The data was split into non-overlapping 50 ms time bins thatwere used to train and test the classifier. Data from all 63 EEG channelswas available for the classifier. For the visual P300 BCI the highestaccuracy occurs in the expected P300 time window. In the auditory BCIneither the high nor the low aptitude users achieve an accuracy as highas in the visual P300 BCI. Dashed lines: visual P300 BCI; continuous lines:auditory P300 BCI.doi:10.1371/journal.pone.0053513.g006
Prediction P300 Brain-Computer Interface Aptitude
PLOS ONE | www.plosone.org 6 February 2013 | Volume 8 | Issue 2 | e53513

the P300 (also at Cz) and finally the late potential was defined as
the maximum amplitude after the P300 (at POz). Average
amplitudes of all three ERP components can be found in
Table 1. The amplitude of the N2 component correlated
significantly with auditory and visual P300 BCI performance,
the amplitude of the P300 correlated with neither and the
amplitude of the late positive component on POz correlated
negatively only with visual P300 BCI performance (see Table 1,
left half). Except the negative correlation between latency of the
P300 component and auditory P300 BCI performance (p = 0.04)
none of the correlations between latency and performance were
significant (see Table 1, right half).
Discussion
We presented P300 BCI performance data from healthy
participants using a visual and an auditory P300 BCI. A standard
oddball measurement lasting less than five minutes was used to
predict the performance of the participants in the BCI application.
The largest differences between high and low aptitude P300 BCI
users in the response to the standard oddball were the amplitude of
the N2 response on Cz and a late postive potential at POz.
Correlation between N2 and performance was r~0:37 (pv0:05)
for the auditory P300 BCI and r~0:47 (pv0:01) for the visual
P300 BCI. Correlation between the late potiential and perfor-
mance was only significant for the visual P300 BCI (r~{0:46;
pv0:01).
BCI PerformanceVisual P300 BCI online accuracy of the 40 participants was on
average 94.5%. This level of accuracy is what can be expected
with healthy participants when using the standard visual P300 BCI
and is therefore comparable to that achieved in other studies
[15,22,35,55]. Comparisons between experimental designs are
difficult due to different time intervals, number of sequences and
channel sets. In any case, the ceiling effect is a common
phenomenon. It might therefore be recommendable to use three
repetitions for visual P300 BCI letter selections in studies that
analyze influences on or predictability of performance as we found
this value to lead to an average accuracy of 70% in our sample and
normal distribution of correct response rate. This accuracy is still
sufficiently high for comprehensible spelling while effectively
removing the ceiling effect.
In contrast, with 62.9%, the mean accuracy with the auditory
P300 BCI was considerably lower. Based on previous studies
which indicated that a longer ISI would increase accuracy we used
an ISI of 550 ms instead of 175 ms as was used in initial study with
the auditory P300 BCI designed by [22]. However, online
accuracy levels were comparable to the 65% achieved by [22]
and thus, were not improved by the longer ISI. Due to the
Figure 7. Responses to auditory oddball (A), visual P300 BCI (B) and auditory P300 BCI (C) are shown from left to right. Top row:average amplitude of the full spatio-temporal feature matrix of the target non-target difference for each experiment. Middle row: time course at Cz(auditory oddball and visual P300 BCI) and Pz (auditory P300 BCI) of the averaged ERP for targets (continuous lines) and non-targets (dashed lines).Bottom row: topographic distribution of the target non-target difference at 200, 300 and 400 ms. For the auditory oddball, subjects were split in highand low aptitude users at the median of the mean performance in the auditory and visual P300 BCI.doi:10.1371/journal.pone.0053513.g007
Prediction P300 Brain-Computer Interface Aptitude
PLOS ONE | www.plosone.org 7 February 2013 | Volume 8 | Issue 2 | e53513
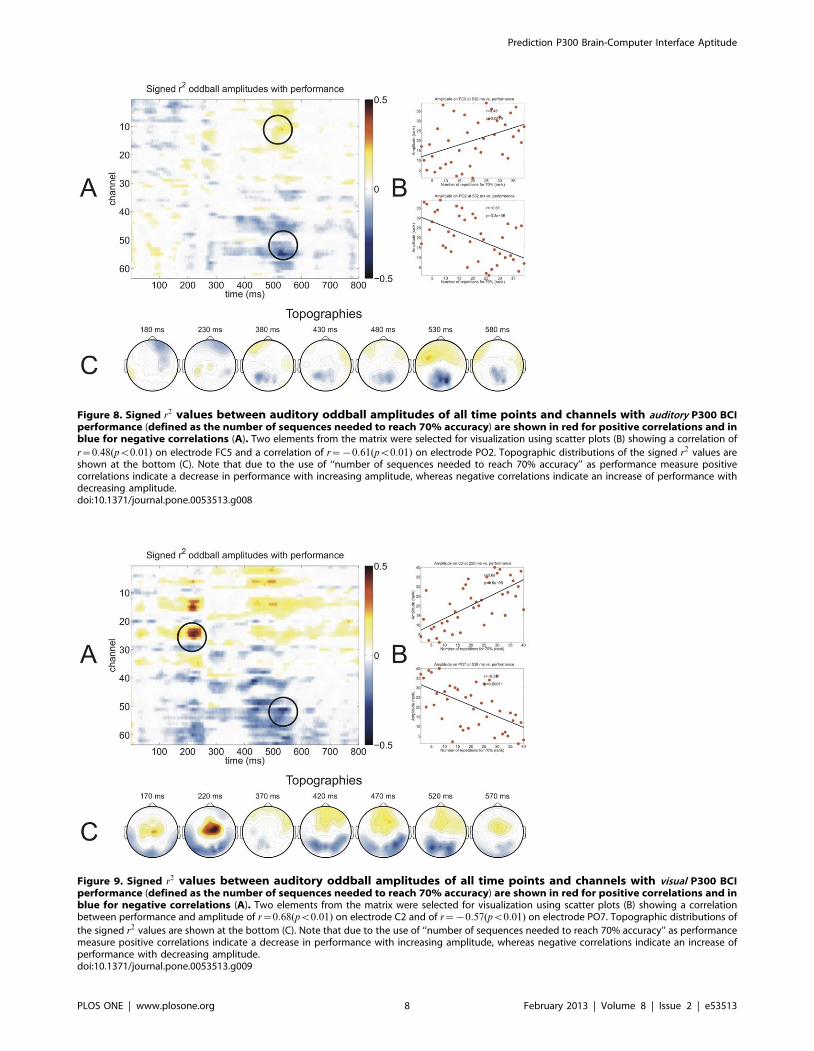
Figure 8. Signed r2 values between auditory oddball amplitudes of all time points and channels with auditory P300 BCIperformance (defined as the number of sequences needed to reach 70% accuracy) are shown in red for positive correlations and inblue for negative correlations (A). Two elements from the matrix were selected for visualization using scatter plots (B) showing a correlation of
r~0:48(pv0:01) on electrode FC5 and a correlation of r~{0:61(pv0:01) on electrode PO2. Topographic distributions of the signed r2 values areshown at the bottom (C). Note that due to the use of ‘‘number of sequences needed to reach 70% accuracy’’ as performance measure positivecorrelations indicate a decrease in performance with increasing amplitude, whereas negative correlations indicate an increase of performance withdecreasing amplitude.doi:10.1371/journal.pone.0053513.g008
Figure 9. Signed r2 values between auditory oddball amplitudes of all time points and channels with visual P300 BCIperformance (defined as the number of sequences needed to reach 70% accuracy) are shown in red for positive correlations and inblue for negative correlations (A). Two elements from the matrix were selected for visualization using scatter plots (B) showing a correlationbetween performance and amplitude of r~0:68(pv0:01) on electrode C2 and of r~{0:57(pv0:01) on electrode PO7. Topographic distributions of
the signed r2 values are shown at the bottom (C). Note that due to the use of ‘‘number of sequences needed to reach 70% accuracy’’ as performancemeasure positive correlations indicate a decrease in performance with increasing amplitude, whereas negative correlations indicate an increase ofperformance with decreasing amplitude.doi:10.1371/journal.pone.0053513.g009
Prediction P300 Brain-Computer Interface Aptitude
PLOS ONE | www.plosone.org 8 February 2013 | Volume 8 | Issue 2 | e53513

decreased selection speed, information transfer rates were much
lower reaching only 0.8 bits/min (compared to 1.54 bits/min in
[22], albeit this was calculated using the formula by [50]).
Nonetheless, our data indicate that increases in information
transfer rate may easily be achieved. For instance, accuracies of
60% are already achieved with nine sequences in the auditory
P300 BCI. Using only nine sequences the information transfer rate
would increase to 1.2 bits/min. Alternatively the ISI could be
decreased to the values used by [22] which would also increase the
information transfer rate to 1.2 bits/min. Compared to the visual
P300 BCI the development of the auditory P300 BCI is in a fairly
early stage. At the time the data of this study was collected (2008)
no other functioning auditory P300 speller system existed. Online
ERP based auditory BCIs with a reduced number of selections
[8,25] were available but we preferred a system comparable to the
visual P300 BCI. Currently a BCI system using spatially
distributed auditory stimuli for target selection appears to be the
most promising path of future development [27].
BCI ERPsAs in the study by [22] we found higher latencies in response to
the target stimuli of the auditory P300 BCI paradigm than of the
visual P300 BCI. This is an effect that was also observed in non-
BCI related ERP studies [56]. As noted by [22] this may be due to
a general increase in the synaptic delays in the auditory cortex as
compared to the visual [57]. On the other hand, it has been shown
that general P300 amplitude and latency depend stronger on other
factors besides stimulus modality, such as stimulus discriminability,
intensity and probability [58,59,60,61]. This is in accordance with
auditory P300 BCI studies using stimuli other than spoken words
which can be discriminated easier and faster. In such studies
auditory and visual P300 latencies have been found to be identical
[62]. Thus, we assume the differences in latency were caused by
differences in stimulus discriminability rather than modality.
Correlation between auditory oddball ERPs and BCIperformance
Figures 8 and 9 provide an overview which ERP components
correlated with BCI performance. In both paradigms a late
component between 400 to 600 ms correlated with performance.
This spatiotemporal distribution fits the characteristics of an
anterior-negative, posterior-positive slow wave [63]. In the visual
P300 BCI a strong positive correlation with performance was
found on frontal electrodes around 200 ms. The spatiotemporal
characteristics of this component indicate this to be the N2 ERP
component [64]. Finally, it is quite surprising that there were no
strong correlations in the time range of 300–400 ms, in which the
P300 ERP component would be expected to correlate with
performance.
When correlating the auditory standard oddball data with the
performance achieved with either the auditory or the visual P300
BCI the strongest differences between low and high aptitude users
were found in a late ERP component that was more negative at
frontal and more positive at occipital and parietal channels for
high as compared to low aptitude users (see Figures 8 and 9). For
the visual P300 BCI this difference was visible on the individual
level. This ERP component constitutes a late positive potential or
anterior-negative, posterior-positive slow wave [63]. An enhance-
ment of anterior-negative, posterior-positive slow wave has been
found in ERPs following tones that require a response (e.g. button
press) compared to ERPs following tones that do not require a
response, rendering them indicative of a higher state of
attentiveness [65]. Slow waves following a warning signal have
also been attributed to be a component of the orienting response
[66]. Similar in morphology and distribution to the orienting
response is the ‘‘reorienting negativity’’ which in contrast has been
observed to be specific to deviant tones and may therefore be
directly applicable to our results [67]. This orienting response
occurred in a time segment of 400–600 ms after stimulus
presentation and was frontocentrally distributed. Therefore the
late ERP component that we found to discriminate high from low
aptitude users may be an indication of successful allocation of
attention to the necessary switches between deviant and standard
tones.
Correlations between N2 amplitude and performance were also
observed. The N2 is not merely a sensory component but is also
involved in cognitive control processes such as response inhibition,
response conflict and error monitoring [64]. The N2 can also be
subdivided into N2a, N2b and as was proposed by [68] and [69]
into N2c components. In contrast to the N2a, the N2b and N2c
components require attention to the stimulus and are accompa-
nied by the elicitation of a P3 component, thus indicating that the
observed N2 component in this work belongs to the N2b or N2c
category. According to [64] the N2b tends to be larger for non-
targets whereas the N2c tends to be larger for targets. As can be
seen in Figure 7 the N2 elicited by the target stimuli (continuous
line) is larger, thus supporting the assumption that the observed
component may be categorized as an N2c. [64] also state that
particularly the frontocentral N2 in response to rare auditory
targets is usually a mixture of MMN, N2b and N2c. Indicative of
at least a contribution by the N2b to the observed N2 component
is its association with the orienting response which was discussed
[70].
Quite unexpectedly, the P300 did not correlate with perfor-
mance. This may in part be due to the fact that our sample
consisted of healthy participants. Only two out of forty were
unable to control the BCI. Thus in this sample a binary predictor
(predicting whether the user is completely unable to control the
BCI or has the potential for at least minimal control of the BCI) of
P300 BCI performance cannot be evaluated. The P300 ERP
component may very well be such a predictor. Possibly the P300
itself may be a better predictor of binary BCI performance than
N2 or late potentials in a sample that includes patients that are
completely unable to control a P300 BCI. Using the P300 ERP
Table 1. Amplitudes, latencies and correlations thereof with BCI performance shown for N200 (minimal amplitude before latencyof P300 on Cz), P300 (maximum between 250 and 700 ms on Cz) and late ERP component (maximum after P300 latency on POz).
Amplitude (mV) R auditory R visual Latency (ms) R auditory R visual
N200 (Cz) 23.25 (SD 2.25) 0.37 (p = 0.02) 0.47 (p,0.01) 229.05 (SD 42.57) 20.22 (p = 0.18) 0.04 (p = 0.81)
P300 (Cz) 4.99 (SD 2.66) 0.04 (p = 0.81) 20.05 (p = 0.75) 378.00 (SD 89.00) 20.32 (p,0.05) 0.07 (p = 0.65)
Late ERP (POz) 3.61 (SD 2.10) 20.26 (p = 0.12) 20.46 (p,0.01) 548.65 (SD 168.55) 0.07 (p = 0.66) 0.19 (p = 0.25)
doi:10.1371/journal.pone.0053513.t001
Prediction P300 Brain-Computer Interface Aptitude
PLOS ONE | www.plosone.org 9 February 2013 | Volume 8 | Issue 2 | e53513
component for prediction of performance in a sample of BCI users
with at least minimal potential to control a BCI may be further
confounded by the knowledge that not only the P300 contributes
to BCI performance. Usually time segments from 0 to 800 ms after
stimulus presentation and electrodes on several scalp locations are
used to record the EEG and extract features. Some publications
have addressed the fact that the so-called P300 BCI is more of a
general ERP BCI (see e.g. [71]). In fact the authors report that
about 30% of all BCI users control the P300 BCI using a negative
component around 200 ms. In our sample the N2, probably as a
general indicator of attention, was a better predictor than the
presence or absence of a P300. This is very plausible due to the
fact the the sample consisted of healthy individuals with no known
neurological disorders. We will show in a future study with ALS
patients to what extend this finding is applicable to a patient
population.
Practical application of aptitude predictionTwo approaches to a future screening protocol to determine
P300 aptitude are possible. On an individual level the findings
from this paper, i.e. which ERP components predict aptitude, can
be employed. Once larger datasets of users with known aptitude
become available we would suggest using a data-driven approach
to train classifiers that can predict the performance of future users
based on the existing data. This is the approach we intend to
implement for BCI end-users. The advantage is that a subjective
assessment of the data to predict aptitude will not be required.
One of the disadvantages is that the data needs to be recorded in
an identical manner for each user and that the aforementioned
large database needs to be collected.
The most probable procedure of employing aptitude prediction
methods (a method to describe motor imagery BCI aptitude was
described in [29] and other predictors of P300 BCI performance
such as [36]) would be to assess the patients aptitude for all
available BCI paradigms, say motor imagery and P300 BCIs, and
then proceed to train and acquaint the patient to the paradigm for
which he or she displays the highest level of aptitude. For example
the aptitude prediction would be the basis for an informed decision
about which BCI paradigm to apply. This would reduce
frustration and strain on the patient and his surroundings.
Conclusions
Correlations between individual values of the channel by time
data matrix of the auditory oddball response and BCI perfor-
mance were as high as r~0:68. Correlations between individual
components, e.g the N2 on Cz, were as high as r~0:47. This
proves the strong relationship between auditory oddball ERPs and
subsequent BCI performance. Lack of correlation between the P3
component of the auditory oddball response and BCI performance
supports the observation that P300 BCIs are not solely controlled
by the P3 component but by a variety of ERP components elicited
by the visual or auditory stimuli. Before practical use, it has to be
evaluated whether the results transfer to patients. When attempt-
ing to communicate with non-responsive patients a fast screening
method is of particular interest to quickly determine the most
promising BCI.
Acknowledgments
We would like to thank Slavica von Hartlieb for assistance in conducting
the experiments. Additional support was received from Massimiliano Rea
and Roberto Andreoni.
Author Contributions
Conceived and designed the experiments: SH MB WR NB AK. Performed
the experiments: SH EH SK. Analyzed the data: SH. Contributed
reagents/materials/analysis tools: SH. Wrote the paper: SH NB AK.
References
1. Pfurtscheller G, Guger C, Muller G, Krausz G, Neuper C (2000) Brain
oscillations control hand orthosis in a tetraplegic. Neurosci Lett 292: 211–4.
2. Kubler A, Neumann N (2005) Brain-computer interfaces – the key for the
conscious brain locked into a paralyzed body. Prog Brain Res 150: 513–525.
3. Birbaumer N, Murguialday AR, Cohen L (2008) Brain-computer interface in
paralysis. Curr Opin Neurol 21: 634–8.
4. Pichiorri F, De Vico Fallani F, Cincotti F, Babiloni F, Molinari M, et al. (2011)
Sensorimotor rhythmbased brain-computer interface training: the impact on
motor cortical responsiveness. J Neural Eng 8: 025020.
5. Polich J (2007) Updating P300: an integrative theory of P3a and P3b. Clin
Neurophysiol 118: 2128–2148.
6. Nijboer F, Furdea A, Gunst I, Mellinger J, McFarland DJ, et al. (2008) An
auditory brain-computer interface (BCI). J Neurosci Methods 167: 43–50.
7. Hoffmann U, Vesin JM, Ebrahimi T, Diserens K (2008) An efficient P300-based
brain-computer interface for disabled subjects. J Neurosci Methods 167: 115–
125.
8. Sellers E, Donchin E (2006) A P300-based brain-computer interface: initial tests
by ALS patients. Clin Neurophysiol 117: 538–548.
9. Neshige R, Murayama N, Tanoue K, Kurokawa H, Igasaki T (2006) Optimal
methods of stimulus presentation and frequency analysis in P300-based brain-
computer interfaces for patients with severe motor impairment. Suppl Clin
Neurophysiol 59: 35–42.
10. Silvoni S, Volpato C, Cavinato M, Marchetti M, Priftis K, et al. (2009) P300-
based brain-computer interface communication: Evaluation and follow-up in
amyotrophic lateral sclerosis. Front Neurosci 3: 60.
11. Zickler C, Riccio A, Leotta F, Hillian-Tress S, Halder S, et al. (2011) A brain-
computer interface as input channel for a standard assistive technology software.
Clin EEG Neurosci 42: 236–44.
12. Mugler EM, Ruf CA, Halder S, Bensch M, Kubler A (2010) Design and
implementation of a P300-based brain-computer interface for controlling an
internet browser. IEEE Trans Neural Syst Rehabil Eng 18: 599–609.
13. Munßinger JI, Halder S, Kleih SC, Furdea A, Raco V, et al. (2010) Brain
painting: First evaluation of a new brain-computer interface application with
ALS-patients and healthy volunteers. Front Neurosci 4: 182.
14. Iturrate I, Antelis J, Minguez J, Kubler A (2009) Non-Invasive Brain-Actuated
wheelchair based on a P300 neurophysiological protocol and automated
navigation. IEEE International Conference on Robotics and Automation.
15. Townsend G, LaPallo BK, Boulay CB, Krusienski DJ, Frye GE, et al. (2010) A
novel P300-based brain-computer interface stimulus presentation paradigm:
moving beyond rows and columns. Clin Neurophysiol 121: 1109–20.
16. Spuler M, Bensch M, Kleih S, Rosenstiel W, Bogdan M, et al. (2012) Online use
of error-related potentials in healthy users and people with severe motor
impairment increases performance of a P300-BCI. Clin Neurophysiol 123:
1328–37.
17. Kubler A, Birbaumer N (2008) Brain-computer interfaces and communication
in paralysis: extinction of goal directed thinking in completely paralysed patients?
Clin Neurophysiol 119: 2658–2666.
18. Jacobs L, Bozian D, Heffner RRJ, Barron SA (1981) An eye movement disorder
in amyotrophic lateral sclerosis. Neurology 31: 1282–1287.
19. Averbuch-Heller L, Helmchen C, Horn AK, Leigh RJ, Buttner-Ennerver JA
(1998) Slow vertical saccades in motor neuron disease: correlation of structure
and function. Ann Neurol 44: 641–648.
20. Treder MS, Schmidt NM, Blankertz B (2011) Gaze-independent brain-
computer interfaces based on covert attention and feature attention. J Neural
Eng 8: 066003.
21. Brunner P, Joshi S, Briskin S, Wolpaw JR, Bischof H, et al. (2010) Does the
‘P300’ speller depend on eye gaze? J Neural Eng 7: 056013.
22. Furdea A, Halder S, Krusienski DJ, Bross D, Nijboer F, et al. (2009) An auditory
oddball (P300) spelling system for brain-computer interfaces. Psychophysiology
46: 617–25.
23. Klobassa DS, Vaughan TM, Brunner P, Schwartz NE, Wolpaw JR, et al. (2009)
Toward a highthroughput auditory P300-based brain-computer interface. Clin
Neurophysiol 120: 1252–61.
24. Kubler A, Furdea A, Halder S, Hammer EM, Nijboer F, et al. (2009) A brain-
computer interface controlled auditory event-related potential (P300) spelling
system for locked-in patients. Ann N Y Acad Sci 1157: 90–100.
25. Hill N, Lal T, Bierig K, Birbaumer N, Scholkopf B (2004) An auditory paradigm
for brain-computer interfaces. In: Advances in Neural Information Processing
Systems 17.
Prediction P300 Brain-Computer Interface Aptitude
PLOS ONE | www.plosone.org 10 February 2013 | Volume 8 | Issue 2 | e53513
26. Halder S, Rea M, Andreoni R, Nijboer F, Hammer EM, et al. (2010) An
auditory oddball braincomputer interface for binary choices. Clin Neurophysiol
121: 516–23.
27. Schreuder M, Blankertz B, Tangermann M (2010) A new auditory multi-class
brain-computer interface paradigm: spatial hearing as an informative cue. PLoS
One 5: e9813.
28. Hohne J, Schreuder M, Blankertz B, Tangermann M (2011) A novel 9-class
auditory ERP paradigm driving a predictive text entry system. Front Neurosci 5:
99.
29. Blankertz B, Sannelli C, Halder S, Hammer EM, Kubler A, et al. (2010)
Neurophysiological predictor of SMR-based BCI performance. Neuroimage 51:
1303–9.
30. Hammer EM, Halder S, Blankertz B, Sannelli C, Dickhaus T, et al. (2012)
Psychological predictors of SMR-BCI performance. Biol Psychol 89: 80–6.
31. Halder S, Agorastos D, Veit R, Hammer EM, Lee S, et al. (2011) Neural
mechanisms of braincomputer interface control. Neuroimage 55: 1779–90.
32. Neumann N, Birbaumer N (2003) Predictors of successful self control during
brain-computer communication. J Neurol Neurosurg Psychiatry 74: 1117–21.
33. Kubler A, Neumann N, Wilhelm B, Hinterberger T, Birbaumer N (2004) Brain-
computer predictability of brain-computer communication. J Psychophysiol 18:
121–129.
34. Kotchoubey B, Haisst S, Daum I, Schugens M, Birbaumer N (2000) Learning
and self-regulation of slow cortical potentials in older adults. Exp Aging Res 26:
15–35.
35. Kleih SC, Nijboer F, Halder S, Kubler A (2010) Motivation modulates the P300
amplitude during brain-computer interface use. Clin Neurophysiol 121: 1023–
31.
36. Kaufmann T, Vogele C, Sutterlin S, Lukito S, Kubler A (2012) Effects of resting
heart rate variability on performance in the P300 brain-computer interface.
Int J Psychophysiol 83: 336–41.
37. Kotchoubey B, Lang S, Baales R, Herb E, Maurer P, et al. (2001) Brain
potentials in human patients with extremely severe diffuse brain damage.
Neurosci Lett 301: 37–40.
38. Vieregge P, Wauschkuhn B, Heberlein I, Hagenah J, Verleger R (1999) Selective
attention is impaired in amyotrophic lateral sclerosis–a study of event-related
EEG potentials. Brain Res Cogn Brain Res 8: 27–35.
39. Smith E, Delargy M (2005) Locked-in syndrome. BMJ 330: 406–9.
40. Birbaumer N (2006) Brain-computer-interface research: coming of age. Clin
Neurophysiol 117: 479–83.
41. Schalk G, McFarland D, Hinterberger T, Birbaumer N, Wolpaw J (2004)
BCI2000: a general-purpose brain-computer interface (BCI) system. IEEE Trans
Biomed Eng 51: 1034–1043.
42. Sharbrough F (1991) American electroencephalographic society guidelines for
standard electrode position nomenclature. J Clin Neurophysiol 8: 200–202.
43. Delorme A, Makeig S (2004) EEGLAB: an open source toolbox for analysis of
single-trial EEG dynamics including independent component analysis. J Neurosci
Methods 134: 9–21.
44. Tong L, Liu RW, Soon V, Huang YF (1991) Indeterminacy and identifiability of
blind identification. IEEE Transactions on circuits and systems 38: 499–509.
45. Cichocki A, Shishkin S, Musha T, Leonowicz Z, Asada T, et al. (2005) EEG
filtering based on blind source separation (BSS) for early detection of
Alzheimer’s disease. Clin Neurophysiol 116: 729–737.
46. Halder S, Bensch M, Mellinger J, Bogdan M, Kubler A, et al. (2007) Online
artifact removal for brain-computer interfaces using support vector machines
and blind source separation. Comput Intell Neurosci: 82069.
47. Farwell L, Donchin E (1988) Talking off the top of your head: toward a mental
prosthesis utilizing even-related brain potentials. Electroencephalogr Clin
Neurophysiol 70: 510–523.
48. Krusienski D, Sellers E, Cabestaing F, Bayoudh S, McFarland D, et al. (2006) A
comparison of classification techniques for the P300 speller. J Neural Eng 3:299–305.
49. Krusienski DJ, Sellers EW, McFarland DJ, Vaughan TM, Wolpaw JR (2008)
Toward enhanced P300 speller performance. J Neurosci Methods 167: 15–21.50. Pierce J (1980) An introduction to information theory: symbols, signals & noise.
New York: Dover Publications, 2nd rev. edition. Available: http://www.loc.gov/catdir/description/dover033/80066678.html. Accessed 2013 Jan 22.
51. Fazel-Rezai R (2007) Human error in P300 speller paradigm for brain-computer
interface. Conf Proc IEEE Eng Med Biol Soc 2007: 2516–9.52. Schlogl A, Kronegg J, Huggins J, Mason S (2007) Evaluation criteria for BCI
research. In: Toward brain-computer interfacing. Cambridge, MA: MIT press.373–391.
53. Nykopp T (2001) Statistical modelling issues for the adaptive brain interface.Master’s thesis, Helsinki University of Technology.
54. Spearman C (1987) The proof and measurement of association between two
things. By C. Spearman, 1904. Am J Psychol 100: 441–71.55. Kaufmann T, Volker S, Gunesch L, Kubler A (2012) Spelling is just a click
away: a user-centered brain-computer interface including auto-calibration andpredictive text entry. Front Neurosci 6.
56. Kotchoubey B, Lang S (2003) Parallel processing of physical and lexical auditory
information in humans. Neurosci Res 45: 369–74.57. Robles L, Delano PH (2007) Efferent system. In: Basbaum AI, Bushnell CM,
Smith DV, editors. The senses: a comprehensive reference, 1st edition, vol. 3.Amsterdam: Elsevier. 413–445.
58. Squires NK, Donchin E, Squires KC, Grossberg S (1977) Bisensory stimulation:inferring decisionrelated processes from P300 component. J Exp Psychol Hum
Percept Perform 3: 299–315.
59. Polich J, Ellerson PC, Cohen J (1996) P300, stimulus intensity, modality, andprobability. Int J Psychophysiol 23: 55–62.
60. Comerchero MD, Polich J (1999) P3a and P3b from typical auditory and visualstimuli. Clin Neurophysiol 110: 24–30.
61. Katayama J, Polich J (1999) Auditory and visual P300 topography from a 3
stimulus paradigm. Clin Neurophysiol 110: 463–8.62. Kathner I, Ruf CA, Pasqualotto E, Braun C, Birbaumer N, et al. (2012) A
portable auditory P300 brain-computer interface with directional cues. ClinNeurophysiol 124(2): 327–338.
63. Spencer KM, Dien J, Donchin E (2001) Spatiotemporal analysis of the late ERPresponses to deviant stimuli. Psychophysiology 38: 343–58.
64. Folstein JR, Van Petten C (2008) Influence of cognitive control and mismatch on
the n2 component of the erp: a review. Psychophysiology 45: 152–70.65. McCallum WC, Curry SH (1981) Late slow wave components of auditory
evoked potentials: their cognitive significance and interaction. Electroencepha-logr Clin Neurophysiol 51: 123–37.
66. Loveless NE, Sanford AJ (1974) Slow potential correlates of preparatory set. Biol
Psychol 1: 303–14.67. Schroger E, Wolff C (1998) Attentional orienting and reorienting is indicated by
human event-related brain potentials. Neuroreport 9: 3355–8.68. Naatanen R, Picton TW (1986) N2 and automatic versus controlled processes.
Electroencephalogr Clin Neurophysiol Suppl 38: 169–86.69. Ritter W, Simson R, Vaughan HG Jr, Friedman D (1979) A brain event related
to the making of a sensory discrimination. Science 203: 1358–61.
70. Naatanen R, Gaillard A (1983) The orienting reflex and the N2 deflection of theevent related potential (ERP). In: Gaillard AW, Ritter W, editors. Tutorials in
Event Related Potential Research: Endogenous Components, North-Holland,volume 10 of Advances in Psychology. 119–141. doi:10.1016/S0166-
4115(08)62036-1.
71. Kaufmann T, Hammer E, Kubler A (2011) ERPs contributing to classificationin the ‘‘P300’’ BCI. 5th International Brain-Computer Interface Workshop and
Training Course: 136–139.
Prediction P300 Brain-Computer Interface Aptitude
PLOS ONE | www.plosone.org 11 February 2013 | Volume 8 | Issue 2 | e53513


![Mismatch Negativity and P300: Biomarkers of Target ... · of auditory processing in schizophrenia is being engaged and may eventually lead to improved patient outcomes [1].! Auditory](https://static.cupdf.com/doc/110x72/5f920fef0ca7521c58038ce4/mismatch-negativity-and-p300-biomarkers-of-target-of-auditory-processing-in.jpg)