Macon
Tampa
Miami
Orlando
Charleston
Montgomery
TallahasseeJacksonville
Savannah
POLK
MIAMI-DADE
LAKE
COLLIER
LEVY
MARION
LEE
BAY
BA
LD
WIN
AIKEN
PALM BEACH
LEE
WARE
CL
AR
KE
OSCEOLA
PIKE
HENDRY
BIBB
TAYLOR
VOLUSIA
LEON
DIXIE
CLAY
HALE
WALTON
BURKE
DALLAS
GLADES
CLAY
DUVAL
ORANGE
MONROE
BROWARD
WILCOX
BERKELEY
PASCO
CLINCH
DALE
GULF
PERRY
ALACHUA
SHELBY
LIBERTY
JACKSON
BUTLER
PUTNAM
TUSCALOOSA
COLLETON
COOSA
MA
RE
NG
O
LEE
HIGHLANDS
ESCAMBIA
BARBOUR
WAYNE
MONROE
BAKER
COVINGTON
JASPER
BREVARD
LAURENS
MACON
HENRY
COFFEE
CONECUH
MARTIN
CITRUS
CHILTON
OKALOOSA
EARLY
WORTH
SANTA
ROSA
HARDEE
ELMORE
MANATEE
LONG
COFFEE
MADISON
NASSAU
LOWNDES
GENEVA
BULLOCH
CHARLTON
EMANUEL
RUSSELL
DE SOTO
DODGE
SUMTER
SCREVEN
BULLOCK
DECATUR
GRADY
TROUP
BRYAN
THOMAS
HILLSBOROUGH
WAKULLA
AUTAUGA
OKEECHOBEE
HARRIS
TIFT
SUWANNEE
HOUSTON
LIBERTY
IRWIN
DOOLY
JONES
BROOKS
GLYNN
ST LUCIE
SUMTER
CALHOUN
HOLMES
APPLING
HAMPTONBIBB
MACON
CHAMBERS
COLQUITT
COWETA
SARASOTA
FLAGLER
TELFAIR
ECHOLS
LOWNDES
GADSDEN
RANDOLPH
FRANKLIN
BAKER
BARNWELL
BERRIEN
WASHINGTON
MITCHELL
JASPER
TAYLOR
TALBOT
WILCOX
STEWART
LAFAYETTE
HANCOCK
HAMILTON
UPSON
PIKE
MONROE
CRISP
PIERCE
HEARD
CHARLOTTE
HERNANDO
BRANTLEY
CLAY
PUTNAM
COOK
JENKINS
BACON
UNION
BAMBERG
MILLER
TURNER
ATKINSON
SEMINOLE
JOHNSON
CALHOUN
BUTTS
DOUGHERTY
COLUMBIA
ESCAMBIA
TALLADEGA
TALLAPOOSA
ST JOHNS
MONTGOMERY
CRENSHAW
JEFFERSON
TATTNALL
MARION
WASHINGTON
JEFFERSON
TOOMBS
TWIGGS
CHARLESTON
CHATHAM
DORCHESTER
EFFINGHAM
MCINTOSH
RANDOLPH
WILKINSON
HOUSTON
MERIWETHER
TERRELL
ALLENDALE
INDIAN RIVER
GILCHRIST
WHEELER
RICHMOND
BALDWIN
PULASKI
EVANS
JEFF DAVIS
LAMAR
CRAWFORD
CANDLER
LANIER
BRADFORD
BEN HILL
SEMINOLE
PEACH
WEBSTER
SCHLEY
BLECKLEYBEAUFORT
MUSCOGEE
TREUTLEN
QUITMAN
SPAULDING
MONTGOMERY
CH
ATTA
HO
OC
HEE
GLASCOCK
BRYAN
CAMDEN
PINELLAS
9090
-40
-40
-50
-50
-60
-60
-70
-70
210210
190190
150150
-10
-10
-20
-20 -30-30
-80
-80
170170
150150
7070
200
200
180
180
190190200200
190190
9090
6060
100100
120
120
130130
140
140
100100
110110
140140
120120
130130
160160
8080
9090100100110110
120120
130
130
10010090908080
70706060
50504040
160
160
170170
180
180
100
100
110110
3030
2020
1010
00
7070
6060
250250
310310
320320
330330
210210
290
290
210
210
280280
190190
240240
260
260
270
270
280280
290290
300300
290290
6060
160160140140150150
180180
170170
200200210210
220220230230
20
20
00
10
10 0030
30
1010
8080
00-10-10
2020
9090
4040
5050606070708080
3030
7070
5050
70
70
50506060
7070
7070
8080
7070
5050
70
70
60
60
120120
60
60
100100
50
50
1010
70
70
80
80
110110
3030
3030
9090
30
30
10
10
1010
1010
7070
2020
8080
4040
30
30
4040
5050
2020
1010
60
60
5050
3030
2020
1010
3030
50
50
2020
40
40
4040
50
50
8080
60
60
40
403
03020
2010
10
2020
1010
00
40
40
10
10
50
50
9090
8080
60
60 5050
4040
4040
4040
3030
7070
110
110
180
180
200
20021
021
0220
22023
023
0
-50-50-6
0-6
0-70-70
4040
3030
1010
2020
-40-40
-30-30
-20-20
00
-10
-10
1010
50
50
006060
150150160160
190
190
100
100
140140
130
130
120
120
8080
170170
4040
80°81°82°83°84°85°86°87°
33°
32°
31°
30°
29°
28°
27°
26°
25°
SCIENTIFIC INVESTIGATIONS MAP 3182
Potentiometric Surface of the Upper Floridan Aquifer in Florida and
Parts of Georgia, South Carolina, and Alabama, May – June 2010
By Sandra L. Kinnaman and Joann F. Dixon, 2011
Base from U.S. Geological Survey digital data, 1996, 1:100,000Albers Equal-Area Conic projectionNational American Datum of 1983
LAKE OKEECHOBEE
Ap p
r ox
i m
at e
up
di p
l im
i to
ft h
eF l o
r i da n
Aq u i f e r
S y s t e m
Printed on recycled paper Any use of trade, product, or firm names in this publication is for descriptive purposes only and does not
This map was printed on an electronic plotter directly from digital files. Dimensional calibration may varybetween electronic plotters and between X and Y directions on the same plotter, and paper may changesize due to atmospheric conditions; therefore, scale and proportions may not be true on plots of this map.For sale by U.S. Geological Survey, Information Services, Box 25286, Federal Center, Denver, CO 80225,1–888–ASK–USGS (275-8747).Digital files available at http://fl.water.usgs.gov/FASWAM/publications.htmlSuggested Citation: Kinnaman, S.L., and Dixon, J.F., 2011 Potentiometric Surface of the Upper FloridanAquifer in Florida and Parts of Georgia, South Carolina, and Alabama, May – June 2010: U.S. GeologicalSurvey Scientific Investigations Map 3182[http://pubs.usgs.gov/sim/3182/].
imply endorsement by the U.S. Government.
MAP AREA
FLORIDA
SOUTHCAROLINA
GEORGIA
ALABAMA
AT
LA
NT
IC O
CE
AN
AT
LA
NT
IC
OC
EA
N
GU
LF
OF
ME
XIC
O
0 20 40 60 80 MILES
0 20 40 60 80 KILOMETERS
North American Datum of 1983
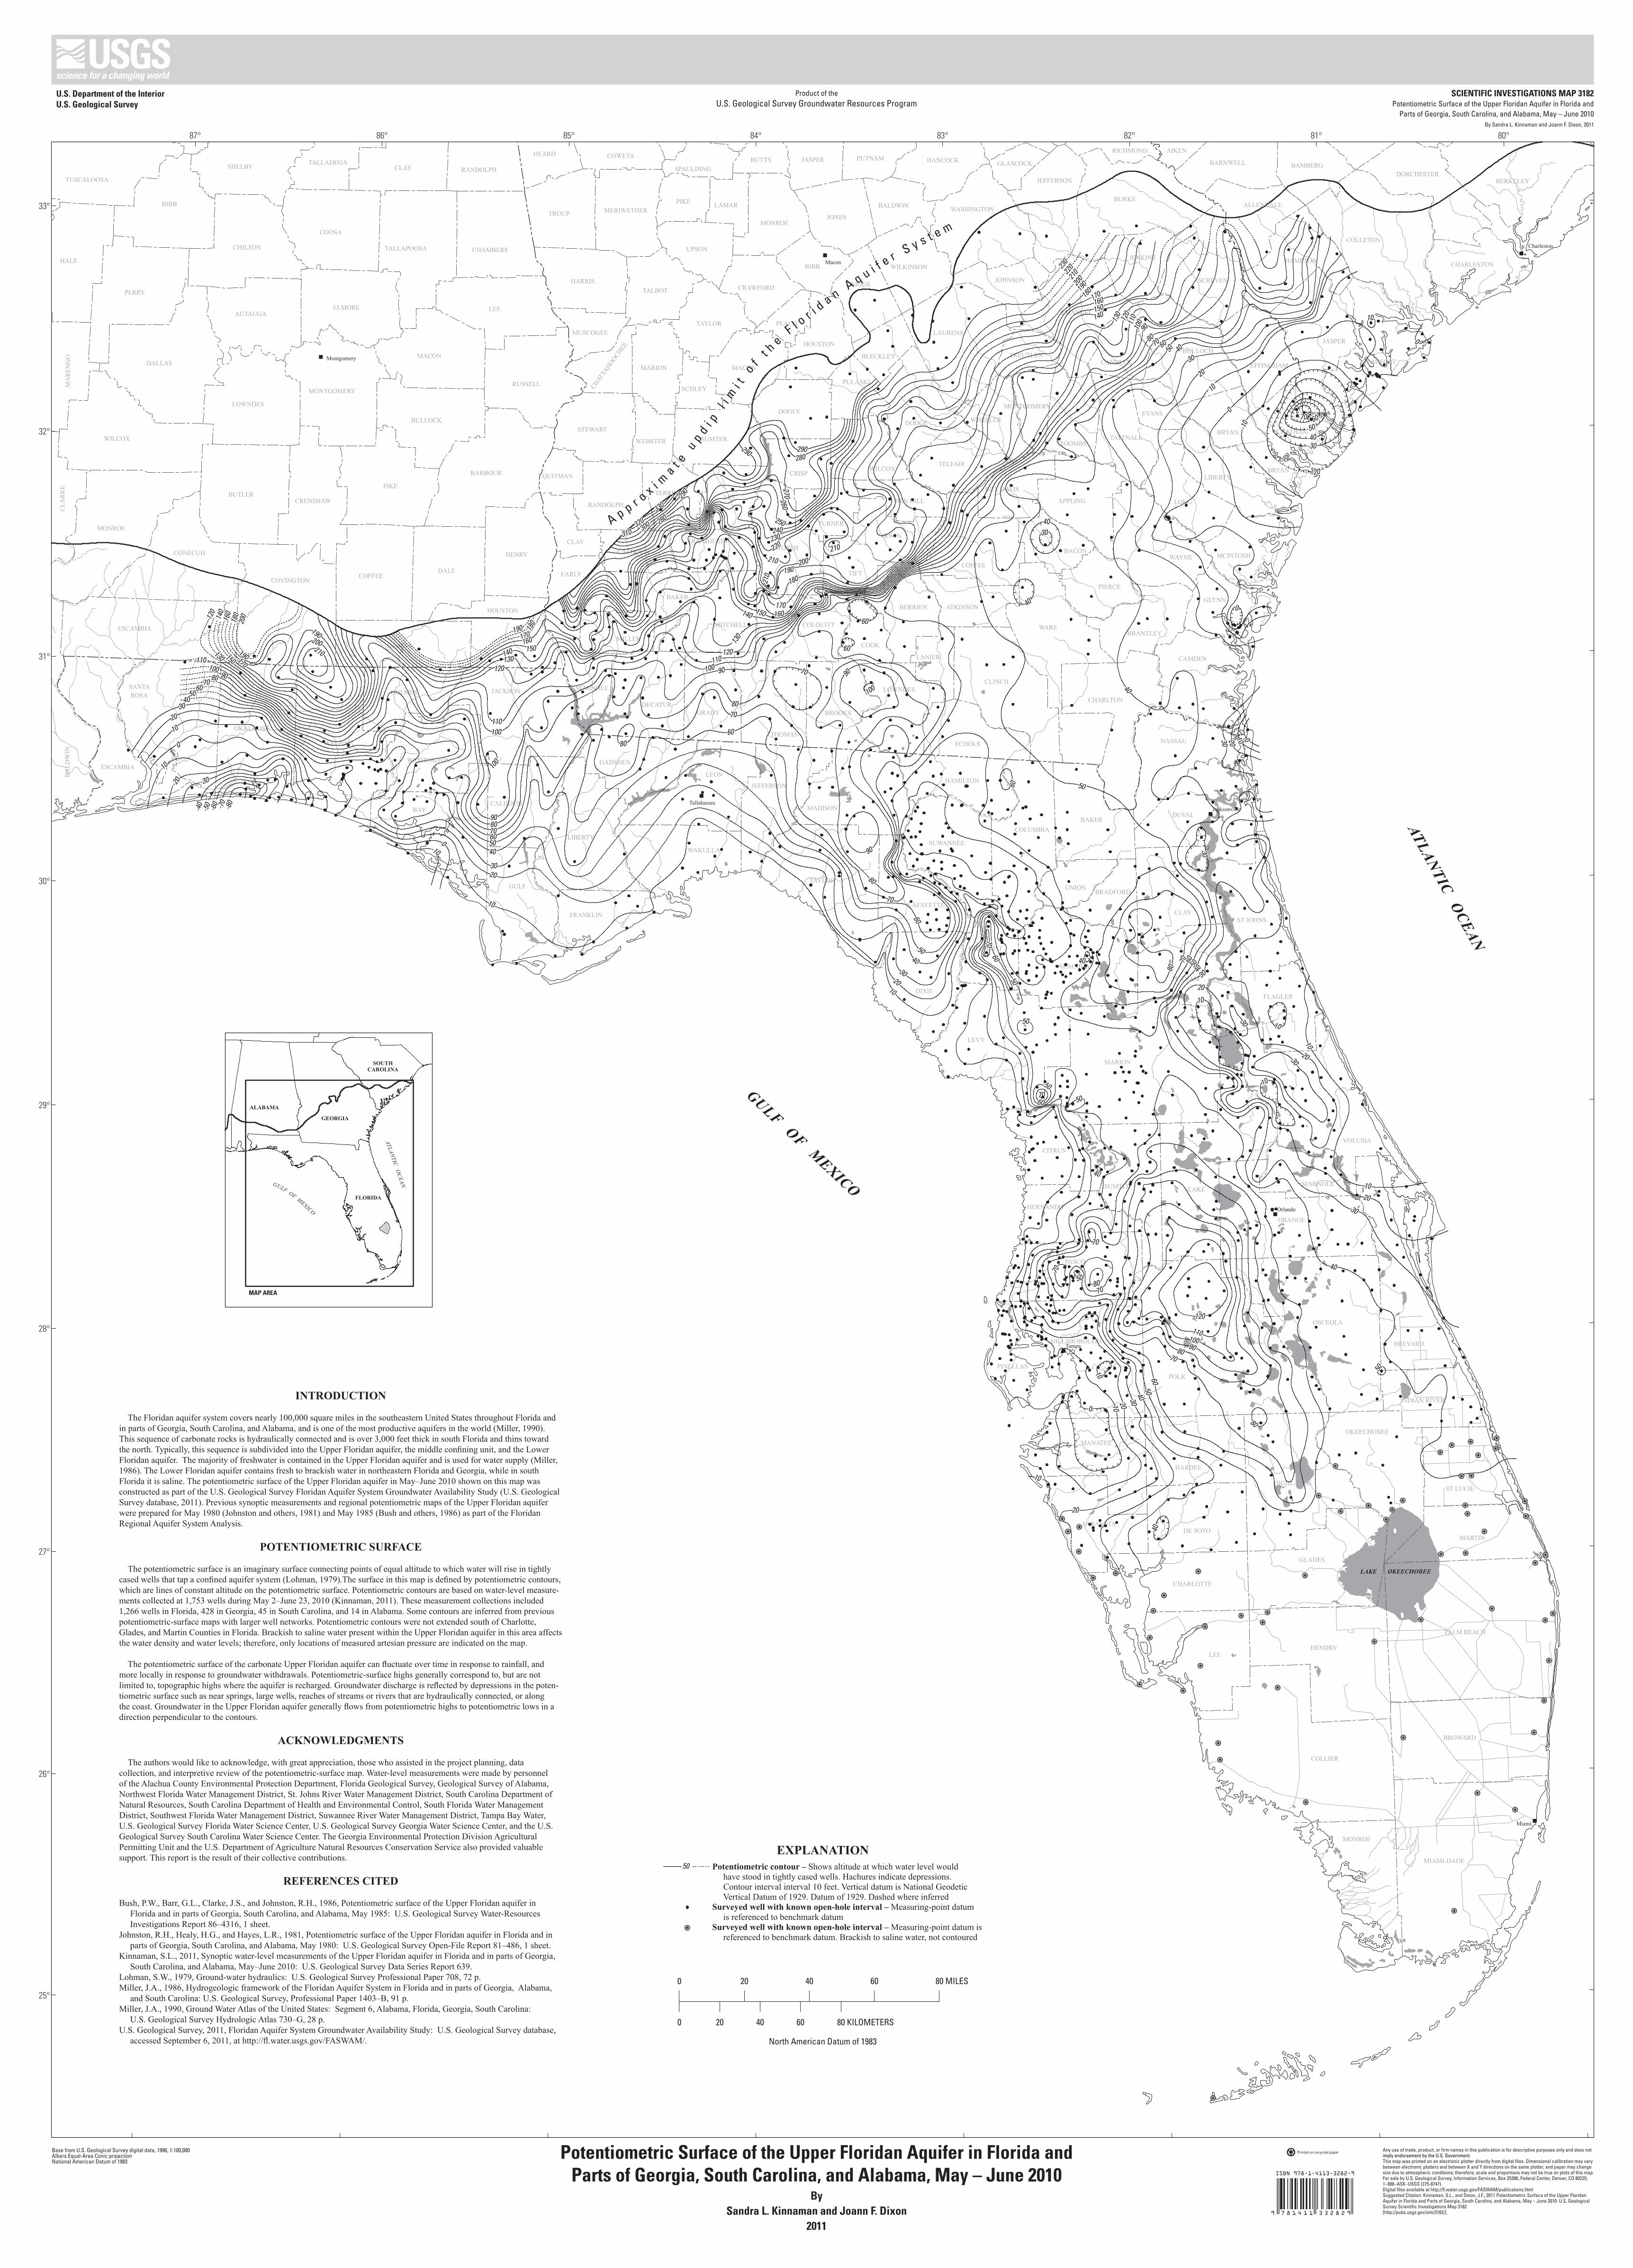
EXPLANATION
Potentiometric contour – Shows altitude at which water level would
have stood in tightly cased wells. Hachures indicate depressions.
Contour interval interval 10 feet. Vertical datum is National Geodetic
Vertical Datum of 1929. Datum of 1929. Dashed where inferred
Measuring-point datum
is referenced to benchmark datum
Measuring-point datum is
referenced to benchmark datum. Brackish to saline water, not contoured
Surveyed well with known open-hole interval –
Surveyed well with known open-hole interval –
50
INTRODUCTION
The Floridan aquifer system covers nearly 100,000 square miles in the southeastern United States throughout Florida and in parts of Georgia, South Carolina, and Alabama, and is one of the most productive aquifers in the world (Miller, 1990). This sequence of carbonate rocks is hydraulically connected and is over 3,000 feet thick in south Florida and thins toward the north. Typically, this sequence is subdivided into the Upper Floridan aquifer, the middle confi ning unit, and the Lower Floridan aquifer. The majority of freshwater is contained in the Upper Floridan aquifer and is used for water supply (Miller, 1986). The Lower Floridan aquifer contains fresh to brackish water in northeastern Florida and Georgia, while in south Florida it is saline. The potentiometric surface of the Upper Floridan aquifer in May–June 2010 shown on this map was constructed as part of the U.S. Geological Survey Floridan Aquifer System Groundwater Availability Study (U.S. Geological Survey database, 2011). Previous synoptic measurements and regional potentiometric maps of the Upper Floridan aquifer were prepared for May 1980 (Johnston and others, 1981) and May 1985 (Bush and others, 1986) as part of the Floridan Regional Aquifer System Analysis.
POTENTIOMETRIC SURFACE
The potentiometric surface is an imaginary surface connecting points of equal altitude to which water will rise in tightly cased wells that tap a confi ned aquifer system (Lohman, 1979).The surface in this map is defi ned by potentiometric contours, which are lines of constant altitude on the potentiometric surface. Potentiometric contours are based on water-level measure-ments collected at 1,753 wells during May 2–June 23, 2010 (Kinnaman, 2011). These measurement collections included 1,266 wells in Florida, 428 in Georgia, 45 in South Carolina, and 14 in Alabama. Some contours are inferred from previous potentiometric-surface maps with larger well networks. Potentiometric contours were not extended south of Charlotte, Glades, and Martin Counties in Florida. Brackish to saline water present within the Upper Floridan aquifer in this area affects the water density and water levels; therefore, only locations of measured artesian pressure are indicated on the map.
The potentiometric surface of the carbonate Upper Floridan aquifer can fl uctuate over time in response to rainfall, and more locally in response to groundwater withdrawals. Potentiometric-surface highs generally correspond to, but are not limited to, topographic highs where the aquifer is recharged. Groundwater discharge is refl ected by depressions in the poten-tiometric surface such as near springs, large wells, reaches of streams or rivers that are hydraulically connected, or along the coast. Groundwater in the Upper Floridan aquifer generally fl ows from potentiometric highs to potentiometric lows in a direction perpendicular to the contours.
ACKNOWLEDGMENTS
The authors would like to acknowledge, with great appreciation, those who assisted in the project planning, data collection, and interpretive review of the potentiometric-surface map. Water-level measurements were made by personnel of the Alachua County Environmental Protection Department, Florida Geological Survey, Geological Survey of Alabama, Northwest Florida Water Management District, St. Johns River Water Management District, South Carolina Department of Natural Resources, South Carolina Department of Health and Environmental Control, South Florida Water Management District, Southwest Florida Water Management District, Suwannee River Water Management District, Tampa Bay Water, U.S. Geological Survey Florida Water Science Center, U.S. Geological Survey Georgia Water Science Center, and the U.S. Geological Survey South Carolina Water Science Center. The Georgia Environmental Protection Division Agricultural Permitting Unit and the U.S. Department of Agriculture Natural Resources Conservation Service also provided valuable support. This report is the result of their collective contributions.
REFERENCES CITED
Bush, P.W., Barr, G.L., Clarke, J.S., and Johnston, R.H., 1986, Potentiometric surface of the Upper Floridan aquifer in Florida and in parts of Georgia, South Carolina, and Alabama, May 1985: U.S. Geological Survey Water-Resources Investigations Report 86–4316, 1 sheet. Johnston, R.H., Healy, H.G., and Hayes, L.R., 1981, Potentiometric surface of the Upper Floridan aquifer in Florida and in parts of Georgia, South Carolina, and Alabama, May 1980: U.S. Geological Survey Open-File Report 81–486, 1 sheet. Kinnaman, S.L., 2011, Synoptic water-level measurements of the Upper Floridan aquifer in Florida and in parts of Georgia, South Carolina, and Alabama, May–June 2010: U.S. Geological Survey Data Series Report 639. Lohman, S.W., 1979, Ground-water hydraulics: U.S. Geological Survey Professional Paper 708, 72 p. Miller, J.A., 1986, Hydrogeologic framework of the Floridan Aquifer System in Florida and in parts of Georgia, Alabama, and South Carolina: U.S. Geological Survey, Professional Paper 1403–B, 91 p. Miller, J.A., 1990, Ground Water Atlas of the United States: Segment 6, Alabama, Florida, Georgia, South Carolina: U.S. Geological Survey Hydrologic Atlas 730–G, 28 p. U.S. Geological Survey, 2011, Floridan Aquifer System Groundwater Availability Study: U.S. Geological Survey database, accessed September 6, 2011, at http://fl .water.usgs.gov/FASWAM/.
By Sandra L. Kinnaman and Joann F. Dixon
2011
Potentiometric Surface of the Upper Floridan Aquifer in Florida and Parts of Georgia, South Carolina, and Alabama, May – June 2010
Product of the U.S. Geological Survey Groundwater Resources Program
U.S. Department of the Interior U.S. Geological Survey