A NOVEL PHOSPHATASE MODULATING THE DNA
DAMAGE RESPONSE AND THE TUMOR SUPPRESSOR P53
PhD Thesis
in partial fulfillment of the requirements
for the degree “Doctor of Philosophy (PhD)”
in the Molecular Biology Program
at the Georg August University Göttingen,
Faculty of Biology
submitted by
Konstantina Marinoglou
born in
Athens, Attica, Greece


AFFIDAVIT
Herewith I declare, that I prepared the PhD Thesis:
"A novel phosphatase modulating the DNA damage response and the tumor suppressor P53"
on my own and with no other sources and aids than quoted.
Göttingen, 30.09.10

List of Publications:
“An siRNA screen to identify phosphatases that modulate the DNA damage response” Konstantina Marinoglou, Matthias Dobbelstein
University of Goettingen, Germany
Poster – Cancer Conference NCRI, Birmingham – UK, October 2008
“The Bactrocera oleae homologues of Drosophila melanogaster sex-determining genes”
Lagos D., Marinoglou K., Pappas V. & K. Komitopoulou
Dept. of Genetics & Biotechnology, School of Biology, University of Athens,
Panepistimiopolis 15784 Athens Greece
Poster – Proceedings of 26th Scientific Conference, Volos – Greece, May 2004, Hellenic
Society for Biological Sciences
i
Table of Contents:
Acknowledgements .................................................................................................................. iv
Abstract ..................................................................................................................................... v
List of Figures ......................................................................................................................... vii
List of Tables .......................................................................................................................... viii
Abbreviations ........................................................................................................................... ix
1 Introduction ....................................................................................................................... 1
1.1 The p53 network .......................................................................................................... 1
1.1.1 The tumor suppressor p53 .................................................................................... 1
1.1.2 Regulation of p53 ................................................................................................. 2
1.1.3 Post-translational modifications of p53 ................................................................ 3
1.1.4 Functions of p53 ................................................................................................... 4
1.2 The DNA damage response ......................................................................................... 6
1.2.1 The kinase cascade ............................................................................................... 7
1.2.2 The cell cycle checkpoints ................................................................................... 9
1.3 Human phosphatases ................................................................................................. 11
1.3.1 Dual Specificity Phosphatases ........................................................................... 12
1.3.2 DUSP18 .............................................................................................................. 13
1.3.3 Implication of phosphatases in the DNA damage response ............................... 15
2 Materials .......................................................................................................................... 17
2.1 Chemicals .................................................................................................................. 17
2.2 Enzymes and buffers.................................................................................................. 19
2.3 Reaction systems (kits) .............................................................................................. 19
2.4 Oligonucleotides ........................................................................................................ 20
2.5 Antibodies .................................................................................................................. 21
2.6 Buffers ....................................................................................................................... 22
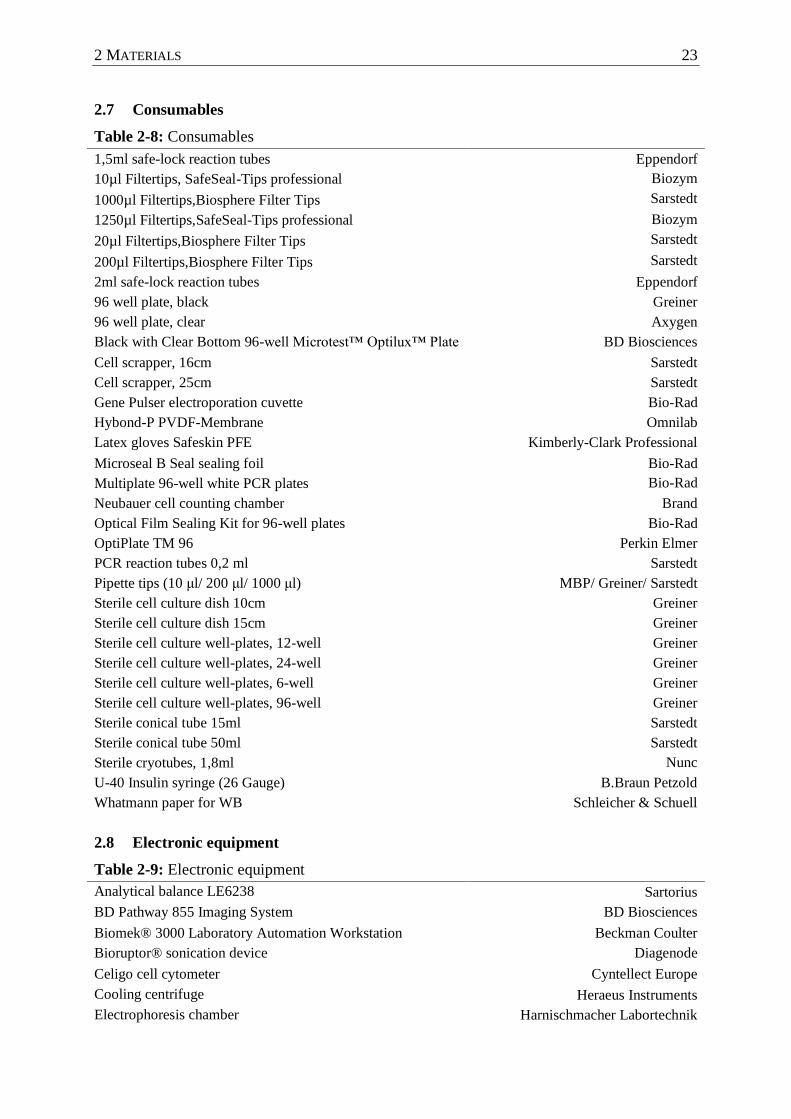
2.7 Consumables .............................................................................................................. 23
2.8 Electronic equipment ................................................................................................. 23
2.9 Software ..................................................................................................................... 24
3 Methods ............................................................................................................................ 25
3.1 Cell culture and treatment .......................................................................................... 25
3.1.1 Culture of human cancer cells ............................................................................ 25
3.1.2 Cell freezing and recovery ................................................................................. 25

ii
3.1.3 Cell proliferation assay ....................................................................................... 25
3.1.4 Generation of polyclonal stable U2OS cell lines ............................................... 26
3.1.5 Irradiation of human cancer cells with UVC light ............................................. 26
3.1.6 Transfection of human cancer cells with Lipofectamine 2000 .......................... 26
3.1.6.1 Transfection with DNA (plasmids) ................................................................ 26
3.1.6.2 Transfection with siRNAs .............................................................................. 27
3.1.7 Cell harvesting .................................................................................................... 27
3.1.7.1 Cell harvesting and fixation for cell cycle analysis with a FACS machine.... 27
3.1.7.2 Preparation of cell lysates for immunoblotting analysis ................................ 27
3.1.7.3 Total RNA extraction ..................................................................................... 28
3.2 Molecular Biology ..................................................................................................... 28
3.2.1 Cloning of Dusp18 ............................................................................................. 28
3.2.1.1 Cloning of Dusp18 cDNA in pCGN ............................................................... 28
3.2.1.2 Cloning of Dusp18 in pIRES .......................................................................... 31
3.2.2 Quantitative Polymerase Chain Reaction (qPCR).............................................. 32
3.2.2.1 cDNA synthesis from total RNA .................................................................... 32
3.2.2.2 Quantitative PCR ............................................................................................ 33
3.2.2.2.1 Preparation of qPCR homemade mastermix: ............................................ 33
3.2.3 Chromatin Immunoprecipitation (ChIP) ............................................................ 34
3.3 Biochemistry .............................................................................................................. 35
3.3.1 Immunoblotting analysis .................................................................................... 35
3.3.1.1 SDS-PAGE ..................................................................................................... 35
3.3.1.2 Immunoblotting (Western Blotting) ............................................................... 36
3.3.1.3 Immunostaining .............................................................................................. 36
3.3.2 Coimmunoprecipitation (CoIP) .......................................................................... 37
3.4 Human phosphatase siRNA library screening ........................................................... 37
3.4.1 Transfection of U2OS cells with the phosphatase library siRNAs .................... 37
3.4.2 Fixation and immunofluorescence staining of the U2OS cells .......................... 38
3.4.3 Imaging and data analysis .................................................................................. 38
4 Results .............................................................................................................................. 40
4.1 Identification of novel phosphatases as potential players in the DNA damage and
p53-response .............................................................................................................. 40
4.1.1 Screening of the human phosphatase siRNA library.......................................... 40
4.2 Investigation of Dusp18 as a novel regulator of the p53 pathway ............................ 44
iii
4.2.1 Subcellular localization of human Dusp18 ........................................................ 44
4.2.2 The knockdown of Dusp18 induces the p53 pathway in different cell lines ..... 46
4.2.3 Depletion of Dusp18 does not increase the phosphorylation or acetylation of
p53 ...................................................................................................................... 49
4.2.4 The interaction of p53 with Mdm2 was not disrupted upon Dusp18
knockdown ......................................................................................................... 50
4.2.5 P53 accumulated and was activated to induce p21 transcription by depletion of
Dusp18 ............................................................................................................... 51
4.3 Dusp18 is necessary for cell survival and proper cell cycle progression .................. 54
4.3.1 Cells depleted of Dusp18 undergo spontaneous apoptosis ................................ 54
4.3.2 Depletion of Dusp18 induced DNA damage response ....................................... 55
4.3.3 Removal of Dusp18 caused an accumulation of cells in S phase which
correlated with reduced cell proliferation. ......................................................... 57
4.3.4 Dusp18 is needed for proper cell cycle progression........................................... 61
4.3.5 Dusp18 knockdown sensitized HCT116 p53 +/+ cells to gemcitabine ............. 63
5 Discussion ......................................................................................................................... 65
5.1 Identification of novel phosphatases that modulate the DNA damage response and
the p53 pathway ......................................................................................................... 65
5.2 The depletion of Dusp18 induced the p53 pathway .................................................. 66
5.2.1 Human Dusp18 was not localized in mitochondria in our system ..................... 66
5.2.2 The depletion of Dusp18 induced p53 and p21 accumulation in several cell
lines .................................................................................................................... 67
5.3 The survival of tumor cells depends on Dusp18 ....................................................... 69
5.4 Dusp18 depletion induces γH2Ax and initiates the DNA damage response cascade 70
6 Summary and Conclusions ............................................................................................. 75
7 Appendix .......................................................................................................................... 77
8 References ........................................................................................................................ 84

iv
ACKNOWLEDGEMENTS
Although it is not the traditional way, I want to first of all, thank God. He knows why.
Even though I could have restricted my acknowledgements to thanking three little moles
digging in the garden, I feel very grateful to many people and would like to take this chance to
thank them.
First of all, I want to thank my supervisor and mentor Professor Matthias Dobbelstein,
for his scientific, but also personal, support and advice. He has always encouraged my
initiatives and ideas, and through our very helpful discussions I have learned a lot about the
exciting field of cancer research. His guidance and will to help were critical for the fulfillment
of this work, and I will always be grateful for his contribution in turning a student into a
scientist.
I greatly appreciate the advice and guidance of my internal committee members,
Professors Andreas Wodarz and Herbert Jäckle. I would like to thank them both very much,
not only for taking the time to regularly monitor and discuss the progress of this work, but
also for their genuine interest and encouragement.
I can only hope that my further steps will bring me into a working environment as
wonderful as the department of Molecular Oncology in Göttingen, although I fear that I can
nowhere else meet, and work with, such great people. Despite my fears when coming to
Germany, they accepted me and taught me that the people of this country can be very
genuine, funny, honest, supportive and warm, and I feel very lucky to have them as colleagues
and friends. I would like to especially thank my younger clone Franziska Schmidt for creating
the pIRES-Dusp18-HA clone and for the Dusp18 localization and NPM studies presented in
this work. Additionally, I am grateful to Monika Bug and Magda Morawska for kindly
contributing material used in this study.
My life in Göttingen would have been much more difficult without the Molecular
Biology program, and I am especially grateful to Steffen, Kerstin and Ivana for all their help
and support during my time here.
I have shared the best moments of the past 5 years with many lovely and just-weird-
enough-to-like-me people, so here I d like to thank: Adema, Ieva, Kathy and Mara for 3+
wonderful years of living together, Martina, for sharing the thesis-writing time and a large
glass of Nutella with me, Christoph, for saving the work of ten days and for making me
happy, and Achim and Andrew, for proof-reading, and for being especially fun-tional friends.
My family has given me everything a family can give; I am forever grateful to my
parents and my brother for their love and support, and for always being there for me in happy
and difficult times, despite the geographical distance.
I acknowledge here the financial support of this work by a Lichtenberg Stipend
(Molecular Biology program), a GGNB stipend (GGNB) and a DFG Stipend
(Graduiertenkollegs 1034).
v
ABSTRACT
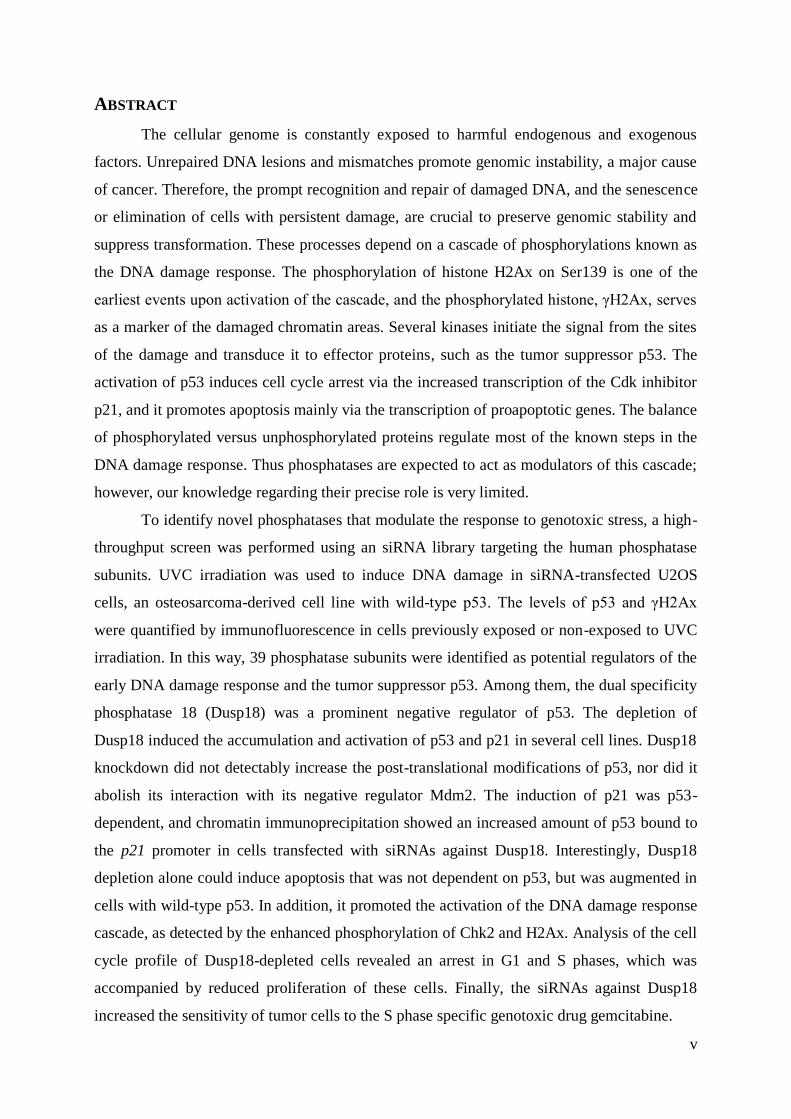
The cellular genome is constantly exposed to harmful endogenous and exogenous
factors. Unrepaired DNA lesions and mismatches promote genomic instability, a major cause
of cancer. Therefore, the prompt recognition and repair of damaged DNA, and the senescence
or elimination of cells with persistent damage, are crucial to preserve genomic stability and
suppress transformation. These processes depend on a cascade of phosphorylations known as
the DNA damage response. The phosphorylation of histone H2Ax on Ser139 is one of the
earliest events upon activation of the cascade, and the phosphorylated histone, γH2Ax, serves
as a marker of the damaged chromatin areas. Several kinases initiate the signal from the sites
of the damage and transduce it to effector proteins, such as the tumor suppressor p53. The
activation of p53 induces cell cycle arrest via the increased transcription of the Cdk inhibitor
p21, and it promotes apoptosis mainly via the transcription of proapoptotic genes. The balance
of phosphorylated versus unphosphorylated proteins regulate most of the known steps in the
DNA damage response. Thus phosphatases are expected to act as modulators of this cascade;
however, our knowledge regarding their precise role is very limited.
To identify novel phosphatases that modulate the response to genotoxic stress, a high-
throughput screen was performed using an siRNA library targeting the human phosphatase
subunits. UVC irradiation was used to induce DNA damage in siRNA-transfected U2OS
cells, an osteosarcoma-derived cell line with wild-type p53. The levels of p53 and γH2Ax
were quantified by immunofluorescence in cells previously exposed or non-exposed to UVC
irradiation. In this way, 39 phosphatase subunits were identified as potential regulators of the
early DNA damage response and the tumor suppressor p53. Among them, the dual specificity
phosphatase 18 (Dusp18) was a prominent negative regulator of p53. The depletion of
Dusp18 induced the accumulation and activation of p53 and p21 in several cell lines. Dusp18
knockdown did not detectably increase the post-translational modifications of p53, nor did it
abolish its interaction with its negative regulator Mdm2. The induction of p21 was p53-
dependent, and chromatin immunoprecipitation showed an increased amount of p53 bound to
the p21 promoter in cells transfected with siRNAs against Dusp18. Interestingly, Dusp18
depletion alone could induce apoptosis that was not dependent on p53, but was augmented in
cells with wild-type p53. In addition, it promoted the activation of the DNA damage response
cascade, as detected by the enhanced phosphorylation of Chk2 and H2Ax. Analysis of the cell
cycle profile of Dusp18-depleted cells revealed an arrest in G1 and S phases, which was
accompanied by reduced proliferation of these cells. Finally, the siRNAs against Dusp18
increased the sensitivity of tumor cells to the S phase specific genotoxic drug gemcitabine.

vi
Hence, the depletion of Dusp18 inhibits the proliferation and promotes the apoptotic
death of tumor cells. Furthermore, the knockdown of Dusp18 can enhance the cytotoxic effect
of therapeutic drugs like gemcitabine. These results identify Dusp18 as a novel phosphatase
needed for the survival and proliferation of cancer cells, and as a suppressor of the DNA
damage response and the p53 pathway, potentially identifying Dusp18 as a cancer drug
candidate.
vii
LIST OF FIGURES
Figure 1-1 : The domains of human p53 and Mdm2. ................................................................ 1
Figure 1-2 : The p53 - Mdm2 - p14ARF network. ..................................................................... 3
Figure 1-3 : Some promoter selection mechanisms for differential activation of p53 target
genes...................................................................................................................... 5
Figure 1-4 : The DNA damage response cascade. ..................................................................... 6
Figure 1-5 : Examples of kinases involved in DNA damage response and cancer
predisposition. ....................................................................................................... 7
Figure 1-6 : A simplified view of the MAP kinase signaling pathways. .................................... 9
Figure 1-7 : The activation of the DNA damage response cascade leads to the arrest of the
cell cycle .............................................................................................................. 10
Figure 1-8 : The different phosphatase families. ..................................................................... 12
Figure 1-9 : Several MKPs are misregulated in different forms of cancer. ............................ 13
Figure 1-10: The structure of human Dusp18. ......................................................................... 14
Figure 4-1 : Immunofluorescence detection of p53 and γH2Ax in UVC-exposed U2OS cells.40
Figure 4-2 : Human phosphatase siRNA library screen selected results. ............................... 42
Figure 4-3 : Groups of phosphatases identified and further evaluated as potential regulators
of DNA damage- and p53- response. .................................................................. 43
Figure 4-4 : Validation of selected screen targets by immunoblotting.................................... 44
Figure 4-5 : Localization of Dusp18. ...................................................................................... 45
Figure 4-6 : Alignment of Human and Murine Dusp18 proteins and MitoProt mitochondrial
localization prediction. ....................................................................................... 46
Figure 4-7 : Knockdown efficiency of Dusp18 siRNAs. .......................................................... 47
Figure 4-8 : Induction of p53 and p21 upon Dusp18 depletion in different cell lines. ........... 48
Figure 4-9 : p53 modification upon Dusp18 knockdown. ....................................................... 50
Figure 4-10: Co-immunoprecipitation of p53 and Mdm2 after Dusp18 knockdown. .............. 51
Figure 4-11: p21 mRNA levels after Dusp18 knockdown. ....................................................... 52
Figure 4-12: Binding of p53 on p21 promoter upon Dusp18 knockdown. ............................... 53
Figure 4-13: Combined knockdown of Dusp18 and SP1 in HCT116 p53 +/+ cells. ............... 54
Figure 4-14: Apoptosis detection in HCT116 cells after Dusp18 knockdown. ........................ 55
Figure 4-15: Stress response in HCT116 cells depleted of Dusp18. ........................................ 56
Figure 4-16: Nucleophosmin localization in U2OS cells depleted of Dusp18. ........................ 57
Figure 4-17: Cell cycle distribution of HCT116 p53 +/+ cells depleted of Dusp18. ............... 58
Figure 4-18: Cell cycle distribution of U2OS (wt p53) cells depleted of Dusp18. ................... 58
Figure 4-19: Cell cycle distribution of U2OS (wt p53) cells depleted of Dusp18 (ModFit
analysis). ............................................................................................................. 59
Figure 4-20: Cell cycle distribution of HCT116 p53 -/- cells depleted of Dusp18. ................. 59
Figure 4-21: Proliferation of HCT116 cells depleted of Dusp18. ............................................ 60
Figure 4-22: Cell cycle distribution of HCT116 p53 +/+ cells depleted of Dusp18 and trapped
in G2/M with Nocodazole (ModFit analysis). ..................................................... 62
Figure 4-23: Cell cycle distribution of U2OS cells depleted of Dusp18 and trapped in G2/M
with Nocodazole (ModFit analysis). ................................................................... 62
viii
Figure 4-24: Cell cycle distribution of HCT116 p53 +/+ and U2OS cells depleted of Dusp18
trapped in G2 with Nocodazole. ......................................................................... 63
Figure 4-25: γH2Ax in HCT116 p53 +/+ cells depleted of Dusp18 after treatment with
gemcitabine. ........................................................................................................ 64
Figure 5-1 : Possible mechanisms of Dusp18 action. ............................................................. 73
Figure 7-1 : Human phosphatase siRNA library screen results. ............................................. 78
Figure 7-2 : Validation of selected screen results using immunofluorescence. ...................... 79
Figure 7-3 : Mdm2 protein levels in cells depleted of Dusp18. ............................................... 80
Figure 7-4 : Binding of SP1 and RNA pol II along the p21 gene upon Dusp18 knockdown. . 81
Figure 7-5 : Cell cycle distribution of HCT116 p53 +/+ cells depleted of Dusp18. ............... 82
Figure 7-6 : Proliferation of HCT116 cells depleted of Dusp18. ............................................ 82
Figure 7-7 : Proliferation of HCT116 p21 -/- cells depleted of Dusp18. ................................ 83
LIST OF TABLES
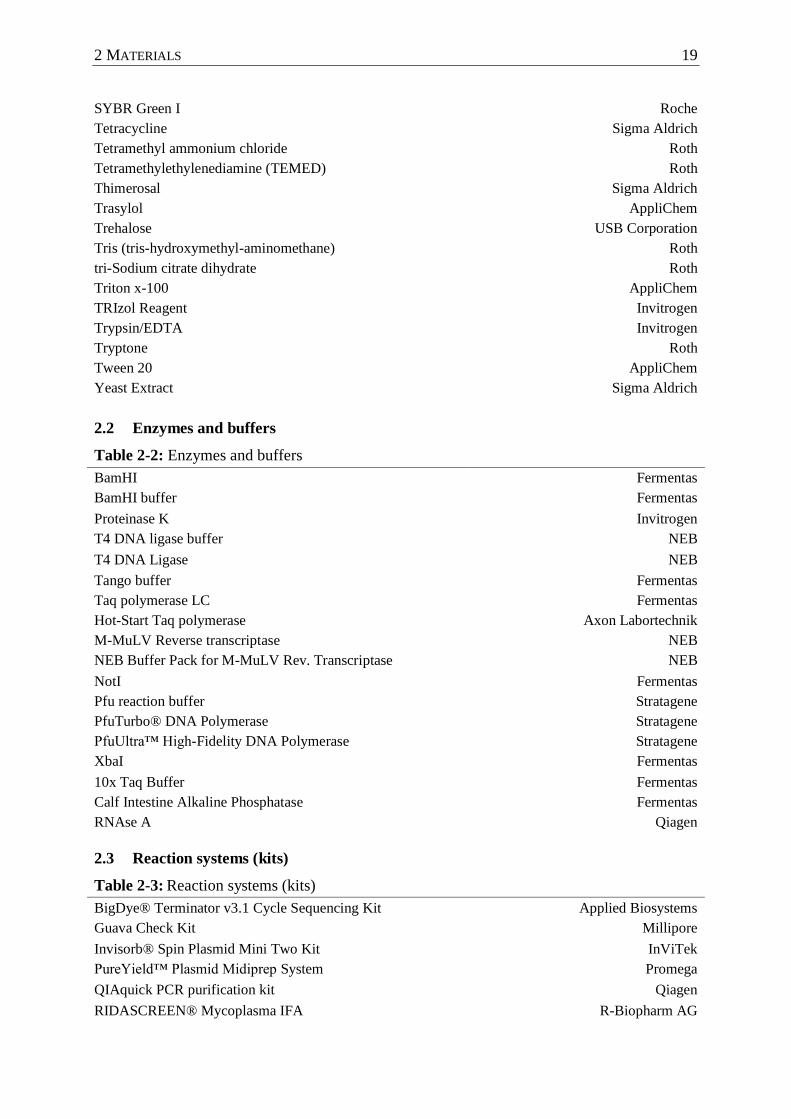
Table 2-1 : Chemicals ............................................................................................................. 17
Table 2-2 : Enzymes and buffers ............................................................................................. 19
Table 2-3 : Reaction systems (kits) ......................................................................................... 19
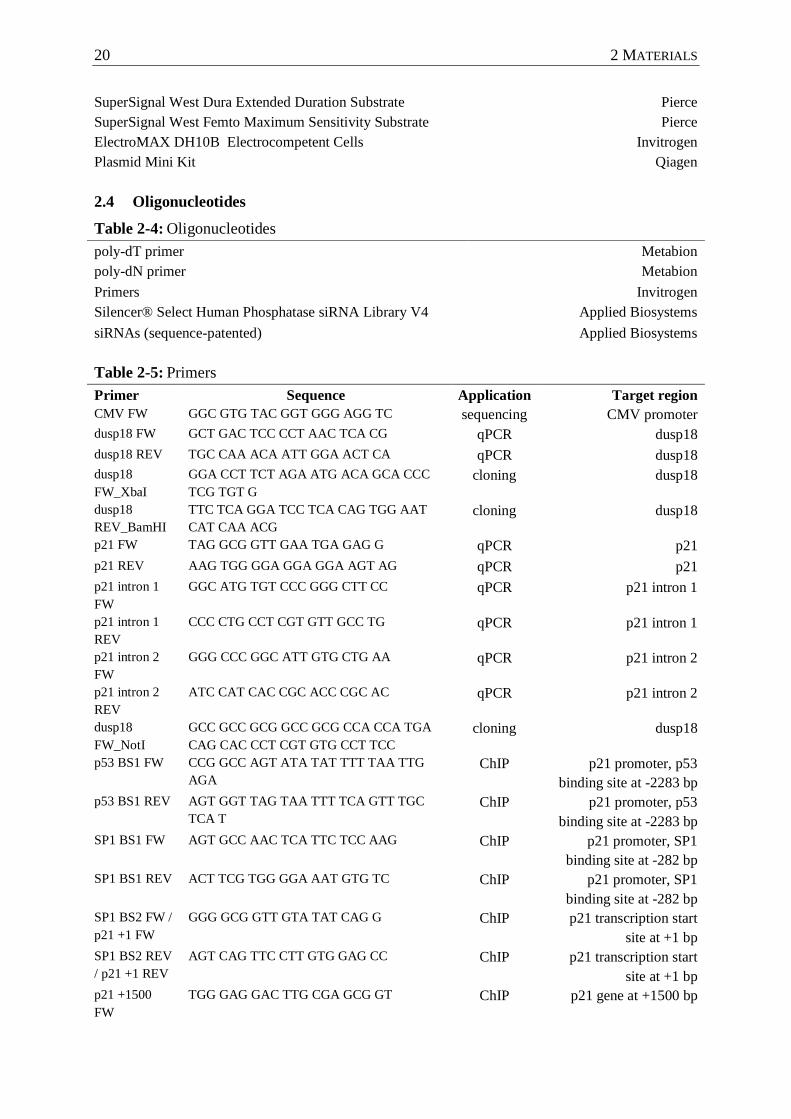
Table 2-4 : Oligonucleotides ................................................................................................... 20
Table 2-5 : Primers .................................................................................................................. 20
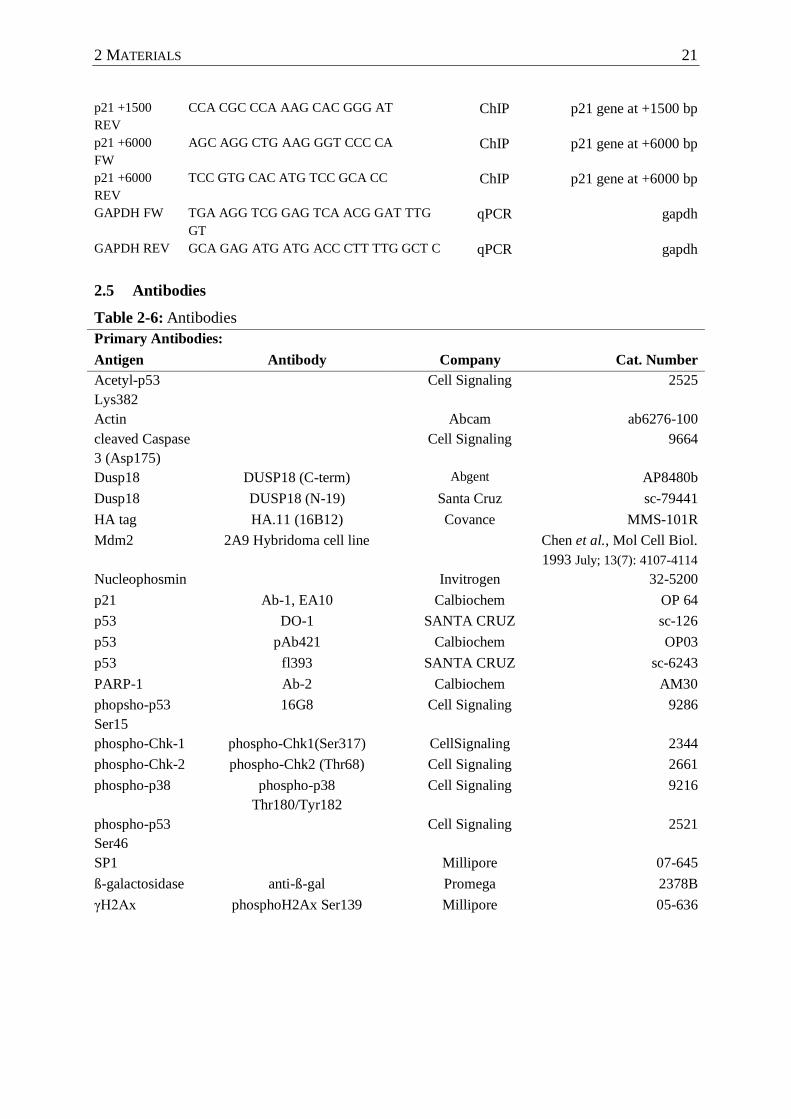
Table 2-6 : Antibodies ............................................................................................................. 21
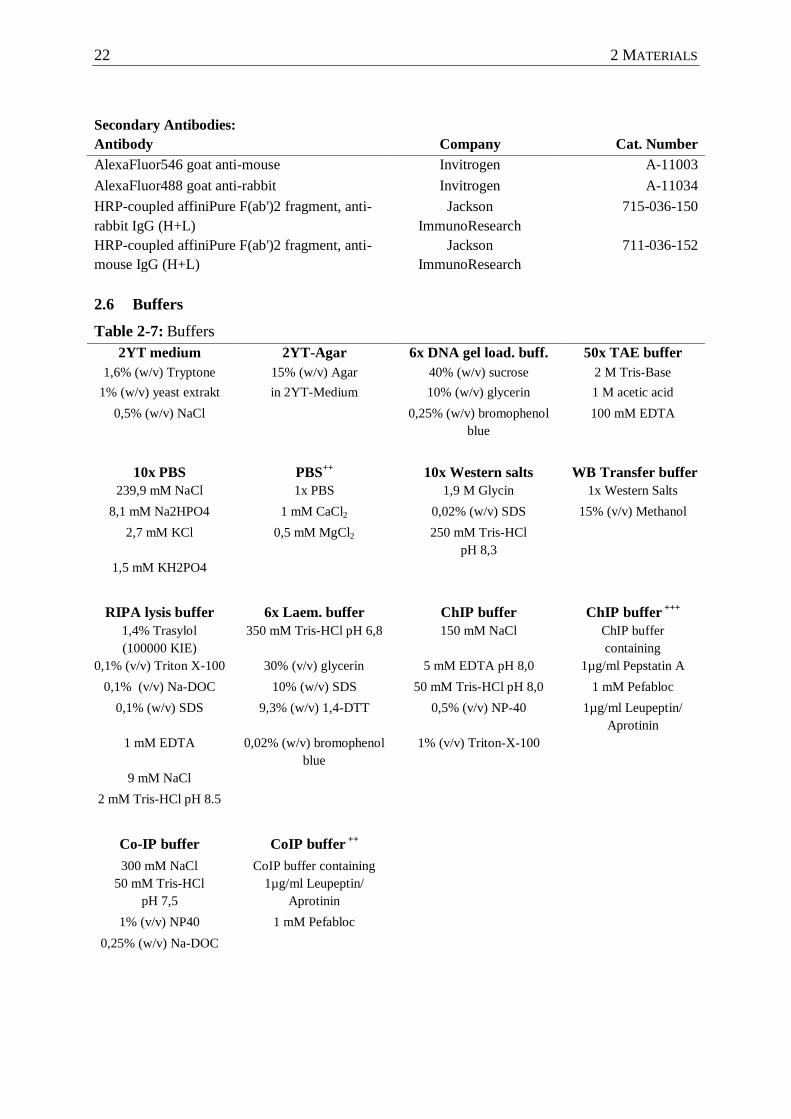
Table 2-7 : Buffers .................................................................................................................. 22
Table 2-8 : Consumables ......................................................................................................... 23
Table 2-9 : Electronic equipment ............................................................................................ 23
Table 2-10: Electronic equipment ............................................................................................ 24
Table 3-1 : Cell lines ............................................................................................................... 25
Table 3-2 : Transfection of cells with DNA ............................................................................ 26
Table 3-3 : Transfection of cells with siRNAs ........................................................................ 27
Table 3-4 : Reaction setup for the PCR amplification of Dusp18........................................... 28
Table 3-5 : Cycling conditions for the PCR amplification of Dusp18 I ................................. 29
Table 3-6 : Setup of the restriction digestion reaction of the Dusp18 PCR product I............. 29
Table 3-7 : Setup of the restriction digestion reaction of the pCGN-HA-E1B plasmid ......... 29
Table 3-8 : Setup of the ligation reaction of Dusp18 in pCGN ............................................... 30
Table 3-9 : Setup of the colony PCR ....................................................................................... 30
Table 3-10: Setup of the sequencing PCR ............................................................................... 31
Table 3-11: Reaction setup for the PCR amplification of Dusp18 II ....................................... 31
Table 3-12: Setup of the restriction digestion reaction for the cloning of Dusp18 in pIRES .. 31
Table 3-13: Setup of the ligation reaction of Dusp18 in pIRES .............................................. 32
Table 3-14: Reaction setup for cDNA synthesis from total RNA part I .................................. 32
Table 3-15: Reaction setup for cDNA synthesis from total RNA part II ................................. 33
Table 3-16: Preparation of home-made 10x PCR mix ............................................................. 33
Table 3-17: Preparation of home-made qPCR Mastermix ....................................................... 33
Table 3-18: Preparation of the final primer-specific qPCR mastermix.................................... 34
Table 3-19: SDS-polyacrylamide gel preparation for protein electrophoresis......................... 35
ix
ABBREVIATIONS
Ac- Acetyl-
APS Ammonium persulfate
ARF Alternative Reading Frame
ARF-BP1 ARF- binding protein 1
ATM Ataxia Telangiectasia Mutated
ATR Ataxia Telangiectasia and Rad3 related
BAK Bcl-2 homologous Antagonist Killer
BAX Bcl-2-Associated X protein
BRCA Breast cancer
BSA Bovine Serum Albumin
buff. buffer
CDC Cell Division Cycle
Cdk Cyclin-dependent kinase
CDKN1A Cdk inhibitor 1A
cDNA complementary DNA
CDS Coding Sequence
ChIP Chromatin Immunoprecipitation
Chk Checkpoint kinase
CIP Ciprobay
CK Casein Kinase
CMV Cytomegalovirus
CoIP Co-Immunoprecipitation
COP-1 Constitutive Photomorphogenic 1
DBD DNA binding domain
DMEM Dulbecco's Modified Eagle Medium
DMSO Dimethyl sulfoxide
DNA Deoxyribonucleic acid
DNA-PK DNA-dependent protein kinase
dNTPs deoxyribonucleotides
DOC Deoxycholate
DTT Dithiothreitol
Dusp Dual specificity phosphatase
E2F1 E2 transcription factor 1
EDTA Ethylene-Diamine-Tetra-Acetate
ERK Extracellular signal-Regulated Kinase
x
FCS Fetal Calf Serum
FOXO Forkhead box, sub-group O
FW Forward
G1 Gap phase 1
G2 Gap phase 2
GSK3ß Glycogen Synthase Kinase 3ß
H2Ax Histone 2Ax
HA Hemagglutinin
HIPK Homeodomain Interacting Protein Kinase
HP1 Heterochromatin Protein 1
HZF Hematopoietic Zinc Finger protein
IF Immunofluorescence
IP Immunoprecipitation
JNK c-Jun N-terminal kinase
KIM Kinase Interaction Motif
KLF Krüppel-like Factor
LMWDSP Low Molecular Weight Dual Specificity Phosphatase
load. loading
M Mitosis phase
MAPK Mitogen Activated Protein Kinase
MDC Mediator of DNA damage Checkpoint protein 1
MDM2 Mouse double minute 2
MKP MAP Kinase Phosphatase
MRN MRE11-Rad50-NBS1
NEB New England Biolabs
NLS Nuclear Localization Signal
NPM Nucleophosmin
p- phospho-
P/S Penicillin/Streptomycin
p21 protein 21 kDa
p38 protein 38 kDa
p53 protein 53 kDa
PARP Poly ADP Ribose Polymerase
PBS Phosphate Buffer Saline
PBST PBS-Tween20
PCAF P300/CBP-Associated Factor
PCNA Proliferating Cell Nuclear Antigen

xi
PCR Polymerase Chain Reaction
PEG Polyethylene Glucol
PI Propidium Iodine
PI3K Phosphatidylinositol 3 Kinase
PIG3 P53 inducible gene 3
PIN Peptidylprolyl cis/trans Isomerase, NIMA-interacting 1
PIRH2 P53-Induced RING-H2 protein
PLK Polo-like Kinase
PP Protein Phosphatase
PPM1D Protein Phosphatase 1D Magnesium-dependent
PTEN Phosphatase and Tensin homologue deleted on chromosome 10
PUMA P53 Upregulated Modulator of Apoptosis
PVDF Polyvinylidene Fluoride
qPCR quantitative PCR
REG Regulatory domain
REV Reverse
RING Really Interesting New Gene
RNA Ribonucleic acid
RNA pol II RNA polymerase II
RPA Replication Protein A
RT Room Temperature
S Synthesis phase
SAPK Stress Activated Protein Kinase
SDS Sodium Dodecyl Sulfate
SDS-PAGE SDS-Polyacrylamide Gel Electrophoresis
siRNA small interfering RNA
SMC Structural Maintenance of Chromosomes
SP1 Specific Protein 1
SYBR Synergy Brands, Inc.
TA Transcriptional Activation domain
TAE Tris-Acetate-EDTA
TBS Tris Buffer Saline
TBST TBS-Tween20
TEMED Tetramethylethylenediamine
Tet Tetracycline
TET Tetramerization domain
TUNEL Terminal deoxynucleotidyl transferase dUTP Nick End Labeling

xii
WAF1 wild-type p53-Activated Fragment 1
WB Western Blot
WIP Wild-type p53-Inducible Phosphatase
XPC Xeroderma Pigmentosum C
YT Yeast extract-Tryptone
Note: genes names are mentioned in italics; protein names start with a capital letter.
1 INTRODUCTION 1
1 INTRODUCTION
1.1 The p53 network
1.1.1 The tumor suppressor p53
P53 is a tumor suppressor that has rightly been named the “guardian of the genome”
(Lane, 1992). It is mutated in more than 50% of all human cancers, and its function is
indirectly impaired in most of the remaining cases (Hainaut and Hollstein, 2000; Vogelstein et
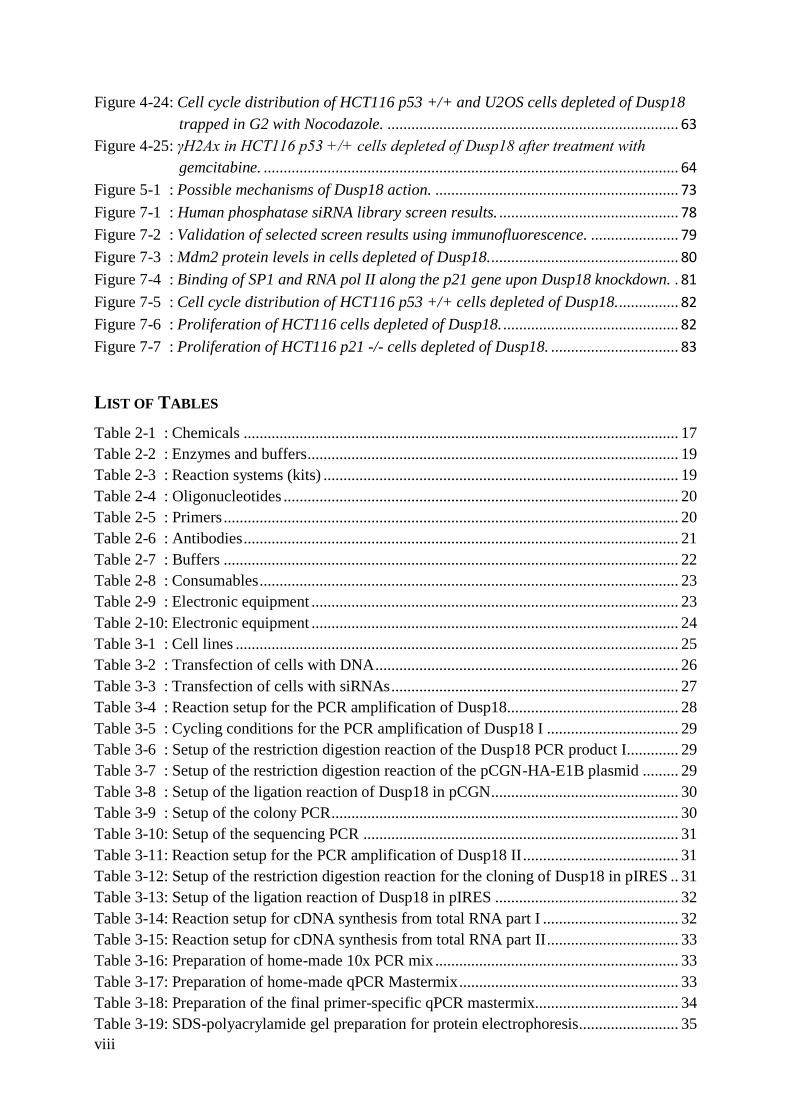
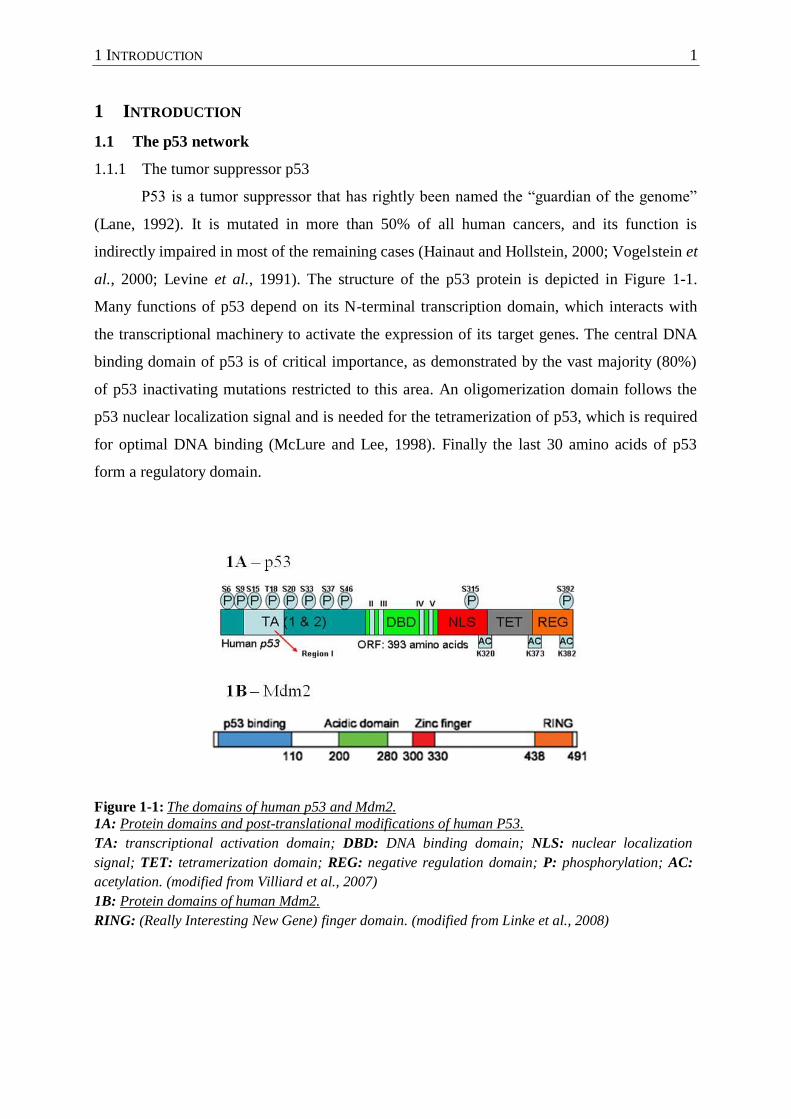
al., 2000; Levine et al., 1991). The structure of the p53 protein is depicted in Figure 1-1.
Many functions of p53 depend on its N-terminal transcription domain, which interacts with
the transcriptional machinery to activate the expression of its target genes. The central DNA
binding domain of p53 is of critical importance, as demonstrated by the vast majority (80%)
of p53 inactivating mutations restricted to this area. An oligomerization domain follows the
p53 nuclear localization signal and is needed for the tetramerization of p53, which is required
for optimal DNA binding (McLure and Lee, 1998). Finally the last 30 amino acids of p53
form a regulatory domain.
Figure 1-1: The domains of human p53 and Mdm2.
1A: Protein domains and post-translational modifications of human P53.
TA: transcriptional activation domain; DBD: DNA binding domain; NLS: nuclear localization
signal; TET: tetramerization domain; REG: negative regulation domain; P: phosphorylation; AC:
acetylation. (modified from Villiard et al., 2007)
1B: Protein domains of human Mdm2.
RING: (Really Interesting New Gene) finger domain. (modified from Linke et al., 2008)
2 1 INTRODUCTION
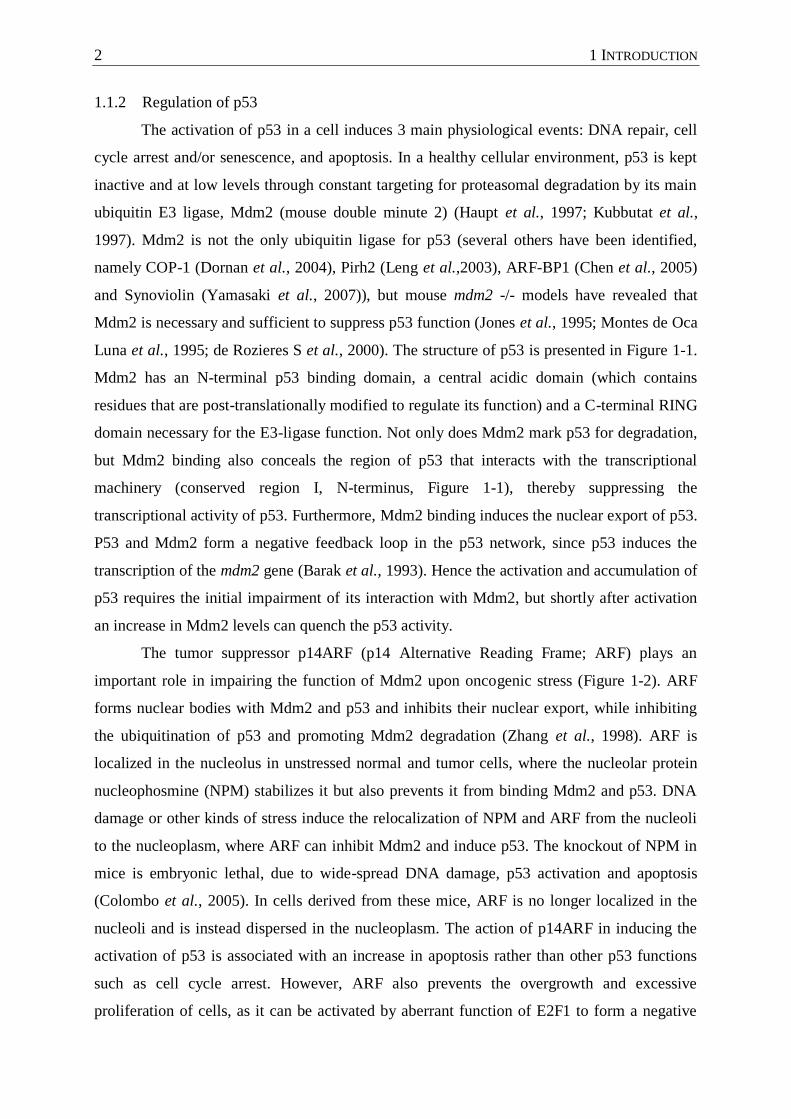
1.1.2 Regulation of p53
The activation of p53 in a cell induces 3 main physiological events: DNA repair, cell
cycle arrest and/or senescence, and apoptosis. In a healthy cellular environment, p53 is kept
inactive and at low levels through constant targeting for proteasomal degradation by its main
ubiquitin E3 ligase, Mdm2 (mouse double minute 2) (Haupt et al., 1997; Kubbutat et al.,
1997). Mdm2 is not the only ubiquitin ligase for p53 (several others have been identified,
namely COP-1 (Dornan et al., 2004), Pirh2 (Leng et al.,2003), ARF-BP1 (Chen et al., 2005)
and Synoviolin (Yamasaki et al., 2007)), but mouse mdm2 -/- models have revealed that
Mdm2 is necessary and sufficient to suppress p53 function (Jones et al., 1995; Montes de Oca
Luna et al., 1995; de Rozieres S et al., 2000). The structure of p53 is presented in Figure 1-1.
Mdm2 has an N-terminal p53 binding domain, a central acidic domain (which contains
residues that are post-translationally modified to regulate its function) and a C-terminal RING
domain necessary for the E3-ligase function. Not only does Mdm2 mark p53 for degradation,
but Mdm2 binding also conceals the region of p53 that interacts with the transcriptional
machinery (conserved region I, N-terminus, Figure 1-1), thereby suppressing the
transcriptional activity of p53. Furthermore, Mdm2 binding induces the nuclear export of p53.
P53 and Mdm2 form a negative feedback loop in the p53 network, since p53 induces the
transcription of the mdm2 gene (Barak et al., 1993). Hence the activation and accumulation of
p53 requires the initial impairment of its interaction with Mdm2, but shortly after activation
an increase in Mdm2 levels can quench the p53 activity.
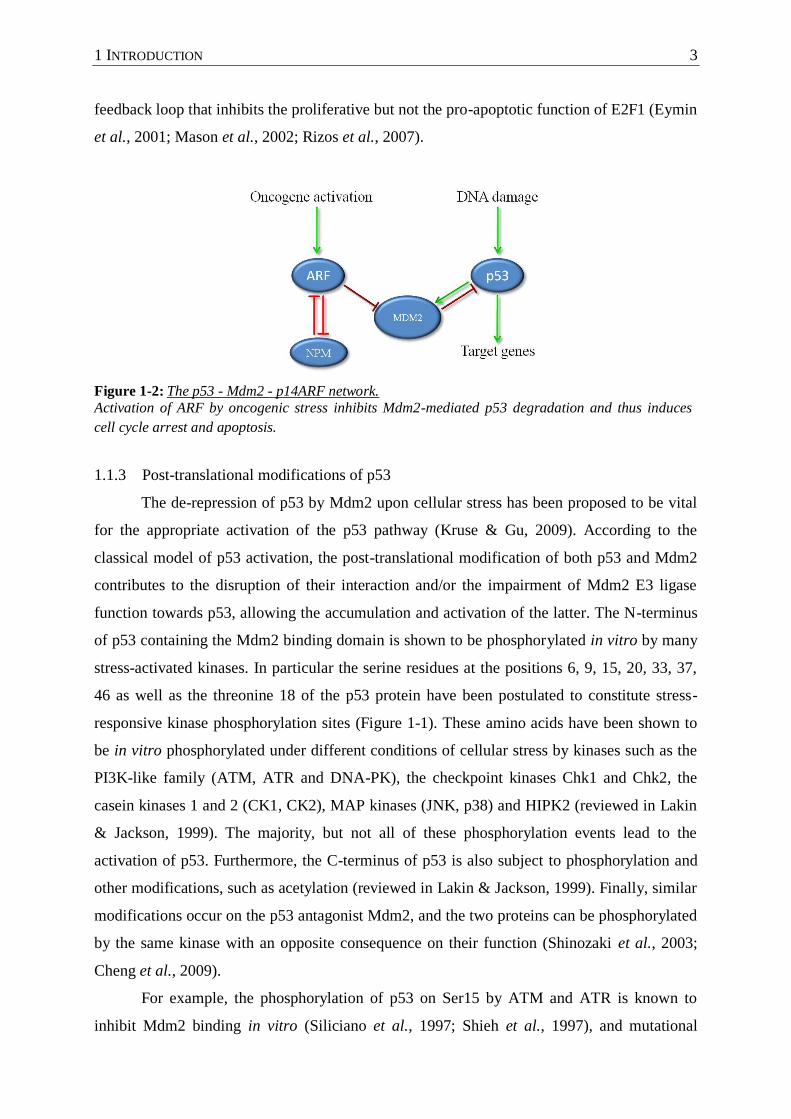
The tumor suppressor p14ARF (p14 Alternative Reading Frame; ARF) plays an
important role in impairing the function of Mdm2 upon oncogenic stress (Figure 1-2). ARF
forms nuclear bodies with Mdm2 and p53 and inhibits their nuclear export, while inhibiting
the ubiquitination of p53 and promoting Mdm2 degradation (Zhang et al., 1998). ARF is
localized in the nucleolus in unstressed normal and tumor cells, where the nucleolar protein
nucleophosmine (NPM) stabilizes it but also prevents it from binding Mdm2 and p53. DNA
damage or other kinds of stress induce the relocalization of NPM and ARF from the nucleoli
to the nucleoplasm, where ARF can inhibit Mdm2 and induce p53. The knockout of NPM in
mice is embryonic lethal, due to wide-spread DNA damage, p53 activation and apoptosis
(Colombo et al., 2005). In cells derived from these mice, ARF is no longer localized in the
nucleoli and is instead dispersed in the nucleoplasm. The action of p14ARF in inducing the
activation of p53 is associated with an increase in apoptosis rather than other p53 functions
such as cell cycle arrest. However, ARF also prevents the overgrowth and excessive
proliferation of cells, as it can be activated by aberrant function of E2F1 to form a negative
1 INTRODUCTION 3
feedback loop that inhibits the proliferative but not the pro-apoptotic function of E2F1 (Eymin
et al., 2001; Mason et al., 2002; Rizos et al., 2007).
Figure 1-2: The p53 - Mdm2 - p14ARF network.
Activation of ARF by oncogenic stress inhibits Mdm2-mediated p53 degradation and thus induces
cell cycle arrest and apoptosis.
1.1.3 Post-translational modifications of p53
The de-repression of p53 by Mdm2 upon cellular stress has been proposed to be vital
for the appropriate activation of the p53 pathway (Kruse & Gu, 2009). According to the
classical model of p53 activation, the post-translational modification of both p53 and Mdm2
contributes to the disruption of their interaction and/or the impairment of Mdm2 E3 ligase
function towards p53, allowing the accumulation and activation of the latter. The N-terminus
of p53 containing the Mdm2 binding domain is shown to be phosphorylated in vitro by many
stress-activated kinases. In particular the serine residues at the positions 6, 9, 15, 20, 33, 37,
46 as well as the threonine 18 of the p53 protein have been postulated to constitute stress-
responsive kinase phosphorylation sites (Figure 1-1). These amino acids have been shown to
be in vitro phosphorylated under different conditions of cellular stress by kinases such as the
PI3K-like family (ATM, ATR and DNA-PK), the checkpoint kinases Chk1 and Chk2, the
casein kinases 1 and 2 (CK1, CK2), MAP kinases (JNK, p38) and HIPK2 (reviewed in Lakin
& Jackson, 1999). The majority, but not all of these phosphorylation events lead to the
activation of p53. Furthermore, the C-terminus of p53 is also subject to phosphorylation and
other modifications, such as acetylation (reviewed in Lakin & Jackson, 1999). Finally, similar
modifications occur on the p53 antagonist Mdm2, and the two proteins can be phosphorylated
by the same kinase with an opposite consequence on their function (Shinozaki et al., 2003;
Cheng et al., 2009).
For example, the phosphorylation of p53 on Ser15 by ATM and ATR is known to
inhibit Mdm2 binding in vitro (Siliciano et al., 1997; Shieh et al., 1997), and mutational
4 1 INTRODUCTION
studies by Ashcroft et al. have demonstrated that this is a major phosphorylation site in cells
(Ashcroft et al., 1999). The same authors and others have shown that individual
phosphorylations are not sufficient for inhibiting the p53-Mdm2 interaction, nor are they
necessary for the induction and transcriptional activity of p53 (Ashcroft et al., 1999; Blattner
et al., 1999). Nevertheless, some combinations of these modifications have been associated
with a more stable p53 polypeptide, particularly the combinatory phosphorylation of serines
15 and 37 (Ashcroft et al., 1999). Furthermore, the phosphorylation of p53 can increase its
affinity for other activating factors (such as acetyl-transferases) and hence induce its
modification on other sites of the protein, for instance its acetylation at the C-terminus of p53.
This region of p53 exerts an inhibitory role on the sequence-specific DNA binding of p53, as
shown by deletion experiments of the last 30 amino acids of p53, as well as by the induction
of DNA binding by the monoclonal antibody pAb421 (which binds at the C-terminal region
of p53) (Kaku et al., 2001; Sakaguchi et al., 1998). The acetylation of p53 in this domain is
believed to relieve this inhibition and increase the affinity of p53 for its DNA target sequence.
More specifically, the histone acetyl-transferases p300 and PCAF acetylate p53 at the lysines
382 (p53 C-terminal inhibitory domain) and 320 (nuclear localization signal) respectively,
enhancing the sequence specific binding of p53 to the chromatin. These C-terminal
acetylation events depend on the phosphorylation of the N-terminus of p53 (Lambert et al.,
1998; Sakaguchi et al., 1998; Chao et al., 2003). Importantly, the acetylation of p53 at Lys382
by p300 has been shown to inhibit its ubiquitination by Mdm2 (Li et al., 2002).
1.1.4 Functions of p53
When the p53 protein is no longer efficiently targeted by Mdm2 for destruction, it
accumulates in the nucleus and together with transcriptional co-factors can activate its target
genes. Except for inhibiting the Mdm2 binding, post-translational modifications on p53
modulate its interaction with specific promoters, influencing the selectivity of its
transcriptional activity. For instance, the phosphorylation of p53 Ser46 has been associated
with the induction of proapoptotic target genes such as puma and noxa, and not proarresting
genes like p21 (Feng et al., 2006). In addition, different transcriptional cofactors can direct
the p53 transactivation of genes that induce either apoptosis or cell cycle arrest, thus deciding
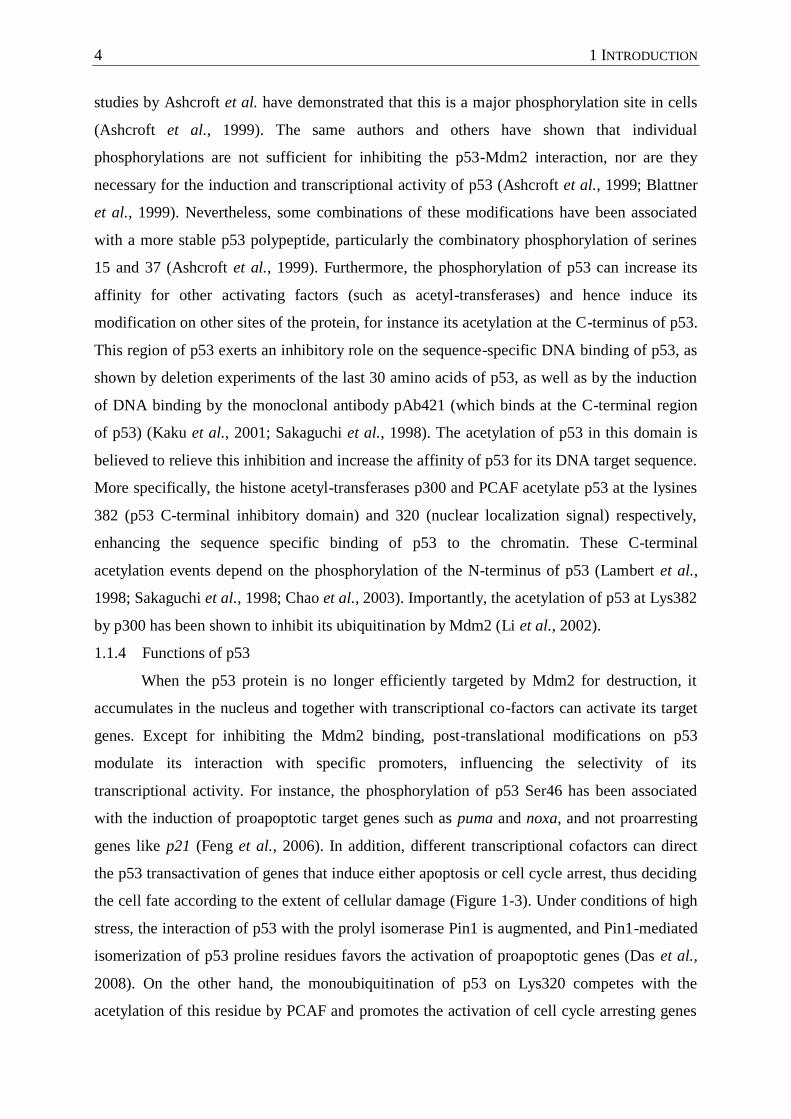
the cell fate according to the extent of cellular damage (Figure 1-3). Under conditions of high
stress, the interaction of p53 with the prolyl isomerase Pin1 is augmented, and Pin1-mediated
isomerization of p53 proline residues favors the activation of proapoptotic genes (Das et al.,
2008). On the other hand, the monoubiquitination of p53 on Lys320 competes with the
acetylation of this residue by PCAF and promotes the activation of cell cycle arresting genes
1 INTRODUCTION 5
(Jentsch et al., 2009). The association of p53 with the hematopoietic zink finger protein (Hzf)
also facilitates the survival of cells versus apoptosis (Das et al., 2008).
Figure 1-3: Some promoter selection mechanisms for differential activation of p53 target genes.
The diverse modifications on p53 and its binding to different co-activators direct the specificity of
target gene expression (from Das et al., 2008).
Damaged DNA also constitutes a major signal for the activation of p53 by
phosphorylation and acetylation following the induction of the DNA damage response
cascade. The transcriptional targets of p53 thereafter accumulate to mediate cell cycle arrest
or apoptosis. The cyclin-dependent kinase inhibitor p21 (also known as WAF1, CDKN1A and
CIP1) is a principle p53 target gene. P21 binds and inhibits cyclins and cyclin-dependent
kinases, thus inducing cell cycle arrest (Harper et al., 1993), and can also impair the function
of PCNA, thereby hindering the synthesis of DNA (Bendjennat et al., 2003). Other factors
have been implicated in the p53-dependent and/or p53-independent induction of the p21 gene,
like components of the mediator of transcription complex (Donner et al., 2007), transcription
factors of the KLF family, such as KLF4 (Yoon et al., 2003), the ubiquitous transcription
factor SP1 (Moustakas & Kardassis, 1998), and histone modifying proteins such as HDACs
(Gui et al., 2004). Interestingly, the transcriptional activity of some can also be regulated in
response to DNA damage. Upon genotoxic stress and ATM activation, SP1 phosphorylation
at Ser101 is greatly increased, promoting its binding to the chromatin (reviewed in Tan &
Khachigian, 2009). In addition to p21, SP1 also collaborates with p53 in activating the
transcription of the proapoptotic genes puma and bak (Koutsodontis & Kardassis, 2004). As
previously discussed, in highly stressed cells or cells with irreparable DNA damage the
transcriptional activity of p53 induces the expression of proapoptotic genes (a few examples
6 1 INTRODUCTION
are puma, noxa, bax, bak and pig3). Apart from that, p53 plays a direct role in promoting the
intrinsic apoptotic pathway by localizing to the mitochondria and inducing the
permeabilization of their outer membrane (Moll et al., 2005).
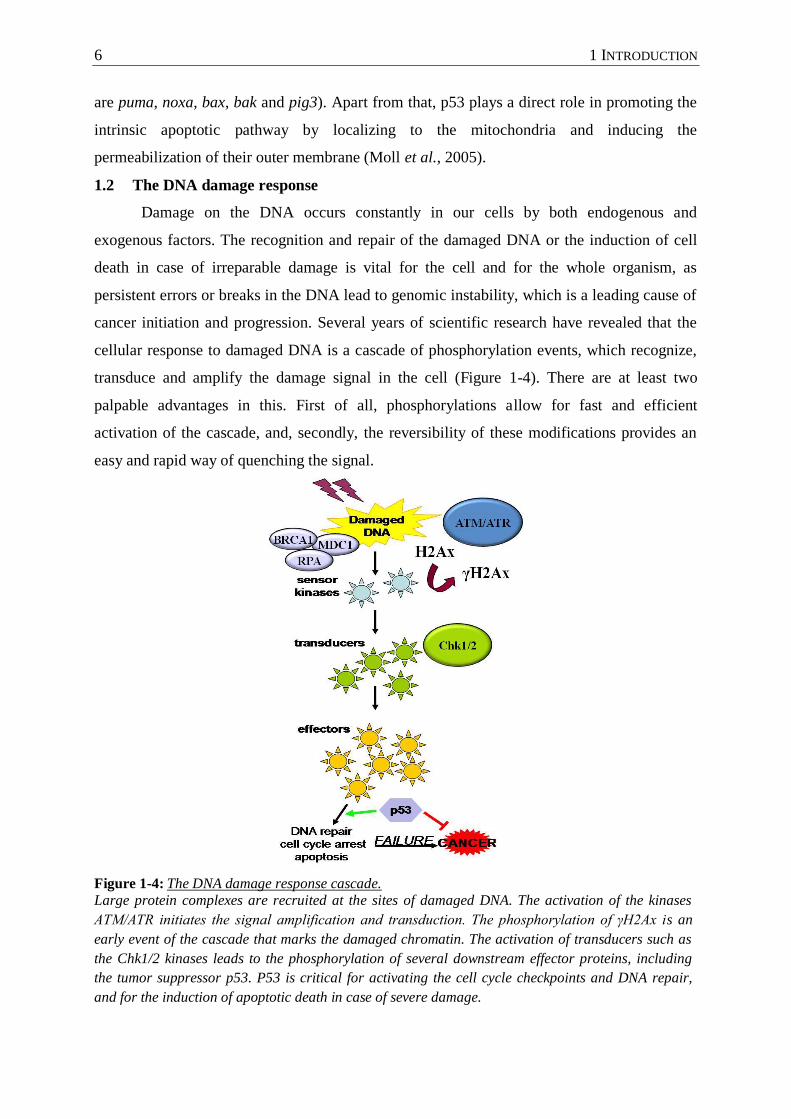
1.2 The DNA damage response
Damage on the DNA occurs constantly in our cells by both endogenous and
exogenous factors. The recognition and repair of the damaged DNA or the induction of cell
death in case of irreparable damage is vital for the cell and for the whole organism, as
persistent errors or breaks in the DNA lead to genomic instability, which is a leading cause of
cancer initiation and progression. Several years of scientific research have revealed that the
cellular response to damaged DNA is a cascade of phosphorylation events, which recognize,
transduce and amplify the damage signal in the cell (Figure 1-4). There are at least two
palpable advantages in this. First of all, phosphorylations allow for fast and efficient
activation of the cascade, and, secondly, the reversibility of these modifications provides an
easy and rapid way of quenching the signal.
Figure 1-4: The DNA damage response cascade.
Large protein complexes are recruited at the sites of damaged DNA. The activation of the kinases
ATM/ATR initiates the signal amplification and transduction. The phosphorylation of γH2Ax is an
early event of the cascade that marks the damaged chromatin. The activation of transducers such as
the Chk1/2 kinases leads to the phosphorylation of several downstream effector proteins, including
the tumor suppressor p53. P53 is critical for activating the cell cycle checkpoints and DNA repair,
and for the induction of apoptotic death in case of severe damage.
1 INTRODUCTION 7
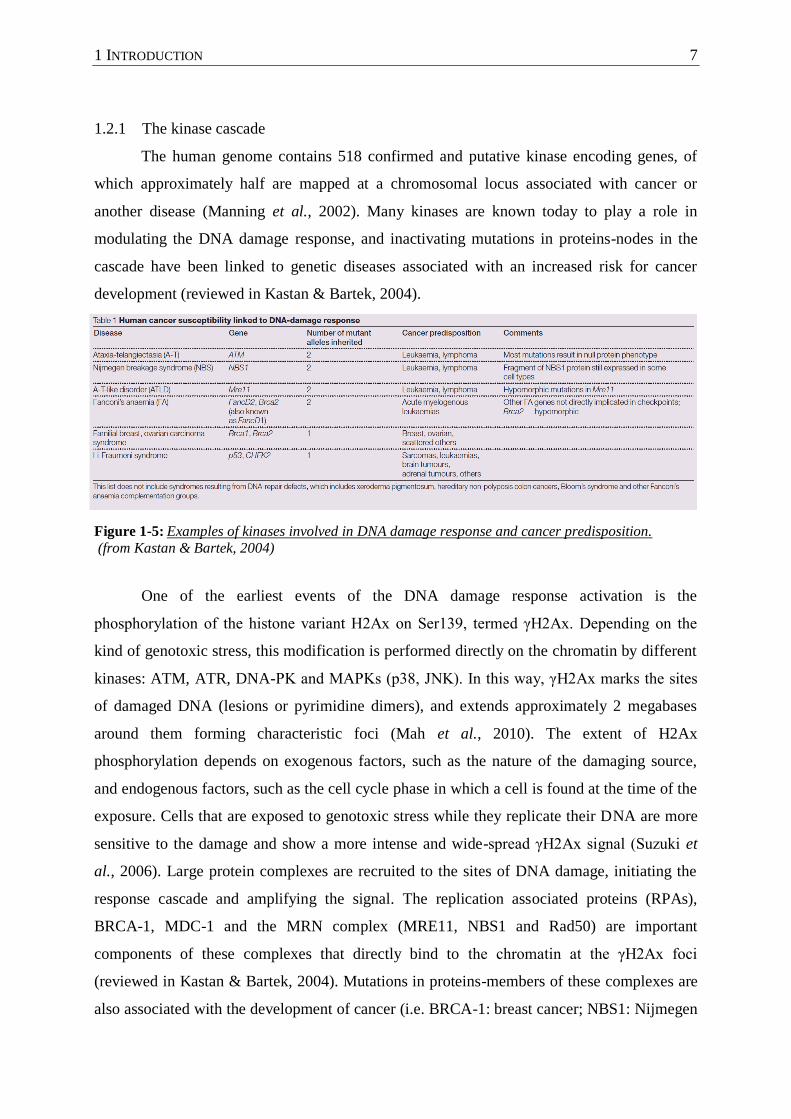
1.2.1 The kinase cascade
The human genome contains 518 confirmed and putative kinase encoding genes, of
which approximately half are mapped at a chromosomal locus associated with cancer or
another disease (Manning et al., 2002). Many kinases are known today to play a role in
modulating the DNA damage response, and inactivating mutations in proteins-nodes in the
cascade have been linked to genetic diseases associated with an increased risk for cancer
development (reviewed in Kastan & Bartek, 2004).
Figure 1-5: Examples of kinases involved in DNA damage response and cancer predisposition.
(from Kastan & Bartek, 2004)
One of the earliest events of the DNA damage response activation is the
phosphorylation of the histone variant H2Ax on Ser139, termed γH2Ax. Depending on the
kind of genotoxic stress, this modification is performed directly on the chromatin by different
kinases: ATM, ATR, DNA-PK and MAPKs (p38, JNK). In this way, γH2Ax marks the sites
of damaged DNA (lesions or pyrimidine dimers), and extends approximately 2 megabases
around them forming characteristic foci (Mah et al., 2010). The extent of H2Ax
phosphorylation depends on exogenous factors, such as the nature of the damaging source,
and endogenous factors, such as the cell cycle phase in which a cell is found at the time of the
exposure. Cells that are exposed to genotoxic stress while they replicate their DNA are more
sensitive to the damage and show a more intense and wide-spread γH2Ax signal (Suzuki et
al., 2006). Large protein complexes are recruited to the sites of DNA damage, initiating the
response cascade and amplifying the signal. The replication associated proteins (RPAs),
BRCA-1, MDC-1 and the MRN complex (MRE11, NBS1 and Rad50) are important
components of these complexes that directly bind to the chromatin at the γH2Ax foci
(reviewed in Kastan & Bartek, 2004). Mutations in proteins-members of these complexes are
also associated with the development of cancer (i.e. BRCA-1: breast cancer; NBS1: Nijmegen
8 1 INTRODUCTION
breakage syndrome, Figure 1-5). As these complexes remain on the chromosomal damage
sites, other kinases play the role of transducing the signal from the foci to the nucleoplasm.
The checkpoint kinases Chk-1 and Chk-2 are activated by ATM/ATR-dependent
phosphorylation and diffuse from the γH2Ax foci to transduce the damage signal. Chk1 and
Chk2 play a prominent role in the arrest of the cell cycle, to facilitate the repair of damaged
DNA or to remove cells with impaired chromosomes from the proliferating cell population.
Both Chk kinases phosphorylate and thereby target for degradation the phosphatase CDC25,
which is needed for mitotic onset (reviewed in Kastan & Bartek, 2004). In addition, Chk1
inhibits the polo-like kinase 1 (plk1), which also regulates the entry and progression of
mitosis (Lee et al., 2010). The activation of the tumor suppressor p53 as one of the final steps
of the DNA damage response cascade is important for efficient cell cycle arrest and the
induction of apoptosis in severely damaged cells. Notably, all the phosphorylation events
occur in many different directions, and feedback loops are also formed, especially in the early
events of the DNA damage response on the chromatin. Thus the response cascade does not
form a pathway, but rather a network of kinases, where each connection can be also a
regulation point by phosphatases.
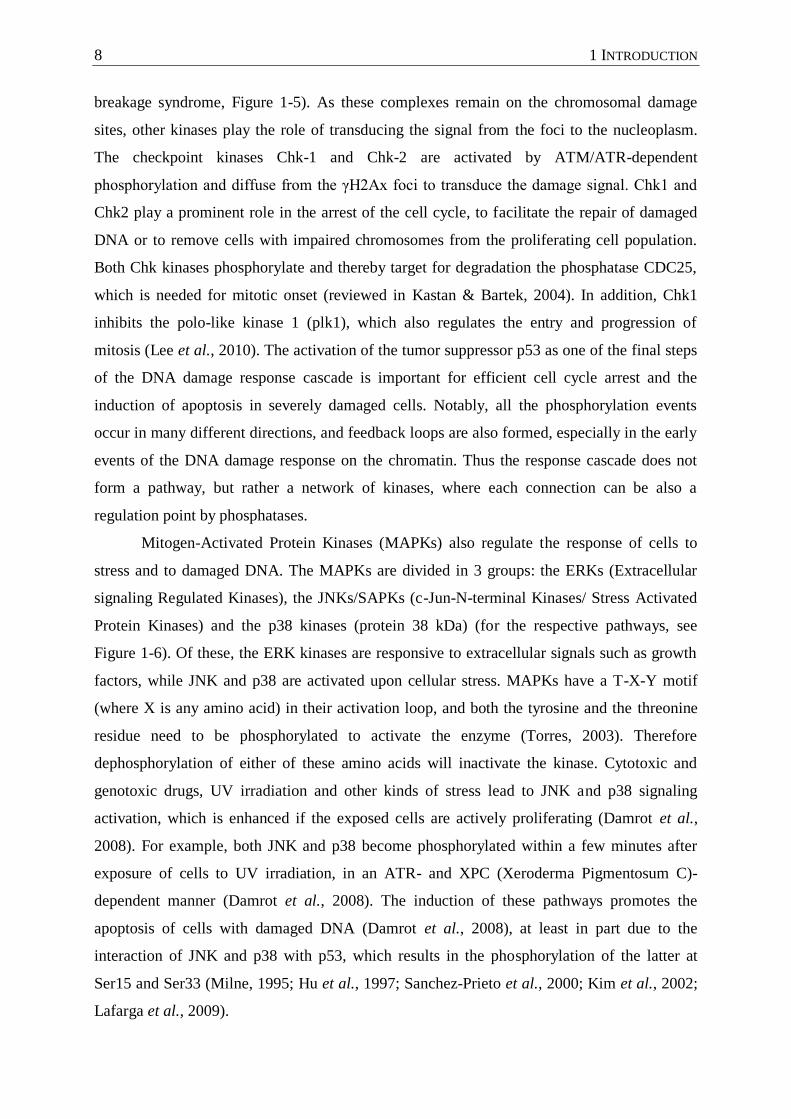
Mitogen-Activated Protein Kinases (MAPKs) also regulate the response of cells to
stress and to damaged DNA. The MAPKs are divided in 3 groups: the ERKs (Extracellular
signaling Regulated Kinases), the JNKs/SAPKs (c-Jun-N-terminal Kinases/ Stress Activated
Protein Kinases) and the p38 kinases (protein 38 kDa) (for the respective pathways, see
Figure 1-6). Of these, the ERK kinases are responsive to extracellular signals such as growth
factors, while JNK and p38 are activated upon cellular stress. MAPKs have a T-X-Y motif
(where X is any amino acid) in their activation loop, and both the tyrosine and the threonine
residue need to be phosphorylated to activate the enzyme (Torres, 2003). Therefore
dephosphorylation of either of these amino acids will inactivate the kinase. Cytotoxic and
genotoxic drugs, UV irradiation and other kinds of stress lead to JNK and p38 signaling
activation, which is enhanced if the exposed cells are actively proliferating (Damrot et al.,
2008). For example, both JNK and p38 become phosphorylated within a few minutes after
exposure of cells to UV irradiation, in an ATR- and XPC (Xeroderma Pigmentosum C)-
dependent manner (Damrot et al., 2008). The induction of these pathways promotes the
apoptosis of cells with damaged DNA (Damrot et al., 2008), at least in part due to the
interaction of JNK and p38 with p53, which results in the phosphorylation of the latter at
Ser15 and Ser33 (Milne, 1995; Hu et al., 1997; Sanchez-Prieto et al., 2000; Kim et al., 2002;
Lafarga et al., 2009).
1 INTRODUCTION 9
Figure 1-6: A simplified view of the MAP kinase signaling pathways.
A MAPK pathway consists of a MAPK-kinase-kinase (MAPKKK), a MAPK-kinase (MAPKK) and a
MAP kinase (MAPK). Each kinase phosphorylates its downstream kinase- target to activate it. The 3
branches are the ERK, the JNK and the p38 MAPK pathways.
1.2.2 The cell cycle checkpoints
The cellular growth and division requires many different mechanisms and pathways in
the cell working together in a well-coordinated orchestra. The proper and error-free
completion of certain processes, such as genomic replication and mitosis, before progressing
to the next phase of the cell cycle, is necessary to ensure the viability of the cell and
maintenance of genomic stability in the daughter cells. Upon genotoxic stress, it is vital for
the cell to slow down or even stop the progression of the cell cycle, to acquire the time to
correct the damage or permanently arrest a potentially harmful and unstable proliferation.
Several checkpoints that can be activated at different phases of the cell cycle provide the
mechanisms the cell needs to monitor and control the cell cycle progression.
In the beginning of the cell cycle, the G1 or G1 to S phase checkpoint can be activated
by the action of ATM/ATR and subsequent induction of the Chk1 and Chk2 kinases, as well
as the p53 pathway. The ATR-Chk1 branch has been suggested to play a permanent safeguard
role in the G1 to S transition, by controlling the protein levels of CDC25A. CDC25A is a key
phosphatase of the cell cycle whose action is needed to start DNA replication. ATR/Chk1
constantly phosphorylate a population of CDC25A and target it for degradation, and
activation of the ATR/Chk1 pathway by DNA damage provides a fast mechanism of arresting
the cell both in G1 and in S phase. This cell cycle arrest lasts only for a few hours and can be
bypassed unless the p53 pathway is additionally induced. P53 and Mdm2 phosphorylation by
10 1 INTRODUCTION
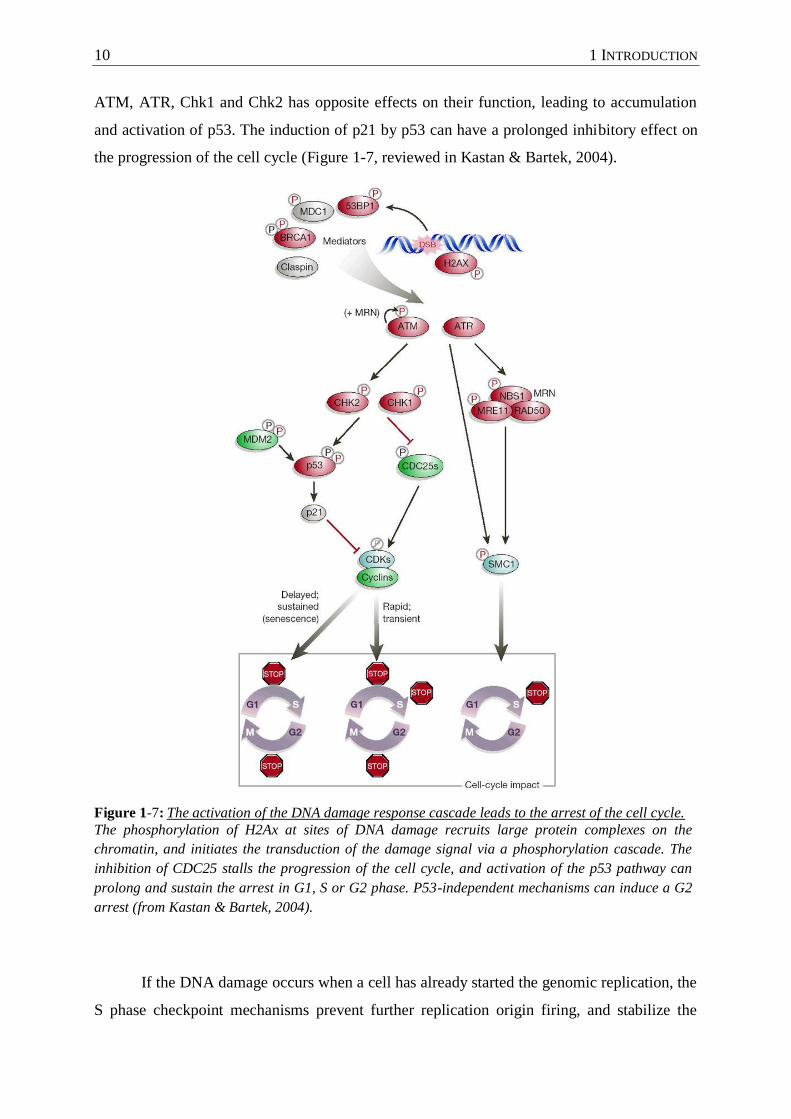
ATM, ATR, Chk1 and Chk2 has opposite effects on their function, leading to accumulation
and activation of p53. The induction of p21 by p53 can have a prolonged inhibitory effect on
the progression of the cell cycle (Figure 1-7, reviewed in Kastan & Bartek, 2004).
Figure 1-7: The activation of the DNA damage response cascade leads to the arrest of the cell cycle.
The phosphorylation of H2Ax at sites of DNA damage recruits large protein complexes on the
chromatin, and initiates the transduction of the damage signal via a phosphorylation cascade. The
inhibition of CDC25 stalls the progression of the cell cycle, and activation of the p53 pathway can
prolong and sustain the arrest in G1, S or G2 phase. P53-independent mechanisms can induce a G2
arrest (from Kastan & Bartek, 2004).
If the DNA damage occurs when a cell has already started the genomic replication, the
S phase checkpoint mechanisms prevent further replication origin firing, and stabilize the
1 INTRODUCTION 11
stalled replication forks to minimize the generation of DNA breaks. The ATR/Chk1/CDC25A
pathway is induced in S phase in a similar way as in the G1 to prevent replication initiation. In
addition, other mechanisms that involve the activation of ATM and subsequent
phosphorylation of NBS1 and SMC1, as well as the inhibition of Cdk2 stop the progression of
DNA replication. Another pathway involving the inhibition of Cdc7, a kinase needed for
replication initiation, through the activation of ATR also plays a role in the induction of an S
phase arrest upon DNA damage (Costanzo et al., 2003).
The final control step before a cell starts its mitotic division is the G2 or G2/M
checkpoint. The inhibition of Cdk1/cyclin B complex is the main target of different pathways
involved in arresting the cells at the borders of G2 and M phases, such as
ATM/ATR/Chk1/Chk2 pathways, p38 and p53/p21 activation, as well as the inhibition of
CDC25C or its activator plk1. Other proteins like BRCA1 and 53BP1 (53 binding protein 1)
are also involved in the induction of a G2/M arrest (Wang et al., 2002; Lou & Chen, 2003).
Interestingly, tumor cells with defective earlier checkpoints, such as cells without functional
p53, tend to arrest in G2/M upon DNA damage, indicating that p53-independent pathways are
sufficient to maintain this arrest (Kastan & Bartek, 2004).
1.3 Human phosphatases
The human proteome contains many more kinases than known phosphatases. In
addition, unlike the kinases, whose specificity is largely provided by structural differences in
their catalytic domains, phosphatases often have similar structures in their active centers.
These arguments led to the misconception that phosphatases might show a lower specificity
towards their substrates than the respective kinases, which was in many cases in agreement
with in vitro phosphatase assays data. The identification of all phosphatase encoding genes
and in vivo experiments revealed that in fact the substrate specificity is often defined by
interaction of the catalytic subunit with a variety of regulatory subunits. The regulatory
subunits can direct the interaction of the catalytic subunit with its target, affect the localization
of the phosphatase complex in specific cellular compartments or inhibit its activity. For
example, the protein phosphatase 1 (PP1) is a protein complex consisting of the catalytic
subunit PP1c and one or more of its more than 50 different regulatory subunits (Cohen, 2002).
Other phosphatases do not form complexes and other mechanisms define their targeting, such
as unique structures around their catalytic center, as is the case for many dual specificity
phosphatases. However, the function and substrate specificity of most human phosphatases is
completely unknown.
12 1 INTRODUCTION
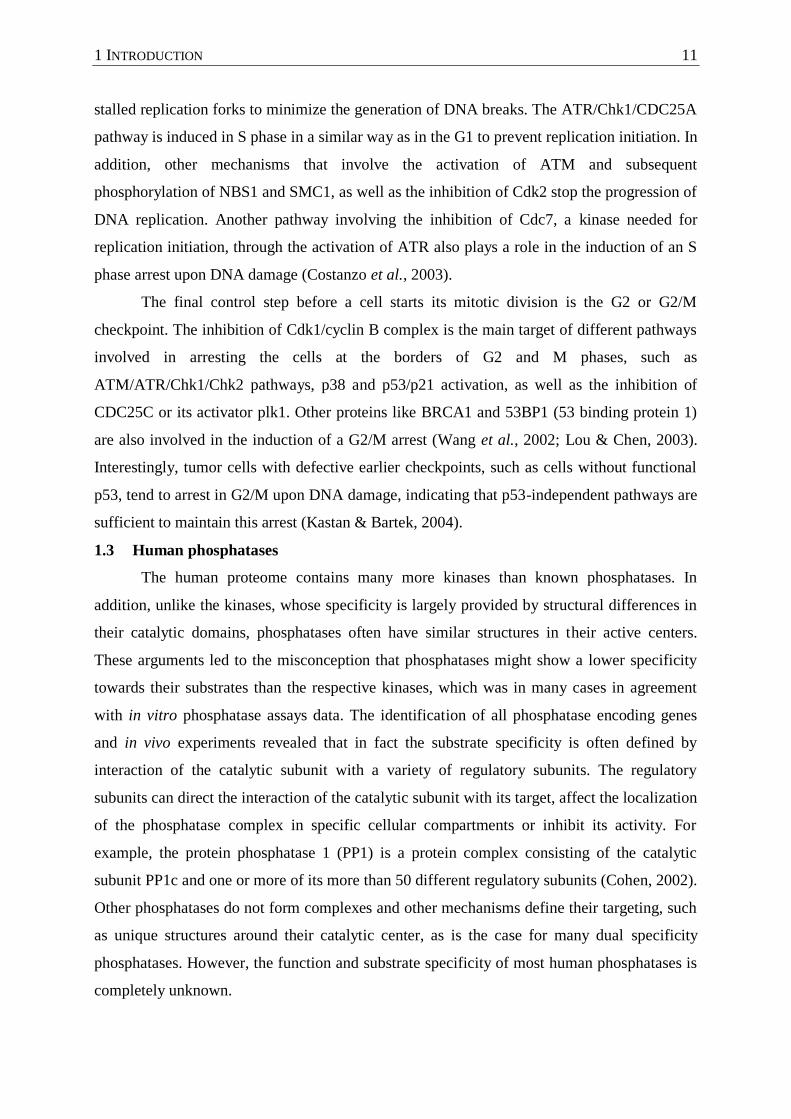
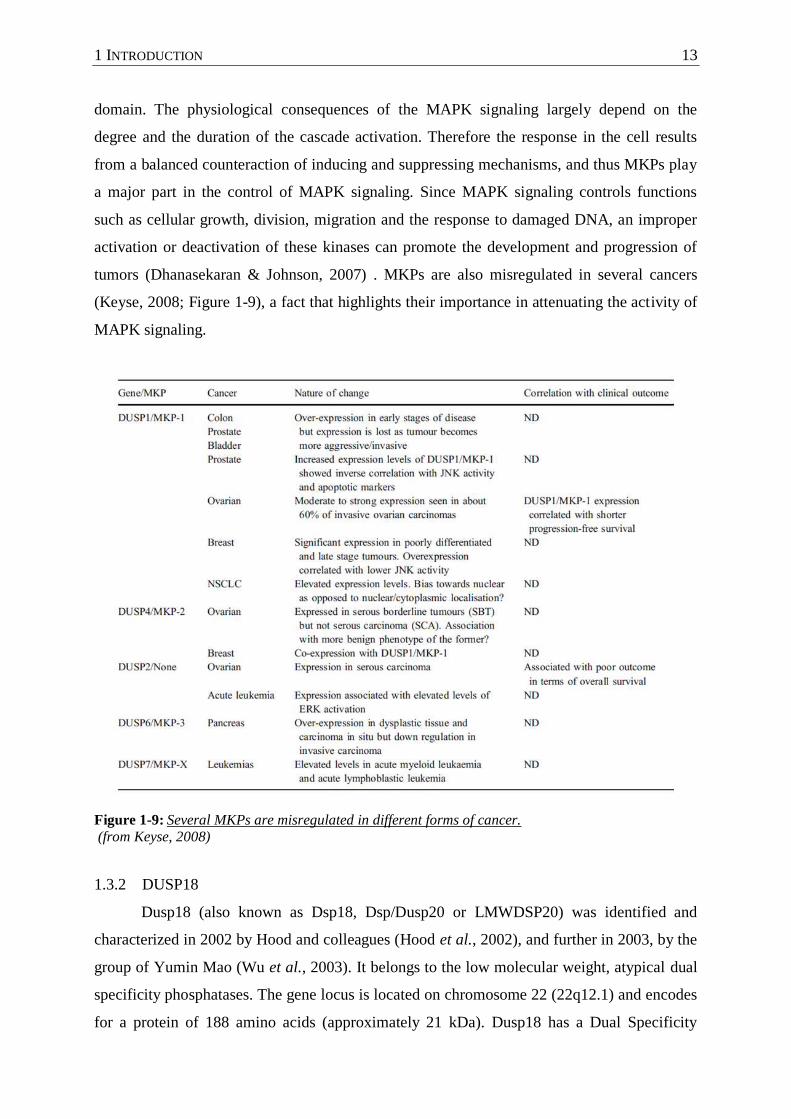
Phosphatases are grouped into families according to their mode of catalysis. The
phosphatase families are listed in Figure 1-8.
Figure 1-8: The different phosphatase families.
(from Moorhead et al., 2007)
1.3.1 Dual Specificity Phosphatases
The dual specificity phosphatases belong to the superfamily of protein tyrosine
phosphatases (PTPs), which are distinguished by their catalytic motif CX5R, where X is any
amino acid and the cysteine is the catalytic amino acid (Moorhead et al., 2007). The name
“dual specificity” originates from their ability to dephosphorylate both tyrosine and
serine/threonine residues, although most of them show a preference for one of the two amino
acids in in vitro assays. Members of the DUSP family are known to play regulatory roles in
diverse signaling pathways in the cell, and thus modulate cell division (CDC14), cytoskeleton
dynamics (slingshot phosphatases), and many of them are regulators of the MAPK signaling
(MAPKP or MKPs, MAPK phosphatases; Trinkle-Mulcahy & Lamond, 2006; Patterson et
al., 2009).
The MKPs have two conserved domains that are important for their function: an N-
terminal non-catalytic domain that contains the so-called kinase interaction motif (KIM) and
also sequences that determine the localization of the protein, and the C-terminal catalytic
1 INTRODUCTION 13
domain. The physiological consequences of the MAPK signaling largely depend on the
degree and the duration of the cascade activation. Therefore the response in the cell results
from a balanced counteraction of inducing and suppressing mechanisms, and thus MKPs play
a major part in the control of MAPK signaling. Since MAPK signaling controls functions
such as cellular growth, division, migration and the response to damaged DNA, an improper
activation or deactivation of these kinases can promote the development and progression of
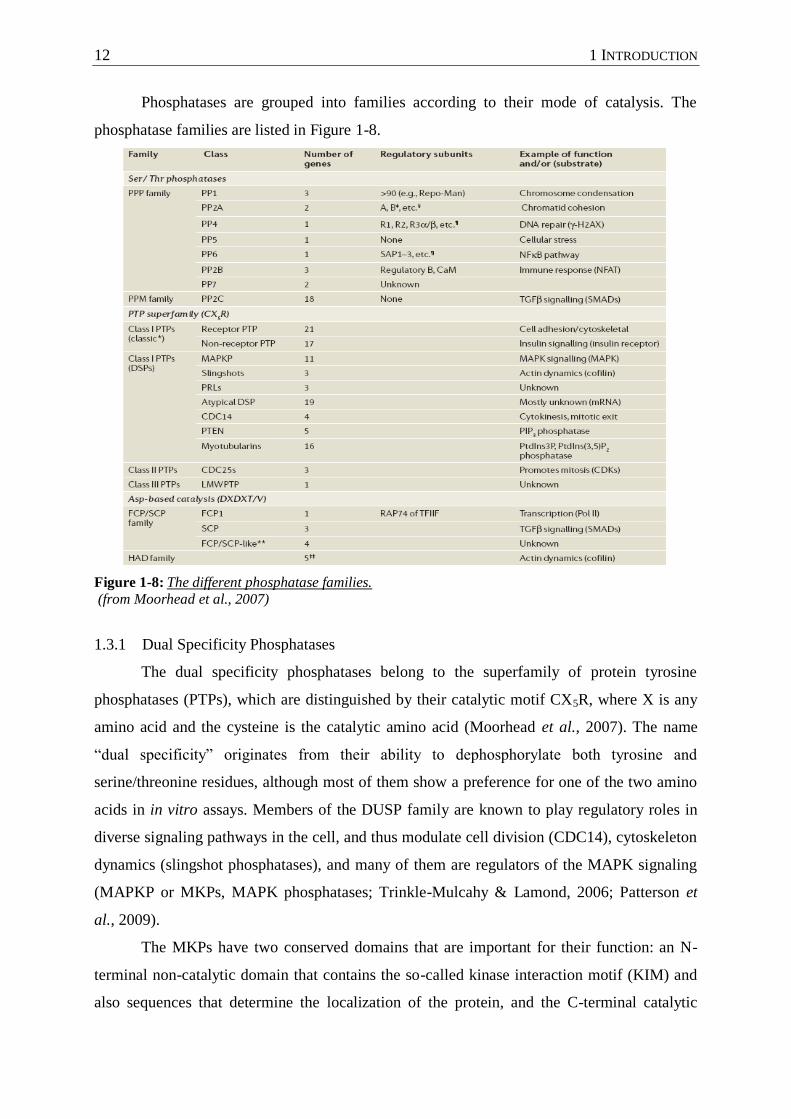
tumors (Dhanasekaran & Johnson, 2007) . MKPs are also misregulated in several cancers
(Keyse, 2008; Figure 1-9), a fact that highlights their importance in attenuating the activity of
MAPK signaling.
Figure 1-9: Several MKPs are misregulated in different forms of cancer.
(from Keyse, 2008)
1.3.2 DUSP18
Dusp18 (also known as Dsp18, Dsp/Dusp20 or LMWDSP20) was identified and
characterized in 2002 by Hood and colleagues (Hood et al., 2002), and further in 2003, by the
group of Yumin Mao (Wu et al., 2003). It belongs to the low molecular weight, atypical dual
specificity phosphatases. The gene locus is located on chromosome 22 (22q12.1) and encodes
for a protein of 188 amino acids (approximately 21 kDa). Dusp18 has a Dual Specificity
14 1 INTRODUCTION
Phosphatase (Protein Tyrosine Phosphatase) domain occupying most of the protein, which
contains the characteristic (H/V)CX5R(S/T) active site motif. Important amino acid residues
for the catalysis are the cysteine within this motif (C104), and an aspartate residue (D73) that
is about 30 amino acids upstream of this cysteine. Dusp18 does not contain the second
domain conserved among DSPs, which is an N-terminal CH2-domain (homologous to
Cdc25). Specific characteristics of Dusp18 that set it apart from other DSPs are its unusual
optimal activity temperature (55°C; Wu et al., 2003) and an extended C-terminal domain that
folds to stabilize the protein, perhaps explaining in this way also its thermostability (Jeong et
al., 2006). Furthermore, the regions surrounding the active site of Dusp18 are not similar to
other DSPs suggesting that Dusp18 might have different substrates than other DSPs. The
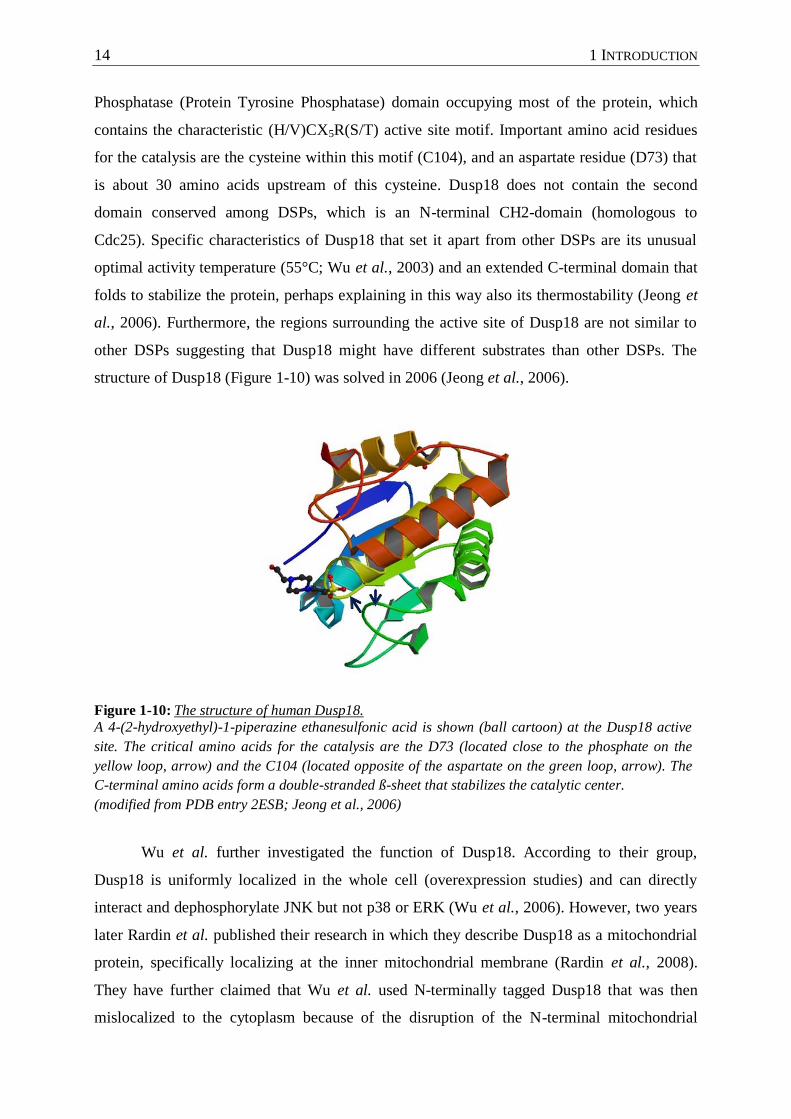
structure of Dusp18 (Figure 1-10) was solved in 2006 (Jeong et al., 2006).
Figure 1-10: The structure of human Dusp18.
A 4-(2-hydroxyethyl)-1-piperazine ethanesulfonic acid is shown (ball cartoon) at the Dusp18 active
site. The critical amino acids for the catalysis are the D73 (located close to the phosphate on the
yellow loop, arrow) and the C104 (located opposite of the aspartate on the green loop, arrow). The
C-terminal amino acids form a double-stranded ß-sheet that stabilizes the catalytic center.
(modified from PDB entry 2ESB; Jeong et al., 2006)
Wu et al. further investigated the function of Dusp18. According to their group,
Dusp18 is uniformly localized in the whole cell (overexpression studies) and can directly
interact and dephosphorylate JNK but not p38 or ERK (Wu et al., 2006). However, two years
later Rardin et al. published their research in which they describe Dusp18 as a mitochondrial
protein, specifically localizing at the inner mitochondrial membrane (Rardin et al., 2008).
They have further claimed that Wu et al. used N-terminally tagged Dusp18 that was then
mislocalized to the cytoplasm because of the disruption of the N-terminal mitochondrial
1 INTRODUCTION 15
signal, and that JNK cannot be a substrate for Dusp18 since it is not located in the
mitochondria. Nevertheless, it should be noted that Rardin et al. performed all their
experiments on the murine and rat homologue of Dusp18, which is similar but not identical to
the human Dusp18 (Figure 4-6, Results).
1.3.3 Implication of phosphatases in the DNA damage response
Only during the last few years scientists have begun to solve the DNA damage
response puzzle by investigating both phosphorylation and dephosphorylation regulatory
mechanisms. Research in this direction has revealed several phosphatases that regulate either
directly kinases involved in the DNA damage response, or they reverse their action by
dephosphorylating their substrates. For example, PPM1D (also known as PP2Cδ or WIP-1) is
a p53 target gene that dephosphorylates and thus inactivates several checkpoint and p53-
activating kinases, such as Chk1, Chk2, ATM, p38, and even p53 itself (hence creating a
negative feedback loop) (Le Guezennec & Bulavin, 2010). PP5 has been implicated in
dephosphorylating ATR (Zhang et al., 2005), while the dephosphorylation of γH2Ax is
performed by several phosphatases including PP2A (Chowdhury et al., 2005), PP4 (Nakada et
al., 2008), Wip1 (Moon et al., 2010) and PP6 (Douglas et al., 2010). PP2A is one of the most
well-studied phosphatases that is in fact involved in many dephosphorylation events
regulating the DNA damage response and the cell cycle checkpoints. Among the targets of
PP2A are the polo-like kinase 1 (plk-1), dephosphorylated during the G2/M checkpoint (Jang
et al., 2007), and the RPA 32kDa protein, targeted to promote the repair of DNA breaks
during S phase (Feng et al., 2009). PP2A also binds the ATM dimer in unstressed cells and
keeps it inactive by constant dephosphorylation of the autophosphorylation Ser1981 site.
DNA breaks trigger the dissociation of PP2A from ATM, thus allowing the activation of the
latter, and the initiation of the signaling cascade in the nucleus (Goodarzi et al., 2004). Hence,
PP2A is an example of a phosphatase that plays both positive and negative roles in the
activation of the DNA damage responsive mechanisms, by targeting a collection of diverse
proteins. Therefore, yet unknown regulation mechanisms must exist to coordinate its action
on all the different substrates.
The investigation of phosphatases in the context of cancer and specifically the
response to damaged DNA opens a new exciting field that can provide new targets and
therapies against tumor initiation, progression and metastasis. As phosphatases are also
enzymes that can be inhibited in the cell by small molecules, understanding their role in
malignancy is crucial, not only to promote the creation of novel drugs, but also to complete
the picture of signaling networks that are affected during transformation. Hence, the aim of

16 1 INTRODUCTION
this study was to identify new phosphatases that modulate the response to DNA damage or are
novel regulators of the p53 tumor suppressor network. For this purpose, a human phosphatase
siRNA library screen was performed, which unveiled Dusp18 as a potential inhibitor of the
p53 pathway. As described above, little is currently known about the function of this
phosphatase. Here, the effect of Dusp18 depletion on the regulation and function of p53, as
well as the possible mechanisms of Dusp18 action are addressed. Furthermore, the molecular
details of the DNA damage response induced by siRNAs that target Dusp18 are examined.
Finally, our efforts focused on understanding the physiological effects of Dusp18 depletion on
the survival and proliferation of tumor cells.
2 MATERIALS 17
2 MATERIALS
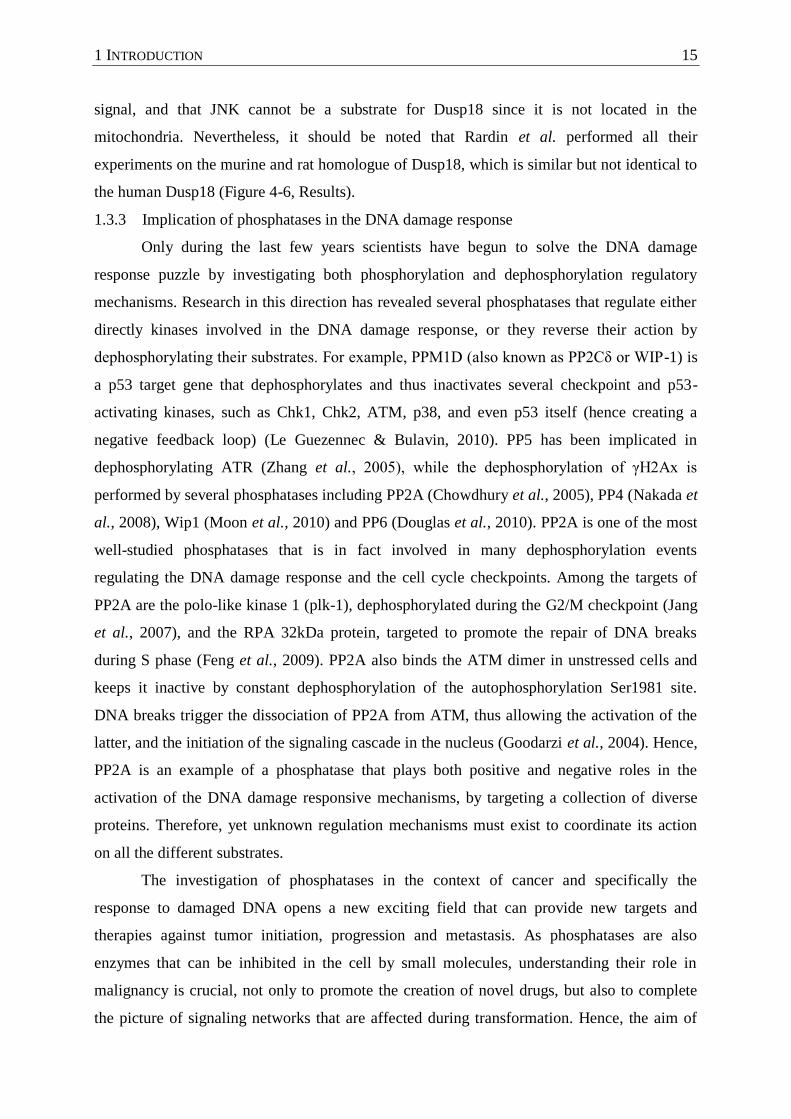
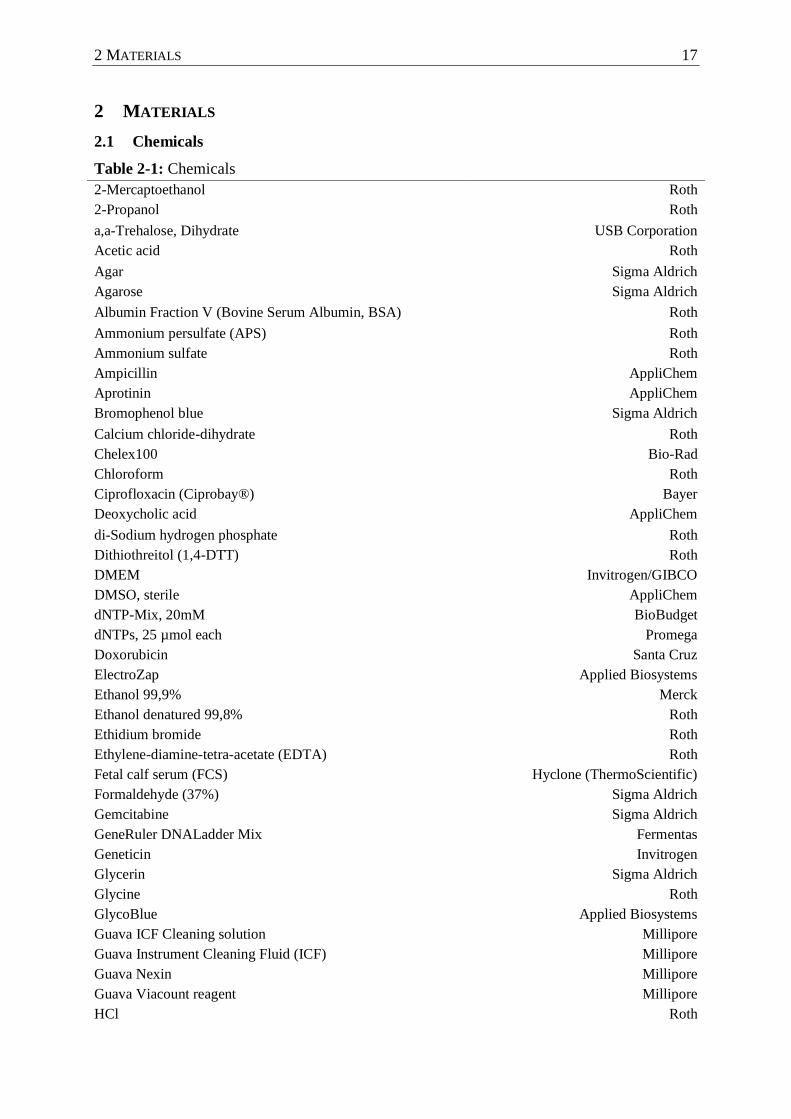
2.1 Chemicals
Table 2-1: Chemicals
2-Mercaptoethanol Roth
2-Propanol Roth
a,a-Trehalose, Dihydrate USB Corporation
Acetic acid Roth
Agar Sigma Aldrich
Agarose Sigma Aldrich
Albumin Fraction V (Bovine Serum Albumin, BSA) Roth
Ammonium persulfate (APS) Roth
Ammonium sulfate Roth
Ampicillin AppliChem
Aprotinin AppliChem
Bromophenol blue Sigma Aldrich
Calcium chloride-dihydrate Roth
Chelex100 Bio-Rad
Chloroform Roth
Ciprofloxacin (Ciprobay®) Bayer
Deoxycholic acid AppliChem
di-Sodium hydrogen phosphate Roth
Dithiothreitol (1,4-DTT) Roth
DMEM Invitrogen/GIBCO
DMSO, sterile AppliChem
dNTP-Mix, 20mM BioBudget
dNTPs, 25 µmol each Promega
Doxorubicin Santa Cruz
ElectroZap Applied Biosystems
Ethanol 99,9% Merck
Ethanol denatured 99,8% Roth
Ethidium bromide Roth
Ethylene-diamine-tetra-acetate (EDTA) Roth
Fetal calf serum (FCS) Hyclone (ThermoScientific)
Formaldehyde (37%) Sigma Aldrich
Gemcitabine Sigma Aldrich
GeneRuler DNALadder Mix Fermentas
Geneticin Invitrogen
Glycerin Sigma Aldrich
Glycine Roth
GlycoBlue Applied Biosystems
Guava ICF Cleaning solution Millipore
Guava Instrument Cleaning Fluid (ICF) Millipore
Guava Nexin Millipore
Guava Viacount reagent Millipore
HCl Roth
18 2 MATERIALS
HEPES Roth
HiDye- Formamide Applied Biosystems
Hoechst 33342 Invitrogen
Isoamylalcohol Roth
Isopropanol, p.A. Geyer
Kanamycin AppliChem
Leupeptin Hemisulfate AppliChem
L-Glutamine Invitrogen/GIBCO
Lipofectamine 2000 Invitrogen
Magnesium acetate tetrahydrate Roth
Magnesium chloride hexahydrate Roth
Magnesium sulfate heptahydrate AppliChem
McCoy' 5A medium Invitrogen/GIBCO
Methanol Geyer
MgSO4 (25mM) Fermentas
Milk powder, blotting grade Roth
Monopotassium phosphate Roth
Nocodazole Sigma Aldrich
Nonidet P40 substitute Amersham
Nuclease free water Applied Biosystems
PageRuler Prestained Protein Ladder Fermentas
Paraformaldehyde Roth
PBS tablets Invitrogen/GIBCO
Pefabloc SC Protease Inhibitor Roth
PEG6000 Fermentas
Penicillin / Streptomycin (P/S) Invitrogen/GIBCO
Pepstatin A AppliChem
Ponceau Roth
Potassium chloride Roth
Propidium iodide solution Sigma Aldrich
Protein A-Sepharose CL-4B Amersham
Protein G - Sepharose 4B Invitrogen
RNase Inhibitor, recombinant NEB
Rotiphorese Gel 30 Roth
Sodium acetate Roth
Sodium Azide 0,1M solution Sigma Aldrich
Sodium bicarbonate solution Sigma Aldrich
Sodium carbonate Roth
Sodium chloride Roth
Sodium deoxycholate (Na-DOC) AppliChem
Sodium dihydrogenphosphate Roth
Sodium dodecyl sulfate (SDS) Roth
Sodium hydrogencarbonate Roth
Sodium hydroxide tablets Roth
Sonicated salmon sperm DNA Fermentas
Sucrose Roth
2 MATERIALS 19
SYBR Green I Roche
Tetracycline Sigma Aldrich
Tetramethyl ammonium chloride Roth
Tetramethylethylenediamine (TEMED) Roth
Thimerosal Sigma Aldrich
Trasylol AppliChem
Trehalose USB Corporation
Tris (tris-hydroxymethyl-aminomethane) Roth
tri-Sodium citrate dihydrate Roth
Triton x-100 AppliChem
TRIzol Reagent Invitrogen
Trypsin/EDTA Invitrogen
Tryptone Roth
Tween 20 AppliChem
Yeast Extract Sigma Aldrich
2.2 Enzymes and buffers
Table 2-2: Enzymes and buffers
BamHI Fermentas
BamHI buffer Fermentas
Proteinase K Invitrogen
T4 DNA ligase buffer NEB
T4 DNA Ligase NEB
Tango buffer Fermentas
Taq polymerase LC Fermentas
Hot-Start Taq polymerase Axon Labortechnik
M-MuLV Reverse transcriptase NEB
NEB Buffer Pack for M-MuLV Rev. Transcriptase NEB
NotI Fermentas
Pfu reaction buffer Stratagene
PfuTurbo® DNA Polymerase Stratagene
PfuUltra™ High-Fidelity DNA Polymerase Stratagene
XbaI Fermentas
10x Taq Buffer Fermentas
Calf Intestine Alkaline Phosphatase Fermentas
RNAse A Qiagen
2.3 Reaction systems (kits)
Table 2-3: Reaction systems (kits)
BigDye® Terminator v3.1 Cycle Sequencing Kit Applied Biosystems
Guava Check Kit Millipore
Invisorb® Spin Plasmid Mini Two Kit InViTek
PureYield™ Plasmid Midiprep System Promega
QIAquick PCR purification kit Qiagen
RIDASCREEN® Mycoplasma IFA R-Biopharm AG
20 2 MATERIALS
SuperSignal West Dura Extended Duration Substrate Pierce
SuperSignal West Femto Maximum Sensitivity Substrate Pierce
ElectroMAX DH10B Electrocompetent Cells Invitrogen
Plasmid Mini Kit Qiagen
2.4 Oligonucleotides
Table 2-4: Oligonucleotides
poly-dT primer Metabion
poly-dN primer Metabion
Primers Invitrogen
Silencer® Select Human Phosphatase siRNA Library V4 Applied Biosystems
siRNAs (sequence-patented) Applied Biosystems
Table 2-5: Primers
Primer Sequence Application Target region
CMV FW GGC GTG TAC GGT GGG AGG TC sequencing CMV promoter
dusp18 FW GCT GAC TCC CCT AAC TCA CG qPCR dusp18
dusp18 REV TGC CAA ACA ATT GGA ACT CA qPCR dusp18
dusp18
FW_XbaI
GGA CCT TCT AGA ATG ACA GCA CCC
TCG TGT G
cloning dusp18
dusp18
REV_BamHI
TTC TCA GGA TCC TCA CAG TGG AAT
CAT CAA ACG
cloning dusp18
p21 FW TAG GCG GTT GAA TGA GAG G qPCR p21
p21 REV AAG TGG GGA GGA GGA AGT AG qPCR p21
p21 intron 1
FW
GGC ATG TGT CCC GGG CTT CC qPCR p21 intron 1
p21 intron 1
REV
CCC CTG CCT CGT GTT GCC TG qPCR p21 intron 1
p21 intron 2
FW
GGG CCC GGC ATT GTG CTG AA qPCR p21 intron 2
p21 intron 2
REV
ATC CAT CAC CGC ACC CGC AC qPCR p21 intron 2
dusp18
FW_NotI
GCC GCC GCG GCC GCG CCA CCA TGA
CAG CAC CCT CGT GTG CCT TCC
cloning dusp18
p53 BS1 FW CCG GCC AGT ATA TAT TTT TAA TTG
AGA
ChIP p21 promoter, p53
binding site at -2283 bp
p53 BS1 REV AGT GGT TAG TAA TTT TCA GTT TGC
TCA T
ChIP p21 promoter, p53
binding site at -2283 bp
SP1 BS1 FW AGT GCC AAC TCA TTC TCC AAG ChIP p21 promoter, SP1
binding site at -282 bp
SP1 BS1 REV ACT TCG TGG GGA AAT GTG TC ChIP p21 promoter, SP1
binding site at -282 bp
SP1 BS2 FW /
p21 +1 FW
GGG GCG GTT GTA TAT CAG G ChIP p21 transcription start
site at +1 bp
SP1 BS2 REV
/ p21 +1 REV
AGT CAG TTC CTT GTG GAG CC ChIP p21 transcription start
site at +1 bp
p21 +1500
FW
TGG GAG GAC TTG CGA GCG GT ChIP p21 gene at +1500 bp
2 MATERIALS 21
p21 +1500
REV
CCA CGC CCA AAG CAC GGG AT ChIP p21 gene at +1500 bp
p21 +6000
FW
AGC AGG CTG AAG GGT CCC CA ChIP p21 gene at +6000 bp
p21 +6000
REV
TCC GTG CAC ATG TCC GCA CC ChIP p21 gene at +6000 bp
GAPDH FW TGA AGG TCG GAG TCA ACG GAT TTG
GT
qPCR gapdh
GAPDH REV GCA GAG ATG ATG ACC CTT TTG GCT C qPCR gapdh
2.5 Antibodies
Table 2-6: Antibodies
Primary Antibodies:
Antigen Antibody Company Cat. Number
Acetyl-p53
Lys382
Cell Signaling 2525
Actin Abcam ab6276-100
cleaved Caspase
3 (Asp175)
Cell Signaling 9664
Dusp18 DUSP18 (C-term) Abgent AP8480b
Dusp18 DUSP18 (N-19) Santa Cruz sc-79441
HA tag HA.11 (16B12) Covance MMS-101R
Mdm2 2A9 Hybridoma cell line Chen et al., Mol Cell Biol.
1993 July; 13(7): 4107-4114
Nucleophosmin Invitrogen 32-5200
p21 Ab-1, EA10 Calbiochem OP 64
p53 DO-1 SANTA CRUZ sc-126
p53 pAb421 Calbiochem OP03
p53 fl393 SANTA CRUZ sc-6243
PARP-1 Ab-2 Calbiochem AM30
phopsho-p53
Ser15
16G8 Cell Signaling 9286
phospho-Chk-1 phospho-Chk1(Ser317) CellSignaling 2344
phospho-Chk-2 phospho-Chk2 (Thr68) Cell Signaling 2661
phospho-p38 phospho-p38
Thr180/Tyr182
Cell Signaling 9216
phospho-p53
Ser46
Cell Signaling 2521
SP1 Millipore 07-645
ß-galactosidase anti-ß-gal Promega 2378B
γH2Ax phosphoH2Ax Ser139 Millipore 05-636
22 2 MATERIALS
Secondary Antibodies:
Antibody Company Cat. Number
AlexaFluor546 goat anti-mouse Invitrogen A-11003
AlexaFluor488 goat anti-rabbit Invitrogen A-11034
HRP-coupled affiniPure F(ab')2 fragment, anti-
rabbit IgG (H+L)
Jackson
ImmunoResearch
715-036-150
HRP-coupled affiniPure F(ab')2 fragment, anti-
mouse IgG (H+L)
Jackson
ImmunoResearch
711-036-152
2.6 Buffers
Table 2-7: Buffers
2YT medium 2YT-Agar 6x DNA gel load. buff. 50x TAE buffer
1,6% (w/v) Tryptone 15% (w/v) Agar 40% (w/v) sucrose 2 M Tris-Base
1% (w/v) yeast extrakt in 2YT-Medium 10% (w/v) glycerin 1 M acetic acid
0,5% (w/v) NaCl 0,25% (w/v) bromophenol
blue
100 mM EDTA
10x PBS PBS++ 10x Western salts WB Transfer buffer
239,9 mM NaCl 1x PBS 1,9 M Glycin 1x Western Salts
8,1 mM Na2HPO4 1 mM CaCl2 0,02% (w/v) SDS 15% (v/v) Methanol
2,7 mM KCl 0,5 mM MgCl2 250 mM Tris-HCl
pH 8,3
1,5 mM KH2PO4
RIPA lysis buffer 6x Laem. buffer ChIP buffer ChIP buffer +++
1,4% Trasylol
(100000 KIE)
350 mM Tris-HCl pH 6,8 150 mM NaCl ChIP buffer
containing
0,1% (v/v) Triton X-100 30% (v/v) glycerin 5 mM EDTA pH 8,0 1µg/ml Pepstatin A
0,1% (v/v) Na-DOC 10% (w/v) SDS 50 mM Tris-HCl pH 8,0 1 mM Pefabloc
0,1% (w/v) SDS 9,3% (w/v) 1,4-DTT 0,5% (v/v) NP-40 1µg/ml Leupeptin/
Aprotinin
1 mM EDTA 0,02% (w/v) bromophenol
blue
1% (v/v) Triton-X-100
9 mM NaCl
2 mM Tris-HCl pH 8.5
Co-IP buffer CoIP buffer ++
300 mM NaCl CoIP buffer containing
50 mM Tris-HCl
pH 7,5
1µg/ml Leupeptin/
Aprotinin
1% (v/v) NP40 1 mM Pefabloc
0,25% (w/v) Na-DOC
2 MATERIALS 23
2.7 Consumables
Table 2-8: Consumables
1,5ml safe-lock reaction tubes Eppendorf
10µl Filtertips, SafeSeal-Tips professional Biozym
1000µl Filtertips,Biosphere Filter Tips Sarstedt
1250µl Filtertips,SafeSeal-Tips professional Biozym
20µl Filtertips,Biosphere Filter Tips Sarstedt
200µl Filtertips,Biosphere Filter Tips Sarstedt
2ml safe-lock reaction tubes Eppendorf
96 well plate, black Greiner
96 well plate, clear Axygen
Black with Clear Bottom 96-well Microtest™ Optilux™ Plate BD Biosciences
Cell scrapper, 16cm Sarstedt
Cell scrapper, 25cm Sarstedt
Gene Pulser electroporation cuvette Bio-Rad
Hybond-P PVDF-Membrane Omnilab
Latex gloves Safeskin PFE Kimberly-Clark Professional
Microseal B Seal sealing foil Bio-Rad
Multiplate 96-well white PCR plates Bio-Rad
Neubauer cell counting chamber Brand
Optical Film Sealing Kit for 96-well plates Bio-Rad
OptiPlate TM 96 Perkin Elmer
PCR reaction tubes 0,2 ml Sarstedt
Pipette tips (10 μl/ 200 μl/ 1000 μl) MBP/ Greiner/ Sarstedt
Sterile cell culture dish 10cm Greiner
Sterile cell culture dish 15cm Greiner
Sterile cell culture well-plates, 12-well Greiner
Sterile cell culture well-plates, 24-well Greiner
Sterile cell culture well-plates, 6-well Greiner
Sterile cell culture well-plates, 96-well Greiner
Sterile conical tube 15ml Sarstedt
Sterile conical tube 50ml Sarstedt
Sterile cryotubes, 1,8ml Nunc
U-40 Insulin syringe (26 Gauge) B.Braun Petzold
Whatmann paper for WB Schleicher & Schuell
2.8 Electronic equipment
Table 2-9: Electronic equipment
Analytical balance LE6238 Sartorius
BD Pathway 855 Imaging System BD Biosciences
Biomek® 3000 Laboratory Automation Workstation Beckman Coulter
Bioruptor® sonication device Diagenode
Celigo cell cytometer Cyntellect Europe
Cooling centrifuge Heraeus Instruments
Electrophoresis chamber Harnischmacher Labortechnik
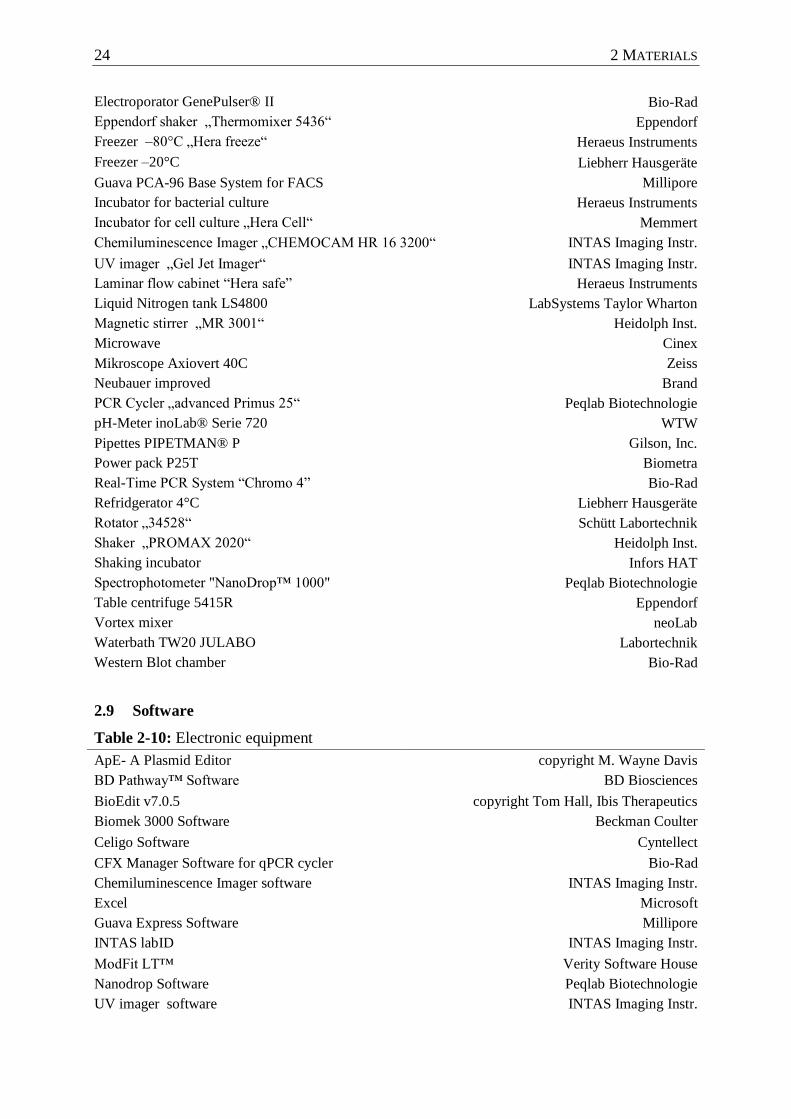
24 2 MATERIALS
Electroporator GenePulser® II Bio-Rad
Eppendorf shaker „Thermomixer 5436“ Eppendorf
Freezer –80°C „Hera freeze“ Heraeus Instruments
Freezer –20°C Liebherr Hausgeräte
Guava PCA-96 Base System for FACS Millipore
Incubator for bacterial culture Heraeus Instruments
Incubator for cell culture „Hera Cell“ Memmert
Chemiluminescence Imager „CHEMOCAM HR 16 3200“ INTAS Imaging Instr.
UV imager „Gel Jet Imager“ INTAS Imaging Instr.
Laminar flow cabinet “Hera safe” Heraeus Instruments
Liquid Nitrogen tank LS4800 LabSystems Taylor Wharton
Magnetic stirrer „MR 3001“ Heidolph Inst.
Microwave Cinex
Mikroscope Axiovert 40C Zeiss
Neubauer improved Brand
PCR Cycler „advanced Primus 25“ Peqlab Biotechnologie
pH-Meter inoLab® Serie 720 WTW
Pipettes PIPETMAN® P Gilson, Inc.
Power pack P25T Biometra
Real-Time PCR System “Chromo 4” Bio-Rad
Refridgerator 4°C Liebherr Hausgeräte
Rotator „34528“ Schütt Labortechnik
Shaker „PROMAX 2020“ Heidolph Inst.
Shaking incubator Infors HAT
Spectrophotometer "NanoDrop™ 1000" Peqlab Biotechnologie
Table centrifuge 5415R Eppendorf
Vortex mixer neoLab
Waterbath TW20 JULABO Labortechnik
Western Blot chamber Bio-Rad
2.9 Software
Table 2-10: Electronic equipment
ApE- A Plasmid Editor copyright M. Wayne Davis
BD Pathway™ Software BD Biosciences
BioEdit v7.0.5 copyright Tom Hall, Ibis Therapeutics
Biomek 3000 Software Beckman Coulter
Celigo Software Cyntellect
CFX Manager Software for qPCR cycler Bio-Rad
Chemiluminescence Imager software INTAS Imaging Instr.
Excel Microsoft
Guava Express Software Millipore
INTAS labID INTAS Imaging Instr.
ModFit LT™ Verity Software House
Nanodrop Software Peqlab Biotechnologie
UV imager software INTAS Imaging Instr.
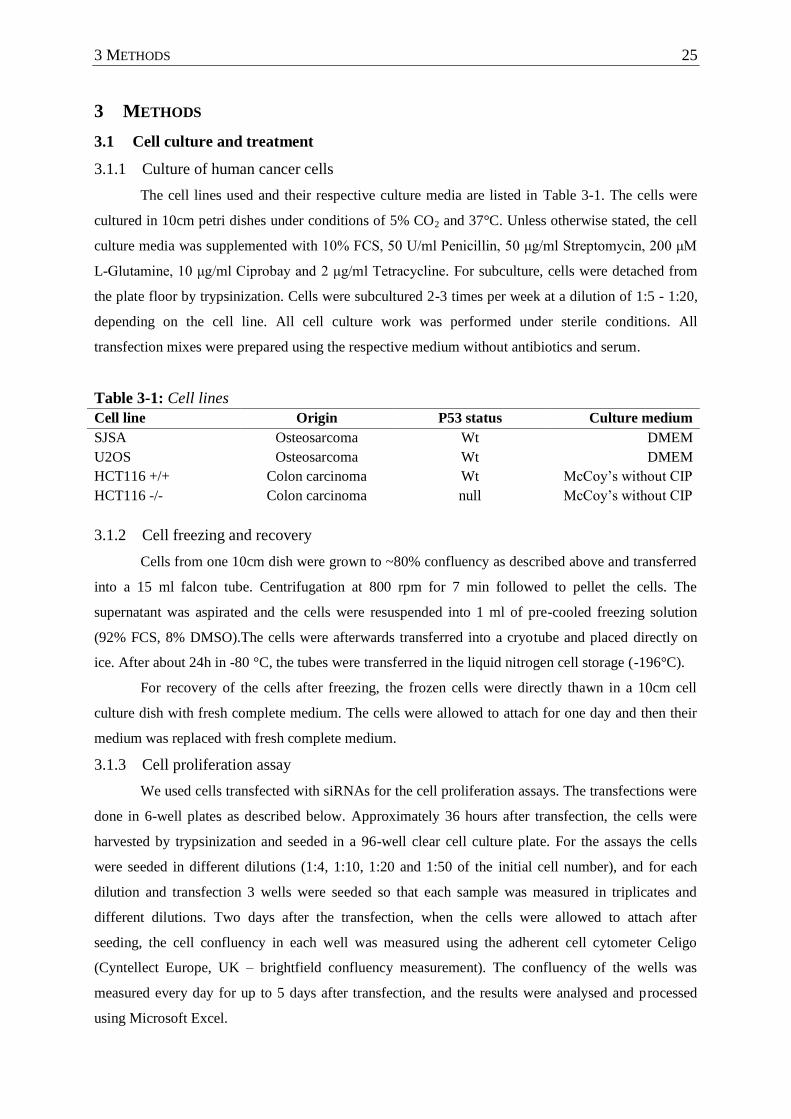
3 METHODS 25
3 METHODS
3.1 Cell culture and treatment
3.1.1 Culture of human cancer cells
The cell lines used and their respective culture media are listed in Table 3-1. The cells were
cultured in 10cm petri dishes under conditions of 5% CO2 and 37°C. Unless otherwise stated, the cell
culture media was supplemented with 10% FCS, 50 U/ml Penicillin, 50 μg/ml Streptomycin, 200 μM
L-Glutamine, 10 μg/ml Ciprobay and 2 μg/ml Tetracycline. For subculture, cells were detached from
the plate floor by trypsinization. Cells were subcultured 2-3 times per week at a dilution of 1:5 - 1:20,
depending on the cell line. All cell culture work was performed under sterile conditions. All
transfection mixes were prepared using the respective medium without antibiotics and serum.
Table 3-1: Cell lines
Cell line Origin P53 status Culture medium
SJSA Osteosarcoma Wt DMEM
U2OS Osteosarcoma Wt DMEM
HCT116 +/+ Colon carcinoma Wt McCoy‟s without CIP
HCT116 -/- Colon carcinoma null McCoy‟s without CIP
3.1.2 Cell freezing and recovery
Cells from one 10cm dish were grown to ~80% confluency as described above and transferred
into a 15 ml falcon tube. Centrifugation at 800 rpm for 7 min followed to pellet the cells. The
supernatant was aspirated and the cells were resuspended into 1 ml of pre-cooled freezing solution
(92% FCS, 8% DMSO).The cells were afterwards transferred into a cryotube and placed directly on
ice. After about 24h in -80 °C, the tubes were transferred in the liquid nitrogen cell storage (-196°C).
For recovery of the cells after freezing, the frozen cells were directly thawn in a 10cm cell
culture dish with fresh complete medium. The cells were allowed to attach for one day and then their
medium was replaced with fresh complete medium.
3.1.3 Cell proliferation assay
We used cells transfected with siRNAs for the cell proliferation assays. The transfections were
done in 6-well plates as described below. Approximately 36 hours after transfection, the cells were
harvested by trypsinization and seeded in a 96-well clear cell culture plate. For the assays the cells
were seeded in different dilutions (1:4, 1:10, 1:20 and 1:50 of the initial cell number), and for each
dilution and transfection 3 wells were seeded so that each sample was measured in triplicates and
different dilutions. Two days after the transfection, when the cells were allowed to attach after
seeding, the cell confluency in each well was measured using the adherent cell cytometer Celigo
(Cyntellect Europe, UK – brightfield confluency measurement). The confluency of the wells was
measured every day for up to 5 days after transfection, and the results were analysed and processed
using Microsoft Excel.
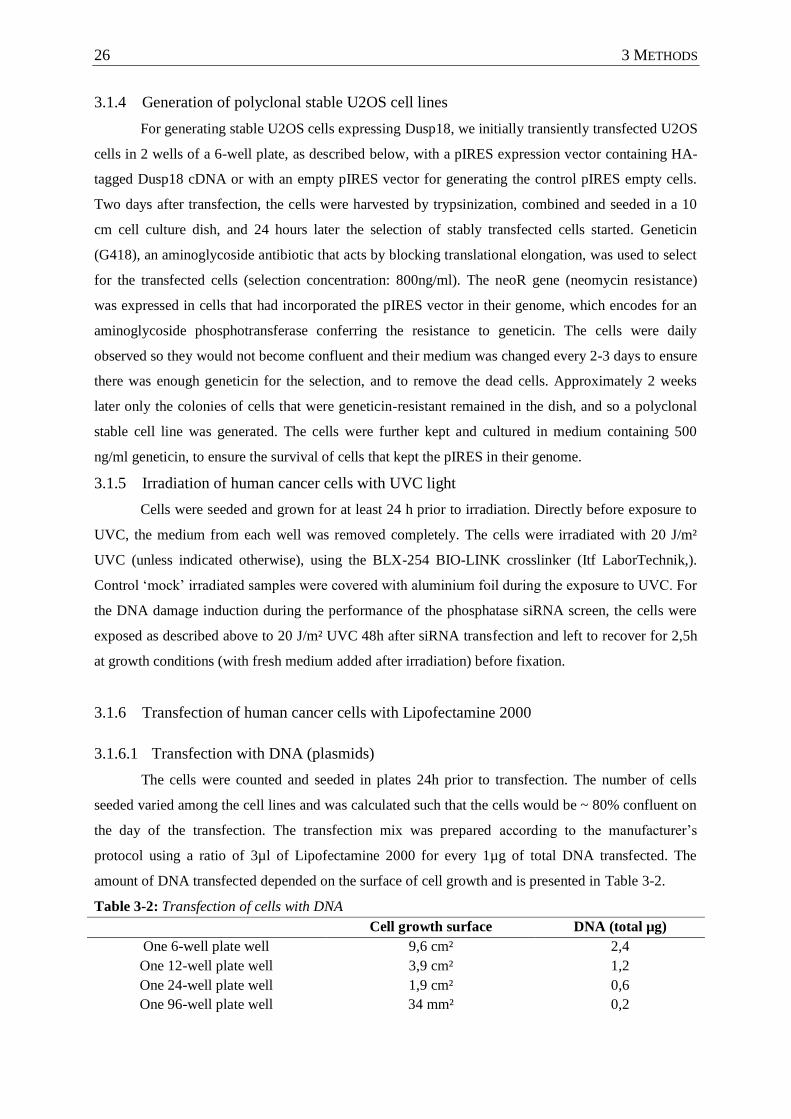
26 3 METHODS
3.1.4 Generation of polyclonal stable U2OS cell lines
For generating stable U2OS cells expressing Dusp18, we initially transiently transfected U2OS
cells in 2 wells of a 6-well plate, as described below, with a pIRES expression vector containing HA-
tagged Dusp18 cDNA or with an empty pIRES vector for generating the control pIRES empty cells.
Two days after transfection, the cells were harvested by trypsinization, combined and seeded in a 10
cm cell culture dish, and 24 hours later the selection of stably transfected cells started. Geneticin
(G418), an aminoglycoside antibiotic that acts by blocking translational elongation, was used to select
for the transfected cells (selection concentration: 800ng/ml). The neoR gene (neomycin resistance)
was expressed in cells that had incorporated the pIRES vector in their genome, which encodes for an
aminoglycoside phosphotransferase conferring the resistance to geneticin. The cells were daily
observed so they would not become confluent and their medium was changed every 2-3 days to ensure
there was enough geneticin for the selection, and to remove the dead cells. Approximately 2 weeks
later only the colonies of cells that were geneticin-resistant remained in the dish, and so a polyclonal
stable cell line was generated. The cells were further kept and cultured in medium containing 500
ng/ml geneticin, to ensure the survival of cells that kept the pIRES in their genome.
3.1.5 Irradiation of human cancer cells with UVC light
Cells were seeded and grown for at least 24 h prior to irradiation. Directly before exposure to
UVC, the medium from each well was removed completely. The cells were irradiated with 20 J/m²
UVC (unless indicated otherwise), using the BLX-254 BIO-LINK crosslinker (Itf LaborTechnik,).
Control „mock‟ irradiated samples were covered with aluminium foil during the exposure to UVC. For
the DNA damage induction during the performance of the phosphatase siRNA screen, the cells were
exposed as described above to 20 J/m² UVC 48h after siRNA transfection and left to recover for 2,5h
at growth conditions (with fresh medium added after irradiation) before fixation.
3.1.6 Transfection of human cancer cells with Lipofectamine 2000
3.1.6.1 Transfection with DNA (plasmids)
The cells were counted and seeded in plates 24h prior to transfection. The number of cells
seeded varied among the cell lines and was calculated such that the cells would be ~ 80% confluent on
the day of the transfection. The transfection mix was prepared according to the manufacturer‟s
protocol using a ratio of 3µl of Lipofectamine 2000 for every 1µg of total DNA transfected. The
amount of DNA transfected depended on the surface of cell growth and is presented in Table 3-2.
Table 3-2: Transfection of cells with DNA
Cell growth surface DNA (total µg)
One 6-well plate well 9,6 cm² 2,4
One 12-well plate well 3,9 cm² 1,2
One 24-well plate well 1,9 cm² 0,6
One 96-well plate well 34 mm² 0,2
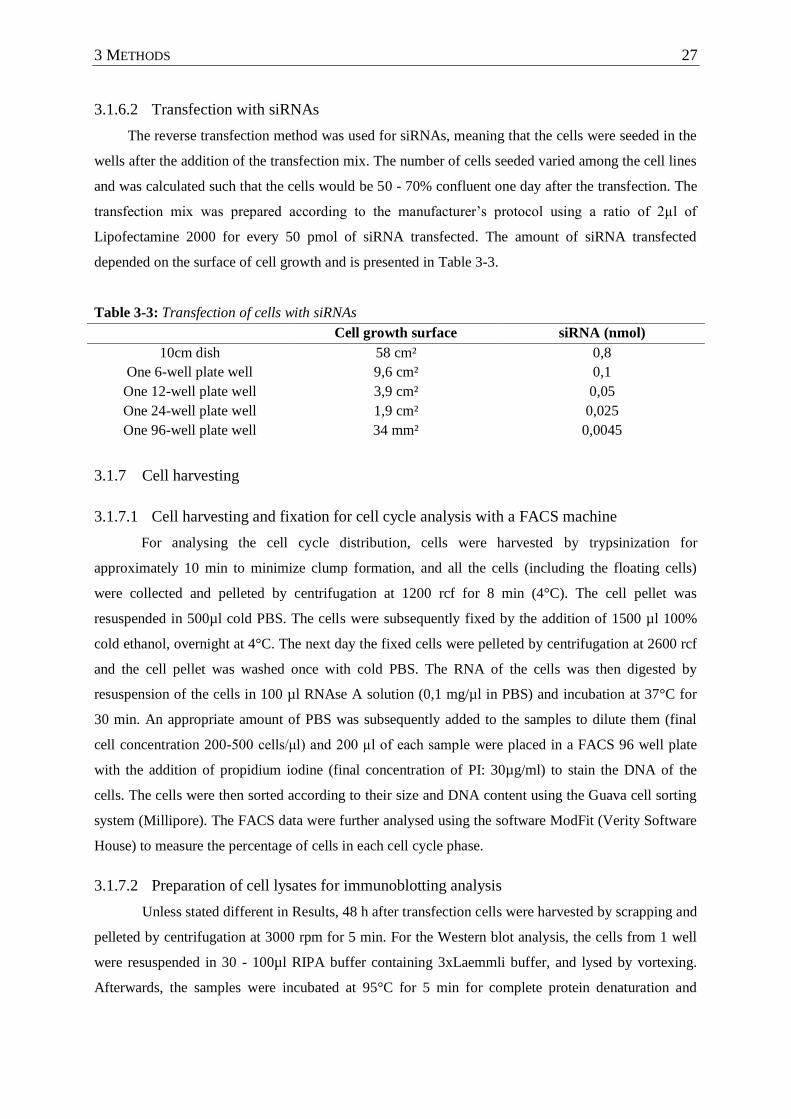
3 METHODS 27
3.1.6.2 Transfection with siRNAs
The reverse transfection method was used for siRNAs, meaning that the cells were seeded in the
wells after the addition of the transfection mix. The number of cells seeded varied among the cell lines
and was calculated such that the cells would be 50 - 70% confluent one day after the transfection. The
transfection mix was prepared according to the manufacturer‟s protocol using a ratio of 2µl of
Lipofectamine 2000 for every 50 pmol of siRNA transfected. The amount of siRNA transfected
depended on the surface of cell growth and is presented in Table 3-3.
Table 3-3: Transfection of cells with siRNAs
Cell growth surface siRNA (nmol)
10cm dish 58 cm² 0,8
One 6-well plate well 9,6 cm² 0,1
One 12-well plate well 3,9 cm² 0,05
One 24-well plate well 1,9 cm² 0,025
One 96-well plate well 34 mm² 0,0045
3.1.7 Cell harvesting
3.1.7.1 Cell harvesting and fixation for cell cycle analysis with a FACS machine
For analysing the cell cycle distribution, cells were harvested by trypsinization for
approximately 10 min to minimize clump formation, and all the cells (including the floating cells)
were collected and pelleted by centrifugation at 1200 rcf for 8 min (4°C). The cell pellet was
resuspended in 500µl cold PBS. The cells were subsequently fixed by the addition of 1500 µl 100%
cold ethanol, overnight at 4°C. The next day the fixed cells were pelleted by centrifugation at 2600 rcf
and the cell pellet was washed once with cold PBS. The RNA of the cells was then digested by
resuspension of the cells in 100 µl RNAse A solution (0,1 mg/µl in PBS) and incubation at 37°C for
30 min. An appropriate amount of PBS was subsequently added to the samples to dilute them (final
cell concentration 200-500 cells/μl) and 200 µl of each sample were placed in a FACS 96 well plate
with the addition of propidium iodine (final concentration of PI: 30µg/ml) to stain the DNA of the
cells. The cells were then sorted according to their size and DNA content using the Guava cell sorting
system (Millipore). The FACS data were further analysed using the software ModFit (Verity Software
House) to measure the percentage of cells in each cell cycle phase.
3.1.7.2 Preparation of cell lysates for immunoblotting analysis
Unless stated different in Results, 48 h after transfection cells were harvested by scrapping and
pelleted by centrifugation at 3000 rpm for 5 min. For the Western blot analysis, the cells from 1 well
were resuspended in 30 - 100µl RIPA buffer containing 3xLaemmli buffer, and lysed by vortexing.
Afterwards, the samples were incubated at 95°C for 5 min for complete protein denaturation and
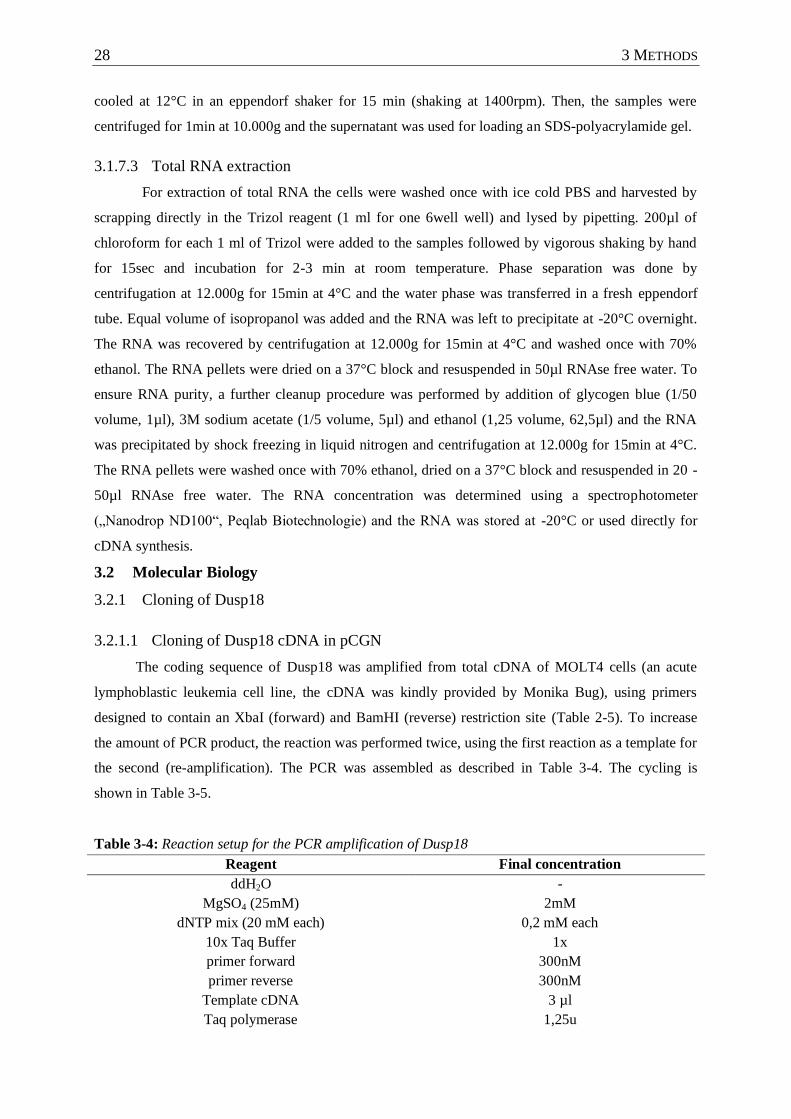
28 3 METHODS
cooled at 12°C in an eppendorf shaker for 15 min (shaking at 1400rpm). Then, the samples were
centrifuged for 1min at 10.000g and the supernatant was used for loading an SDS-polyacrylamide gel.
3.1.7.3 Total RNA extraction
For extraction of total RNA the cells were washed once with ice cold PBS and harvested by
scrapping directly in the Trizol reagent (1 ml for one 6well well) and lysed by pipetting. 200µl of
chloroform for each 1 ml of Trizol were added to the samples followed by vigorous shaking by hand
for 15sec and incubation for 2-3 min at room temperature. Phase separation was done by
centrifugation at 12.000g for 15min at 4°C and the water phase was transferred in a fresh eppendorf
tube. Equal volume of isopropanol was added and the RNA was left to precipitate at -20°C overnight.
The RNA was recovered by centrifugation at 12.000g for 15min at 4°C and washed once with 70%
ethanol. The RNA pellets were dried on a 37°C block and resuspended in 50µl RNAse free water. To
ensure RNA purity, a further cleanup procedure was performed by addition of glycogen blue (1/50
volume, 1µl), 3M sodium acetate (1/5 volume, 5µl) and ethanol (1,25 volume, 62,5µl) and the RNA
was precipitated by shock freezing in liquid nitrogen and centrifugation at 12.000g for 15min at 4°C.
The RNA pellets were washed once with 70% ethanol, dried on a 37°C block and resuspended in 20 -
50µl RNAse free water. The RNA concentration was determined using a spectrophotometer
(„Nanodrop ND100“, Peqlab Biotechnologie) and the RNA was stored at -20°C or used directly for
cDNA synthesis.
3.2 Molecular Biology
3.2.1 Cloning of Dusp18
3.2.1.1 Cloning of Dusp18 cDNA in pCGN
The coding sequence of Dusp18 was amplified from total cDNA of MOLT4 cells (an acute
lymphoblastic leukemia cell line, the cDNA was kindly provided by Monika Bug), using primers
designed to contain an XbaI (forward) and BamHI (reverse) restriction site (Table 2-5). To increase
the amount of PCR product, the reaction was performed twice, using the first reaction as a template for
the second (re-amplification). The PCR was assembled as described in Table 3-4. The cycling is
shown in Table 3-5.
Table 3-4: Reaction setup for the PCR amplification of Dusp18
Reagent Final concentration
ddH2O -
MgSO4 (25mM) 2mM
dNTP mix (20 mM each) 0,2 mM each
10x Taq Buffer 1x
primer forward 300nM
primer reverse 300nM
Template cDNA 3 µl
Taq polymerase 1,25u
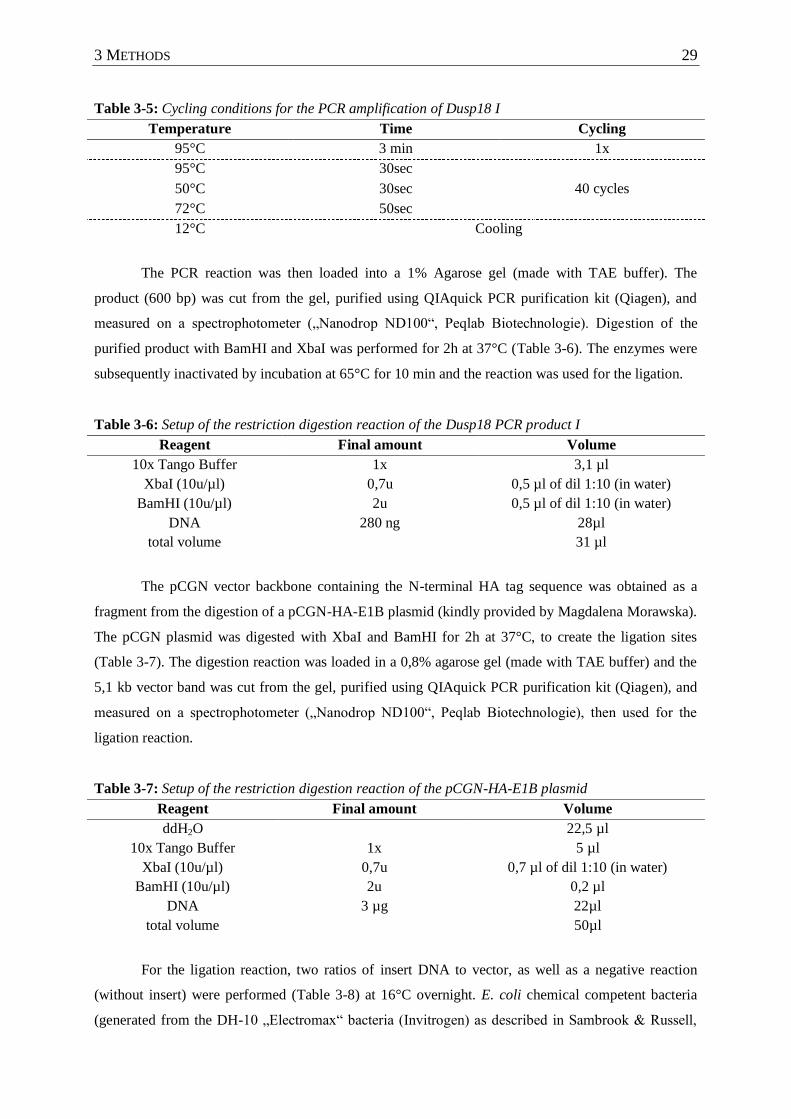
3 METHODS 29
Table 3-5: Cycling conditions for the PCR amplification of Dusp18 I
Temperature Time Cycling
95°C 3 min 1x
95°C 30sec
40 cycles 50°C 30sec
72°C 50sec
12°C Cooling
The PCR reaction was then loaded into a 1% Agarose gel (made with TAE buffer). The
product (600 bp) was cut from the gel, purified using QIAquick PCR purification kit (Qiagen), and
measured on a spectrophotometer („Nanodrop ND100“, Peqlab Biotechnologie). Digestion of the
purified product with BamHI and XbaI was performed for 2h at 37°C (Table 3-6). The enzymes were
subsequently inactivated by incubation at 65°C for 10 min and the reaction was used for the ligation.
Table 3-6: Setup of the restriction digestion reaction of the Dusp18 PCR product I
Reagent Final amount Volume
10x Tango Buffer 1x 3,1 µl
XbaI (10u/µl) 0,7u 0,5 µl of dil 1:10 (in water)
BamHI (10u/µl) 2u 0,5 µl of dil 1:10 (in water)
DNA 280 ng 28µl
total volume 31 µl
The pCGN vector backbone containing the N-terminal HA tag sequence was obtained as a
fragment from the digestion of a pCGN-HA-E1B plasmid (kindly provided by Magdalena Morawska).
The pCGN plasmid was digested with XbaI and BamHI for 2h at 37°C, to create the ligation sites
(Table 3-7). The digestion reaction was loaded in a 0,8% agarose gel (made with TAE buffer) and the
5,1 kb vector band was cut from the gel, purified using QIAquick PCR purification kit (Qiagen), and
measured on a spectrophotometer („Nanodrop ND100“, Peqlab Biotechnologie), then used for the
ligation reaction.
Table 3-7: Setup of the restriction digestion reaction of the pCGN-HA-E1B plasmid
Reagent Final amount Volume
ddH2O 22,5 µl
10x Tango Buffer 1x 5 µl
XbaI (10u/µl) 0,7u 0,7 µl of dil 1:10 (in water)
BamHI (10u/µl) 2u 0,2 µl
DNA 3 µg 22µl
total volume 50µl
For the ligation reaction, two ratios of insert DNA to vector, as well as a negative reaction
(without insert) were performed (Table 3-8) at 16°C overnight. E. coli chemical competent bacteria
(generated from the DH-10 „Electromax“ bacteria (Invitrogen) as described in Sambrook & Russell,
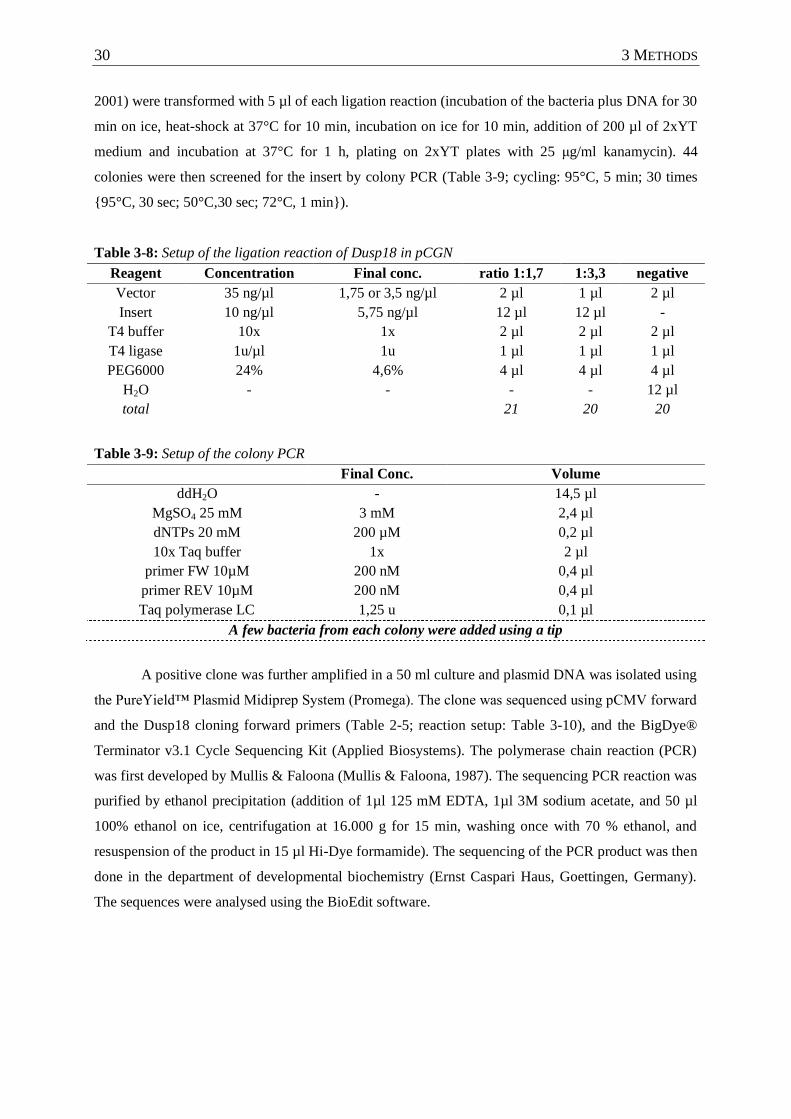
30 3 METHODS
2001) were transformed with 5 µl of each ligation reaction (incubation of the bacteria plus DNA for 30
min on ice, heat-shock at 37°C for 10 min, incubation on ice for 10 min, addition of 200 µl of 2xYT
medium and incubation at 37°C for 1 h, plating on 2xYT plates with 25 μg/ml kanamycin). 44
colonies were then screened for the insert by colony PCR (Table 3-9; cycling: 95°C, 5 min; 30 times
{95°C, 30 sec; 50°C,30 sec; 72°C, 1 min}).
Table 3-8: Setup of the ligation reaction of Dusp18 in pCGN
Reagent Concentration Final conc. ratio 1:1,7 1:3,3 negative
Vector 35 ng/µl 1,75 or 3,5 ng/µl 2 µl 1 µl 2 µl
Insert 10 ng/µl 5,75 ng/µl 12 µl 12 µl -
T4 buffer 10x 1x 2 µl 2 µl 2 µl
T4 ligase 1u/µl 1u 1 µl 1 µl 1 µl
PEG6000 24% 4,6% 4 µl 4 µl 4 µl
H2O - - - - 12 µl
total 21 20 20
Table 3-9: Setup of the colony PCR
Final Conc. Volume
ddH2O - 14,5 µl
MgSO4 25 mM 3 mM 2,4 µl
dNTPs 20 mM 200 µM 0,2 µl
10x Taq buffer 1x 2 µl
primer FW 10µM 200 nM 0,4 µl
primer REV 10µM 200 nM 0,4 µl
Taq polymerase LC 1,25 u 0,1 µl
A few bacteria from each colony were added using a tip
A positive clone was further amplified in a 50 ml culture and plasmid DNA was isolated using
the PureYield™ Plasmid Midiprep System (Promega). The clone was sequenced using pCMV forward
and the Dusp18 cloning forward primers (Table 2-5; reaction setup: Table 3-10), and the BigDye®
Terminator v3.1 Cycle Sequencing Kit (Applied Biosystems). The polymerase chain reaction (PCR)
was first developed by Mullis & Faloona (Mullis & Faloona, 1987). The sequencing PCR reaction was
purified by ethanol precipitation (addition of 1µl 125 mM EDTA, 1µl 3M sodium acetate, and 50 µl
100% ethanol on ice, centrifugation at 16.000 g for 15 min, washing once with 70 % ethanol, and
resuspension of the product in 15 µl Hi-Dye formamide). The sequencing of the PCR product was then
done in the department of developmental biochemistry (Ernst Caspari Haus, Goettingen, Germany).
The sequences were analysed using the BioEdit software.

3 METHODS 31
Table 3-10: Setup of the sequencing PCR
Reagent Final Conc.
Plasmid 200-400ng
Seq-buffer (kit) 1,5 µl
Seq-mix (kit) 1,5 µl
Primer 8 pmol
ddH2O adjust to 10 µl
Cycling: 96°C, 10 sec / 55°C, 15 sec / 60°C, 4 min for 25 cycles
3.2.1.2 Cloning of Dusp18 in pIRES
The following experimental procedure was performed by Franziska Schmidt. We previously
cloned Dusp18 cDNA in the pIRES vector (Invitrogen) for creating the stable U2OS cell lines. The
coding region of Dusp18 was amplified by PCR (Table 3-11) using the previously generated pCGN-
Dusp18 plasmid as a template and primers with NotI (forward) or BamHI (reverse) restriction sites.
The reverse primer contained the HA tag sequence upstream of the restriction site (the primers are
included in Table 2-5). The PCR fragment was purified using QIAquick® PCR Purification Kit
(Qiagen). The vector and the PCR product were digested with BamHI and NotI to create the ligation
sites (Table 3-12). After restriction digestion, the enzymes were inactivated by incubating the reactions
at 80°C for 30 min.
Table 3-11: Reaction setup for the PCR amplification of Dusp18 II
Reagent Stock conc. Volume (µl) Final conc.
ddH2O 37,5 -
Pfu reaction buffer 10x 5,0 1x
dNTPs 20 mM 0,5 200 µM
DNA template 100 ng/µl 1,0 100 ng
Primer Fwd 5 µM 2,5 250 nM
Primer Rev 5 µM 2,5 250 nM
Pfu Turbo Polymerase 2,5 U/µl 1,0 2,5 U
Cycling: 95°C, 2 min.; 30 times {95°C, 30 sec; 58°C,30 sec; 72°C, 1 min}; 72°C, 10 min.
Table 3-12: Setup of the restriction digestion reaction for the cloning of Dusp18 in pIRES
insert DNA vector
DNA PCR product (10 µl) 3 µg (5,35 µl)
NotI (10 U/µl) 2 µl (20 U) 2 µl (20 U)
BamHI (10 U/µl) 1 µl (10 U) 1 µl (10 U)
10x BamHI buffer 2 µl (1x) 2 µl (1x)
water 5 µl 9,65 µl
Final volume 20 µl 20 µl
Incubation time: 4 h at 37°C.
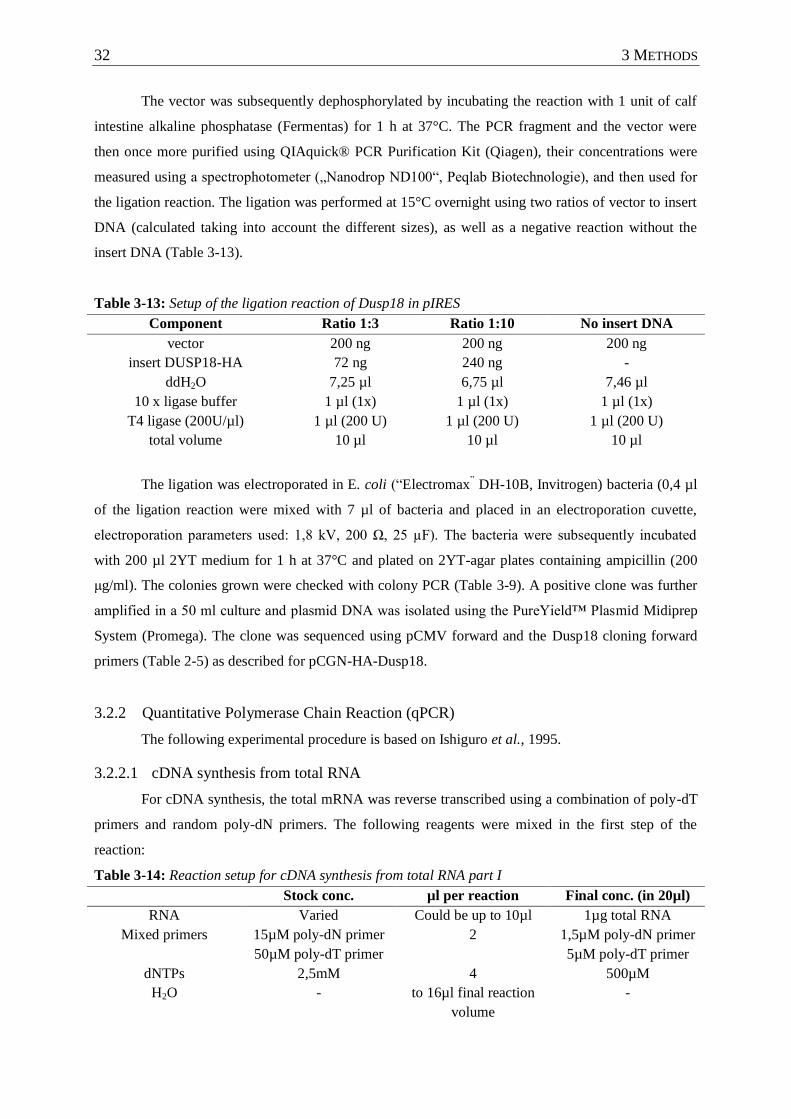
32 3 METHODS
The vector was subsequently dephosphorylated by incubating the reaction with 1 unit of calf
intestine alkaline phosphatase (Fermentas) for 1 h at 37°C. The PCR fragment and the vector were
then once more purified using QIAquick® PCR Purification Kit (Qiagen), their concentrations were
measured using a spectrophotometer („Nanodrop ND100“, Peqlab Biotechnologie), and then used for
the ligation reaction. The ligation was performed at 15°C overnight using two ratios of vector to insert
DNA (calculated taking into account the different sizes), as well as a negative reaction without the
insert DNA (Table 3-13).
Table 3-13: Setup of the ligation reaction of Dusp18 in pIRES
Component Ratio 1:3 Ratio 1:10 No insert DNA
vector 200 ng 200 ng 200 ng
insert DUSP18-HA 72 ng 240 ng -
ddH2O 7,25 µl 6,75 µl 7,46 µl
10 x ligase buffer 1 µl (1x) 1 µl (1x) 1 µl (1x)
T4 ligase (200U/µl) 1 µl (200 U) 1 µl (200 U) 1 µl (200 U)
total volume 10 µl 10 µl 10 µl
The ligation was electroporated in E. coli (“Electromax” DH-10B, Invitrogen) bacteria (0,4 µl
of the ligation reaction were mixed with 7 µl of bacteria and placed in an electroporation cuvette,
electroporation parameters used: 1,8 kV, 200 Ω, 25 µF). The bacteria were subsequently incubated
with 200 µl 2YT medium for 1 h at 37°C and plated on 2YT-agar plates containing ampicillin (200
μg/ml). The colonies grown were checked with colony PCR (Table 3-9). A positive clone was further
amplified in a 50 ml culture and plasmid DNA was isolated using the PureYield™ Plasmid Midiprep
System (Promega). The clone was sequenced using pCMV forward and the Dusp18 cloning forward
primers (Table 2-5) as described for pCGN-HA-Dusp18.
3.2.2 Quantitative Polymerase Chain Reaction (qPCR)
The following experimental procedure is based on Ishiguro et al., 1995.
3.2.2.1 cDNA synthesis from total RNA
For cDNA synthesis, the total mRNA was reverse transcribed using a combination of poly-dT
primers and random poly-dN primers. The following reagents were mixed in the first step of the
reaction:
Table 3-14: Reaction setup for cDNA synthesis from total RNA part I
Stock conc. µl per reaction Final conc. (in 20µl)
RNA Varied Could be up to 10µl 1µg total RNA
Mixed primers 15µM poly-dN primer
50µM poly-dT primer
2 1,5µM poly-dN primer
5µM poly-dT primer
dNTPs 2,5mM 4 500µM
H2O - to 16µl final reaction
volume
-

3 METHODS 33
The mix was heated at 70°C for 5 min to resolve the secondary structures of the RNA and then
briefly cooled to 12°C to allow primer annealing. The following reagents were added in the second
step of the reaction:
Table 3-15: Reaction setup for cDNA synthesis from total RNA part II
Stock conc. µl per reaction Final conc. (in 20µl)
M-MuLV RT Reaction
Buffer
10x 2 1x
RNAse Inhibitor 40 U/µl 0,25 10 U
M-MuLV Reverse
Transcriptase
200 U/µl 0,125 25 U
H2O - 1,625 -
The reverse transcription was done at 42°C for 1 hour and the enzyme was subsequently
inactivated at 95°C for 5min. Control reactions without the reverse transcriptase were also performed
to check each sample for genomic DNA contamination. Each reaction was diluted with RNAse-free
water to a final volume of 50µl and the cDNA was stored at -20°C or used directly for qPCR.
3.2.2.2 Quantitative PCR
3.2.2.2.1 Preparation of qPCR homemade mastermix:
Table 3-16: Preparation of home-made 10x PCR mix
Component Stock Conc. For 10ml Final Conc.
Tris-HCl pH8.8 1,5M (in H2O) 5 ml 750 mM
(NH4)2SO4 1M (in H2O) 2 ml 200 mM
Tween-20 10% (in H2O) 100 µl 0,1%
H2O 2,9 ml
Table 3-17: Preparation of home-made qPCR Mastermix
Component Stock Conc.
µl for 1 sample
(14µl)
µl for 1000
samples (14ml) Final Conc.
Home-made 10x
PCR mix
10x 2,5 2500 1x
MgCl 25 mM (in H2O) 3 3000 3 mM
SyBR green 1:800 (in DMSO) 0,2504 250,4 1:80.000
dNTPs 20 mM
(each, in H2O)
0,25 250 0,2 mM
Taq polymerase 5 U/µl 0,1 100 20 U/ml
Triton X-100 10% (in H2O) 0,625 625 0,25%
Trehalose 1 M (in 10mM Tris-
HCl pH 8.5)
7,5 7500 300 mM
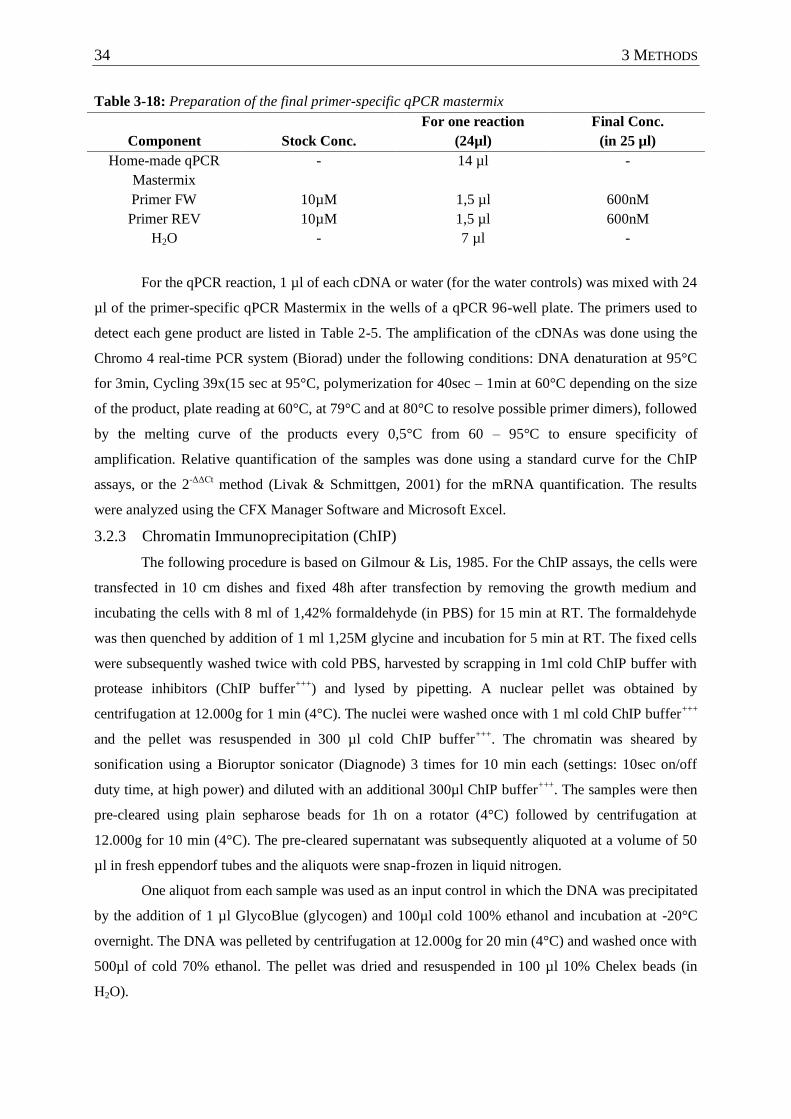
34 3 METHODS
Table 3-18: Preparation of the final primer-specific qPCR mastermix
Component Stock Conc.
For one reaction
(24µl)
Final Conc.
(in 25 µl)
Home-made qPCR
Mastermix
- 14 µl -
Primer FW 10µM 1,5 µl 600nM
Primer REV 10µM 1,5 µl 600nM
H2O - 7 µl -
For the qPCR reaction, 1 µl of each cDNA or water (for the water controls) was mixed with 24
µl of the primer-specific qPCR Mastermix in the wells of a qPCR 96-well plate. The primers used to
detect each gene product are listed in Table 2-5. The amplification of the cDNAs was done using the
Chromo 4 real-time PCR system (Biorad) under the following conditions: DNA denaturation at 95°C
for 3min, Cycling 39x(15 sec at 95°C, polymerization for 40sec – 1min at 60°C depending on the size
of the product, plate reading at 60°C, at 79°C and at 80°C to resolve possible primer dimers), followed
by the melting curve of the products every 0,5°C from 60 – 95°C to ensure specificity of
amplification. Relative quantification of the samples was done using a standard curve for the ChIP
assays, or the 2-ΔΔCt
method (Livak & Schmittgen, 2001) for the mRNA quantification. The results
were analyzed using the CFX Manager Software and Microsoft Excel.
3.2.3 Chromatin Immunoprecipitation (ChIP)
The following procedure is based on Gilmour & Lis, 1985. For the ChIP assays, the cells were
transfected in 10 cm dishes and fixed 48h after transfection by removing the growth medium and
incubating the cells with 8 ml of 1,42% formaldehyde (in PBS) for 15 min at RT. The formaldehyde
was then quenched by addition of 1 ml 1,25M glycine and incubation for 5 min at RT. The fixed cells
were subsequently washed twice with cold PBS, harvested by scrapping in 1ml cold ChIP buffer with
protease inhibitors (ChIP buffer+++
) and lysed by pipetting. A nuclear pellet was obtained by
centrifugation at 12.000g for 1 min (4°C). The nuclei were washed once with 1 ml cold ChIP buffer+++
and the pellet was resuspended in 300 µl cold ChIP buffer+++
. The chromatin was sheared by
sonification using a Bioruptor sonicator (Diagnode) 3 times for 10 min each (settings: 10sec on/off
duty time, at high power) and diluted with an additional 300µl ChIP buffer+++
. The samples were then
pre-cleared using plain sepharose beads for 1h on a rotator (4°C) followed by centrifugation at
12.000g for 10 min (4°C). The pre-cleared supernatant was subsequently aliquoted at a volume of 50
µl in fresh eppendorf tubes and the aliquots were snap-frozen in liquid nitrogen.
One aliquot from each sample was used as an input control in which the DNA was precipitated
by the addition of 1 µl GlycoBlue (glycogen) and 100µl cold 100% ethanol and incubation at -20°C
overnight. The DNA was pelleted by centrifugation at 12.000g for 20 min (4°C) and washed once with
500µl of cold 70% ethanol. The pellet was dried and resuspended in 100 µl 10% Chelex beads (in
H2O).
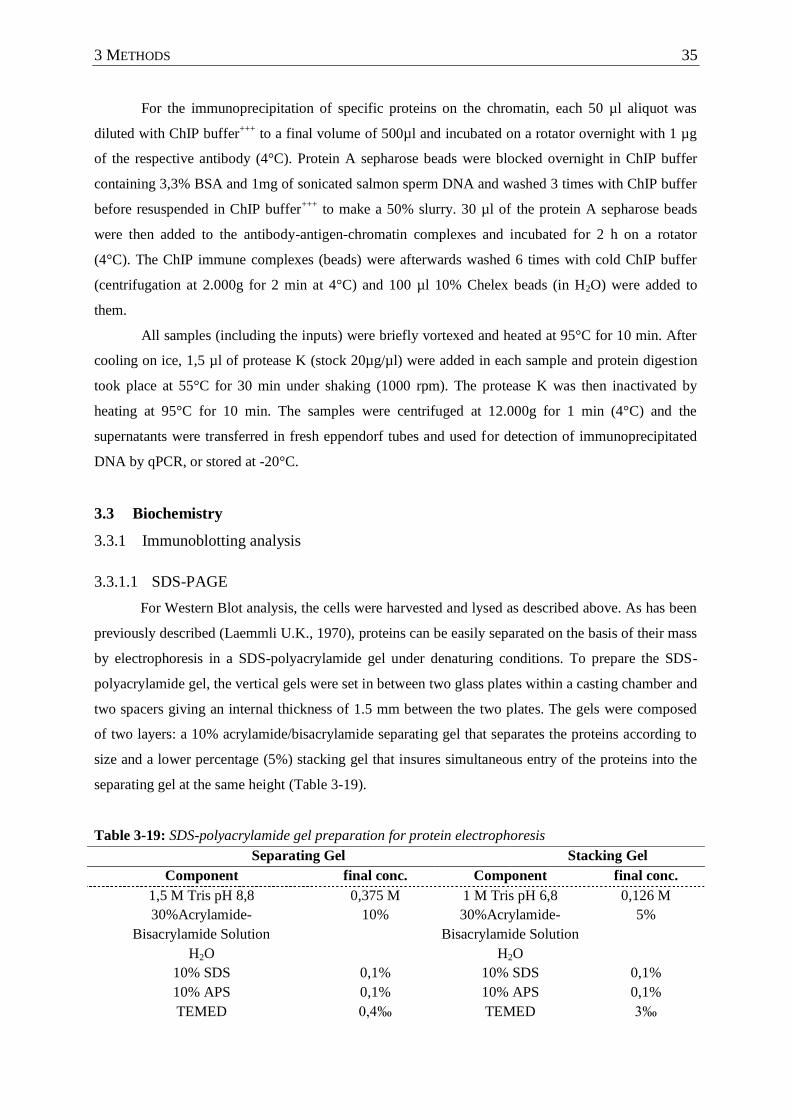
3 METHODS 35
For the immunoprecipitation of specific proteins on the chromatin, each 50 µl aliquot was
diluted with ChIP buffer+++
to a final volume of 500µl and incubated on a rotator overnight with 1 µg
of the respective antibody (4°C). Protein A sepharose beads were blocked overnight in ChIP buffer
containing 3,3% BSA and 1mg of sonicated salmon sperm DNA and washed 3 times with ChIP buffer
before resuspended in ChIP buffer+++
to make a 50% slurry. 30 µl of the protein A sepharose beads
were then added to the antibody-antigen-chromatin complexes and incubated for 2 h on a rotator
(4°C). The ChIP immune complexes (beads) were afterwards washed 6 times with cold ChIP buffer
(centrifugation at 2.000g for 2 min at 4°C) and 100 µl 10% Chelex beads (in H2O) were added to
them.
All samples (including the inputs) were briefly vortexed and heated at 95°C for 10 min. After
cooling on ice, 1,5 µl of protease K (stock 20µg/µl) were added in each sample and protein digestion
took place at 55°C for 30 min under shaking (1000 rpm). The protease K was then inactivated by
heating at 95°C for 10 min. The samples were centrifuged at 12.000g for 1 min (4°C) and the
supernatants were transferred in fresh eppendorf tubes and used for detection of immunoprecipitated
DNA by qPCR, or stored at -20°C.
3.3 Biochemistry
3.3.1 Immunoblotting analysis
3.3.1.1 SDS-PAGE
For Western Blot analysis, the cells were harvested and lysed as described above. As has been
previously described (Laemmli U.K., 1970), proteins can be easily separated on the basis of their mass
by electrophoresis in a SDS-polyacrylamide gel under denaturing conditions. To prepare the SDS-
polyacrylamide gel, the vertical gels were set in between two glass plates within a casting chamber and
two spacers giving an internal thickness of 1.5 mm between the two plates. The gels were composed
of two layers: a 10% acrylamide/bisacrylamide separating gel that separates the proteins according to
size and a lower percentage (5%) stacking gel that insures simultaneous entry of the proteins into the
separating gel at the same height (Table 3-19).
Table 3-19: SDS-polyacrylamide gel preparation for protein electrophoresis
Separating Gel Stacking Gel
Component final conc. Component final conc.
1,5 M Tris pH 8,8 0,375 M 1 M Tris pH 6,8 0,126 M
30%Acrylamide-
Bisacrylamide Solution
10% 30%Acrylamide-
Bisacrylamide Solution
5%
H2O H2O
10% SDS 0,1% 10% SDS 0,1%
10% APS 0,1% 10% APS 0,1%
TEMED 0,4‰ TEMED 3‰
36 3 METHODS
The separating gel was poured in between the two glass plates, leaving a space of about 1,7 cm
and 300 µl of isopropanol was then added to the surface of the gel to exclude air bubbles. After the
separating gel was polymerized, the isopropanol was removed. The stacking gel was then poured on
top of the separating gel, the comb inserted and the gel was allowed to polymerize. The samples were
loaded into the wells of the gel and electrophoresis buffer was added last to the chamber and any air
bubbles expelled. SDS-PAGE was performed using 15mA through the stacking gel and 18-20mA
through the separating gel. The negatively charged SDS-protein complexes migrate in the direction of
the anode at the bottom of the gel.
3.3.1.2 Immunoblotting (Western Blotting)
This method of protein detection was first developed by Renart et al (1979) and by Towbin et
al (1979). After separating the protein samples by SDS-PAGE, they were transferred to a
nitrocellulose membrane using the wet transfer apparatus (Biorad). The stacking gel and the sides of
running gel were removed beyond the sample wells with a razor blade and the gel was equilibrated
with wet transfer buffer. The PVDF transfer membrane was soaked in 100% methanol for one minute
and equilibrated in wet transfer buffer for a few minutes. Additionally six pieces of Whatman filter
paper and 3 wet transfer sponges were soaked in wet transfer buffer. Two sponges followed by three
Whatman paper pieces were placed on the red part of the cassette that is then placed towards the
anode. Then the transfer membrane was placed on top of filter paper stack. The gel was placed on top
of the PVDF membrane. The other three pieces of filter paper and the last sponge were placed on top
of the gel. A clean plastic tube was rolled on top of the stack to exclude any air bubbles. Then the
black part of the cassette was placed on top of the transfer stack and the cassette was closed firmly.
The transfer chamber was filled completely with wet transfer buffer and the cassette was placed with
the red towards the anode. The transfer was performed at 85V for 120 min. The pre-stained molecular
weight protein ladder served as an indication of successful transfer.
3.3.1.3 Immunostaining
For detection of our protein of interest on the PVDF membrane, the membrane was first
blocked in freshly prepared PBS-T containing 5% nonfat dry milk (blocking buffer) for 1 h at room
temperature with constant agitation. The primary antibody was diluted at 1:1000 in blocking buffer
and used for incubation of the membrane overnight (12-16 h) at 4°C with agitation. The membrane
was then washed three times with PBS-T, each time for 10 min. The anti-mouse peroxidase-
conjugated secondary antibody was diluted in blocking buffer, added to the membrane and incubated
at RT for 1h. The membrane was then washed briefly three times with PBS-T, and with blocking
solution for 15 min twice. For the phosphor-specific antibodies, 5% BSA was used instead of milk
(due to the competing phosphates of milk casein) and TBS instead of PBS.
Finally the membranes were covered with an enhanced chemiluminescence solution
containing the peroxidase substrates (SuperSignal West Dura Extended Duration Substrate, Pierce)
3 METHODS 37
and incubated for approximately 1 min before measuring the luminescence signal. For low intensity
signals a more sensitive detection system was used (SuperSignal West Femto Maximum Sensitivity
Substrate, Pierce). The chemiluminescence reaction is catalyzed by the peroxidase that is conjugated
on the secondary antibody (oxidation of luminol), and leads to the emission of photons. The
membrane was covered in plastic film and luminescence was detected using a chemiluminescence
imaging system (INTAS). When necessary, relative quantification of the protein bands was performed
using the Lab1D software (INTAS).
3.3.2 Coimmunoprecipitation (CoIP)
For CoIP the cells were transfected in 10 cm dishes. The cells were harvested by scrapping
and pelleted by centrifugation at 800 rcf for 8 min. The cell lysis was done in 1 ml cold CoIP buffer
with protease inhibitors (CoIP buffer++
) by homogenization using a 26G syringe (0,45mm diameter).
The lysates were then centrifuged at 16.000g for 15 min (4°C) to pellet the cell debris, and the
supernatant was transferred in fresh eppendorf tubes and pre-cleared with 50µl of plain sepharose
beads for 1h on a rotator (4°C). A combination of protein G sepharose (10µl per sample) and plain
sepharose beads (40µl) was combined with 1 µg of each antibody and incubated for 1h on a rotator
(4°C). After pre-clearing, 30µl of each sample were kept as an input control and the rest was divided
among the antibody-sepharose beads complexes. The antibody-antigen reaction took place for 2h on a
rotator (4°C). The complexes (beads) were subsequently washed 10 times with 800 µl CoIP buffer++
(the first two times) or CoIP buffer (centrifugation at 2000g, for 2 min each time, 4°C). 25µl of
6xLaemmli solution were added in each sample followed by incubation at 95°C for 5 min for protein
denaturation. The samples were stored at -20°C or used directly for immunoblotting.
3.4 Human phosphatase siRNA library screening
3.4.1 Transfection of U2OS cells with the phosphatase library siRNAs
Osteosarcoma U2OS cells (wt p53) were transfected with the human phosphatase Silencer
Select siRNA library (Applied Biosystems) in BD immunofluorescence 96well plates using the
Biomek 3000 automation workstation (Beckmann). Each phosphatase subunit was targeted by 3
different siRNAs in separate plates. Therefore for each set of targets there were 3 plates transfected
targeting the same phosphatases with different siRNAs (A, B and C), and the transfection for each set
was done twice, once for mock irradiation and once for exposing to 20 J/m² UVC. For each well (1
siRNA per well), 4,5 pmol (in 9 µl) of each siRNA were combined with 26 µl of plain DMEM
medium. For each well, 0,25 µl Lipofectamine 2000 were mixed with 14,75 µl plain DMEM medium
and incubated for 5 min at RT (prepared as a mastermix). The Lipofectamine 2000 mastermix was
then aliquoted in the wells and the siRNAs were added, mixed and the transfection mix was incubated
for 20 at RT. Finally, the U2OS cells were added (7.000 cells per well, in 100 µl complete medium).
The cells were incubated with the transfection mix for 48 h to allow for mRNA degradation and

38 3 METHODS
irradiated with UVC or mock treated (as described in §3.1.5). 2,5 h after irradiation the cells were
fixed and stained as described below.
3.4.2 Fixation and immunofluorescence staining of the U2OS cells
For fixation, the medium was completely removed carefully from the wells and the cells were
incubated in 100 µl of 3,7% Formaldehyde (in PBS++
) for 20 min (RT). After washing twice with
PBS++
, the cells were permeabilized with 100 µl 0,5% Triton-X-100 (in PBS++
) for 10 min (RT). The
Triton-X-100 solution was removed, the cells washed 4 times with PBS++
and blocked with 10% FCS
(in PBS++
) for 10 min (RT). The primary antibodies solution (10% FCS), containing the FL393 anti-
p53 (rabbit, polyclonal, dilution: 1:300) and the anti-γH2Ax (phosphor-Ser139, mouse, monoclonal,
dilution: 1:1850) was then added in the wells (70 µl per well). After 1 h incubation at RT, the cells
were washed three times with PBS++
(the last time for 5 min) and the secondary antibodies solution
(10% FCS), containing the Alexa-488 anti-rabbit (dilution: 1:550 – green fluorescence), the Alexa-546
anti-mouse (dilution: 1:550 – red fluorescence) and Hoechst DNA dye (Molecular Probes, stock
concentration: 1mg/ml, dilution: 1:5500 – blue fluorescence) was then added in the wells (70 µl per
well). After 45 min incubation at RT in the dark, the cells were washed three times with PBS++
(the
last time for 5 min) and fresh PBS++
was added in the wells. The wells were then covered with an
aluminum plate cover and the plates were stored at 4°C or directly imaged with the BD Pathway
automatic imaging system (BD Biosciences).
3.4.3 Imaging and data analysis
Images were collected from all the wells (each well representing a different siRNA) using the
BD Pathway automatic imaging system (BD Biosciences). The images were subsequently analyzed
with the BD Pathway software (BD Biosciences). Each image was first processed to identify the nuclei
in the well by using the Hoechst channel to generate a well mask, which could be used to measure the
fluorescence of the other two channels (p53 and γH2Ax) within each nucleus in a well. Two types of
data were then generated from these intensities: one was the average intensity of each signal for each
well (unconstrained data) and the other was the percentage of nuclei in each well that met an intensity
threshold (constrained data). The intensity threshold was defined separately for each plate. The
average intensity of the whole plate was used as an intensity threshold, as we assumed a random
distribution of the siRNAs in the plate that would result in an approximately equal number of up- and
down-regulators of our signal readouts. The threshold was such that the percentage of nuclei meeting
this constrain in the wells transfected with the control siRNAs was about 30%, and this did not vary
much among the different plates. Therefore this constraining of the data made the comparison of the
different plates possible, as the different sets of plates were transfected and immunostained on
different days, and the overall intensities moderately varied between the sets. The constrained data
were used then to generate a z-score for each targeted phosphatase subunit using the following
formula:

3 METHODS 39
where X is the mean of % constrained nuclei of the three siRNAs (A, B and C) targeting one
phosphatase subunit, µ is the mean of all the X values, and σ is the standard deviation of the X values.
All z-scores were then aligned in graphs for each readout, as shown in Results, and phosphatase
subunits with z-scores higher than 1 or lower than -1 were considered significant hits.
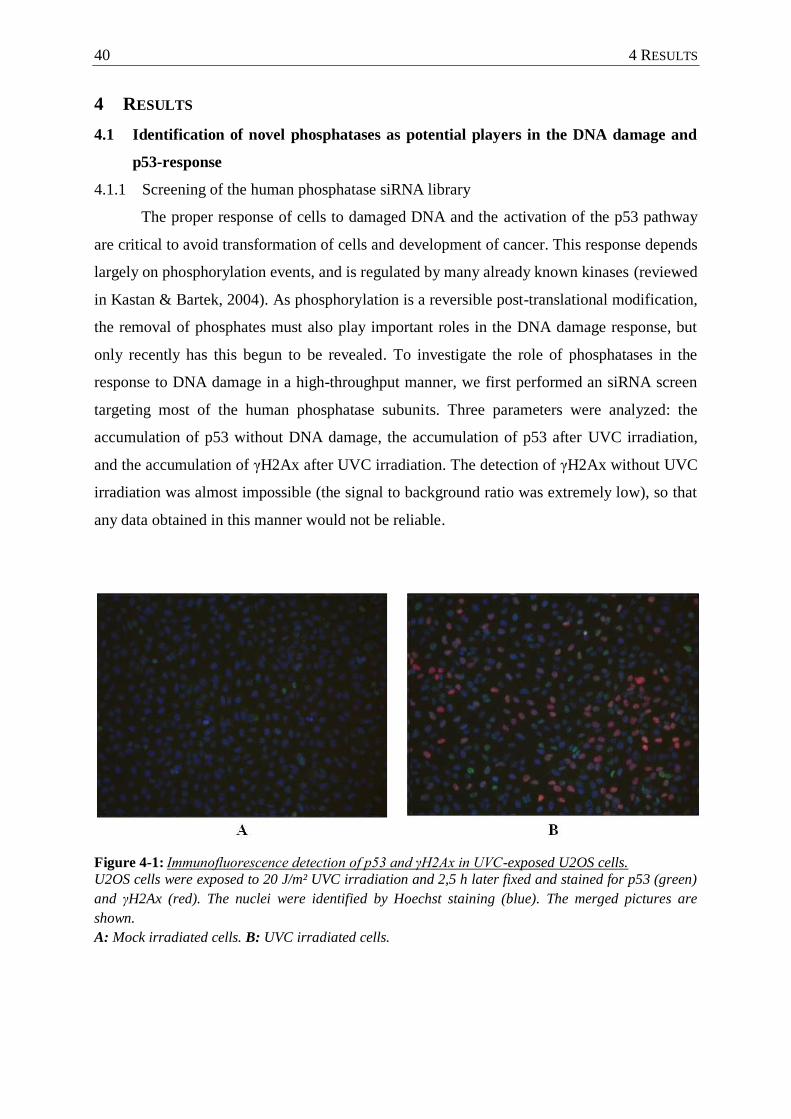
40 4 RESULTS
4 RESULTS
4.1 Identification of novel phosphatases as potential players in the DNA damage and
p53-response
4.1.1 Screening of the human phosphatase siRNA library
The proper response of cells to damaged DNA and the activation of the p53 pathway
are critical to avoid transformation of cells and development of cancer. This response depends
largely on phosphorylation events, and is regulated by many already known kinases (reviewed
in Kastan & Bartek, 2004). As phosphorylation is a reversible post-translational modification,
the removal of phosphates must also play important roles in the DNA damage response, but
only recently has this begun to be revealed. To investigate the role of phosphatases in the
response to DNA damage in a high-throughput manner, we first performed an siRNA screen
targeting most of the human phosphatase subunits. Three parameters were analyzed: the
accumulation of p53 without DNA damage, the accumulation of p53 after UVC irradiation,
and the accumulation of γH2Ax after UVC irradiation. The detection of γH2Ax without UVC
irradiation was almost impossible (the signal to background ratio was extremely low), so that
any data obtained in this manner would not be reliable.
Figure 4-1: Immunofluorescence detection of p53 and γH2Ax in UVC-exposed U2OS cells.
U2OS cells were exposed to 20 J/m² UVC irradiation and 2,5 h later fixed and stained for p53 (green)
and γH2Ax (red). The nuclei were identified by Hoechst staining (blue). The merged pictures are
shown.
A: Mock irradiated cells. B: UVC irradiated cells.
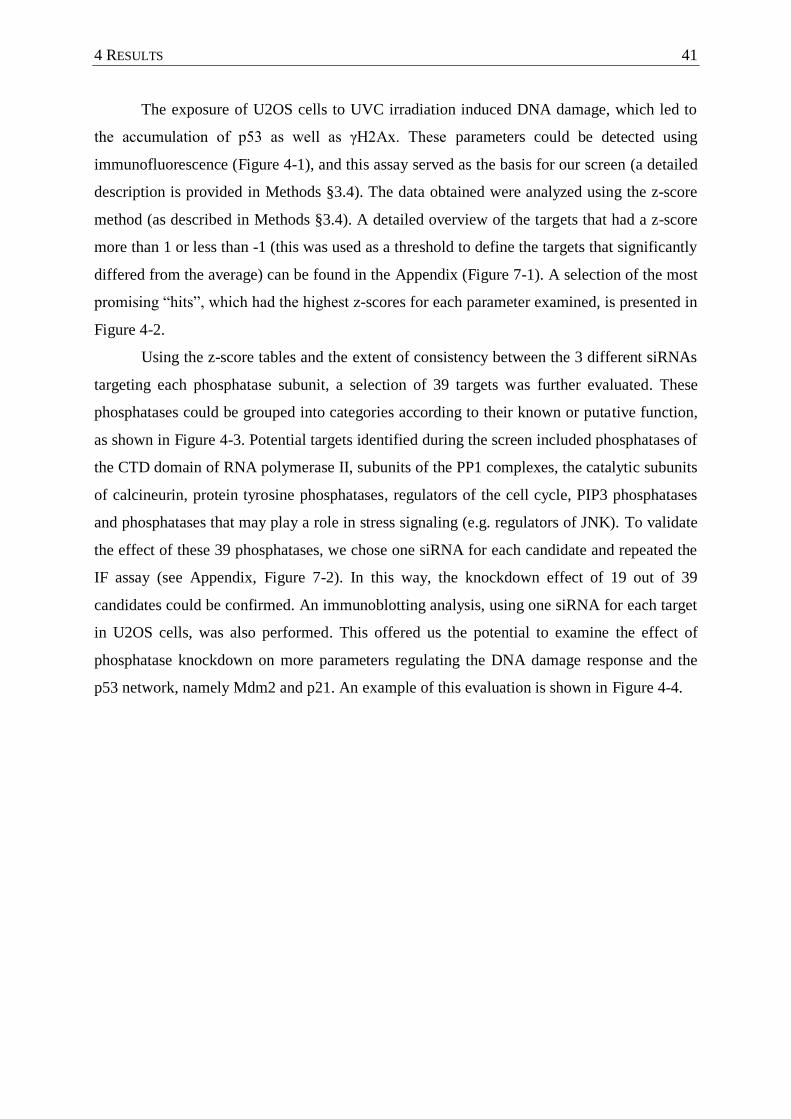
4 RESULTS 41
The exposure of U2OS cells to UVC irradiation induced DNA damage, which led to
the accumulation of p53 as well as γH2Ax. These parameters could be detected using
immunofluorescence (Figure 4-1), and this assay served as the basis for our screen (a detailed
description is provided in Methods §3.4). The data obtained were analyzed using the z-score
method (as described in Methods §3.4). A detailed overview of the targets that had a z-score
more than 1 or less than -1 (this was used as a threshold to define the targets that significantly
differed from the average) can be found in the Appendix (Figure 7-1). A selection of the most
promising “hits”, which had the highest z-scores for each parameter examined, is presented in
Figure 4-2.
Using the z-score tables and the extent of consistency between the 3 different siRNAs
targeting each phosphatase subunit, a selection of 39 targets was further evaluated. These
phosphatases could be grouped into categories according to their known or putative function,
as shown in Figure 4-3. Potential targets identified during the screen included phosphatases of
the CTD domain of RNA polymerase II, subunits of the PP1 complexes, the catalytic subunits
of calcineurin, protein tyrosine phosphatases, regulators of the cell cycle, PIP3 phosphatases
and phosphatases that may play a role in stress signaling (e.g. regulators of JNK). To validate
the effect of these 39 phosphatases, we chose one siRNA for each candidate and repeated the
IF assay (see Appendix, Figure 7-2). In this way, the knockdown effect of 19 out of 39
candidates could be confirmed. An immunoblotting analysis, using one siRNA for each target
in U2OS cells, was also performed. This offered us the potential to examine the effect of
phosphatase knockdown on more parameters regulating the DNA damage response and the
p53 network, namely Mdm2 and p21. An example of this evaluation is shown in Figure 4-4.
42 4 RESULTS
Figure 4-2: Human phosphatase siRNA library screen selected results.
The screen and the data analysis were performed as described in Methods (§3.4). The top condidates
(z-score > 1,5 or <-1,5) are displayed for upregulation (I) and downregulation (II) of each parameter
measured.
A: p53 signal in non-irradiated cells
B: p53 signal in UVC-irradiated cells
C: γH2Ax signal in UVC-irradiated cells
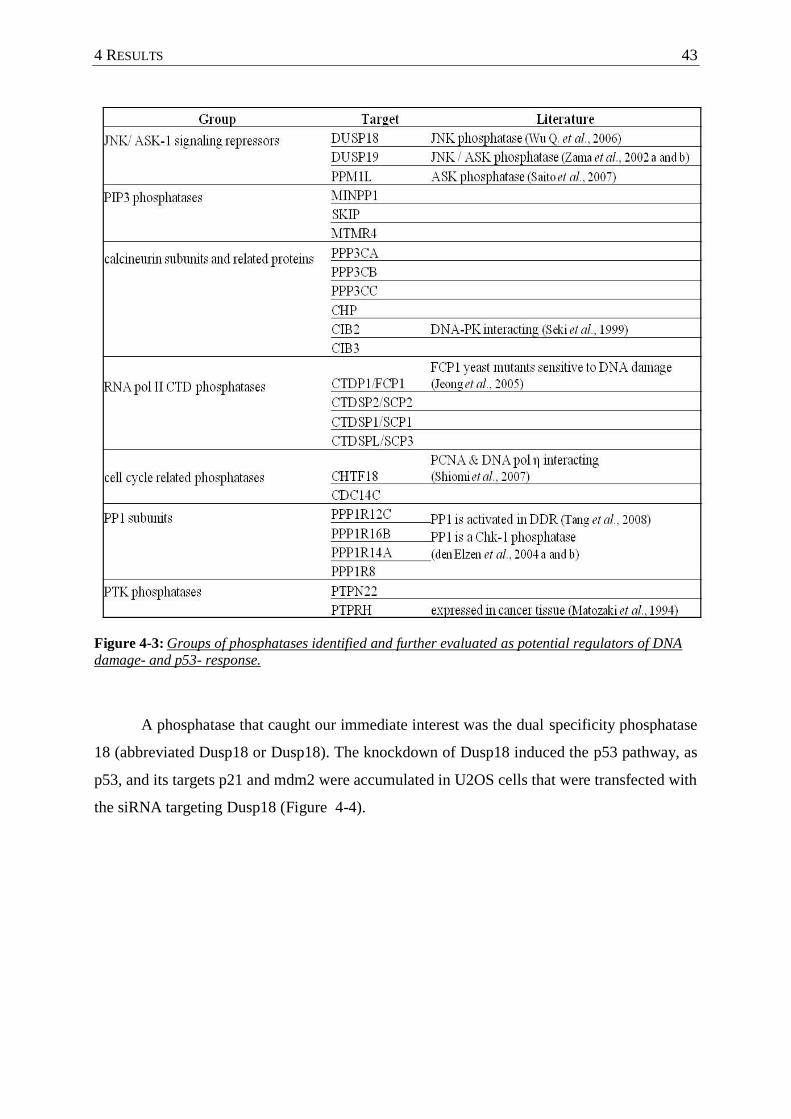
4 RESULTS 43
Figure 4-3: Groups of phosphatases identified and further evaluated as potential regulators of DNA
damage- and p53- response.
A phosphatase that caught our immediate interest was the dual specificity phosphatase
18 (abbreviated Dusp18 or Dusp18). The knockdown of Dusp18 induced the p53 pathway, as
p53, and its targets p21 and mdm2 were accumulated in U2OS cells that were transfected with
the siRNA targeting Dusp18 (Figure 4-4).
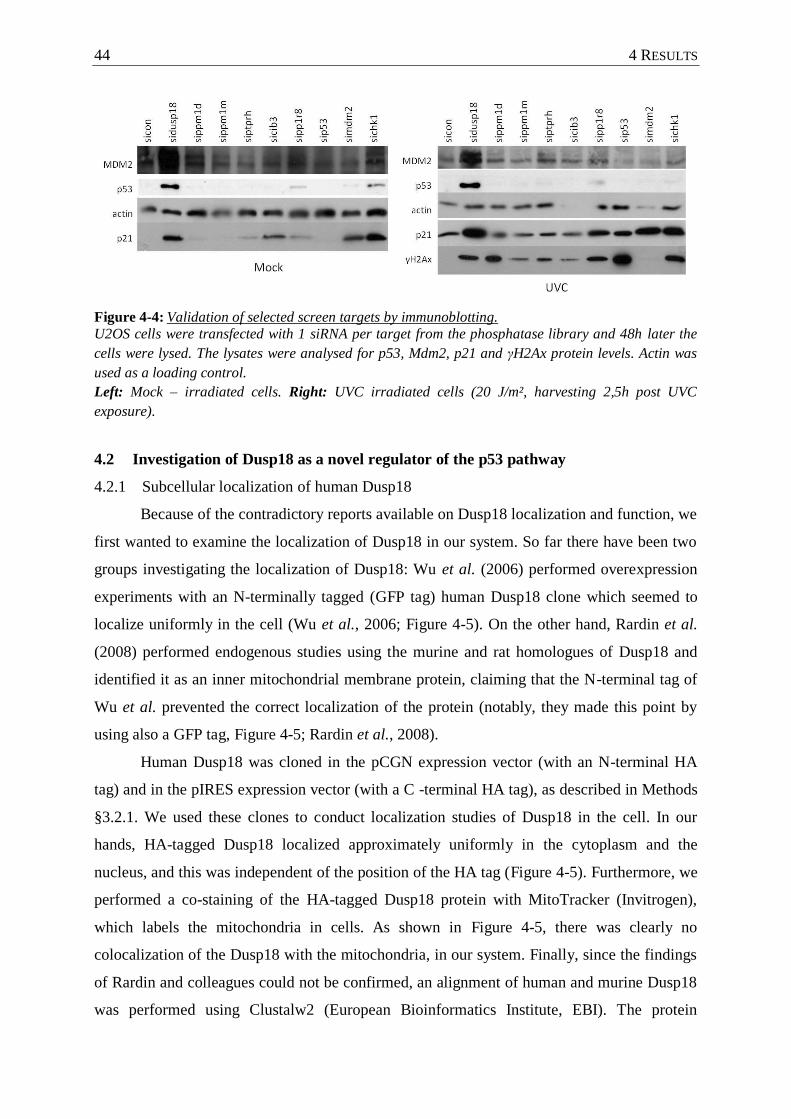
44 4 RESULTS
Figure 4-4: Validation of selected screen targets by immunoblotting.
U2OS cells were transfected with 1 siRNA per target from the phosphatase library and 48h later the
cells were lysed. The lysates were analysed for p53, Mdm2, p21 and γH2Ax protein levels. Actin was
used as a loading control.
Left: Mock – irradiated cells. Right: UVC irradiated cells (20 J/m², harvesting 2,5h post UVC
exposure).
4.2 Investigation of Dusp18 as a novel regulator of the p53 pathway
4.2.1 Subcellular localization of human Dusp18
Because of the contradictory reports available on Dusp18 localization and function, we
first wanted to examine the localization of Dusp18 in our system. So far there have been two
groups investigating the localization of Dusp18: Wu et al. (2006) performed overexpression
experiments with an N-terminally tagged (GFP tag) human Dusp18 clone which seemed to
localize uniformly in the cell (Wu et al., 2006; Figure 4-5). On the other hand, Rardin et al.
(2008) performed endogenous studies using the murine and rat homologues of Dusp18 and
identified it as an inner mitochondrial membrane protein, claiming that the N-terminal tag of
Wu et al. prevented the correct localization of the protein (notably, they made this point by
using also a GFP tag, Figure 4-5; Rardin et al., 2008).
Human Dusp18 was cloned in the pCGN expression vector (with an N-terminal HA
tag) and in the pIRES expression vector (with a C -terminal HA tag), as described in Methods
§3.2.1. We used these clones to conduct localization studies of Dusp18 in the cell. In our
hands, HA-tagged Dusp18 localized approximately uniformly in the cytoplasm and the
nucleus, and this was independent of the position of the HA tag (Figure 4-5). Furthermore, we
performed a co-staining of the HA-tagged Dusp18 protein with MitoTracker (Invitrogen),
which labels the mitochondria in cells. As shown in Figure 4-5, there was clearly no
colocalization of the Dusp18 with the mitochondria, in our system. Finally, since the findings
of Rardin and colleagues could not be confirmed, an alignment of human and murine Dusp18
was performed using Clustalw2 (European Bioinformatics Institute, EBI). The protein
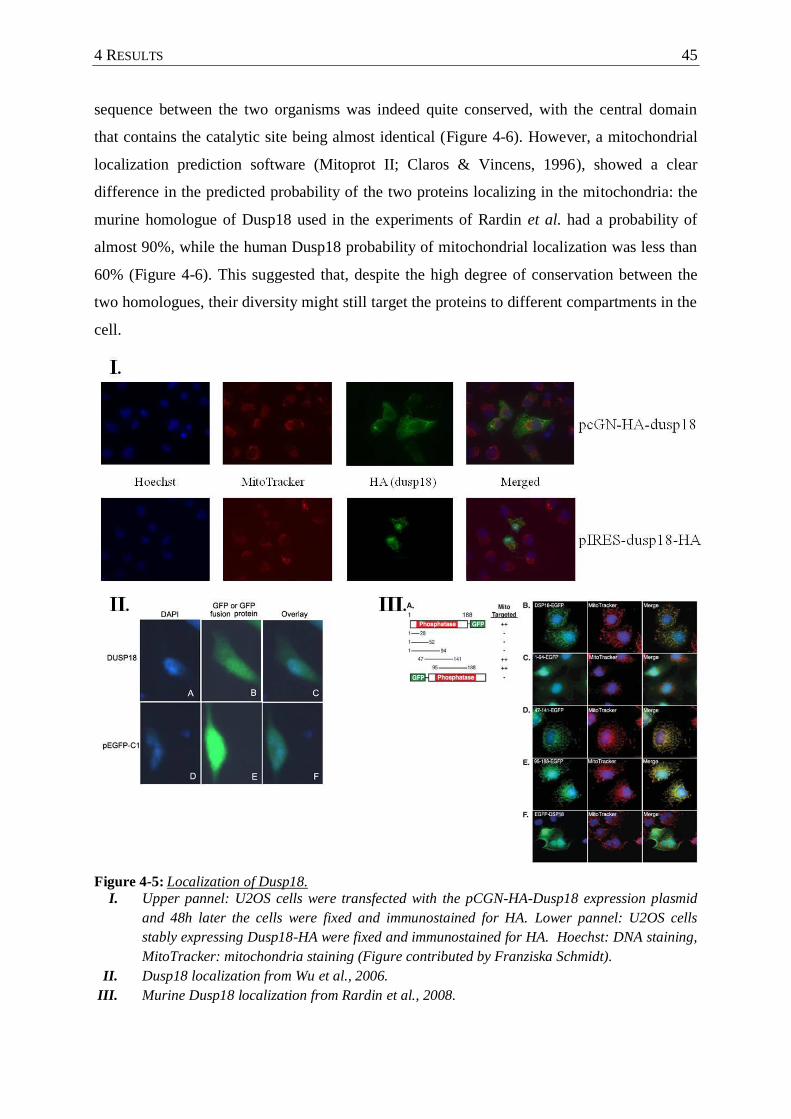
4 RESULTS 45
sequence between the two organisms was indeed quite conserved, with the central domain
that contains the catalytic site being almost identical (Figure 4-6). However, a mitochondrial
localization prediction software (Mitoprot II; Claros & Vincens, 1996), showed a clear
difference in the predicted probability of the two proteins localizing in the mitochondria: the
murine homologue of Dusp18 used in the experiments of Rardin et al. had a probability of
almost 90%, while the human Dusp18 probability of mitochondrial localization was less than
60% (Figure 4-6). This suggested that, despite the high degree of conservation between the
two homologues, their diversity might still target the proteins to different compartments in the
cell.
Figure 4-5: Localization of Dusp18.
I. Upper pannel: U2OS cells were transfected with the pCGN-HA-Dusp18 expression plasmid
and 48h later the cells were fixed and immunostained for HA. Lower pannel: U2OS cells
stably expressing Dusp18-HA were fixed and immunostained for HA. Hoechst: DNA staining,
MitoTracker: mitochondria staining (Figure contributed by Franziska Schmidt).
II. Dusp18 localization from Wu et al., 2006.
III. Murine Dusp18 localization from Rardin et al., 2008.
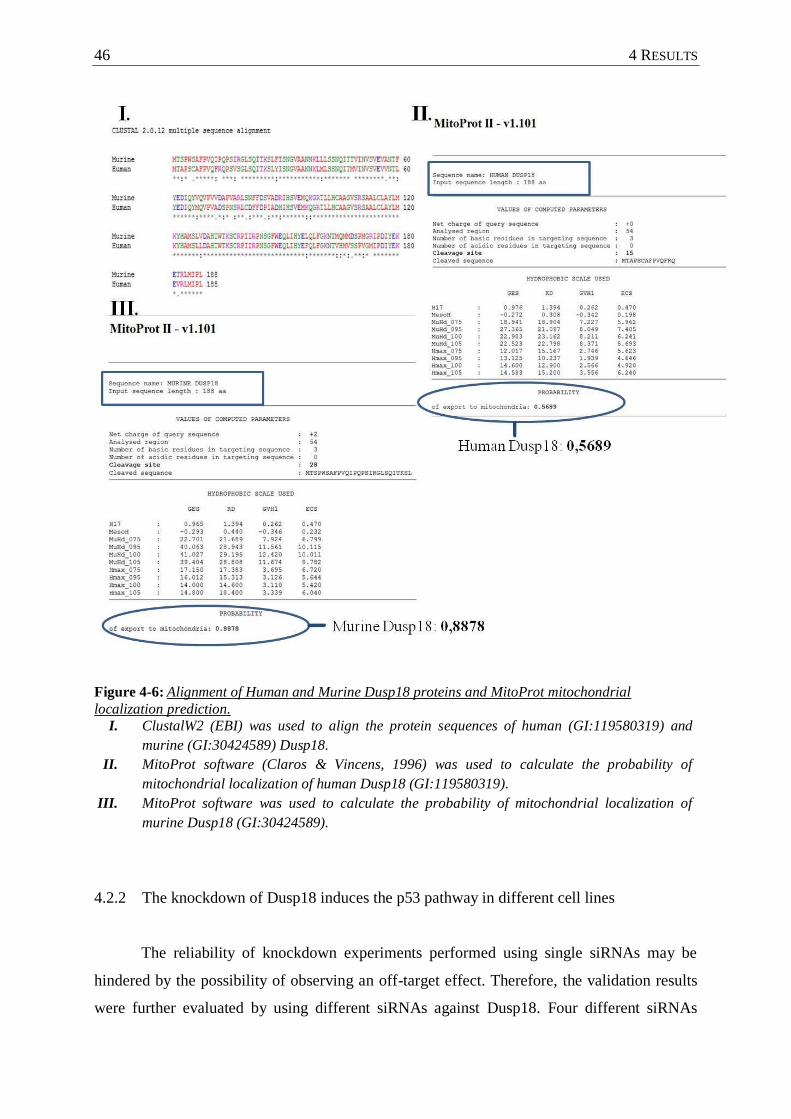
46 4 RESULTS
Figure 4-6: Alignment of Human and Murine Dusp18 proteins and MitoProt mitochondrial
localization prediction.
I. ClustalW2 (EBI) was used to align the protein sequences of human (GI:119580319) and
murine (GI:30424589) Dusp18.
II. MitoProt software (Claros & Vincens, 1996) was used to calculate the probability of
mitochondrial localization of human Dusp18 (GI:119580319).
III. MitoProt software was used to calculate the probability of mitochondrial localization of
murine Dusp18 (GI:30424589).
4.2.2 The knockdown of Dusp18 induces the p53 pathway in different cell lines
The reliability of knockdown experiments performed using single siRNAs may be
hindered by the possibility of observing an off-target effect. Therefore, the validation results
were further evaluated by using different siRNAs against Dusp18. Four different siRNAs
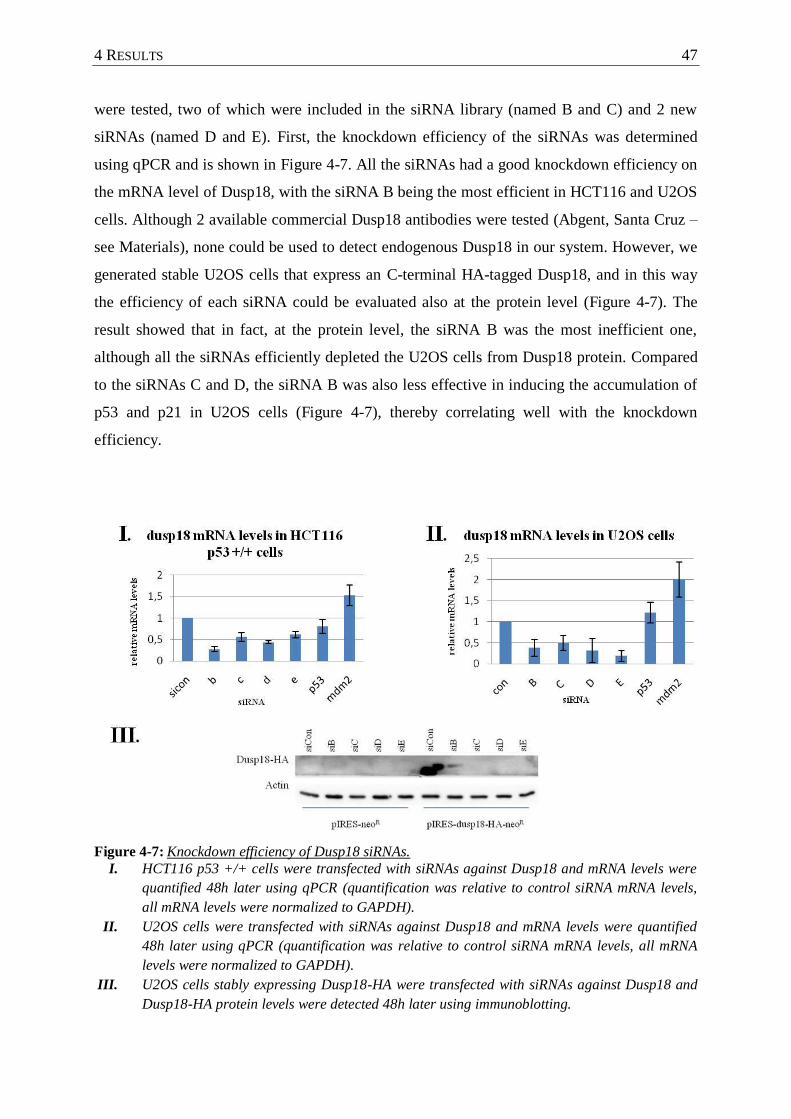
4 RESULTS 47
were tested, two of which were included in the siRNA library (named B and C) and 2 new
siRNAs (named D and E). First, the knockdown efficiency of the siRNAs was determined
using qPCR and is shown in Figure 4-7. All the siRNAs had a good knockdown efficiency on
the mRNA level of Dusp18, with the siRNA B being the most efficient in HCT116 and U2OS
cells. Although 2 available commercial Dusp18 antibodies were tested (Abgent, Santa Cruz –
see Materials), none could be used to detect endogenous Dusp18 in our system. However, we
generated stable U2OS cells that express an C-terminal HA-tagged Dusp18, and in this way
the efficiency of each siRNA could be evaluated also at the protein level (Figure 4-7). The
result showed that in fact, at the protein level, the siRNA B was the most inefficient one,
although all the siRNAs efficiently depleted the U2OS cells from Dusp18 protein. Compared
to the siRNAs C and D, the siRNA B was also less effective in inducing the accumulation of
p53 and p21 in U2OS cells (Figure 4-7), thereby correlating well with the knockdown
efficiency.
Figure 4-7: Knockdown efficiency of Dusp18 siRNAs.
I. HCT116 p53 +/+ cells were transfected with siRNAs against Dusp18 and mRNA levels were
quantified 48h later using qPCR (quantification was relative to control siRNA mRNA levels,
all mRNA levels were normalized to GAPDH).
II. U2OS cells were transfected with siRNAs against Dusp18 and mRNA levels were quantified
48h later using qPCR (quantification was relative to control siRNA mRNA levels, all mRNA
levels were normalized to GAPDH).
III. U2OS cells stably expressing Dusp18-HA were transfected with siRNAs against Dusp18 and
Dusp18-HA protein levels were detected 48h later using immunoblotting.
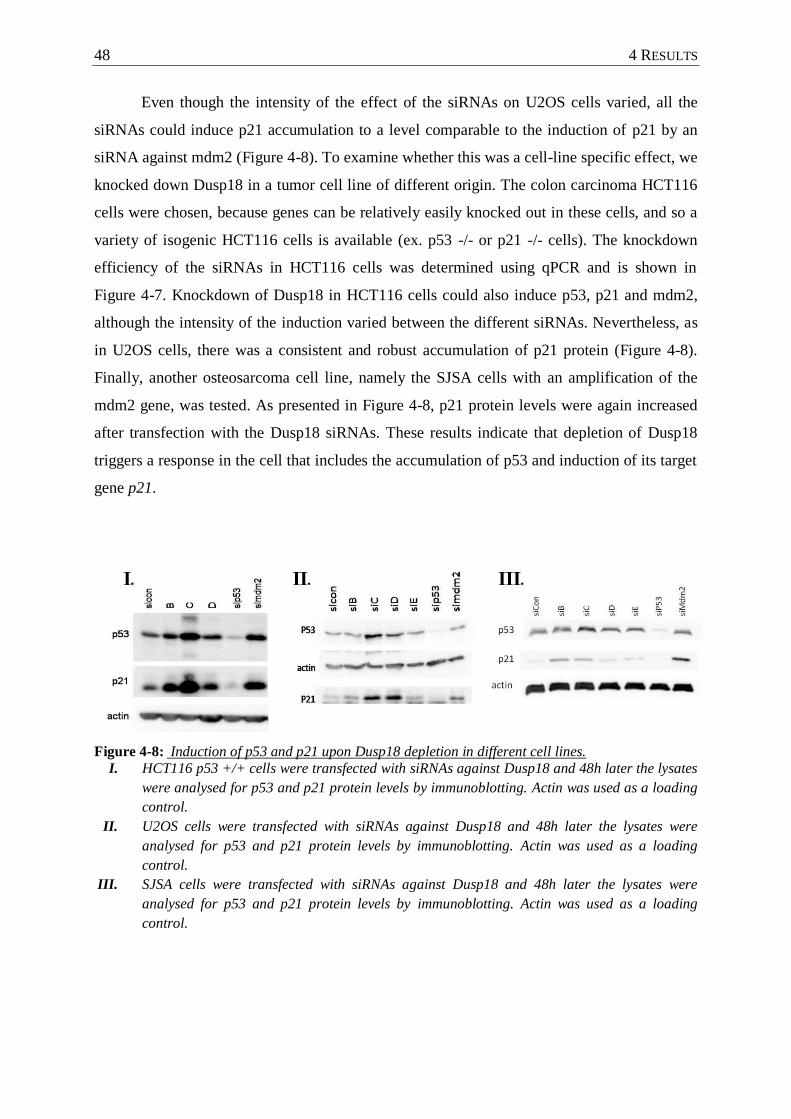
48 4 RESULTS
Even though the intensity of the effect of the siRNAs on U2OS cells varied, all the
siRNAs could induce p21 accumulation to a level comparable to the induction of p21 by an
siRNA against mdm2 (Figure 4-8). To examine whether this was a cell-line specific effect, we
knocked down Dusp18 in a tumor cell line of different origin. The colon carcinoma HCT116
cells were chosen, because genes can be relatively easily knocked out in these cells, and so a
variety of isogenic HCT116 cells is available (ex. p53 -/- or p21 -/- cells). The knockdown
efficiency of the siRNAs in HCT116 cells was determined using qPCR and is shown in
Figure 4-7. Knockdown of Dusp18 in HCT116 cells could also induce p53, p21 and mdm2,
although the intensity of the induction varied between the different siRNAs. Nevertheless, as
in U2OS cells, there was a consistent and robust accumulation of p21 protein (Figure 4-8).
Finally, another osteosarcoma cell line, namely the SJSA cells with an amplification of the
mdm2 gene, was tested. As presented in Figure 4-8, p21 protein levels were again increased
after transfection with the Dusp18 siRNAs. These results indicate that depletion of Dusp18
triggers a response in the cell that includes the accumulation of p53 and induction of its target
gene p21.
Figure 4-8: Induction of p53 and p21 upon Dusp18 depletion in different cell lines.
I. HCT116 p53 +/+ cells were transfected with siRNAs against Dusp18 and 48h later the lysates
were analysed for p53 and p21 protein levels by immunoblotting. Actin was used as a loading
control.
II. U2OS cells were transfected with siRNAs against Dusp18 and 48h later the lysates were
analysed for p53 and p21 protein levels by immunoblotting. Actin was used as a loading
control.
III. SJSA cells were transfected with siRNAs against Dusp18 and 48h later the lysates were
analysed for p53 and p21 protein levels by immunoblotting. Actin was used as a loading
control.
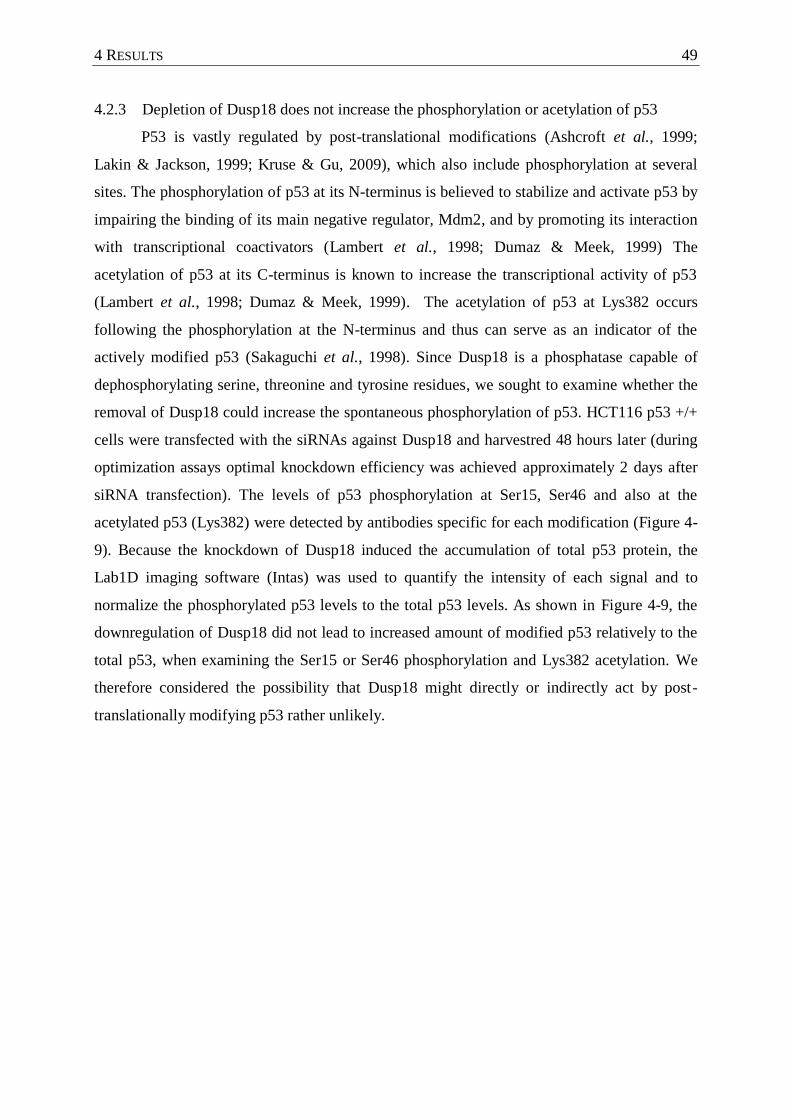
4 RESULTS 49
4.2.3 Depletion of Dusp18 does not increase the phosphorylation or acetylation of p53
P53 is vastly regulated by post-translational modifications (Ashcroft et al., 1999;
Lakin & Jackson, 1999; Kruse & Gu, 2009), which also include phosphorylation at several
sites. The phosphorylation of p53 at its N-terminus is believed to stabilize and activate p53 by
impairing the binding of its main negative regulator, Mdm2, and by promoting its interaction
with transcriptional coactivators (Lambert et al., 1998; Dumaz & Meek, 1999) The
acetylation of p53 at its C-terminus is known to increase the transcriptional activity of p53
(Lambert et al., 1998; Dumaz & Meek, 1999). The acetylation of p53 at Lys382 occurs
following the phosphorylation at the N-terminus and thus can serve as an indicator of the
actively modified p53 (Sakaguchi et al., 1998). Since Dusp18 is a phosphatase capable of
dephosphorylating serine, threonine and tyrosine residues, we sought to examine whether the
removal of Dusp18 could increase the spontaneous phosphorylation of p53. HCT116 p53 +/+
cells were transfected with the siRNAs against Dusp18 and harvestred 48 hours later (during
optimization assays optimal knockdown efficiency was achieved approximately 2 days after
siRNA transfection). The levels of p53 phosphorylation at Ser15, Ser46 and also at the
acetylated p53 (Lys382) were detected by antibodies specific for each modification (Figure 4-
9). Because the knockdown of Dusp18 induced the accumulation of total p53 protein, the
Lab1D imaging software (Intas) was used to quantify the intensity of each signal and to
normalize the phosphorylated p53 levels to the total p53 levels. As shown in Figure 4-9, the
downregulation of Dusp18 did not lead to increased amount of modified p53 relatively to the
total p53, when examining the Ser15 or Ser46 phosphorylation and Lys382 acetylation. We
therefore considered the possibility that Dusp18 might directly or indirectly act by post-
translationally modifying p53 rather unlikely.
50 4 RESULTS
Figure 4-9: p53 modification upon Dusp18 knockdown.
I. HCT116 p53 +/+ cells were transfected with siRNAs against Dusp18 and 48h later the lysates
were analysed for total p53 and modified p53 protein levels by immunoblotting. Actin was
used as a loading control.
II. Relative quantification of modified p53 levels with LabID (INTAS), normalized to total p53
levels.
III. Relative quantification of total p53 levels with LabID (INTAS).
4.2.4 The interaction of p53 with Mdm2 was not disrupted upon Dusp18 knockdown
The main negative regulator of p53 is the ubiquitin E3 ligase Mdm2, which binds and
targets the p53 protein for proteasome-dependent degradation. Hence we hypothesized that
Dusp18 knockdown might interfere with the function of Mdm2, and thus induce the
accumulation and activation of p53. Assessing the cellular levels of Mdm2 protein after
depletion of Dusp18 was complicated, because the activation of p53 can induce the
transcription of mdm2 (Appendix, Figure 7-3). As the binding of p53 by Mdm2 is necessary
for Mdm2-dependent downregulation of p53, the interaction of the two proteins was
investigated by Coimmunoprecipitation (CoIP). This experiment was performed using the
osteosarcoma SJSA cells, because they carry an mdm2 amplification, and thus have increased
amounts of Mdm2 protein. P21 protein was increased by Dusp18 depletion in these cells more
profoundly by the siRNAs siB and siC than with the other siRNAs (Figure 4-8), so these two
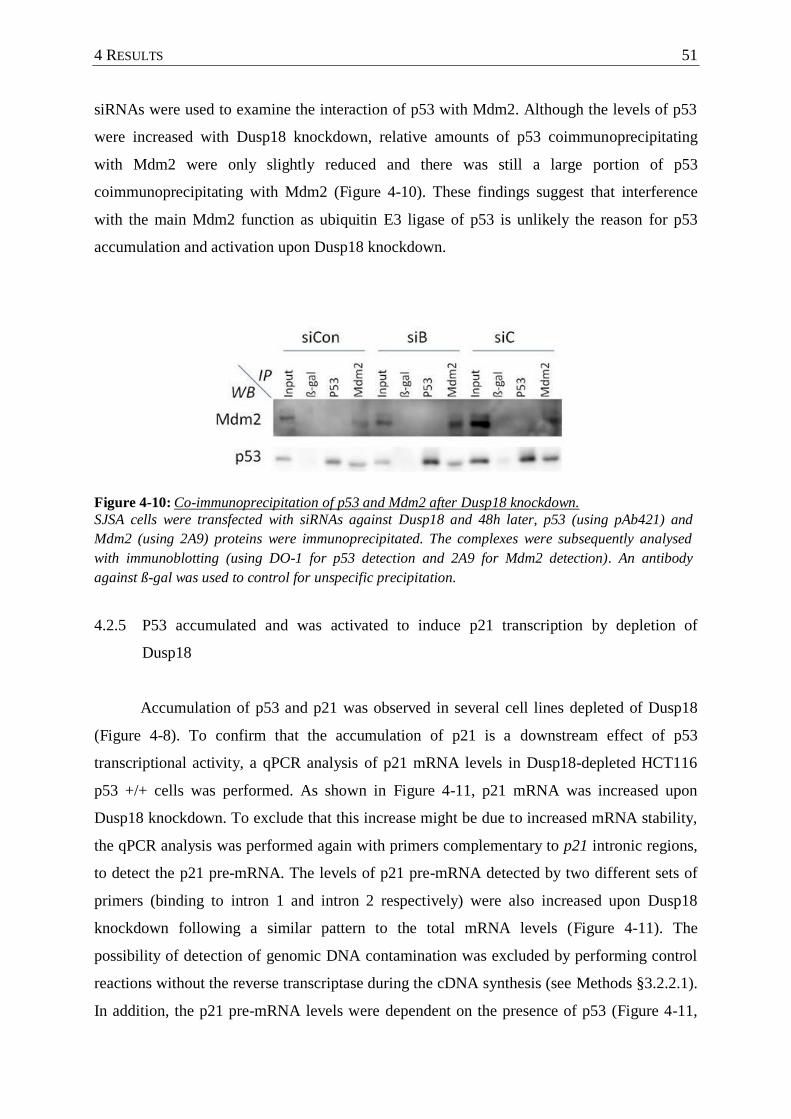
4 RESULTS 51
siRNAs were used to examine the interaction of p53 with Mdm2. Although the levels of p53
were increased with Dusp18 knockdown, relative amounts of p53 coimmunoprecipitating
with Mdm2 were only slightly reduced and there was still a large portion of p53
coimmunoprecipitating with Mdm2 (Figure 4-10). These findings suggest that interference
with the main Mdm2 function as ubiquitin E3 ligase of p53 is unlikely the reason for p53
accumulation and activation upon Dusp18 knockdown.
Figure 4-10: Co-immunoprecipitation of p53 and Mdm2 after Dusp18 knockdown.
SJSA cells were transfected with siRNAs against Dusp18 and 48h later, p53 (using pAb421) and
Mdm2 (using 2A9) proteins were immunoprecipitated. The complexes were subsequently analysed
with immunoblotting (using DO-1 for p53 detection and 2A9 for Mdm2 detection). An antibody
against ß-gal was used to control for unspecific precipitation.
4.2.5 P53 accumulated and was activated to induce p21 transcription by depletion of
Dusp18
Accumulation of p53 and p21 was observed in several cell lines depleted of Dusp18
(Figure 4-8). To confirm that the accumulation of p21 is a downstream effect of p53
transcriptional activity, a qPCR analysis of p21 mRNA levels in Dusp18-depleted HCT116
p53 +/+ cells was performed. As shown in Figure 4-11, p21 mRNA was increased upon
Dusp18 knockdown. To exclude that this increase might be due to increased mRNA stability,
the qPCR analysis was performed again with primers complementary to p21 intronic regions,
to detect the p21 pre-mRNA. The levels of p21 pre-mRNA detected by two different sets of
primers (binding to intron 1 and intron 2 respectively) were also increased upon Dusp18
knockdown following a similar pattern to the total mRNA levels (Figure 4-11). The
possibility of detection of genomic DNA contamination was excluded by performing control
reactions without the reverse transcriptase during the cDNA synthesis (see Methods §3.2.2.1).
In addition, the p21 pre-mRNA levels were dependent on the presence of p53 (Figure 4-11,
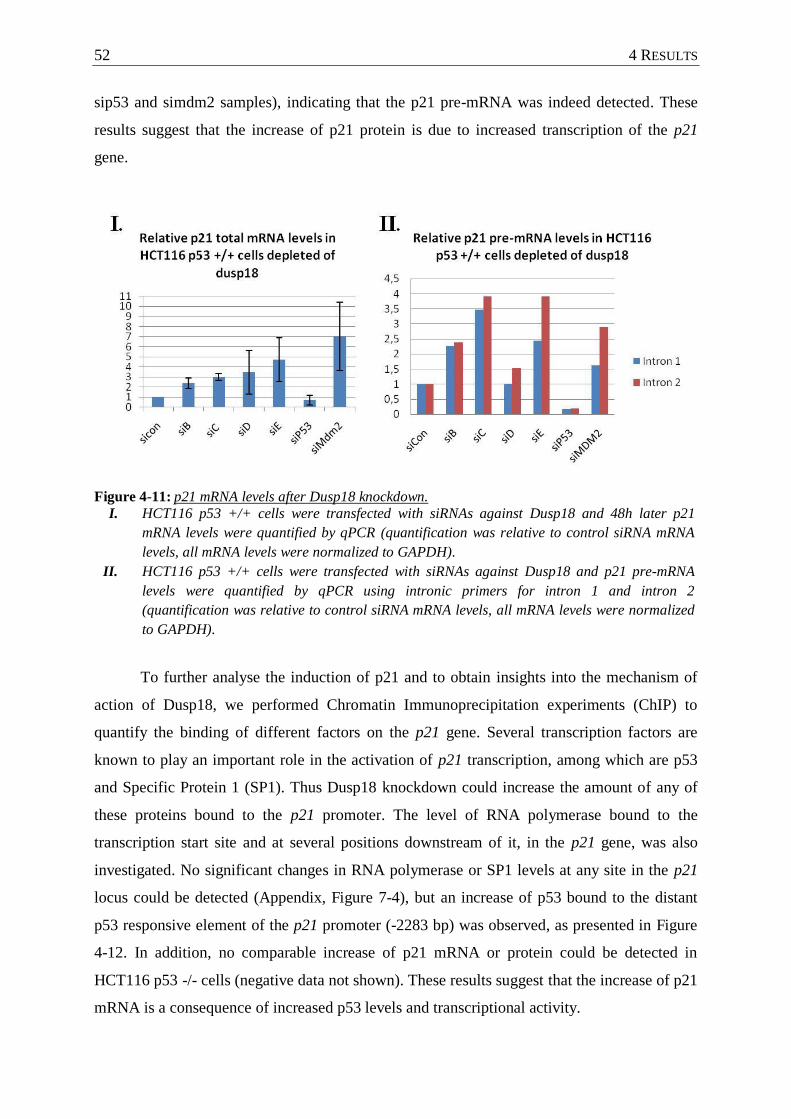
52 4 RESULTS
sip53 and simdm2 samples), indicating that the p21 pre-mRNA was indeed detected. These
results suggest that the increase of p21 protein is due to increased transcription of the p21
gene.
Figure 4-11: p21 mRNA levels after Dusp18 knockdown.
I. HCT116 p53 +/+ cells were transfected with siRNAs against Dusp18 and 48h later p21
mRNA levels were quantified by qPCR (quantification was relative to control siRNA mRNA
levels, all mRNA levels were normalized to GAPDH).
II. HCT116 p53 +/+ cells were transfected with siRNAs against Dusp18 and p21 pre-mRNA
levels were quantified by qPCR using intronic primers for intron 1 and intron 2
(quantification was relative to control siRNA mRNA levels, all mRNA levels were normalized
to GAPDH).
To further analyse the induction of p21 and to obtain insights into the mechanism of
action of Dusp18, we performed Chromatin Immunoprecipitation experiments (ChIP) to
quantify the binding of different factors on the p21 gene. Several transcription factors are
known to play an important role in the activation of p21 transcription, among which are p53
and Specific Protein 1 (SP1). Thus Dusp18 knockdown could increase the amount of any of
these proteins bound to the p21 promoter. The level of RNA polymerase bound to the
transcription start site and at several positions downstream of it, in the p21 gene, was also
investigated. No significant changes in RNA polymerase or SP1 levels at any site in the p21
locus could be detected (Appendix, Figure 7-4), but an increase of p53 bound to the distant
p53 responsive element of the p21 promoter (-2283 bp) was observed, as presented in Figure
4-12. In addition, no comparable increase of p21 mRNA or protein could be detected in
HCT116 p53 -/- cells (negative data not shown). These results suggest that the increase of p21
mRNA is a consequence of increased p53 levels and transcriptional activity.
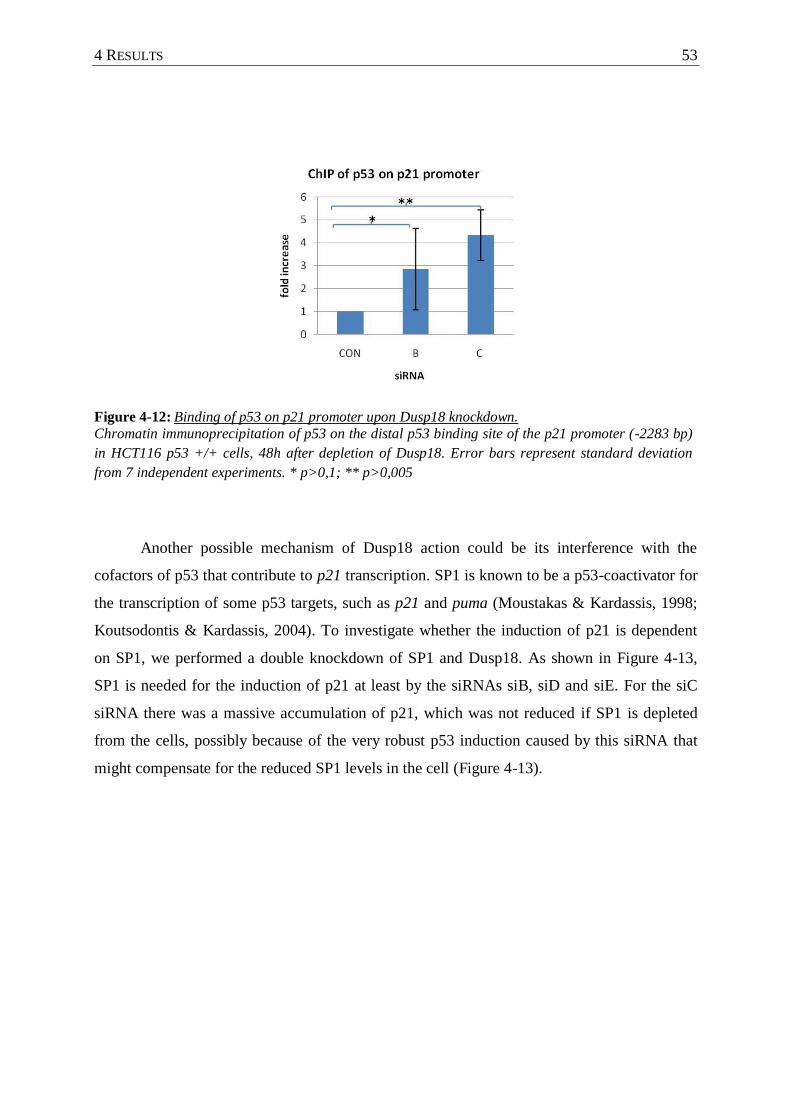
4 RESULTS 53
Figure 4-12: Binding of p53 on p21 promoter upon Dusp18 knockdown.
Chromatin immunoprecipitation of p53 on the distal p53 binding site of the p21 promoter (-2283 bp)
in HCT116 p53 +/+ cells, 48h after depletion of Dusp18. Error bars represent standard deviation
from 7 independent experiments. * p>0,1; ** p>0,005
Another possible mechanism of Dusp18 action could be its interference with the
cofactors of p53 that contribute to p21 transcription. SP1 is known to be a p53-coactivator for
the transcription of some p53 targets, such as p21 and puma (Moustakas & Kardassis, 1998;
Koutsodontis & Kardassis, 2004). To investigate whether the induction of p21 is dependent
on SP1, we performed a double knockdown of SP1 and Dusp18. As shown in Figure 4-13,
SP1 is needed for the induction of p21 at least by the siRNAs siB, siD and siE. For the siC
siRNA there was a massive accumulation of p21, which was not reduced if SP1 is depleted
from the cells, possibly because of the very robust p53 induction caused by this siRNA that
might compensate for the reduced SP1 levels in the cell (Figure 4-13).
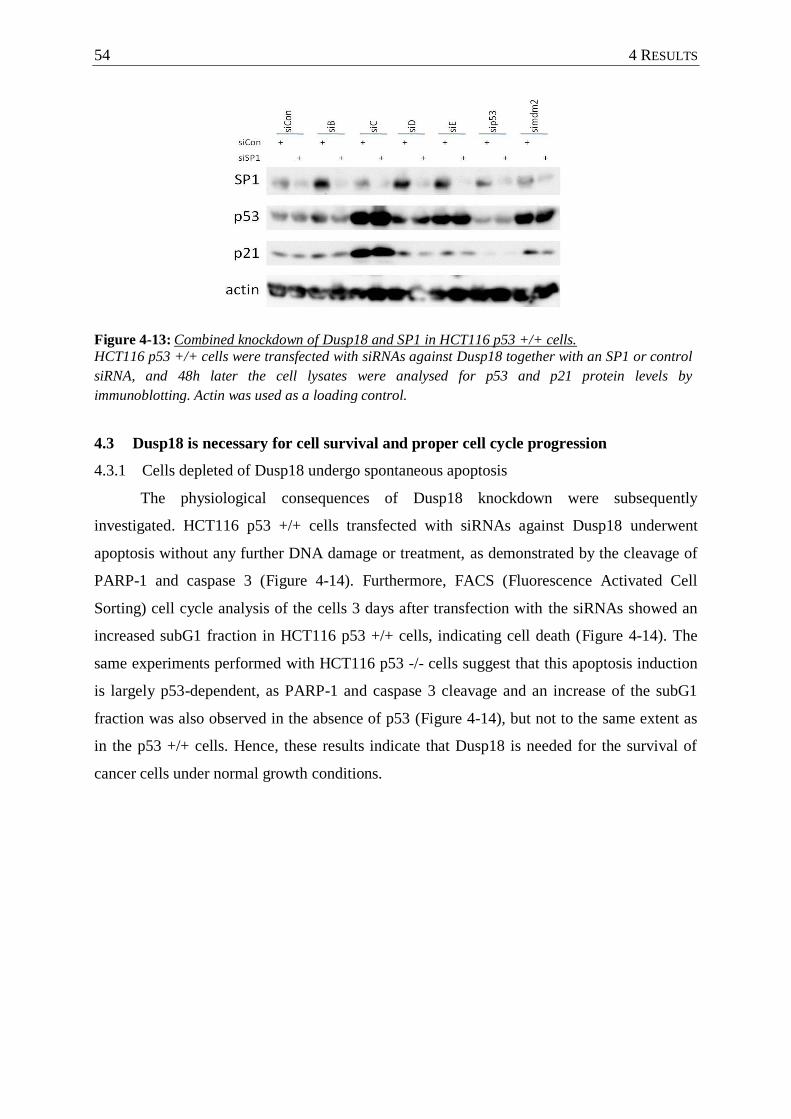
54 4 RESULTS
Figure 4-13: Combined knockdown of Dusp18 and SP1 in HCT116 p53 +/+ cells.
HCT116 p53 +/+ cells were transfected with siRNAs against Dusp18 together with an SP1 or control
siRNA, and 48h later the cell lysates were analysed for p53 and p21 protein levels by
immunoblotting. Actin was used as a loading control.
4.3 Dusp18 is necessary for cell survival and proper cell cycle progression
4.3.1 Cells depleted of Dusp18 undergo spontaneous apoptosis
The physiological consequences of Dusp18 knockdown were subsequently
investigated. HCT116 p53 +/+ cells transfected with siRNAs against Dusp18 underwent
apoptosis without any further DNA damage or treatment, as demonstrated by the cleavage of
PARP-1 and caspase 3 (Figure 4-14). Furthermore, FACS (Fluorescence Activated Cell
Sorting) cell cycle analysis of the cells 3 days after transfection with the siRNAs showed an
increased subG1 fraction in HCT116 p53 +/+ cells, indicating cell death (Figure 4-14). The
same experiments performed with HCT116 p53 -/- cells suggest that this apoptosis induction
is largely p53-dependent, as PARP-1 and caspase 3 cleavage and an increase of the subG1
fraction was also observed in the absence of p53 (Figure 4-14), but not to the same extent as
in the p53 +/+ cells. Hence, these results indicate that Dusp18 is needed for the survival of
cancer cells under normal growth conditions.
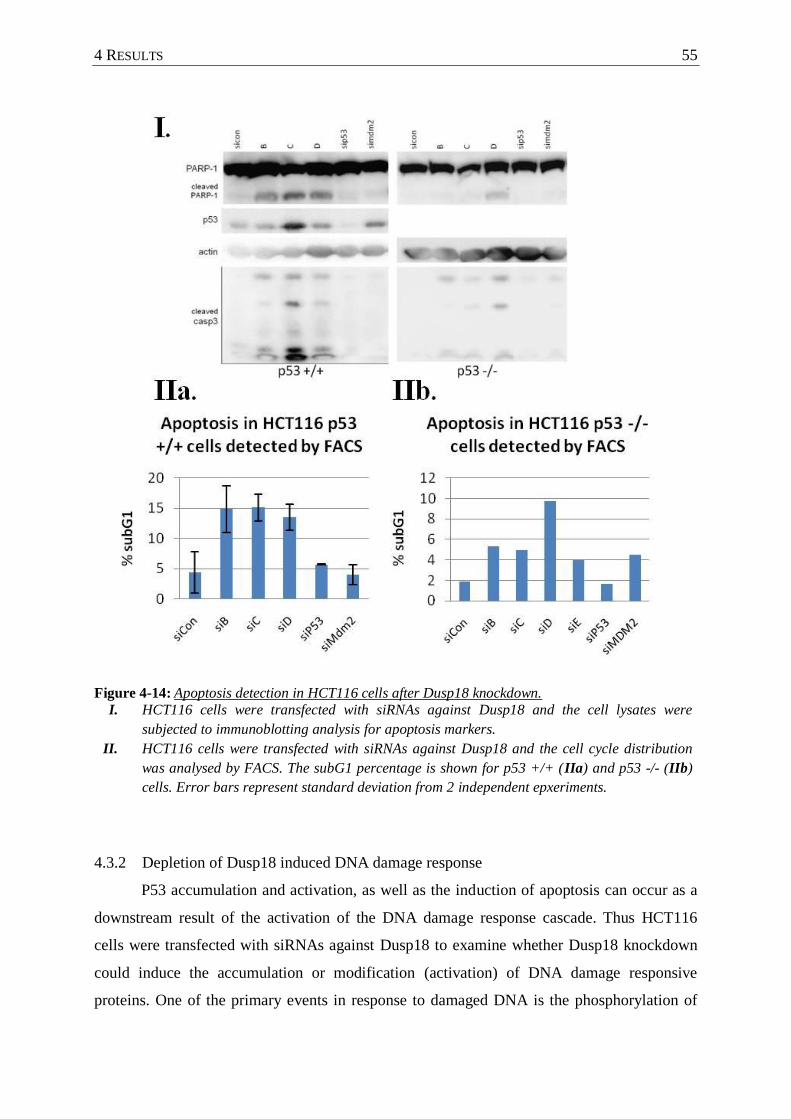
4 RESULTS 55
Figure 4-14: Apoptosis detection in HCT116 cells after Dusp18 knockdown.
I. HCT116 cells were transfected with siRNAs against Dusp18 and the cell lysates were
subjected to immunoblotting analysis for apoptosis markers.
II. HCT116 cells were transfected with siRNAs against Dusp18 and the cell cycle distribution
was analysed by FACS. The subG1 percentage is shown for p53 +/+ (IIa) and p53 -/- (IIb)
cells. Error bars represent standard deviation from 2 independent epxeriments.
4.3.2 Depletion of Dusp18 induced DNA damage response
P53 accumulation and activation, as well as the induction of apoptosis can occur as a
downstream result of the activation of the DNA damage response cascade. Thus HCT116
cells were transfected with siRNAs against Dusp18 to examine whether Dusp18 knockdown
could induce the accumulation or modification (activation) of DNA damage responsive
proteins. One of the primary events in response to damaged DNA is the phosphorylation of
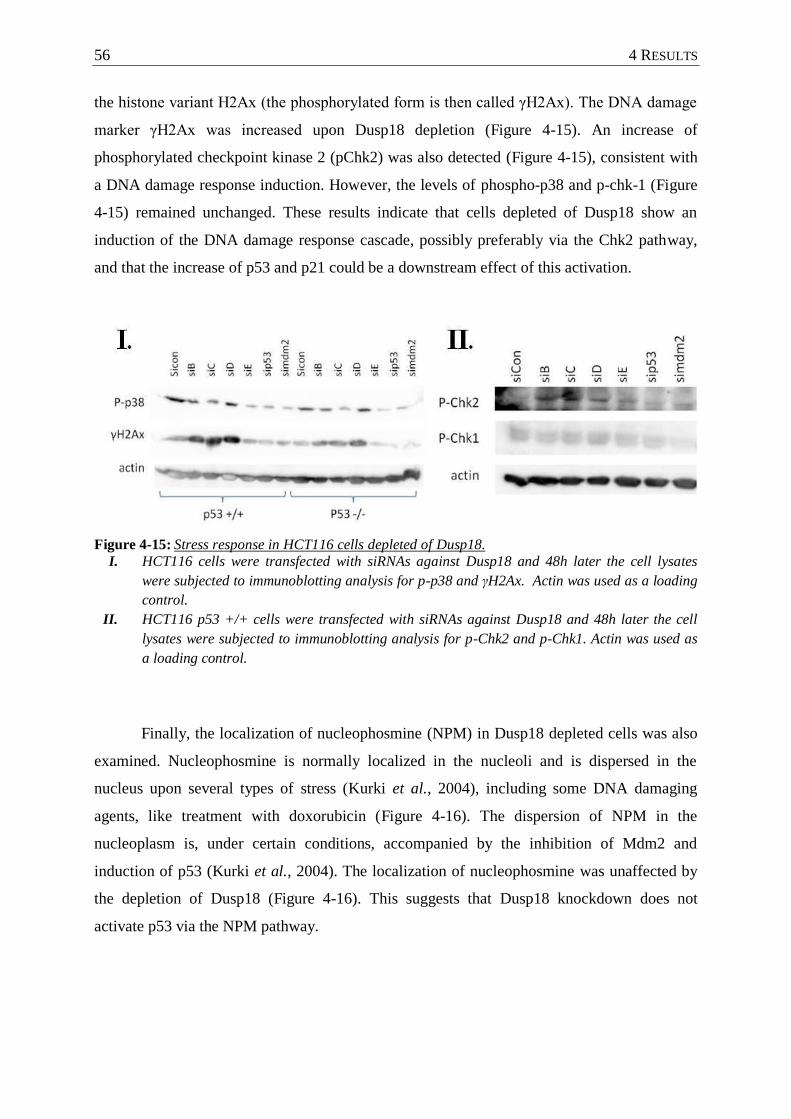
56 4 RESULTS
the histone variant H2Ax (the phosphorylated form is then called γH2Ax). The DNA damage
marker γH2Ax was increased upon Dusp18 depletion (Figure 4-15). An increase of
phosphorylated checkpoint kinase 2 (pChk2) was also detected (Figure 4-15), consistent with
a DNA damage response induction. However, the levels of phospho-p38 and p-chk-1 (Figure
4-15) remained unchanged. These results indicate that cells depleted of Dusp18 show an
induction of the DNA damage response cascade, possibly preferably via the Chk2 pathway,
and that the increase of p53 and p21 could be a downstream effect of this activation.
Figure 4-15: Stress response in HCT116 cells depleted of Dusp18.
I. HCT116 cells were transfected with siRNAs against Dusp18 and 48h later the cell lysates
were subjected to immunoblotting analysis for p-p38 and γH2Ax. Actin was used as a loading
control.
II. HCT116 p53 +/+ cells were transfected with siRNAs against Dusp18 and 48h later the cell
lysates were subjected to immunoblotting analysis for p-Chk2 and p-Chk1. Actin was used as
a loading control.
Finally, the localization of nucleophosmine (NPM) in Dusp18 depleted cells was also
examined. Nucleophosmine is normally localized in the nucleoli and is dispersed in the
nucleus upon several types of stress (Kurki et al., 2004), including some DNA damaging
agents, like treatment with doxorubicin (Figure 4-16). The dispersion of NPM in the
nucleoplasm is, under certain conditions, accompanied by the inhibition of Mdm2 and
induction of p53 (Kurki et al., 2004). The localization of nucleophosmine was unaffected by
the depletion of Dusp18 (Figure 4-16). This suggests that Dusp18 knockdown does not
activate p53 via the NPM pathway.
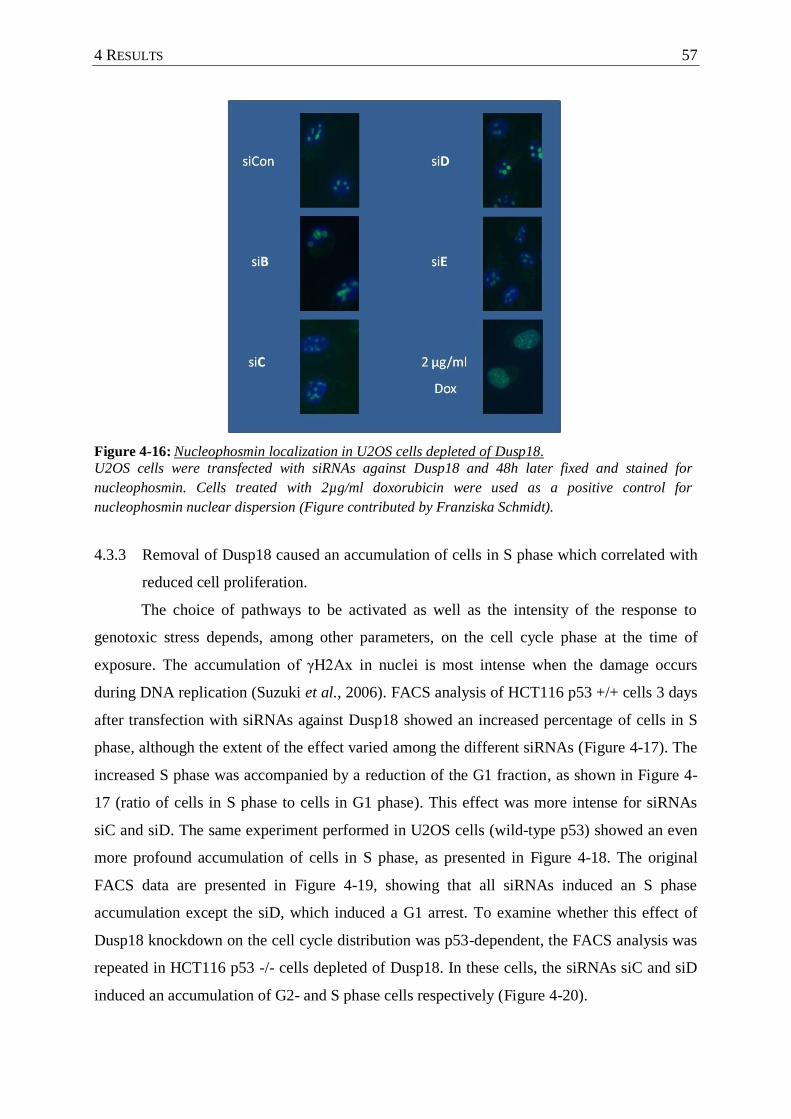
4 RESULTS 57
Figure 4-16: Nucleophosmin localization in U2OS cells depleted of Dusp18.
U2OS cells were transfected with siRNAs against Dusp18 and 48h later fixed and stained for
nucleophosmin. Cells treated with 2µg/ml doxorubicin were used as a positive control for
nucleophosmin nuclear dispersion (Figure contributed by Franziska Schmidt).
4.3.3 Removal of Dusp18 caused an accumulation of cells in S phase which correlated with
reduced cell proliferation.
The choice of pathways to be activated as well as the intensity of the response to
genotoxic stress depends, among other parameters, on the cell cycle phase at the time of
exposure. The accumulation of γH2Ax in nuclei is most intense when the damage occurs
during DNA replication (Suzuki et al., 2006). FACS analysis of HCT116 p53 +/+ cells 3 days
after transfection with siRNAs against Dusp18 showed an increased percentage of cells in S
phase, although the extent of the effect varied among the different siRNAs (Figure 4-17). The
increased S phase was accompanied by a reduction of the G1 fraction, as shown in Figure 4-
17 (ratio of cells in S phase to cells in G1 phase). This effect was more intense for siRNAs
siC and siD. The same experiment performed in U2OS cells (wild-type p53) showed an even
more profound accumulation of cells in S phase, as presented in Figure 4-18. The original
FACS data are presented in Figure 4-19, showing that all siRNAs induced an S phase
accumulation except the siD, which induced a G1 arrest. To examine whether this effect of
Dusp18 knockdown on the cell cycle distribution was p53-dependent, the FACS analysis was
repeated in HCT116 p53 -/- cells depleted of Dusp18. In these cells, the siRNAs siC and siD
induced an accumulation of G2- and S phase cells respectively (Figure 4-20).
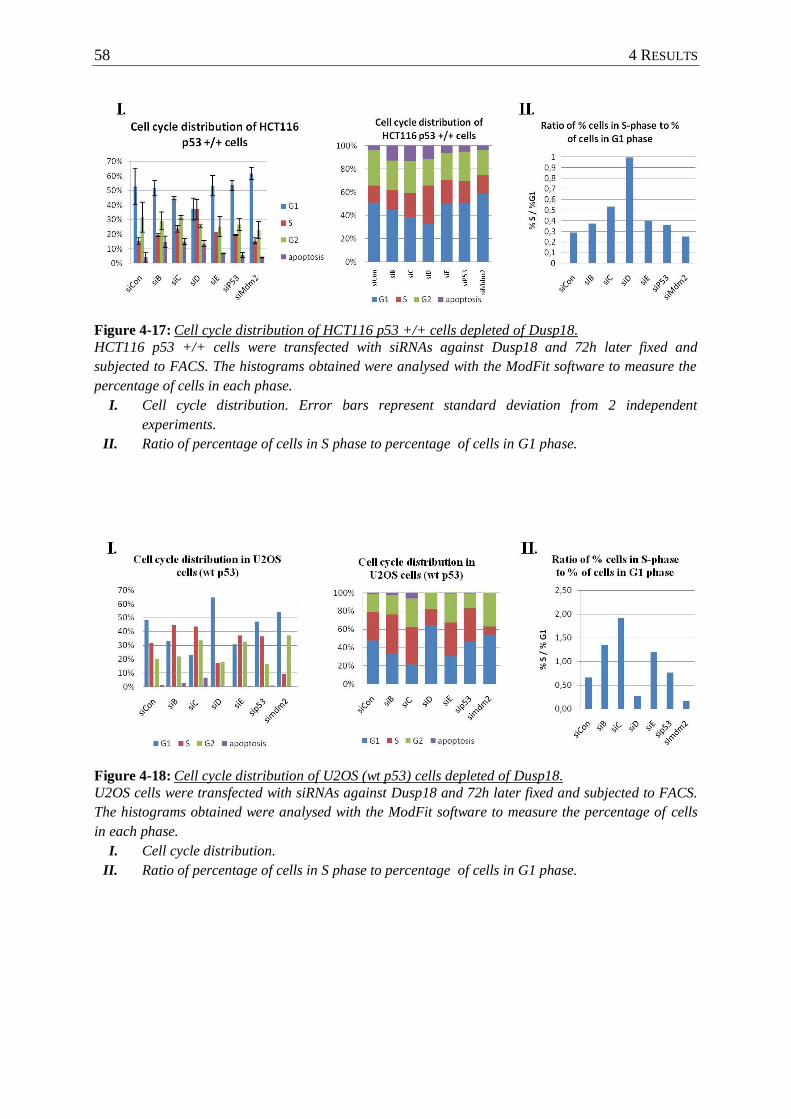
58 4 RESULTS
Figure 4-17: Cell cycle distribution of HCT116 p53 +/+ cells depleted of Dusp18.
HCT116 p53 +/+ cells were transfected with siRNAs against Dusp18 and 72h later fixed and
subjected to FACS. The histograms obtained were analysed with the ModFit software to measure the
percentage of cells in each phase.
I. Cell cycle distribution. Error bars represent standard deviation from 2 independent
experiments.
II. Ratio of percentage of cells in S phase to percentage of cells in G1 phase.
Figure 4-18: Cell cycle distribution of U2OS (wt p53) cells depleted of Dusp18.
U2OS cells were transfected with siRNAs against Dusp18 and 72h later fixed and subjected to FACS.
The histograms obtained were analysed with the ModFit software to measure the percentage of cells
in each phase.
I. Cell cycle distribution.
II. Ratio of percentage of cells in S phase to percentage of cells in G1 phase.
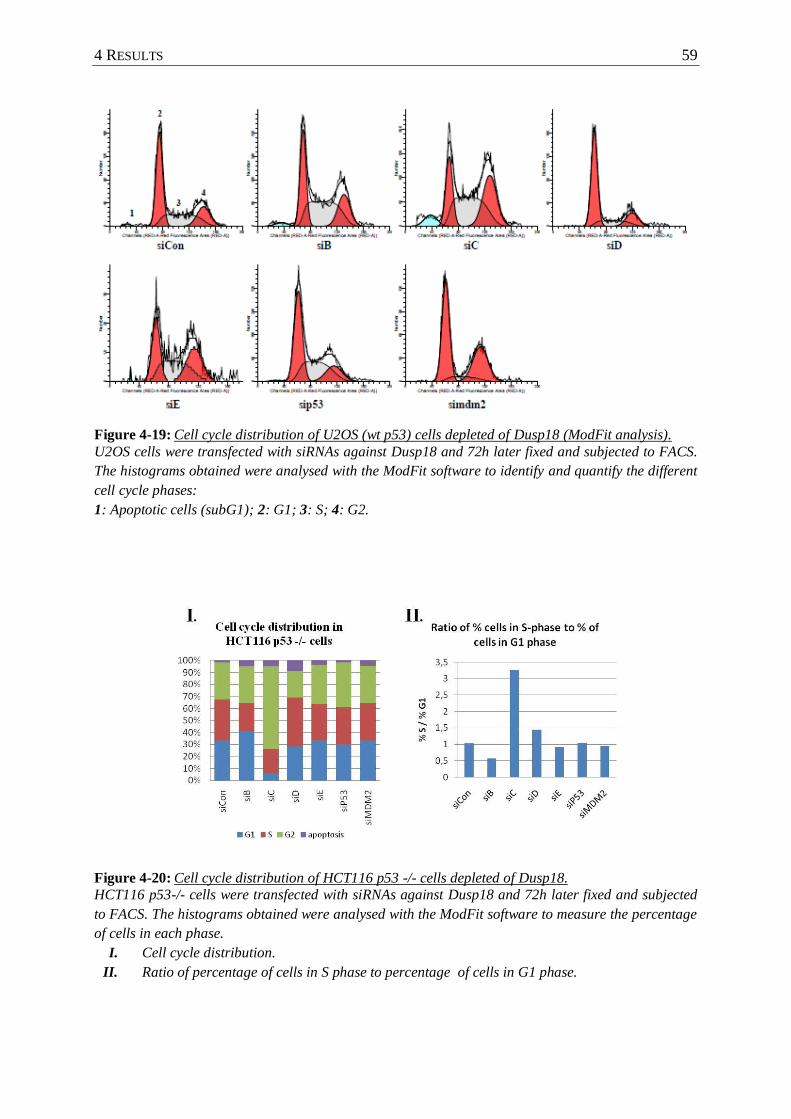
4 RESULTS 59
Figure 4-19: Cell cycle distribution of U2OS (wt p53) cells depleted of Dusp18 (ModFit analysis).
U2OS cells were transfected with siRNAs against Dusp18 and 72h later fixed and subjected to FACS.
The histograms obtained were analysed with the ModFit software to identify and quantify the different
cell cycle phases:
1: Apoptotic cells (subG1); 2: G1; 3: S; 4: G2.
Figure 4-20: Cell cycle distribution of HCT116 p53 -/- cells depleted of Dusp18.
HCT116 p53-/- cells were transfected with siRNAs against Dusp18 and 72h later fixed and subjected
to FACS. The histograms obtained were analysed with the ModFit software to measure the percentage
of cells in each phase.
I. Cell cycle distribution.
II. Ratio of percentage of cells in S phase to percentage of cells in G1 phase.

60 4 RESULTS
This accumulation of cells in the S phase could result from an increase of the G1 to S
transition, or alternatively because the depletion of Dusp18 caused a delay in the S phase. To
distinguish between these two possibilities, a proliferation assay was performed. HCT116 p53
+/+ or p53 -/- cells were transfected with the siRNAs against Dusp18 and starting 2 days post
transfection (marked as 48 h) the increase in the cell confluency over a period of 4 days was
monitored. As shown in Figure 4-21 and Figure 7-6 (Appendix), the proliferation rate of both
cell lines, as measured by the increase of confluency over time, was reduced by the siRNAs
siC and siD. This correlates with the accumulation of cells in S phase (FACS data, Figures 4-
18 and 4-20), and suggests that this increase of the percentage of cells replicating their DNA
is caused by a delay in S phase, and not by an increased G1 to S transition. Although the cell
proliferation was measured for up to 5 days post transfection of the siRNAs, the effect of
Dusp18 depletion on the cell confluency was observed only during the first 72h. This could be
attributed to a rapid decrease in the efficiency of the siRNAs 4 days after cell transfection (as
is most common with transient siRNA transfections).
Figure 4-21: Proliferation of HCT116 cells depleted of Dusp18.
HCT116 p53 +/+ (I) and p53 -/- (II) cells were transfected with siRNAs against Dusp18 and their
confluence was measured 48h and 72h after transfection. The increase in confluence within that time
is represented in the graphs. Error bars indicate standard deviation from 4 different dilutions of cells
(see Methods §3.1.3).
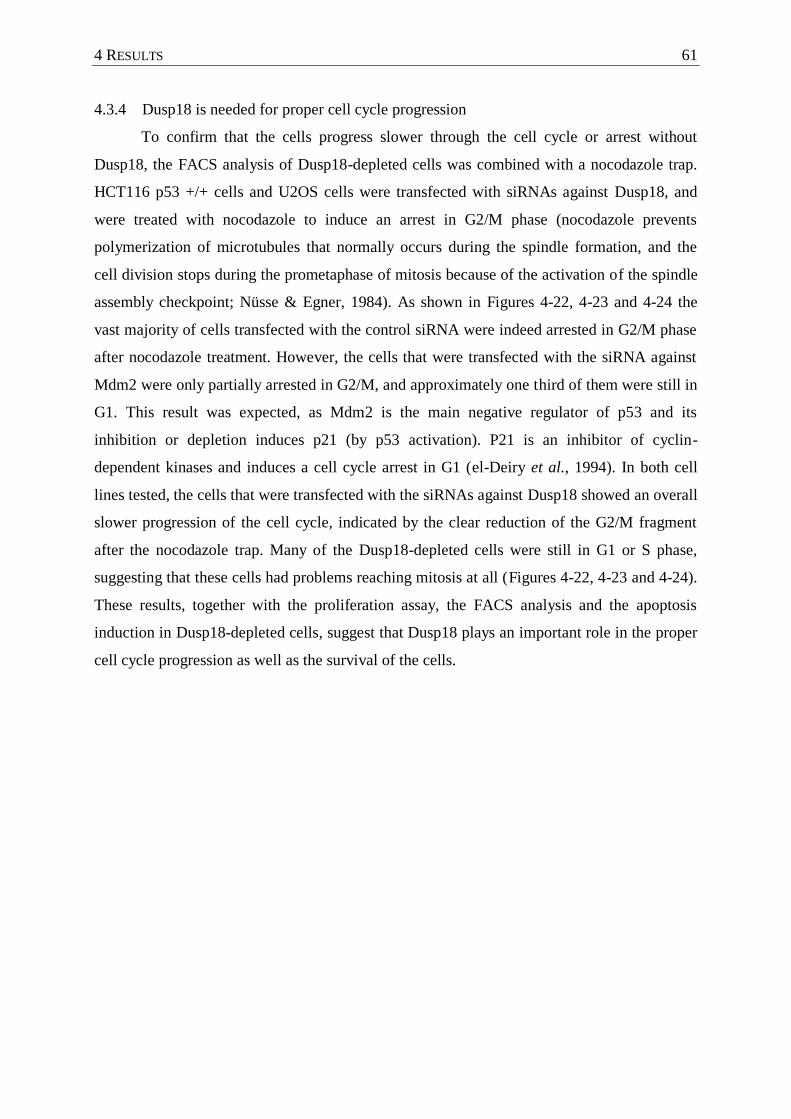
4 RESULTS 61
4.3.4 Dusp18 is needed for proper cell cycle progression
To confirm that the cells progress slower through the cell cycle or arrest without
Dusp18, the FACS analysis of Dusp18-depleted cells was combined with a nocodazole trap.
HCT116 p53 +/+ cells and U2OS cells were transfected with siRNAs against Dusp18, and
were treated with nocodazole to induce an arrest in G2/M phase (nocodazole prevents
polymerization of microtubules that normally occurs during the spindle formation, and the
cell division stops during the prometaphase of mitosis because of the activation of the spindle
assembly checkpoint; Nüsse & Egner, 1984). As shown in Figures 4-22, 4-23 and 4-24 the
vast majority of cells transfected with the control siRNA were indeed arrested in G2/M phase
after nocodazole treatment. However, the cells that were transfected with the siRNA against
Mdm2 were only partially arrested in G2/M, and approximately one third of them were still in
G1. This result was expected, as Mdm2 is the main negative regulator of p53 and its
inhibition or depletion induces p21 (by p53 activation). P21 is an inhibitor of cyclin-
dependent kinases and induces a cell cycle arrest in G1 (el-Deiry et al., 1994). In both cell
lines tested, the cells that were transfected with the siRNAs against Dusp18 showed an overall
slower progression of the cell cycle, indicated by the clear reduction of the G2/M fragment
after the nocodazole trap. Many of the Dusp18-depleted cells were still in G1 or S phase,
suggesting that these cells had problems reaching mitosis at all (Figures 4-22, 4-23 and 4-24).
These results, together with the proliferation assay, the FACS analysis and the apoptosis
induction in Dusp18-depleted cells, suggest that Dusp18 plays an important role in the proper
cell cycle progression as well as the survival of the cells.
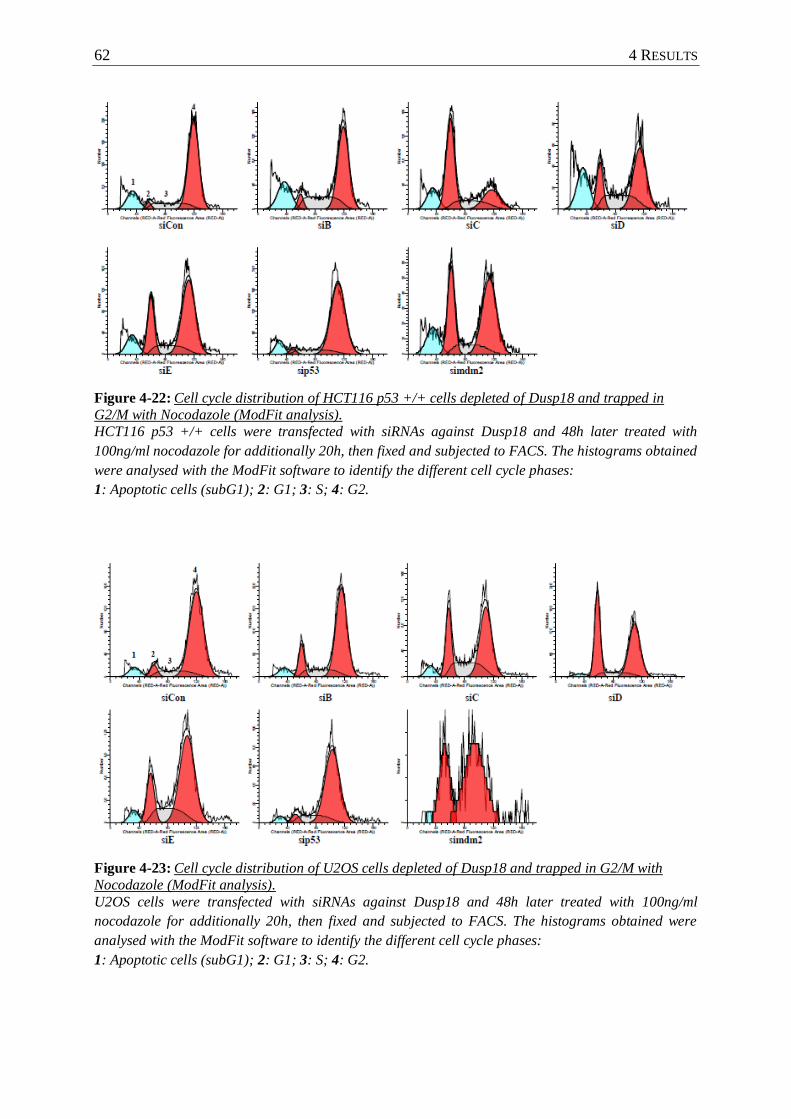
62 4 RESULTS
Figure 4-22: Cell cycle distribution of HCT116 p53 +/+ cells depleted of Dusp18 and trapped in
G2/M with Nocodazole (ModFit analysis).
HCT116 p53 +/+ cells were transfected with siRNAs against Dusp18 and 48h later treated with
100ng/ml nocodazole for additionally 20h, then fixed and subjected to FACS. The histograms obtained
were analysed with the ModFit software to identify the different cell cycle phases:
1: Apoptotic cells (subG1); 2: G1; 3: S; 4: G2.
Figure 4-23: Cell cycle distribution of U2OS cells depleted of Dusp18 and trapped in G2/M with
Nocodazole (ModFit analysis).
U2OS cells were transfected with siRNAs against Dusp18 and 48h later treated with 100ng/ml
nocodazole for additionally 20h, then fixed and subjected to FACS. The histograms obtained were
analysed with the ModFit software to identify the different cell cycle phases:
1: Apoptotic cells (subG1); 2: G1; 3: S; 4: G2.

4 RESULTS 63
Figure 4-24: Cell cycle distribution of HCT116 p53 +/+ and U2OS cells depleted of Dusp18 trapped
in G2 with Nocodazole.
HCT116 p53 +/+ (A) or U2OS (B) cells were transfected with siRNAs against Dusp18 and 48h later
treated with 100ng/ml nocodazole for additionally 20h, then fixed and subjected to FACS. The
histograms obtained were analysed with the ModFit software to measure the percentage of cells in
each phase.
4.3.5 Dusp18 knockdown sensitized HCT116 p53 +/+ cells to gemcitabine
Since the Dusp18 depleted cells accumulated in S phase and showed an increase of
γH2Ax, we sought to examine if the knockdown of Dusp18 could sensitize the cells to a
damaging drug that is effective while the DNA is replicating. SiRNA transfected cells were
therefore treated with gemcitabine. Gemcitabine is a cytosine nucleotide analogue that
induces DNA damage and accumulation of γH2Ax in S phase cells. After combining Dusp18
knockdown with gemcitabine treatment, the accumulation of γH2Ax was even higher than in
cells treated with gemcitabine and transfected with the negative control siRNA (Figure 4-25).
Interestingly, the induction of p53 by mdm2 knockdown had a protective effect on the cells,
as it inhibited the accumulation of γH2Ax (in agreement with previously published data;
Kranz et al., 2008). This further strengthens the hypothesis that, although the knockdown of
Dusp18 induces p53 and p21, this induction is likely a secondary effect of the DNA damage
response, and, in fact, the depletion of Dusp18 somehow triggers the DNA damage responsive
cascade, leading first to the accumulation of γH2Ax and subsequently activating the p53
pathway.
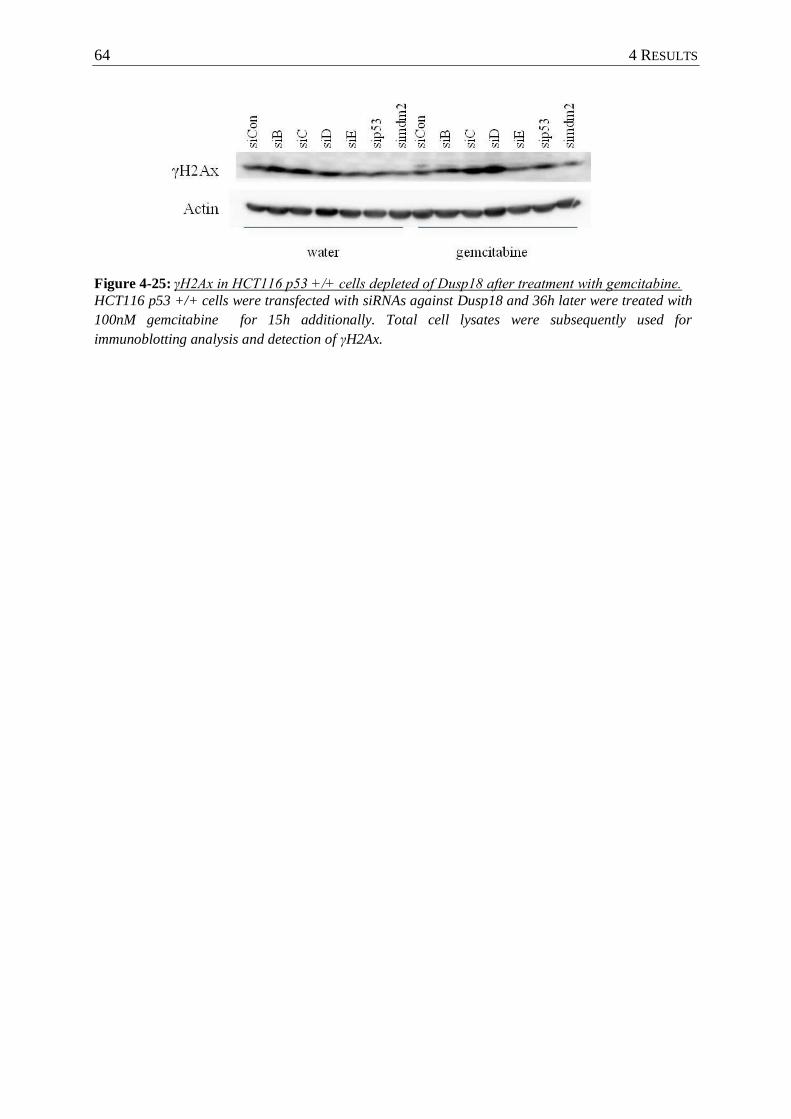
64 4 RESULTS
Figure 4-25: γH2Ax in HCT116 p53 +/+ cells depleted of Dusp18 after treatment with gemcitabine.
HCT116 p53 +/+ cells were transfected with siRNAs against Dusp18 and 36h later were treated with
100nM gemcitabine for 15h additionally. Total cell lysates were subsequently used for
immunoblotting analysis and detection of γH2Ax.
5 DISCUSSION 65
5 DISCUSSION
5.1 Identification of novel phosphatases that modulate the DNA damage response and
the p53 pathway
Persistent damage to hereditary material leads to genomic instability, a major cause of
cancer development. Thus organisms have developed ways to maintain genomic stability, as
well as to recognize, repair or eliminate cells with damaged DNA to the benefit of the body.
The aim of this study was to contribute to the elucidation of the mechanisms that control the
response of cells to DNA damage, with a particular interest in the early DNA damage
response and the p53 pathway.
In contrast to kinases, the role of phosphatases in the DNA damage response is not
well established. The particular cellular response to genotoxic stress depends on the balanced
network of several signaling pathways that are activated, inactivated and undergo crosstalk to
determine cellular fate. Phosphatases are expected to take part in the regulation of the
phosphorylation cascades that constitute the core of these signaling pathways. They may
regulate the output of this network by shifting the balance between pathways, either by
deactivating dephosphorylation of signaling kinases, activating phosphorylation or by ceasing
a constant dephosphorylation action upon signaling. As discussed in the Introduction, several
phosphatases have already been identified as “players” in the modulation of these cascades.
We believe that this is only a small portion of the role of phosphatases in the DNA damage
response, and to address the matter efficiently, we first performed a high throughput siRNA
screen to identify novel phosphatases that regulate the response to genotoxic stress.
We focused our efforts on one particular phosphatase, namely DUSP18, as the
knockdown of this phosphatase induced the accumulation of p53. However, several of our
screen “hits” were also investigated by other researchers. For example, the phosphatase
PPM1D, was initially identified as a negative regulator of p53 (Lu et al., 2005), but its
depletion caused a γH2Ax accumulation in our screen (Appendix, Figures 7-1 and 7-2) and in
the further validation experiments (Figure 4-4, compare lane 3 to lane 1 for γH2Ax). Indeed,
two independent groups recently identified PPM1D as a γH2Ax phosphatase (Macůrek et al.,
2010; Moon et al. 2010), confirming our findings and enhancing the reliability of our screen
results. In addition, the catalytic subunits of calcineurin PPP3CA and PPP3CB were identified
as positive regulators of p53 (Appendix, Figure 7-1, p53 downregulation upon calcineurin
knockdown independently of UVC). This is in agreement with a recent report from Wu X. et
al. showing that calcineurin inhibition counteracts p53-induced cellular senescence to
promote cancer formation (Wu et al., 2010). These examples indicate that, with our screen,
66 5 DISCUSSION
we could indeed identify new phosphatases that can regulate the response to DNA damage
and the p53 pathway.
5.2 The depletion of Dusp18 induced the p53 pathway
During our screen and the hit validation experiments, an siRNA against Dusp18
massively induced the accumulation of p53 in osteosarcoma U2OS cells, as well as the
activation of p53 as shown by the induction of its target genes p21 and mdm2. We therefore
chose to further investigate this new potential negative regulator of the p53 pathway, as its
inhibition seemed to activate p53 in cancer cells and hence it could become a novel anti-
cancer drug target.
5.2.1 Human Dusp18 was not localized in mitochondria in our system
The background knowledge on this phosphatase is limited to 6 publications, of which
2 have described the cloning of Dusp18 and the in vitro characterization of its enzymatic
activity (Hood et al., 2002; Wu et al., 2003). The structure of the protein has also been solved
by Jeong and colleagues (Jeong et al., 2006). However, the in vivo function of Dusp18 is still
unclear, as the 2 groups that investigated this aspect have published contradictory results (Wu
et al., 2006; Rardin et al, 2008). The research of Wu Q. et al. was based on overexpression
studies of the human Dusp18, which revealed a role for Dusp18 in the regulation of JNK
signaling. More specifically, the authors claimed that Dusp18 can directly interact and
dephosphorylate the p54SAPKbeta protein, but not p38 or p44ERK1 (Wu et al., 2006). In
contrast to that, Rardin et al. performed experiments with the murine homologue of Dusp18.
Using both overexpression and the endogenous protein in rat cells, the group showed that the
murine Dusp18 is localized in the periphery of the inner mitochondrial membrane, facing the
intermembrane space. As JNK is not localized in the mitochondria, the authors rejected a role
for Dusp18 as a JNK phosphatase (Rardin et al., 2008). The targeting of proteins to the
mitochondria depends, in most cases, on a sequence located at the N-terminus of the protein,
which contains positively charged as well as hydrophobic amino acids that can form
amphiphilic α-helices in a suitable environment (Claros & Vincens, 1996). Wu et al. also
performed localization experiments with overexpressed human Dusp18 (N-terminally tagged
with GFP), and found it ubiquitously expressed both in the cytoplasm and the nucleus of cells
(Wu et al., 2006; Figure 4-5). Rardin et al. suggested that the N-terminal bulky GFP tag
mislocalized the protein and inhibited its targeting to the mitochondria. However, their
deletion experiments showed that the region necessary and sufficient to target Dusp18 to the
mitochondria is in fact found in the C-terminal half of the protein (amino acids 95-188), and
that the N-terminal half is dispensable for localization (Wu et al., 2006).
5 DISCUSSION 67
We wanted to examine the localization of Dusp18 in our system. For this we cloned
the human Dusp18 open reading frame in expression vectors with either an N- or a C-terminal
HA tag. Notably, the HA tag consists only of 7 amino acids, and is therefore much smaller
than a GFP tag (~ 20kDa). Both clones were expressed in U2OS osteosarcoma cells and
localized in the cytoplasm and nucleus independently of the position of the HA tag. When we
marked the mitochondria of the cells expressing HA-tagged Dusp18, we could not observe
any colocalization between them and the Dusp18 (Figure 4-5). Hence, at least in our system,
human Dusp18 was not localized in the mitochondria. Because Rardin et al. used the murine
homologue of Dusp18 for their experiments, we aligned the human and murine sequences to
examine the extent of their similarity. Furthermore we used a mitochondrial targeting
prediction program to calculate the probability of mitochondrial localization for the two
homologues. Although the protein sequence of Dusp18 is well conserved between human and
mouse, there are differences in the amino acid sequences mostly at the N- and C-termini. Only
the middle parts of the proteins that contain the dual specificity phosphatase catalytic domain
are identical (Figure 4-6). In addition, the prediction program for mitochondrial targeting
predicted the localization of the murine protein to the mitochondria with a probability close to
90%, while the probability for the human homologue was less than 60% (Figure 4-6). These
results raise the possibility that the mitochondrial localization of Dusp18 might be specific for
the mouse homologue, and the human protein is actually localized in the cytoplasm and
nucleus as previously shown by Hood et al. and Wu Q. et al. (Hood et al., 2002; Wu et al.,
2006). However, at this point we cannot exclude the possibilities that overexpressed Dusp18
is mislocalized in the cells, perhaps due to lack of a modification or an interaction partner
needed for its localization to mitochondria, although this does not correlate with the widely
accepted model of mitochondrial targeting of proteins.
5.2.2 The depletion of Dusp18 induced p53 and p21 accumulation in several cell lines
Several siRNAs against Dusp18 were tested for their ability to induce p53 and its
target genes in different tumor cell lines. Although the intensity of the effect varied depending
on the siRNA and the cell line used, all the siRNAs showed the same tendency of inducing
the p53 target p21. Other gene targets of p53 were also induced by the knockdown of Dusp18,
including proapoptotic genes such as puma (data not shown), but only the induction of p21
was consistent between the different siRNAs and independent of the cell line we used. Our
first hypothesis was that, since Dusp18 is a phosphatase, it could directly or indirectly affect
the modification of p53, and therefore its stability and activity. We used phospho- and acetyl-
p53 specific antibodies to test whether Dusp18 depletion would induce the spontaneous
68 5 DISCUSSION
modification of p53, indicating that in a healthy cell Dusp18 might act to control basal levels
and activity of p53. No such spontaneous phosphorylation of serines 15 and 46 was detected.
Although there is a plethora of phosphorylation sites on p53, all of which we could not test,
we also looked at the acetylation of lysine 382. This residue is located in the inhibitory
domain of p53. Its acetylation follows p53 multiple phosphorylation, and thus is indicative of
a heavily modified and transcriptionally active p53 (Sakaguchi et al., 1998). We could not
observe any spontaneous K382 acetylation induced by the knockdown of Dusp18. These
results suggest that the induction of p53 by the depletion of Dusp18 is likely not a direct
consequence of p53 hyperphosphorylation due to the removal of a phosphorylation-
counteracting molecule.
In agreement to that, the interaction of p53 with its negative regulator Mdm2 was not
significantly affected by the depletion of Dusp18 (Figure 4-10). The efficiency of complex
formation of the two proteins is largely regulated by post-translational modifications on both
polypeptides. Thus, should the accumulation and activation of p53 be a result of increased
phosphorylation of either itself or Mdm2, we would expect the inhibition, to a great extent, of
their interaction. The accumulation and activation of p53 by a mechanism different than the
direct inhibition of the Mdm2 function would result in the reduction but not complete
abrogation of the complex formation. Hence, the small reduction in the amount of p53 co-
precipitated with Mdm2 that we observed is likely a secondary effect and not the initial reason
for the activation of p53.
The induction of p21 by the depletion of Dusp18 occurred in the cells as a
consequence of p53 activation, as shown by the increase in p21 pre-mRNA levels and by the
increased binding of p53 to the p21 promoter. Despite that, we could not detect an increase of
the RNA polymerase bound to any sites of the p21 gene tested. It is known that the p21
mRNA production is regulated at the level of transcription elongation rather than the loading
of RNA polymerase II on the promoter (Mattia et al., 2007; Donner et al., 2007; Beckerman
et al., 2009). In addition, the amount of RNA polymerase bound along the coding region of
the gene does not strikingly increase. Instead, the C-terminal transcription domain (CTD) of
RNA polymerase molecules is phosphorylated to create the elongating form of the enzyme,
and this changes dramatically upon induction of p21 (Donner et al., 2007). Thus, the lack of
increased RNA polymerase binding to the p21 locus can be explained by the phosphorylation
of existing molecules on the gene, and by an increased transcription speed, which would not
necessarily increase the number of bound molecules. Rather, this would allow them to go
faster through the gene, therefore producing more mRNA in a given amount of time. The
5 DISCUSSION 69
chromatin immunoprecipitation of RNA polymerase II phosphorylated at the Ser2 of its CTD
heptapeptides (which represents the elongating form of the enzyme) could provide support to
this hypothesis.
Another possible mechanism of Dusp18 action could be the inhibition of p53
transcriptional activity by the modulation of one of its transcription partners. A good
candidate was the general transcription factor SP1 (Specificity Protein 1), as it is also needed
for the activation of the p21 promoter, and its activity is regulated by phosphorylation.
Therefore Dusp18 might partially act on SP1 to inhibit its binding to the promoter of p21. We
tested this hypothesis by investigating the amounts of SP1 bound to the p21 promoter when
the cells were depleted of Dusp18, but did not observe a significant increase of chromatin
immunoprecipitated SP1 (Figure 7-4). However, we did observe that the accumulation of p21
protein was dependent on the presence of SP1; in the combined knockdown of SP1 and
Dusp18 the p21 protein amount failed to increase to the levels of the Dusp18 knockdown
alone for 3 out of 4 siRNAs (Figure 4-13). The accumulation of p53 with the siRNA C was so
robust that it could have perhaps overcome the necessity of abundant SP1, and thus this
siRNA seemed to induce p21 independently of SP1 levels. A further observation of this
experiment was that SP1 protein levels were also increased upon depletion of Dusp18; yet this
effect was not confirmed upon repetition of the experiment (data not shown).
In conclusion, Dusp18 depletion led to the accumulation of p21 mRNA and protein in
several tumor cell lines, as a result of the activation of the p53 pathway. The amount of p53
bound to the responsive element on the p21 promoter was augmented, and the p21 mRNA
induction was a result of increased transcription, but not increased transcription initiation as
the binding of RNA polymerase II to the p21 gene remained the same. Finally, the induction
of p21 is at least partially dependent on the p53 cofactor SP1.
5.3 The survival of tumor cells depends on Dusp18
Tumor cells transfected with siRNAs against Dusp18 showed signs of apoptosis
induction, starting at 48 hours after transfection. HCT116 cells depleted of Dusp18 showed
cleavage of the apoptotic markers PARP-1 and caspase 3 at 48 hours after siRNA
transfection. Additionally, FACS analysis revealed an increase in the subG1 fraction of cells
sorted 72 hours after siRNA transfection. These events were augmented in p53 +/+ relatively
to the p53 -/- cells, indicating that the apoptosis induction was largely p53 dependent, or that
simply the presence of p53 in the cells sensitized them to the depletion of Dusp18.
The accumulation of p21 (i.e. resulting from Mdm2 depletion) typically induces a
prolonged arrest of the cell cycle at the border of G1 and S phases (el-Deiry et al., 1994).
70 5 DISCUSSION
Despite the induction of p21 by Dusp18 knockdown, the cell cycle sorting analysis of siRNA-
transfected HCT116 and U2OS cells indicated that there was an increase in the fragment of
cells in S phase upon Dusp18 depletion. This effect could have been the result of increased
entry of the cells into S phase, or the activation of the intra-S phase checkpoint. Monitoring of
the proliferation of Dusp18-depleted HCT116 cells showed that the absence of our favorite
phosphatase induced a proliferation defect, indicated by the low rate of confluency increase
over time. Therefore siRNA targeting of Dusp18 must result in a slow progression of the cells
through the cell cycle.
To confirm this hypothesis, we performed the FACS analysis again using nocodazole
to arrest the cells in the G2/M phase, after depleting them of Dusp18. This should allow the
cells to proceed to the end of the G2 phase, and then stop there, unless there is an arrest
already earlier in the cell cycle. Indeed, the control siRNA transfected cells almost completely
accumulated at the border of G2/M phase (Figure 4-22, 4-23 and 4-24). Instead, the Dusp18
depleted cells clearly showed a slower progression of the cell cycle, and, in addition to the
G2/M peak, there was a large amount of cells still in G1 and S phases. HCT116 p53 +/+ and
U2OS (p53 wild type) cells depleted of Mdm2 arrested as expected in G1 phase, due to the
accumulation of p21 by the induction of p53. However, in Mdm2 siRNA transfected cells
there was a reduction in the percentage of the S phase cells, in contrast to the Dusp18 siRNAs.
In addition, there was no increase in apoptotic cells observed with the depletion of Mdm2,
while in Dusp18 depleted cells the subG1 fragment of cells was augmented indicating cell
death. Therefore the cell cycle profile and the arrest of Dusp18 depleted cells in G1 and S
phase is not identical to the profile resulting from direct p53 induction by the Mdm2 siRNA.
These results lend further support the hypothesis that, instead of acting by directly
inhibiting the accumulation and activation of p53, Dusp18 probably suppresses the activation
of another pathway, which in turn activates p53 and its target p21.
5.4 Dusp18 depletion induces γH2Ax and initiates the DNA damage response cascade
P53 is activated in response to cellular stress. Therefore the influence of Dusp18
knockdown on different factors regulating or responding to different kinds of stress was
examined. We were particularly interested in DNA damage responsive proteins, as the
involved signaling cascades can also lead to the cell cycle arrest and apoptosis we observed.
Of the proteins investigated, the most prominent relevant consequence of Dusp18 knockdown
was the accumulation of γH2Ax.
There are two possible hypotheses that can explain the accumulation of γH2Ax. The
first and more straightforward way to explain the phosphorylation of H2Ax in the absence of
5 DISCUSSION 71
Dusp18 is that the latter is a novel γH2Ax phosphatase (Figure 5-1 (1)). Thus the depletion of
Dusp18 would allow the accumulation of spontaneously phosphorylated histone molecules,
by shifting the balance of phosphorylation versus dephosphorylation events. So far several
other phosphatases have been implicated in the dephosphorylation of γH2Ax, including the
protein phosphatases PP4, PP6 and PP2A. This indicates that this dephosphorylation event is
not performed specifically in the cells by one phosphatase, and that different enzymes might
cooperate or take over this task under diverse conditions. Hence it might be possible that
other, undiscovered yet phosphatases may contribute to γH2Ax dephosphorylation. However,
an accumulation of γH2Ax was observed in cells depleted of Dusp18 without any further
genotoxic stress (Figure 4-15), although this accumulation was augmented by the addition of
gemcitabine (Figure 4-25). In contrast, the depletion of already identified γH2Ax
phosphatases has not resulted in any detectable γH2Ax accumulation without further cellular
stress in previously published results (Chowdhury et al., 2005; Nakada et al., 2008; Moon et
al., 2010; Douglas et al., 2010). Instead, the depletion of these phosphatases has led to
prolonged or more profound γH2Ax signal after DNA damage, or has interfered with the
restoration of the damage and the re-entry in the cell cycle. This difference makes the
assumption that Dusp18 might be a novel direct γH2Ax phosphatase rather unlikely.
The second hypothesis that can explain the accumulation of γH2Ax is that the
depletion of Dusp18 induces the activation of the DNA damage response cascade in the cells
(Figure 5-1 (2)). This assumption is in agreement with the activation of other DNA damage
responsive proteins (such as the phosphorylation of Chk2, Figure 4-15), and the physiological
consequences of cell cycle arrest and apoptosis induction, that occur in part as a result of p53
activation. As γH2Ax is one of the earliest events of DNA damage response, Dusp18 might
act as a repressor at one or more of the first steps of the cascade activation. For example,
Dusp18 might be a negative regulator of the ATM/ATR kinases, such that siRNAs against
Dusp18 may induce the activation of these proteins, and initiate the DNA damage response. A
simultaneous knockdown of Dusp18 and ATM/ATR could further elucidate this hypothesis.
Little is known so far about the connection between the actual damage of DNA and the
activation of ATM and ATR, but certainly Dusp18 could also act upstream of these kinases,
by negatively regulating one of these intermediate steps. For instance, the serine/threonine
kinase Cdk5 has been shown to phosphorylate ATM on Ser794, a modification that precedes
and is required for the activating autophosphorylation of ATM on Ser1981. Tian et al.
recently showed that, in post-mitotic neurons, DNA damage activates ATM via Cdk5 and
leads to γH2Ax accumulation and p53 activation. This is accompanied by an induction of
72 5 DISCUSSION
Cdks 2 and 6, forcing these normally non-dividing cells to re-enter the cell cycle. The re-entry
into the cell cycle requires ATM activity and leads to apoptotic neuronal death. This pathway
of aberrant cell cycle progression that leads to apoptosis may not be restricted only to
neuronal cells, as both ATM and Cdk5 are widely expressed (Tian et al., 2009). A
hypothetical mode of action for Dusp18 could be an inhibitory role on Cdk5 or its activators
p25 and p35. The detection of Ser794-phosphorylated ATM in Dusp18-depleted cells and/or a
double knockdown experiment of Dusp18 with Cdk5 might provide further insight into this
possibility. Furthermore, Ayoub and colleagues (Ayoub et al., 2008) discovered that DNA
breaks result in an altered chromatin structure, which allows for the weakening of hydrogen
bonds between Heterochromatin Protein 1 (HP1) and Lys9-methylated H3. They showed that
the dissociation of HP1 from the damaged DNA occurs in a CK2 dependent manner
(phosphorylation of HP1 at Thr15) and promotes the conversion of H2Ax into γH2Ax at
damaged DNA sites (Ayoub et al., 2008). Dusp18 could suppress one or more of these events,
and thus the depletion of this phosphatase could favor the accumulation of γH2Ax resulting
either from spontaneous DNA damage or from faulty activation of the CK2/HP1 pathway.
The use of a CK2 inhibitor in combination with Dusp18 depletion, or the detection of HP1
localization upon Dusp18 knockdown by immunofluorescence may help to support or
contradict this hypothesis.
The activity of Dusp18 upstream of the activation of the DNA damage response is also
possible (Figure 5-1 (3)); Dusp18 could be necessary for a vital cellular process, or for the
maintenance of a survival pathway in the cell. A very interesting aspect we have not yet
addressed is whether Dusp18 knockdown leads to the induction of actual damage to DNA, or
just to the activation of the DNA damage response cascade. The detection of DNA ends (for
example by TUNEL or comet assay) would provide an answer to this question. In this way,
we could discern between the possibility that Dusp18 acts by directly inhibiting the initiation
of the DNA damage response cascade, or by maintaining a process necessary for survival and
proliferation. For example, the PI3K/AKT survival pathway regulates many cellular
procedures implicated in survival and proliferation (Osaki et al., 2004). Saito et al. found that
inhibition of this pathway in colorectal cells, by overexpression of its negative regulator
PTEN (phosphatase and tensin homologue deleted in chromosome 10), induced a G2/M arrest
and suppressed their proliferation. Combination of PTEN overexpression with the ATM/ATR
inhibitor caffeine abrogated the cell cycle arrest and instead led to apoptotic death (Saito et
al., 2003). Dusp18 might be necessary for the sustained activation of such a pathway in tumor
cells, and thus its depletion might decrease the activity of this pathway, hence inducing cell
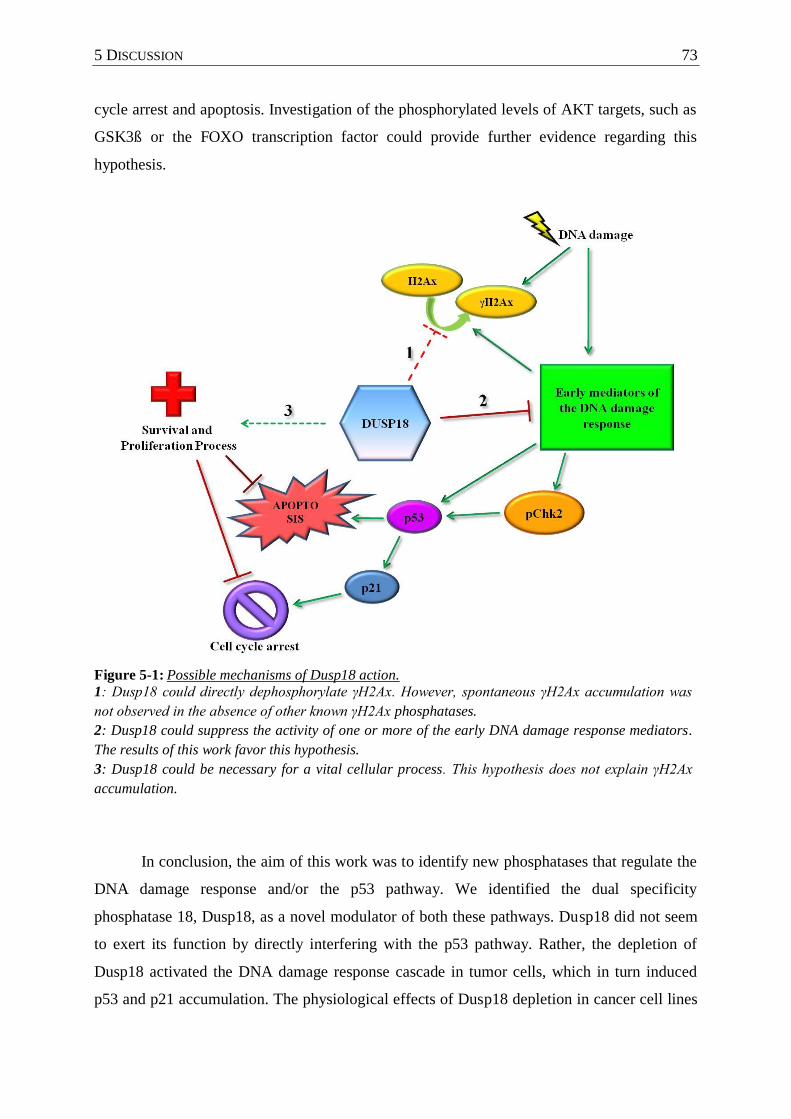
5 DISCUSSION 73
cycle arrest and apoptosis. Investigation of the phosphorylated levels of AKT targets, such as
GSK3ß or the FOXO transcription factor could provide further evidence regarding this
hypothesis.
Figure 5-1: Possible mechanisms of Dusp18 action.
1: Dusp18 could directly dephosphorylate γH2Ax. However, spontaneous γH2Ax accumulation was
not observed in the absence of other known γH2Ax phosphatases.
2: Dusp18 could suppress the activity of one or more of the early DNA damage response mediators.
The results of this work favor this hypothesis.
3: Dusp18 could be necessary for a vital cellular process. This hypothesis does not explain γH2Ax
accumulation.
In conclusion, the aim of this work was to identify new phosphatases that regulate the
DNA damage response and/or the p53 pathway. We identified the dual specificity
phosphatase 18, Dusp18, as a novel modulator of both these pathways. Dusp18 did not seem
to exert its function by directly interfering with the p53 pathway. Rather, the depletion of
Dusp18 activated the DNA damage response cascade in tumor cells, which in turn induced
p53 and p21 accumulation. The physiological effects of Dusp18 depletion in cancer cell lines
74 5 DISCUSSION
included a prolonged delay of cell cycle progression both in G1 and S phase, and an increased
rate of apoptosis. Both these effects took place in the absence of any further exogenous
cellular stress, i.e. genotoxic drugs. However, the accumulation of the characteristic marker of
DNA damage response activation, γH2Ax, was augmented when Dusp18-depleted cells were
further treated with the S phase targeting DNA damaging drug gemcitabine. Our data suggest
that Dusp18 might play an essential role in moderating the activity levels of the early DNA
damage responsive kinases, hence its absence could allow their uncontrolled activation.
Another equally possible model would place Dusp18 in charge of maintaining the activity of a
pathway promoting the survival and proliferation of cells. Tumor cells often have a higher
dependence on pathways such as the PI3K/AKT than their respective normal tissue cells (Roy
et al., 2010 and references therein). Further investigation is necessary to gain insight into the
details of Dusp18 action. Nevertheless, we have identified a novel protein, whose depletion
leads, without any further exogenous damage, to the arrest of proliferation and apoptotic death
of tumor cells. As most enzymes, Dusp18 could provide a novel drug target. Finally, the cell
death-inducing effect of Dusp18 knockdown could be enhanced by suppressing the cell cycle
arrest, for instance by the parallel inhibition of checkpoint kinases, or other so called caretaker
genes (synergistic lethality). Hence, the targeted inhibition of Dusp18 alone or in combination
with kinase inhibitors in tumors could provide the grounds for the development of novel
therapeutic drugs, adding to our hopes of discovering new approaches to combat cancer.
6 SUMMARY AND CONCLUSIONS 75
6 SUMMARY AND CONCLUSIONS
From bacteria to mammals, organisms have developed mechanisms to maintain the
stability of their genome. Environmental factors, such as UV light and cellular processes, like
genomic replication and recombination, constantly induce point mutations and breaks on the
DNA. If this damage is not promptly and properly repaired, it can lead to impaired gene
expression, inactivate the protective effects of tumor suppressors, and induce oncogenes, thus
promoting the malignant transformation of the cell. Therefore, persistent DNA damage can
prove catastrophic for the organism. One of the major tumor suppressors is the so-called
“guardian of the genome” p53. The main functions of p53 are to facilitate DNA repair, to
induce cell cycle arrest (by augmenting the expression of the Cdk/cyclin inhibitor p21) and to
initiate the induction of apoptosis in severely damaged cells.
The phosphorylation of proteins is a rapid, specific and reversible modification; this
makes it ideal for the regulation of signal transduction pathways. The response to genotoxic
stress largely depends on a series of phosphorylations, and on the activity of several known
kinases. The phosphorylation state of the proteins that constitute the DNA damage response
cascade is regulated by the balanced activities of kinases and phosphatases. The role of
kinases in this pathway is quite well established; however, the contribution of phosphatases in
the regulation of the DNA damage response has only recently begun to be revealed.
The aim of this study was to identify new phosphatases regulating the response to
genotoxic stress and the p53 network. To address this in a high-throughput manner, an siRNA
screen targeting most known human phosphatase subunits was performed. Briefly, U2OS
cells (an osteosarcoma-derived cell line) were transfected with the siRNA library (3 different
siRNAs were used per targeted phosphatase subunit). Subsequently, the cells were exposed to
UVC irradiation to induce DNA damage, or mock treated. Then, the cells were fixed and
labeled with fluorescent antibodies against the tumor suppressor p53, and γH2Ax. γH2Ax is
the Ser139 phosphorylated form of the histone variant H2Ax. This modification occurs within
a few minutes after inducing DNA damage, marks the sites of damaged chromatin and plays a
key role in the amplification and transduction of the DNA damage signal. The phosphatase
siRNA library screening resulted in the identification of 39 potential novel modulators of p53
and of the DNA damage response. Several of these were identified and confirmed by other
groups during the course of this study, thereby enhancing the reliability of our screen data.
Our efforts were focused on understanding the function of the dual specificity phosphatase 18
(Dusp18), which emerged from our screen as a promising new p53 modulator.
76 6 SUMMARY AND CONCLUSIONS
The transfection of several cell lines with siRNAs against Dusp18 activated the p53
pathway, as detected by the accumulation of p53 and its target gene product p21. The
induction of p21 was robust and particularly consistent among the different cell lines and
siRNAs used. The depletion of Dusp18 in cells lacking p53 did not result in a similar
induction of p21. Quantitative PCR analysis revealed that the depletion of Dusp18 led to the
increase of p21 mRNA and pre-mRNA levels. In addition, the siRNAs against Dusp18
augmented the amount of p53 that was bound to the p21 promoter. Furthermore, combined
depletion of Dusp18 and a p53 transcriptional cofactor, SP1, reduced the observed
accumulation of p21 protein. These results suggest that the induction of p21 is a consequence
of the increased transcriptional activity of p53.
The p53 protein stability and activity are regulated by a variety of post-translational
modifications. However, no detectable increase in the phosphorylation or acetylation of p53
was observed after depletion of Dusp18. Furthermore, the interaction of p53 with its negative
regulator, Mdm2, was not disrupted upon Dusp18 knockdown. These results suggest that
Dusp18 might not act directly on p53 to suppress the p53 pathway.
The depletion of Dusp18 induced apoptosis in tumor cells. Although to a lesser extent,
this apoptosis induction was also observed in cells lacking p53. An accumulation of γH2Ax
also occurred upon Dusp18 knockdown, independently of p53. In addition, an increase in
pChk2, but not pChk1 levels, was detected. The cell cycle analysis of cells depleted of
Dusp18 showed a delayed progression through the S phase, which was accompanied by a
reduced proliferation rate. A nocodazole trap in G2/M phase revealed that the siRNAs against
Dusp18 induced an arrest in G1 and in S phase, as the cells depleted of Dusp18 failed to
synchronize in G2/M. This led us to assume that the S phase arrest could sensitize the tumor
cells to cancer therapeutic drugs that target DNA replication, such as gemcitabine. Indeed,
cells depleted of Dusp18 showed an increased response to this drug, as detected by an
augmented accumulation of γH2Ax. These findings indicate a role for Dusp18 in tumor cell
survival and proliferation, and thus introduce Dusp18 as a potential novel cancer drug target.
In conclusion, Dusp18 was identified as a novel phosphatase modulating the tumor
suppressor p53 and the DNA damage response. Our results suggest that the depletion of
Dusp18 can lead to proliferation defects and the apoptotic death of tumor cells. Furthermore,
Dusp18 knockdown can synergistically potentiate the cytotoxic effect of cancer drugs. Hence,
Dusp18 may represent a potential new therapeutic target for cancer.
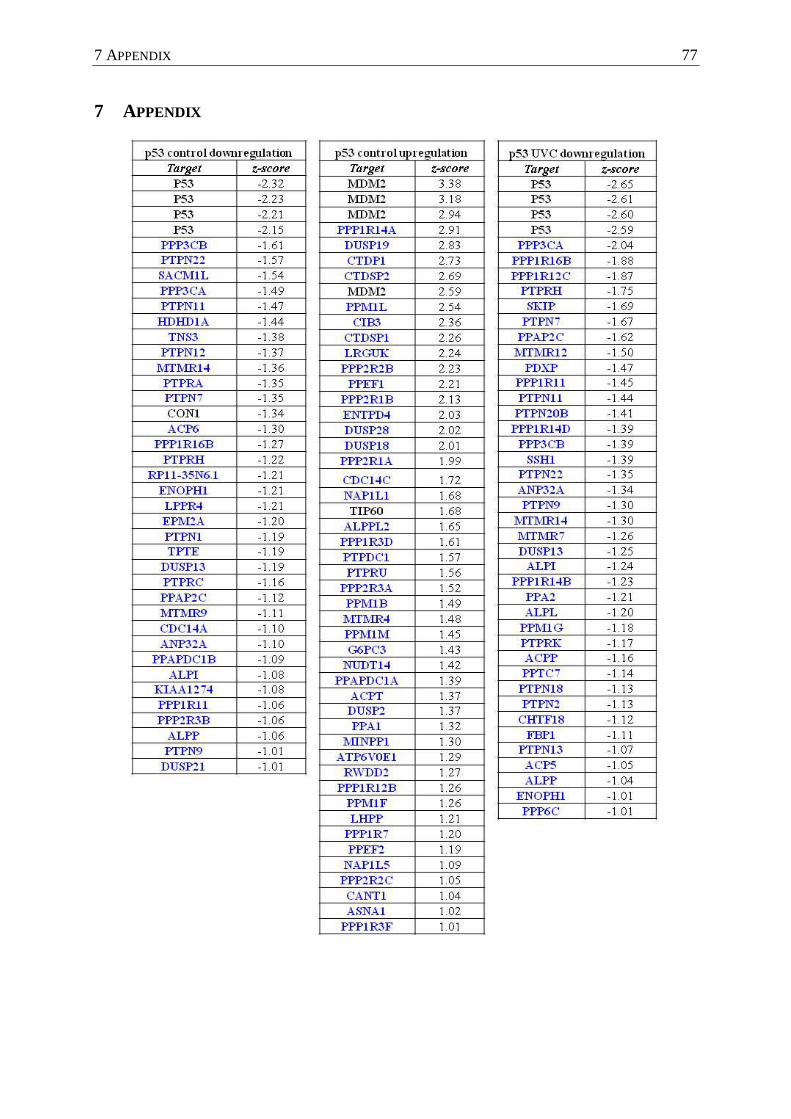
7 APPENDIX 77
7 APPENDIX
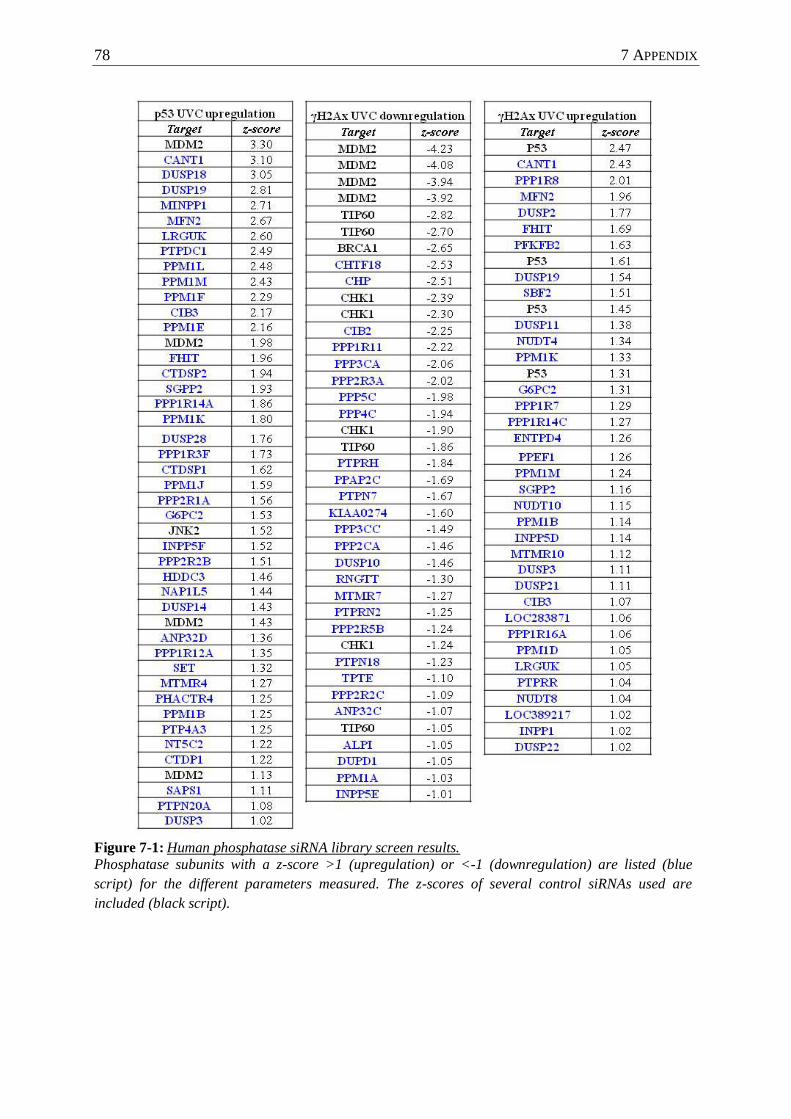
78 7 APPENDIX
Figure 7-1: Human phosphatase siRNA library screen results.
Phosphatase subunits with a z-score >1 (upregulation) or <-1 (downregulation) are listed (blue
script) for the different parameters measured. The z-scores of several control siRNAs used are
included (black script).
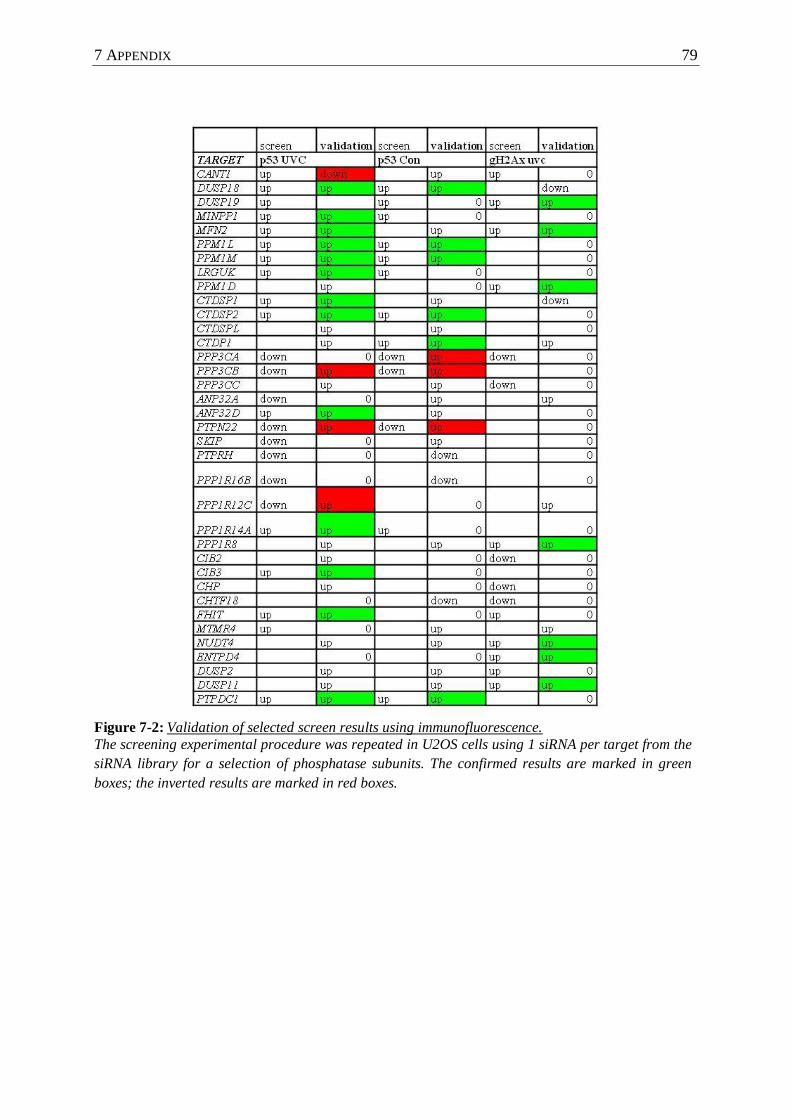
7 APPENDIX 79
Figure 7-2: Validation of selected screen results using immunofluorescence.
The screening experimental procedure was repeated in U2OS cells using 1 siRNA per target from the
siRNA library for a selection of phosphatase subunits. The confirmed results are marked in green
boxes; the inverted results are marked in red boxes.

80 7 APPENDIX
Figure 7-3: Mdm2 protein levels in cells depleted of Dusp18.
Each cell line shown was transfected with siRNAs against Dusp18 and 48h later the cell lysates were
subjected to immunoblotting analysis to detect Mdm2 protein (I). Actin was used as a loading control
(II).
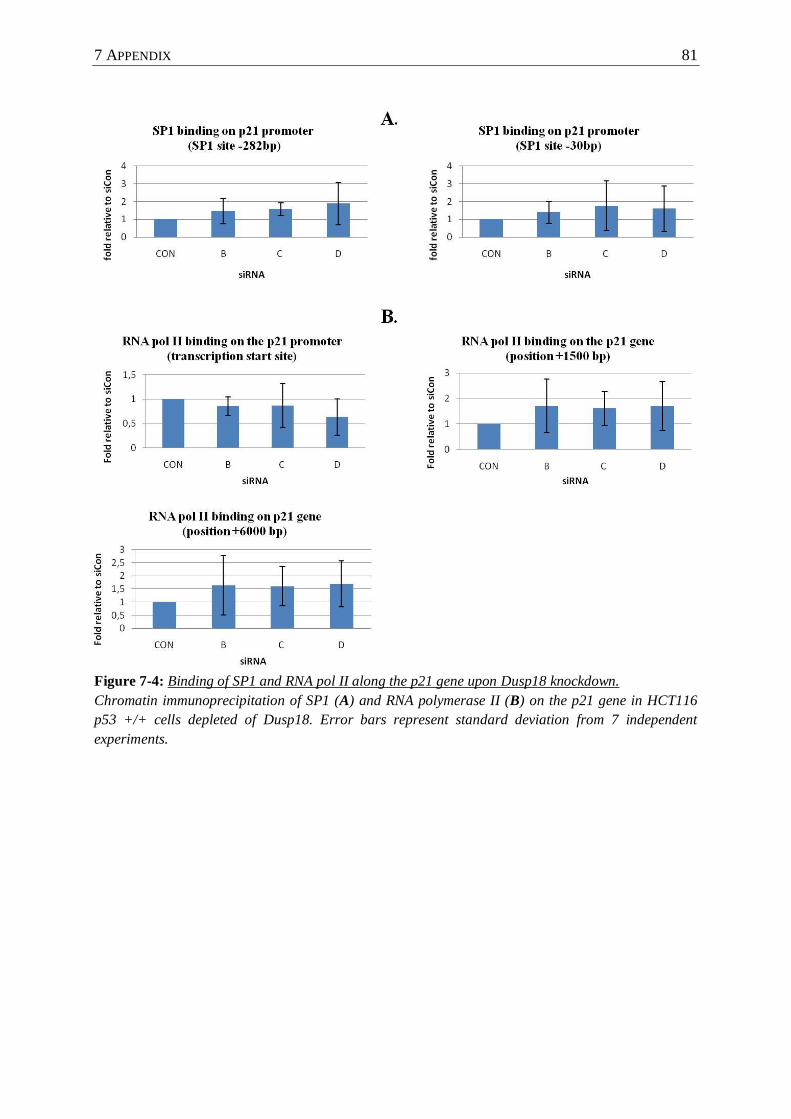
7 APPENDIX 81
Figure 7-4: Binding of SP1 and RNA pol II along the p21 gene upon Dusp18 knockdown.
Chromatin immunoprecipitation of SP1 (A) and RNA polymerase II (B) on the p21 gene in HCT116
p53 +/+ cells depleted of Dusp18. Error bars represent standard deviation from 7 independent
experiments.
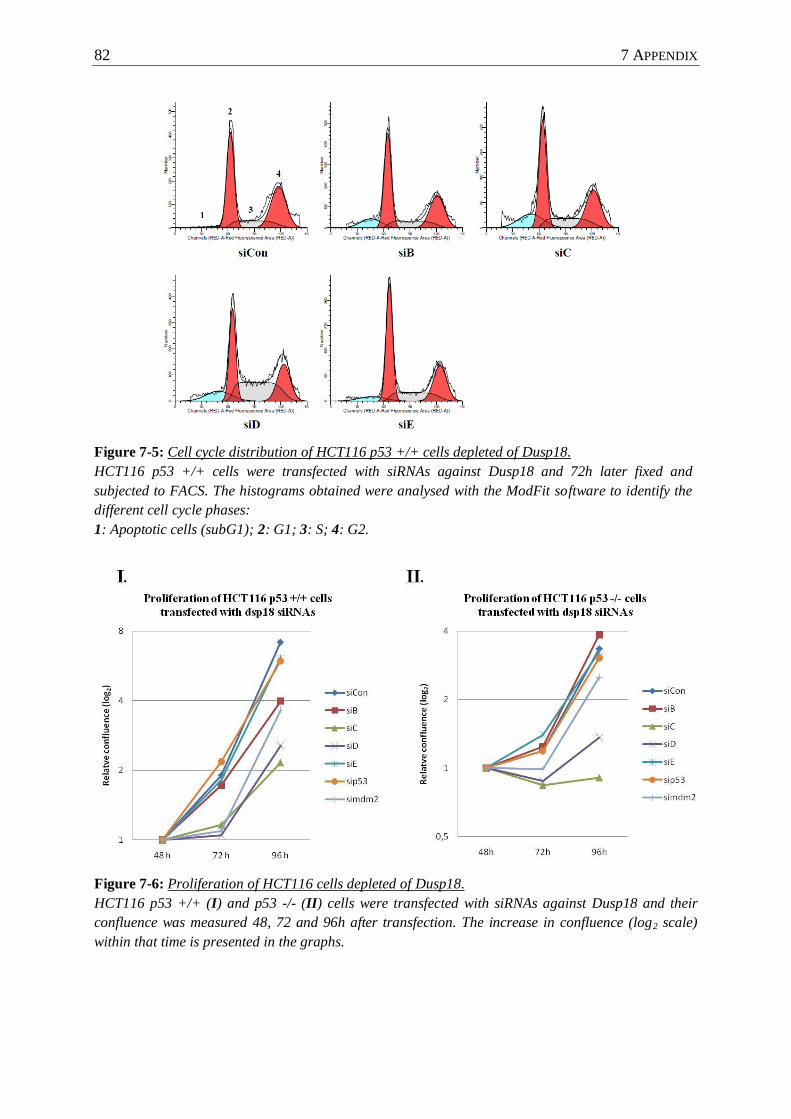
82 7 APPENDIX
Figure 7-5: Cell cycle distribution of HCT116 p53 +/+ cells depleted of Dusp18.
HCT116 p53 +/+ cells were transfected with siRNAs against Dusp18 and 72h later fixed and
subjected to FACS. The histograms obtained were analysed with the ModFit software to identify the
different cell cycle phases:
1: Apoptotic cells (subG1); 2: G1; 3: S; 4: G2.
Figure 7-6: Proliferation of HCT116 cells depleted of Dusp18.
HCT116 p53 +/+ (I) and p53 -/- (II) cells were transfected with siRNAs against Dusp18 and their
confluence was measured 48, 72 and 96h after transfection. The increase in confluence (log2 scale)
within that time is presented in the graphs.

7 APPENDIX 83
Figure 7-7: Proliferation of HCT116 p21 -/- cells depleted of Dusp18.
I. HCT116 p21 -/- cells were transfected with siRNAs against Dusp18 and 72 h later fixed and
subjected to FACS. The histograms obtained were analysed with ModfFit to measure the
percentage of cells in each cell cycle phase.
II. HCT116 p21 -/- cells were transfected with siRNAs against Dusp18 and their confluence was
measured 48h and 72h after transfection. The increase in confluence within that time is
represented in the graphs. Error bars indicate standard deviation from 4 different dilutions of
cells (see Methods §3.1.3).
III. HCT116 p21 -/- cells were transfected with siRNAs against Dusp18 and their confluence was
measured 48, 72 and 96h after transfection. The increase in confluence (log2 scale) within that
time is represented in the graph.
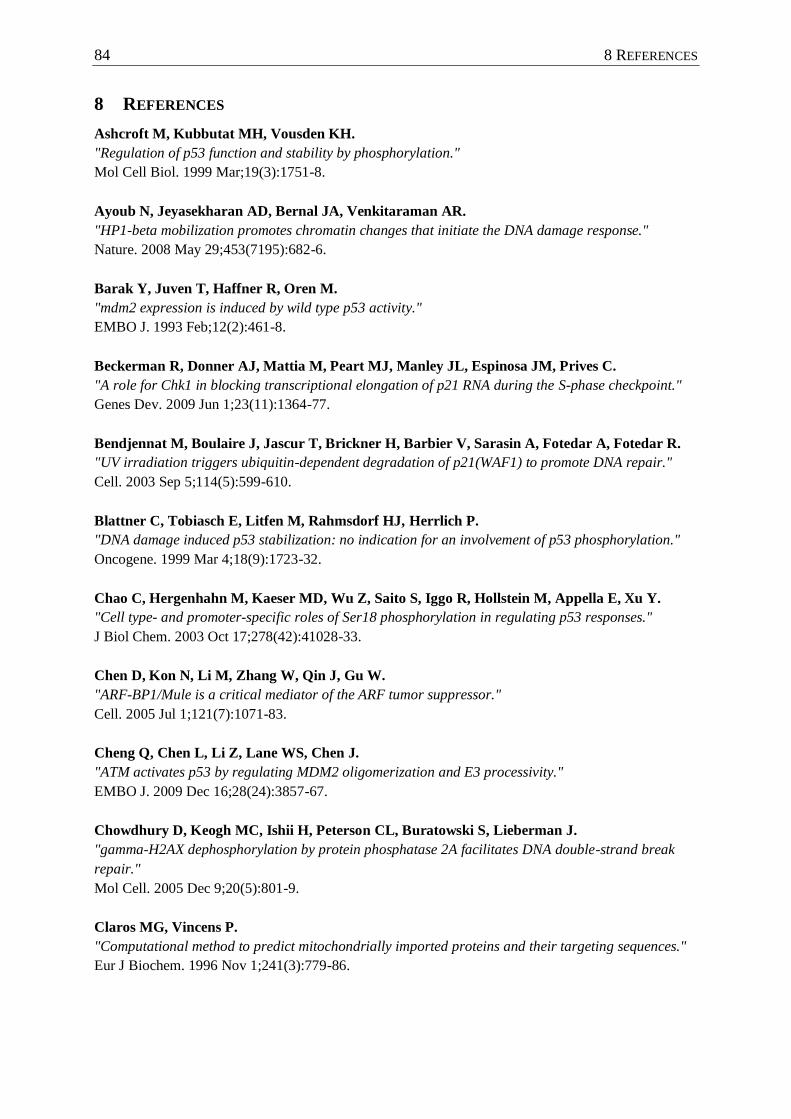
84 8 REFERENCES
8 REFERENCES
Ashcroft M, Kubbutat MH, Vousden KH.
"Regulation of p53 function and stability by phosphorylation."
Mol Cell Biol. 1999 Mar;19(3):1751-8.
Ayoub N, Jeyasekharan AD, Bernal JA, Venkitaraman AR.
"HP1-beta mobilization promotes chromatin changes that initiate the DNA damage response."
Nature. 2008 May 29;453(7195):682-6.
Barak Y, Juven T, Haffner R, Oren M.
"mdm2 expression is induced by wild type p53 activity."
EMBO J. 1993 Feb;12(2):461-8.
Beckerman R, Donner AJ, Mattia M, Peart MJ, Manley JL, Espinosa JM, Prives C.
"A role for Chk1 in blocking transcriptional elongation of p21 RNA during the S-phase checkpoint."
Genes Dev. 2009 Jun 1;23(11):1364-77.
Bendjennat M, Boulaire J, Jascur T, Brickner H, Barbier V, Sarasin A, Fotedar A, Fotedar R.
"UV irradiation triggers ubiquitin-dependent degradation of p21(WAF1) to promote DNA repair."
Cell. 2003 Sep 5;114(5):599-610.
Blattner C, Tobiasch E, Litfen M, Rahmsdorf HJ, Herrlich P.
"DNA damage induced p53 stabilization: no indication for an involvement of p53 phosphorylation."
Oncogene. 1999 Mar 4;18(9):1723-32.
Chao C, Hergenhahn M, Kaeser MD, Wu Z, Saito S, Iggo R, Hollstein M, Appella E, Xu Y.
"Cell type- and promoter-specific roles of Ser18 phosphorylation in regulating p53 responses."
J Biol Chem. 2003 Oct 17;278(42):41028-33.
Chen D, Kon N, Li M, Zhang W, Qin J, Gu W.
"ARF-BP1/Mule is a critical mediator of the ARF tumor suppressor."
Cell. 2005 Jul 1;121(7):1071-83.
Cheng Q, Chen L, Li Z, Lane WS, Chen J.
"ATM activates p53 by regulating MDM2 oligomerization and E3 processivity."
EMBO J. 2009 Dec 16;28(24):3857-67.
Chowdhury D, Keogh MC, Ishii H, Peterson CL, Buratowski S, Lieberman J.
"gamma-H2AX dephosphorylation by protein phosphatase 2A facilitates DNA double-strand break
repair."
Mol Cell. 2005 Dec 9;20(5):801-9.
Claros MG, Vincens P.
"Computational method to predict mitochondrially imported proteins and their targeting sequences."
Eur J Biochem. 1996 Nov 1;241(3):779-86.
8 REFERENCES 85
Cohen PT.
"Protein phosphatase 1--targeted in many directions."
J Cell Sci. 2002 Jan 15;115(Pt 2):241-56.
Colombo E, Bonetti P, Lazzerini Denchi E, Martinelli P, Zamponi R, Marine JC, Helin K, Falini
B, Pelicci PG.
"Nucleophosmin is required for DNA integrity and p19Arf protein stability."
Mol Cell Biol. 2005 Oct;25(20):8874-86.
Costanzo V, Shechter D, Lupardus PJ, Cimprich KA, Gottesman M, Gautier J.
"An ATR- and Cdc7-dependent DNA damage checkpoint that inhibits initiation of DNA replication."
Mol Cell. 2003 Jan;11(1):203-13.
Damrot J, Helbig L, Roos WP, Barrantes SQ, Kaina B, Fritz G.
"DNA replication arrest in response to genotoxic stress provokes early activation of stress-activated
protein kinases (SAPK/JNK)."
J Mol Biol. 2009 Feb 6;385(5):1409-21.
Das S, Boswell SA, Aaronson SA, Lee SW.
"P53 promoter selection: choosing between life and death."
Cell Cycle. 2008 Jan 15;7(2):154-7.
de Rozieres S, Maya R, Oren M, Lozano G.
"The loss of mdm2 induces p53-mediated apoptosis."
Oncogene. 2000 Mar 23;19(13):1691-7.
den Elzen N, Kosoy A, Christopoulos H, O'Connell MJ.
"Resisting arrest: recovery from checkpoint arrest through dephosphorylation of Chk1 by PP1."
Cell Cycle. 2004 May;3(5):529-33.
den Elzen NR, O'Connell MJ.
"Recovery from DNA damage checkpoint arrest by PP1-mediated inhibition of Chk1."
EMBO J. 2004 Feb 25;23(4):908-18.
Dhanasekaran DN, Johnson GL.
"MAPKs: function, regulation, role in cancer and therapeutic targeting."
Oncogene. 2007 May 14;26(22):3097-9.
Donner AJ, Hoover JM, Szostek SA, Espinosa JM.
"Stimulus-specific transcriptional regulation within the p53 network."
Cell Cycle. 2007 Nov 1;6(21):2594-8.
Donner AJ, Szostek S, Hoover JM, Espinosa JM.
"CDK8 is a stimulus-specific positive coregulator of p53 target genes."
Mol Cell. 2007 Jul 6;27(1):121-33.
86 8 REFERENCES
Dornan D, Wertz I, Shimizu H, Arnott D, Frantz GD, Dowd P, O'Rourke K, Koeppen H, Dixit
VM
"The ubiquitin ligase COP1 is a critical negative regulator of p53."
Nature. 2004 May 6;429(6987):86-92.
Douglas P, Zhong J, Ye R, Moorhead GB, Xu X, Lees-Miller SP.
"Protein phosphatase 6 interacts with the DNA-dependent protein kinase catalytic subunit and
dephosphorylates gamma-H2AX."
Mol Cell Biol. 2010 Mar;30(6):1368-81.
Dumaz N, Meek DW.
"Serine15 phosphorylation stimulates p53 transactivation but does not directly influence interaction
with HDM2."
EMBO J. 1999 Dec 15;18(24):7002-10.
el-Deiry WS, Harper JW, O'Connor PM, Velculescu VE, Canman CE, Jackman J, Pietenpol JA,
Burrell M, Hill DE, Wang Y, et al.
"WAF1/CIP1 is induced in p53-mediated G1 arrest and apoptosis."
Cancer Res. 1994 Mar 1;54(5):1169-74.
Eymin B, Karayan L, Séité P, Brambilla C, Brambilla E, Larsen CJ, Gazzéri S.
"Human ARF binds E2F1 and inhibits its transcriptional activity."
Oncogene. 2001 Mar 1;20(9):1033-41.
Feng J, Wakeman T, Yong S, Wu X, Kornbluth S, Wang XF.
"Protein phosphatase 2A-dependent dephosphorylation of replication protein A is required for the
repair
of DNA breaks induced by replication stress."
Mol Cell Biol. 2009 Nov;29(21):5696-709.
Feng L, Hollstein M, Xu Y.
"Ser46 phosphorylation regulates p53-dependent apoptosis and replicative senescence."
Cell Cycle. 2006 Dec;5(23):2812-9.
Gilmour DS, Lis JT.
"In vivo interactions of RNA polymerase II with genes of Drosophila melanogaster."
Mol Cell Biol. 1985 Aug;5(8):2009-18.
Goodarzi AA, Jonnalagadda JC, Douglas P, Young D, Ye R, Moorhead GB, Lees-Miller SP,
Khanna KK.
"Autophosphorylation of ataxia-telangiectasia mutated is regulated by protein phosphatase 2A."
EMBO J. 2004 Nov 10;23(22):4451-61.
Gui CY, Ngo L, Xu WS, Richon VM, Marks PA.
"Histone deacetylase (HDAC) inhibitor activation of p21WAF1 involves changes in promoter-
associated proteins, including HDAC1."
Proc Natl Acad Sci U S A. 2004 Feb 3;101(5):1241-6.
8 REFERENCES 87
Hainaut P, Hollstein M.
"p53 and human cancer: the first ten thousand mutations."
Adv Cancer Res. 2000;77:81-137
Harper JW, Adami GR, Wei N, Keyomarsi K, Elledge SJ.
"The p21 Cdk-interacting protein Cip1 is a potent inhibitor of G1 cyclin-dependent kinases."
Cell. 1993 Nov 19;75(4):805-16.
Haupt Y, Maya R, Kazaz A, Oren M.
"Mdm2 promotes the rapid degradation of p53."
Nature. 1997 May 15;387(6630):296-9.
Hood KL, Tobin JF, Yoon C.
"Identification and characterization of two novel low-molecular-weight dual specificity
phosphatases."
Biochem Biophys Res Commun. 2002 Nov 8;298(4):545-51.
Hu MC, Qiu WR, Wang YP.
"JNK1, JNK2 and JNK3 are p53 N-terminal serine 34 kinases."
Oncogene. 1997 Nov 6;15(19):2277-87.
Ishiguro T, Saitoh J, Yawata H, Yamagishi H, Iwasaki S, Mitoma Y.
"Homogeneous quantitative assay of hepatitis C virus RNA by polymerase chain reaction in the
presence of a fluorescent intercalater."
Anal Biochem. 1995 Aug 10;229(2):207-13.
Jang YJ, Ji JH, Choi YC, Ryu CJ, Ko SY.
"Regulation of Polo-like kinase 1 by DNA damage in mitosis. Inhibition of mitotic PLK-1 by protein
phosphatase 2A."
J Biol Chem. 2007 Jan 26;282(4):2473-82.
Jentsch S, Siepe D.
"Pin1, a novel switch in the ubiquitin pathway."
Cell Cycle. 2009 Dec;8(23):3800-1.
Jeong DG, Cho YH, Yoon TS, Kim JH, Son JH, Ryu SE, Kim SJ.
"Structure of human DSP18, a member of the dual-specificity protein tyrosine phosphatase family."
Acta Crystallogr D Biol Crystallogr. 2006 Jun;62(Pt 6):582-8.
Jeong SJ, Kim HJ, Yang YJ, Seol JH, Jung BY, Han JW, Lee HW, Cho EJ.
"Role of RNA polymerase II carboxy terminal domain phosphorylation in DNA damage response."
J Microbiol. 2005 Dec;43(6):516-22.
Jones SN, Roe AE, Donehower LA, Bradley A.
"Rescue of embryonic lethality in Mdm2-deficient mice by absence of p53."
Nature. 1995 Nov 9;378(6553):206-8.
88 8 REFERENCES
Joseph Sambrook, David W. Russell
"Preparation and Transformation of Competent E. coli Using Calcium Chloride"
Molecular Cloning, 3rd edition; Cold Spring Harbor Laboratory Press, Cold Spring Harbor, NY,
USA, 2001
Kaku S, Iwahashi Y, Kuraishi A, Albor A, Yamagishi T, Nakaike S, Kulesz-Martin M.
"Binding to the naturally occurring double p53 binding site of the Mdm2 promoter alleviates the
requirement for p53 C-terminal activation."
Nucleic Acids Res. 2001 May 1;29(9):1989-93.
Kastan MB, Bartek J.
"Cell-cycle checkpoints and cancer."
Nature. 2004 Nov 18;432(7015):316-23.
Keyse SM.
"Dual-specificity MAP kinase phosphatases (MKPs) and cancer."
Cancer Metastasis Rev. 2008 Jun;27(2):253-61.
Kim SJ, Hwang SG, Shin DY, Kang SS, Chun JS.
"p38 kinase regulates nitric oxide-induced apoptosis of articular chondrocytes by accumulating p53
via NFkappa B-dependent transcription and stabilization by serine 15 phosphorylation."
J Biol Chem. 2002 Sep 6;277(36):33501-8.
Koutsodontis G, Kardassis D.
"Inhibition of p53-mediated transcriptional responses by mithramycin A."
Oncogene. 2004 Dec 9;23(57):9190-200.
Kranz D, Dohmesen C, Dobbelstein M.
"BRCA1 and Tip60 determine the cellular response to ultraviolet irradiation through distinct
pathways."
J Cell Biol. 2008 Jul 14;182(1):197-213.
Kruse JP, Gu W.
"Modes of p53 regulation."
Cell. 2009 May 15;137(4):609-22.
Kubbutat MH, Jones SN, Vousden KH.
"Regulation of p53 stability by Mdm2."
Nature. 1997 May 15;387(6630):299-303.
Kurki S, Peltonen K, Latonen L, Kiviharju TM, Ojala PM, Meek D, Laiho M.
"Nucleolar protein NPM interacts with HDM2 and protects tumor suppressor protein p53 from
HDM2-mediated degradation."
Cancer Cell. 2004 May;5(5):465-75.
8 REFERENCES 89
Lafarga V, Cuadrado A, Lopez de Silanes I, Bengoechea R, Fernandez-Capetillo O, Nebreda
AR.
"p38 Mitogen-activated protein kinase- and HuR-dependent stabilization of p21(Cip1) mRNA
mediates the G(1)/S checkpoint."
Mol Cell Biol. 2009 Aug;29(16):4341-51.
Lakin ND, Jackson SP.
"Regulation of p53 in response to DNA damage."
Oncogene. 1999 Dec 13;18(53):7644-55.
Lambert PF, Kashanchi F, Radonovich MF, Shiekhattar R, Brady JN.
"Phosphorylation of p53 serine 15 increases interaction with CBP."
J Biol Chem. 1998 Dec 4;273(49):33048-53.
Lane DP.
"Cancer. p53, guardian of the genome."
Nature. 1992 Jul 2;358(6381):15-6.
Le Guezennec X, Bulavin DV.
"WIP1 phosphatase at the crossroads of cancer and aging."
Trends Biochem Sci. 2010 Feb;35(2):109-14.
Lee HJ, Hwang HI, Jang YJ.
"Mitotic DNA damage response: Polo-like kinase-1 is dephosphorylated through ATM-Chk1
pathway."
Cell Cycle. 2010 Jun 25;9(12).
Leng RP, Lin Y, Ma W, Wu H, Lemmers B, Chung S, Parant JM, Lozano G, Hakem R,
Benchimol S.
"Pirh2, a p53-induced ubiquitin-protein ligase, promotes p53 degradation."
Cell. 2003 Mar 21;112(6):779-91.
Levine AJ, Momand J, Finlay CA.
"The p53 tumour suppressor gene."
Nature. 1991 Jun 6;351(6326):453-6.
Li M, Luo J, Brooks CL, Gu W.
"Acetylation of p53 inhibits its ubiquitination by Mdm2."
J Biol Chem. 2002 Dec 27;277(52):50607-11.
Linke K, Mace PD, Smith CA, Vaux DL, Silke J, Day CL.
"Structure of the MDM2/MDMX RING domain heterodimer reveals dimerization is required for their
ubiquitylation in trans."
Cell Death Differ. 2008 May;15(5):841-8.
90 8 REFERENCES
Livak KJ, Schmittgen TD.
"Analysis of relative gene expression data using real-time quantitative PCR and the 2(-Delta Delta
C(T)) Method."
Methods. 2001 Dec;25(4):402-8.
Lou Z, Chen J.
"BRCA proteins and DNA damage checkpoints."
Front Biosci. 2003 May 1;8:s718-21.
Lu X, Nannenga B, Donehower LA.
"PPM1D dephosphorylates Chk1 and p53 and abrogates cell cycle checkpoints."
Genes Dev. 2005 May 15;19(10):1162-74.
Macůrek L, Lindqvist A, Voets O, Kool J, Vos HR, Medema RH.
"Wip1 phosphatase is associated with chromatin and dephosphorylates gammaH2AX to promote
checkpoint inhibition."
Oncogene. 2010 Apr 15;29(15):2281-91.
Mah LJ, Vasireddy RS, Tang MM, Georgiadis GT, El-Osta A, Karagiannis TC.
"Quantification of gammaH2AX foci in response to ionising radiation."
J Vis Exp. 2010 Apr 6;(38). pii: 1957. doi: 10.3791/1957.
Manning G, Whyte DB, Martinez R, Hunter T, Sudarsanam S.
"The protein kinase complement of the human genome."
Science. 2002 Dec 6;298(5600):1912-34.
Mason SL, Loughran O, La Thangue NB.
"p14(ARF) regulates E2F activity."
Oncogene. 2002 Jun 20;21(27):4220-30.
Matozaki T, Suzuki T, Uchida T, Inazawa J, Ariyama T, Matsuda K, Horita K, Noguchi H,
Mizuno H, Sakamoto C, et al.
"Molecular cloning of a human transmembrane-type protein tyrosine phosphatase and its expression
in gastrointestinal cancers."
J Biol Chem. 1994 Jan 21;269(3):2075-81.
Mattia M, Gottifredi V, McKinney K, Prives C.
"p53-Dependent p21 mRNA elongation is impaired when DNA replication is stalled."
Mol Cell Biol. 2007 Feb;27(4):1309-20.
McLure KG, Lee PW.
"How p53 binds DNA as a tetramer."
EMBO J. 1998 Jun 15;17(12):3342-50.
Moll UM, Wolff S, Speidel D, Deppert W.
"Transcription-independent pro-apoptotic functions of p53."
Curr Opin Cell Biol. 2005 Dec;17(6):631-6.
8 REFERENCES 91
Montes de Oca Luna R, Wagner DS, Lozano G
"Rescue of early embryonic lethality in mdm2-deficient mice by deletion of p53."
Nature. 1995 Nov 9;378(6553):203-6.
Moon SH, Nguyen TA, Darlington Y, Lu X, Donehower LA.
"Dephosphorylation of gammaH2AX by WIP1: An important homeostatic regulatory event in DNA
repair and cell cycle control."
Cell Cycle. 2010 Jun 12;9(11).
Moorhead GB, Trinkle-Mulcahy L, Ulke-Lemée A.
"Emerging roles of nuclear protein phosphatases."
Nat Rev Mol Cell Biol. 2007 Mar;8(3):234-44.
Moustakas A, Kardassis D.
"Regulation of the human p21/WAF1/Cip1 promoter in hepatic cells by functional interactions
between Sp1 and Smad family members."
Proc Natl Acad Sci U S A. 1998 Jun 9;95(12):6733-8.
Mullis KB, Faloona FA.
"Specific synthesis of DNA in vitro via a polymerase-catalyzed chain reaction."
Methods Enzymol. 1987;155:335-50.
Nakada S, Chen GI, Gingras AC, Durocher D.
"PP4 is a gamma H2AX phosphatase required for recovery from the DNA damage checkpoint."
EMBO Rep. 2008 Oct;9(10):1019-26.
Nüsse M, Egner HJ.
"Can nocodazole, an inhibitor of microtubule formation, be used to synchronize mammalian cells?
Accumulation of cells in mitosis studied by two parametric flow cytometry using acridine orange and
by DNA distribution analysis."
Cell Tissue Kinet. 1984 Jan;17(1):13-23.
Osaki M, Oshimura M, Ito H.
"PI3K-Akt pathway: its functions and alterations in human cancer."
Apoptosis. 2004 Nov;9(6):667-76.
Owens DM, Keyse SM.
"Differential regulation of MAP kinase signalling by dual-specificity protein phosphatases."
Oncogene. 2007 May 14;26(22):3203-13.
Patterson KI, Brummer T, O'Brien PM, Daly RJ.
"Dual-specificity phosphatases: critical regulators with diverse cellular targets."
Biochem J. 2009 Mar 15;418(3):475-89.
92 8 REFERENCES
Rardin MJ, Wiley SE, Murphy AN, Pagliarini DJ, Dixon JE.
"Dual specificity phosphatases 18 and 21 target to opposing sides of the mitochondrial inner
membrane."
J Biol Chem. 2008 May 30;283(22):15440-50.
Rizos H, Scurr LL, Irvine M, Alling NJ, Kefford RF.
"p14ARF regulates E2F-1 ubiquitination and degradation via a p53-dependent mechanism."
Cell Cycle. 2007 Jul 15;6(14):1741-7.
Roy SK, Srivastava RK, Shankar S.
"Inhibition of PI3K/AKT and MAPK/ERK pathways causes activation of FOXO transcription factor,
leading to cell cycle arrest and apoptosis in pancreatic cancer."
J Mol Signal. 2010 Jul 19;5:10.
Saito J, Toriumi S, Awano K, Ichijo H, Sasaki K, Kobayashi T, Tamura S.
"Regulation of apoptosis signal-regulating kinase 1 by protein phosphatase 2Cepsilon."
Biochem J. 2007 Aug 1;405(3):591-6.
Saito Y, Gopalan B, Mhashilkar AM, Roth JA, Chada S, Zumstein L, Ramesh R.
"Adenovirus-mediated PTEN treatment combined with caffeine produces a synergistic therapeutic
effect in colorectal cancer cells."
Cancer Gene Ther. 2003 Nov;10(11):803-13.
Sakaguchi K, Herrera JE, Saito S, Miki T, Bustin M, Vassilev A, Anderson CW, Appella E.
"DNA damage activates p53 through a phosphorylation-acetylation cascade."
Genes Dev. 1998 Sep 15;12(18):2831-41.
Sanchez-Prieto R, Rojas JM, Taya Y, Gutkind JS.
"A role for the p38 mitogen-acitvated protein kinase pathway in the transcriptional activation of p53
on genotoxic stress by chemotherapeutic agents."
Cancer Res. 2000 May 1;60(9):2464-72.
Seki N, Hattori A, Hayashi A, Kozuma S, Ohira M, Hori T, Saito T.
"Structure, expression profile and chromosomal location of an isolog of DNA-PKcs interacting
protein (KIP) gene."
Biochim Biophys Acta. 1999 Jan 18;1444(1):143-7.
Shieh SY, Ikeda M, Taya Y, Prives C.
"DNA damage-induced phosphorylation of p53 alleviates inhibition by MDM2."
Cell. 1997 Oct 31;91(3):325-34.
Shinozaki T, Nota A, Taya Y, Okamoto K.
"Functional role of Mdm2 phosphorylation by ATR in attenuation of p53 nuclear export."
Oncogene. 2003 Dec 4;22(55):8870-80.
8 REFERENCES 93
Shiomi Y, Masutani C, Hanaoka F, Kimura H, Tsurimoto T.
"A second proliferating cell nuclear antigen loader complex, Ctf18-replication factor C, stimulates
DNA polymerase eta activity."
J Biol Chem. 2007 Jul 20;282(29):20906-14.
Siliciano JD, Canman CE, Taya Y, Sakaguchi K, Appella E, Kastan MB.
"DNA damage induces phosphorylation of the amino terminus of p53."
Genes Dev. 1997 Dec 15;11(24):3471-81.
Suzuki K, Okada H, Yamauchi M, Oka Y, Kodama S, Watanabe M.
"Qualitative and quantitative analysis of phosphorylated ATM foci induced by low-dose ionizing
radiation."
Radiat Res. 2006 May;165(5):499-504.
Tan NY, Khachigian LM.
"Sp1 phosphorylation and its regulation of gene transcription."
Mol Cell Biol. 2009 May;29(10):2483-8.
Tang X, Hui ZG, Cui XL, Garg R, Kastan MB, Xu B.
"A novel ATM-dependent pathway regulates protein phosphatase 1 in response to DNA damage."
Mol Cell Biol. 2008 Apr;28(8):2559-66.
Tian B, Yang Q, Mao Z.
"Phosphorylation of ATM by Cdk5 mediates DNA damage signalling and regulates neuronal death."
Nat Cell Biol. 2009 Feb;11(2):211-8.
Torres M.
"Mitogen-activated protein kinase pathways in redox signaling."
Front Biosci. 2003 Jan 1;8:d369-91.
Trinkle-Mulcahy L, Lamond AI.
"Mitotic phosphatases: no longer silent partners."
Curr Opin Cell Biol. 2006 Dec;18(6):623-31.
Villiard E, Brinkmann H, Moiseeva O, Mallette FA, Ferbeyre G, Roy S.
"Urodele p53 tolerates amino acid changes found in p53 variants linked to human cancer."
BMC Evol Biol. 2007 Sep 28;7:180.
Vogelstein B, Lane D, Levine AJ.
"Surfing the p53 network."
Nature. 2000 Nov 16;408(6810):307-10.
Wang B, Matsuoka S, Carpenter PB, Elledge SJ.
"53BP1, a mediator of the DNA damage checkpoint."
Science. 2002 Nov 15;298(5597):1435-8.
94 8 REFERENCES
Wu Q, Gu S, Dai J, Dai J, Wang L, Li Y, Zeng L, Xu J, Ye X, Zhao W, Ji C, Xie Y, Mao Y.
"Molecular cloning and characterization of a novel dual-specificity phosphatase18 gene from human
fetal brain."
Biochim Biophys Acta. 2003 Feb 20;1625(3):296-304.
Wu Q, Huang S, Sun Y, Gu S, Lu F, Dai J, Yin G, Sun L, Zheng D, Dou C, Feng C, Ji C, Xie Y,
Mao Y.
"Dual specificity phosphotase 18, interacting with SAPK, dephosphorylates SAPK and inhibits
SAPK/JNK signal pathway in vivo."
Front Biosci. 2006 Sep 1;11:2714-24.
Wu X, Nguyen BC, Dziunycz P, Chang S, Brooks Y, Lefort K, Hofbauer GF, Dotto GP.
"Opposing roles for calcineurin and ATF3 in squamous skin cancer."
Nature. 2010 May 20;465(7296):368-72.
Yamasaki S, Yagishita N, Sasaki T, Nakazawa M, Kato Y, Yamadera T, Bae E, Toriyama S,
Ikeda R, Zhang L, Fujitani K, Yoo E, Tsuchimochi K, Ohta T, Araya N, Fujita H, Aratani S,
Eguchi K, Komiya S, Maruyama I, Higashi N, Sato M, Senoo H, Ochi T, Yokoyama S, Amano T,
Kim J, Gay S, Fukamizu A, Nishioka K, Tanaka K, Nakajima T.
"Cytoplasmic destruction of p53 by the endoplasmic reticulum-resident ubiquitin ligase 'Synoviolin'."
EMBO J. 2007 Jan 10;26(1):113-22.
Yoon HS, Chen X, Yang VW.
"Kruppel-like factor 4 mediates p53-dependent G1/S cell cycle arrest in response to DNA damage."
J Biol Chem. 2003 Jan 24;278(4):2101-5.
Zama T, Aoki R, Kamimoto T, Inoue K, Ikeda Y, Hagiwara M.
"Scaffold role of a mitogen-activated protein kinase phosphatase, SKRP1, for the JNK signaling
pathway."
J Biol Chem. 2002 Jun 28;277(26):23919-26.
Zama T, Aoki R, Kamimoto T, Inoue K, Ikeda Y, Hagiwara M.
"A novel dual specificity phosphatase SKRP1 interacts with the MAPK kinase MKK7 and inactivates
the JNK MAPK pathway. Implication for the precise regulation of the particular MAPK pathway."
J Biol Chem. 2002 Jun 28;277(26):23909-18.
Zhang J, Bao S, Furumai R, Kucera KS, Ali A, Dean NM, Wang XF.
"Protein phosphatase 5 is required for ATR-mediated checkpoint activation."
Mol Cell Biol. 2005 Nov;25(22):9910-9.
Zhang Y, Xiong Y, Yarbrough WG.
"ARF promotes MDM2 degradation and stabilizes p53: ARF-INK4a locus deletion impairs both the
Rb and p53 tumor suppression pathways."
Cell. 1998 Mar 20;92(6):725-34.
95
Konstantina Marinoglou
Hannoversche Str. 10
37075 Göttingen
Germany
phone: +49 (0)163-682 5158
email: [email protected]
Education:
10/2006 – 10/2010
PhD position in the Department of Molecular
Oncology, University of Göttingen, Germany
10/2006 - 03/2007
MSc in Molecular Biology (Grade A)
“Analysis of p53 in Drosophila”
Dept. of Molecular Oncology, Uni Gö
08/2006 MSc exams (Grade B)
09/2005 - present
Studying within the MSc/PhD Molecular Biology
program of International Max Planck Research
School.
06/2003 - 03/2005
Diploma thesis
Dept. of Molecular Genetics, University of
Athens, Greece
09/2000 - 03/2005 Diploma in Biology (7,33 out of 10)
University of Athens, Greece
09/1997 - 06/2000
Higher Secondary School education, National
greek exams (19,3 out of 20)
3rd
Nikea High School, Nikea, Greece
Laboratory Techniques & Experience:
MSc. & PhD work
Drosophila & Mammalian cell culture, DNA and
siRNA transfections, reporter assays,
immunofluorescence, cell viability assays,
western blot, dsRNA preparation & purification,
using automated pipetting and microscopy to
perform a HTS.
Diploma Thesis work
Basic molecular techniques, cloning, DNA and
RNA purification from different sources, PCR,
working with radioactive phosphorus and
bacterial phages, screening of phage libraries.
96
Skills:
Languages
Greek (native)
English (fluent)
German (good)
Computers
Use of Microsoft Office, internet, Bioinformatic
tools, Special programs for scientists (BioEdit,
Vector NTI), NCBI databases and software,
Flybase, ApE.
Advanced Methods & Secondary Skill courses
Project Management
Drug Discovery Course
Training in handling automated pipetting and
microscopy systems
Scientific communication
Scholarships:
04/2009 - 10/2010
01/2009 - 03/2009
DFG Stipend (GRK 1034)
GGNB Bridging Stipend
10/2006 - 12/2008 Lichtenberg Stipend (Niedersachsen)
09/2005 - 09/2006 Stipend International Max Planck Research
School
Interests:
Reading, guitar playing, team sports such as volleyball, tae kwon do, computer games. During 2007-
2009 member of the International PhD Symposium “Horizons in Molecular Biology” organizing team,
especially involved in the organization of the Horizons Career Fair for scientists.
Reference:
Prof. Dr. med. Matthias Dobbelstein
AG Molekulare Onkologie
GZMB
Justus-von-Liebig Weg 11
37077 Göttingen
Germany