Clemson UniversityTigerPrints
All Dissertations Dissertations
5-2018
Perception-Action System Calibration in thePresence of Stable and Unstable PerceptualPerturbationsLeah HartmanClemson University, [email protected]
Follow this and additional works at: https://tigerprints.clemson.edu/all_dissertations
This Dissertation is brought to you for free and open access by the Dissertations at TigerPrints. It has been accepted for inclusion in All Dissertations byan authorized administrator of TigerPrints. For more information, please contact [email protected].
Recommended CitationHartman, Leah, "Perception-Action System Calibration in the Presence of Stable and Unstable Perceptual Perturbations" (2018). AllDissertations. 2144.https://tigerprints.clemson.edu/all_dissertations/2144
PERCEPTION-ACTION SYSTEM CALIBRATION IN THE PRESENCE OF STABLE AND UNSTABLE PERCEPTUAL PERTURBATIONS
A Dissertation Presented to
the Graduate School of Clemson University
In Partial Fulfillment of the Requirements for the Degree
Doctor of Philosophy Human Factors Psychology
Accepted by:Dr. Christopher Pagano, Committee Chair
Dr. Dewayne Moore Dr. Rick Tyrrell Dr. Eric Muth
by Leah Hartman
May 2018

ii
ABSTRACT
Actors are able to calibrate to various changes to both their own abilities and their
surrounding environments. Most calibration studies have examined recalibration to stable
perturbations (i.e., a single, constant change). However, numerous real-world experiences
involve perturbations that do not remain constant. The present studies investigated the
effect of varying perturbations on postural sway and prospective control. It was
hypothesized that short-timescale variations of a perturbation would affect participants’
ability to recalibrate. Specifically, the different patterns of perturbation would result in a
change to postural sway that would mediate the relationship between the condition and
the ability to calibrate. It was found that accuracy was dependent on the type of
environmental conditions of the perturbation change (i.e., the rate of change or the pattern
of change). However, in general, calibration effects were found for all conditions. The
different perturbations also affected the amount of postural sway. The proposed mediated
relationship was not supported by this series of experiments. However, this is most likely
due to the task not creating enough variability within the variables of interest. The results
of these experiments provide further evidence for perception-action system calibration
mechanism through task-relevant feedback.
Author Keywords Perception-action, calibration, virtual reality, unstable environments

iii
DEDICATION
“Sometimes you can only find Heaven by slowly backing away from Hell.” -Carrie Fisher
This is dedicated to everyone who supported me as I backed away from my hell to find
my heaven. Thank you to my family and friends for giving me their unconditional love,
support and protection while I demolished my old life to make a new one that I love.
Mom, Dad, and Skye: thank you for being the most incredible, supportive, and loving
family through everything and I would not be here without you. Lastly, to my advisor and
friend, Dr. Chris Pagano, thank you for taking a chance on me and allowing me the
freedom to explore and find my voice.

iv
ACKNOWLEDGEMENT
This work has taken three years to develop and complete. It would not have been
possible without the support of numerous individuals. I would like to start by saying
thank you to my fellow Clemson human factors graduate students both past and present.
Most of you have acted as sounding boards for these ideas, provided feedback and
technical support throughout the different stages of this process. Thank you for being the
best kind of Clemson family.
I would like to thank my Perception and Action lab-mates: Brian Day, Katie
Lucaites, and Hannah Solini. Thank you for listening to my ranting and ravings of the
barely formed ideas during the early stages. Thank you for helping me verbalize and
organize these into a format that others could actually understand. Thank you for all of
the technical support and the time commitment of running participants. Lastly, and most
importantly, thank you for being my emotional support group and making me laugh
through everything. Each of you are so incredibly special to me and I am so unbelievably
fortunate to have had the opportunity to work with each of you. I love you so much lab
family.
Secondly, I would like to thank Ayush Bhargava and Dr. Andrew Robb who
developed the virtual environment used in this dissertation. Your ability to create exactly
what was in my mind has been incredible. Thank you for making some of my more
difficult requests possible and for creating such an easy-to-use interface. This has literally
been the smoothest collaboration effort I have experienced at Clemson. Thank you both
for making that possible.

v
Next, I would like to thank my committee members: Dr. DeWayne Moore, Dr.
Eric Muth, and Dr. Rick Tyrrell. I individually selected you because of the respect I have
for each of you in your respective fields of expertise. Additionally, I knew that individual
and collectively you would help push me to develop the best dissertation from my ideas
and reach a level of excellence. Thank you for your guidance through this project and
through my time in graduate school. You have all played huge roles in my time here at
Clemson and I thank you for all of the advice and support over the years. I would like to
especially thank Dr. Moore for being like a second mentor to me. Thank you for letting
me essentially camp in your office for multiple hours throughout any given week. This
dissertation’s results would not have been possible without your guidance and instruction
over the years.
Lastly, I would like to thank one of the most influential individuals in my life, my
graduate advisor and mentor, Dr. Chris Pagano. Chris, I am not sure there are words to
express my gratitude to you. Thank you for giving me this life changing opportunity—
you will never know what this chance has meant to me. Thank you for allowing me the
freedom to try and do (almost) anything I dreamt up. Thank you for also telling me “no”
when I needed to hear it. I have always felt secure as I explored and developed knowing
you were there for support and guidance. Thank you for arguing with me and playing
devil’s advocate even when I hated it. The last five-years have been a dream and I have
loved every minute of it. I am so proud to have worked with and for you. Thank you for
being the most exceptional mentor and friend.

vi
TABLE OF CONTENTS
Page TITLE PAGE ........................................................................................................................i ABSTRACT ...........................................................................................................................ii DEDICATION .......................................................................................................................iii ACKNOWLEDGEMENT .....................................................................................................iv LIST OF FIGURES ...............................................................................................................ix LIST OF TABLES .................................................................................................................xiv LIST OF APPENDICES ........................................................................................................xvii
CHAPTER I. PERCEPTUAL ADAPTATION IN THE PRESENCE OF STABLE
AND UNSTABLE PERCEPTUAL PERTURBATIONS ...................................1 1. Direct Perception .................................................................................................1 2. Development, Attunement, and Calibration of Perceptual-Motor
System ..............................................................................................................3 33. Perceiving Affordances ......................................................................................5
3.1 The Effect of Postural Sway on Affordance Judgements ..............................7 3.2 Calibration to Changes in Affordances ..........................................................9 3.2 Virtual Reality as a Tool to Examine Affordance Perceptions ......................13
4. Purpose and Goals ................................................................................................15
II. EXPERIMENT ONE ...........................................................................................16 1. Hypotheses ...........................................................................................................19 2. Methods................................................................................................................20
2.1. Participants ....................................................................................................20 2.2. Materials & Apparatus ..................................................................................21
2.2.1. Wii Balance Board (WBB) .................................................................21 2.2.2. Motion Tracking .................................................................................22 2.2.3. Virtual Environment ...........................................................................23
3. Procedure .............................................................................................................24 3.1. Pre-Test .........................................................................................................28 3.2. Experimental Phase .......................................................................................28 3.2.1. Block 1: Baseline Phase .............................................................................28 3.3. Blocks 2-6: Experimental Phase ...................................................................28 3.4. Post-test .........................................................................................................29
4. Data Preprocessing ...............................................................................................29 4.1. Postural Sway: Entropy .................................................................................29 4.2. Transformation Variables .............................................................................30

vii
4.2.1. Accuracy: Absolute Error ...................................................................30 4.2.2. Target Specifying Variables ...............................................................31
4.2.3. Head Movement Variables .................................................................33 4.3. Variable Reference Specification .................................................................33
4.3.1. Categorical Variables .........................................................................33 4.3.2. Continuous Variables .........................................................................34
5. Results ...................................................................................................................34 5.1. Outlier Analysis ............................................................................................35 5.2. Hierarchical Linear Modeling (HLM) .........................................................36 5.3. Accuracy: Absolute Error (degrees) .............................................................37
5.3.1 Experimental Block Analyses ..............................................................38 5.3.1.1. Primary Variable Analysis .....................................................38 5.3.1.2. Secondary Variable Analysis .................................................50
5.3.2. Pre-/ Post-Test Analyses .....................................................................54 5.3.2.1. Primary Variable Analysis ....................................................54 5.3.2.2. Secondary Variable Analysis .................................................64
5.4. Postural Sway: Entropy ................................................................................69 5.4.1. Experimental Block Analysis ............................................................69 5.4.2. Pre-/ Post-test Block Analysis ...........................................................73
5.5. Mediation Modeling .....................................................................................75 5.5.1. Experimental Block Analysis ............................................................77 5.5.2. Pre-/ Post-Test Block Analysis ..........................................................77
6. Discussion .............................................................................................................78
III. EXPERIMENT TWO ..........................................................................................84 1. Hypotheses ...........................................................................................................86 2. Methods................................................................................................................86
2.1. Participants ....................................................................................................86 2.2. Materials & Apparatus ..................................................................................87
3. Procedure .............................................................................................................87 4. Data Preprocessing ...............................................................................................87 5. Results ..................................................................................................................87
5.1. Outlier Analysis ............................................................................................88 5.2. Hierarchical Linear Modeling (HLM) .........................................................89 5.3. Accuracy: Absolute Error (degrees) .............................................................89
5.3.1 Experimental Block Analyses ..............................................................89 5.3.1.1. Primary Variable Analysis .....................................................89 5.3.1.2. Secondary Variable Analysis .................................................105
5.3.2. Pre-/ Post-Test Analyses .....................................................................108 5.3.2.1. Primary Variable Analysis ....................................................108

viii
5.3.2.2. Secondary Variable Analysis .................................................122 5.4. Postural Sway: Entropy ................................................................................128
5.4.1. Experimental Block Analysis ............................................................128 5.4.2. Pre-/ Post-test Block Analysis ...........................................................132
5.5. Mediation Modeling .....................................................................................134 5.5.1. Experimental Block Analysis ............................................................136 5.5.2. Pre-/ Post-Test Block Analysis ..........................................................137
6. Discussion of Experiment 2 Results .....................................................................138
IV. GENERAL DISCUSSION ........................................................................................141 1. Contributions to Calibration Literature ...............................................................142 2. Limitations and Future Studies ...........................................................................144 3. Applications of Current Work ............................................................................146 4. Conclusion ..........................................................................................................147
REFERENCES ......................................................................................................................148
APPENDICES .......................................................................................................................156

ix
LIST OF FIGURES
Figure Page
1. Visual rotational gain profiles for Experiment 1 .......................................................18
2. Mediation Model ........................................................................................................19
3. Wii Balance Board set up with platform ....................................................................22
4. Virtual Environment Layout ......................................................................................24
5. Participant movement during trials ............................................................................25
6. Participants’ views of Virtual Environment during differenttrial tasks ....................................................................................................................26
7. Target dichotomous location assignments .................................................................32
8. Target dichotomous action requirement assignments ................................................32
9. Graph of main effect of block on absolute error (degrees) inexperimental blocks for experiment 1 ........................................................................41
10. Graph of main effect of directionality on absolute error (degrees) in the experimental blocks of experiment 1. .............................................................42
11. Interaction of block by directionality estimating absolute error (degrees) experimental blocks of experiment 1 ........................................................44
12. Effect of the directionality of the estimate on the absolute error mediatedby the location of the target in experimental blocks in experiment 1 ........................45
13. Three-way interaction of directionality, action requirement, andblock trial predicting absolute error in the experimental blocks of Experiment 1 .............................................................................................................46
14. Block 2 of the four-way interaction of action requirement, block,condition, and block trial predicting absolute error in theexperimental blocks of experiment 1 .........................................................................48
15. Block 6 of the four-way interaction of action requirement,block, condition, and block trial predicting absolute error inthe experimental blocks of experiment 1 ...................................................................49

x
16. Significant four-way interaction of block, condition, location, andaction requirement predicting absolute error in the experimentalblocks of experiment 1 ...............................................................................................50
17. Main effect of mediolateral sway (SampEn-X) predicting absoluteerror in the experimental blocks of experiment 1. .....................................................52
18. Interaction of block and simulator sickness (SSQ) predictingabsolute error (degrees) in the experimental blocks ofexperiment 1 ...............................................................................................................53
19. Interaction of block and rotational difference (degrees)predictingabsolute error (degrees) in the experimental blocks of experiment 1 ........................54
20. Main effect of block trial on absolute error (degrees) for thepre-/ post-test blocks in experiment 1 ........................................................................57
21. Interaction between condition and block for Pre-/ Post-test inexperiment 1 ...............................................................................................................58
22. Three-way interaction of block trial by block by target location in pre-/ post-test analyses in experiment 1 ................................................................59
23. Three-way interaction of block trial by block by action requirements in pre-/ post-test analyses in experiment 1 ................................................................60
24. Three-way interaction of block trial by action requirement bydirectionality in pre-/ post-test analyses in experiment 1 ..........................................61
25. Three-way interaction of block by action requirement by conditionin pre-/ post-test analyses in experiment 1 .................................................................62
26. Three-way interaction of block by action requirement bydirectionality by condition in pre-/ post-test analyses inexperiment 1 ...............................................................................................................63
27. The main effect of rotational difference (degrees) between head rotationand estimating arm rotation on absolute error for pre-/ post-testanalysis in experiment 1 .............................................................................................66
28. The interaction effect of block and the rotational difference (degrees)between head rotation and estimating arm rotation on absoluteerror for pre-/ post-test analysis in experiment 1 .......................................................67

xi
29. The interaction effect of block, condition and the rotational difference (degrees)between head rotation and estimating arm rotation on absolute errorfor pre-/ post-test analysis in experiment 1 ................................................................68
30. Means and standard errors of the main effect of block on SampEn-Xand SampEn-Y for the experimental blocks in experiment 1 ....................................71
31. Means and standard errors of the interaction of block andcondition on SampEn-X and SampEn-Y for the experimental blocksin experiment 1 ..........................................................................................................72
32. Means and standard errors of the interaction of block andcondition on SampEn-Y for the pre- and post-test in experiment 1 ..........................74
33. Pathway map of mediation for experiment 1 ............................................................76
34. Visual Rotational Gain Profiles for experiment 2 .....................................................85
35. Graph of main effect of block on absolute error (degrees) in the experimental blocks of experiment 2 ........................................................................92
36. Main effect of block trial on absolute error in the experimentalblocks of experiment 2 ...............................................................................................93
37. Graph of main effect of action requirement on absolute error(degrees) in the experimental blocks of experiment 2 ...............................................94
38. Graph of main effect of directionality on absolute error (degrees)in the experimental block of experiment 2 ................................................................95
39. The effect of block trial on absolute error moderated by block inthe experimental blocks of experiment 2 ...................................................................96
40. Interaction of block by directionality estimating absolute error inthe experimental blocks of experiment 2 ...................................................................98
41. Effect of the directionality of the estimate on the absolute errormediated by the location of the target in experimental blocks inexperiment 2 ...............................................................................................................99
42. The effect of block trial and directionality on absolute errormoderated by block in the experimental blocks of experiment 2 ..............................101
43. The three-way interaction of location by directionality by block trialin the experimental blocks of experiment 2 ...............................................................102
xii
44. The three-way interaction of action requirements by directionality byblock trial in the experimental blocks of experiment 2 ..............................................103
45. Significant four-way interaction of directionality, condition, location,and action requirement for the experimental blocks in experiment 2 ........................105
46. Interaction of block and simulator sickness (SSQ) predictingabsolute error in the experimental blocks of experiment 2 ........................................108
47. Main effect of trials within block on absolute error in thepre-/post-test blocks of experiment 2 .........................................................................111
48. Interaction of directionality and block predicting absolute error (degrees) in experiment 2 pre- and post-test blocks .................................................112
49. Interaction of directionality and action requirement predictingabsolute error (degrees) in experiment 2 pre- and post-test blocks ...........................113
50. Interaction of block and condition predicting absolute error (degrees)in experiment 2 pre- and post-test blocks ..................................................................115
51. Interaction of location and condition predicting absolute error(degrees) in experiment 2 pre- and post-test blocks ..................................................116
52. Three-way interaction of block trial by block by target locationfor the pre-/ post- test blocks of experiment 2 ...........................................................117
53. Three-way interaction between target location, block, anddirectionality predicting absolute error (degrees) in the pre-/ post-testblocks in experiment 2 ...............................................................................................118
54. Three-way interaction of block trial by action requirement bydirectionality in pre-/ post-test blocks of experiment 2 .............................................119
55. Three-way interaction of block by action requirement by directionalityby condition for pre-/ post-test blocks in experiment 2 .............................................120
56. The five-way interaction for control condition, peripheral target,under-rotation estimation, block trial, and action requirement inexperiment 2 pre-/ post-test blocks ............................................................................121
57. The five-way interaction for oscillating condition, frontal target,under-rotation estimation, block trial, and action requirement inexperiment 2 pre-/ post-test blocks ............................................................................122

xiii
58. The main effect of max rotation on absolute error in the pre- andpost-test blocks of experiment 2. ...............................................................................124
59. The main effect of rotational difference between head rotationand estimating arm rotation on absolute error in the pre- and post-testblocks of experiment 2. ..............................................................................................125
60. The interaction effect of block and the rotational difference betweenhead rotation and estimating arm rotation on absolute error for thepre- and post-tests of experiment 2. ...........................................................................126
61. The interaction effect of condition and the total rotation on absoluteerror in the pre- and post-test blocks of experiment 2. ..............................................127
62. The interaction effect of condition and the rotational difference betweenhead rotation and estimating arm rotation on absolute error in the pre- and post-test blocks of experiment 2. ........................................................................128
63. Means and standard errors of the main effect of block on SampEn-Xand SampEn-Y for the experimental blocks in experiment 2. ...................................130
64. Means and standard errors of the interaction of block and conditionon SampEn-X and SampEn-Y for the experimental blocks inexperiment 2 ...............................................................................................................132
65. Means and standard errors of the interaction of block and conditionon SampEn-X and SampEn-Y for the pre- and post-test inexperiment 2 ...............................................................................................................134
66. Pathway map of mediation for experiment 2 .............................................................136

xiv
LIST OF TABLES
Table Page
1. Fixed Coefficients, Standard Errors and R2∆ for Absolute Errorfor the primary variables in the experimental block of Experiment 1... ....................38
2. Means and standard deviations for the main effect of block forthe experimental blocks of experiment 1 ...................................................................40
3. Absolute Error means and standard deviations for block by directionalityinteraction for the experimental blocks of experiment 1 ...........................................43
4. Absolute Error means and standard deviations for location bydirectionality interaction for the experimental blocks ofexperiment 1 ...............................................................................................................45
5. Fixed Coefficients, Standard Errors and R2∆ for Absolute Error forthe secondary variables in the experimental blocks of experiment 1. .......................51
6. Fixed Coefficients, Standard Errors and R2∆ for Absolute Error in thePre-/ Post Blocks of Experiment 1. ............................................................................55
7. Fixed Coefficients, Standard Errors and R2∆ for Absolute Error forthe Secondary Variables in pre-/ post-test analyses in Experiment 1. .......................65
8. F-tests for SampEn-X and –Y for the experimental blocks inexperiment 1. ..............................................................................................................69
9. Mean and standard deviations of the main effect of block onSampEn-X and SampEn-Y in the experimental blocks of Experiment 1. .................70
10. Mean and standard deviations of the interaction effect of blockand condition on SampEn-X and SampEn-Y for the experimentalblocks of Experiment 1. .............................................................................................71
11. F-tests for SampEn-X and –Y for the pre- and post-test blocksin experiment 1. .........................................................................................................73
12. Mean and standard deviations of the interaction effect ofblock and condition on SampEn-X and SampEn-Y for pre- and post-test blocks in Experiment 1 .........................................................................74
13. Coefficient estimates and standard errors for the differentexperimental models for the various paths, indirect effects anddirect effects for the experimental blocks in experiment 1. .......................................77

xv
14. Coefficient estimates and standard errors for the differentexperimental models for the various paths, indirect effects anddirect effects for the pre- and post-test blocks of Experiment 1. ...............................78
15. Fixed Coefficients, Standard Errors and R2∆ for Absolute Errorfor the primary variables in the experimental block of Experiment 2. ......................90
16. Means and standard deviations for the main effect of blockpredicting absolute error in the experimental blocks of experiment 2. ......................92
17. Absolute Error means and standard deviations for block bydirectionality interaction for experimental blocks in experiment 2. ..........................97
18. Absolute Error means and standard deviations for location bydirectionality interaction for the experimental blocks of experiment 2. .............................................................................................................99
19. Fixed Coefficients, Standard Errors and R2∆ for Absolute Error forthe Secondary Variables for the experimental blocks of experiment 2. ....................107
20. Fixed Coefficients, Standard Errors and R2∆ for Absolute Error in thePre-/ Post Blocks of Experiment 2. ............................................................................109
21. Means and standard deviations of absolute error for the interactionof directionality and block in the pre- and post-test blocks ofExperiment 2. .............................................................................................................112
22. Means and standard deviations of absolute error for the interactionof directionality and block in the pre- and post-test blocks ofExperiment 2. .............................................................................................................113
23. Means and standard deviations of absolute error for theinteraction of condition and block in the pre- and post-test blocksof Experiment 2. .........................................................................................................114
24. Means and standard deviations of absolute error for theinteraction of location and condition in the pre- and post-testblocks of Experiment 2. .............................................................................................116
25. Fixed Coefficients, Standard Errors and R2∆ for Absolute Errorfor the Secondary Variables in pre-/ post-test analyses inExperiment 2. .............................................................................................................123
26. F-tests for SampEn-X and –Y for the experimental blocks inexperiment 2. ..............................................................................................................129

xvi
27. Mean and standard deviations of the main effect of blockon SampEn-X and SampEn-Y in the experimental blocks ofExperiment 2. .............................................................................................................130
28. Mean and standard deviations of the interaction effectof block and condition on SampEn-X and SampEn-Yfor the experimental blocks of Experiment 2. ............................................................131
29. F-tests for SampEn-X and –Y for the pre- and post-testblocks in experiment 2. ..............................................................................................133
30. Mean and standard deviations of the interaction effectof block and condition on SampEn-X and SampEn-Y forpre- and post-test blocks in Experiment 2. .................................................................134
31. Coefficient estimates and standard errors for the differentexperimental models for the various paths, indirect effectsand direct effects for the experimental blocks in experiment 2 .................................136
32. Coefficient estimates and standard errors for the differentexperimental models for the various paths, indirect effects anddirect effects for the pre- and post-test blocks of Experiment 2. ...............................137
xvii
LIST OF APPENDICES
Appendix Page
A: Experiment 1: Descriptive Statistics for Collected Predictors Experimental Blocks ...................................................................................156
B: Experiment 1: Descriptive Statistics for Collected Predictors Experimental Blocks ...................................................................................157
C: Experiment 1: Experimental Block Primary Analysis Coefficients for the Outcome Variable of Absolute Error ..........................158
D: LSD Post Hoc Analysis of Block for Experimental Blocks Primary Variable Analysis of Absolute Error in Experiment 1. ................166
E: Experiment 1: Experimental Block Secondary Analysis Coefficients of Absolute Error ....................................................................167
F: Experiment 1: Pre-/ Post Block Primary Analysis Coefficients ......................................170
G: Experiment 1: Pre-/ Post-test Secondary Analysis Coefficients for Absolute Error ..................................................................173
H: LSD Post Hoc Analysis of Block for Experimental Blocks for SampEn-X in Experiment 1. .......................................................................175
I: LSD Post Hoc Analysis of Block for Experimental Blocks for SampEn-Y in Experiment 1. ................................................................176
J: Experiment 2: Descriptive Statistics for Collected Predictors Experimental Blocks ...................................................................................177
K: Experiment 2: Descriptive Statistics for Collected Predictors Experimental Blocks ...................................................................................178

xviii
L: Experiment 2: Experimental Block Primary Analysis Coefficients for the Outcome Variable of Absolute Error .........................179
M: LSD Post Hoc Analysis of Block for Experimental Blocks Primary Variable Analysis of Absolute Error in Experiment 2. ..............................................................................................188
N: LSD Post Hoc Analysis of Location by Action Requirement by Condition by Directionality for Experimental Blocks Primary Variable Analysis of Absolute Error in Experiment 2. .............................................................189
O: Experiment 2: Experimental Block Secondary Analysis Coefficients of Absolute Error ....................................................190
P: Experiment 2: Pre-/ Post-Test Primary Analysis Coefficients for the Outcome Variable of Absolute Error ..........................193
Q: Experiment 2: Pre-/ Post-Test Secondary Analysis Coefficients for the Outcome Variable of Absolute Error .........................196
R: LSD Post Hoc Analysis of Block for Pre-/ Post-Test Blocks for SampEn-X in Experiment 2. ....................................................198
S: LSD Post Hoc Analysis of Block for Pre-/ Post-Test Blocks for SampEn-Y in Experiment 2. ....................................................199
1
CHAPTER I.
PERCEPTION-ACTION SYSTEM CALIBRATION IN THE PRESENCE OF STABLE AND UNSTABLE PERCEPTUAL PERTURBATIONS
How do humans successfully interact with their environments under changing conditions?
The ability to adapt in order to perform both basic and advanced tasks within varying
environments and under countless conditions, enables humans and other organisms to survive
and thrive. The capacity to perceive and calibrate to these ever changing environments is one that
scientists have strived to understand and predict.
The ecological approach to perception and action takes as its primary unit of study the
relationship created by an organism (or actor) and its environment. This relational approach has
evolved over six decades of empirical research that investigates the perception and motor control
required for an organism to successfully interact with its environment. In the actor-environment
relationship, both entities are active and changing (Heft, 2003; Gibson, 1966). The present work
is directed at understanding how actors calibrate to changes in this actor-environment
relationship.
1. Direct Perception
The ecological approach to perception and action starts with an analysis of what makes up
the environment (i.e., the surfaces and the make up of the objects) as well as how that
information is conveyed to the actor through energy arrays (e.g., J.J. Gibson, 1959, 1966, 1979;
Lombardo, 1987; Michaels & Carello, 1981; Turvey, Shaw, Reed, & Mace, 1981). These arrays
provided by the environment consist of light for vision, chemical energy for smell, acoustic
energy for hearing, etc. The arrays convey information about the various surfaces and substances
that comprise the environment and their relationship to the perceiver. For instance, the pattern of

2
light that enters the eye contains meaningful information that enables the actor to perceive
without the need for elaboration by a cognitive system (Lombardo, 1987; Turvey & Carello,
1986).
These information rich arrays and their resulting stimulation patterns become more
informative as an actor moves within the environment. For example, as an eye moves the pattern
of ambient light changes in a lawful manner, generating what is termed optic flow. This pattern
of change provides information regarding the locomotion of the actor as well as the dimensional
structure of the environment (e.g., distance, depth, size of various objects, directionality of
movement, etc.; Bingham & Pagano, 1998; Cutting, 1986; Fajen & Warren, 2003; Gibson, 1979;
Gomer, Dash, Moore, & Pagano, 2009; Warren, 2006).
This theoretical approach and understanding of perception off-loads cognition (Zhao &
Warren, 2015). The meaningful aspects of the environment do not require higher cognitive
functions (e.g., interpretation, representation, memory, calculation, decision making, etc.).
Instead the surfaces of the environment provide the information in a lawful manner that allows
the meaningful aspects within an environment to be perceptible.
The basic question of how organisms are able to move through an environment and
successfully interact with elements within it can be answered in our ability to utilize this
perceptual information. Specifically, it allows for prospective control, the ability to guide and
control future-oriented actions (J.J. Gibson, 1979; E.J. Gibson, 1969; Turvey, 1992; Reed, 1996;
Adolph, Eppler, Marin, Weise, & Clearfield 2000; Gibson & Pick, 2000; Littman, 2011).
Prospective control can be seen in our day-to-day lives with the majority of the motor
movements we use to interact with our environments and others (e.g., reaching, walking,

3
climbing, catching, etc.). In order to achieve prospective control, an actor must be able to
perceive and use the energy arrays available within the environment.
2. Development, Attunement, and Calibration of Perceptual-Motor System
The environmental information that is provided to the perceptual systems is in fact sufficient
support for perception (Gibson, 1966). Variables with useful information, that are lawfully
related to the property being perceived are known as specifying variables (Wagman, Shockley,
Riley & Turvey, 2001; Withagen & Michaels, 2005). Through training, observers become
attuned to the most specifying perceptual information within the stimulus arrays characterizing
each of the senses (E.J. Gibson 1963, 1969; J.J. Gibson & E.J. Gibson, 1955). That is, observers
are able to converge on the information that is the most correlated to an object’s property. This
correlated relationship enables accurate predictions for the use of prospective control. In essence,
the lawful relationship found in the arrays, allows for actors to interact within their environment
without the use of higher cognitive resources.
This perceptual learning, or the ability to differentiate specifying variables from
ambiguously-related or non-specifying variables, is what E.J. Gibson referred to as the education
of attention or attunement (E.J. Gibson 1963, 1969; J.J. Gibson & E.J. Gibson, 1955). In essence,
it is tuning the body’s perceptual capabilities to correctly gather important task-related
information. Without this attunement, untrained perceivers may rely on non-specifying variables
(i.e., variables which have less of a lawful relationship to the target property).
This gathering of information inevitably leads to some degree of perceptual error in the
results of the action taken (Jacobs, Vaz, & Michaels, 2012). Therefore, the act of attunement is
not a passive process; it requires active perceptual exploration of the world. Through perceptual

4
learning, animals are able to fine tune their abilities to extract the useful and relevant information
from the stimulus array. Attunement occurs when useful task-related feedback is available.
Through feedback training, calibration enables a rescaling of the perception-action system’s
output to properly match task demands (Bingham & Pagano, 1998; Day, et al., submitted; Fajen,
2007; Iodice, Scuderi, Saggini & Pezzulo, 2015; Warren, 1984; Withagen & Michaels, 2004).
Without continuous task-relevant feedback the perception-action system becomes increasingly
inaccurate (Bingham & Pagano, 1998; Ebrahimi, et al., 2016; Wickelgren, McConnell. &
Bingham, 2000).
A need to recalibrate will occur if there is a disturbance in either the perceptual or action
systems (Bingham & Pagano, 1998). Recalibration is necessary for a system to interact within
various environments, under certain changes (long or short-term changes, to be discussed) to the
perceptual or musculoskeletal system, environment itself, etc. A system can be thought of as
being recalibrated when an environment that has been distorted or transformed in some capacity
is no longer perceived as being novel (Dolezal, 1982). Essentially, recalibration can be defined
as the return to pre-perturbed performance level after a decrease at the onset of the initial
disruption (Dolezal, 1982).
Interestingly, attunement and calibration are primarily unconscious processes. Mark (1987)
demonstrated participants were able to calibrate to what chair heights were sit-on-able after their
physical dimensions were altered by standing on blocks. While participants were not allowed to
practice sitting, they were still able to accurately make judgments based off of their new action
capabilities in the various conditions. However, the fact that they could not make an accurate
estimation of the height of the blocks they were standing on suggests that the recalibration of the

5
perception-action system occurs without the specific knowledge of the alterations (Mark, 1987;
Day, et al., submitted).
3. Perceiving Affordances
Affordances are the opportunities for action provided by the surfaces of the environment.
For example, a horizontal plane allows for actions such as standing, sitting, tripping over, etc.
These action opportunities are presented lawfully through environmental information (Gibson,
1976/1982, 1979; Turvey, 1992). The relations between the environment and the capabilities of
the organism make activity such as those requiring prospective control possible (Turvey, 1992;
Turvey & Shaw, 1995; Fajen, Riley & Turvey, 2008).
There are two primary categories of affordances: body-scaled and action-based (Fajen,
2007; Fajen, Riley & Turvey, 2008). The majority of the research completed within the
ecological field investigates one of these two types of affordances. The first category of
affordances is the body-scaled aspect, in which the environment is scaled to the geometric
dimensions of an individual’s body (Fajen, 2007; Fajen, Riley & Turvey, 2008). For example,
the ratio of knee-height to perceiving whether a horizontal surface is sit-on-able (Mark, 1987),
ratio of leg length to most comfortable stair height (Warren, 1995), and ratio of doorway width to
shoulder width in perceiving pass-ability (Warren & Whang, 1987). Studies such as these have
revealed ratios that remain invariant over different body sizes which enable affordances to be
quantifiable through it (e.g., leg-length units are the more proper unit for determining the
affordance of stair climbing than centimeters or inches; Warren, 1995; Cesari, 2005; Cesari et al.,
2003; Konczak et al., 1992).

6
However, the ratios for optimal performance differ between individuals with different action
capabilities, such as able-bodied young adults to able-bodied older adults (Cesari, Formenti, &
Olivato, 2003; Konczak et al., 1992; Sakurai et al., 2013, 2014). Thus, an actor’s ability to
interact with the environment goes beyond their simple geometric dimensions. Therefore, the
second component of the affordance theory corresponds to the energy and strength component of
affordances, and is known as action-based affordances or action capabilities (Fajen, 2007). This
component takes into account factors such as strength and flexibility (Day, Wagman, & Smith,
2015; Fajen et al., 2009; Gibson, 1976/1982). Importantly, these are still perceptually specified
in the relationship between the environment and the actor. For instance, when comparing able-
bodied older adults with college students, the ratio for optimal performance in a stair climbing
task changes. For instance, older participants select shorter riser heights even though their
geometric dimensions are similar to that of the college students (Cesari, Formenti, & Olivato,
2003; Konczak et al., 1992; Sakurai et al., 2013, 2014). Day, Wagman, and Smith, (2015)
concluded that there is only one overarching type of category which is action-scaled, and that the
body-scaled affordances are simply a special subset.
For both components that make up affordances (i.e., geometric dimensions and action
capabilities), changes in the environment and/or the actor change what is possible for a given
individual acting within an environment. Therefore, in order to obtain “an accurate
understanding of perception” one must consider “the perceiver and the environment as a single
unit (O’Neill & Russell, 2017, p 54).”

7
3.1. The Effect of Postural Sway on Affordance Judgements
Postural sway is one mechanism actors utilize in order to explore the global array for
affordance based judgements. For example, Mark, Balliett, Craver, Douglas, & Fox (1990)
demonstrated that actors recalibrate to extensions of their leg lengths (i.e., leg lengths extended
with platform shoes), so long as they can sway or move. However, they also demonstrated that
calibration for affordances can be inhibited through the manipulation of postural sway
movement. This manipulation was either by restricting the postural sway or artificially
increasing it.
Mark et al., (1990) restricted postural sway by having participants stand against a wall rigidly
or restricting the postural sway by requiring participants to view the seat (i.e., for judgements of
sit-on-ability) through a peep-hole. Both of these movements diminished or canceled the natural
postural sway of participants. Additionally, they were able to increase the amount of postural
sway by having participants stand in an awkward stance (i.e., heels together, toes pointed
outward). They found that those who had their postural sway manipulated either by restriction of
or with additional variability introduced, recalibration was retarded or halted completely.
Essentially, their errors and variability of their motor decisions remained high. Whereas, the
individuals that were in groups without a postural sway manipulation, recalibration occurred
quickly.
Many studies have further demonstrated the utility of head and torso movements during and
prior to making affordance judgements, specifically in terms of the accuracy of the affordance
perception (e.g., Bingham & Pagano, 1998; Bingham & Stassen, 1994; Gomer et al., 2009;
Stoffregen et al., 2009; Yu et al., 2011; Yu & Stoffregen, 2012). Mantel et al. (2008)
demonstrated that participants who were allowed to actively engage in a virtual environment
8
(i.e., allowed to move their head and torso in order to change viewing angles, etc.) were more
accurate and precise than those who were only shown a previous recorded video of exploratory
movement. Self-generated exploratory movement enables the generation of useful invariants to
be gleaned from the animal-environment system (Bingham & Pagano, 1998; Mantel et al., 2015).
Even minimum movement that occurs with ordinary body sway (e.g., slow, ~ 0.2 Hz and small
~2 cm) provides information about the animal within the system (Stoffregen & Mantel, 2015).
These studies suggest that information regarding one’s action capabilities is not simply stored
in a fixed or quantitative manner. Optic flow from head movements and postural sway reveals
information about depth that is not available in static viewing. Such information includes the
classic distance cue of motion parallax. Since information from vision alone is necessarily
angular, it does not provide information about definite (i.e., absolute) distance that can be used
for prospective control. However, somatosensory information available during active exploration
provides a metric for the angular information provided optically, and thus vision is in fact multi-
modal, with perception and motor control being a unitary process (Bingham & Stassen, 1994;
Mantel et al., 2015). Calibration via feedback is used to properly scale the application of this
metric to produce accurate performance (Bingham & Pagano, 1998; Pan, Coats & Bingham,
2014). People gather the necessary information through actions such as a change in their postural
sway in order to appropriately gauge their capabilities within the specific environment under the
specific Condition (Stoffregen, Wang, & Bardy, 2005). Essentially, movement reveals useful
information that enables actions to be properly scaled to features of the environment. For
instance, if there is an increase in postural instability, then the perception of doorway pass-ability
is affected (i.e., more narrow doorways appear less passible; O’Neill & Russell, 2017).
9
Research has also investigated the effect of disruption of the perceptual system on postural
sway, and subsequently affect recalibration. Littman (2009, 2011) used a visual distortion (e.g.,
prism illusion) within a virtual environment. These types of disturbances caused participants to
demonstrate compensatory movements to detect the appropriate new mapping. Littman’s
findings and others (e.g., Riccio & Stoffregen, 1991; Smart & Smith, 2001) demonstrate that
compensatory reactions are due to the initial failure of an appropriate mapping in novel situations
that can lead to instability and subsequent motion sickness. Active exploration and the learning
of new mappings can reflect a recalibration for the novel stimulus (Littman, 2009).
3.2. Calibration to Changes in Affordances
The perception of affordances is a dynamic process (Fajen, Riley, & Turvey, 2009; Wagman,
Higuchi, & Taheny, 2014). This malleability allows for calibration to the body’s changing
physical dimensions or abilities. For example, if an individual injures their ankle, what once was
possible (e.g., jumping, climbing, or walking) is now not as feasible or possible using the same
motion. Similarly, the use of a tool makes new actions possible (e.g., Day et al., 2017; Witt,
Proffitt, Epstein, 2005). Regardless of their malleability, affordances are continuously perceived
as the body moves through the environment.
Changes within an individual or environment can be described as occurring over short- or
long-timescales and can affect both body-scaled and action-scaled affordances. It should be
noted that the categorization of the timescale (i.e., short or long) is of course relative. For
example, fatigue has been considered both long- and short-timescales, depending on the research
interest of a study (e.g., Fajen, Riley, & Turvey, 2008).

10
Short-timescale changes of affordances can be loosely defined as any changes that can revert
back to the original or baseline conditions in a relatively short time period. Some common
examples of these type of short-timescale changes include: fatigue (e.g., Witt et al. 2009; Bhalla
& Proffitt, 1999; Schnall, Zadra, & Proffitt, 2010; Proffitt, Stefanucci, Banton, & Epstein, 2003),
changes in body dimensions through the use of equipment (e.g., Day et al., 2017; Petrucci, M.
N., Horn, G. P., Rosengren, K. S., & Hsiao-Wecksler, E. T., 2016; Warren, 1984), change to
one’s action capabilities or geometric dimensions via tools (e.g., Scott & Gray, 2010), prism
goggles (Bingham & Romack, 1999), etc. The majority of short-timescale changes occur with a
rapid change and then stabilize at a particular point. For instance, when firefighters put on their
equipment they are abruptly much larger and heavier than they usually are, which can lead to
fatigue. Petrucci et al., (2016) found that firefighters adjusted their affordance judgements
accordingly by selecting larger aperture widths or higher beams to pass under.
Long-timescale changes of affordances can result in permanent changes. Some common
examples include changes throughout the lifespan (e.g., Comalli, Franchak, Char, & Adolph,
2013; Ishak, Franchak, & Adolph, 2014; Sakurai et al., 2013; Hackeny & Cinelli, 2013). What is
most unique about long-timescale changes is the pattern of continued change across the
timespan. An example of this is the development that occurs from birth to the maturation phase
where strength and body dimensions are at their peak. From this point onward, there is a leveling
off of abilities and then a general decline as an individual continues to age. Due to this, the
perception of affordances is constantly having to be adjusted based on the particular environment
and task. As an illustration, body-scaled affordances that are based on the anthropometric
measurements of the body change at a particularly rapid rate from infancy until maturation.

11
This type of ever changing animal-environment relationship can be observed for short-
timescale changes such as injury or fatigue. Both of these examples could be considered long-
timescale changes if they occur over extended periods of time, and calibration may occur
gradually during that period. A sprained ankle, for example, takes time to heal, but as the
ligaments and soft tissues gradually repair, the actor can begin to place more weight on the ankle
and begin to move around more easily. They would eventually no longer require a walking aid.
While some injuries are instantaneous, others can be categorized as being stress injuries that
occur over longer time periods. In some cases, people recover from their injuries but show some
permanent change.
Our ability to adjust to short- and long-timescale changes has led researchers to study
recalibration. These changes can be considered perturbations, a deviation from the normal state
of the system. Such perturbations are typically held constant within an experimental Condition.
In essence, the change or perturbation introduced in the experiment, either a change in the
environment, actor, or the perceptual processes, remains constant. For example, in the well-
studied prism goggle perturbation, the visual device shifts the visual image which causes
participants to make errors until they are able to recalibrate their perception-action system to the
shift (e.g., Harris, 1965; Bingham & Romack, 1999; Cunningham & Welch, 1994; Welch, Choe
& Neinrich, 1974). A similar example is Mark’s (1987) experiment of adding blocks to the feet,
the displacement of the eye height was constant.
A gain is a type of perturbation that rescales the system’s output. For example, a visual
perturbation within a virtual environment that causes a reaching hand to appear to be moving
20% further than it is actually moving is a gain of 1.2 (Ebrahimi et al., 2015). Gains can be
considered constant when they remain the same throughout an experimental session. So while a

12
gain is different from a displacement, both can be seen as being held constant in past
experiments. There is no change to the perturbation that is introduced into the system.
A different class of perturbations are those that are unstable. For such perturbations the
amount of gain or the degree of displacement changes from moment to moment. Similarly,
changes in one’s action capabilities that vary instantaneously result in instability. Such situations
result in an unstable actor-environment relationship, due to perceptual-motor perturbations that
do not remain fixed or constant. While there is a large literature of empirical studies involving
stable perturbations, unstable perturbations have received little attention. It is hypothesized that
unstable perturbations to the perception-action system will be more difficult, and perhaps
impossible, to calibrate to (e.g., Bingham and Romack, 1999).
A common example of this type of relationship can be seen through consumption of alcohol.
As an actor consumes alcohol they are constantly changing their level of inebriation. As alcohol
is absorbed into the blood stream multiple systems within the body are affected including
vestibular, visual, cognitive, and motor abilities. This effect demonstrates a similar pattern found
in most long-timescale changes yet occurs within the time-frame of short-timescale changes. The
changes in level of inebriation is not necessarily constant in terms of rate of inebriation or time
within that inebriated level. As the alcohol is absorbed in the body, an individual’s ability to
interact with the environment changes. In most cases this change is a diminishing of the
coordination of perception-action systems. While this example is not simple or perfect due to the
intricacies of the various systems that are affected and their interactions, what should be focused
on is the pattern of the blood alcohol content and the resulting behavioral deficits. While the
effects of alcohol have been studied individually with the various systems, from an ecological
perspective, the question remains as to what specifically is being disrupted in the actor-

13
environment relationship to cause individuals to be unable to calibrate to the perturbation within
the system.
In order to demonstrate the logic behind this unique relationship, the previous example of an
injury can be used for comparison. The rate of healing for an injury generally consists of periods
of stabilization that allow for actors to recalibrate to the new conditions of the actor-environment
system. These periods of stabilization are due to the longer timescale that are generally seen in
injury recovery. Thus, this type of relationship can be considered essentially a stabilized one
since the changes have these periods of stabilization to allow for actors to recalibrate, whereas
the example of alcohol consumption does not.
Essentially, both examples demonstrate various action-perception systems under different
conditions of disturbance. While both experience perturbations, the injury example is a much
more stabilized actor-environment system allowing for the recalibration of prospective control,
whereas the other can be described, at least anecdotally, as having a much more unstable actor-
environment system potentially interfering with calibration.
3.3. Virtual Reality as a Tool to Examine Affordance Perceptions
While perturbations enable scientists to examine the process of calibration, it can be difficult
to create perturbations in the real environment. Virtual environments (VE) are useful tools for
examining conditions and/or tasks that would not otherwise be feasible due to lack of resources,
safety, or simply are impossible to create in a structured manner. While some research has shown
that people perform differently in VEs than in the real world (e.g., Napieralski et al., 2011;
Ebrahimi, Babu, Pagano, & Jorg, 2016), other research has found that VEs can be reliable and
representative of real world experimental conditions (Bertram et al., 2015; Ganier, Hoareau, &

14
Tisseau, 2014; Hyltander et al., 2002; Larrue et al., 2014; Regian, 1997; Rose et al., 2000). In
general, VEs have been shown to be useful for examining the mechanics of calibration to
perturbations such as perceptual distortions (e.g., Altenhoff et al., 2012; Bingham, Bradley,
Bailey & Vinner, 2001; Littman, 2009; 2011).
For instance, a task that humans engage in frequently is determining what is within reach.
Being able to determine what is within reach is an important affordance which must remain
calibrated in the face of changes in posture, stability, the addition of tools, and changes in
accuracy required. Previous research has altered users’ reaching abilities by extending their reach
with tools (e.g., Bourgeois, Farnè, & Coello, 2014; Day, et al., 2017; Day, et al., submitted;
Maravita & Iriki, 2004), or manipulating the perception of where the target is located using
virtual reality (e.g., Ebrahimi, Altenhoff, Pagano, & Babu, 2015). This research has investigated
what occurs if physical dimensions or the physical perception of the environment is altered and
whether individuals can attune to these changes. In all of the studies, calibration can be observed
through changes in the participants’ behavior after appropriate training or feedback has been
given (Bingham & Pagano, 1998; Ebrahimi et al., 2015; Ebrahimi, et al., 2016;).
Bingham and Romack (1999) investigated the introduction and removal of a perturbation
(i.e., taking prism goggles on and off). Participants were not only able to calibrate under both
conditions but recalibration occurred more rapidly with each successive perturbation shift. One
example of how VEs can assist in researching calibration is that the perturbation can be changed
in both duration and amount without providing any cues (e.g., changing out goggles). For
example, Littman (2011), was able to create a perturbation that contained multiple perceptual
distortions simultaneously by the use of yaw and pitch rotations by using VE technology in order
to study the effects on calibration.

15
Both Littman (2011) and Bingham and Romack (1999) used stable levels of perturbation
throughout their experiments. While Bingham and Romack (1999) removed and added the
perturbation of the googles, the change between these two perceptual environments were the
same since the same amount of perturbation was added or removed each time. What if the
change in the perturbation was not shifting back and forth but constantly changing?
4. Purpose and Goals
While many changes in the actor-environment relationship happen either instantaneously
such as an injury, a change in height due to donning high heels, etc., or over very long timescales
such as with growth. However, others fall in between. It has been demonstrated that actors are
able to calibrate to changes in affordances over very short time scales (e.g., prism goggles, the
addition of a tool, etc.) or long-term changes that persist over long time scales (e.g., body
growth, aging, physical training, pregnancy, etc.). However, there are some changes to
affordances that occur in short-time frames but have the pattern of a long-time scale change.
These essentially create unstable actor-environment interactions. In essence, something within
the interaction is causing the relationship that is stable under most conditions to have increased
variability causing it to be unstable. The purpose of this series of experiments is to examine the
effect of unstable environments on calibration: specifically, how changes to the amount of
perturbation affects calibration. The goal of this experimentation is to further enhance our
understanding of perception-action calibration.

16
CHAPTER II.
EXPERIMENT ONE
Both experiments used a multiplicative visual gain perturbation to investigate the effect of an
unstable environment on performance. The perturbation was a multiplicative function of the rate
of visual rotation in the VE which was coupled with the movement of participants’ rotational
head movements. The gain only occurred on the unitary plane of yaw (i.e., looking left or right).
Therefore, instead of a 1-to-1 representation from the head rotation action to its visual effects
displayed in the VE, a perturbation increased the rate of rotation in the visual scene. For instance,
a gain value of 2 will double the rate of visual rotation (e.g., a head rotation of 15 degrees will
result in a visual rotation of the VE scene of 30 degrees while a head rotation of 10 degrees will
result in a 20-degree visual rotation). It is not a fixed value across all degrees of head rotation
movements thereby creating a change in the optic flow.
This type of visual gain can be seen in video games and other virtual environments in terms
of panning across the screen. Essentially, in these examples, the panning movement speed
increases the longer you move across a scene. This gain can also be seen in new power steering
automation in cars. At faster speeds, a driver is required to turn the wheel more than when
driving at slower speeds to create the same type of movement. Thus, the effect of wheel input on
car movement depends on the speed of the car.
In this experiment there were three conditions of visual gains: control, constant, and
randomized increase. The first, was a control condition with the visual gain of one (i.e., one
times the amount of head rotation). A visual gain of one is analogous to regular viewing within a
VE where head rotation maps 1-to-1 with visual rotation. This condition allowed for the

17
examination of any fatigue effects that could occur within the task as well as any effects of being
in a VE.
The second condition had a stable perturbation level (i.e., the gain remained at the same
value during the experimental blocks). This constant condition is analogous to that of previous
research that had a constant gain during the calibration phase. The amount of gain in this
condition was the mean of the total amount of gain in the third experimental condition (i.e., 2.5x
gain). Meaning that the visual movement within the VE will be two and a half times the amount
of the actual head rotation movement (e.g., a head rotation of 10 degrees will create a visual
rotation of 25 degrees). This condition will allow for us to determine if any retardation of
recalibration is simply due to the stimulus itself (i.e., rotational gain perturbation) and not the
changing of the gain.
The last condition is the experimental condition where the amount of gain in the system
changed for each block. The pattern of the change of gain is important as it can result in
confounding of the results. There are three patterns of change that could occur: increase,
decrease, or a combination of the two. While all three of these patterns can be found in
naturalistic settings and are important to investigate, decrease and the combination of both have
conflated patterns. In essence, in both of these patterns, there are both increase and decreasing
(e.g., in order to decrease, one would have to increase up to a high level of gain) patterns
observed. This conflation would make it difficult to isolate the cause of the effect to the rate of
gain change as the effect could simply be the result of the mixture of increasing and decreasing.
Therefore, the increase pattern was selected for both experiments with the hope that future
experiments will examine the effect of decreasing and the combination of both. In order to
18
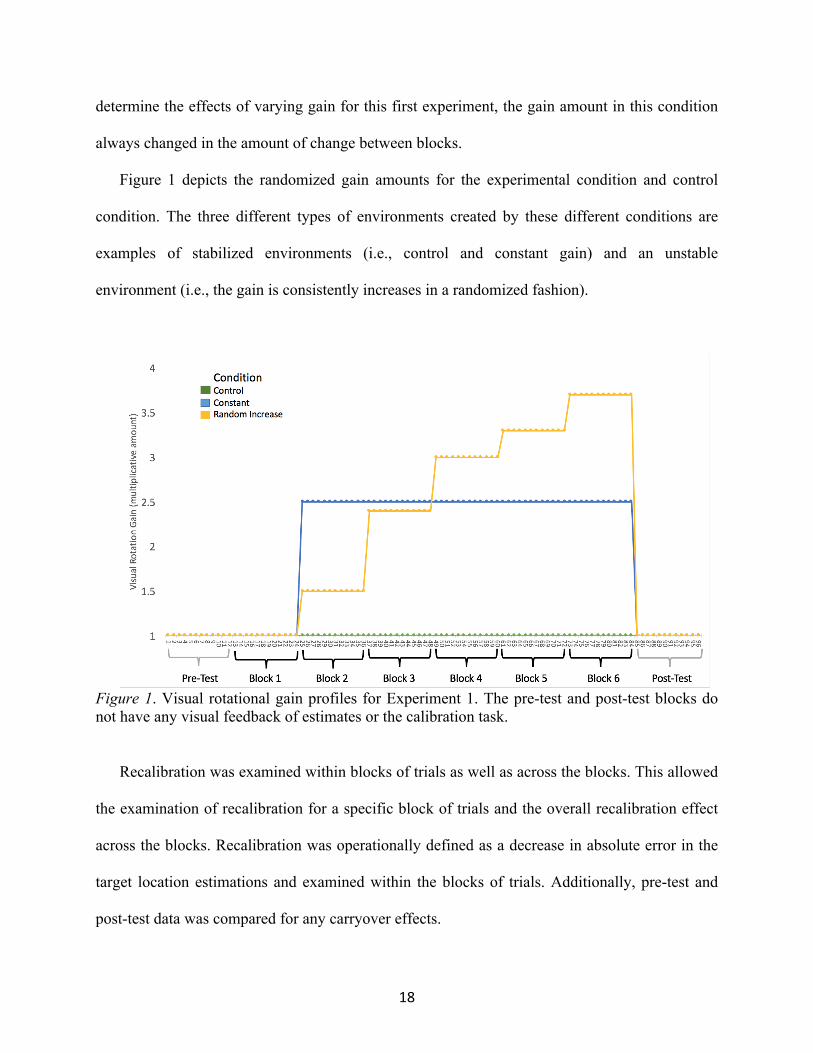
determine the effects of varying gain for this first experiment, the gain amount in this condition
always changed in the amount of change between blocks.
Figure 1 depicts the randomized gain amounts for the experimental condition and control
condition. The three different types of environments created by these different conditions are
examples of stabilized environments (i.e., control and constant gain) and an unstable
environment (i.e., the gain is consistently increases in a randomized fashion).
Figure 1. Visual rotational gain profiles for Experiment 1. The pre-test and post-test blocks do not have any visual feedback of estimates or the calibration task.
Recalibration was examined within blocks of trials as well as across the blocks. This allowed
the examination of recalibration for a specific block of trials and the overall recalibration effect
across the blocks. Recalibration was operationally defined as a decrease in absolute error in the
target location estimations and examined within the blocks of trials. Additionally, pre-test and
post-test data was compared for any carryover effects.

19
1. Hypotheses
The current study has four primary hypotheses. (1) We expect that the more unstable an
environment is, the more difficult it will be to recalibrate (i.e., the longer it will take to
recalibrate). The control group will show the most rapid recalibration. The constant group will
also show rapid recalibration after the initial onset of the perturbation. The randomized increase
group (i.e., the experimental group with the varying amounts of gain changes between blocks)
will take the longest to recalibrate. (2) It is hypothesized that the unstable environment will cause
greater target estimation errors and (3) have greater postural sway (e.g., higher levels of entropy)
than the other two groups. (4) Lastly, it is hypothesized that postural sway (e.g., entropy) will
mediate the relationship between the type of perturbation condition (i.e., type of environment)
and target estimation errors (see Figure2).
Figure 2. Mediation Model. Postural Sway (a measure of entropy) is hypothesized to mediate the relationship between the perturbation of the environment (i.e., the different conditions) and the accuracy of participant’s judgments measured by error.
PerturbationEnvironment(Condition)
AccuracyofJudgement(AbsoluteError)
PosturalSway (Entropy)

20
2. Methods
2.1. Participants
Since this study is a repeated measures design which includes a time-series component,
multilevel analysis will be used. Estimating power for a multilevel study requires consideration
of the Level 2 (L2) units (i.e., the number of participants) comparatively to the size of Level 1
(L1) units (i.e., the number of measurement occasions) and the intraclass correlation (ICC). Due
to the nesting of the L1 variables within the Level 2 variables require additional assumptions
during power estimations.
Fifty-three university undergraduate students participated in the study (19 males and 36
females; age range 18-23; mean 19.33). These participants were recruited using the Clemson
participant pool and given course credit for their participation in the study. Participants were
allowed to stop the experiment at any time. Participants’ data that did not complete the entire
experiment, had equipment or experimenter error, or did not participate in the study correctly
(i.e., did not follow instructions) were not included in the analyses. Five participants withdrew
from the experiment due to simulator sickness (two in the constant condition and three in the
random increase condition), two participants were removed due to equipment failure, three were
removed due to failure to follow instructions, and one was removed due to experimenter error.
Additional participants were run in order to have the total 42 right-handed participants required
for the study with complete data.
21
2.2. Materials & Apparatus
2.2.1. Wii Balance Board (WBB)
Postural sway or the slow low-amplitude movement of the body can be measured through
center of mass or center of pressure (COP). The COP is essentially the distribution of the vertical
ground reaction force. During an upright stance, the COP can be thought of as being distributed
between each foot and generally is about midway (Pellecchia & Shockley, 2005). The change in
the location of the COP over time (i.e., the shifting of the distribution of the center point) creates
a pathway that allows researchers to examine the factors that influence postural control.
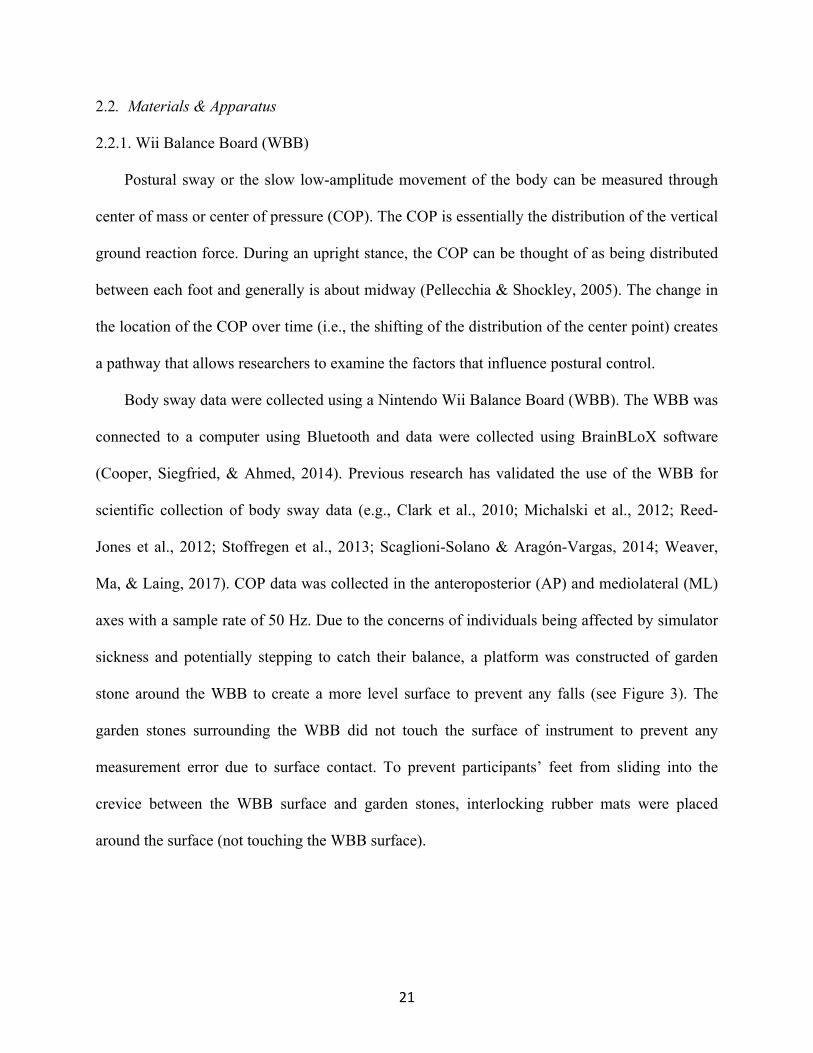
Body sway data were collected using a Nintendo Wii Balance Board (WBB). The WBB was
connected to a computer using Bluetooth and data were collected using BrainBLoX software
(Cooper, Siegfried, & Ahmed, 2014). Previous research has validated the use of the WBB for
scientific collection of body sway data (e.g., Clark et al., 2010; Michalski et al., 2012; Reed-
Jones et al., 2012; Stoffregen et al., 2013; Scaglioni-Solano & Aragón-Vargas, 2014; Weaver,
Ma, & Laing, 2017). COP data was collected in the anteroposterior (AP) and mediolateral (ML)
axes with a sample rate of 50 Hz. Due to the concerns of individuals being affected by simulator
sickness and potentially stepping to catch their balance, a platform was constructed of garden
stone around the WBB to create a more level surface to prevent any falls (see Figure 3). The
garden stones surrounding the WBB did not touch the surface of instrument to prevent any
measurement error due to surface contact. To prevent participants’ feet from sliding into the
crevice between the WBB surface and garden stones, interlocking rubber mats were placed
around the surface (not touching the WBB surface).
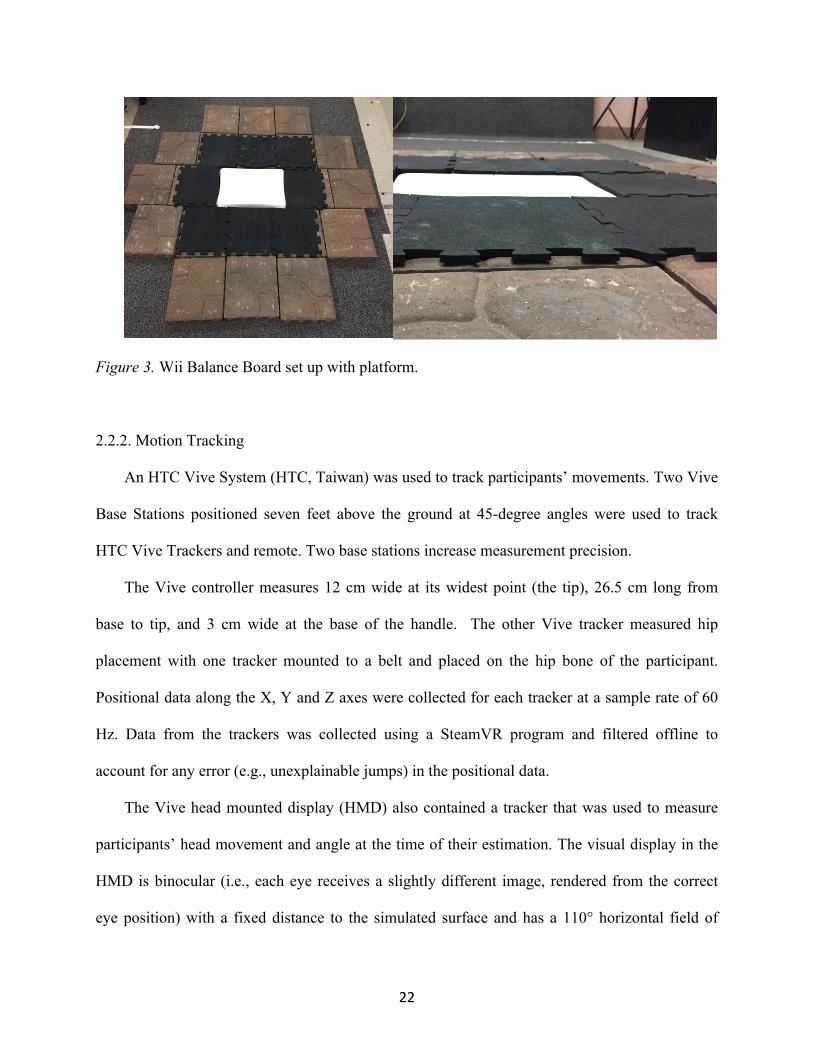
22
Figure 3. Wii Balance Board set up with platform.
2.2.2. Motion Tracking
An HTC Vive System (HTC, Taiwan) was used to track participants’ movements. Two Vive
Base Stations positioned seven feet above the ground at 45-degree angles were used to track
HTC Vive Trackers and remote. Two base stations increase measurement precision.
The Vive controller measures 12 cm wide at its widest point (the tip), 26.5 cm long from
base to tip, and 3 cm wide at the base of the handle. The other Vive tracker measured hip
placement with one tracker mounted to a belt and placed on the hip bone of the participant.
Positional data along the X, Y and Z axes were collected for each tracker at a sample rate of 60
Hz. Data from the trackers was collected using a SteamVR program and filtered offline to
account for any error (e.g., unexplainable jumps) in the positional data.
The Vive head mounted display (HMD) also contained a tracker that was used to measure
participants’ head movement and angle at the time of their estimation. The visual display in the
HMD is binocular (i.e., each eye receives a slightly different image, rendered from the correct
eye position) with a fixed distance to the simulated surface and has a 110° horizontal field of

23
view. Therefore, the eye accommodates to view an image shown at the fixed depth of the
simulated surface. However, since each eye receives a different image, the vergence angle of the
eyes change depending on how far away the simulated object is presented within the VE. The
simulated targets were kept at a constant distance of 2.91 meters away from the participants in
the VE. The HMD’s interpupillary distance (IPD) setting was adjusted so that it matched the
participant’s IPD.
2.2.3. Virtual Environment
The virtual scene used in this experiment was a room with wooden floors and four brick
patterned walls (see Figure 4) and was created using Unity. These two patterns were used in the
environment to provide texture to increase the information gathered through optic flow.
Participant location in the room was held constant across all participants (i.e., even if the WBB
were to move in the laboratory, the participant would still have the VE rendered in the same
location).
The trial targets were bullseyes that were created by overlapping three virtual circles. The
outside white circle had an approximate radius of 12.5 cm, the red middle circle had a radius of
11 cm, and the central circle had a radius of 1.2 cm. These were located on an invisible circular
arc around the participant keeping the distance from the target to the participant constant at 2.91
meters. There were four target placements: two on either side of the participant at 90 degrees and
61.3 degrees. Targets were not within the field of view when participant was looking at the “+.”
The trial targets were not constantly visible and would only appear for the randomly assigned
trial (i.e., participants would only be able to see one target at a time).
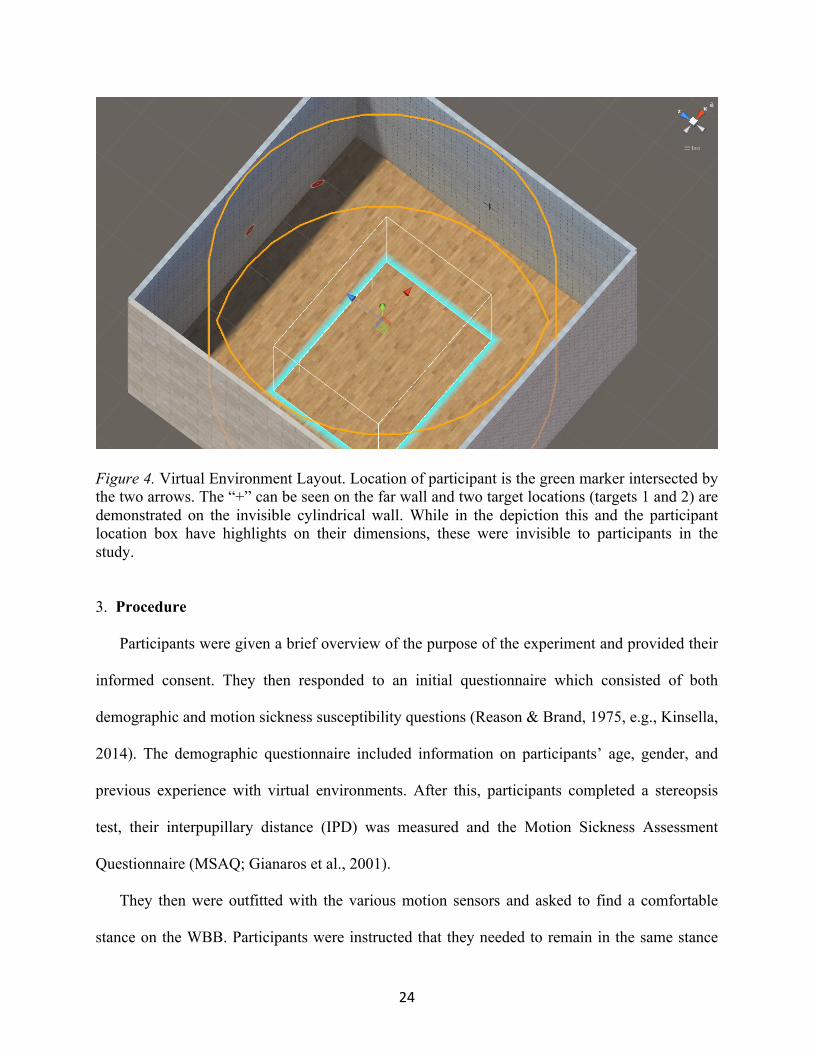
24
Figure 4. Virtual Environment Layout. Location of participant is the green marker intersected by the two arrows. The “+” can be seen on the far wall and two target locations (targets 1 and 2) are demonstrated on the invisible cylindrical wall. While in the depiction this and the participant location box have highlights on their dimensions, these were invisible to participants in the study.
3. Procedure
Participants were given a brief overview of the purpose of the experiment and provided their
informed consent. They then responded to an initial questionnaire which consisted of both
demographic and motion sickness susceptibility questions (Reason & Brand, 1975, e.g., Kinsella,
2014). The demographic questionnaire included information on participants’ age, gender, and
previous experience with virtual environments. After this, participants completed a stereopsis
test, their interpupillary distance (IPD) was measured and the Motion Sickness Assessment
Questionnaire (MSAQ; Gianaros et al., 2001).
They then were outfitted with the various motion sensors and asked to find a comfortable
stance on the WBB. Participants were instructed that they needed to remain in the same stance

25
on the WBB throughout the experiment. Therefore, during the action of a target estimation,
participants only engage their upper body (i.e., twisting at waist and moving the arm upward to
make target estimation judgments; see Figure 5b and c). Before the start of the data collection
phase, participants were given instructions for the experiment, given two practice trials, and the
were asked to explain the task and objective to the experimenter to check for comprehension.
Figure 5. Participant movement during trials. a) relax starting position, b) action required for targets 3 and 4 to the right side of the body, c) action required for targets 1 and 2 to the left side of the body. The red circle in figure c is to highlight the location of the remote controller trigger used to mark participants’ estimations.
For each block of trials, participants were forward facing in a relaxed stance—arms resting
down to the side of the body with head looking straight ahead (see Figure 5a). They were
instructed to have their head and eyes facing the “+” in the center of the wall in front of them in
the VE (see Figure 6a). Participants were given a verbal cue to begin the block of trials. For each
trial, the participant pointed the remote at the “+” and pulled the trigger. This action resulted in
a b c

26
the initiation of the trial (i.e., the initiation of the Vive tracking system) and a red arrow
indicating the location of the trial’s target (either to the left or the right of them) to appear (see
Figure 6b). The targets were not in the field of view when the participant was looking directly
forward.
Figure 6. Participants’ views of Virtual Environment during different trial tasks. (a) Stimulus of “+” target and (b) the direction of target location indicator after participant initiated trial by pointing and pulling the trigger at the “+” target, (c) participant viewing a target, (d) example of missing a target before participant recalibrates to hitting the target.
Participant’s then rotated their head and/or upper torso to locate the bullseye trial target
(Figure 6c). After finding the target and fixating on it, participants marked their estimate of the
location of the target by raising the arm with the remote controller up and pulling the trigger
located at the back (see the red circle for the location of the trigger in Figure 5c). Participants
were instructed their goal was to hit center position of the target. When making their estimates
they were required to bring their arm up in a straight manner. When making their initial estimate,

27
participants did not have any visualization of the controller or their arm in the virtual world. This
is similar to previous work of “blind” reaches (e.g., Day et al., 2017).
During the pre- and post-tests, after marking their estimate of a target’s location, participants
did not receive any additional feedback as to their performance other than a laser “zapping”
noise that just provided feedback they had made an estimate. At this point, they would rotate
back to the “+” in order to start the next trial (i.e., pointing and triggering the remote at the “+”).
During the experimental blocks, after the participant made their target estimation a ball
appeared displaying the location of their estimation (see Figure 6d). At this point they were
instructed to correct the location (if they did not hit it in their initial estimation) of the hand
remote until it matched the location of the target (e.g., central point of the target) and to again
pull the trigger. If participants missed during their recalibration they were instructed to continue
aiming and shooting until they hit the target. They were given an auditory feedback cue when
they correctly hit the target of a high pitched “ding” sound. Once this occurred, they were asked
to return their hand to the starting position and point and trigger the remote at the “+” in order to
start the next trial. Four targets were randomly presented three times in each of the eight blocks
of trials. Therefore, there was a total of 96 trials (12 per block).
Blocks of trials were completed automated through the VE programing. Therefore,
participants were in control of the timing of trials and the rate in which they completed blocks.
Once participants completed all trials within a block, they were told they could relax and
remained in the environment while the simulator sickness questionnaire (SSQ) was administered
verbally (Kennedy, Lane, Berbaum & Lilienthall, 1993). While simulator sickness is not a
variable of interest for this study, it is important to determine if it influenced the data.

28
3.1. Pre-Test Phase
Each condition started with a block of trials that were considered the pre-test phase. These
trials were without any perturbation gains (i.e., gain= 1x head rotation) or visual feedback of
where they made their target estimates. This block of trials allowed for a comparison of
performance to observe calibration effects in the post-test phase.
3.2. Experimental Phase
3.2.1. Block 1: Baseline Phase
The experimental phase began after the completion of the pre-test phase. The first block in
this phase is considered a baseline for the experimental block. This block of trials remained at a
gain of 1 but received visual feedback after their initial estimation. This block of trials allowed
for a baseline of measurements to be used to compare the other experimental trials that include
varying levels of perturbation.
3.2.1. Blocks 2-6: Experimental Phase
During the experimental phase, the constant condition (2x gain) and random increase
condition (different changes in level of gain between blocks) had perturbations included. These
perturbation of visual gain can be seen in Figure 1 for each block of trials. Participants were not
informed of any visual gain changes in any condition.

29
3.3. Post-Test Phase
The post-experimental-baseline phase was simply a repeat of the initial baseline phase after
the administration of the experimental phase. Like the pre-test, the participants received no
visual feedback about their performance. This block of trials allowed for an examination of
returning back to an unperturbed environment.
4. Data Preprocessing
4.1. Postural Sway: Entropy
Postural sway was recorded and analyzed in order to obtain the degree of entropy and
determinism of the system (i.e., amount of postural control demonstrated by the participant).
Entropy can be defined as the amount of new information generated by a system. Approximate
entropy (ApEn) can be used to characterize the observed postural sway of a participant and
examine the factors influencing the dynamical structure (Newell, 1998; Pincus, 1991). Richman
and Moorman (2000), later modified ApEn for shorter times series (i.e., 100-20,000 points)
termed sample entropy (SampEn).
SampEn quantifies the overall complexity or irregularity of a system. Systems that are
generating non-redundant information have large SampEn values. This increase in entropy
occurs when a system visits new states (Kantz, 2004). SampEn was used in this experiment to
quantify the amount of postural movement that a participant performs. SampEn was created for
each block of trials. Unfortunately, the individual trials did not provide enough data points for
analysis purposes due to the speed at which they were completed. While this did not allow for
the quantification of postural sway within the specific blocks of trials to investigate recalibration
within the block (i.e., the trials within each block), it was still possible to examine postural sway

30
recalibration across the blocks. This information enabled the investigation of how the different
conditions affect postural sway as well as how postural sway affects performance (i.e., amount of
error in an estimation).
As previously discussed, a WBB and BrainBLoX software was utilized to collect the
postural sway data (Cooper, Siegfried, & Ahmed, 2014). This data was divided into two different
files one for the sway occurring on the x axis (mediolateral sway) and the second the y-axis
(anterior-posterior sway). These were split due to the requirements of the SampEn analysis. Data
filtering was then applied to each participant’s individual blocks of trials in order to check for
any measurement noise in the data. A fourth order zero-phase shift low-pass Butterworth filter
was used with a cut-off frequency of 10 Hz commonly used in the studies devoted to the
dynamical properties of COP signals (e.g., Salavati et al. 2009; Randami et al., 2009). This data
was then filtered through a SampEn analysis and analyzed to select the appropriate tolerance (r)
and maximum length (m) to calculate the SampEn values. A tolerance of 0.3 and a maximum
length of 3 was selected for the final value utilized in this analysis.
4.2. Transformation Variables
4.2.1. Accuracy: Absolute Error
For every trial of this experiment, an initial target estimation was performed by the
participant. The difference between the target angle and the estimation angle defines the level of
accuracy for the trial. This can be thought of in terms of error. Measurement of error can be
problematic. In previous research error has been examined in raw form, by its variability, and in
absolute values (e.g., Schmidt, 1988). The raw error term can be created by taking the angle of
the presented target and the estimated target angle or degrees for each trial (error=estimated

31
angle-presented target angle). This results in a measure where lower (negative) values indicate
greater error due to underestimation, middle values near zero indicate less error, and higher
values indicate greater error due to overestimation. Thus, the scale is not a linear representation
of error. To address this problem absolute error can be assessed by taking the absolute value of
the signed error. Low values near zero reflect less error and higher values reflect greater error.
Although absolute error is a linear measure of error, directionality, or error due to under or over
rotation, is lost. Measures of absolute error assume error due to under or over rotation are
equivalent. However, effects on absolute error may depend on whether the error is due to under
or over rotation. Directionality of the error has been shown to moderate the influence of
experimental conditions on absolute error (e.g., Day et al., 2017). Therefore, to deconflate
absolute error (directionality conflated with size of error) two terms were created: absolute
error (which takes the absolute value of the signed error and is the amount of error regardless of
rotation) and directionality (a dichotomous variable to distinguish under- and over-rotation in the
estimation)
4.2.2. Target Specifying Variables
The four targets used in this experiment were transformed into two variables to analyze the
effects of their location and the action required to aim at them. Both of the variables were
dichotomous. Location was defined in terms of whether the target was at 90 degrees or 63.1
degrees. Targets 1 and 4 were considered peripheral in their location and targets 2 and 3 were
considered frontal (see Figure 7). The second term created was action requirement. This term
specified if the aiming action was open- or cross-body. Targets 1 and 2 were considered cross-
body while targets 3 and 4 were considered open-body (see Figure 8).
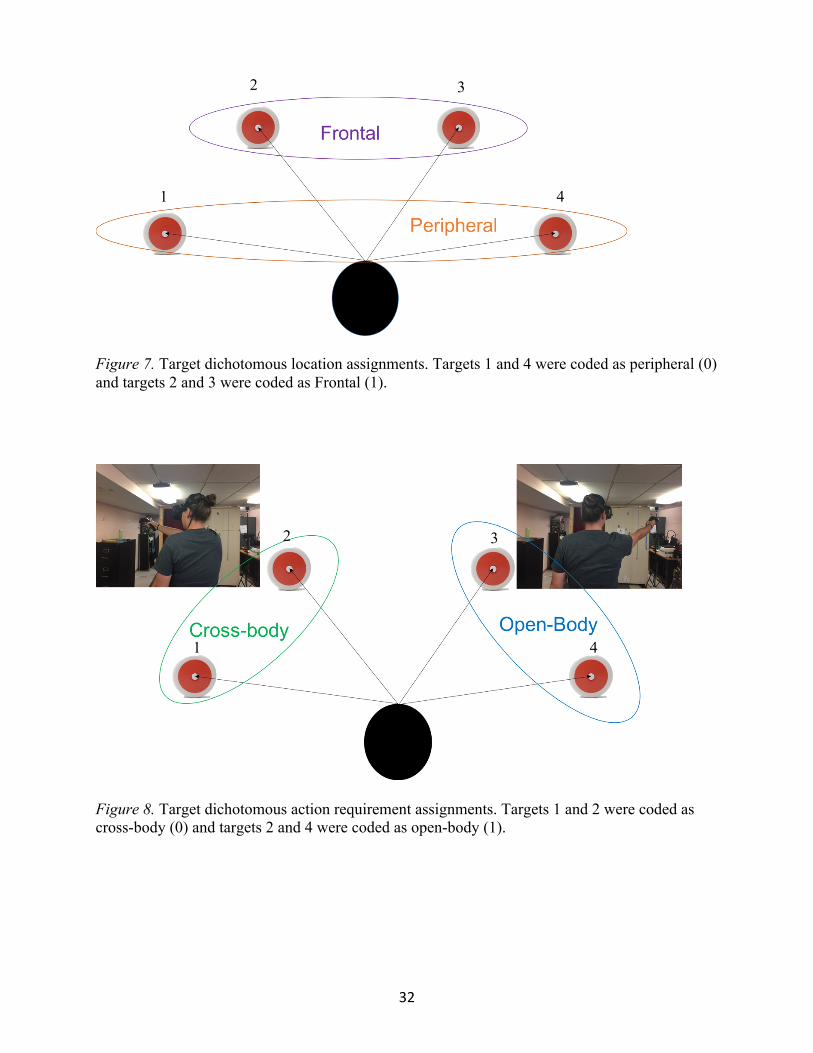
32
Figure 7. Target dichotomous location assignments. Targets 1 and 4 were coded as peripheral (0) and targets 2 and 3 were coded as Frontal (1).
Figure 8. Target dichotomous action requirement assignments. Targets 1 and 2 were coded as cross-body (0) and targets 2 and 4 were coded as open-body (1).
1
2 3
4
1
2 3
4

33
4.2.3. Head Movement Variables
Three head movement variables were created from the tracker in the HMD and the remote
controller. The first measured the maximum angle the head/ body rotated in the VE and was
termed max rotation. The total rotation variable was created to measure the amount of rotation
of the head/body along the yaw rotation axis. This variable was additive where any amount of
rotation in any direction was included. While this variable does provide a metric of total
movement within a trial, it does not include the information of directionality change that would
have allowed it to be more informative. However, it will be included in the models as a coarse
scale of total movement. The last variable was the rotation difference between the central tracker
on the HMD and the remote tracker (i.e., the estimation angle). This variable coarsely measures
the amount of eye movement within the HMD to the target at the time of estimation.
4.3. Variable Reference Specification
4.3.1. Categorical Variables
All categorical variables were dummy coded for analyses and a reference category was
specified for each. This reference remains constant throughout all analyses. For the condition
variable, the control condition was used as the reference group. Block 1 of the experimental trials
were used as reference in the analyses of these trials while the pre-test block was used as the
reference for the pre/post-test comparison analyses. The reference group for directionality was
over rotation. For the target variables, frontal was the reference for the location variable and
open-body was used to for the action requirement variable.

34
4.3.2. Continuous Variables
Continuous variables such as SampEn, MSAQ, SSQ, head movement variables were
grand mean centered. This allows for a meaningful zero for these data and allows for the
intercept variance to be estimated correctly across addition of variables. The block trial variable
was not mean centered as the meaningful zero point for this condition is the first trial. Therefore,
this variable was transformed so that the trial number began at zero instead of one (i.e.,
subtracting one from the variable).
5. Results of Experiment 1
Evidence for the first hypothesis examining recalibration rate can be studied at the block
level or within blocks at the trial level. Therefore, any significant findings in the experimental
block analysis of absolute error with any interactions containing both block or trials within block
and condition can be examined for this hypothesis.
While the first hypothesis examines the rate of recalibration observing the change in
absolute error within the experimental blocks, the second hypothesis is used to examine the
overall effect of the three environments on calibration in general. This can be observed in the
carry-over effects found in the post-test. Therefore, the interaction of interest is block and
condition in the pre-/ post-test analysis of absolute error.
The third hypothesis can be found in the postural sway analyses. The interaction of block
and condition in the experimental blocks indicate how the different levels of perturbation affect

35
the mediolateral sway and/ or the posterior-anterior sway. The overall effect of the environments
on the postural sway can be observed in the carry-over effects found in the post-test.
Lastly, the mediation model is utilized to integrate the other analyses into a relational
model between condition and absolute error with postural sway as a mediator. Block was then
included as a moderator to determine recalibration effects in the experimental blocks and carry-
over effects in the pre-/ post-test blocks.
In order to address the rich complexity of the data, comprehensive analyses were
conducted. While the lower-order main effects and interactions described above can provide
evidence for the various hypotheses, these interactions can be dependent on other variables.
Therefore, higher-order interactions were included for full factorial models to examine other
moderating factors. This is specifically for the primary dependent variable of absolute error.
These analyses were conducted in a systematic fashion examining primary variables that are
specific to the hypothesis and the principal focus of the current study before secondary variables
that could be impacting the results (e.g., simulator sickness, head rotation, etc.). Additionally,
while all significant effects are discussed, main effects and lower-order interactions are the
average of higher-order interaction variables and should be examined as such. In essence,
significant higher-order interactions demonstrate moderating factors of lower order main effects
and interactions. Descriptive statistics for collected variables can be found in Appendix A for the
experimental blocks and Appendix B for the pre-/post-test blocks for Experiment 1.
5.1. Outlier Analysis
For each analysis, full models (i.e., a model with all predictors and interactions that will be
analyzed) were conducted to determine any outliers. From these models residuals were obtained,

36
standardized, and examined for any potential outliers and extreme cases that are outside of the
normal distribution (Cohen et. al, 2003). Generally, it has been found that these points are due to
malfunctioning in the tracking equipment based or on participant error (e.g., marking an
estimation prematurely). All analyses found less than 1% of the trials removed due to outlier
analysis.
5.2. Hierarchical Linear Modeling (HLM)
Variables have considerable nesting within participants due to the repeated-measures design
used in this research. In order to address the nesting of trials within participants, multilevel
modeling (hierarchical linear modeling, HLM) was used to analyze both accuracy and entropy
as dependent variables. HLM allows more flexibility in the modeling of repeated-measures data
and has many advantages over traditional repeated-measures analysis of variance (e.g., Cohen et
al., 2003). For instance, predictors may be nominal or continuous and vary at the measurement
occasions (i.e., they can be time-varying and can change between trials). This allows for the
variances across measurement occasions and within participants to be kept and analyze instead
of being disregarded by other mean based type analyses. The use of HLM also allows for a more
flexible approach to modeling the possible error structures and “fit” statistics of the repeated
measures.
Predictors that carry variance at the measurement occasion level are Level 1 variables.
These variables are anything that can potentially change from trial to trial (e.g., target location,
visual gain, phase or block of the trial, trial number, etc.). Predictors that carry variance at the
person-level are Level 2 variables. These are any variables that remain constant for participants
during the experiment. Interaction terms will also be created which can be either inter-level
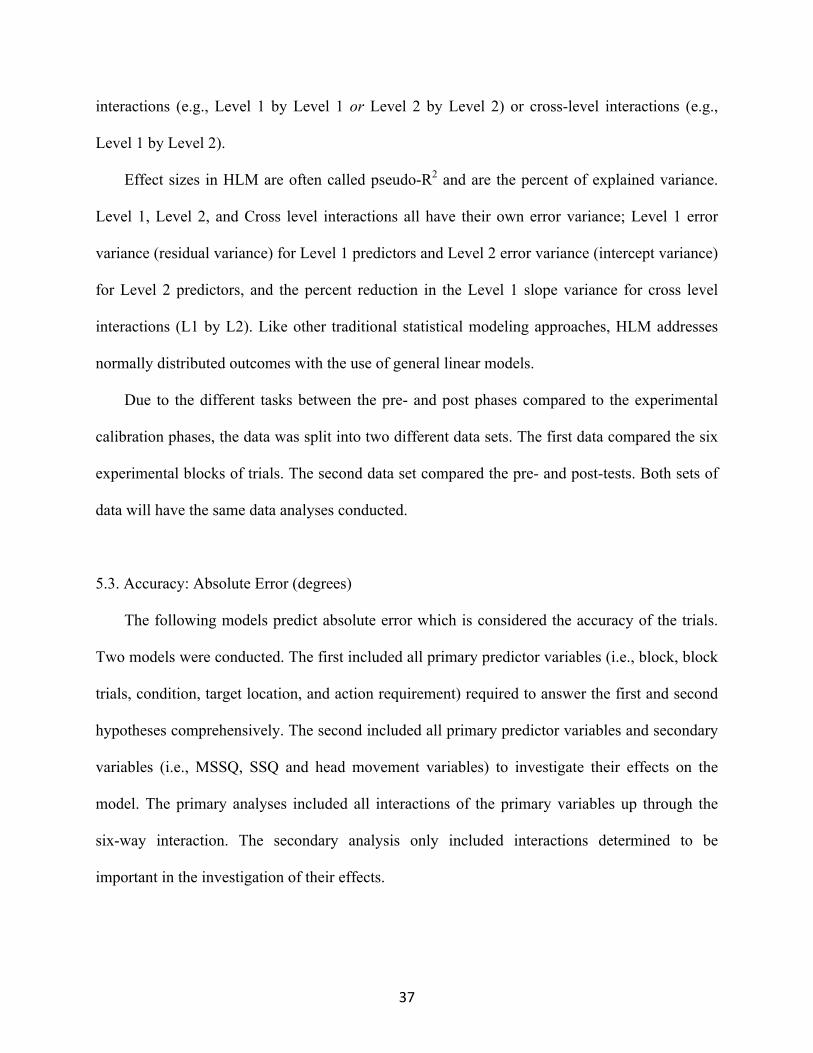
37
interactions (e.g., Level 1 by Level 1 or Level 2 by Level 2) or cross-level interactions (e.g.,
Level 1 by Level 2).
Effect sizes in HLM are often called pseudo-R2 and are the percent of explained variance.
Level 1, Level 2, and Cross level interactions all have their own error variance; Level 1 error
variance (residual variance) for Level 1 predictors and Level 2 error variance (intercept variance)
for Level 2 predictors, and the percent reduction in the Level 1 slope variance for cross level
interactions (L1 by L2). Like other traditional statistical modeling approaches, HLM addresses
normally distributed outcomes with the use of general linear models.
Due to the different tasks between the pre- and post phases compared to the experimental
calibration phases, the data was split into two different data sets. The first data compared the six
experimental blocks of trials. The second data set compared the pre- and post-tests. Both sets of
data will have the same data analyses conducted.
5.3. Accuracy: Absolute Error (degrees)
The following models predict absolute error which is considered the accuracy of the trials.
Two models were conducted. The first included all primary predictor variables (i.e., block, block
trials, condition, target location, and action requirement) required to answer the first and second
hypotheses comprehensively. The second included all primary predictor variables and secondary
variables (i.e., MSSQ, SSQ and head movement variables) to investigate their effects on the
model. The primary analyses included all interactions of the primary variables up through the
six-way interaction. The secondary analysis only included interactions determined to be
important in the investigation of their effects.

38
For the dependent variable of accuracy measured by absolute error a main effects model
including all Level 1 and 2 predictors was conducted for a more conservative model to estimate
effects and coefficients. Level 1 predictors include: block (categorical), block trial (continuous),
target location (dichotomous), action requirement (dichotomous), SampEn (continuous), and
SSQ. The level 2 predictors will be condition and MSAQ-pre and –post for experimental models.
The MSAQ-pre and –post will be grouped into a single variable for the pre-/post analysis
creating a level 2 variable.
5.3.1. Experimental Block Analyses for Absolute Error in Experiment 1
5.3.1.1. Absolute Error Primary Analysis in Experimental Blocks for Experiment 1
The F-Test results from the hierarchical linear modeling for accuracy as the outcome can be
seen in Table 1. Continuous variables also have the coefficient estimate of the slope and standard
error. For a comprehensive table of all predictors’ coefficients is located in Appendix C.
Table 1. Fixed Coefficients, Standard Errors and R2∆ for Absolute Error for the primary variables in the experimental block of Experiment 1.
Fixed Effects
Predictor Coefficient (SE) F-Test P-value
ΔR2
L1 L2 Cross-Level Interaction
Intercept 1.73 (0.16)
-- -- -- -- --
Block -- 5.70 <0.001 .0207 -- -- Block Trial (Btrial) -0.01 (0.01) 2.18 0.15 -- -- -- Location (Loc) -- 1.96 0.16 -- -- -- Action Requirement (AR) -- 2.51 0.12 -- -- -- Directionality (Dir) -- 13.06 0.00 .0135 -- -- Condition (Cond) -- 1.07 0.35 -- -- -- Block*Btrial -- 2.12 0.06 -- -- -- Loc*Block -- 0.19 0.97 -- -- -- AR*Block -- 0.94 0.46 -- -- -- Dir*Block -- 3.19 0.01 .0028 -- --

39
Loc*Btrial -- 0.65 0.42 -- -- -- AR*Btrial -- 1.64 0.20 -- -- -- Dir*Btrial -- 0.03 0.87 -- -- -- Loc*AR -- 1.54 0.22 -- -- -- AR*Dir -- 0.21 0.65 -- -- -- Loc*Dir -- 8.52 <0.001 .0020 -- -- Cond*Block -- 1.63 0.09 -- -- -- Cond*Btrial -- 1.14 0.33 -- -- -- Cond*Loc -- 0.53 0.59 -- -- -- Cond*AR -- 0.21 0.81 -- -- -- Cond*Dir -- 0.08 0.93 -- -- -- Loc*Block*Btrial -- 1.44 0.21 -- -- -- AR*Block*Btrial -- 1.25 0.28 -- -- -- Dir*Block*Btrial -- 0.54 0.75 -- -- -- Loc*AR*Block -- 0.57 0.73 -- -- -- Loc*Dir*Block -- 1.72 0.13 -- -- -- AR*Dir*Block -- 0.95 0.45 -- -- -- Loc*Dir*Btrial -- 0.90 0.34 -- -- -- AR*Dir*Btrial -- 17.30 <0.001 .0043 -- -- Loc*AR*Dir -- 2.82 0.09 -- -- -- Loc*AR*Btrial -- 0.78 0.38 -- -- -- Cond*Block*Btrial -- 1.31 0.22 -- -- -- Cond*Loc*Block -- 1.33 0.21 -- -- -- Cond*AR*Block -- 0.99 0.45 -- -- -- Cond*Dir*Block -- 0.79 0.64 -- -- -- Cond*Loc*Btrial -- 0.16 0.86 -- -- -- Cond*AR*Btrial -- 0.54 0.59 -- -- -- Cond*Dir*Btrial -- 1.56 0.20 -- -- -- Cond*Loc*AR -- 0.85 0.43 -- -- -- Cond*Loc*Dir -- 0.68 0.51 -- -- -- Cond*AR*Dir -- 1.91 0.15 -- -- -- Loc*AR*Dir*Block -- 0.57 0.72 -- -- -- Loc*AR*Dir*Btrial -- 0.02 0.89 -- -- -- Loc*AR*Block*Btrial -- 1.11 0.35 -- -- -- Loc*Dir*Block*Btrial -- 1.90 0.09 -- -- -- AR*Dir*Block*Btrial -- 0.69 0.63 -- -- -- Cond*Loc*Block*Btrial -- 0.93 0.51 -- -- -- Cond*AR*Block*Btrial -- 1.85 0.048 -- -- .0030 Cond*Dir*Block*Btrial -- 0.55 0.86 -- -- -- Cond*Loc*AR*Block -- 1.93 0.04 -- -- .0031 Cond*Loc*Dir*Block -- 0.62 0.80 -- -- -- Cond*AR*Dir*Block -- 0.80 0.63 -- -- -- Cond*Loc*AR*Btrial -- 0.80 0.45 -- -- -- Cond*Loc*Dir*Btrial -- 0.04 0.97 -- -- -- Cond*AR*Dir*Btrial -- 0.64 0.53 -- -- -- Cond*Loc*AR*Dir -- 0.64 0.53 -- -- -- Loc*AR*Dir*Block*Btrial -- 0.94 0.45 -- -- -- Cond*Loc*AR*Dir*Block -- 0.56 0.85 -- -- -- Cond*Loc*AR*Dir*Btrial -- 0.22 0.80 -- -- -- Cond*Loc*AR*Block*Btrial -- 0.59 0.83 -- -- -- Cond*Loc*Dir*Block*Btrial -- 1.21 2.85 -- -- -- Cond*AR*Dir*Block*Btrial -- 1.42 0.17 -- -- -- Cond*Loc*AR*Dir*Block*Btrial -- 0.93 0.50 -- -- -- TotalΔR2 .0433 -- .0061
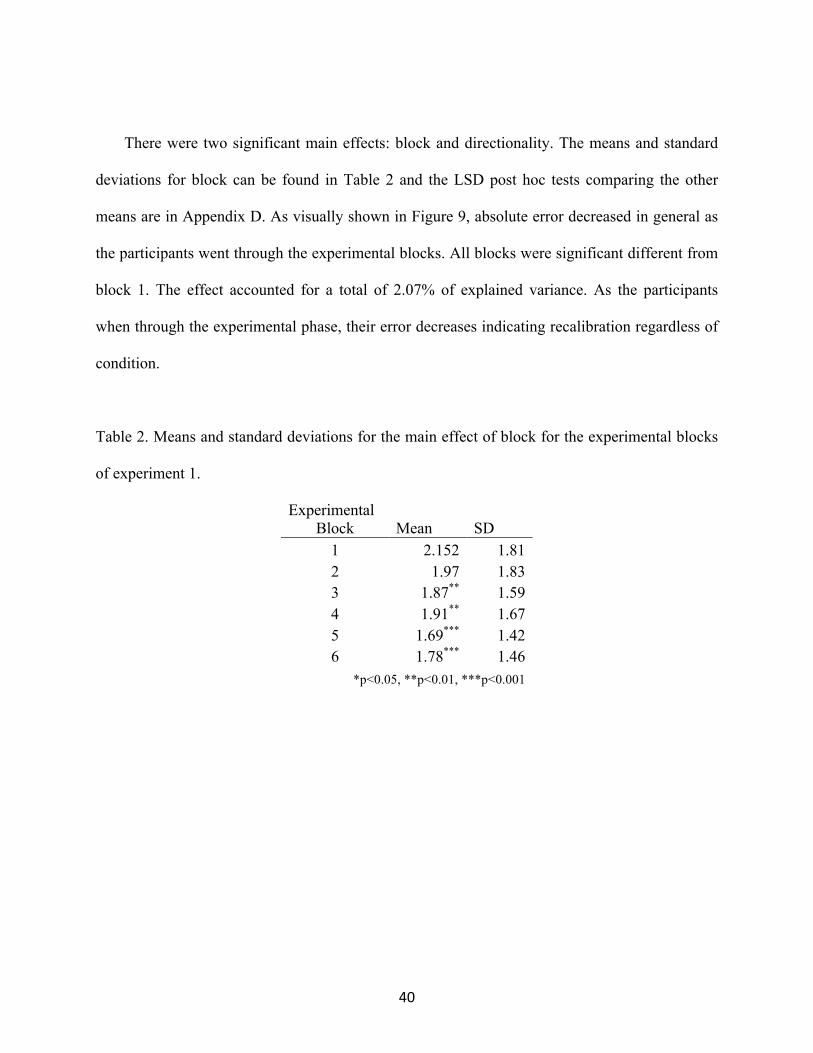
40
There were two significant main effects: block and directionality. The means and standard
deviations for block can be found in Table 2 and the LSD post hoc tests comparing the other
means are in Appendix D. As visually shown in Figure 9, absolute error decreased in general as
the participants went through the experimental blocks. All blocks were significant different from
block 1. The effect accounted for a total of 2.07% of explained variance. As the participants
when through the experimental phase, their error decreases indicating recalibration regardless of
condition.
Table 2. Means and standard deviations for the main effect of block for the experimental blocks
of experiment 1.
Experimental Block Mean SD
1 2.152 1.81 2 1.97 1.83 3 1.87** 1.59 4 1.91** 1.67 5 1.69*** 1.42 6 1.78*** 1.46
*p<0.05, **p<0.01, ***p<0.001

41
Figure 9. The main effect of block on absolute error (degrees) in experimental blocks for experiment 1. Block 1 was used as the reference group with blocks 3-6 being significantly different. As the participants when through the experimental phase, their error decreases indicating recalibration regardless of condition.
The directionality main effect showed that the amount of error depended on the direction of
the estimation. Estimations that were under rotated had more error (M = 2.07 degrees, SD =
1.74) than over-rotation estimations (M = 1.53 degrees, SD = 1.74; see Figure 10). The effect
account for a total of 1.35 % of explained variance.
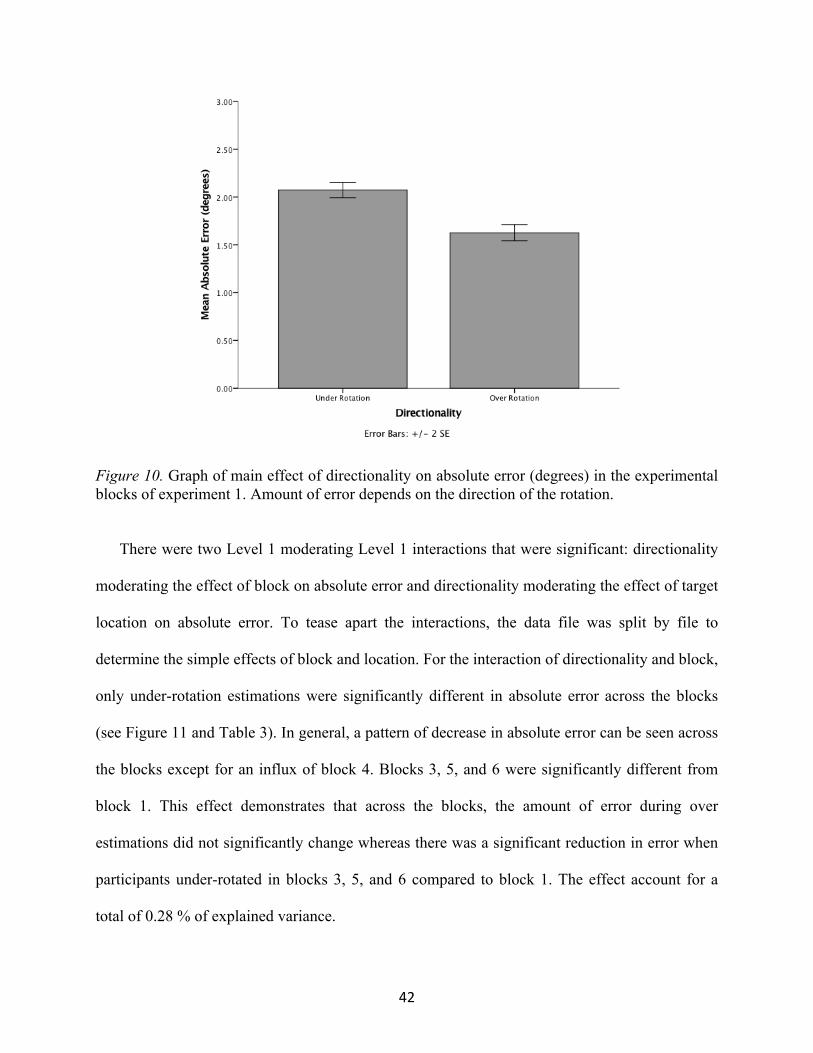
42
Figure 10. Graph of main effect of directionality on absolute error (degrees) in the experimental blocks of experiment 1. Amount of error depends on the direction of the rotation.
There were two Level 1 moderating Level 1 interactions that were significant: directionality
moderating the effect of block on absolute error and directionality moderating the effect of target
location on absolute error. To tease apart the interactions, the data file was split by file to
determine the simple effects of block and location. For the interaction of directionality and block,
only under-rotation estimations were significantly different in absolute error across the blocks
(see Figure 11 and Table 3). In general, a pattern of decrease in absolute error can be seen across
the blocks except for an influx of block 4. Blocks 3, 5, and 6 were significantly different from
block 1. This effect demonstrates that across the blocks, the amount of error during over
estimations did not significantly change whereas there was a significant reduction in error when
participants under-rotated in blocks 3, 5, and 6 compared to block 1. The effect account for a
total of 0.28 % of explained variance.

43
Table 3. Absolute Error means and standard deviations for block by directionality interaction for
the experimental blocks of experiment 1. Only under-rotation means were significantly different.
Directionality Experimental Block Mean SD
Under Rotation***
Block1 2.42 2.01 Block2 2.18 1.95
Block3** 2.05 1.70 Block4 2.23 1.83 Block5*** 1.75 1.44 Block6*** 1.82 1.33
Over Rotation
Block1 1.75 1.36 Block2 1.65 1.57 Block3 1.62 1.36 Block4* 1.44 1.26 Block5 1.59 1.39 Block6 1.71 1.66
*p<0.05, **p<0.01, ***p<0.001

44
Figure 11. Interaction of block by directionality estimating absolute error (degrees) experimental blocks of experiment 1. The simple effect of block estimating absolute error is only significant when participants are under-rotating.
For the interaction of location, only over-rotation was significantly different in absolute
error between frontal and peripheral location. The means and standard deviations of the
interaction can be found in Table 4 with a visualization in Figure 12. For the peripheral targets
(targets 1 and 4) participants had larger amounts of error (i.e., they over-rotated more than when
they estimated peripheral targets. The effect account for a total of 0.20 % of explained variance.

45
Table 4. Absolute Error means and standard deviations for location by directionality interaction
for the experimental blocks of experiment 1. Only over-rotation means were significantly
different.
Directionality Location
Frontal Peripheral Mean SD Mean SD
Under Rotation 2.08 1.72 2.07 1.76 Over Rotation*** 1.48 1.27 1.76 1.56
*p<0.05, **p<0.01, ***p<0.001
Figure 12. Effect of the directionality of the estimate on the absolute error mediated by the location of the target in experimental blocks in Experiment 1. Only over rotation is significantly different between the locations.
There was one significant three-way L1 interaction between action requirement, target
location, and the trials within blocks accounting for 0.43 % of the variance. To investigate the

46
location of the difference, the data file was first split by directionality and the two-way
interaction between action requirement and block trials was analyzed. Both under- and over-
rotation had significant interactions in the model. The file was further split by action requirement
to investigate the simple effect of block trial. In over-rotation, only cross-body had a significant
effect for block trial while in under-rotation only open-body was significant. The figures for this
three-way interaction can be seen in Figure 13. In the under-rotation graph, it can be seen that the
amount of absolute error decreases in the open body condition while, the cross-body targets
increased the amount of absolute error slightly but this slope was not significant. In the over-
rotation graph, open-body has a very shallow non-significant slope while absolute error
decreased for cross-body targets as the trials continued. The negative slopes for under-rotation by
open-body targets and over rotation by cross-body targets indicates calibration effects in these
interactions as the trials within the block increased.
Figure 13. Three-way interaction of directionality, action requirement, and block trial predicting absolute error in the experimental blocks of Experiment 1. In under-rotation only open-body has a significant block trial simple slope. In over-rotation, only cross-body has a significant block trial simple slope. Note that the first trial in a block is considered trial 0 in the analysis and graph.

47
Lastly, there were two significant cross-level four-way interactions. This first was an
interaction between condition, action requirement, block, and block trial which explained 0.31%
of the total explained variance This interaction was further explored by splitting the file to find
the simple effects of the lower-order interactions and simple slopes. The first comparison was the
three-way interaction of condition, block, and block trial by action requirement. In this analysis
only the interaction in the cross-body targets were significant. The two-way interaction of
condition and block trial were then investigation by splitting by action requirement and block.
The examination of the cross-body by block interactions of condition and block trial was only
significant for blocks 2 and 6. The last decomposition of the interaction was to split the file by
action requirement, block, and condition and investing the simple slopes of block trial within
cross-body targets in blocks 2 (the first block of gain in both the constant and random increase
conditions) and 6 (the last block of the experimental blocks). In block 2, both the control and
constant conditions had a significant negative slope, while random increase showed a non-
significant positive slope (see Figure 14). In block 6, only the random increase condition had a
significant negative slope (see Figure 15).
The negative slopes indicate calibration across the trial while non-significant slopes
indicate a lack of calibration either due to inability to calibrate or pre-perturbed levels of
accuracy. Examining these two blocks together provides evidence for the first hypothesis. There
is more variability for the random increase non-significant slope condition in block 2 compared
to the control and constant non-significant slopes in block 6. Therefore, the lack of calibration in
block 2 for the random increase slope can be attributed to an inability to calibrate while the lack
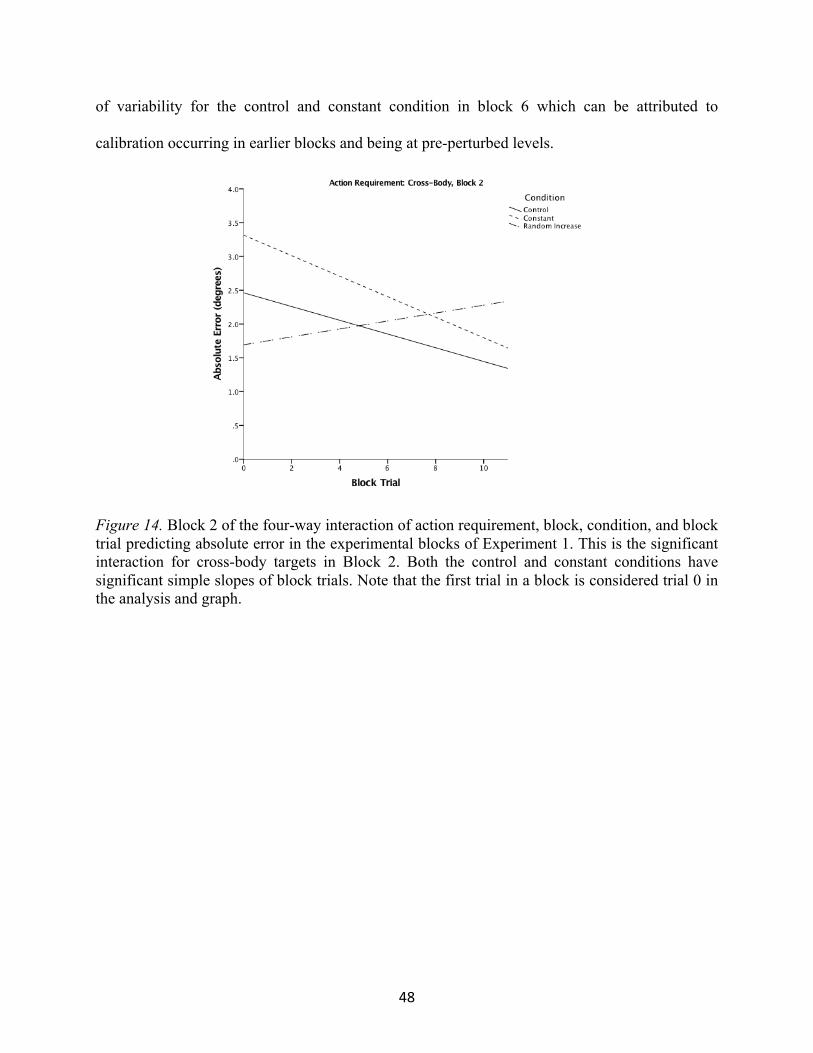
48
of variability for the control and constant condition in block 6 which can be attributed to
calibration occurring in earlier blocks and being at pre-perturbed levels.
Figure 14. Block 2 of the four-way interaction of action requirement, block, condition, and block trial predicting absolute error in the experimental blocks of Experiment 1. This is the significant interaction for cross-body targets in Block 2. Both the control and constant conditions have significant simple slopes of block trials. Note that the first trial in a block is considered trial 0 in the analysis and graph.

49
Figure 15. Block 6 of the four-way interaction of action requirement, block, condition, and block trial predicting absolute error in the experimental blocks of Experiment 1. This is the significant interaction for cross-body targets in Block 6. Only the random increase condition had a significant slope. Note that the first trial in a block is considered trial 0 in the analysis and graph.
The second four-way interaction is between condition, block, target location, and action
requirement. To investigate the three-way interaction of condition, target location, and action
requirement were analyzed by block. The only block that was significant was the first block.
Next the two-way interaction of target location and action requirement were analyzed within the
first block by condition. Only the constant condition was significant. Finally, the simple effect of
action requirement was analyzed in the constant condition’s first block by location. Action
requirement was only significant within the peripheral targets (see Figure 16). In Figure 16, it
can be seen that the constant condition has more absolute error for cross-body peripheral targets
(i.e., target 1; M= 2.76, SD= 1.89) than for open-body peripheral targets (i.e., target 4; M=1.52,
SD= 1.56). This interaction explained 0.30% of the variance.

50
Figure 16. Significant four-way interaction of block, condition, location, and action requirement predicting absolute error in the experimental blocks of Experiment 1. The decomposition of the interaction found the significant was in the first experimental block, in the constant condition, for the peripheral targets.
5.3.1.2. Absolute Error Secondary Analysis in Experimental Blocks of Experiment 1.
In this model, secondary variables and specific interactions were included in the model in
order to determine their effects on absolute error while controlling for the primary variables.
Level 1 secondary variables include: total head rotation, max head rotation, rotational difference
(difference between head rotation and arm rotation), SSQ. Level 2 secondary variables are the
MSAQ-Pre and the MSAQ-Post. Due to the high correlation between max head rotation and total
head rotation, these two variables were analyzed in their perspective models without the
inclusion of the other. This was to guard against any suppression that may occur with both
variables in the model simultaneously. Since primary models and interactions have been
discussed previous, only the significant new effects will be discussed. The F-Test results from

51
the hierarchical linear modeling for accuracy as the outcome including secondary variables can
be seen in Table 5. Only main effect and significant interactions have coefficients included in the
table. For a full table of all coefficients please refer to Appendix E.
Table 5. Fixed Coefficients, Standard Errors and R2∆ for Absolute Error for the secondary
variables in the experimental blocks of experiment 1.
The only significant secondary variable main effect is SampEn-X. This effect is the
measurement of mediolateral sway and accounts for 0.18% of the total explained variance. As
depicted in Figure 17, in general (i.e., averaged across blocks and conditions), as SampEn-X
increases by 0.1 (i.e., as postural sway increases), absolute error decreases by 0.44 degrees. This
Fixed Effects
Predictor Coefficient (SE) F-Test P-value
ΔR2
L1 L2 Cross-Level Interaction
Intercept 1.66 (0.19) -- -- -- -- --
Block 3.98 <0.001 .0043 -- -- Block trial -0.02 (0.01) 2.26 0.14 -- -- -- Location 0.87 0.35 -- -- -- Action Requirement 3.17 0.08 -- -- -- Directionality 12.64 0.00 .0115 -- -- Total Rotation 0.003 (0.002) 2.60 0.11 -- -- -- Max Rotation -0.01 (0.01) 0.88 0.35 -- -- -- Rotational Difference 0.003 (0.01) 0.11 0.74 -- -- -- SampEn-X -4.41 (1.84) 5.71 0.02 .0018 -- -- SampEn-Y 0.06 (2.84) 0.00 0.99 -- -- -- SSQ 0.002 (0.02 0.02 0.90 -- -- -- MSAQ Pre 2.79 0.10 -- -- -- MSAQ Post 0.78 0.38 -- -- -- Condition 1.33 0.28 -- -- -- Block * SSQ 3.02 0.01 .0036 -- -- Block * Total Rotation 0.66 0.65 -- -- -- Block * Max Rotation 0.49 0.79 -- -- -- Block * Rotational Difference 4.56 <0.001 .0060 -- -- Condition * SSQ 0.14 0.87 -- -- -- Condition * Total Rotation 0.28 0.76 -- -- -- Condition * Max Rotation 0.32 0.72 -- -- -- Condition * Rotational Difference 0.59 0.55 -- -- -- Block * Condition 1.64 0.09 -- -- -- Block * Condition * SSQ 0.63 0.79 -- -- -- Block * Condition * Total Rotation 0.99 0.45 -- -- -- Block * Condition * Max Rotation 1.28 0.24 -- -- -- Block*Condition * Rotational Difference 1.02 0.36 -- -- --
TotalΔR2 .0272 -- --

52
is an interesting result as the opposite effect was expected. Specifically, it was expected that the
more postural sway the less accurate the estimates would become.
Figure 17. Main effect of mediolateral sway (SampEn-X) predicting absolute error in the experimental blocks of experiment 1. The x-axis scale is the grand mean center version of the SampEn-X variable with the translated actual values located above.
There were two Level 1 moderating Level 1 interactions that were significant: block
moderating SSQ scores and block moderating rotational difference between head rotation and
estimation rotation. As shown in Figure 18, the slope of SSQ estimating absolute error depends
on the block. In blocks 2, 3, and 6, had positive slopes indicating that higher SSQ scores created
greater absolute error. Blocks 1,4, and 5 had negative slopes. None of the simple slopes were
significant. This accounted for 0.36% of the explained variance.

53
Figure 18. Interaction of block and simulator sickness (SSQ) predicting absolute error (degrees) in the experimental blocks of experiment 1. The x-axis is the grand mean center SSQ variable, with the translated actual values located above. Note that SSQ scores were whole numbers and the translated values in the figure are based on the mean of the variable and values depicted.
The second significant two-way interaction was block moderating the effect of rotational
difference on absolute error. This effect accounted for 0.6 % of the variance. Figure 19 shows
that the effect of rotational differences depended on the block. Block 1 has the greatest influence
on the relationship between rotational difference and absolute error. In this block, as rotational
difference increases absolute error decrease. Essentially, after the initial block with visual
feedback, rotational differences did not have as much of an effect on accuracy. The simple slopes
for rotational difference by block were not significantly different from zero.

54
Figure 19. Interaction of block and rotational difference (degrees) predicting absolute error
(degrees) in the experimental blocks of experiment 1. The x-axis is the grand mean center
variable of rotational difference, with the translated actual values located above.
5.3.2. Pre-/ Post-test Analyses for Absolute Error in Experiment 1
The only change from the experimental block analysis is that in the secondary analysis
MSAQ-pre and –post is grouped into a single variable for the pre-/post analysis creating a level 2
variable.
5.3.2.1. Absolute Error Primary Analysis in Pre-/ Post-test blocks of Experiment1
The F-Test results from the hierarchical linear modeling for accuracy as the outcome can
be seen in Table 6. Due to the size of the complete coefficient table, only the main effects’ and

55
significant interactions’ coefficients and standard errors are included in the table. Please see
Appendix F for the comprehensive coefficient table.
Table 6. Fixed Coefficients, Standard Errors and R2∆ for Absolute Error in the Pre-/ Post Blocks
of Experiment 1.
Fixed Effects
Predictor Coefficient (SE) F-Test P-value
ΔR2
L1 L2
Cross-Level
Interaction Intercept 1.90 (0.34) -- -- -- -- --
Block -- 15.08 <0.001 .0136 -- -- Block Trial (Btrial) 0.11 (0.03) 17.97 <0.001 .0238 -- -- Location (Loc) -- 4.50 0.034 .0466 -- -- Action Requirement (AR) -- 3.68 0.062 -- -- -- Directionality (Dir) -- 0.92 0.344 -- -- -- Condition (Cond) -- 1.22 0.305 -- -- -- Block * Btrial -- 0.04 0.834 -- -- -- Block * Loc -- 0.06 0.806 -- -- -- Block * AR -- 0.14 0.707 -- -- -- Block * Dir -- 8.71 0.003 .0033 -- -- Loc * Btrial -- 0.40 0.525 -- -- -- AR * Btrial -- 3.02 0.083 -- -- -- Dir * Btrial -- 1.16 0.283 -- -- -- Loc * AR -- 0.94 0.332 -- -- -- Dir * AR -- 5.33 0.021 .0079 -- -- Loc * Dir -- 3.46 0.063 -- -- -- Block * Cond -- 6.88 <0.001 -- -- .0080 Cond * Btrial -- 0.09 0.913 -- -- -- Cond * Loc -- 0.45 0.640 -- -- -- Cond * AR -- 1.39 0.262 -- -- -- Cond * Dir -- 0.50 0.611 -- -- -- Block * Loc * Btrial -- 4.68 0.031 .0028 -- -- Block * AR * Btrial -- 4.71 0.030 .0017 -- -- Block * Dir * Btrial -- 0.86 0.354 -- -- -- Block * Loc * AR -- 1.44 0.231 -- -- -- Block * Loc * Dir -- 2.65 0.104 -- -- -- Block * Dir * AR -- 1.00 0.317 -- -- -- Loc * AR * Btrial -- <0.001 0.998 -- -- -- Loc * Dir * Btrial -- 1.94 0.164 -- -- -- Dir * AR * Btrial -- 18.86 <0.001 .0133 -- -- Loc * Dir * AR -- 1.26 0.263 -- -- -- Loc * AR * Btrial -- 0.14 0.873 -- -- -- Block * Cond * Btrial -- 2.43 0.089 -- -- -- Block * Cond * Loc -- 0.49 0.611 -- -- -- Block * Cond * AR -- 3.13 0.044 -- -- .0018 Block * Cond * Dir -- 1.19 0.306 -- -- -- Cond * Loc * Btrial -- 1.11 0.329 -- -- --

56
There were three significant main effects: block, block trial, and target Loc. For the main
effect of block, the pre-test block had more absolute error (M = 3.24, SD = 2.68) than the post-
test block (M = 2.78, SD = 2.25). This effect account for a total of 1.36% of explained variance.
The block trials main effect can be seen in Figure 20. As participants go through the trials within
the pre- and post-test block on average they are increasing their absolute error amount by 0.11
degrees per block. This indicates that without visual feedback, calibration is not occurring within
these blocks on average. This effect account for a total of 2.38% of explained variance. Lastly,
target location had a significant main effect with a total of 4.66%. There were greater amounts of
absolute error in the peripheral target (i.e., targets 1 and 4) estimates (M = 3.17, SD= 2.63) than
the frontal target (i.e. targets 2 and 3) estimates (M=2.85, SD = 2.32).
Cond * AR * Btrial -- 0.94 0.390 -- -- -- Cond * Dir * Btrial -- 0.41 0.747 -- -- -- Cond * Loc * AR -- 0.43 0.650 -- -- -- Cond * Loc * Dir -- 0.02 0.982 -- -- -- Cond * Dir * AR -- 0.43 0.650 -- -- -- Block * Loc * Dir * AR -- 0.81 0.370 -- -- -- Loc * Dir * AR * Btrial -- 0.47 0.493 -- -- -- Block * Loc * AR * Btrial -- 1.19 0.276 -- -- -- Block * Loc * Dir * Btrial -- <0.001 0.990 -- -- -- Block * Cond * Loc * Btrial -- 0.82 0.441 -- -- -- Block * Cond * AR * Btrial -- 0.20 0.820 -- -- -- Block * Cond * Dir * Btrial -- 1.94 0.144 -- -- -- Block * Cond * Loc * AR -- 1.90 0.151 -- -- -- Block * Cond * Loc * Dir -- 0.14 0.866 -- -- -- Block * Cond * Dir * AR -- 3.83 0.022 -- -- .0046 Cond * Loc * AR * Btrial -- 0.41 0.667 -- -- -- Cond * Loc * Dir * Btrial -- 0.41 0.665 -- -- -- Cond * Dir * AR * Btrial -- 0.84 0.431 -- -- -- Cond * Loc * Dir * AR -- 0.68 0.506 -- -- -- Block * Loc * Dir * AR * Btrial -- 0.19 0.666 -- -- -- Block * Cond * Loc * Dir * AR -- 0.06 0.940 -- -- -- Cond * Loc * Dir * AR * Btrial -- 2.96 0.052 -- -- -- Block * Cond * Loc * AR * Btrial -- 0.33 0.719 -- -- -- Block * Cond * Loc * Dir * Btrial -- 0.71 0.490 -- -- -- Block * Cond * Dir * AR * Btrial -- 1.69 0.186 -- -- -- Block * Cond * Loc * Dir * AR * Btrial -- 0.84 0.431 -- -- --
TotalΔR2
.1130 .0144
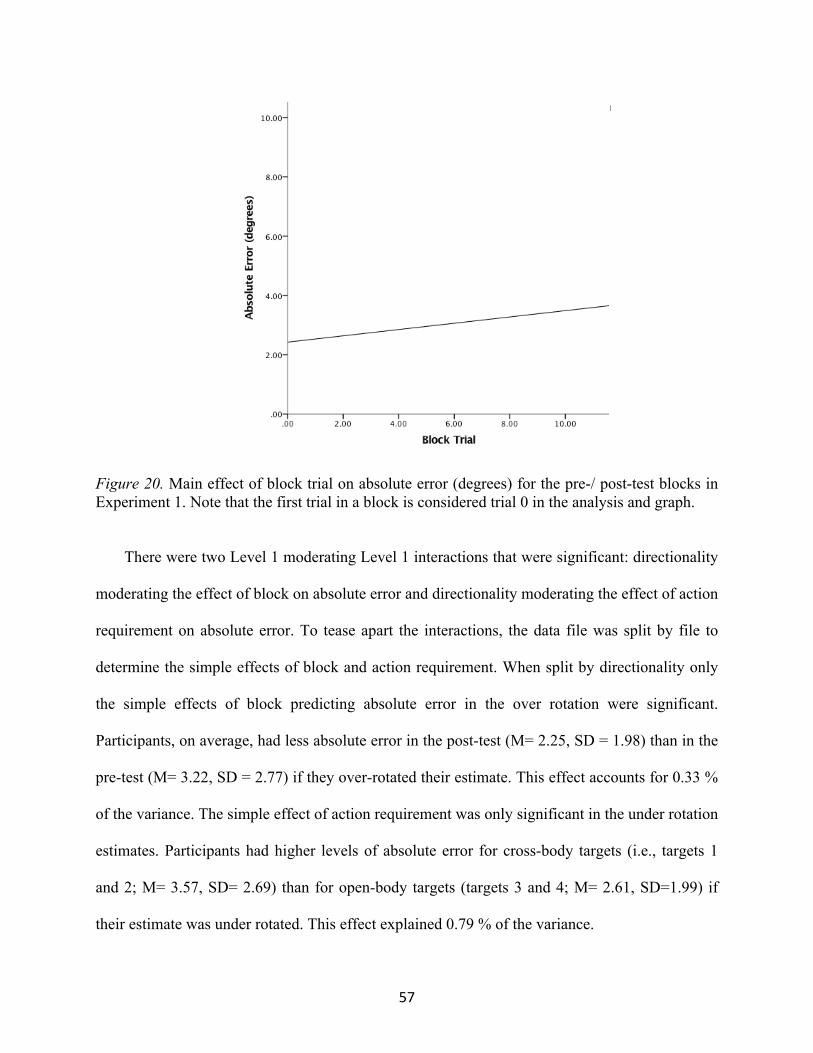
57
Figure 20. Main effect of block trial on absolute error (degrees) for the pre-/ post-test blocks in Experiment 1. Note that the first trial in a block is considered trial 0 in the analysis and graph.
There were two Level 1 moderating Level 1 interactions that were significant: directionality
moderating the effect of block on absolute error and directionality moderating the effect of action
requirement on absolute error. To tease apart the interactions, the data file was split by file to
determine the simple effects of block and action requirement. When split by directionality only
the simple effects of block predicting absolute error in the over rotation were significant.
Participants, on average, had less absolute error in the post-test (M= 2.25, SD = 1.98) than in the
pre-test (M= 3.22, SD = 2.77) if they over-rotated their estimate. This effect accounts for 0.33 %
of the variance. The simple effect of action requirement was only significant in the under rotation
estimates. Participants had higher levels of absolute error for cross-body targets (i.e., targets 1
and 2; M= 3.57, SD= 2.69) than for open-body targets (targets 3 and 4; M= 2.61, SD=1.99) if
their estimate was under rotated. This effect explained 0.79 % of the variance.
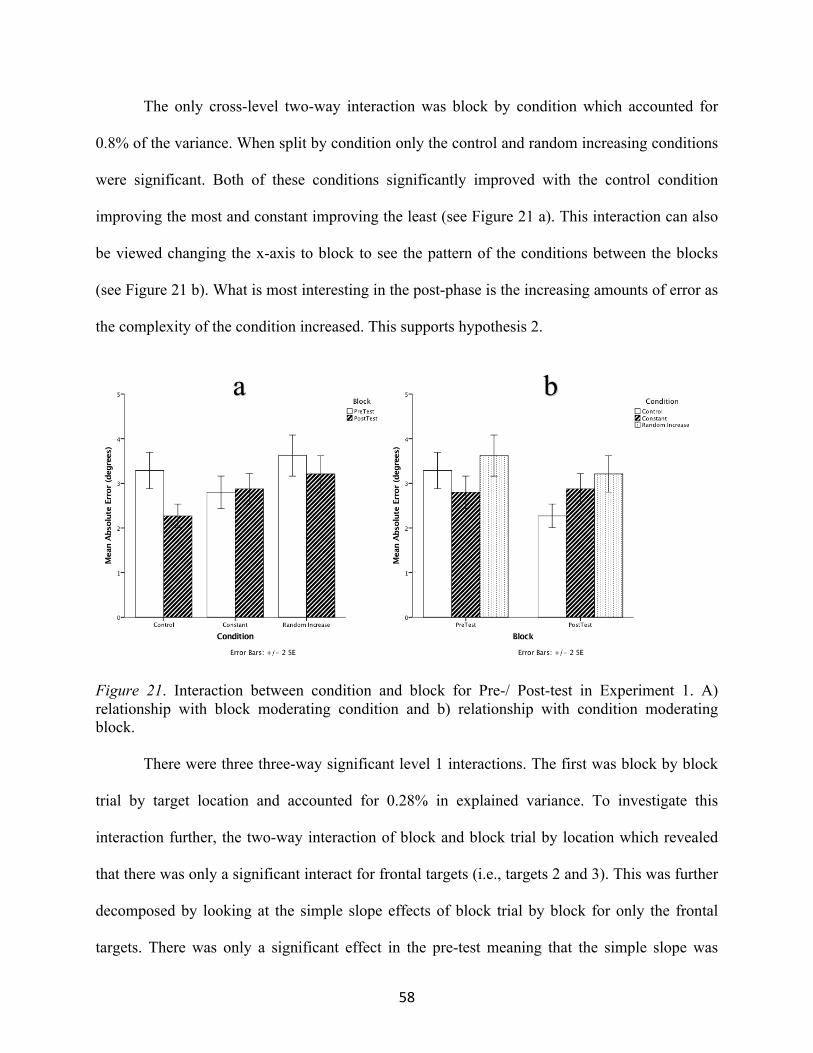
58
The only cross-level two-way interaction was block by condition which accounted for
0.8% of the variance. When split by condition only the control and random increasing conditions
were significant. Both of these conditions significantly improved with the control condition
improving the most and constant improving the least (see Figure 21 a). This interaction can also
be viewed changing the x-axis to block to see the pattern of the conditions between the blocks
(see Figure 21 b). What is most interesting in the post-phase is the increasing amounts of error as
the complexity of the condition increased. This supports hypothesis 2.
Figure 21. Interaction between condition and block for Pre-/ Post-test in Experiment 1. A) relationship with block moderating condition and b) relationship with condition moderating block.
There were three three-way significant level 1 interactions. The first was block by block
trial by target location and accounted for 0.28% in explained variance. To investigate this
interaction further, the two-way interaction of block and block trial by location which revealed
that there was only a significant interact for frontal targets (i.e., targets 2 and 3). This was further
decomposed by looking at the simple slope effects of block trial by block for only the frontal
targets. There was only a significant effect in the pre-test meaning that the simple slope was
a b
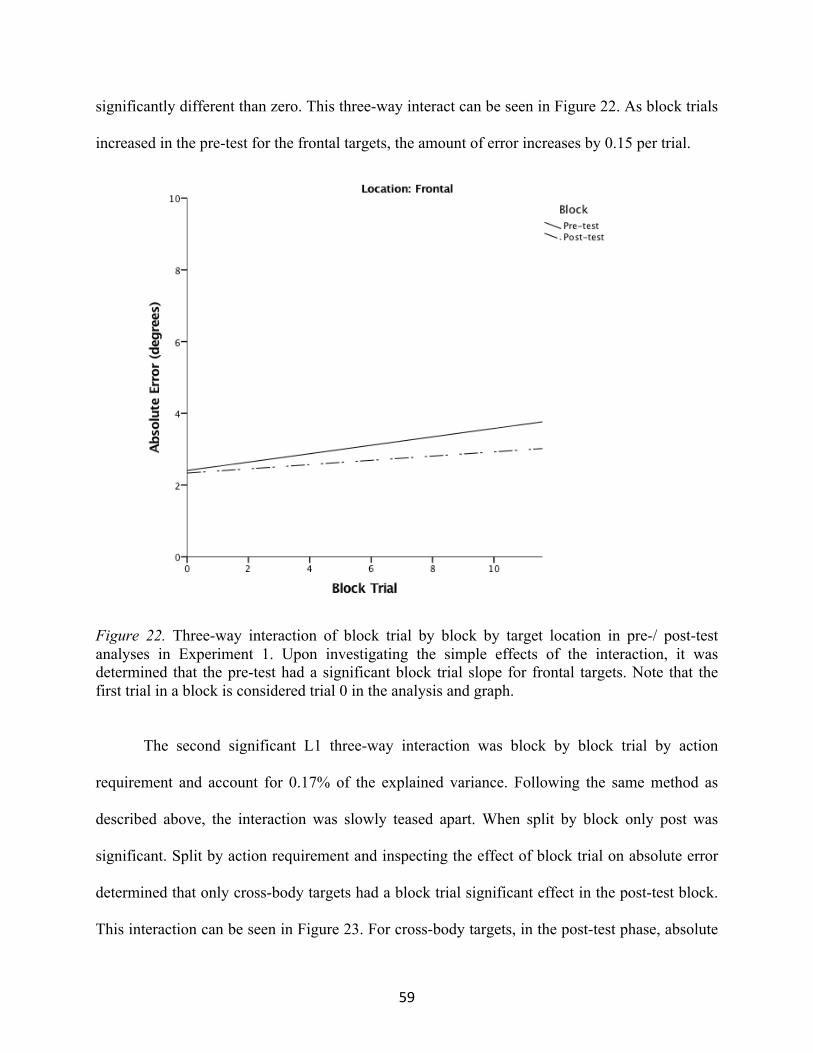
59
significantly different than zero. This three-way interact can be seen in Figure 22. As block trials
increased in the pre-test for the frontal targets, the amount of error increases by 0.15 per trial.
Figure 22. Three-way interaction of block trial by block by target location in pre-/ post-test analyses in Experiment 1. Upon investigating the simple effects of the interaction, it was determined that the pre-test had a significant block trial slope for frontal targets. Note that the first trial in a block is considered trial 0 in the analysis and graph.
The second significant L1 three-way interaction was block by block trial by action
requirement and account for 0.17% of the explained variance. Following the same method as
described above, the interaction was slowly teased apart. When split by block only post was
significant. Split by action requirement and inspecting the effect of block trial on absolute error
determined that only cross-body targets had a block trial significant effect in the post-test block.
This interaction can be seen in Figure 23. For cross-body targets, in the post-test phase, absolute
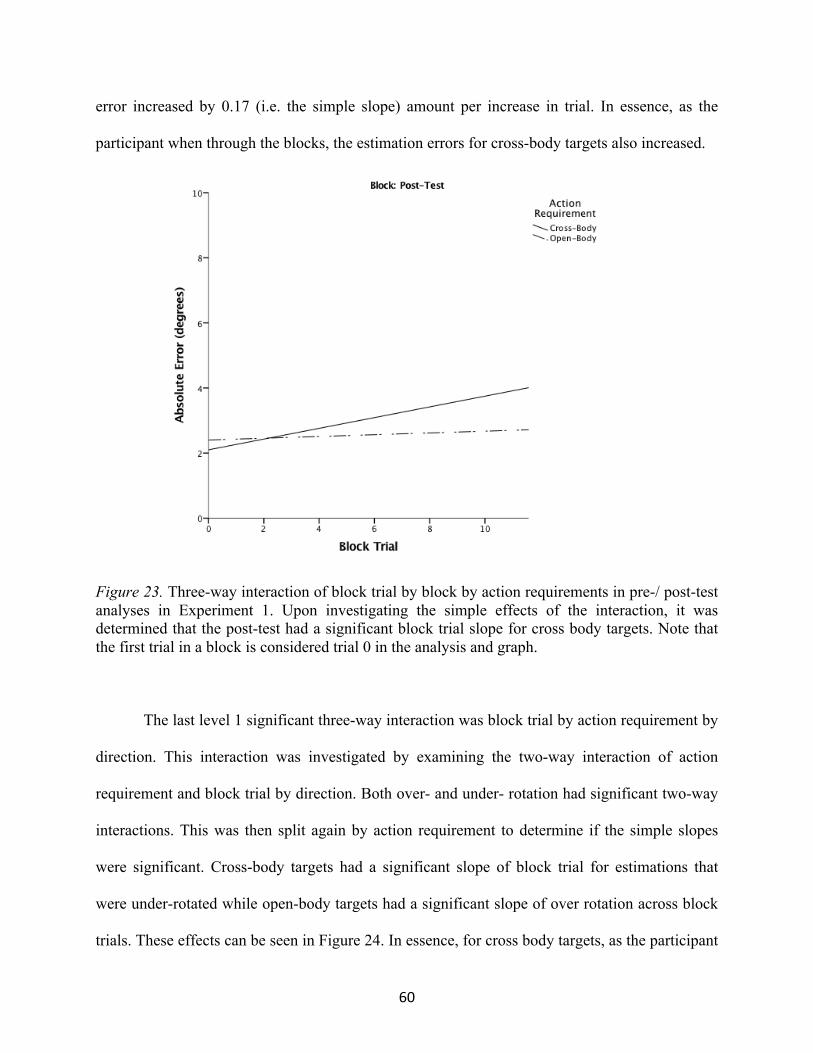
60
error increased by 0.17 (i.e. the simple slope) amount per increase in trial. In essence, as the
participant when through the blocks, the estimation errors for cross-body targets also increased.
Figure 23. Three-way interaction of block trial by block by action requirements in pre-/ post-test analyses in Experiment 1. Upon investigating the simple effects of the interaction, it was determined that the post-test had a significant block trial slope for cross body targets. Note that the first trial in a block is considered trial 0 in the analysis and graph. The last level 1 significant three-way interaction was block trial by action requirement by
direction. This interaction was investigated by examining the two-way interaction of action
requirement and block trial by direction. Both over- and under- rotation had significant two-way
interactions. This was then split again by action requirement to determine if the simple slopes
were significant. Cross-body targets had a significant slope of block trial for estimations that
were under-rotated while open-body targets had a significant slope of over rotation across block
trials. These effects can be seen in Figure 24. In essence, for cross body targets, as the participant
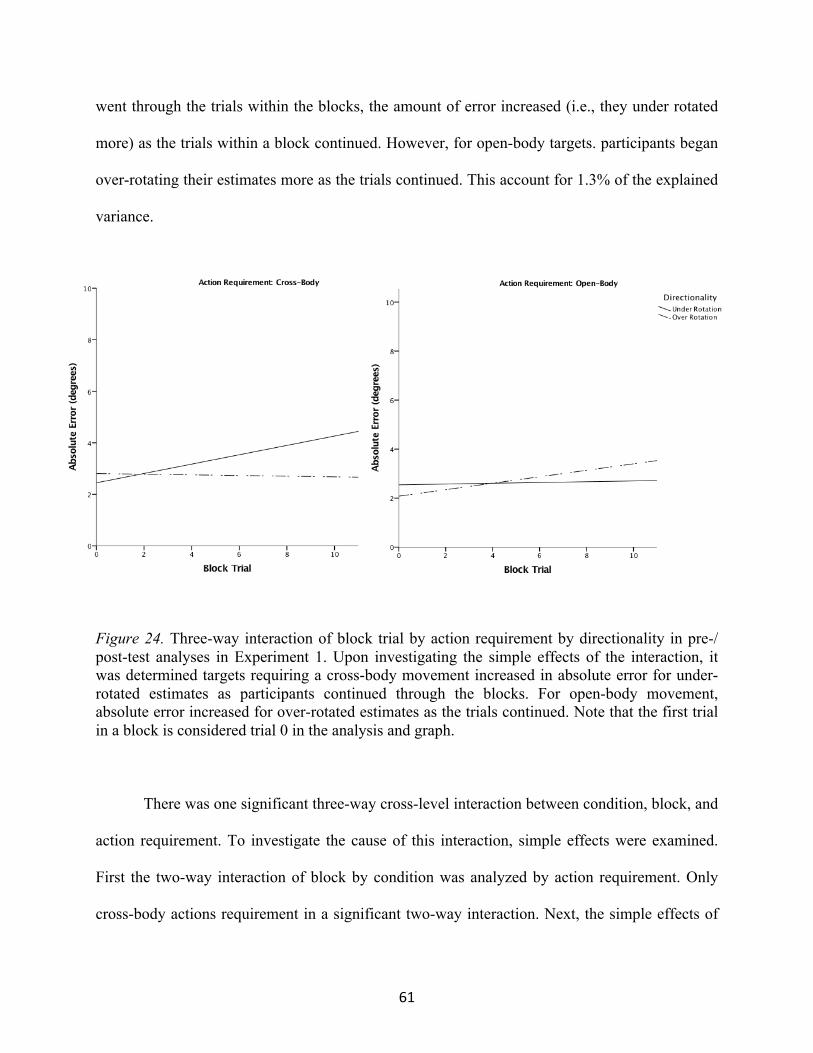
61
went through the trials within the blocks, the amount of error increased (i.e., they under rotated
more) as the trials within a block continued. However, for open-body targets. participants began
over-rotating their estimates more as the trials continued. This account for 1.3% of the explained
variance.
Figure 24. Three-way interaction of block trial by action requirement by directionality in pre-/ post-test analyses in Experiment 1. Upon investigating the simple effects of the interaction, it was determined targets requiring a cross-body movement increased in absolute error for under-rotated estimates as participants continued through the blocks. For open-body movement, absolute error increased for over-rotated estimates as the trials continued. Note that the first trial in a block is considered trial 0 in the analysis and graph.
There was one significant three-way cross-level interaction between condition, block, and
action requirement. To investigate the cause of this interaction, simple effects were examined.
First the two-way interaction of block by condition was analyzed by action requirement. Only
cross-body actions requirement in a significant two-way interaction. Next, the simple effects of

62
the block were analyzed by condition for cross-body targets. There were two significant simple
effects of block in the control condition (pre: M = 3.53, SD = 2.51; post M = 2.36, SD =1.78)
and the random increase condition (pre: M = 4.40, SD = 2.57; post M = 2.58, SD =2.81; see
Figure 25). Both of these conditions significantly decreased the absolute error for cross body
targets in the post-test. This effect accounts for 0.18% of the explained variance.
Figure 25. Three-way interaction of block by action requirement by condition in pre-/ post-test analyses in Experiment 1. The pre- and post- absolute error means for the control and random increase condition were significantly different for cross-body targets. Both decreased significantly in the post-test. Constant condition was not significant.
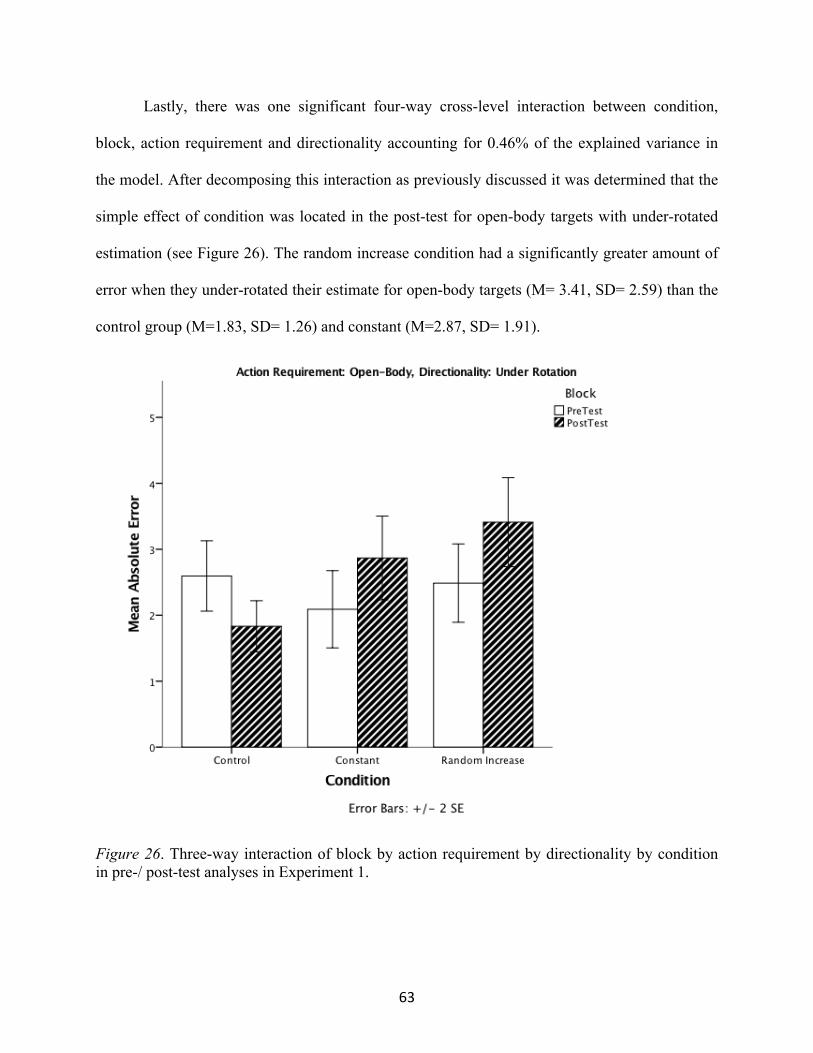
63
Lastly, there was one significant four-way cross-level interaction between condition,
block, action requirement and directionality accounting for 0.46% of the explained variance in
the model. After decomposing this interaction as previously discussed it was determined that the
simple effect of condition was located in the post-test for open-body targets with under-rotated
estimation (see Figure 26). The random increase condition had a significantly greater amount of
error when they under-rotated their estimate for open-body targets (M= 3.41, SD= 2.59) than the
control group (M=1.83, SD= 1.26) and constant (M=2.87, SD= 1.91).
Figure 26. Three-way interaction of block by action requirement by directionality by condition in pre-/ post-test analyses in Experiment 1.

64
This finding supports that calibration did occur for the control condition, however both
the constant and random increase conditions had larger amounts of error when under-rotating
their open-body estimates. This effect can be explained due to the interactions in the
experimental block where both these conditions did not have to rotate as far as the control
conditions causing their estimates to have greater error in the carryover effect of the post-test
block. Additionally, as hypothesized, the random increase condition showed the most error and
variability in these estimates. The control and random increase conditions had a significant
difference between pre- and post-tests. The control condition significantly decreased the absolute
error from pre- (M = 2.59, SD = 1.69) to post-test (M = 1.83, SD = 2.59) for open-body targets
when they under-rotated (i.e., if they made an under rotated estimate, the total error was less
during the post-phase). The random increase condition significantly increased the absolute error
from pre (M = 2.49, SD = 1.83), to post-test (M = 3.41, SD = 2.59) for open-body targets when
they under-rotated. This finding is evidence supporting hypothesis 2.
5.3.2.2. Absolute Error Secondary Analysis in Pre-/ Post-test blocks of Experiment 1
This is the same analyses as used for the experimental blocks. However, MSAQ was
turned into a Level 1 variables as it varies between these two blocks. Again, due to the high
correlation between max head rotation and total head rotation, these two variables were analyzed
in their perspective models without the inclusion of the other. This was to guard against any
suppression that may occur with both variables in the model simultaneously. Since primary
models and interactions have been discussed previous, only the significant new effects will be
discussed. The F-Test results from the hierarchical linear modeling for accuracy as the outcome
including secondary variables can be seen in Table 7. Only continuous variables will have

65
coefficients and standard errors included in the model. For a full table of all coefficients please
refer to Appendix G.
Table 7: Fixed Coefficients, Standard Errors and R2∆ for Absolute Error for the Secondary
Variables in pre-/ post-test analyses in Experiment 1.
The only significant secondary variable main effect was the rotational difference between
the head rotation and the target estimation. This effect accounts for 3.93% of the total explained
variance. As depicted in Figure 27, as the difference between the head rotation and estimation
rotation increases by 1 degree, absolute error increases by 0.13 degrees. Meaning that more
accurate estimations occur when there are smaller disparities between the angle of the head and
the the angle of the estimating arm.
Fixed Effects
Predictor Coefficient (SE) F-Test P-value
ΔR2
L1 L2 Cross-Level Interaction
Intercept 2.25 (0.38)
-- -- -- -- --
Block 12.08 0.001 .0095 -- --
Block trial (btrial) 0.09 (0.03)
13.16 0.001 .0169 -- --
Location 2.33 0.127 -- -- -- Action Requirement 7.86 0.008 .0169 -- -- Directionality 10.05 0.002 .0213 -- -- Total Rotation -0.01 (0.01) 1.75 0.186 -- -- -- Max Rotation 0.04 (0.02) 3.64 0.057 -- -- -- Rotation Difference 0.13 (0.02) 38.66 <0.001 .0393 -- -- SampEn-X -6.24 (5.26) 1.41 0.236 -- -- -- SampEn-Y -3.73 (6.21) 0.36 0.548 -- -- -- MSAQ 0.22 0.639 -- -- -- Condition 1.18 0.319 -- -- -- Block * Total Rotation 0.05 0.826 -- -- -- Block * Max Rotation 0.86 0.355 -- -- -- Block * Rotation Difference 17.57 <0.001 .0131 -- -- Condition * MSAQ 1.14 0.32 -- -- -- Condition * Total Rotation 0.45 0.636 -- -- -- Condition * Max Rotation 1.00 0.367 -- -- -- Condition * Rotation Difference 2.91 0.055 -- -- -- Block * Condition 6.04 0.002 -- -- .0073 Condition * Btrial 0.15 0.861 -- -- -- Block * Condition * Total Rotation 0.33 0.721 -- -- -- Block * Condition * Max Rotation 0.54 0.584 -- -- --
Block * Condition * Rotation Difference 4.45 0.012 -- -- .0047
TotalΔR2 .1170 -- .0120

66
Figure 27. The main effect of rotational difference (degrees) between head rotation and estimating arm rotation on absolute error for pre-/ post-test analysis in Experiment 1. The x-axis scale is the grand mean center rotational difference variable with the translated actual values located above.
There was a significant two-way interaction between rotational differences and block.
This interaction accounted for 1.31% in explained variance. Simple slopes were conducted to
determine how the slopes vary between blocks. Only the pre-test block had a significant simple
slope (see Figure 28). In this figure you can see that in the pre-test as the degree of rotational
difference between the head angle and the estimation angle increases, the absolute error also
increases by about 0.2 degrees. Essentially, in the pre- test, the difference between head degree

67
and estimation of the pointing arm greatly influenced the accuracy of the estimate. What is also
noteworthy is this effect is not seen in the post-test block.
Figure 28. The interaction effect of block and the rotational difference between head rotation and estimating arm rotation on absolute error for pre-/ post-test analysis in Experiment 1. Only the pre-test slope was significant. The x-axis scale is the grand mean center rotational difference variable with the translated actual values located above.
Lastly, there was one significant three-way between block, condition, and rotational
difference which accounted for 0.47% in explained variance. Investigating this interaction found
the effect of rotational difference on absolute error is in the post-test phase in the control and
random increase condition (see Figure 29). As the rotational difference increased, individuals in
the control condition increased their estimation error by about 0.14 degrees for every rotational
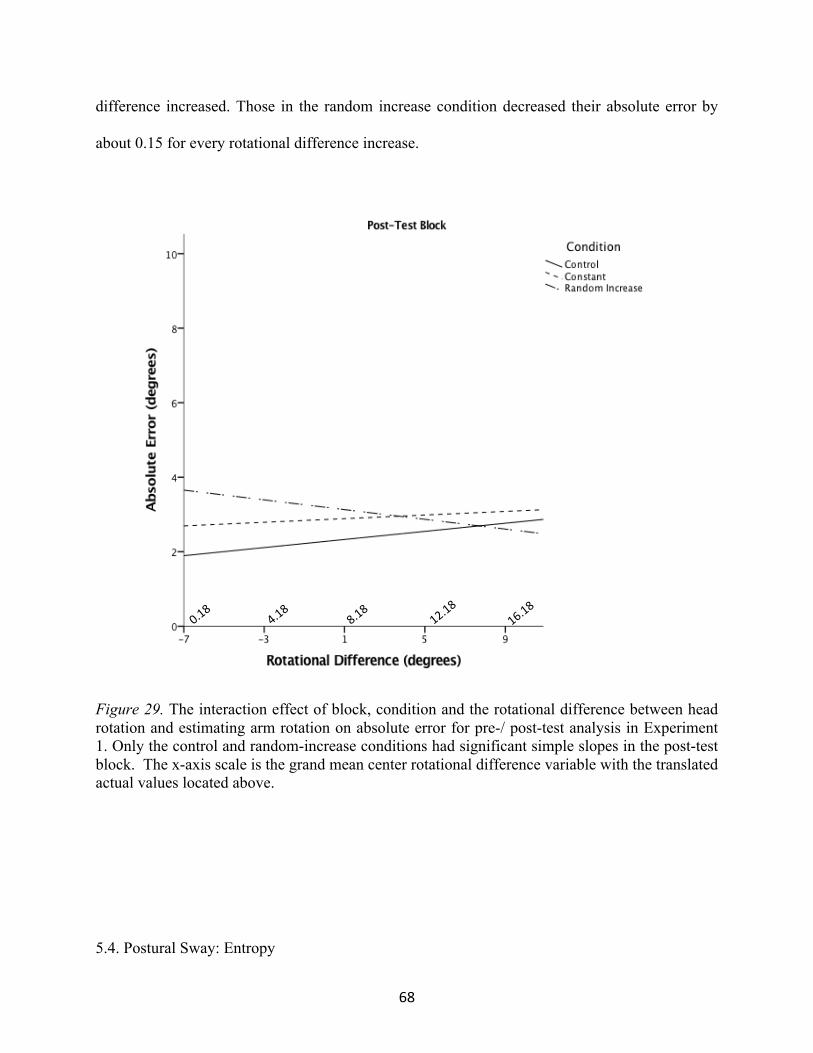
68
difference increased. Those in the random increase condition decreased their absolute error by
about 0.15 for every rotational difference increase.
Figure 29. The interaction effect of block, condition and the rotational difference between head rotation and estimating arm rotation on absolute error for pre-/ post-test analysis in Experiment 1. Only the control and random-increase conditions had significant simple slopes in the post-test block. The x-axis scale is the grand mean center rotational difference variable with the translated actual values located above.
5.4. Postural Sway: Entropy

69
The predictors for the dependent variable of postural sway are block, condition and the two-
way interaction. There are two measures of the entropy, the mediolateral sway (SampEn-X) and
the posterior-anterior sway (SampEn-Y). Both of these variables are measured at the block level
and therefore, trials within blocks cannot be used as a variable. The postural sway indexed by the
SampEn-X variable is the shifting of the COP by shifting weight to either side of the body (i.e.,
left to right). While the SampEn-Y variable is the shifting of the COP by shifting weight forward
and backward (i.e., between the toes and heels of the foot).
5.4.1. Postural Sway Analysis in Experimental Block for Experiment 1
The F-Test results from the hierarchical linear modeling for SampEn-X and SampEn-Y
as the outcome can be seen in Table 8.
Table 8. F-tests for SampEn-X and –Y for the experimental blocks in experiment 1.
Both outcome variables had significant main effects of block. The means for block can be
found in Table 9 and visualized in Figure 30. For both SampEn-X and –Y, all blocks were
significantly different from block 1, LSD post hoc analyses can be found in Appendix H for
SampEn-X and Appendix I for SampEn-Y. In general entropy increases across blocks for
ΔR2 Outcome Variable Model F-Test P-value L1 L2 Cross-Level Interaction
SampEn-X Block 42.03 <0.001 .0633 -- --
Condition 0.13 0.88 -- -- -- Block*Condition 10.117 <0.001 -- -- .0272
SampEn-Y Block 11.063 <0.001 .0166 -- -- Condition 0.302 0.741 -- -- -- Block*Condition 41.346 <0.001 -- -- .1173

70
SampEn-X. However, for SampEn-Y, the first three blocks decreased while the last three blocks
increased. This effect accounted for 6.33% of explained variance in the SampEn-X variable and
1.66% in the SampEn-Y variable.
Table 9. Mean and standard deviations of the main effect of block on SampEn-X and SampEn-Y
in the experimental blocks of Experiment 1.
Mean (SD) Block SampEn-X SampEn-Y
1 0.0618 (0.02) 0.0592 (0.02) 2 0.0654 (0.02) 0.0565 (0.02) 3 0.0636 (0.02) 0.0554 (0.02) 4 0.0627 (0.02) 0.0562 (0.02) 5 0.0695 (0.02) 0.0566 (0.01) 6 0.0723 (0.02) 0.0576 (0.02)
Figure 30. Means and standard errors of the main effect of block on SampEn-X and SampEn-Y for the experimental blocks in Experiment 1. Additionally, the two-way interaction between block and condition was significant for
both entropy outcome variables. For SampEn-X, the interaction accounted for 2.72% in

71
explained variance while it accounted for 11.73% for SampEn-Y. The means for the interaction
can be found in Table 10 and visualized in Figure 31. When the interaction was analyzed for the
simple effects, there were significant simple effect of block in all conditions for both SampEn-X
and –Y. In general, there was more mediolateral sway than posterior-anterior sway. There was
also more variability in the conditions as the complexity of the environment increased for both
indices. In essence, the control condition shows the least amount of variability and the random
increase shows the most variability. The random increase condition also shows a gradual
increase pattern in the SampEn-X outcome variable.
Table 10. Mean and standard deviations of the interaction effect of block and condition on
SampEn-X and SampEn-Y for the experimental blocks of Experiment 1.
SampEn-X SampEn-Y
Experimental Block Control Constant Random Increase Control Constant Random Increase
1 0.0579 (0.02) 0.0647 (0.03) 0.0627 (0.02) 0.0517 (0.01) 0.0641 (0.01) 0.0620 (0.02) 2 0.0664 (0.02) 0.0684 (0.02) 0.0614 (0.03) 0.0507 (0.01) 0.0557 (0.01) 0.0630 (0.02) 3 0.0650 (0.02) 0.0600 (0.02) 0.0659 (0.02) 0.0546 (0.01) 0.0570 (0.02) 0.0544 (0.02) 4 0.0610 (0.02) 0.0607 (0.02) 0.0665 (0.03) 0.0598 (0.01) 0.0566 (0.01) 0.0522 (0.02) 5 0.0638 (0.02) 0.0708 (0.02) 0.0740 (0.02) 0.0548 (0.01) 0.0609 (0.01) 0.0541 (0.02) 6 0.0695 (0.02) 0.0734 (0.02) 0.0738 (0.03) 0.0573 (0.01) 0.0589 (0.01) 0.0567 (0.03)

72
Figure 31. Means and standard errors of the interaction of block and condition on SampEn-X and SampEn-Y for the experimental blocks in Experiment 1.
5.4.2. Postural Sway Analysis for Pre-/ Post-test Block in Experiment 1
The F-Test results from the hierarchical linear modeling for SampEn-X and SampEn-Y
as the outcome can be seen in Table 11.

73
Table 11. F-tests for SampEn-X and –Y for the pre- and post-test blocks in experiment 1.
ΔR2 Outcome Variable Model F-Test P-value L1 L2 Cross-Level Interaction
SampEn-X Block 39.64 0 .0342 -- -- Condition 0.46 0.636 -- -- -- Block*Condition 1.257 0.285 -- -- --
SampEn-Y Block <0.001 0.99 -- -- -- Condition 0.61 0.55 -- -- -- Block*Condition 58.446 <0.001 -- -- .1065
SampEn-X had a significant main effect of block. SampEn-X reduced from the pre-test
(M = 0.068, SD = 0.02) to the post-test (M = 0.063, SD = 0.02). This indicates that there was less
mediolateral sway in the post-test and accounted for 3.42% explained variance. SampEn-Y did
not have a significant main effect of block, having the same mean and standard deviation for
both pre- and post-test (M = 0.063, SD =0.02).
The two-way interaction was only significant for SampEn-Y outcome variable and
accounted for 10.65% in explained variance. There was a significant simple effects of block in
only the control and random increase conditions. The means and standard deviations can be
found in Table 12. The control condition significantly increased from pre- to post-test, while the
random increase condition significantly decreased from pre- to post-test (see Figure 32). In
essence, the posterior-anterior sway increased from pre- to post-test for the control condition and
decreased for the random increase condition. This finding is noteworthy, as the opposite effect
was hypothesized.
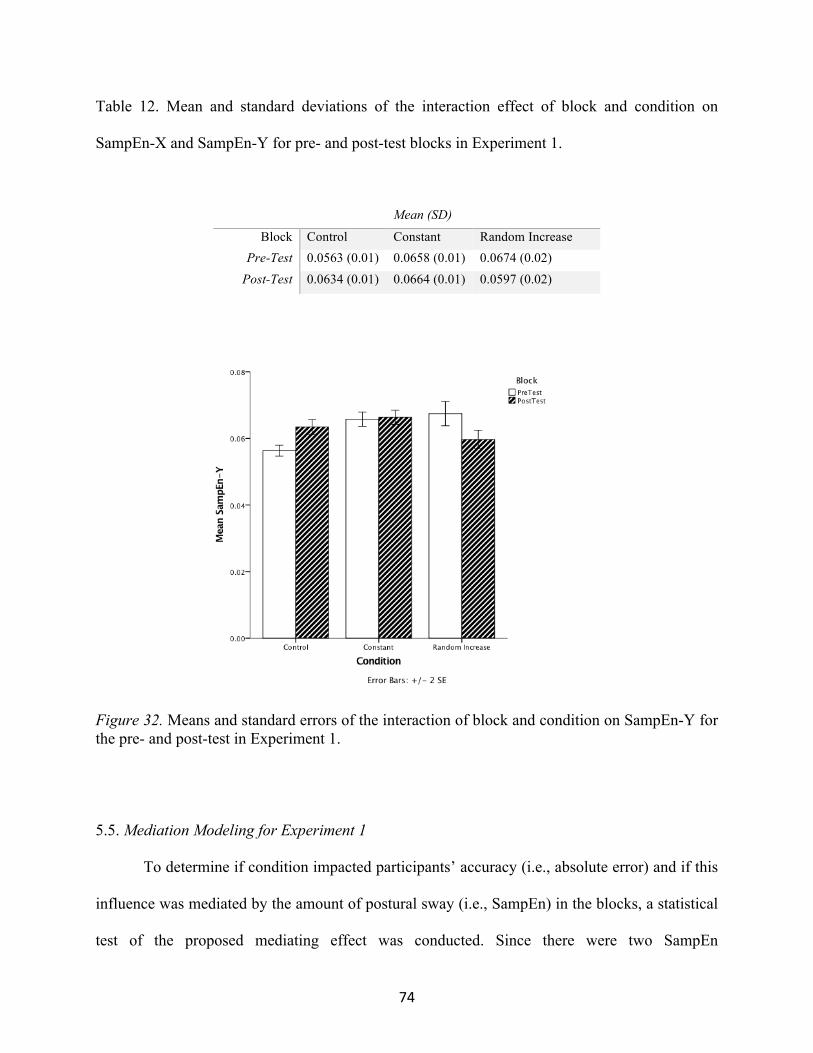
74
Table 12. Mean and standard deviations of the interaction effect of block and condition on
SampEn-X and SampEn-Y for pre- and post-test blocks in Experiment 1.
Mean (SD)
Block Control Constant Random Increase Pre-Test 0.0563 (0.01) 0.0658 (0.01) 0.0674 (0.02)
Post-Test 0.0634 (0.01) 0.0664 (0.01) 0.0597 (0.02)
Figure 32. Means and standard errors of the interaction of block and condition on SampEn-Y for the pre- and post-test in Experiment 1.
5.5. Mediation Modeling for Experiment 1
To determine if condition impacted participants’ accuracy (i.e., absolute error) and if this
influence was mediated by the amount of postural sway (i.e., SampEn) in the blocks, a statistical
test of the proposed mediating effect was conducted. Since there were two SampEn

75
measurements, one measuring the mediolateral sway (SampEn-X) and one measuring the
posterior-anterior sway (SampEn-Y), this mediation model has two mediators (see Figure 33).
Both the constant condition and the random increase condition were compared individually with
the control condition. The mediated effect was then modeled with block as a moderating effect.
Both the full model and moderated mediations by block for experimental blocks results can be
seen in Table 13 and for pre-/post-test blocks can be seen in Table 14 (refer to Figure 33 for
pathway locations).
The pathways within the mediation model are regressions with the point of the arrow
indicating the prediction direction. Therefore, these simple effects of block were already
analyzed in the MLM analyses above. This model is to determine if there are significant indirect
effects with SampEn mediating the effects of condition on absolute error.
The first initial model was all the data regardless of block. This mediation model was a 2-
1-1 (i.e., condition-L2, SampEn-X/Y-L1, and absolute error-L1). Then to determine if block
moderated this mediation, the model was split by block and reanalyzed as a 2-2-1 model
(condition and SampEn-X/ -Y are level 2 variables while absolute error remains at a
measurement level 1).
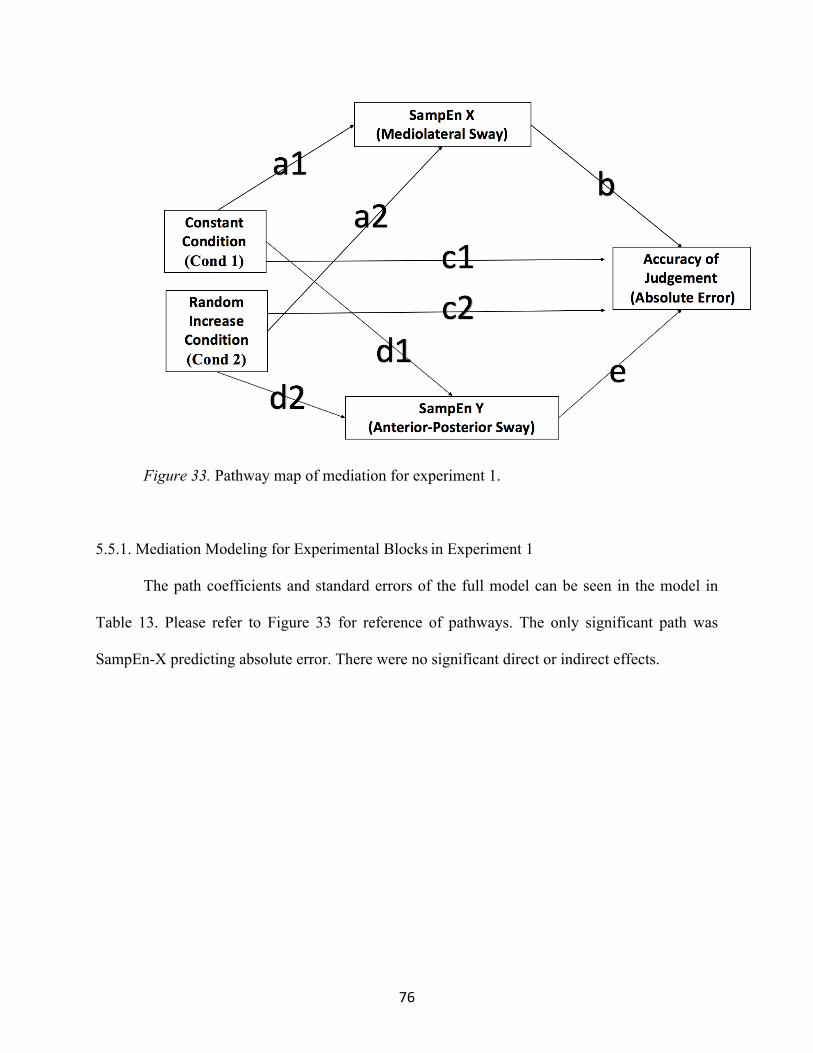
76
Figure 33. Pathway map of mediation for experiment 1.
5.5.1. Mediation Modeling for Experimental Blocks in Experiment 1
The path coefficients and standard errors of the full model can be seen in the model in
Table 13. Please refer to Figure 33 for reference of pathways. The only significant path was
SampEn-X predicting absolute error. There were no significant direct or indirect effects.

77
Table 13. Coefficient estimates and standard errors for the different experimental models for the
various paths, indirect effects and direct effects for the experimental blocks in experiment 1.
Estimate (SE) Pathways Indirect Effects Direct Effects SampEn-X SampEn-Y a1 a2 b c1 c2 d1 d2 e Cond 1a
(a1*b) Cond 2b
(a2*b) Cond 1a
(d1*e) Cond 2b
(d1*e) Cond 1a
(c1) Cond 2b
(c2) F u l l M o d e l
0.002 (0.01)
0.003 (0.01)
<0.001 (0.002)**
0.24 (0.21)
0.25 (0.14)
0.004 (0.003)
0.002 (0.01)
<0.001 (0.001)
-0.02 (0.05)
-0.03 (0.05)
0.003 (0.01)
0.002 (0.01)
0.24 (0.21)
0.25 (0.14)
Blo
ck
1 0.01 (0.01)
0.01 (0.01)
-7.32 (6.12)
0.31 (0.3)
0.45 (0.35)
1.24 (0.47)
1.04 (0.58)
0.02 (0.09)
-0.05 (0.07)
-0.04 (0.07)
0.03 (0.10)
0.03 (0.09)
0.31 (0.3)
0.45 (0.35)
2 0.002 (0.01)
-0.005 (0.01)
-0.83 (7.07)
0.46 (0.32)
0.14 (0.26)
0.50 (0.45)
1.23 (0.64)
-0.06 (0.07)
-0.002 (0.01)
0.004 (0.04)
-0.03 (0.04)
-0.07 (0.08)
0.46 (0.32)
0.14 (0.26)
3 -0.005 (0.01)
0.001 (0.01)
3.05 (7.56)
0.32 (0.30)
0.34 (0.19)
0.24 (0.46)
-0.02 (0.68)
0.03 (0.06)
-0.02 (0.04)
0.003 (0.03)
0.01 (0.02)
-0.001 (0.02)
0.32 (0.30)
0.34 (0.19)
4 <0.001 (0.01)
0.01 (0.01)
-10.50 (4.36)*
0.15 (0.25)
0.49 (0.21)*
-0.32 (0.48)
-0.76 (0.68)
0.11 (0.06)
0.003 (0.08)
-0.06 (0.09)
-0.03 (0.05)
-0.08 (0.09)
0.15 (0.25)
0.49 (0.21) *
5 0.002 (0.01)
-0.01 (0.01)
-0.83 (7.07)
0.46 (0.32)
0.14 (0.26)
0.50 (0.45)
1.23 (0.64)
-0.06 (0.07)
-0.002 (0.01)
0.004 (0.04)
-0.03 (0.04)
-0.07 (0.08)
0.46 (0.32)
0.14 (0.26)
6 0.004 (0.01)
0.004 (0.01)
-1.78 (4.67)
0.30 (0.24)
0.51 (0.20)*
0.16 (0.35)
-0.06 (0.76)
0.03 (0.06)
-0.01 (0.02)
-0.01 (0.02)
0.01 (0.01)
-0.002 (0.03)
0.30 (0.24)
0.51 (0.20)*
*p<0.05, **p<0.01, ***p<0.001, a= Comparison of control and constant conditions, b= comparison of random increase and control group.
For the moderated mediation model, pathway coefficients, standard errors, and p-values
for the different pathways can be found in Table 13 by block. In block 4 there was a significant
direct effect which was the c2 path indicating that there was a significant difference between the
control and random increasing condition when estimating absolute error. This model also had a
significant pathway of SampEn estimating absolute error. Block 6 also had a significant direct
effect which was the c2 path. This indicates a significant difference between the random
increasing condition and the control. There were no significant indirect pathways in any blocks.
5.5.2. Mediation Modeling for Pre-/ Post-test Blocks in Experiment 1
The path coefficients and standard errors of the full model can be seen in the model in
Table 14. Please refer to Figure 33 for reference of pathways. There were no significant
pathways, direct or indirect effects in the full model.

78
Table 14. Coefficient estimates and standard errors for the different experimental models for the
various paths, indirect effects and direct effects for the pre- and post-test blocks of Experiment 1.
Estimate (SE) Pathways Indirect Effects Direct Effects SampEn-X SampEn-Y a1 a2 b c1 c2 d1 d2 e Cond 1a
(a1*b) Cond 2b
(a2*b) Cond 1a
(d1*e) Cond 2b
(d1*e) Cond 1a
(c1) Cond 2b
(c2) F u l l M o d e l
-0.01 (0.01)
-0.01 0.01)
-3.48 (12.73)
0.04 (0.34)
0.62 (0.48)
0.01 (0.004)
0.003 (0.01)
-3.80 (14.10)
0.02 (0.07)
0.02 (0.08)
-0.01 (0.05)
-0.02 (0.08)
0.04 (0.34)
0.62 (0.47)
Blo
ck Pre-
Test 0.01
(0.01)* 0.01
(0.01) -11.75 (6.01)
-0.02 (0.22)
-0.02 (0.25)
0.01 (0.01)*
0.01 (0.01)
3.744 (4.65)
0.01 (0.07)
0.02 (0.08)
0.04 (0.05)
0.04 (0.05)
-0.02 (0.22)
-0.02 (0.25)
Post-Test
-0.003 (0.01)
-0.006 (0.01)
14.86 (12.74)
-0.16 (0.53)
0.75 (0.61)
0.01 (0.01)*
0.01 (0.01)
-29.161 (15.15)
-0.16 (0.53)
-0.05 (0.13)
-0.28 (0.19)
-0.33 (0.24)
-0.16 (0.53)
0.75 (0.61)
*p<0.05, **p<0.01, ***p<0.001, a= Comparison of control and constant conditions, b= comparison of random increase and control group.
For the moderated mediation model, pathway coefficients, standard errors, and p-values
for the different pathways can be found in Table 14 by block. In the pre-test block there were
two significant pathways of condition 1 predicting both postural sway indices (SampEn-X and
SampEn-Y). Condition 1 is the comparison of the control and constant conditions. This indicates
that there were differences between the control and constant conditions predicting both SampEn-
X and –Y. In the post-test block, there was only a significant path of condition 1 on SampEn-Y.
indicating a difference between control and constant conditions. There were not significant
indirect or direct pathways.
6. Discussion
In general participants calibrated target estimations across the blocks of experimental trials
and from the pre- to the post-test. This indicates that regardless of condition, there was a level of
calibration that occurred. This finding supports previous research that task-relevant feedback can
overcome systemic distortions or perturbations. On average, participants tended to have higher
under-rotation estimations than over-rotation estimation indicating that their errors were greater
79
if they did not rotate far enough to the target. These under-rotation estimations reduced across
the experimental blocks and trials within blocks indicating a high level of calibration effect from
them. Target location and action requirement also affected the estimates. Across block trials,
under-rotation estimates decreased as participants calibrated to open body targets while over-
rotation calibrated more for cross-body targets.
The current study had four primary hypotheses: (1) more unstable environments will take
longer to calibrate, (2) that the random increase condition will have the highest amount of target
estimation error and (3) the highest postural sway, and (4) that postural sway will mediate the
relationship between the conditions and estimation error. While all of these hypotheses can be
analyzed with the primary variables of interest, there were concerns of the effect of secondary
variables such as simulator sickness and head movement during trials. These variables were
analyzed in secondary models while keeping the primary variables in the models as constants.
The first hypothesis of this study was that more unstable environments will take longer to
calibrate. This hypothesis can be found in the experimental blocks with any interaction in which
block and condition interact. The four-way interaction between condition, block, block trial, and
action requirement demonstrated this hypothesized effect. There were two significant blocks
within the four-way interaction in which there was a significant simple slope effects for block
trial for cross-body targets in which different effects can be seen in the conditions. The first
block was Block 2 (see Figure 14). This block is the first block in which the constant condition
and random increase condition have the first level of perturbation added into the virtual
environment. In this block, both the control and the constant condition have negative slopes,
indicating calibration within the block. The constant condition has the steepest slope indicating a
faster rate of calibration than the constant condition. The random increase condition has a non-
80
significant positive slope. A non-significant slope indicates a lack of calibration. This could
either be caused due to an inability to calibrate or already being at a pre-perturbed level. The
amount of variability seen in the random increase block, indicates an inability to calibrate.
The other block that was significant was block 6 where the constant and control conditions
had non-significant slopes and the random increase group had a significant negative slope
indicating calibration occurring within the block (see Figure 15). Block 6 is the last experimental
block and is the highest amount of rotational gain for the random increase condition. What is
most interesting about this block is the relationship to that of block 2. In block 2, both the control
and constant conditions demonstrate calibration while in the 6th block they do not. This pattern
suggests that both of these conditions experienced calibration during the first block and
maintained calibration effects in later blocks. However, because the random increase block was
still experiencing changes in the 6th experimental block this required that they continue to
recalibrate. This provides support that the control condition rapidly calibrated while the constant
condition calibrated at a similar level if not slightly retarded than the control (see Figure 13). The
random increase condition was still calibrating in the last experimental block indicating a need to
recalibrate even in later blocks.
The second hypotheses can be found in the absolute error analyses with the variable of
condition. While this variable was not significant as a main effect in any of the analyses, the
effect of the condition can be seen in the carryover effects in the post-test block. As shown in
Figure 21b, the amount of absolute error increases as the complexity of the condition increases.
The control group has the least amount, the random increase the most error, and the constant
between the two groups.
81
This effect could also be seen in them more comprehensive analysis of the four-way cross-
level interaction between condition, block, action requirement and directionality in the pre-/ post-
test analysis (see Figure 26). The random increase condition had a significantly greater amount
of error when they under-rotated their estimate for open-body targets (M= 3.41, SD= 2.59) than
the control group (M=1.83, SD= 1.26) and constant (M=2.87, SD= 1.91). This finding supports
that calibration occurred for the control condition, similar to previous research. However, both
the constant and random increase conditions had larger amounts of error when under-rotating
their open-body estimates. This effect can be explained due to the interactions in the
experimental block where both these conditions did not have to rotate as far as the control
conditions causing their estimates to have greater error in the carryover effect of the post-test
block. The decrease pattern shown in the control condition is a typical pattern seen in calibration
studies (i.e., a reduction in error) while the increase in the constant condition is typical of the
perturbed conditions of past research where participants calibrate to the perturbed state and the
random-increase condition shows the most increase in absolute error between the three groups
demonstrating the most difficulty to calibrate. This finding is evidence supporting hypothesis 2.
For hypothesis 3, this interest variable were the two indices of postural sway: SampEn-X
measuring mediolateral sway and SampEn-Y measuring posterior-anterior sway. It was predicted
that there would be a greater postural sway amount in the random increase condition. Calibration
effects would be indicated by a decreasing of entropy across blocks. While there was a
significant effect of condition and block in the experimental blocks, there was not a clear pattern
to make a concrete explanation of the results (see Figure 31). Interestingly, the random increase
condition increased similar to their perturbation increases for the SampEn-X measurement. In
general, the random increase condition had the most variability between the blocks compared to
82
the other conditions. The constant condition variability of both postural sway indices diminished
across the blocks of trials to similar levels of the control condition indicating calibration of
postural sway. However, the random increase condition remained variable throughout the blocks.
Lastly, there were larger effect sizes of the interaction between block and condition for SampEn-
Y than SampEn-X indicating that this interaction affected the anterior-posterior sway more than
the mediolateral sway.
Within the pre-/ post-block analysis, this hypothesis predicted that the random increase
would have the highest perturbation levels. The interaction of block and condition was only
significant for the SampEn-Y outcome variable (anterior-posterior sway). The opposite of the
proposed effect was found (see Figure 32). The control condition increased in their sway path,
the constant condition was not significantly different, and the random increase path actually
significantly decreased the entropy from pre- to post-test.
Hypothesis 4 was the relationship between the condition and absolute error mediated through
postural sway. This analysis was essentially an assimilation of both the absolute error analysis
and the postural sway analysis into a singular integrated model to potentially explain a
relationship between the three variables. In the full model in both the experimental blocks and
the pre-/ post-test block analyses, there was not an indirect effect. To determine if block
moderated the mediation model, it was included as a moderator. Again, no indirect effects were
found. Therefore, hypothesis 4 does not have sufficient evidence to be supported from this
current study.
83
CHAPTER III.
EXPERIMENT TWO
One of the questions that Experiment 1 and previous research has failed to answer is whether
pattern predictability of changes in perturbation magnitude effect the recalibration rate. Most
predictability comes from a closed-loop system in which we perform an action or engage within
an environment. For example, as an actor is drinking a cup of coffee, the weight of that cup is
predictably decreasing. It may not be known how much that cup weighs or the exact change in
the weight of the cup due to the coffee being consumed but they can adjust their movement
patterns based off the interaction between them and the environment. This perturbation change
can be effectively normalized or made into a constant.
In the previous example, we are an active member of the change through the specific
manipulation of consuming the coffee and therefore knowing it is steadily decreasing in weight.
For another example, as one pedals a bike the changes in optic flow produced from the amount
of force placed on the pedals to rotate the wheels of the bike are coupled. As the bike gains
speed, we can shift to higher gears that allow for less rotation of pedals to maintain the specific
speed.
This type of change is very similar to the visual gain used in Experiment 1. Every time we
shift into a different gear, there is a predictability of the feedback. Likewise, in Bingham and
Romack (1999), their participants were explicitly aware of a change in perturbation because they
physically removed and the re-donned the same pair of prism goggles. This additional cue in
both of these examples could be an assistance of preparing the body for recalibration.
All of these examples are of either the actor facilitating the change or being provided a cue
that a change is about to occur. However, there are other times where we are simply subject to

84
the changes occurring in the actor-environment relationship (i.e., we do not have an active role in
the change itself). For example, many aspects within the body change without direct cognitive
input from the actor themselves. Additionally, technology can have changes that occur variably
(e.g., cursor movement of a mouse getting gradually slower and catching up due to technological
glitches).
As previous discussed, VE allows for cues that could provide a cognitive preparation to be
eliminated. There is no need to take off and put on other prism goggles in order to alert the
participant to a change in the actor-environment system. These cues are not always available in
everyday examples of rapid changes. For example, those with nervous system or musculoskeletal
disorders which can create rapid changes in the action abilities of the body as well as the
movement accuracy, there are not necessarily cues as to when these changes will shift and occur.
However, they may have certain predictable traits to them such as severity of deficit changes,
etc. While these individuals most likely are aware of their illnesses, they are in a sense passive
participants to the changes and not active members of the change.
Bingham and Romack (1999) found that participants recalibrated a faster rate when they
consecutively interacted with the two levels of perturbation (displacement using the goggles or
regular vision). However, was the recalibration rate effect due to the visual cue that provided
knowledge of the nature of the perturbation change between the blocks of trials? Would this
recalibration rate increase still occur without this other visual cue?
In this experiment, the effect of predictability of the perturbation gain on rate of recalibration
will be examined. Predictability in the contexts of this study is defined as the pattern of change to
the perturbation gain and not the knowledge that there will be a change. Participants will not be
informed of the nature of the changes (similar to Experiment 1). Both groups will experience the

85
same level of perturbation change (increase of 0.5 gain per block increase). However, the
oscillating condition will be following a similar pattern of the Bingham and Romack (1999)
experiment which will fluctuate between having the 0.5x perturbation change and no
perturbation change (see Figure 34). The second group is a hybrid of group 3 in Experiment 1
and the Bingham and Romack (1999) group. In this group the gain will gradually increase by 0.5
each block (see Figure 34).
Figure 34. Visual Rotational Gain Profiles for Experiment 2. Both conditions in Experiment 2 have the same amount of perturbation change between blocks of experimental trials. The oscillation condition will be the fluctuate between having an additional gain and not. The constant gain condition will steadily increase perturbation amounts across blocks of trials.
Specifically, this experiment will answer whether the predictability of the pattern of change
in the environment can affect the rate of recalibration. While both groups do have an element of
predictability, the oscillation group is returning to previously experienced states where as the

86
constant gain increase group will never be within the same perturbation level. Essentially, will
each successive recalibration occur more rapidly, similar to the findings of Bingham and
Romack (1999) or will the lack of visual cue creating an expectation of a cue cause similar
findings to the other unstable environments (Experiment 1, group 3; Experiment 2 Group 2)?
1. Hypotheses
The current study has three primary hypotheses. (1) It is hypothesized that the rate of
recalibration across consecutive trials will be faster in the oscillating condition than in the
constant gain increase condition. (2) However, this recalibration rate will be slower than that of
the constant condition in experiment 1. (3) Lastly, it is again hypothesized that postural sway
(e.g., entropy) will mediate the relationship between the type of perturbation condition (i.e., type
of environment) and target estimation errors (see Figure 2).
2. Methods
2.1. Participants
Thirty-one participants were recruited using the Clemson participant pool and were given
course credit for their participation in the study. These were added to the control condition group
(study demographics: 22 males and 23 females; age range 18-22 Mean=18.98). Participants were
allowed to stop the experiment at any time. Participants’ data that did not complete the entire
experiment, had equipment or experimenter error, or did not participate in the study correctly
(i.e., did not follow instructions) were not included in the analyses. Two participants withdrew
from the experiment due to simulator sickness (both in the constant-increase condition), and one
was removed due to failure to follow instructions. Additional participants were run in order to
87
have the total 28 right-handed participants required for the study with complete data.
Additionally, the data from the control group of Experiment 1 will be utilized as a reference
group in the experiment.
2.2. Materials & Apparatus
The materials and apparatus used in this experiment were the same as Experiment 1. The
only change in this experiment is to the perturbation gain levels. The gain changes can be seen in
Figure 34.
3. Procedure
The procedure for this experiment is the same as Experiment 1.
4. Data Preprocessing
The data preprocessing for this experiment is the same as Experiment 1.
5. Results
To examine the effects of the two analyses in this experiment, the control condition from
experiment 1 will be used as a reference condition. (1) It is hypothesized that the rate of
recalibration across consecutive trials will be faster in the oscillating condition than in the
constant gain increase condition. (2) However, this recalibration rate will be slower than that of
the control condition in experiment 1. (3) Lastly, it is again hypothesized that postural sway (e.g.,
entropy) will mediate the relationship between the type of perturbation condition (i.e., type of
environment) and target estimation errors (see Figure 2).

88
Evidence for the first and second hypothesis examining recalibration rate can be studied
at the block level or within blocks at the trial level. Therefore, any significant findings in the
experimental block analysis of absolute error with any interactions containing both block or trials
within block and condition can be examined for these hypotheses. For both hypotheses, the
dependent variables of absolute error and postural sway will be analyzed. Additionally, any
carry-over effects in the post-test will allow for discussion of the total effect of the experimental
gains in the experimental blocks.
Lastly, similar to the first experiment, the mediation model is utilized to integrate the
other analyses into a relational model between condition and absolute error with postural sway as
a mediator. Block was then included as a moderator to determine recalibration effects in the
experimental blocks and carry-over effects in the pre-/ post-test blocks.
Again, in order to address the rich complexity of the data, comprehensive analyses were
conducted. Lower-order main effects and interactions described above to answer the hypotheses
can be dependent on other variables. Therefore, higher-order interactions were included for full
factorial models to examine other moderating factors. Similar to experiment 1, all significant
effects are discussed, however, main effects and lower-order interactions are the average of
higher-order interaction variables and should be examined as such. In essence, significant higher-
order interactions demonstrate moderating factors of lower order main effects and interactions.
Descriptive statistics for collected variables can be found in Appendix J for the experimental
blocks and Appendix K for the pre-/post-test blocks for Experiment 2.
5.1. Outlier Analysis

89
For each analysis, full models (i.e., a model with all predictors and interactions that will be
analyzed) were conducted to determine any outliers. From these models residuals were obtained,
standardized, and examined for any potential outliers and extreme cases that are outside of the
normal distribution (Cohen et. al, 2003). Generally, it has been found that these points are due to
malfunctioning in the tracking equipment based or on participant error (e.g., marking an
estimation prematurely). All analyses found less than 1% of the trials removed due to outlier
analysis.
5.2. Hierarchical Linear Modeling
Variables have considerable nesting within participants due to the repeated-measures design
used in this research. In order to address the nesting of trials within participants, multilevel
modeling (hierarchical linear modeling, HLM) was used to analyze both accuracy and entropy
as dependent variables. For a full discussion on HLM, please see Chapter II section 5.2.
5.3. Accuracy: Absolute Error
The specification for the models are the same as experiment 1 (see Chapter II section 5.3).
5.3.1. Experimental Blocks Analyses for Absolute Error in Experiment 2
5.3.1.1. Absolute Error Primary Analysis for Experimental Block in Experiment 2
The F-Test results from the hierarchical linear modeling for accuracy as the outcome can be
seen in Table 15. Continuous variables also have the coefficient estimate of the slope and
standard error. For a comprehensive table of all predictors’ coefficients is located in Appendix L.

90
Table 15. Fixed Coefficients, Standard Errors and R2∆ for Absolute Error for the primary
variables in the experimental block of Experiment 2.
Fixed Effects
Predictor Coefficient
(SE) F-Test P-value
ΔR2
L1 L2
Cross-Level
Interaction Intercept 1.63 (0.13)
-- -- -- -- --
Block -- 3.33 0.005 .0175 -- -- Btrial -0.02 (0.01) 6.67 0.012 .0037 -- -- Loc -- 1.64 0.201 -- -- -- AR -- 15.62 <0.001 .0138 -- -- Dir -- 13.89 0.001 .0137 -- -- Cond -- 0.11 0.894 -- -- -- Block * Btrial -- 2.35 0.038 .0014 -- -- Block * Loc -- 1.41 0.218 -- -- -- Block * AR -- 1.04 0.393 -- -- -- Block * Dir -- 2.49 0.03 .0022 -- -- Loc * Btrial -- 2.29 0.13 -- -- -- Dir * Btrial -- 0.41 0.523 -- -- -- Loc * AR -- 3.17 0.075 -- -- -- Dir * AR -- 0.02 0.897 -- -- -- Loc * Dir -- 6.01 0.014 .0016 -- -- Block * Cond -- 1.17 0.304 -- -- -- Cond * Btrial -- 0.00 0.996 -- -- -- Cond * Loc -- 0.83 0.438 -- -- -- Cond * AR -- 0.77 0.47 -- -- -- Cond * Dir -- 1.47 0.243 -- -- -- Block * Loc * Btrial -- 0.74 0.592 -- -- -- Block * AR * Btrial -- 2.09 0.064 -- -- -- Block * Dir * Btrial -- 2.29 0.044 .0024 -- -- Block * Loc * AR -- 0.48 0.794 -- -- -- Block * Loc * Dir -- 1.79 0.112 -- -- -- Block * Dir * AR -- 0.50 0.78 -- -- -- Loc * AR * Btrial -- 1.49 0.222 -- -- -- Loc * Dir * Btrial -- 5.72 0.017 .0014 -- -- Dir * AR * Btrial -- 8.24 0.004 .0012 -- -- Loc * Dir * AR -- 0.07 0.797 -- -- -- Loc * AR * Btrial -- 1.55 0.213 -- -- -- Block * Cond * Btrial -- 0.93 0.505 -- -- -- Block * Cond * Loc -- 1.35 0.198 -- -- -- Block * Cond * AR -- 0.98 0.46 -- -- -- Block * Cond * Dir -- 1.07 0.385 -- -- -- Cond * Loc * Btrial -- 0.03 0.969 -- -- -- Cond * AR * Btrial -- 0.71 0.494 -- -- -- Cond * Dir * Btrial -- 2.32 0.073 -- -- -- Cond * Loc * Dir -- 0.50 0.609 -- -- -- Cond * Loc * AR -- 1.05 0.351 -- -- -- Cond * Dir * AR -- 0.02 0.979 -- -- --

91
There were four significant main effects: block, block trial, action requirement, and
directionality. The means and standard deviations for block can be found in Table 16 and the
LSD post hoc tests comparing the other means are in Appendix M. As visually shown in Figure
35, absolute error decreased in general as the participants went through the experimental blocks.
Only the last three blocks (4, 5, and 6) were significantly different from block 1. The effect
accounted for a total of 1.75 % of explained variance. As the participants went through the
experimental phase, their error decreases indicating recalibration regardless of condition.
Block * Loc * Dir * AR -- 0.62 0.684 -- -- -- Loc * Dir * AR * Btrial -- 0.95 0.33 -- -- -- Block * Loc * AR * Btrial -- 0.68 0.638 -- -- -- Block * Loc * Dir * Btrial -- 0.59 0.706 -- -- -- Block * Dir * AR * Btrial -- 0.40 0.851 -- -- -- Block * Cond * Loc * Btrial -- 1.16 0.315 -- -- -- Block * Cond * AR * Btrial -- 1.69 0.077 -- -- -- Block * Cond * Dir * Btrial -- 1.58 0.107 -- -- -- Block * Cond * Loc * AR -- 0.67 0.751 -- -- -- Block * Cond * Loc * Dir -- 1.78 0.058 -- -- -- Block * Cond * Dir * AR -- 1.34 0.204 -- -- -- Cond * Loc * AR * Btrial -- 0.01 0.995 -- -- -- Cond * Loc * Dir * Btrial -- 0.87 0.419 -- -- -- Cond * Dir * AR * Btrial -- 2.36 0.094 -- -- -- Cond * Loc * Dir * AR -- 3.23 0.04 -- -- .0020 Block * Loc * Dir * AR * Btrial -- 0.72 0.608 -- -- -- Block * Cond * Loc * Dir * AR -- 0.40 0.947 -- -- -- Cond * Loc * Dir * AR * Btrial -- 0.27 0.762 -- -- -- Block * Cond * Loc * AR * Btrial
-- 0.22 0.994
-- -- --
Block * Cond * Loc * Dir * Btrial
-- 0.98 0.457
-- -- --
Block * Cond * Dir * AR * Btrial
-- 1.17 0.307
-- -- --
Block * Cond * Loc * Dir * AR * Btrial
-- 0.50 0.889
-- -- --
TotalΔR2 .0589 -- .0020

92
Table 16. Means and standard deviations for the main effect of block predicting absolute error in
the experimental blocks of experiment 2. blocks 4-6 are significantly different from block 1.
Experimental Block Mean SD
1 1.87 1.54 2 1.76 1.45 3 1.75 1.48 4 1.62** 1.26 5 1.65** 1.24 6 1.59** 1.31
*p<0.05, **p<0.01, ***p<0.001
Figure 35. The main effect of block on absolute error (degrees) in the experimental blocks of Experiment 2. Block 1 was used as the reference group with blocks 4-6 being significantly different. As the participants went through the experimental phase, their error decreases indicating recalibration regardless of condition.

93
Block trial also had a significant effect predicting absolute error and explained 0.37% of
explained variance. Figure 36 depicts the relationship between block trial and absolute error. As
block trials increased, absolute error decreases by 0.02 on average per trial. This effect provides
evidence of calibration occurring within blocks.
Figure 36. Main effect of block trial on absolute error in the experimental blocks of experiment
2. Note that the first trial in a block is considered trial 0 in the analysis and graph.
Action requirement also significantly predicted absolute error and explained 1.38% of the
variance. In general, cross-body actions produced larger error amounts (M = 1.88 degrees, SD =
1.48), than open-body actions (M = 1.54 degrees, SD = 1.26). See Figure 37 for a visualization
of this effect.

94
Figure 37. Graph of main effect of action requirement on absolute error (degrees) in the experimental blocks of Experiment 2.
The directionality main effect showed that the amount of error depended on the direction of
the estimation. Estimations that were under rotated had more error (M = 1.84, SD = 1.42) than
over-rotation estimations (M = 1.50, SD = 1.31; see Figure 38). The effect account for a total of
1.37 % of explained variance.

95
Figure 38. Graph of main effect of directionality on absolute error (degrees) in the experimental block of Experiment 2. Amount of error depends on the direction of the rotation.
There were three Level 1 moderating Level 1 interactions that were significant: block
moderating the effect of block trial on absolute error, directionality moderating the effect of
block on absolute error, and directionality moderating the effect of target location on absolute
error. To tease apart the interactions simple effects were analyzed.
For the interaction of block and block trial, the simple slopes of block trial were examined
for each block, only blocks 1 and 2 had significant slopes. Figure 39 depicts the the effect of
block trial moderated by block on absolute error. Both block 1 and 2 show significant negative
slopes indicating calibration within both of these blocks. Absolute error reduced by 0.07 degrees
per trial increase in block 1 and reduced by 0.05 degrees per trial increase in block 2. This is a
noteworthy effect as it demonstrates that calibration is occurring within blocks but that it is only
significantly occurring during the first two blocks but not the rest of the experimental blocks.

96
Because there is not a significant interaction between block, block trial, and condition, this effect
can be explained as recalibration occurring in the first blocks and the participants not calibrating
any further in the later blocks.
Figure 39. The effect of block trial on absolute error moderated by block in the experimental blocks of Experiment 2. Only block 1 and 2 have significant slopes. Note that the first trial in a block is considered trial 0 in the analysis and graph.
For the interaction of directionality and block, only under-rotation estimations were
significantly different in absolute error across the blocks (see Figure 40 and Table 17). In
general, a pattern of decrease in absolute error can be seen across the blocks. All blocks were
significantly different from block 1. This effect demonstrates that across the blocks, the amount

97
of error during over estimations did not significantly change whereas there was a significant
reduction in error when participants under-rotated in blocks 2-6 compared to block 1. The effect
account for a total of 0.22 % of explained variance.
Table 17. Absolute Error means and standard deviations for block by directionality interaction
for experimental blocks in experiment 2. Only under-rotation means were significantly different.
Directionality Experimental Block Mean SD
Under Rotation***
Block1 2.16 1.62
Block2* 1.85 1.41
Block3* 1.90 1.49
Block4*** 1.77 1.39
Block5*** 1.74 1.20
Block6** 1.63 1.32
Over Rotation
Block1 1.48 1.32
Block2 1.62 1.50
Block3 1.50 1.41
Block4* 1.38 1.01
Block5 1.48 1.31
Block6 1.53 1.30
*p<0.05, **p<0.01, ***p<0.001

98
Figure 40. Interaction of block by directionality estimating absolute error in the experimental blocks of experiment 2. The simple effect of block estimating absolute error is only significant when participants are under-rotating.
For the interaction of location and estimate directionality, only over-rotation was
significantly different in absolute error between frontal and peripheral location. The means and
standard deviations of the interaction can be found in Table 18 with a visualization in Figure 41.
For the peripheral targets (targets 1 and 4) participants had larger amounts of error (i.e., they
over-rotated more than when they estimated peripheral targets. The effect account for a total of
0.16 % of explained variance.

99
Table 18. Absolute Error means and standard deviations for location by directionality interaction
for the experimental blocks of experiment 2. Only over-rotation means were significantly
different.
Directionality Location
Frontal Peripheral Mean SD Mean SD
Under Rotation 1.85 1.38 1.84 1.45 Over Rotation*** 1.39 1.21 1.60 1.40
*p<0.05, **p<0.01, ***p<0.001
Figure 41. Effect of the directionality of the estimate on the absolute error mediated by the location of the target in experimental blocks in Experiment 2. Only over rotation is significantly different between the locations.
There were three significant three-way L1 interactions: block by block trial by
directionality, location by block trial by directionality, and action requirement by block trial by
directionality. In essence, these can be thought of as a two-way interaction being moderated by
100
block, location, and action requirement. All of these need to be decomposed into the simple
slopes of block trial.
For the first three-way interaction of block by block trial by directionality, the two-way
interaction between block trial and directionality was investigated between blocks. Blocks 1-4
had the significant two-way interactions but not block 5 or 6. When the simple slopes for block
trial was examined within the significant blocks, there were only two significant simple slope:
block 1 for over estimations, and block 2 for over estimations (see Figure 42). As trial number
increased by one the absolute values decreased by 0.11 degrees in block 1 and 0.03 degrees in
block 2 for over-rotation estimates. This pattern and the subsequent non-significant slopes across
blocks demonstrates calibration occurring in the first two blocks but not calibration occurring in
the later blocks. This effect accounted for 0.24% of the explained variance in the model.

101
Figure 42. The effect of block trial and directionality on absolute error moderated by block in the experimental blocks of Experiment 2. Only block 1 and 2 have significant slopes for over rotation estimations. Note that the first trial in a block is considered trial 0 in the analysis and graph.
For the second three-way interaction, the simple slopes of block trials were significant for
peripheral targets that had over-rotation estimations. In Figure 43, for peripheral targets that had
over-rotated estimates decreased by 0.06 degrees in absolute error with each increase of trial
within a block. This means that for peripheral targets, participants’ over-rotated less as the trials
increased within a block. Again, this negative slope indicates calibration occurring in this
combination. However, the other simple slopes were not significantly different from zero. Most

102
likely this effect is due to the gain impact of the peripheral targets compared to frontal targets.
Essentially, greater visual gain amounts affect the total head rotation of the peripheral targets
more than the frontal targets. This effect account for 0.14% of the explained variance.
Figure 43. The three-way interaction of location by directionality by block trial in the experimental blocks of experiment 2. The significance of the effect was found for peripheral targets moderated by the directionality of the estimate. Note that the first trial in a block is considered trial 0 in the analysis and graph.
The last significant three-way L1 interaction was between direction, block trial, and
action requirement which accounted for 0.12% of the explained variance. The simple effect of
this three way was found for open-body targets that had under-rotation estimates. Figure 44

103
shows that for targets requiring an open-body action, calibration occurred for under-rotations
estimations. In essence, the amount of absolute error in under-rotated estimates decreased by
0.05 per trial increase for open-body targets.
Figure 44. The three-way interaction of action requirements by directionality by block trial in the experimental blocks of experiment 2. The significance of the effect was found for open-body actions (i.e., targets 3 and 4) moderated by the directionality of the estimate. Note that the first trial in a block is considered trial 0 in the analysis and graph.
Lastly, there was one significant cross-level four-way interaction between condition,
estimate directionality, target location, and action requirement. To investigate the three-way
interaction of condition, estimate directionality, and action requirement were analyzed by
104
location. Only frontal targets had a significant three-way interaction. Next, the two-way
interaction of condition and estimate directionality were analyzed within frontal targets by action
requirements. Only the cross-body actions had a significant two-way interaction of condition and
direction. Lastly, the main effects of directionality were examined for target 3 (the frontal cross-
body target). The only condition that had a significant main effect of directionality was the
constant increase condition. This interaction can be seen in Figure 45. Participants in the
constant increase condition had larger estimation errors when they under-rotated (M = 2.16, SD
= 1.61) for frontal cross-body targets (i.e., target 3) than when they over-rotated their estimates
(M = 1.34, SD = 1.20). This interaction explained 0.20 % of the variance. All LSD pairwise
comparisons can be found in Appendix N.

105
Figure 45. Significant four-way interaction of directionality, condition, location, and action requirement for the experimental blocks in experiment 2. The decomposition of the interaction found the significant was in the first experimental block, in the constant condition, for the peripheral targets.
5.3.1.2. Absolute Error Secondary Analysis for Experimental Block in Experiment 2
In this model, secondary variables and specific interactions were included in the model in
order to determine their effects on absolute error while controlling for the primary variables.
Level 1 secondary variables include: total head rotation, max head rotation, rotational difference

106
(difference between head rotation and arm rotation), SSQ. Level 2 secondary variables are the
MSAQ-Pre and the MSAQ-Post. Due to the high correlation between max head rotation and total
head rotation, these two variables were analyzed in their perspective models without the
inclusion of the other. This was to guard against any suppression that may occur with both
variables in the model simultaneously. Since primary models and interactions have been
discussed previous, only the significant new effects will be discussed. The F-Test results from
the hierarchical linear modeling for accuracy as the outcome including secondary variables can
be seen in Table 19. Also coefficients and standard errors are only reported for continuous
variables in the table. For a full table of the coefficients and standard errors please refer to
Appendix O.

107
Table 19. Fixed Coefficients, Standard Errors and R2∆ for Absolute Error for the Secondary Variables for the experimental blocks of experiment 2.
There were no significant main effects of the secondary variables. There was one
significant level 1 interaction between block and SSQ scores. As shown in Figure 46, the slope
of SSQ estimating absolute error depends on the block. In blocks 1-5 had positive slopes while
block 6 had a negative slope. None of the simple slopes were significantly different from zero.
Fixed Effects
Predictor Coefficient (SE) F-Test P-value
ΔR2
L1 L2 Cross-Level Interaction
Intercept 1.73 (0.16)
-- -- -- -- --
Block 2.02 0.07 -- -- -- Block trial -0.2 (0.01) 8.39 0.01 .0043 -- -- Location (Loc) 1.56 0.21 -- -- -- Action Requirement 19.04 0.00 .0153 -- -- Shot Directionality 32.34 0.00 0118 -- -- Total Rotation 0.003 (0.002) 0.27 0.76 -- -- -- Max Rotation -0.006 (0.01) 0.00 0.99 -- -- -- Rotational Difference 0.003 (0.01) 0.94 0.33 -- -- -- SampEn-X -4.41 (1.84) 1.69 0.19 -- -- -- SampEn-Y 0.06 (2.84) 2.42 0.12 -- -- -- SSQ 0.002 (0.02) 0.00 0.95 -- -- -- MSAQ Pre -0.03 (0.02) 0.21 0.65 -- -- -- MSAQ Post 0.01 (0.01) 0.21 0.65 -- -- -- Condition 1.54 0.22 -- -- -- Block * SSQ 2.42 0.03 .0025 -- -- Block * Total Rotation 0.96 0.44 -- -- -- Block * Max Rotation 1.34 0.24 -- -- -- Block * Rotational Difference 1.93 0.09 -- -- -- Condition * SSQ 0.75 0.48 -- -- -- Condition * Total Rotation 0.48 0.62 -- -- -- Condition * Max Rotation 1.08 0.34 -- -- --
Condition * Rotational Difference 0.72 0.49 -- -- --
Block * Condition 1.12 0.34 -- -- -- Block * Condition * SSQ 1.82 0.052 -- -- -- Block * Condition * Total Rotation 0.68 0.75 -- -- -- Block * Condition * Max Rotation 0.82 0.61 -- -- -- Block * Condition * Rotational Difference 1.18 0.30 -- -- -- TotalΔR2 .0339 -- --

108
Figure 46. Interaction of block and simulator sickness (SSQ) predicting absolute error in the experimental blocks of experiment 2. The x-axis scale is the grand mean center simulator sickness (SSQ) variable with the translated actual values located above.
5.3.2. Pre-/ Post-test Analyses for Experiment 2
5.3.2.1. Absolute Error Primary Analysis for the Pre-/ Post-Test Block in Experiment 2
The only change from the experimental block analysis is that in the secondary analysis
MSAQ-pre and –post is grouped into a single variable for the pre-/post analysis creating a level 2
variable. The F-Test results from the hierarchical linear modeling for accuracy as the outcome
can be seen in Table 20. Due to the size of the complete coefficient table, only the main effects’
and significant interactions’ coefficients and standard errors are included in the table. Please see
Appendix P for the comprehensive coefficient table.
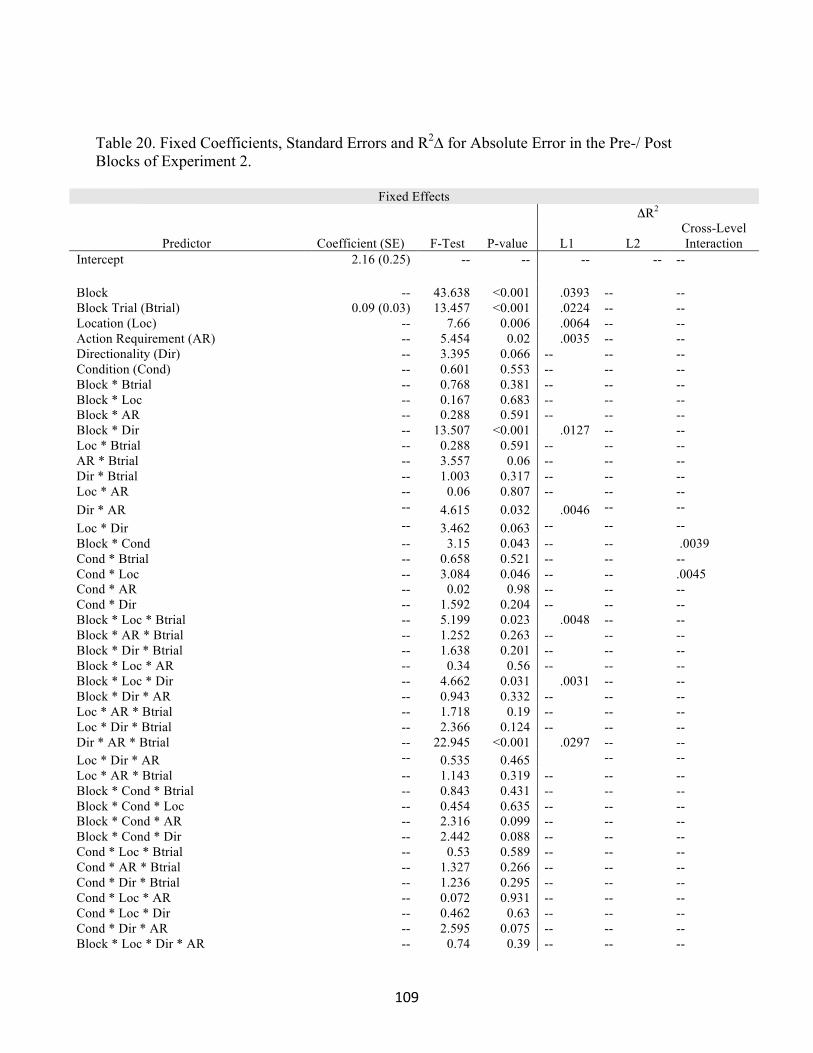
109
Table 20. Fixed Coefficients, Standard Errors and R2∆ for Absolute Error in the Pre-/ Post Blocks of Experiment 2.
Fixed Effects
Predictor Coefficient (SE) F-Test P-value
ΔR2
L1 L2 Cross-Level Interaction
Intercept 2.16 (0.25)
-- -- -- -- --
Block -- 43.638 <0.001 .0393 -- -- Block Trial (Btrial) 0.09 (0.03) 13.457 <0.001 .0224 -- -- Location (Loc) -- 7.66 0.006 .0064 -- -- Action Requirement (AR) -- 5.454 0.02 .0035 -- -- Directionality (Dir) -- 3.395 0.066 -- -- -- Condition (Cond) -- 0.601 0.553 -- -- -- Block * Btrial -- 0.768 0.381 -- -- -- Block * Loc -- 0.167 0.683 -- -- -- Block * AR -- 0.288 0.591 -- -- -- Block * Dir -- 13.507 <0.001 .0127 -- -- Loc * Btrial -- 0.288 0.591 -- -- -- AR * Btrial -- 3.557 0.06 -- -- -- Dir * Btrial -- 1.003 0.317 -- -- -- Loc * AR -- 0.06 0.807 -- -- -- Dir * AR -- 4.615 0.032 .0046 -- -- Loc * Dir -- 3.462 0.063 -- -- -- Block * Cond -- 3.15 0.043 -- -- .0039 Cond * Btrial -- 0.658 0.521 -- -- -- Cond * Loc -- 3.084 0.046 -- -- .0045 Cond * AR -- 0.02 0.98 -- -- -- Cond * Dir -- 1.592 0.204 -- -- -- Block * Loc * Btrial -- 5.199 0.023 .0048 -- -- Block * AR * Btrial -- 1.252 0.263 -- -- -- Block * Dir * Btrial -- 1.638 0.201 -- -- -- Block * Loc * AR -- 0.34 0.56 -- -- -- Block * Loc * Dir -- 4.662 0.031 .0031 -- -- Block * Dir * AR -- 0.943 0.332 -- -- -- Loc * AR * Btrial -- 1.718 0.19 -- -- -- Loc * Dir * Btrial -- 2.366 0.124 -- -- -- Dir * AR * Btrial -- 22.945 <0.001 .0297 -- -- Loc * Dir * AR -- 0.535 0.465
-- --
Loc * AR * Btrial -- 1.143 0.319 -- -- -- Block * Cond * Btrial -- 0.843 0.431 -- -- -- Block * Cond * Loc -- 0.454 0.635 -- -- -- Block * Cond * AR -- 2.316 0.099 -- -- -- Block * Cond * Dir -- 2.442 0.088 -- -- -- Cond * Loc * Btrial -- 0.53 0.589 -- -- -- Cond * AR * Btrial -- 1.327 0.266 -- -- -- Cond * Dir * Btrial -- 1.236 0.295 -- -- -- Cond * Loc * AR -- 0.072 0.931 -- -- -- Cond * Loc * Dir -- 0.462 0.63 -- -- -- Cond * Dir * AR -- 2.595 0.075 -- -- -- Block * Loc * Dir * AR -- 0.74 0.39 -- -- --
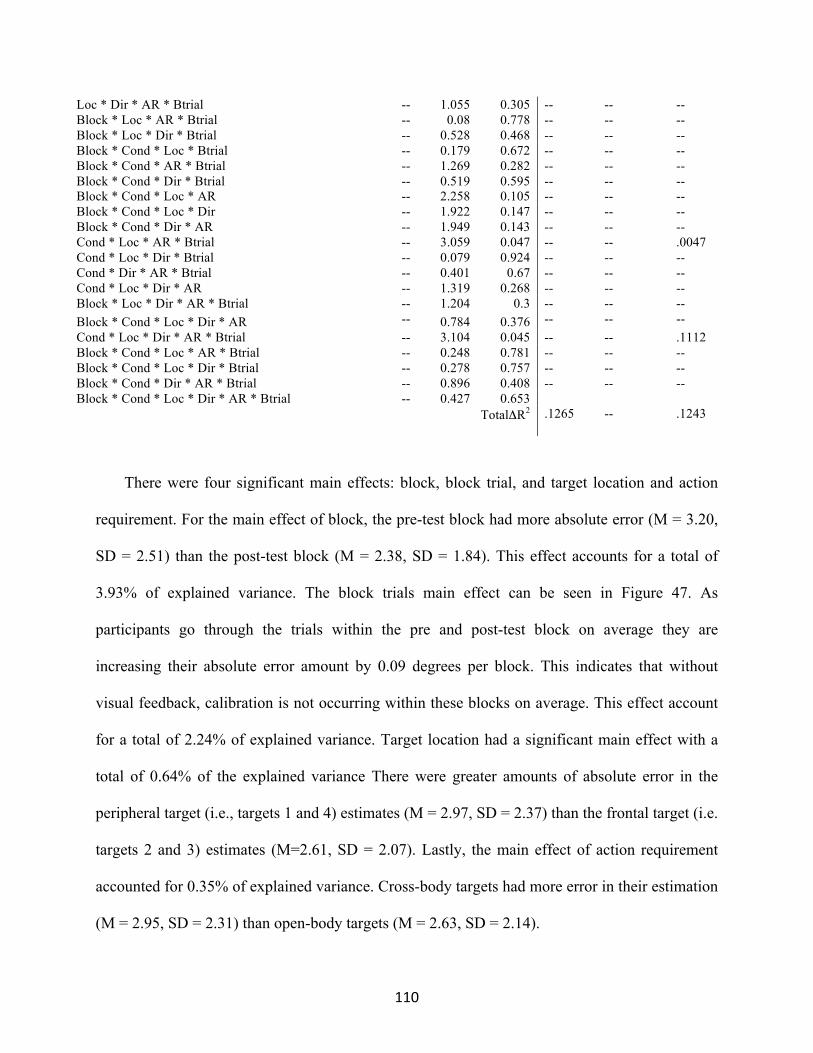
110
There were four significant main effects: block, block trial, and target location and action
requirement. For the main effect of block, the pre-test block had more absolute error (M = 3.20,
SD = 2.51) than the post-test block (M = 2.38, SD = 1.84). This effect accounts for a total of
3.93% of explained variance. The block trials main effect can be seen in Figure 47. As
participants go through the trials within the pre and post-test block on average they are
increasing their absolute error amount by 0.09 degrees per block. This indicates that without
visual feedback, calibration is not occurring within these blocks on average. This effect account
for a total of 2.24% of explained variance. Target location had a significant main effect with a
total of 0.64% of the explained variance There were greater amounts of absolute error in the
peripheral target (i.e., targets 1 and 4) estimates (M = 2.97, SD = 2.37) than the frontal target (i.e.
targets 2 and 3) estimates (M=2.61, SD = 2.07). Lastly, the main effect of action requirement
accounted for 0.35% of explained variance. Cross-body targets had more error in their estimation
(M = 2.95, SD = 2.31) than open-body targets (M = 2.63, SD = 2.14).
Loc * Dir * AR * Btrial -- 1.055 0.305 -- -- -- Block * Loc * AR * Btrial -- 0.08 0.778 -- -- -- Block * Loc * Dir * Btrial -- 0.528 0.468 -- -- -- Block * Cond * Loc * Btrial -- 0.179 0.672 -- -- -- Block * Cond * AR * Btrial -- 1.269 0.282 -- -- -- Block * Cond * Dir * Btrial -- 0.519 0.595 -- -- -- Block * Cond * Loc * AR -- 2.258 0.105 -- -- -- Block * Cond * Loc * Dir -- 1.922 0.147 -- -- -- Block * Cond * Dir * AR -- 1.949 0.143 -- -- -- Cond * Loc * AR * Btrial -- 3.059 0.047 -- -- .0047 Cond * Loc * Dir * Btrial -- 0.079 0.924 -- -- -- Cond * Dir * AR * Btrial -- 0.401 0.67 -- -- -- Cond * Loc * Dir * AR -- 1.319 0.268 -- -- -- Block * Loc * Dir * AR * Btrial -- 1.204 0.3 -- -- -- Block * Cond * Loc * Dir * AR -- 0.784 0.376 -- -- -- Cond * Loc * Dir * AR * Btrial -- 3.104 0.045 -- -- .1112 Block * Cond * Loc * AR * Btrial -- 0.248 0.781 -- -- -- Block * Cond * Loc * Dir * Btrial -- 0.278 0.757 -- -- -- Block * Cond * Dir * AR * Btrial -- 0.896 0.408 -- -- -- Block * Cond * Loc * Dir * AR * Btrial -- 0.427 0.653
TotalΔR2 .1265 --
.1243
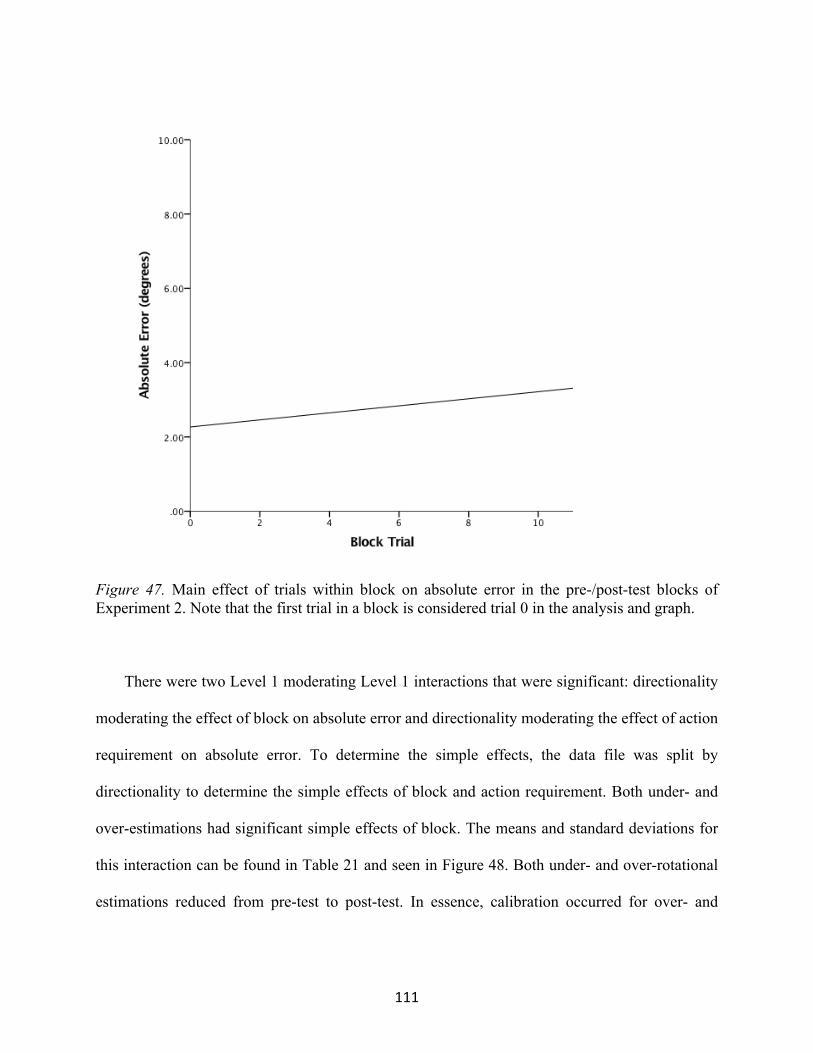
111
Figure 47. Main effect of trials within block on absolute error in the pre-/post-test blocks of Experiment 2. Note that the first trial in a block is considered trial 0 in the analysis and graph.
There were two Level 1 moderating Level 1 interactions that were significant: directionality
moderating the effect of block on absolute error and directionality moderating the effect of action
requirement on absolute error. To determine the simple effects, the data file was split by
directionality to determine the simple effects of block and action requirement. Both under- and
over-estimations had significant simple effects of block. The means and standard deviations for
this interaction can be found in Table 21 and seen in Figure 48. Both under- and over-rotational
estimations reduced from pre-test to post-test. In essence, calibration occurred for over- and

112
under-estimations. However, over-rotation estimates calibrated the most seeing the greatest
decrease in absolute error from pre- to post-tests. This effect accounts for 1.27 % of the variance.
Table 21. Means and standard deviations of absolute error for the interaction of directionality
and block in the pre- and post-test blocks of Experiment 2.
Mean (SD)
Estimate Directionality Pre-Test Post-Test Under rotation 3.12 (2.32) 2.69 (1.96)
Over rotation 3.27 (2.68) 1.94 (1.55)
Figure 48. Interaction of directionality and block predicting absolute error (degrees) in experiment 2 pre- and post-test blocks.
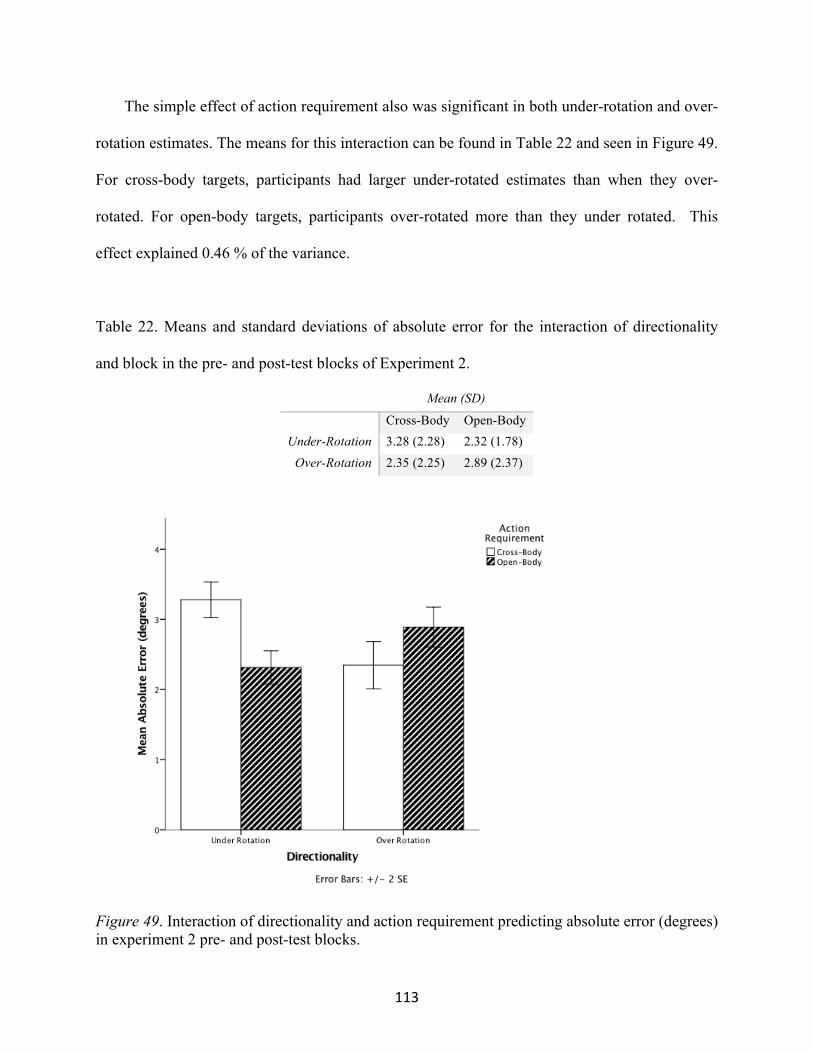
113
The simple effect of action requirement also was significant in both under-rotation and over-
rotation estimates. The means for this interaction can be found in Table 22 and seen in Figure 49.
For cross-body targets, participants had larger under-rotated estimates than when they over-
rotated. For open-body targets, participants over-rotated more than they under rotated. This
effect explained 0.46 % of the variance.
Table 22. Means and standard deviations of absolute error for the interaction of directionality
and block in the pre- and post-test blocks of Experiment 2.
Mean (SD)
Cross-Body Open-Body Under-Rotation 3.28 (2.28) 2.32 (1.78)
Over-Rotation 2.35 (2.25) 2.89 (2.37)
Figure 49. Interaction of directionality and action requirement predicting absolute error (degrees) in experiment 2 pre- and post-test blocks.

114
The two cross-level two-way interaction: block by condition and location by condition.
The block by condition interaction accounted for 0.39% of the variance. All three conditions
significantly decreased the amount of error in the post test (see Table 23 for means and standard
deviations). This interaction can be seen in Figure 50. What is most interesting is that the
absolute error is approximately the same across conditions in the post-test, indicating that
condition did not affect calibration in general.
Table 23. Means and standard deviations of absolute error for the interaction of condition and
block in the pre- and post-test blocks of Experiment 2.
Mean (SD)
Condition Pre-Test Post-Test Control 3.29 (2.62) 2.27 (1.72)
Oscillating 2.79 (2.33) 2.42 (1.78) Constant Increase 3.56 (2.53) 2.48 (2.02)

115
Figure 50. Interaction of block and condition predicting absolute error (degrees) in experiment 2 pre- and post-test blocks.
The second cross-level interaction was between condition and location. This interaction
accounted for 0.45% of explained variance. The simple effect of location is significant only in
the control and constant increase conditions. The means and standard deviations can be found in
Table 24 and the interaction can be seen in Figure 51. Both the control and constant increase
conditions had significantly more error for peripheral targets and frontal targets.

116
Table 24. Means and standard deviations of absolute error for the interaction of location and
condition in the pre- and post-test blocks of Experiment 2.
Mean (SD)
Condition Frontal Peripheral Control 2.53 (1.97) 3.02 (2.50
Oscillating 2.61 (2.10) 2.60 (2.07) Constant Increase 2.69 (2.14) 3.35 (2.51)
Figure 51. Interaction of location and condition predicting absolute error (degrees) in experiment 2 pre- and post-test blocks.
There were three three-way significant level 1 interactions. This first was block by block
trial by target location. Decomposed into simple effects found that the pre tests, the frontal
targets had a significant slope of block and in the post-test the peripheral targets had a significant
slope. This three-way interact can be seen in Figure 52. As block trials increased in the pre-test
for the frontal targets, the amount of error increases by 0.12 per trial. As block trials increase in

117
the post-test for the peripheral targets, the amount of error increases by 0.15 per trial. This
interaction accounted for 0.48% of explained variance.
Figure 52. Three-way interaction of block trial by block by target location for the pre-/ post- test blocks of Experiment 2. There was a significant slope for frontal targets in the pre-test and peripheral targets in the post-test. Note that the first trial in a block is considered trial 0 in the analysis and graph.
The second three-way interaction was between target location, block, and estimate
directionality. When decomposed into simple effects, directionality was significant in both
blocks for frontal targets but over-rotation was significant for the peripheral targets between
blocks. This interaction can be seen in Figure 53. There was a decrease in the amount of error
from pre- to post-test in general for both target locations. Under-rotated estimates remained
about the same in the pre-tests for peripheral targets. This indicates that calibration did not occur
significantly for peripheral targets if participants underestimated. This interaction accounts for
0.31% of explained variance.

118
Figure 53. Three-way interaction between target location, block, and directionality predicting absolute error (degrees) in the pre-/ post-test blocks in Experiment 2.
The third significant L1 three-way interaction was block trial by action requirement by
directionality. When decomposed into simple effects, cross-body targets had a significant slope
of block trial for estimations that were under-rotated while open-body targets had a significant
slop of over rotation across block trials. These effects can be seen in Figure 54. In essence, for
cross-body targets, as the participants went through the trials within the blocks, the amount of
error increased (i.e., they under rotated more) by 0.25 degrees per trial increase. However, for
open-body targets. participants began over-rotating their estimates increased by 0.13 in error per
trial increase. This account for 2.97% of the explain variance.
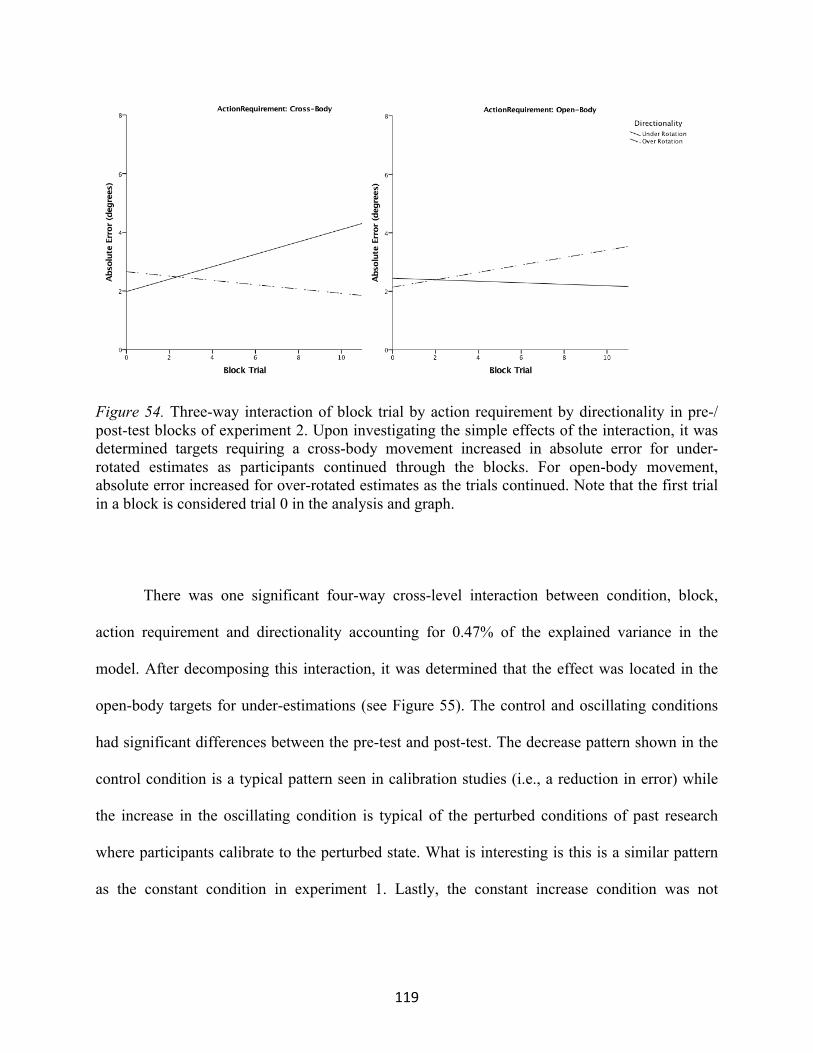
119
Figure 54. Three-way interaction of block trial by action requirement by directionality in pre-/ post-test blocks of experiment 2. Upon investigating the simple effects of the interaction, it was determined targets requiring a cross-body movement increased in absolute error for under-rotated estimates as participants continued through the blocks. For open-body movement, absolute error increased for over-rotated estimates as the trials continued. Note that the first trial in a block is considered trial 0 in the analysis and graph.
There was one significant four-way cross-level interaction between condition, block,
action requirement and directionality accounting for 0.47% of the explained variance in the
model. After decomposing this interaction, it was determined that the effect was located in the
open-body targets for under-estimations (see Figure 55). The control and oscillating conditions
had significant differences between the pre-test and post-test. The decrease pattern shown in the
control condition is a typical pattern seen in calibration studies (i.e., a reduction in error) while
the increase in the oscillating condition is typical of the perturbed conditions of past research
where participants calibrate to the perturbed state. What is interesting is this is a similar pattern
as the constant condition in experiment 1. Lastly, the constant increase condition was not

120
significantly different in the post-test from the pre-test; however, they did decrease which is
opposite of the expected finding.
Figure 55. Three-way interaction of block by action requirement by directionality by condition
for pre-/ post-test blocks in experiment 2.
Lastly, there was a significant five-way interaction between condition, target location,
action requirement, estimation directionality, and block trial. When decomposed to determine
significant simple slopes it was determined that the significant simple slopes were for under-
rotation estimates. For the control condition there was a significant slope for peripheral targets
that required cross-body action (i.e., target 1; see Figure 56). As participants in the control
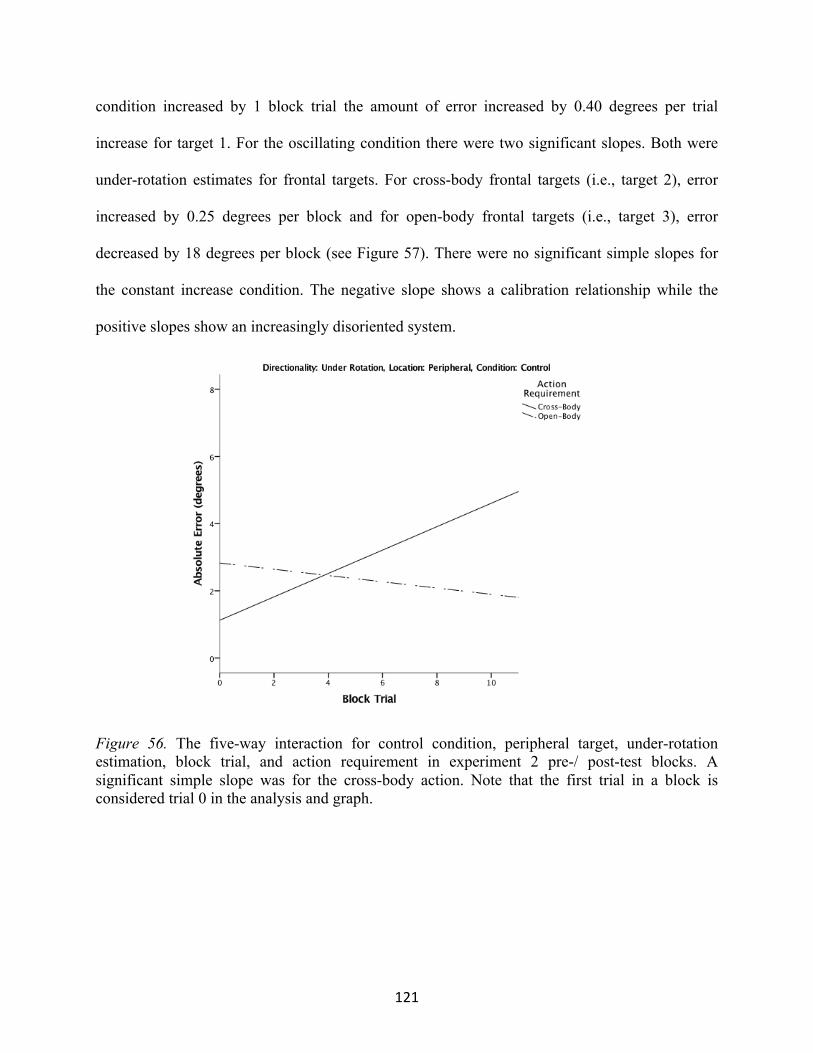
121
condition increased by 1 block trial the amount of error increased by 0.40 degrees per trial
increase for target 1. For the oscillating condition there were two significant slopes. Both were
under-rotation estimates for frontal targets. For cross-body frontal targets (i.e., target 2), error
increased by 0.25 degrees per block and for open-body frontal targets (i.e., target 3), error
decreased by 18 degrees per block (see Figure 57). There were no significant simple slopes for
the constant increase condition. The negative slope shows a calibration relationship while the
positive slopes show an increasingly disoriented system.
Figure 56. The five-way interaction for control condition, peripheral target, under-rotation estimation, block trial, and action requirement in experiment 2 pre-/ post-test blocks. A significant simple slope was for the cross-body action. Note that the first trial in a block is considered trial 0 in the analysis and graph.
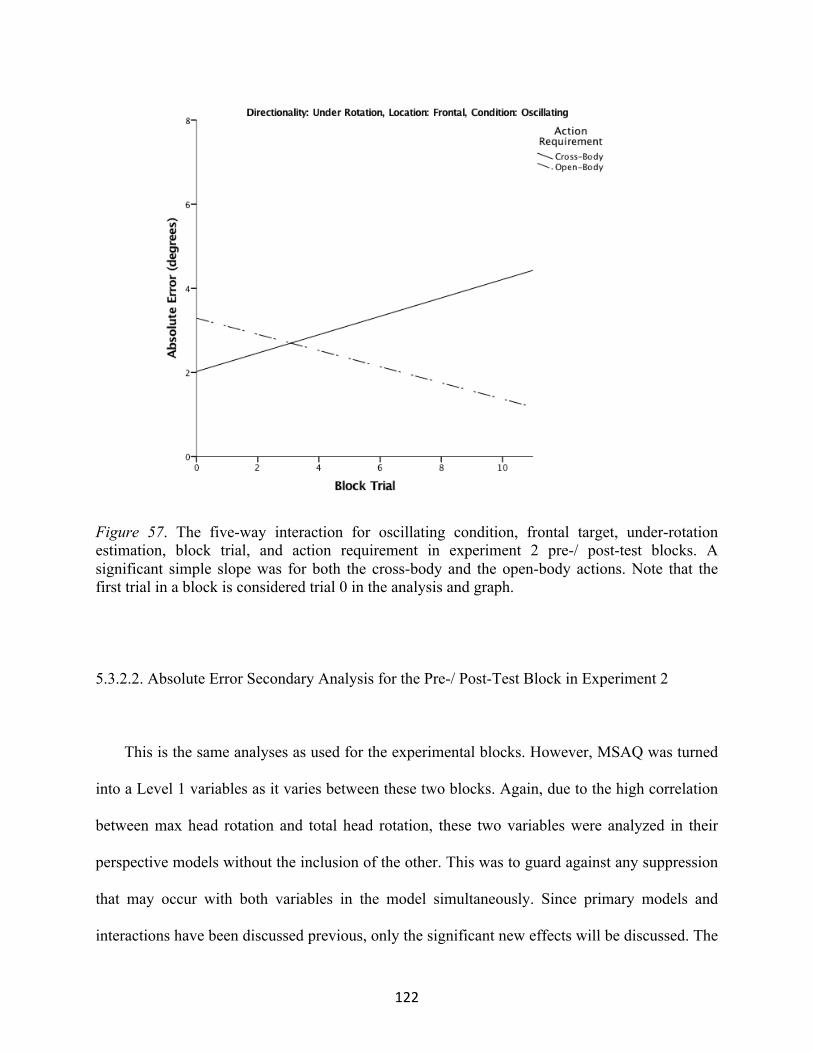
122
Figure 57. The five-way interaction for oscillating condition, frontal target, under-rotation estimation, block trial, and action requirement in experiment 2 pre-/ post-test blocks. A significant simple slope was for both the cross-body and the open-body actions. Note that the first trial in a block is considered trial 0 in the analysis and graph.
5.3.2.2. Absolute Error Secondary Analysis for the Pre-/ Post-Test Block in Experiment 2
This is the same analyses as used for the experimental blocks. However, MSAQ was turned
into a Level 1 variables as it varies between these two blocks. Again, due to the high correlation
between max head rotation and total head rotation, these two variables were analyzed in their
perspective models without the inclusion of the other. This was to guard against any suppression
that may occur with both variables in the model simultaneously. Since primary models and
interactions have been discussed previous, only the significant new effects will be discussed. The

123
F-Test results from the hierarchical linear modeling for accuracy as the outcome including
secondary variables can be seen in Table 25. Only continuous variables will have coefficients
and standard errors included in the model. For a full table of all coefficients please refer to
Appendix Q.
Table 25: Fixed Coefficients, Standard Errors and R2∆ for Absolute Error for the Secondary
Variables in pre-/ post-test analyses in Experiment 2.
There were two significant secondary variables: max rotation and rotational difference.
The main effect of max rotation accounted for 1.85% of the explained variance. As shown in
Fixed Effects
Predictor Coefficient (SE) F-Test P-value
ΔR2
L1 L2
Cross-Level
Interaction Intercept 3.28 (0.32)
-- -- -- -- --
Block 32.419 <0.001 .0275 -- --
Block trial 0.09 (0.03)
12.601 0.001 .0196 -- --
Location 24.035 <0.001 .0192 -- -- Action Requirement 10 0.002 .0076 -- -- Directionality 33.234 <0.001 .0290 -- -- Total Rotation 0.01 (0.01) 3.429 0.064
-- --
Max Rotation 0.10 (0.02) 27.398 <0.001 .0185 -- -- Rotation Difference 0.17 (0.02) 62.697 <0.001 .0564 -- -- SampEn-X -0.9 (4.60) 0.038 0.845
-- --
SampEn-Y 6.01 (4.50) 1.785 0.184
-- -- MSAQ 1.354 0.246
-- --
Condition 0.093 0.911
-- -- Block * Total Rotation 0.891 0.346
-- --
Block * Max Rotation 1.167 0.28
-- -- Block * Rotation Difference 4.408 0.036 .0029 -- -- Condition * MSAQ 1.165 0.314
-- --
Condition * Total Rotation 3.1 0.045
-- .0029 Condition * Max Rotation 2.804 0.061
-- --
Condition * Rotation Difference 6.301 0.002
-- .0011 Block * Condition 2.334 0.097
-- --
Condition * Btrial 0.648 0.527
-- -- Block * Condition * Total Rotation 0.218 0.804
-- --
Block * Condition * Max Rotation 0.109 0.897
-- -- Block * Condition * Rotation Difference 2.719 0.066
-- --
TotalΔR2 .1807 -- .0040
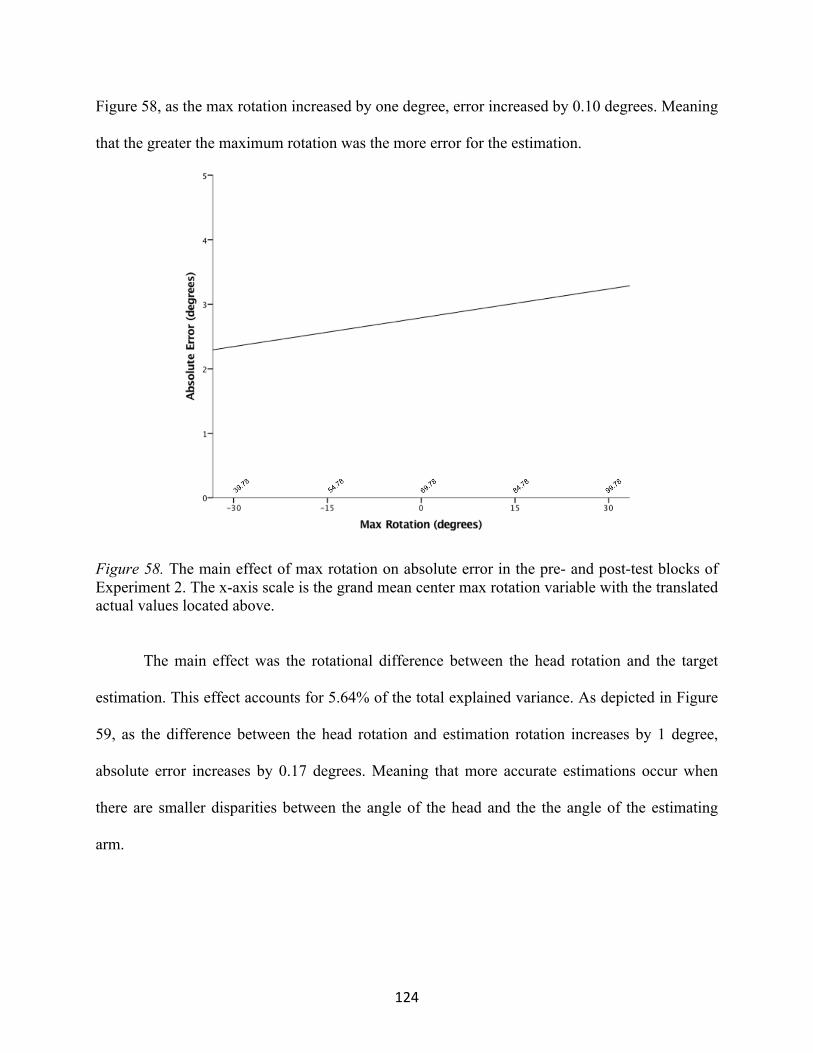
124
Figure 58, as the max rotation increased by one degree, error increased by 0.10 degrees. Meaning
that the greater the maximum rotation was the more error for the estimation.
Figure 58. The main effect of max rotation on absolute error in the pre- and post-test blocks of Experiment 2. The x-axis scale is the grand mean center max rotation variable with the translated actual values located above.
The main effect was the rotational difference between the head rotation and the target
estimation. This effect accounts for 5.64% of the total explained variance. As depicted in Figure
59, as the difference between the head rotation and estimation rotation increases by 1 degree,
absolute error increases by 0.17 degrees. Meaning that more accurate estimations occur when
there are smaller disparities between the angle of the head and the the angle of the estimating
arm.
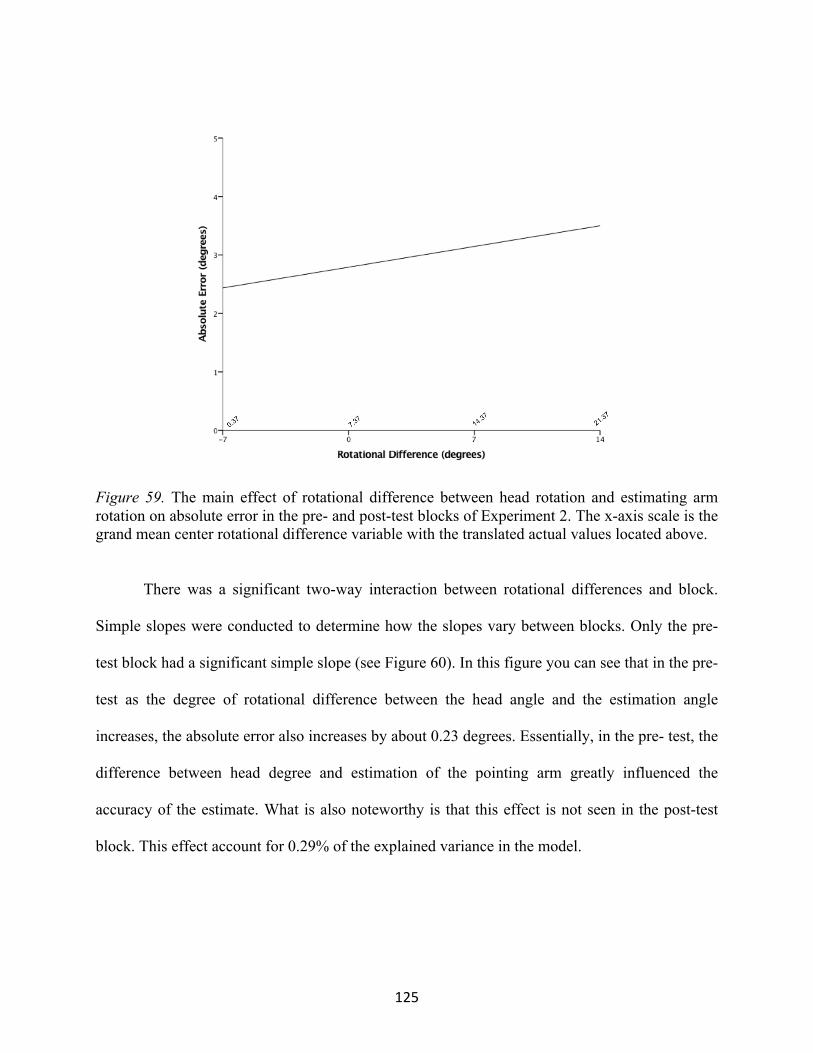
125
Figure 59. The main effect of rotational difference between head rotation and estimating arm rotation on absolute error in the pre- and post-test blocks of Experiment 2. The x-axis scale is the grand mean center rotational difference variable with the translated actual values located above.
There was a significant two-way interaction between rotational differences and block.
Simple slopes were conducted to determine how the slopes vary between blocks. Only the pre-
test block had a significant simple slope (see Figure 60). In this figure you can see that in the pre-
test as the degree of rotational difference between the head angle and the estimation angle
increases, the absolute error also increases by about 0.23 degrees. Essentially, in the pre- test, the
difference between head degree and estimation of the pointing arm greatly influenced the
accuracy of the estimate. What is also noteworthy is that this effect is not seen in the post-test
block. This effect account for 0.29% of the explained variance in the model.

126
Figure 60. The interaction effect of block and the rotational difference between head rotation and estimating arm rotation on absolute error for the pre- and post-tests of Experiment 2. Only the pre-test slope was significant. The x-axis scale is the grand mean center rotational difference variable with the translated actual values located above.
There were two significant cross-level two-way interaction with condition moderating
total rotation and rotational difference. The first was condition and total rotation. When
decomposed into simple slopes, only the constant increase condition had a significant positive
slope (see Figure 61). As participants in this condition increased the total rotation by one degree,
their absolute error increased by 0.03 degrees.

127
Figure 61. The interaction effect of condition and the total rotation on absolute error in the pre- and post-test blocks of Experiment 2. Only the constant-increase conditions had significant simple slopes. The x-axis scale is the grand mean center total rotation variable with the translated actual values located above.
The second cross-level two-way interaction was between condition and rotational
difference. Decomposing the effect found that only control and constant increase conditions had
significant rotational difference slopes (see Figure 62). Investigating this interaction found the
effect of rotational difference on absolute error is in the post-test phase in the control and
constant increase condition. As the rotational difference increased, individuals in the control
condition increased their estimation error by about 0.16 degrees for every rotational difference
increased. Those in the constant increase condition decreased their absolute error by about 0.11

128
for every rotational difference increase. This indicates that rotational difference did not affect
those in the oscillating condition, but did for those in the control and constant increase condition.
Figure 62. The interaction effect of condition and the rotational difference between head rotation and estimating arm rotation on absolute error in the pre- and post-test blocks of Experiment 2. Only the control and constant -increase conditions had significant simple slopes. The x-axis scale is the grand mean center rotational difference variable with the translated actual values located above.
5.4. Postural Sway: Entropy for Experiment 2
The predictors for the dependent variable of postural sway are block, condition and the two-
way interaction. There are two measures of the entropy, the mediolateral sway (SampEn-X) and
the posterior-anterior sway (SampEn-Y). Both of these variables are measured at the block level
and therefore, trials within blocks cannot be used as a variable. The postural sway indexed by the

129
SampEn-X variable is the shifting of the COP by shifting weight to either side of the body (i.e.,
left to right). While the SampEn-Y variable is the shifting of the COP by shifting weight forward
and backward (i.e., between the toes and heels of the foot).
5.4.1. Postural Sway Analysis for the Experimental Blocks in Experiment 2
The F-Test results from the hierarchical linear modeling for SampEn-X and SampEn-Y
as the outcome can be seen in Table 26.
Table 26. F-tests for SampEn-X and –Y for the experimental blocks in experiment 2.
ΔR2 Outcome Variable Model F-Test P-value L1 L2 Cross-Level
Interaction SampEn-X Block 106.58 <0.001 .1506 -- --
Condition 0.30 0.74 -- -- -- Block*Condition 27.47 <0.001 -- -- .0663
SampEn-Y Block 18.38 <0.001 .0245 -- -- Condition 2.40 0.10 -- -- -- Block*Condition 36.93 <0.001 -- -- .1050
Both outcome variables had significant main effects of block. The means for block can be
found in Table 27 and visualized in Figure 63. For SampEn-X all blocks were significantly
different from block 1, but only blocks 5 and 6 were significantly different than block 1 for
SampEn-Y. LSD post hoc analyses can be found in Appendix R for SampEn-X and Appendix S
for SampEn-Y. In general entropy increases across blocks for SampEn-X. However, for
SampEn-Y, the first 4 blocks were not significantly different, but the last two blocks decreased.
This effect accounted for 15.06% of explained variance of the SampEn-X variable and 2.45% of
the explained variance of the SampEn-Y variable.

130
Table 27. Mean and standard deviations of the main effect of block on SampEn-X and SampEn-
Y in the experimental blocks of Experiment 2.
Mean (SD) Block SampEn-X SampEn-Y
1 0.0563 (0.02) 0.0620 (0.02) 2 0.0636 (0.02) 0.0610 (0.02) 3 0.0625 (0.02) 0.0631 (0.02) 4 0.0668 (0.02) 0.0627 (0.02) 5 0.0644 (0.02) 0.0582 (0.02) 6 0.0730 (0.02) 0.0597 (0.02)
Figure 63. Means and standard errors of the main effect of block on SampEn-X and SampEn-Y for the experimental blocks in Experiment 2.
Additionally, the two-way interaction between block and condition was significant for
both entropy outcome variables. For SampEn-X, the interaction accounted for 6.63% in
explained variance while it accounted for 10.50% in explained variance for SampEn-Y. The
means for block can be found in Table 28 and visualized in Figure 64. When the interaction was
analyzed for the simple effects, there were significant simple effect of block in all conditions for
both SampEn-X and –Y. In general, there was more mediolateral sway than posterior-anterior

131
sway. What is most interesting is the pattern of the oscillating condition and the experimental
condition. In the oscillating condition, an oscillating pattern can be seen in both SampEn-X and –
Y. In this condition blocks 4 and 6 have the highest postural sway amounts, which is the opposite
effect of what was hypothesized (calibration would create less postural sway). For the constant
increase condition, a pattern of increase can be seen for SampEn-X but a decreasing pattern can
be seen in SampEn-Y. In essence, as the mediolateral sway increased the posterior-anterior sway
decreased. The constant increase demonstrates the most variability between the three conditions
for the SampEn-X.
Table 28. Mean and standard deviations of the interaction effect of block and condition on
SampEn-X and SampEn-Y for the experimental blocks of Experiment 2.
SampEn-X SampEn-Y
Experimental Block Control Oscillating Random Increase Control Oscillating Random Increase
1 0.0579 (0.02) 0.0560 (0.01) 0.0551 (0.02) 0.0517 (0.01) 0.0677 (0.02) 0.0666 (0.02) 2 0.0664 (0.02) 0.0620 (0.02) 0.0623 (0.02) 0.0507 (0.01) 0.0659 (0.02) 0.0663 (0.02) 3 0.0650 (0.02) 0.0589 (0.02) 0.0641 (0.02) 0.0546 (0.01) 0.0694 (0.02) 0.0649 (0.02) 4 0.0610 (0.02) 0.0704 (0.03) 0.0689 (0.02) 0.0598 (0.01) 0.0656 (0.02) 0.0625 (0.02) 5 0.0638 (0.02) 0.0573 (0.02) 0.0732 (0.02) 0.0548 (0.01) 0.0669 (0.02) 0.0517 (0.01) 6 0.0695 (0.02) 0.0701 (0.02) 0.0802 (0.03) 0.0573 (0.01) 0.0652 (0.02) 0.0560 (0.02

132
Figure 64. Means and standard errors of the interaction of block and condition on SampEn-X and SampEn-Y for the experimental blocks in Experiment 2.
5.4.1.2. Postural Sway Analysis for the Pre-/ Post-Test Blocks in Experiment 2
The F-Test results from the hierarchical linear modeling for SampEn-X and SampEn-Y
as the outcome can be seen in Table 29.

133
Table 29. F-tests for SampEn-X and –Y for the pre- and post-test blocks in experiment 2.
ΔR2 Outcome Variable Model F-Test P-value L1% L2 % Cross-Level
Interaction% SampEn-X Block 2.04 0.15 -- -- --
Condition 1.10 0.35 -- -- -- Block*Condition 11.532 <0.001 -- -- .0248
SampEn-Y Block 0.29 0.59 -- -- -- Condition
1.78 0.18 -- -- --
Block*Condition 67.504 0 -- -- .1206
The two-way interaction was the only significance for both SampEn-X and –Y. This
accounted for 2.48% in explained variance for SampEn-X and 12.06% for SampEn-Y. There
was a significant simple effects of block in all conditions for both outcome variables (see Table
30 for means and standard deviations). For SampEn-X, the control and constant increase
conditions decreased from pre- to post-test while the oscillating condition increased (see Figure
65).
For the SampEn-Y, the control and oscillating condition increased from pre- to post while
the constant increase condition decreased. The control condition significantly increased from
pre- to post-test, while the constant increase condition significantly decreased from pre- to post-
test (see Figure 65). In essence, the posterior-anterior sway increased from pre- to post-test for
the control condition and decreased for the constant increase condition.

134
Table 30. Mean and standard deviations of the interaction effect of block and condition on
SampEn-X and SampEn-Y for pre- and post-test blocks in Experiment 2.
Mean (SD)
SampEn-X SampEn-Y Condition Pre Post Pre Post
Control 0.0705 (0.02) 0.0662 (0.02) 0.0563 (0.01) 0.0634 (0.01) Oscillating 0.0602 (0.02) 0.0635 (0.02) 0.0719 (0.02) 0.0745 (0.03)
Constant Increase 0.0627 (0.02) 0.0604 (0.02) 0.0738 (0.03) 0.0643 (0.02)
Figure 65. Means and standard errors of the interaction of block and condition on SampEn-X (left) and SampEn-Y (right) for the pre- and post-test in Experiment 2.
5.5. Mediation Modeling for Experiment 2
To determine if condition impacted participants’ accuracy (i.e., absolute error) and if this
influence was mediated by the amount of postural sway (i.e., SampEn) in the blocks, a statistical
test of the proposed mediating effect was conducted. Since there were two SampEn
measurements, one measuring the mediolateral sway (SampEn-X) and one measuring the
posterior-anterior sway (SampEn-Y), this mediation model has two mediators (see Figure 66).
135
Both the constant condition and the constant increase condition were compared individually with
the control condition. The mediated effect was then modeled with block as a moderating effect.
Both the full model and moderated mediations by block for experimental blocks results can be
seen in Table 31 and for pre-/post-test blocks can be seen in Table 32 (refer to Figure 66 for
pathway locations).
The pathways within the mediation model are regressions with the point of the arrow
indicating the prediction direction. Therefore, these simple effects of block were already
analyzed in the MLM analyses above. This model is to determine if there are significant indirect
effects with SampEn mediating the effects of condition on absolute error.
The first initial model was all the data regardless of block. This mediation model was a 2-
1-1 (i.e., condition-L2, SampEn-X/Y-L1, and absolute error-L1). Then to determine if block
moderated this mediation, the model was split by block and reanalyzed as a 2-2-1 model
(condition and SampEn-X/Y are level 2 variables while absolute error remains at a measurement
level 1).

136
Figure 66. Pathway map of mediation for experiment 2.
5.5.1. Mediation Modeling of Experimental Blocks in Experiment 2
Table 31. Coefficient estimates and standard errors for the different experimental models for the
various paths, indirect effects and direct effects for the experimental blocks in experiment 2.
Estimate (SE)
Pathways Indirect Effects Direct Effects
SampEn-X SampEn-Y a1 a2 b c1 c2 d1 d2 e Cond 1a
(a1*b) Cond 2b
(a2*b) Cond 1a
(d1*e) Cond 2b
(d1*e) Cond 1a
(c1) Cond 2b
(c2) F u l l M o d e l
0.002 (0.01)
0.003 (0.01)
-7.42 (2.50) *
0.24 (0.21)
0.25 (0.14)
0.004 (0.003)
0.002 (0.01)
0.70 (3.42
-0.02 (0.05)
-0.03 (0.05)
0.003 (0.01)
0.002 (0.01)
0.24 (0.21)
0.25 (0.14)
Blo
ck
1 0.01 (0.01)*
0.01 (0.01)
-11.75 (6.01)
-0.02 (0.22)
-0.02 (0.25)
0.01 (0.01)*
0.01 (0.01)
3.74 (4.65)
0.01 (0.07)
0.02 (0.08)
0.04 (0.05)
0.04 (0.05)
-0.02 (0.22)
-0.02 (0.25)
2 -0.003 (0.01)
-0.003 (0.01)
-2.16 (4.09)
-0.01 (0.18)
-0.06 (0.21)
0.01 (0.01)*
0.01 (0.01)
-4.16 (3.68)
0.01 (0.2)
0.01 (0.2)
-0.05 (0.05)
-0.05 (0.06)
-0.01 (0.18)
-0.06 (0.21)
3 -0.005 (0.01)
0.001 (0.01)
-3.07 (5.19)
0.26 (0.21)
-0.01 (0.19)
0.01 (0.01)
0.01 (0.01)
-1.60 (6.68)
0.01 (0.03)
-0.002 (0.02)
-0.02 (0.07)
-0.01 (0.04)
0.26 (0.21)
-0.01 (0.19)
4 0.01 (0.01)
0.01 (0.01)
-3.1 (3.17)
0.27 (0.14)*
-0.07 (0.15)
0.002 (0.01)
-0.002 (0.01)
-0.22 (3.01)
-0.03 (0.05)
-0.03 (0.04)
>0.001 (0.005)
>0.001 (0.004)
-0.27 (0.14)*
-0.07 (0.15)
5 -0.01 (0.01)
0.01 (0.01)
-2.39 (3.0)
-0.19 (0.13)
-0.16 (0.16)
0.01 (0.01)
-0.01 (0.01)
9.01 (5.83)
0.01 (0.02)
-0.03 (0.04)
0.07 (0.07)
-0.07 (0.05)
-0.19 (0.13)
-0.16 (0.16)
6 0.002 (0.01)
0.01 (0.01)
-0.99 (2.61)
0.14 (0.15)
0.10 (0.18)
0.004 (0.01)
-0.01 (0.01)
-2.43 (4.41)
-0.002 (0.01)
-0.01 (0.03)
-0.01 (0.02)
0.01 (0.02)
0.14 (0.15)
0.10 (0.18)
*p<0.05, **p<0.01, ***p<0.001, a= Comparison of control and constant conditions, b= comparison of constant increase and control group.
The path coefficients and standard errors of the full model can be seen in the model in
Table 31. Please refer to Figure 66 for references of pathways. The only significant path for the

137
full model was SampEn-X predicting absolute error. There were no significant direct or indirect
effects.
For the moderated mediation model, pathway coefficients, standard errors, and p-values
for the different pathways can be found in Table 31 by block. In block 1 there were two
significant paths a1 and d1. Both of these are a significant difference between the control and
constant condition when predicting postural sway: SampEn X (a1) and SampEn Y (d1). In block
2 only d1 was significant (significant difference between control and constant conditions when
predicting postural sway. In block 4 there was a significant direct effect which was the c1 path
indicating that there was a significant difference between the control and constant condition
when estimating absolute error. Unfortunately, there were no significant indirect pathways.
5.5.2. Mediation Modeling of Pre-/ Post-Test Blocks in Experiment
Table 32. Coefficient estimates and standard errors for the different experimental models for the
various paths, indirect effects and direct effects for the pre- and post-test blocks of Experiment 2.
Estimate (SE) Pathways Indirect Effects Direct Effects SampEn-X SampEn-Y a1 a2 b c1 c2 d1 d2 e Cond 1a
(a1*b) Cond 2b
(a2*b) Cond 1a
(d1*e) Cond 2b
(d1*e) Cond 1a
(c1) Cond 2b
(c2) F u l l M o d e l
-0.01 (0.01)
-0.01 0.01)
1.27 (13.76)
-0.18 (0.30)
0.24 (0.32)
0.01 (0.004)
0.004 (0.01)
10.95 (13.99)
-0.01 (0.08)
-0.01 (0.09)
0.09 (0.11)
0.05 (0.14)
-0.18 (0.30)
0.24 (0.32)
Blo
ck Pre-
Test -0.01 (0.01)
-0.01 (0.01)
-17.05 (8.88)
-0.58 (0.51)
-0.24 (0.58)
0.01 (0.01)
0.01 (0.01)
-4.76 (10.62)
0.15 (0.14)
0.11 (0.13)
-0.05 (0.12)
-0.06 (0.15)
-0.58 (0.51)
-0.24 (0.58)
Post-Test
-0.003 (0.01)
-0.01 (0.01)
6.63 (6.78)
0.10 (0.28)
0.24 (0.34)
0.01 (0.01)*
-0.004 (0.01)
5.65 (5.73)
-0.02 (0.06)
-0.04 (0.07)
0.04 (0.07)
-0.02 (0.04)
0.10 (0.28)
0.24 (0.34)
*p<0.05, **p<0.01, ***p<0.001, a= Comparison of control and constant conditions, b= comparison of constant increase and control group.

138
The path coefficients and standard errors of the full model can be seen in the model in
Table 32. Please refer to Figure 66 for reference of pathways. There were no significant
pathways, direct or indirect effects in the full model.
For the moderated mediation model, pathway coefficients, standard errors, and p-values
for the different pathways can be found in Table 32 by block. There were no significant paths in
the pre-test. In the post-test block, there was only a significant path of condition 1 on SampEn-Y
indicating a difference between control and oscillating conditions. There were no significant
indirect or direct pathways.
In block 1 there were two significant paths a1 and d1. Both of these are a significant
difference between the control and constant condition when predicting postural sway: SampEn X
(a1) and SampEn Y (d1). In block 2 only d1 was significant (significant difference between
control and constant conditions when predicting postural sway. In block 4 there was a significant
direct effect which was the c1 path indicating that there was a significant difference between the
control and constant condition when estimating absolute error. Unfortunately, there were no
significant indirect pathways.
6. Discussion of Experiment 2 Results
The findings of second experiment are very similar to those of the first. In general, the
pattern of calibration occurred across experimental blocks, across trials within blocks, and from
the pre-to the post-test. Participants calibrated target estimations across the blocks of
experimental trials and from the pre- to the post-test. This indicates that regardless of condition,
there was a level of calibration that occurred. This finding supports previous research that task-
relevant feedback can overcome systemic distortions or perturbations. On average, participants

139
tended to have higher under-rotation estimations than over-rotation estimation indicating that
their errors were greater if they did not rotate far enough to the target. These under-rotation
estimations reduced across the experimental blocks and trials within blocks indicating a high
level of calibration effect from them. Target location and action requirement also affected the
accuracy of estimates. These variables moderated the lower-order interactions and main effects.
The current study had three primary hypotheses: (1) the rate of recalibration across
consecutive trials will be faster in the oscillating condition than in the constant gain increase
condition. (2) However, this recalibration rate will be slower than that of the constant condition
in experiment 1. (3) postural sway (e.g., entropy) will mediate the relationship between the type
of perturbation condition (i.e., type of environment) and target estimation errors (see Figure 2).
While all of these hypotheses can be analyzed with the primary variables of interest, there
were concerns of the effect of secondary variables such as simulator sickness and head
movement during trials. These variables were analyzed in secondary models while keeping the
primary variables in the models as constants. Even though there were main effects and
interactions of the secondary variables, the effect sizes were not large enough to create concerns
for the validity of the primary variables and their interactions.
The first hypothesis of this study was that more unstable environments will take longer to
calibrate. This hypothesis can be found with any interaction in which block and condition
interact within the experimental blocks. Unlike experiment 1, the conditions in this experiment
did not show the significant differences to that of the control condition in terms of absolute error.
However, there were significant findings in the postural sway analyses with the SampEn-X
outcome variable showing specific patterns associated with the oscillating condition and random
increase. The variability within the entropy variables follows similar results of the first

140
experiment in which the more unstable environment, the constant increase, demonstrated higher
levels of variability across blocks of trials than the oscillating condition or the control condition.
Similarly, the second hypothesis can be found viewing the interaction of block and condition
and/or block trial and condition. While these interactions were not significant in the model of
absolute error, comparing the simple slope estimates of the three-way interaction of block,
condition and block trial found that the oscillating condition actually calibrated in the first
perturbation change block at a fast rate (negative slope of 0.06) than the constant condition
(negative slope of 0.03). Additionally, across blocks, the oscillating condition had less variance
than the constant condition.
Hypothesis 3 in this experiment was the same as the 4th hypothesis in experiment 1. This
hypothesis was that the relationship between the condition and absolute error would be mediated
through postural sway. Again, this analysis was essentially an assimilation of both the absolute
error analysis and the postural sway analysis into a singular integrated model to potentially
explain a relationship between the three variables. The findings for this hypothesis was similar to
those in experiment 1. In the full model in both the experimental blocks and the pre-/ post-test
block analyses, there was not an indirect effect. To determine if block moderated the mediation
model, it was included as a moderator. Again, no indirect effects were found. Therefore,
hypothesis 3 does not have sufficient evidence to be supported from this current study.

141
CHAPTER IV.
GENERAL DISCUSSION
Previous research has demonstrated that people are able to adapt to perceptual distortions
or perturbations (e.g., Day et al., 2017; Altenhoff, et al., 2012, Bingham & Romack, 1999;
Bingham & Pagano, 1998). However, the majority of the literature investigating the effect of
perturbations on prospective control have involved relatively stable and constant perturbations.
These two experiments were conducted to examine the effects of different types of unstable
environments on calibration. Specifically, how environments that change in relatively short time
frames can affect the rate and amount of calibration.
The current studies investigated perturbation calibration through a series of intricate and
comprehensive analytical models that allowed for the complexity of the study and subsequent
rich data to be examined and explained. Both experiments utilized a visual rotation perturbation
at varying levels. The perturbation levels were manipulated through the gain increase amount in
experiment 1 and the pattern of the gain amount in experiment 2.
In both experiments, it was hypothesized that the more unstable an environment, either
through the rate of perturbation change or the pattern of change, the more difficult calibration
would be. Calibration effects were examined using the primary outcome variable of absolute
error and the secondary outcome variable of entropy in postural sway. While the gain amounts
were found to affect the amount of postural sway between blocks the effect was more visible
through the examination of the variability of the patterns within the conditions. The effect of the
different environments on absolute error were also evident within and between blocks. However,

142
the constant rate of the pattern in the experimental groups of experiment 2 demonstrated similar
calibration effects as the control condition.
While the main mediation model and the moderated-mediation models did not find the
proposed indirect effects, there were effects of the perceptual gains on postural sway in both
experiments. These effects can be seen on both the SampEn-X outcome variable measuring
mediolateral sway and the SampEn-Y outcome variable measuring anterior-posterior sway.
However, more perturbed conditions (i.e., the random increase and the constant increase
conditions) demonstrated the most variability in their absolute error estimates and their postural
sway. Therefore, while the effects of the perturbation levels can be seen within the experimental
blocks, these participants still demonstrated a general decrease in their absolute error amounts.
Any significant effects of the SampEn-Y variable are especially interesting as that type of
postural sway would provide additional depth information. However, since the targets were
located at the same distance, why did we see this type of movement so affected? Future research
should analyze the head movement of the participant similar to postural sway to determine if the
increase of the postural sway is an exploratory movement or an unconscious movement caused
by the perceptual information change in the environment (i.e., the movement is due to
compensatory movements; see Riccio & Stoffregen, 1991; Smart & Smith, 2001).
1. Contribution to Calibration Literature
In the current work, calibration was investigated within blocks of trials and between
blocks of trials and in examining pre- and post-test differences. While the latter is commonly
used to investigate calibration effects, the examination within blocks and between blocks of
feedback calibration is not. These results provide a comprehensive examination of multiple

143
levels of calibration occurring: calibration within unique perturbation levels (investigation at
trials within block level), across multiple blocks of either constant perturbation levels (control
and constant conditions) or fluctuating perturbation levels (oscillating, constant increase and
random increase).
Both experiments demonstrated general calibration effects within and across blocks as
well as carry-over effects seen in the post-test block. These findings support previous research
into task-relevant feedback calibration effects (e.g., Bingham & Pagano, 1998; Day, et al.,
submitted; Fajen, 2007; Iodice, Scuderi, Saggini & Pezzulo, 2015; Warren, 1984; Withagen &
Michaels, 2004). Importantly, while participants experienced unstable environments (i.e.,
random increase and constant increase), they still had significant reductions in the absolute error
of their estimations in the post-test.
Comparing the results of the first and second experiment, it can be seen in the post-test
results of the accuracy measurement of absolute error that there was an effect of the patterning of
the perturbation change. The participants in the two patterned gain change conditions (oscillating
and constant increase) calibrated as well as the control condition (see Figure 50), while the carry-
over effects for error in the constant and random increase condition in experiment 1 were more
than the constant condition in an increasing pattern see Figure 21). This comparison supports the
need for future research into the patterning and the gain amounts of unstable environment for
calibration research.
Additionally, in the post-test it can be seen that errors start increasing as participants
continue through the trials. This finding supports that perception drifts and becomes less accurate
when feedback is removed (Bingham & Pagano, 1998). Additionally, there could be an effect of

144
speed and accuracy trade-off occurring in this block. However, it is important to note that the
error amounts are minimal (generally under 6 degrees).
After the completion of the experiment, participants were asked if they had any
knowledge of the study or if they had any hypotheses as to what was being investigated in the
study. While the majority of participants could not articulate what they felt was being studied,
there were several able to determine there were changes being made to the visual gain amount.
Similar to Littman (2011), the participants that were able to determine the experimental effects
were in the more complex environments (i.e., the more unstable environments, either the
constant increase or random increase conditions). Anecdotally, the participants that were able to
articulate the experimental manipulation, made exploratory head movements in the environment
between the blocks while they answered the verbal SSQ. Unfortunately, the current study did not
measure the pattern of head movements within blocks and between blocks of trials in a fashion
that these movements could be investigated. In future research, it would be beneficial to use
entropy not only for postural sway indexes but also for the head movement (to be discussed).
2. Limitations and Future Studies
Some limitations of the current included issues with measurement variables, task
difficulty, task constraints, and pattern of change for the gain of perturbation. The first
significant limitation was very little variability in both primary dependent variables (absolute
error and entropy). The small amount of variance indicates that there was not a high level of
individual differences which could be due to the experimental task. In essence, the lack of
variability indicates that participants were very good at the task, the task lacked a level of
difficulty to demonstrate the differences between the conditions, or the visual gains in the current

145
study were not sufficient to perturb the participants. This lack of variability could be a
contributing factor to the inability to find indirect effects in the mediation models. Therefore, it is
suggested that the task involved in future studies be adjusted in order to have a higher variability
in the individual differences either by using more difficult tasks, different types of perturbations,
or multiple simultaneous perturbations.
There were several limitations due to the gains selected in the current work. The first is
the pattern of only increasing for both experiments. Patterns of decreasing and the mixture of
increasing and decreasing should be investigated. Additionally, the rate of change in the
introduction to new perturbation levels should be investigated. In the current study it is believed
that the lack of variance could be due to the length of the blocks of trials. Future work could
fluctuate gains at different intervals and different patterns to determine how these different
patterns could affect the rate of calibration and the ability to calibrate in general. In addition, it
would be beneficial to see if the level of perturbation before the post-test affects the level of the
carry-over effects. This experiment would allow for the ability to discuss the carry-over effects
seen in experiment 1. In essence, are the levels due to the changes in the environment or are they
similar to other calibration research where they are maintaining the calibration of the last level of
perturbation.
Another limitation was the inability to measure postural sway for the individual trials
within blocks. Due to the rapid nature of the trials, there were not enough data points to create a
SampEn analysis per trial. This inability to measure at the trial level did not allow for analyses of
changes of postural sway to be at the trial level. In essence, any changes that occurred within the
block of trials for calibration of the postural sway could not be analyzed. It could be that the
mediation model proposed in this work is at this level and not across blocks. This issue was not

146
due to the equipment but the parameters for calculating SampEn at this time. One way to try to
determine this would be to affect the gain amounts between trials and not simply between blocks.
Another measurement issue was the variable of total rotation. While this variable gave a
coarse measurement of total head movement within trials, it is conflated with the directionality
of head movement (i.e., the amount of changes in head rotation movements). In future work, this
variable should be collected with the amount of times the head changed direction. Additionally,
some participants occasionally started turning their head in the wrong direction in anticipation of
a target. These values greatly influenced the amount of total head movement. By including the
directionality of the head rotation, this could provide incites into these movements. The head
rotation variable might also be treated as a time-series variable also instead of reducing down to
a single number.
Lastly, while the secondary variables were not the focus of this experiment, the
significant main effects of head movement and simulator sickness as well as their interactions
with the primary variables of condition and block are note-worthy. Future analyses and research
should be conducted to determine if the relationship between condition and absolute error are
dependent on these measures or mediated by them.
3. Application of Current Work
The results of the current studies demonstrate calibration of the perception-action system
under different unstable short-timescale changes. This provide further evidence for perception-
action calibration mechanisms in terms of action-scaling from feedback. These results have
several applied research implications within the human factors field specifically with training.

147
Virtual environments are used for many applied training applications. While our day-to-
day environments have rapid changes and non-stable changes, many of these simulations only
have stable perturbations. Since these types of simulations provide some amount of confidence in
users of their abilities to engage in specific tasks under certain environments, they should be
representative of more ecologically valid situations.
Additionally, research into technical fields such as aviation should be investigating not
just the effects of a change in a specific variable but how changes within timeframe for that
variable can also affect performance. For example, for pilots, many aspects within an
environment change rapidly depending on speed, altitude, etc. However, most research is
conducted examining only one aspect at one level of change.
4. Conclusion
Similar to Littman (2011), the current studies demonstrate that the investigations of more
complex environments are necessary to understand the flexibility and calibration limits of the
perception-action system. While all conditions in the current studies demonstrated a level of
calibration, the effects of the different levels of perturbations can be seen in the performance of
the participants and the affects of unconscious motor movements such as postural sway. Lastly,
while the current study did not find the proposed mediated relationship, future research should
continue to investigate the outcomes in a relational approach.

148
REFERENCES
Adolph, K. E., Eppler, M. A., Marin, L., Weise, I. B., & Clearfield, M. W. (2000). Exploration in
the service of prospective control. Infant Behavior and Development, 23(3), 441-460.
Adolph, K. E., & Kretch, K. S. (2015). Gibson’s theory of perceptual learning. International Encyclopedia of the Social and Behavioral Sciences, 10, 127-134.
Altenhoff, B.M., Napieralski, P.E., Long, L.O., Bertrand, J.W., Pagano, C.C., Babu, S.V., & Davis, T.A. (2012). Effects of Visual and Haptic Feedback on Near-Field Depth Perception in an Immersive Virtual Environment. Proceedings of the ACM Symposium on Applied Perception, Los Angeles, CA, Aug 3-4, 2012.
Bertram, J., Moskaliuk, J., & Cress, U. (2015). Virtual training: Making reality work? Computers in Human Behavior, 43, 284-292.
Bhalla, M., & Proffitt, D.R. (1999). Visual–motor recalibration in geographical slant perception. Journal of Experimental Psychology: Human Perception and Performance, 25, 1076–1096.
Bingham, G. P. & Pagano, C. C. (1998). The necessity of a perception–action approach to definite distance perception: Monocular distance perception to guide reaching. Journal of Experimental Psychology: Human Perception and Performance, 24(1), 145–168.
Bingham, G. P., & Romack, J. L. (1999). The rate of adaptation to displacement prisms remains constant despite acquisition of rapid calibration. Journal of Experimental Psychology: Human Perception and Performance, 25(5), 1331-1346.
Bingham, G. P., & Stassen, M. G. (1994). Monocular distance information in optic flow from head movement. Ecological Psychology, 6, 219–238.
Bourgeois, J., Farnè, A., & Coello, Y. (2014). Costs and benefits of tool-use on the perception of reachable space. Acta psychologica, 148, 91-95.
Cesari, P. (2005). An invariant guiding stair descent by young and old adults. Experimental Aging Research, 31(4), 441-455.
Cesari, P., Formenti, F., & Olivato, P. (2003). A common perceptual parameter for stair climbing for children, young and old adults. Human movement science, 22(1), 111-124.
Clark, R. A., Bryant, A. L., Pua, Y., McCrory, P., Bennell, K., & Hunt, M. (2010). Validity and reliability of the Nintendo Wii Balance Board for assessment of standing balance. Gait & posture, 31(3), 307-310.
Cooper J, Siegfried K, Ahmed AA (2014) BrainBLoX: Brain and Biomechanics Lab in a Box Software (Version 1.0) [Software]. Available from: http://www.colorado.edu/neuromechanics/research/wii-balance-board-project
149
Cunningham, H. A., & Welch, R. B. (1994). Multiple concurrent visual-motor mappings: implications for models of adaptation. Journal of Experimental Psychology-Human Perception and Performance, 20(5), 987-999.
Cutting, J. E. (1986). Perception with an eye for motion. Cambridge, MA: MIT Press.
Day, B., Ebrahimi, E., Hartman, L.S., Pagano, C.C., Robb, A.C., & Babu, S.V. (submitted). Examining the Effects of Altered Avatars on Perception-Action in Virtual Reality.
Day, B., Ebrahimi, E., Hartman, L.S., Pagano, C.C., & Babu, S.V. (2017) Calibration to Tool
Use During Visually-Guided Reaching. Acta Psychologica. Day, B. M., Wagman, J. B., & Smith, P. J. (2015). Perception of maximum stepping and leaping
distance: Stepping affordances as a special case of leaping affordances. Acta Psychologica, 158, 26-35.
Dolezal, H. (1982). Living in a World Transformed. New York: Academic Press.
Ebrahimi, E., Altenhoff, B., Pagano, C.C., & Babu, S.V. (2015). Carryover Effects of Calibration to Visual and Proprioceptive Information on Near Field Distance Judgments in 3D User Interaction. Proceedings of the IEEE 10th Symposium on 3D User Interfaces, 97-104, March 23-24, Arles, France.
Ebrahimi, E., Babu, S. V., Pagano, C. C., & Jörg, S. (2016). An empirical evaluation of visuo-haptic feedback on physical reaching behaviors during 3D interaction in real and immersive virtual environments. ACM Transactions on Applied Perception (TAP), 13, 19:1-19:21.
Fajen, B. R. (2007). Affordance-based control of visually guided action. Ecological Psychology, 19(4), 383-410.
Fajen, B. R., Riley, M. A., & Turvey, M. T. (2009). Information, affordances, and the control of action in sport. International Journal of Sport Psychology, 40(1), 79.
Fajen, B. R., & Warren, W. H. (2003). Behavioral dynamics of steering, obstable avoidance, and route selection. Journal of Experimental Psychology: Human Perception and Performance, 29(2), 343.
Frith, C. D., Blakemore, S. J., & Wolpert, D. M. (2000). Abnormalities in the awareness and control of action. Phil. Trans. R. Soc. Lond. B, 355(1404), 1771-1788.
Ganier, F., Hoareau, C., & Tisseau, J. (2014). Evaluation of procedural learning transfer from a virtual environment to a real situation: a case study on tank maintenance training. Ergonomics, 57(6), 828-843.

150
Gianaros, P. J., Muth, E. R., Mordkoff, J. T., Levine, M. E., & Stern, R. M. (2001). A questionnaire for the assessment of the multiple dimensions of motion sickness. Aviation, space, and environmental medicine, 72(2), 115.
Gibson, E.J. (1963). Perceptual Learning. Annual Review of Psychology, 14, 29-56.
Gibson, E. J. (1969). Principles of perceptual learning and development.
Gibson, E. J., & Pick, A. D. (2000). An ecological approach to perceptual learning and development. Oxford University Press, USA.
Gibson, J. J. (1959). Perception as a function of stimulation. In S. Koch (Ed.), Psychology: A study of a science (Vol. 1, pp. 456-501). New York: McGraw-Hill.
Gibson, J. J. (1966). The senses considered as perceptual systems. New York: Houghton Mifflin.
Gibson, J. J. (1976/1982) The theory of affordances and the design of the environment. Paper presented at the Symposium on Perception in Architecture, American Society for Esthetics, Toronto, October, 1976. Republished in E. Reed and R. Jones (eds.) Reasons for realism: Selected essays of James J. Gibson (pp. 413-418), Hillsdale, NJ: Lawrence Erlbaum Associates.
Gibson, J. J. (1979). The ecological approach to visual perception. Boston: Houghton Mifflin.
Gibson, J.J. & Gibson, E. J. (1955). Perceptual learning: Differentiation or enrichment? Psychological Review, 62(1), 32-40.
Gomer, J. A., Dash, C., Moore, K. S., & Pagano, C. C. (2009). Using Radial Outflow to provide Depth Information During Teleoperation. Presence: Teleoperators and Virtual Environments, 18, 304-320.
Hackney, A. L., & Cinelli, M. E. (2013). Young and older adults use body-scaled information during a non-confined aperture crossing task. Experimental brain research, 225(3), 419-429.
Harris, C. S. (1965). Perceptual adaptation to inverted, reversed, and displaced vision. Psychological Review, 72(6), 419-444.
Heft, H. (2003). Affordances, dynamic experience, and the challenge of reification. Ecological Psychology, 15(2), 149-180.
Hyltander, A., Liljegren, E., Rhodin, P. H., & Lönroth, H. (2002). The transfer of basic skills learned in a laparoscopic simulator to the operating room. Surgical Endoscopy and Other Interventional Techniques, 16(9), 1324-1328.
Ishak, S., Franchak, J. M., & Adolph, K. E. (2014). Perception-action development from infants to adults: Perceiving affordances for reaching through openings. Journal of Experimental Child Psychology, 117, 92-105.

151
Jacobs, D. M., Vaz, D. V., & Michaels, C. F. (2012). The learning of visually guided action: An information-space analysis of pole balancing. Journal of Experimental Psychology: Human Perception and Performance, 38(5), 1215–1227.
Kantz, H., & Schreiber, T. (2004). Nonlinear time series analysis (Vol. 7). Cambridge university press.
Kennedy, R., & Stanney, K. (1996). Postural instability induced by virtual reality exposure: development of a certification protocol. International Journal of Human-Computer Interaction, 8(1), 25-47.
Kinsella, A. J. (2014). The effect of 0.2 Hz and 1.0 Hz frequency and 100 ms and 20-100 ms
amplitude of latency on simulatory sickness in a head mounted display (Master Thesis, Clemson University).
Konczak, J., Meeuwsen, H. J., & Cress, M. E. (1992). Changing affordances in stair climbing:
The perception of maximum climbability in young and older adults. Journal of Experimental Psychology: Human Perception and Performance, 18(3), 691.
Littman, E. M. (2009). Prospective Control: Effect of Exploratory-task-generated-motion on Adaptation in Real and Virtual Environments. Unpublished Master’s Thesis, Miami University, Oxford, OH.
Littman, E. M. (2011). Adaptation to Simultaneous Multi-Dimensional Distortions Unpublished Doctoral Dissertation, Miami University, Oxford, OH.
Lombardo, T. J. (1987). The reciprocity of perceiver and environment: The evolution of James J. Gibson’s ecological psychology. Hillsdale, NJ: Lawrence Erlbaum Associates
Larrue, F., Sauzeon, H., Wallet, G., Foloppe, D., Cazalets, J. R., Gross, C., & N'Kaoua, B. (2014). Influence of body-centered information on the transfer of spatial learning from a virtual to a real environment. Journal of Cognitive Psychology, 26(8), 906-918.
Mantel, B., Stoffregen, T. A., Campbell, A., & Bardy, B. G. (2015). Exploratory movement generates higher-order information that is sufficient for accurate perception of scaled egocentric distance. PloS one, 10(4), e0120025.
Maravita, A., & Iriki, A. (2004). Tools for the body (schema). Trends in cognitive sciences, 8(2), 79-86.
Mark, L. S. (1987). Eyeheight-scaled information about affordances: a study of sitting and stair climbing. Journal of Experimental Psychology: Human Perception and Performance, 13(3), 361- ?.
Mark, L.S., Balliett, J.A., Craver, K.D., Douglas, S.D., & Fox, T. (1990). What an Actor Must Do in order to Perceive the Affordance of Sitting. Ecological Psychology, 2(4), 325-366.
152
Michaels, C. F., & Carello, C. (1981). Direct perception (pp. 1-208). Englewood Cliffs, NJ: Prentice-Hall.
Napieralski, P.E., Altenhoff, B.M., Bertrand, J.W., Long, L.O., Babu, S.V., Pagano, C.C., Kern, J. & Davis, T.A. (2011). Comparing Near Field Distance Perception in Real and Virtual Environments Using Both Verbal and Action Responses. ACM Transactions on Applied Perception, 8(3), 18:1-18:19.
Newell, K. M. (1998). Degrees of freedom and the development of postural center of pressure profiles. Applications of nonlinear dynamics to developmental process modeling, 63-84.
O’Neill, S. M. & Russell, M. K. (2017). Impact of postural stability and modality on the perception of passage and surface climbing. Ecological Psychology, 29(1), 54-68.
Pan, Coats & Bingham (2014). Journal of Experimental Psychology: Human Perception and Performance, 40(1), 404-415.
Pagano, C. C., & Bingham, G. P. (1998). Comparing measures of monocular distance perception: Verbal and reaching errors are not correlated. Journal of Experimental Psychology: Human Perception and Performance, 24(4), 1037.
Pagano, C. C., Grutzmacher, R. P., & Jenkins, J. C. (2001). Comparing verbal and reaching responses to visually perceived egocentric distances. Ecological Psychology, 13(3), 197-226.
Pagano, C. C., & Isenhower, R. W. (2008). Expectation affects verbal judgments but not reaches to visually perceived egocentric distances. Psychonomic Bulletin & Review, 15(2), 437-442.
Pagano, C. C., & Turvey, M. T. (1998). Eigenvectors of the inertia tensor and perceiving the orientation of limbs and objects. Journal of Applied Biomechanics, 14, 331-359.
Petrucci, M. N., Horn, G. P., Rosengren, K. S., & Hsiao-Wecksler, E. T. (2016). Inaccuracy of affordance judgments for firefighters wearing personal protective equipment. Ecological Psychology, 28(2), 108-126.
Pincus, S. M. (1991). Approximate entropy as a measure of system complexity. Proceedings of the National Academy of Sciences, 88(6), 2297-2301.
Proffitt, D.R., Stefanucci, J.K., Banton, T., & Epstein, W. (2003). The role of effort in distance perception. Psychological Science, 14, 106–112.
Ramdani, S., Seigle, B., Lagarde, J., Bouchara, F., & Bernard, P. L. (2009). On the use of sample entropy to analyze human postural sway data. Medical Engineering and Physics, 31(8), 1023-1031.
Reason, J. T., & Brand, J. J. (1975). Motion sickness. London: Academic Press.
153
Reed, E. S. (1996). Encountering the world: Toward an ecological psychology. Oxford University Press.
Regian, J. W. (1997). Virtual reality for training: Evaluating transfer. In Virtual Reality, Training’s Future? Springer US, 31-40.
Richman, J. S., & Moorman, J. R. (2000). Physiological time-series analysis using approximate entropy and sample entropy. American Journal of Physiology-Heart and Circulatory Physiology, 278(6), H2039-H2049.
Rose, F. D., Attree, E. A., Brooks, B. M., Parslow, D. M., & Penn, P. R. (2000). Training in virtual environments: transfer to real world tasks and equivalence to real task training. Ergonomics, 43(4), 494-511.
Salavati, M., Hadian, M. R., Mazaheri, M., Negahban, H., Ebrahimi, I., Talebian, S., ... & Parnianpour, M. (2009). Test–retest reliabty of center of pressure measures of postural stability during quiet standing in a group with musculoskeletal disorders consisting of low back pain, anterior cruciate ligament injury and functional ankle instability. Gait & posture, 29(3), 460-464.
Sakurai R, Fujiwara Y, Ishihara M, Higuchi T, Uchida H, Imanaka K (2013) Age-related self-overestimation of step-over ability in healthy older adults and its relationship to fall risk. BMC Geriatr 13:44
Scaglioni-Solano, P., & Aragón-Vargas, L. F. (2014). Validity and reliability of the Nintendo Wii Balance Board to assess standing balance and sensory integration in highly functional older adults. International Journal of Rehabilitation Research, 37(2), 138-143.
Schnall, S., Zadra, J.R., & Proffitt, D.R. (2010). Direct evidence for the economy of action: Glucose and the perception of geographical slant. Perception, 39, 464–482.
Scott, S., & Gray, R. (2010). Switching tools: Perceptual-motor recalibration to weight changes. Experimental Brain Research, 201(2), 177–189.
Stoffregen, T. A., Chen, F. C., Varlet, M., Alcantara, C., & Bardy, B. G. (2013). Getting your sea legs. PLoS One, 8(6), e66949.
Stoffregen, T. A., & Mantel, B. (2015). Exploratory movement and affordances in design. AI EDAM, 29(3), 257-265.
Stoffregen, T. A., Yang, C. M., & Bardy, B. G. (2005). Affordance judgments and nonlocomotor body movement. Ecological Psychology, 17(2), 75-104.
Turvey, M. T. (1992). Affordances and prospective control: An outline of the ontology. Ecological Psychology, 9(3), 173-187.
154
Turvey, M. T., & Shaw, R. E. (1995). Toward an ecological physics and a physical psychology. In R. Solso & D. Massaro (Eds.), The science of the mind: 2001 and beyond (pp. 144-169). Oxford: Oxford University Press.
Turvey, M. T., Shaw, R. E., Reed, E. S. & Mace, W. M. (1981) Ecological laws of perceiving and acting: In reply to Fodor and Pylyshyn (1981). Cognition, 9(3), 237–304.
Van Hedel, H. J., & Dietz, V. (2004). Obstacle avoidance during human walking: Effects of biomechanical constraints on performance. Archives of Physical Medicine and Rehabilitation, 85(6), 972–979.
Wagman, J.B., Shockley, K., Riley, M.A. & Turvey, M.T. (2001). Attunement, calibration, and exploration in fast haptic perceptual learning. Journal of Motivational Behavior, 33, 323-327.
Warren, W. H. (2006). The dynamics of perception and action. Psychological Review, 113(2), 358-390.
Warren, W. H. (1995). Constructing an econiche. In Flach, J., Hancock, P., Caird, J., & Vicente, K. (Eds.). Global Perspectives on the Ecology of Human-Machine Systems (pp. 210-237). Hillsdale, NJ: Lawrence Erlbaum Associates.
Warren Jr, W. H., & Whang, S. (1987). Visual guidance of walking through apertures: body-scaled information for affordances. Journal of Experimental Psychology: Human Perception and Performance, 13(3), 371.
Weaver, T. B., Ma, C., & Laing, A. C. (2017). Use of the Nintendo Wii balance board for studying standing static balance control: technical considerations, force-plate congruency, and the effect of battery life. Journal of applied biomechanics, 33(1), 48-55.
Welch, R. B., Choe, C. S., & Neinrich, D. R. (1974). Evidence for a three-component model of prism adaptation. Journal of Experimental Psychology, 103(4), 700-705.
Witt, J. K., Proffitt, D. R., & Epstein, W. (2005). Tool use affects perceived distance, but only when you intend to use it. Journal of experimental psychology: Human perception and performance, 31(5), 880.
Withagen, R., & Michaels, C. F. (2004). Transfer of calibration in length perception by dynamic touch. Percept Psychophysics, 66(8), 1282–1292.
Withagen, R. & Michaels, C.F. (2005). The role of feedback information for calibration and attunement in perceiving length by dynamic touch. Journal of Experimental Psychology: Human Perception and Performance, 31, 1379-1390.
Withagen, R., & Michaels, C. F. (2007). Transfer of Calibration Between Length and Sweet-Spot Perception by Dynamic Touch. Ecological Psychology, 19(1), 1–19.

155
Yonas, A., & Hartman, B. (1993). Perceiving the Affordance of Contact in Four and Five-Month-Old Infants. Child Development, 64(1), 298-308.
Yu, Y., Bardy, B.G., & Stoffregen, T.A. (2011). Influences of head and torso movement before and during affordance perception. Journal of Motor Behavior 43(1), 45–54.
Yu, Y., & Stoffregen, T.A. (2012). Postural and locomotor contributions to affordance perception. Journal of Motor Behavior, 44(5), 305–311.
Zhao, H., & Warren, W. H. (2015). On-line and model-based approaches to the visual control of action. Vision Research, 110, 190-202.

156
APPENDIX A. Experiment 1: Descriptive Statistics for Collected Predictors Experimental Blocks
PREDICTOR N MINIMUM MAXIMUM MEAN STD.
DEVIATION TOTAL ROTATION (DEGREES)
3018 40.92 431.20 84.37 22.41
MAX ROTATION (DEGREES)
3018 40.92 139.65 73.72 14.48
ROTATIONAL DIFFERENCE (DEGREES)
3018 0.00 26.12 5.19 4.14
SSQ 3018 0.00 19.00 2.86 3.59 ML POSTURAL SWAY (ENTROPY)
3018 0.02 0.16 0.07 0.02
AP POSTURAL SWAY (ENTROPY)
3018 0.02 0.13 0.06 0.02

157
APPENDIX B. Experiment 1: Descriptive Statistics for Collected Predictors Pre-/Post-Test Blocks
PREDICTOR N MINIMUM MAXIMUM MEAN STD. DEVIATION
MSAQ PRE-TEST 1008 15.00 38.00 18.42 4.25 MSAQ POST-TEST 1008 16.00 71.00 22.76 10.55 TOTAL ROTATION (DEGREES)
1008 44.23 207.63 77.56 15.48
MAX ROTATION (DEGREES)
1008 39.91 108.18 70.37 13.93
ROTATIONAL DIFFERENCE (DEGREES)
1008 0.00 27.08 7.18 5.41
SSQ 1008 0.00 16.00 1.81 2.99
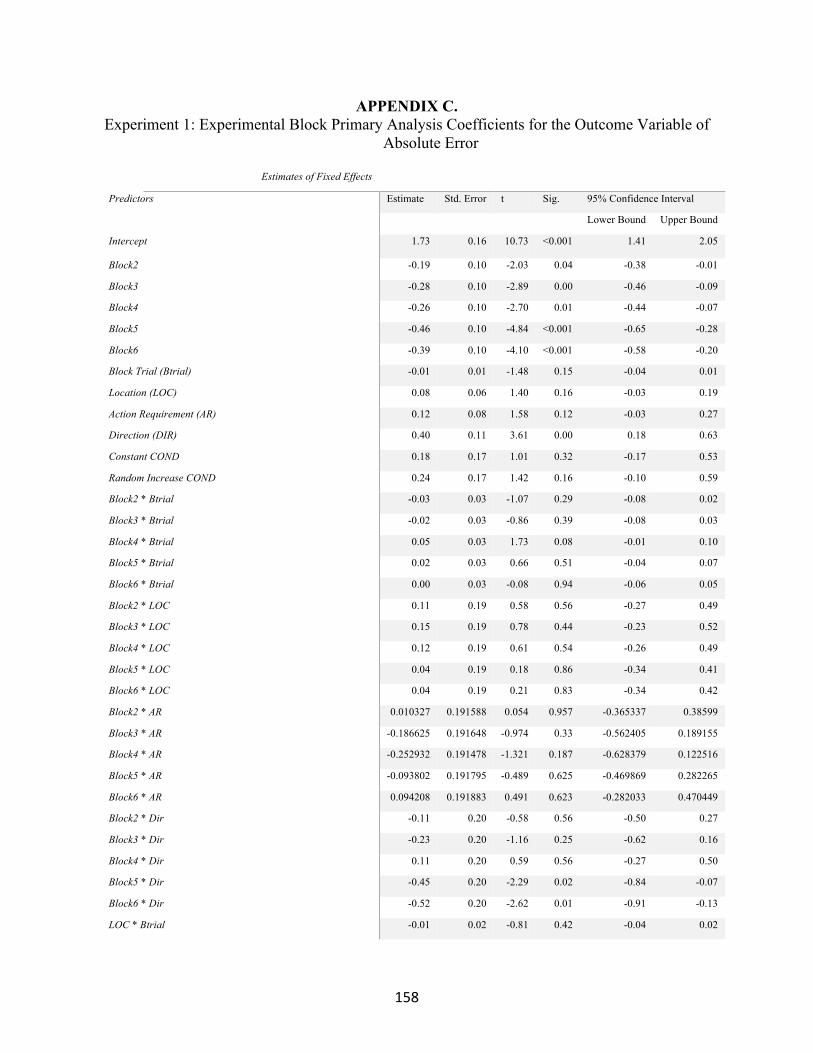
158
APPENDIX C. Experiment 1: Experimental Block Primary Analysis Coefficients for the Outcome Variable of
Absolute Error
Estimates of Fixed Effects
Predictors Estimate Std. Error t Sig. 95% Confidence Interval
Lower Bound Upper Bound
Intercept 1.73 0.16 10.73 <0.001 1.41 2.05
Block2 -0.19 0.10 -2.03 0.04 -0.38 -0.01
Block3 -0.28 0.10 -2.89 0.00 -0.46 -0.09
Block4 -0.26 0.10 -2.70 0.01 -0.44 -0.07
Block5 -0.46 0.10 -4.84 <0.001 -0.65 -0.28
Block6 -0.39 0.10 -4.10 <0.001 -0.58 -0.20
Block Trial (Btrial) -0.01 0.01 -1.48 0.15 -0.04 0.01
Location (LOC) 0.08 0.06 1.40 0.16 -0.03 0.19
Action Requirement (AR) 0.12 0.08 1.58 0.12 -0.03 0.27
Direction (DIR) 0.40 0.11 3.61 0.00 0.18 0.63
Constant COND 0.18 0.17 1.01 0.32 -0.17 0.53
Random Increase COND 0.24 0.17 1.42 0.16 -0.10 0.59
Block2 * Btrial -0.03 0.03 -1.07 0.29 -0.08 0.02
Block3 * Btrial -0.02 0.03 -0.86 0.39 -0.08 0.03
Block4 * Btrial 0.05 0.03 1.73 0.08 -0.01 0.10
Block5 * Btrial 0.02 0.03 0.66 0.51 -0.04 0.07
Block6 * Btrial 0.00 0.03 -0.08 0.94 -0.06 0.05
Block2 * LOC 0.11 0.19 0.58 0.56 -0.27 0.49
Block3 * LOC 0.15 0.19 0.78 0.44 -0.23 0.52
Block4 * LOC 0.12 0.19 0.61 0.54 -0.26 0.49
Block5 * LOC 0.04 0.19 0.18 0.86 -0.34 0.41
Block6 * LOC 0.04 0.19 0.21 0.83 -0.34 0.42
Block2 * AR 0.010327 0.191588 0.054 0.957 -0.365337 0.38599
Block3 * AR -0.186625 0.191648 -0.974 0.33 -0.562405 0.189155
Block4 * AR -0.252932 0.191478 -1.321 0.187 -0.628379 0.122516
Block5 * AR -0.093802 0.191795 -0.489 0.625 -0.469869 0.282265
Block6 * AR 0.094208 0.191883 0.491 0.623 -0.282033 0.470449
Block2 * Dir -0.11 0.20 -0.58 0.56 -0.50 0.27
Block3 * Dir -0.23 0.20 -1.16 0.25 -0.62 0.16
Block4 * Dir 0.11 0.20 0.59 0.56 -0.27 0.50
Block5 * Dir -0.45 0.20 -2.29 0.02 -0.84 -0.07
Block6 * Dir -0.52 0.20 -2.62 0.01 -0.91 -0.13
LOC * Btrial -0.01 0.02 -0.81 0.42 -0.04 0.02

159
AR * Btrial 0.02 0.02 1.28 0.20 -0.01 0.05
DIR * Btrial 0.00 0.02 -0.16 0.87 -0.04 0.03
LOC * AR 0.14 0.11 1.24 0.22 -0.08 0.36
DIR * AR 0.05 0.12 0.46 0.65 -0.18 0.29
LOC * DIR -0.34 0.12 -2.92 0.00 -0.56 -0.11
Block2 * Random Increase COND -0.41 0.23 -1.75 0.08 -0.87 0.05
Block2 * Constant COND 0.07 0.23 0.29 0.77 -0.39 0.53
Block3 * Random Increase COND -0.10 0.23 -0.45 0.66 -0.56 0.35
Block3 * Constant COND -0.01 0.23 -0.04 0.97 -0.47 0.45
Block4 * Random Increase COND -0.09 0.23 -0.39 0.70 -0.55 0.37
Block4 * Constant COND -0.18 0.23 -0.76 0.45 -0.64 0.28
Block5 * Random Increase COND -0.59 0.23 -2.51 0.01 -1.05 -0.13
Block5 * Constant COND -0.31 0.23 -1.35 0.18 -0.77 0.14
Block6 * Random Increase COND 0.04 0.23 0.17 0.87 -0.42 0.50
Block6 * Constant COND -0.06 0.23 -0.27 0.79 -0.52 0.40
Random Increase COND * Btrial 0.03 0.02 1.13 0.26 -0.02 0.08
Constant COND * Btrial -0.01 0.02 -0.30 0.77 -0.06 0.04
Random Increase COND * LOC -0.03 0.14 -0.21 0.83 -0.30 0.24
Constant COND * LOC -0.13 0.14 -0.97 0.33 -0.40 0.13
Random Increase COND * AR -0.03 0.19 -0.18 0.86 -0.42 0.35
Constant COND * AR -0.12 0.19 -0.63 0.53 -0.50 0.26
Random Increase COND * DIR 0.05 0.28 0.18 0.86 -0.52 0.62
Constant COND * DIR -0.06 0.28 -0.21 0.84 -0.63 0.51
Block2 * LOC * Btrial -0.03 0.06 -0.50 0.62 -0.14 0.08
Block3 * LOC * Btrial -0.13 0.06 -2.23 0.03 -0.24 -0.02
Block4 * LOC * Btrial -0.08 0.06 -1.49 0.14 -0.19 0.03
Block5 * LOC * Btrial -0.01 0.06 -0.26 0.79 -0.12 0.10
Block6 * LOC * Btrial -0.07 0.06 -1.25 0.21 -0.18 0.04
Block2 * AR * Btrial -0.11 0.06 -1.99 0.05 -0.22 0.00
Block3 * AR * Btrial -0.03 0.06 -0.48 0.63 -0.14 0.08
Block4 * AR * Btrial 0.00 0.06 -0.07 0.94 -0.11 0.11
Block5 * AR * Btrial -0.07 0.06 -1.29 0.20 -0.18 0.04
Block6 * AR * Btrial -0.07 0.06 -1.22 0.22 -0.18 0.04
Block2 * DIR * Btrial 0.04 0.06 0.66 0.51 -0.07 0.15
Block3 * DIR * Btrial 0.01 0.06 0.23 0.82 -0.10 0.13
Block4 * DIR * Btrial -0.05 0.06 -0.87 0.38 -0.16 0.06
Block5 * DIR * Btrial 0.01 0.06 0.10 0.92 -0.11 0.12
Block6 * DIR * Btrial 0.02 0.06 0.27 0.79 -0.10 0.13
Block2 * LOC * AR -0.42 0.38 -1.09 0.28 -1.17 0.33
Block3 * LOC * AR -0.07 0.38 -0.18 0.86 -0.82 0.68

160
Block4 * LOC * AR -0.45 0.38 -1.17 0.24 -1.20 0.30
Block5 * LOC * AR -0.09 0.38 -0.22 0.82 -0.84 0.67
Block6 * LOC * AR -0.39 0.38 -1.01 0.31 -1.14 0.37
Block2 * LOC * DIR 0.28 0.39 0.70 0.48 -0.49 1.05
Block3 * LOC * DIR -0.08 0.39 -0.21 0.83 -0.86 0.69
Block4 * LOC * DIR 0.52 0.39 1.34 0.18 -0.25 1.29
Block5 * LOC * DIR 0.58 0.39 1.48 0.14 -0.19 1.35
Block6 * LOC * DIR -0.35 0.40 -0.89 0.37 -1.13 0.43
Block2 * DIR * AR -0.25 0.40 -0.63 0.53 -1.02 0.53
Block3 * DIR * AR -0.52 0.40 -1.31 0.19 -1.29 0.26
Block4 * DIR * AR -0.48 0.39 -1.21 0.23 -1.25 0.29
Block5 * DIR * AR -0.36 0.40 -0.91 0.36 -1.13 0.42
Block6 * DIR * AR -0.81 0.40 -2.05 0.04 -1.59 -0.03
LOC * DIR * Btrial 0.03 0.03 0.95 0.34 -0.03 0.10
DIR * AR * Btrial 0.14 0.03 4.16 0.00 0.07 0.21
LOC * DIR * AR 0.39 0.23 1.68 0.09 -0.06 0.84
Block2 * Random Increase COND * Btrial -0.03 0.07 -0.45 0.66 -0.16 0.10
Block2 * Constant COND * Btrial -0.03 0.07 -0.46 0.65 -0.16 0.10
Block3 * Random Increase COND * Btrial -0.06 0.07 -0.84 0.40 -0.19 0.08
Block3 * Constant COND * Btrial 0.04 0.07 0.53 0.60 -0.10 0.17
Block4 * Random Increase COND * Btrial 0.06 0.07 0.82 0.41 -0.08 0.19
Block4 * Constant COND * Btrial 0.08 0.07 1.13 0.26 -0.06 0.21
Block5 * Random Increase COND * Btrial -0.07 0.07 -1.09 0.28 -0.21 0.06
Block5 * Constant COND * Btrial -0.02 0.07 -0.30 0.77 -0.15 0.11
Block6 * Random Increase COND * Btrial -0.11 0.07 -1.58 0.12 -0.24 0.03
Block6 * Constant COND * Btrial 0.05 0.07 0.78 0.44 -0.08 0.19
Block2 * Random Increase COND * LOC 0.02 0.47 0.04 0.97 -0.90 0.94
Block2 * Constant COND * LOC 0.06 0.47 0.13 0.89 -0.86 0.99
Block3 * Random Increase COND * LOC 0.08 0.47 0.18 0.86 -0.83 1.00
Block3 * Constant COND * LOC -0.01 0.47 -0.01 0.99 -0.93 0.91
Block4 * Random Increase COND * LOC -0.86 0.47 -1.85 0.07 -1.78 0.05
Block4 * Constant COND * LOC -0.22 0.47 -0.47 0.64 -1.14 0.70
Block5 * Random Increase COND * LOC -0.19 0.47 -0.40 0.69 -1.11 0.73
Block5 * Constant COND * LOC 0.70 0.47 1.49 0.14 -0.22 1.62
Block6 * Random Increase COND * LOC 0.12 0.47 0.25 0.81 -0.80 1.03 Block6 * Constant COND * LOC 0.61 0.47 1.30 0.20 -0.31 1.54
Block2 * Random Increase COND * DIR 0.50 0.49 1.02 0.31 -0.46 1.46
Block2 * Constant COND * DIR 0.55 0.48 1.14 0.26 -0.40 1.49
Block3 * Random Increase COND * DIR 0.15 0.49 0.30 0.76 -0.81 1.11
Block3 * Constant COND * DIR 0.83 0.48 1.71 0.09 -0.12 1.77

161
Block4 * Random Increase COND * DIR 0.24 0.49 0.49 0.62 -0.72 1.20
Block4 * Constant COND * DIR 0.39 0.48 0.82 0.42 -0.55 1.33
Block5 * Random Increase COND * DIR 0.62 0.49 1.26 0.21 -0.34 1.58
Block5 * Constant COND * DIR 0.43 0.48 0.90 0.37 -0.51 1.38
Block6 * Random Increase COND * DIR 0.06 0.49 0.13 0.90 -0.90 1.03
Block6 * Constant COND * DIR -0.08 0.48 -0.17 0.87 -1.02 0.87
Random Increase COND * LOC * Btrial 0.02 0.04 0.56 0.58 -0.06 0.10
Constant COND * LOC * Btrial 0.01 0.04 0.30 0.77 -0.07 0.09
Random Increase COND * AR * Btrial -0.04 0.04 -1.04 0.30 -0.12 0.04
Constant COND * AR * Btrial -0.02 0.04 -0.51 0.61 -0.10 0.06
Random Increase COND * DIR * Btrial 0.02 0.03 0.63 0.53 -0.04 0.07
Constant COND * DIR * Btrial -0.05 0.03 -1.79 0.07 -0.11 0.00
Control COND * DIR * Btrial 0.03 0.03 1.04 0.30 -0.03 0.09
Random Increase COND * LOC * AR -0.32 0.27 -1.18 0.24 -0.86 0.21
Constant COND * LOC * AR -0.29 0.27 -1.07 0.29 -0.83 0.24
Random Increase COND * LOC * DIR -0.27 0.29 -0.94 0.35 -0.83 0.29
Constant COND * LOC * DIR -0.30 0.28 -1.07 0.29 -0.86 0.25
Random Increase COND * DIR * AR -0.11 0.29 -0.38 0.71 -0.68 0.46
Constant COND * DIR * AR 0.42 0.29 1.46 0.15 -0.14 0.99
Block2 * LOC * DIR * AR 0.24 0.79 0.30 0.76 -1.31 1.79
Block3 * LOC * DIR * AR -0.40 0.79 -0.50 0.61 -1.96 1.16
Block4 * LOC * DIR * AR -0.05 0.78 -0.06 0.95 -1.59 1.49
Block5 * LOC * DIR * AR 0.86 0.79 1.09 0.28 -0.69 2.41
Block6 * LOC * DIR * AR 0.31 0.80 0.39 0.69 -1.25 1.88
LOC * DIR * AR * Btrial 0.01 0.07 0.14 0.89 -0.12 0.14
Block2 * LOC * AR * Btrial -0.07 0.11 -0.62 0.53 -0.29 0.15
Block3 * LOC * AR * Btrial 0.13 0.11 1.20 0.23 -0.09 0.36
Block4 * LOC * AR * Btrial 0.12 0.11 1.03 0.30 -0.11 0.34
Block5 * LOC * AR * Btrial 0.12 0.11 1.04 0.30 -0.10 0.34
Block6 * LOC * AR * Btrial 0.00 0.11 0.02 0.99 -0.22 0.22
Block2 * LOC * DIR * Btrial 0.07 0.12 0.57 0.57 -0.16 0.29
Block3 * LOC * DIR * Btrial -0.18 0.12 -1.53 0.13 -0.40 0.05
Block4 * LOC * DIR * Btrial -0.23 0.12 -1.98 0.05 -0.46 0.00
Block5 * LOC * DIR * Btrial -0.03 0.12 -0.29 0.77 -0.26 0.19
Block6 * LOC * DIR * Btrial -0.10 0.12 -0.88 0.38 -0.33 0.13
Block2 * DIR * AR * Btrial 0.02 0.12 0.13 0.90 -0.21 0.24
Block3 * DIR * AR * Btrial 0.14 0.12 1.21 0.23 -0.09 0.38
Block4 * DIR * AR * Btrial 0.06 0.12 0.50 0.62 -0.17 0.29
Block5 * DIR * AR * Btrial 0.14 0.12 1.18 0.24 -0.09 0.36
Block6 * DIR * AR * Btrial 0.15 0.12 1.29 0.20 -0.08 0.38

162
Block2 * Random Increase COND * LOC * Btrial -0.01 0.14 -0.06 0.95 -0.28 0.26
Block2 * Constant COND * LOC * Btrial 0.06 0.14 0.46 0.65 -0.21 0.34
Block3 * Random Increase COND * LOC * Btrial -0.01 0.14 -0.06 0.96 -0.28 0.26
Block3 * Constant COND * LOC * Btrial -0.10 0.14 -0.69 0.49 -0.37 0.18
Block4 * Random Increase COND * LOC * Btrial -0.02 0.14 -0.18 0.86 -0.30 0.25
Block4 * Constant COND * LOC * Btrial 0.16 0.14 1.20 0.23 -0.11 0.43
Block5 * Random Increase COND * LOC * Btrial -0.12 0.14 -0.91 0.37 -0.39 0.15
Block5 * Constant COND * LOC * Btrial 0.02 0.14 0.13 0.90 -0.25 0.29
Block6 * Random Increase COND * LOC * Btrial -0.20 0.14 -1.45 0.15 -0.47 0.07
Block6 * Constant COND * LOC * Btrial -0.07 0.14 -0.54 0.59 -0.34 0.20
Block2 * Random Increase COND * AR * Btrial 0.41 0.14 2.96 0.00 0.14 0.67
Block2 * Constant COND * AR * Btrial 0.04 0.14 0.29 0.77 -0.23 0.31
Block3 * Random Increase COND * AR * Btrial 0.16 0.14 1.19 0.24 -0.11 0.43
Block3 * Constant COND * AR * Btrial 0.07 0.14 0.53 0.60 -0.20 0.34
Block4 * Random Increase COND * AR * Btrial 0.09 0.14 0.64 0.53 -0.18 0.36
Block4 * Constant COND * AR * Btrial -0.04 0.14 -0.33 0.74 -0.31 0.22
Block5 * Random Increase COND * AR * Btrial 0.20 0.14 1.47 0.14 -0.07 0.47
Block5 * Constant COND * AR * Btrial -0.07 0.14 -0.48 0.63 -0.33 0.20
Block6 * Random Increase COND * AR * Btrial -0.06 0.14 -0.44 0.66 -0.33 0.21
Block6 * Constant COND * AR * Btrial -0.07 0.14 -0.49 0.63 -0.33 0.20
Block2 * Random Increase COND * DIR * Btrial 0.06 0.14 0.45 0.66 -0.22 0.34
Block2 * Constant COND * DIR * Btrial -0.05 0.14 -0.39 0.70 -0.33 0.22
Block3 * Random Increase COND * DIR * Btrial 0.13 0.14 0.90 0.37 -0.15 0.41
Block3 * Constant COND * DIR * Btrial 0.12 0.14 0.86 0.39 -0.16 0.40
Block4 * Random Increase COND * DIR * Btrial 0.13 0.14 0.93 0.36 -0.15 0.41
Block4 * Constant COND * DIR * Btrial 0.14 0.14 1.00 0.32 -0.14 0.42
Block5 * Random Increase COND * DIR * Btrial 0.19 0.14 1.34 0.18 -0.09 0.47
Block5 * Constant COND * DIR * Btrial 0.19 0.14 1.34 0.18 -0.09 0.46
Block6 * Random Increase COND * DIR * Btrial 0.13 0.14 0.93 0.35 -0.15 0.42
Block6 * Constant COND * DIR * Btrial 0.16 0.14 1.12 0.26 -0.12 0.43
Block2 * Random Increase COND * LOC * AR 1.86 0.94 1.98 0.05 0.02 3.70
Block2 * Constant COND * LOC * AR -1.76 0.94 -1.88 0.06 -3.60 0.08
Block3 * Random Increase COND * LOC * AR 0.29 0.94 0.31 0.76 -1.54 2.12
Block3 * Constant COND * LOC * AR -1.22 0.94 -1.30 0.19 -3.06 0.62
Block4 * Random Increase COND * LOC * AR 0.54 0.94 0.58 0.57 -1.29 2.37
Block4 * Constant COND * LOC * AR -1.61 0.94 -1.72 0.09 -3.45 0.22
Block5 * Random Increase COND * LOC * AR 1.75 0.94 1.87 0.06 -0.09 3.59
Block5 * Constant COND * LOC * AR -1.22 0.94 -1.30 0.19 -3.05 0.62
Block6 * Random Increase COND * LOC * AR 1.04 0.94 1.11 0.27 -0.80 2.88
Block6 * Constant COND * LOC * AR -1.02 0.94 -1.09 0.28 -2.87 0.82

163
Block2 * Random Increase COND * LOC * DIR 0.58 0.98 0.58 0.56 -1.36 2.51
Block2 * Constant COND * LOC * DIR 0.63 0.96 0.65 0.51 -1.26 2.51
Block3 * Random Increase COND * LOC * DIR 0.08 0.98 0.08 0.94 -1.84 2.00
Block3 * Constant COND * LOC * DIR 1.10 0.96 1.14 0.25 -0.79 2.99
Block4 * Random Increase COND * LOC * DIR -0.34 0.98 -0.35 0.73 -2.26 1.59
Block4 * Constant COND * LOC * DIR 0.15 0.96 0.15 0.88 -1.74 2.03
Block5 * Random Increase COND * LOC * DIR 1.09 0.98 1.11 0.27 -0.83 3.00
Block5 * Constant COND * LOC * DIR 0.46 0.96 0.47 0.64 -1.43 2.34
Block6 * Random Increase COND * LOC * DIR 0.96 0.99 0.98 0.33 -0.97 2.89
Block6 * Constant COND * LOC * DIR 0.35 0.98 0.36 0.72 -1.57 2.27
Block2 * Random Increase COND * DIR * AR -0.71 0.99 -0.71 0.48 -2.65 1.24
Block2 * Constant COND * DIR * AR -0.82 0.97 -0.84 0.40 -2.72 1.09
Block3 * Random Increase COND * DIR * AR -0.98 0.99 -0.99 0.32 -2.92 0.97
Block3 * Constant COND * DIR * AR -2.10 0.98 -2.15 0.03 -4.01 -0.19
Block4 * Random Increase COND * DIR * AR -0.29 0.99 -0.30 0.77 -2.24 1.65
Block4 * Constant COND * DIR * AR -0.67 0.97 -0.69 0.49 -2.57 1.24
Block5 * Random Increase COND * DIR * AR -0.27 0.99 -0.27 0.79 -2.21 1.67
Block5 * Constant COND * DIR * AR -0.53 0.97 -0.54 0.59 -2.44 1.38
Block6 * Random Increase COND * DIR * AR -1.69 1.00 -1.69 0.09 -3.65 0.27
Block6 * Constant COND * DIR * AR -1.55 0.98 -1.59 0.11 -3.47 0.37
Random Increase COND * LOC * AR * Btrial -0.09 0.08 -1.20 0.23 -0.25 0.06
Constant COND * LOC * AR * Btrial -0.08 0.08 -0.96 0.34 -0.23 0.08
Random Increase COND * LOC * DIR * Btrial 0.02 0.08 0.21 0.84 -0.14 0.18
Constant COND * LOC * DIR * Btrial 0.00 0.08 -0.05 0.96 -0.16 0.16
Random Increase COND * DIR * AR * Btrial -0.02 0.08 -0.25 0.81 -0.19 0.14
Constant COND * DIR * AR * Btrial -0.09 0.08 -1.07 0.28 -0.25 0.07
Random Increase COND * LOC * DIR * AR -0.65 0.58 -1.13 0.26 -1.78 0.48
Constant COND * LOC * DIR * AR -0.39 0.57 -0.68 0.50 -1.50 0.73
Block2 * LOC * DIR * AR * Btrial 0.33 0.24 1.42 0.16 -0.13 0.80
Block3 * LOC * DIR * AR * Btrial 0.02 0.24 0.10 0.92 -0.45 0.49
Block4 * LOC * DIR * AR * Btrial 0.31 0.24 1.30 0.19 -0.16 0.78
Block5 * LOC * DIR * AR * Btrial -0.03 0.24 -0.11 0.91 -0.49 0.44
Block6 * LOC * DIR * AR * Btrial 0.19 0.24 0.80 0.43 -0.28 0.66
Block2 * Random Increase COND * LOC * DIR * AR 0.33 2.01 0.17 0.87 -3.62 4.28
Block2 * Constant COND * LOC * DIR * AR -1.32 1.97 -0.67 0.50 -5.18 2.54
Block3 * Random Increase COND * LOC * DIR * AR -0.58 2.01 -0.29 0.77 -4.52 3.36
Block3 * Constant COND * LOC * DIR * AR -0.44 1.97 -0.22 0.82 -4.30 3.43
Block4 * Random Increase COND * LOC * DIR * AR 0.53 2.00 0.26 0.79 -3.39 4.44
Block4 * Constant COND * LOC * DIR * AR -1.46 1.96 -0.74 0.46 -5.30 2.38
Block5 * Random Increase COND * LOC * DIR * AR 1.29 2.00 0.65 0.52 -2.63 5.20

164
Block5 * Constant COND * LOC * DIR * AR -1.01 1.97 -0.51 0.61 -4.88 2.85
Block6 * Random Increase COND * LOC * DIR * AR 1.59 2.01 0.79 0.43 -2.35 5.52
Block6 * Constant COND * LOC * DIR * AR 1.66 2.00 0.83 0.41 -2.26 5.58
Random Increase COND * LOC * DIR * AR * Btrial 0.01 0.17 0.08 0.94 -0.32 0.34
Constant COND * LOC * DIR * AR * Btrial -0.09 0.17 -0.53 0.60 -0.41 0.24
Block2 * Random Increase COND * LOC * AR * Btrial 0.20 0.28 0.70 0.48 -0.35 0.75
Block2 * Constant COND * LOC * AR * Btrial 0.06 0.28 0.23 0.82 -0.49 0.62
Block3 * Random Increase COND * LOC * AR * Btrial 0.39 0.28 1.41 0.16 -0.15 0.94
Block3 * Constant COND * LOC * AR * Btrial 0.25 0.28 0.91 0.37 -0.29 0.80
Block4 * Random Increase COND * LOC * AR * Btrial 0.28 0.28 1.00 0.32 -0.27 0.83
Block4 * Constant COND * LOC * AR * Btrial 0.03 0.28 0.12 0.90 -0.51 0.58
Block5 * Random Increase COND * LOC * AR * Btrial 0.23 0.28 0.81 0.42 -0.32 0.77
Block5 * Constant COND * LOC * AR * Btrial -0.10 0.28 -0.36 0.72 -0.65 0.45
Block6 * Random Increase COND * LOC * AR * Btrial -0.02 0.28 -0.06 0.95 -0.56 0.53
Block6 * Constant COND * LOC * AR * Btrial -0.26 0.28 -0.92 0.36 -0.81 0.29
Block2 * Random Increase COND * LOC * DIR * Btrial 0.43 0.29 1.48 0.14 -0.14 1.00
Block2 * Constant COND * LOC * DIR * Btrial 0.08 0.29 0.29 0.77 -0.48 0.64
Block3 * Random Increase COND * LOC * DIR * Btrial 0.21 0.29 0.72 0.47 -0.36 0.78
Block3 * Constant COND * LOC * DIR * Btrial -0.44 0.29 -1.52 0.13 -1.00 0.13
Block4 * Random Increase COND * LOC * DIR * Btrial 0.42 0.29 1.42 0.16 -0.16 0.99
Block4 * Constant COND * LOC * DIR * Btrial 0.13 0.29 0.46 0.65 -0.43 0.69
Block5 * Random Increase COND * LOC * DIR * Btrial 0.37 0.29 1.30 0.19 -0.19 0.94
Block5 * Constant COND * LOC * DIR * Btrial 0.07 0.29 0.24 0.81 -0.49 0.63
Block6 * Random Increase COND * LOC * DIR * Btrial -0.08 0.29 -0.28 0.78 -0.66 0.50
Block6 * Constant COND * LOC * DIR * Btrial -0.33 0.29 -1.11 0.27 -0.90 0.25
Block2 * Random Increase COND * DIR * AR * Btrial 0.18 0.30 0.62 0.53 -0.40 0.76
Block2 * Constant COND * DIR * AR * Btrial -0.31 0.29 -1.07 0.28 -0.88 0.26
Block3 * Random Increase COND * DIR * AR * Btrial -0.39 0.30 -1.28 0.20 -0.98 0.21
Block3 * Constant COND * DIR * AR * Btrial -0.01 0.30 -0.02 0.99 -0.59 0.57
Block4 * Random Increase COND * DIR * AR * Btrial -0.51 0.30 -1.71 0.09 -1.11 0.08
Block4 * Constant COND * DIR * AR * Btrial -0.32 0.30 -1.09 0.27 -0.91 0.26
Block5 * Random Increase COND * DIR * AR * Btrial -0.30 0.30 -1.01 0.31 -0.88 0.28
Block5 * Constant COND * DIR * AR * Btrial -0.16 0.29 -0.53 0.59 -0.73 0.42
Block6 * Random Increase COND * DIR * AR * Btrial -0.32 0.30 -1.06 0.29 -0.91 0.27
Block6 * Constant COND * DIR * AR * Btrial -0.17 0.29 -0.58 0.56 -0.74 0.40
Block2 * Random Increase COND * LOC * DIR * AR * Btrial
-0.87 0.63 -1.37 0.17 -2.11 0.37
Block2 * Constant COND * LOC * DIR * AR * Btrial -0.45 0.61 -0.74 0.46 -1.65 0.74
Block3 * Random Increase COND * LOC * DIR * AR * Btrial
-1.01 0.65 -1.56 0.12 -2.27 0.26
Block3 * Constant COND * LOC * DIR * AR * Btrial -0.54 0.61 -0.88 0.38 -1.74 0.67
Block4 * Random Increase COND * LOC * DIR * AR * Btrial
-1.39 0.65 -2.16 0.03 -2.66 -0.13

165
Block4 * Constant COND * LOC * DIR * AR * Btrial -0.06 0.63 -0.09 0.93 -1.28 1.17
Block5 * Random Increase COND * LOC * DIR * AR * Btrial
-1.31 0.63 -2.09 0.04 -2.55 -0.08
Block5 * Constant COND * LOC * DIR * AR * Btrial -0.13 0.61 -0.22 0.83 -1.33 1.07
Block6 * Random Increase COND * LOC * DIR * AR * Btrial
-0.80 0.65 -1.24 0.21 -2.07 0.46
Block6 * Constant COND * LOC * DIR * AR * Btrial -0.26 0.64 -0.41 0.68 -1.52 0.99

166
APPENDIX D. LSD Post Hoc Analysis of Block for Experimental Blocks Primary Variable Analysis of
Absolute Error in Experiment 1.
Pairwise Comparisons
(I) Block (J) Block
Mean Difference (I-J) Std. Error P-value 95% Confidence Interval for
Difference
Lower Bound Upper Bound
Block1 Block2 .194* 0.096 0.043 0.006 0.381
Block3 .276* 0.096 0.004 0.088 0.464
Block4 .258* 0.095 0.007 0.07 0.445
Block5 .463* 0.096 0 0.276 0.651
Block6 .392* 0.096 0 0.204 0.579
Block2 Block1 -.194* 0.096 0.043 -0.381 -0.006
Block3 0.082 0.095 0.389 -0.105 0.269
Block4 0.064 0.095 5.03E-01 -0.123 0.251
Block5 .269* 0.096 0.005 0.082 0.457
Block6 .198* 0.096 0.039 0.01 0.385
Block3 Block1 -.276* 0.096 0.004 -0.464 -0.088
Block2 -0.082 0.095 0.389 -0.269 0.105
Block4 -0.018 0.095 0.847 -0.206 0.169
Block5 0.187 0.095 0.05 -5.49E-05 0.374
Block6 0.115 0.095 0.226 -0.072 0.303
Block4 Block1 -.258* 0.095 0.007 -0.445 -0.07
Block2 -0.064 0.095 0.503 -2.51E-01 0.123
Block3 0.018 0.095 0.847 -0.169 0.206
Block5 .205* 0.095 0.031 0.018 0.393
Block6 0.134 0.095 0.161 -0.053 0.321
Block5 Block1 -.463* 0.096 0 -0.651 -0.276
Block2 -.269* 0.096 0.005 -0.457 -0.082
Block3 -0.187 0.095 0.05 -0.374 5.49E-05
Block4 -.205* 0.095 0.031 -0.393 -0.018
Block6 -0.072 0.095 0.453 -0.259 0.115
Block6 Block1 -.392* 0.096 0 -0.579 -0.204
Block2 -.198* 0.096 0.039 -0.385 -0.01
Block3 -0.115 0.095 0.226 -0.303 0.072
Block4 -0.134 0.095 0.161 -0.321 0.053
Block5 0.072 0.095 0.453 -0.115 0.259
Based on estimated marginal means * The mean difference is significant at the .05 level.

167
APPENDIX E.
Experiment 1: Experimental Block Secondary Analysis Coefficients of Absolute Error
Estimates of Fixed Effects
Predictors Estimate Std. Error t Sig. 95% Confidence Interval
Lower Bound Upper Bound
Block 2 -0.184738 0.098248 -1.88 0.06 -0.377381 0.007905
Block 3 -0.275753 0.099152 -2.781 0.005 -0.470168 -0.081337
Block 4 -0.264104 0.102754 -2.57 0.01 -0.465582 -0.062627
Block 4 -0.441092 0.105937 -4.164 0 -0.648811 -0.233374
Block 5 -0.361632 0.109512 -3.302 0.001 -0.576361 -0.146902
Block Trial -0.015464 0.010293 -1.502 0.138 -0.036051 0.005123
Location 0.144144 0.155035 0.93 0.353 -0.159875 0.448163
Action Requirement 0.13751 0.077211 1.781 0.082 -0.018237 0.293257
Directionality 0.401304 0.112871 3.555 0.001 0.173176 0.629432
Total Rotation 0.00352 0.002186 1.61 0.108 -0.000768 0.007807
Max Rotation -0.006296 0.006733 -0.935 0.35 -0.019501 0.006909
Rotational Difference 0.003401 0.010013 0.34 0.734 -0.016234 0.023035
SampEn-X -4.405331 1.843828 -2.389 0.017 -8.022835 -0.787827
SampEn-Y 0.064608 2.839855 0.023 0.982 -5.511665 5.64088
SSQ 0.001851 0.016947 0.109 0.913 -0.031379 0.03508
Pre-MSAQ -0.029078 0.017407 -1.67 0.104 -0.0644 0.006245
Post-MSAQ 0.007004 0.006991 1.002 0.323 -0.007172 0.021179
Constant Condition 0.200735 0.180022 1.115 0.272 -0.163794 0.565263
Random Increase Condition 0.291151 0.180114 1.616 0.114 -0.073596 0.655898
Block 2 * SSQ 0.005204 0.046031 0.113 0.91 -0.085052 0.095461
Block 3 * SSQ 0.03279 0.043399 0.756 0.45 -0.052305 0.117885
Block 4 * SSQ -0.041172 0.041091 -1.002 0.316 -0.121742 0.039398
Block 4 * SSQ -0.062646 0.041415 -1.513 0.13 -0.143851 0.018559
Block 5 * SSQ 0.001235 0.040452 0.031 0.976 -0.078082 0.080553
Block 2 * Total Rotation 0.00027 0.003973 0.068 0.946 -0.00752 0.00806
Block 3 * Total Rotation 0.00631 0.004752 1.328 0.184 -0.003008 0.015627
Block 4 * Total Rotation 0.001406 0.00485 0.29 0.772 -0.008103 0.010915
Block 4 * Total Rotation -0.000504 0.004889 -0.103 0.918 -0.010091 0.009082
Block 5 * Total Rotation 0.004089 0.004946 0.827 0.408 -0.005609 0.013787
Block 2 * Max Rotation -0.000395 0.006714 -0.059 0.953 -0.01356 0.012771
Block 3 * Max Rotation 0.000415 0.006851 0.061 0.952 -0.013018 0.013849
Block 4 * Max Rotation 0.001161 0.006904 0.168 0.867 -0.012376 0.014697
Block 4 * Max Rotation -0.006896 0.006997 -0.986 0.324 -0.020616 0.006824

168
Block 5 * Max Rotation 0.002945 0.006935 0.425 0.671 -0.010652 0.016543
Block 2 * Rotational Difference 0.081751 0.023703 3.449 0.001 0.035274 0.128228
Block 3 * Rotational Difference 0.080879 0.023039 3.511 0 0.035705 0.126053
Block 4 * Rotational Difference 0.030495 0.023214 1.314 0.189 -0.015023 0.076013
Block 4 * Rotational Difference 0.086534 0.022951 3.77 0 0.041532 0.131536
Block 5 * Rotational Difference 0.047988 0.022205 2.161 0.031 0.00445 0.091527
Constant Condition * SSQ 0.000946 0.037273 0.025 0.98 -0.072321 0.074213
Random Increase Condition * SSQ -0.01239 0.037356 -0.332 0.74 -0.085883 0.061104
Constant Condition * Total Rotation 0.001485 0.004383 0.339 0.735 -0.007108 0.010078
Random Increase Condition * Total Rotation 0.002896 0.00405 0.715 0.475 -0.005045 0.010837
Constant Condition * Max Rotation -0.002627 0.005179 -0.507 0.612 -0.012782 0.007527
Random Increase Condition * Max Rotation 0.001237 0.005157 0.24 0.81 -0.008876 0.011349
Constant Condition * Rotational Difference 0.012742 0.020451 0.623 0.533 -0.027375 0.052859
Random Increase Condition * Rotational Difference 0.021331 0.019974 1.068 0.286 -0.017844 0.060506
Block 2 * Constant Condition -0.457101 0.234573 -1.949 0.051 -0.917049 0.002848
Block 2 * Random Increase Condition 0.03978 0.237908 0.167 0.867 -0.426707 0.506267
Block 3 * Constant Condition -0.111831 0.237077 -0.472 0.637 -0.576689 0.353026
Block 3 * Random Increase Condition -0.057746 0.237637 -0.243 0.808 -0.5237 0.408207
Block 4 * Constant Condition -0.069598 0.241603 -0.288 0.773 -0.54333 0.404133
Block 4 * Random Increase Condition -0.192771 0.23938 -0.805 0.421 -0.662143 0.276601
Block 4 * Constant Condition -0.547692 0.240633 -2.276 0.023 -1.019521 -0.075863
Block 4 * Random Increase Condition -0.303065 0.235923 -1.285 0.199 -0.765659 0.15953
Block 5 * Constant Condition 0.049631 0.240158 0.207 0.836 -0.421265 0.520528
Block 5 * Random Increase Condition -0.059355 0.237031 -0.25 0.802 -0.524122 0.405411
Block 2 * Constant Condition * SSQ 0.0953 0.141596 0.673 0.501 -0.182339 0.37294
Block 2 * Random Increase Condition * SSQ 0.067526 0.120293 0.561 0.575 -0.168342 0.303393
Block 3 * Constant Condition * SSQ 0.260667 0.134576 1.937 0.053 -0.003208 0.524542
Block 3 * Random Increase Condition * SSQ 0.122156 0.120139 1.017 0.309 -0.113412 0.357723
Block 4 * Constant Condition * SSQ 0.201591 0.130684 1.543 0.123 -0.054653 0.457835
Block 4 * Random Increase Condition * SSQ 0.080887 0.115136 0.703 0.482 -0.144871 0.306645
Block 4 * Constant Condition * SSQ 0.240532 0.129803 1.853 0.064 -0.013987 0.495051
Block 4 * Random Increase Condition * SSQ 0.087146 0.114336 0.762 0.446 -0.137043 0.311335
Block 5 * Constant Condition * SSQ 0.177499 0.125163 1.418 0.156 -0.067928 0.422925
Block 5 * Random Increase Condition * SSQ 0.066691 0.110349 0.604 0.546 -0.149688 0.28307
Block 2 * Constant Condition * Total Rotation -0.003039 0.016103 -0.189 0.85 -0.034615 0.028536
Block 2 * Random Increase Condition * Total Rotation 0.010142 0.012553 0.808 0.419 -0.014472 0.034757
Block 3 * Constant Condition * Total Rotation -0.006491 0.015315 -0.424 0.672 -0.03652 0.023538
Block 3 * Random Increase Condition * Total Rotation -0.003609 0.01326 -0.272 0.786 -0.02961 0.022392
Block 4 * Constant Condition * Total Rotation -0.025306 0.015104 -1.675 0.094 -0.054922 0.00431
Block 4 * Random Increase Condition * Total Rotation -0.003625 0.012928 -0.28 0.779 -0.028974 0.021724
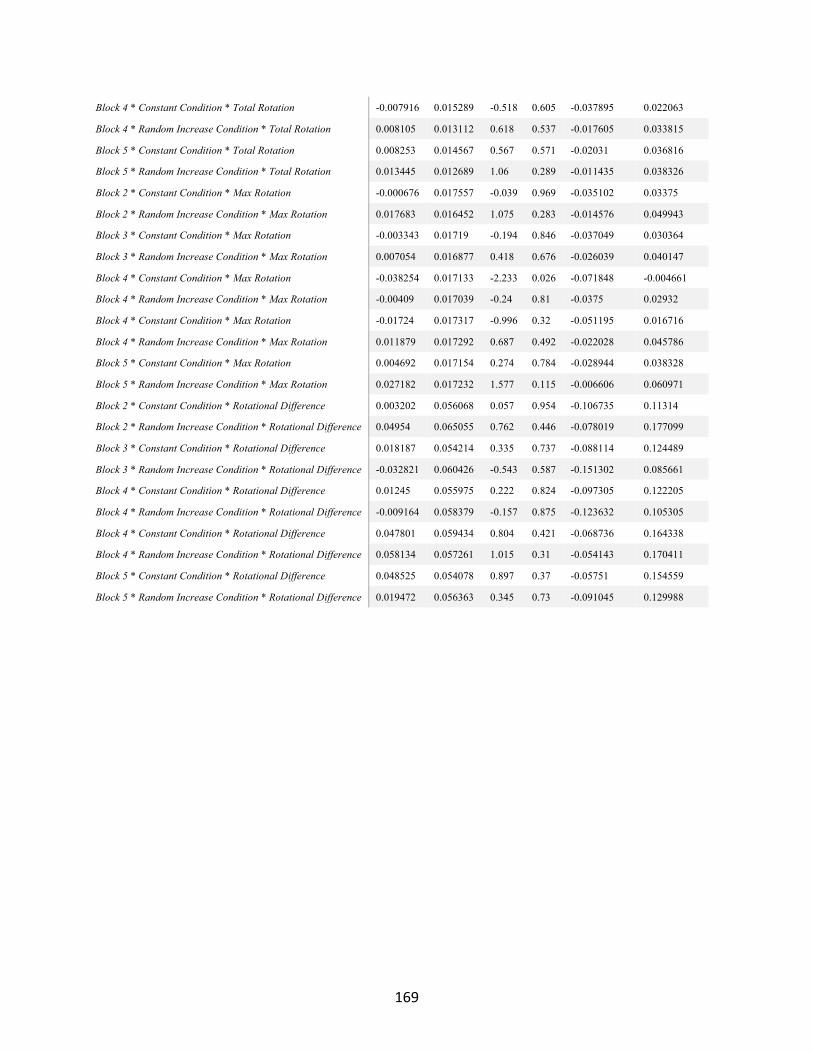
169
Block 4 * Constant Condition * Total Rotation -0.007916 0.015289 -0.518 0.605 -0.037895 0.022063
Block 4 * Random Increase Condition * Total Rotation 0.008105 0.013112 0.618 0.537 -0.017605 0.033815
Block 5 * Constant Condition * Total Rotation 0.008253 0.014567 0.567 0.571 -0.02031 0.036816
Block 5 * Random Increase Condition * Total Rotation 0.013445 0.012689 1.06 0.289 -0.011435 0.038326
Block 2 * Constant Condition * Max Rotation -0.000676 0.017557 -0.039 0.969 -0.035102 0.03375
Block 2 * Random Increase Condition * Max Rotation 0.017683 0.016452 1.075 0.283 -0.014576 0.049943
Block 3 * Constant Condition * Max Rotation -0.003343 0.01719 -0.194 0.846 -0.037049 0.030364
Block 3 * Random Increase Condition * Max Rotation 0.007054 0.016877 0.418 0.676 -0.026039 0.040147
Block 4 * Constant Condition * Max Rotation -0.038254 0.017133 -2.233 0.026 -0.071848 -0.004661
Block 4 * Random Increase Condition * Max Rotation -0.00409 0.017039 -0.24 0.81 -0.0375 0.02932
Block 4 * Constant Condition * Max Rotation -0.01724 0.017317 -0.996 0.32 -0.051195 0.016716
Block 4 * Random Increase Condition * Max Rotation 0.011879 0.017292 0.687 0.492 -0.022028 0.045786
Block 5 * Constant Condition * Max Rotation 0.004692 0.017154 0.274 0.784 -0.028944 0.038328
Block 5 * Random Increase Condition * Max Rotation 0.027182 0.017232 1.577 0.115 -0.006606 0.060971
Block 2 * Constant Condition * Rotational Difference 0.003202 0.056068 0.057 0.954 -0.106735 0.11314
Block 2 * Random Increase Condition * Rotational Difference 0.04954 0.065055 0.762 0.446 -0.078019 0.177099
Block 3 * Constant Condition * Rotational Difference 0.018187 0.054214 0.335 0.737 -0.088114 0.124489
Block 3 * Random Increase Condition * Rotational Difference -0.032821 0.060426 -0.543 0.587 -0.151302 0.085661
Block 4 * Constant Condition * Rotational Difference 0.01245 0.055975 0.222 0.824 -0.097305 0.122205
Block 4 * Random Increase Condition * Rotational Difference -0.009164 0.058379 -0.157 0.875 -0.123632 0.105305
Block 4 * Constant Condition * Rotational Difference 0.047801 0.059434 0.804 0.421 -0.068736 0.164338
Block 4 * Random Increase Condition * Rotational Difference 0.058134 0.057261 1.015 0.31 -0.054143 0.170411
Block 5 * Constant Condition * Rotational Difference 0.048525 0.054078 0.897 0.37 -0.05751 0.154559
Block 5 * Random Increase Condition * Rotational Difference 0.019472 0.056363 0.345 0.73 -0.091045 0.129988

170
APPENDIX F. Experiment 1: Pre-/ Post Block Primary Analysis Coefficients
Estimates of Fixed Effects
Parameter Estimate Std. Error
t Sig. 95% Confidence Interval
Intercept 1.904127 0.338111 5.632 0 1.230626 2.577629
Post-Test -0.493274
0.127038 -3.883
0 -0.742598 -0.24395
Block Trial 0.114009 0.026897 4.239 0 0.060123 0.167894
Location 0.267379 0.126041 2.121 0.034 0.020011 0.514747
Action Requirement 0.459198 0.239252 1.919 0.062 -0.024023 0.942418
Directionality 0.197335 0.20585 0.959 0.344 -0.219515 0.614185
Constant Condition 0.586038 0.400993 1.461 0.152 -0.224681 1.396757
Random Increase Condition 0.096294 0.400574 0.24 0.811 -0.713695 0.906283
Post-Test * Block Trial -0.00768 0.036673 -0.209
0.834 -0.079655 0.064294
Post-Test * Location -0.06169 0.251626 -0.245
0.806 -0.555525 0.432145
Post-Test * Action Requirement -0.097004
0.258346 -0.375
0.707 -0.604069 0.41006
Post-Test * Directionality 0.803943 0.272485 2.95 0.003 0.269186 1.338699
Location * Block Trial 0.02387 0.037553 0.636 0.525 -0.049828 0.097567
Action Requirement * Block Trial 0.065865 0.037899 1.738 0.083 -0.008513 0.140242
Directionality * Block Trial 0.04251 0.039552 1.075 0.283 -0.035109 0.120129
Location * Action Requirement 0.24322 0.250797 0.97 0.332 -0.249001 0.73544
Directionality * Action Requirement 0.722653 0.312884 2.31 0.021 0.108649 1.336657
Location * Directionality -0.479625
0.258024 -1.859
0.063 -0.986025 0.026774
Post-Test * Constant Condition 0.497467 0.307943 1.615 0.107 -0.106904 1.101838
Post-Test * Random Increase Condition 1.132617 0.305914 3.702 0 0.532226 1.733007
Constant Condition * Block Trial -0.005145
0.067003 -0.077
0.939 -0.139505 0.129215
Random Increase Condition * Block Trial -0.026974
0.067094 -0.402
0.689 -0.1615 0.107552
Constant Condition * Location -0.258068
0.308735 -0.836
0.403 -0.863984 0.347848
Random Increase Condition * Location -0.246185
0.308022 -0.799
0.424 -0.850707 0.358338
Constant Condition * Action Requirement 0.629595 0.577605 1.09 0.283 -0.539415 1.798604
Random Increase Condition * Action Requirement -0.323794
0.573937 -0.564
0.576 -1.486418 0.83883
Constant Condition * Directionality 0.495232 0.506637 0.977 0.335 -0.533803 1.524266
Random Increase Condition * Directionality 0.141246 0.497 0.284 0.778 -0.870406 1.152899
Location * Block Trial -0.05708 0.052996 -1.077
0.282 -0.161087 0.046927
Post-Test * Location * Block Trial 0.163618 0.07564 2.163 0.031 0.015173 0.312063
Action Requirement * Block Trial -0.01037 0.060734 -0.171
0.865 -0.130337 0.109596
Post-Test * Action Requirement * Block Trial 0.158642 0.073105 2.17 0.03 0.015167 0.302117

171
Post-Test * Directionality * Block Trial -0.070267
0.075762 -0.927
0.354 -0.218955 0.07842
Post-Test * Location * Action Requirement 0.602448 0.502688 1.198 0.231 -0.384128 1.589024
Post-Test * Location * Directionality 0.839868 0.515712 1.629 0.104 -0.172272 1.852009
Post-Test * Directionality * Action Requirement -0.557124
0.556612 -1.001
0.317 -1.649471 0.535223
Location * Action Requirement * Block Trial -0.000195
0.075415 -0.003
0.998 -0.148199 0.147808
Location * Directionality * Block Trial 0.107803 0.077375 1.393 0.164 -0.044046 0.259651
Directionality * Action Requirement * Block Trial 0.361276 0.083195 4.343 0 0.198 0.524553
Location * Directionality * Action Requirement 0.583538 0.520815 1.12 0.263 -0.438618 1.605693
Location * Action Requirement * Block Trial 0.017628 0.0538 0.328 0.743 -0.087956 0.123213
Location * Cross-AR * Block Trial 0.021213 0.052404 0.405 0.686 -0.081633 0.12406
Post-Test * Constant Condition * Block Trial -0.177004
0.088861 -1.992
0.047 -0.351405 -0.002603
Post-Test * Random Increase Condition * Block Trial -0.162035
0.08924 -1.816
0.07 -0.337177 0.013107
Post-Test * Constant Condition * Location 0.279533 0.613908 0.455 0.649 -0.925316 1.484382
Post-Test * Random Increase Condition * Location 0.607079 0.612381 0.991 0.322 -0.594782 1.808941
Post-Test * Constant Condition * Action Requirement -0.755278
0.62648 -1.206
0.228 -1.984857 0.474302
Post-Test * Random Increase Condition * Action Requirement 0.825834 0.627084 1.317 0.188 -0.404926 2.056593
Post-Test * Constant Condition * Directionality 1.009302 0.671964 1.502 0.133 -0.30945 2.328055
Post-Test * Random Increase Condition * Directionality 0.651773 0.65115 1.001 0.317 -0.626133 1.92968
Constant Condition * Location * Block Trial 0.036342 0.091945 0.395 0.693 -0.144103 0.216786
Random Increase Condition * Location * Block Trial -0.096733
0.092054 -1.051
0.294 -0.277392 0.083926
Constant Condition * Action Requirement * Block Trial 0.119993 0.091889 1.306 0.192 -0.060345 0.300331
Random Increase Condition * Action Requirement * Block Trial 0.027334 0.092335 0.296 0.767 -0.153882 0.208551
Constant Condition * Directionality * Block Trial 0.06478 0.067581 0.959 0.338 -0.067851 0.19741
Random Increase Condition * Directionality * Block Trial 0.037763 0.069137 0.546 0.585 -0.097916 0.173441
Control Condition * Directionality * Block Trial -0.0083 0.069696 -0.119
0.905 -0.145075 0.128475
Constant Condition * Location * Action Requirement 0.540547 0.613529 0.881 0.379 -0.663584 1.744677
Random Increase Condition * Location * Action Requirement 0.425631 0.614162 0.693 0.488 -0.779739 1.631
Constant Condition * Location * Directionality -0.084344
0.644069 -0.131
0.896 -1.348393 1.179704
Random Increase Condition * Location * Directionality -0.117275
0.630239 -0.186
0.852 -1.354187 1.119638
Post-Test * Location * Directionality * Action Requirement 0.948347 1.056316 0.898 0.37 -1.124764 3.021459
Location * Directionality * Action Requirement * Block Trial 0.107281 0.156478 0.686 0.493 -0.199814 0.414375
Post-Test * Location * Action Requirement * Block Trial 0.165433 0.151743 1.09 0.276 -0.132366 0.463232
Post-Test * Location * Directionality * Block Trial 0.001863 0.154228 0.012 0.99 -0.300811 0.304537
Post-Test * Constant Condition * Location * Block Trial -0.237309
0.18582 -1.277
0.202 -0.601984 0.127367
Post-Test * Random Increase Condition * Location * Block Trial -0.104203
0.183521 -0.568
0.57 -0.464373 0.255968
Post-Test * Constant Condition * Action Requirement * Block Trial 0.112711 0.179082 0.629 0.529 -0.238758 0.46418
Post-Test * Random Increase Condition * Action Requirement * Block Trial
0.059244 0.180514 0.328 0.743 -0.295033 0.413522

172
Post-Test * Constant Condition * Directionality * Block Trial 0.30724 0.189705 1.62 0.106 -0.065078 0.679558
Post-Test * Random Increase Condition * Directionality * Block Trial 0.3289 0.185802 1.77 0.077 -0.035755 0.693556
Post-Test * Constant Condition * Location * Action Requirement 1.741068 1.22613 1.42 0.156 -0.665359 4.147495
Post-Test * Random Increase Condition * Location * Action Requirement
2.289688 1.223829 1.871 0.062 -0.112242 4.691618
Post-Test * Constant Condition * Location * Directionality 0.062056 1.297763 0.048 0.962 -2.48498 2.609092
Post-Test * Random Increase Condition * Location * Directionality 0.610856 1.257829 0.486 0.627 -1.85779 3.079501
Post-Test * Constant Condition * Directionality * Action Requirement -3.489596
1.391736 -2.507
0.012 -6.220863 -0.75833
Post-Test * Random Increase Condition * Directionality * Action Requirement
-2.989086
1.363203 -2.193
0.029 -5.664385 -0.313787
Constant Condition * Location * Action Requirement * Block Trial 0.134333 0.184318 0.729 0.466 -0.227405 0.496072
Random Increase Condition * Location * Action Requirement * Block Trial
0.151489 0.184982 0.819 0.413 -0.211553 0.514531
Constant Condition * Location * Directionality * Block Trial 0.178091 0.19717 0.903 0.367 -0.208861 0.565044
Random Increase Condition * Location * Directionality * Block Trial 0.091973 0.190394 0.483 0.629 -0.281689 0.465635
Constant Condition * Directionality * Action Requirement * Block Trial -0.250049
0.206775 -1.209
0.227 -0.655874 0.155775
Random Increase Condition * Directionality * Action Requirement * Block Trial
-0.206778
0.205564 -1.006
0.315 -0.610203 0.196648
Constant Condition * Location * Directionality * Action Requirement -0.450731
1.316913 -0.342
0.732 -3.03532 2.133858
Random Increase Condition * Location * Directionality * Action Requirement
1.035448 1.303162 0.795 0.427 -1.522142 3.593038
Post-Test * Location * Directionality * Action Requirement * Block Trial
-0.13697 0.317227 -0.432
0.666 -0.759548 0.485609
Post-Test * Constant Condition * Location * Directionality * Action Requirement
0.156055 2.678479 0.058 0.954 -5.100883 5.412993
Post-Test * Random Increase Condition * Location * Directionality * Action Requirement
-0.712189
2.632591 -0.271
0.787 -5.87904 4.454661
Constant Condition * Location * Directionality * Action Requirement * Block Trial
-0.996293
0.40988 -2.431
0.015 -1.800712 -0.191873
Random Increase Condition * Location * Directionality * Action Requirement * Block Trial
-0.46206 0.400505 -1.154
0.249 -1.248092 0.323973
Post-Test * Constant Condition * Location * Action Requirement * Block Trial
-0.249524
0.380343 -0.656
0.512 -0.995976 0.496928
Post-Test * Random Increase Condition * Location * Action Requirement * Block Trial
0.033306 0.376839 0.088 0.93 -0.706279 0.77289
Post-Test * Constant Condition * Location * Directionality * Block Trial 0.125619 0.39834 0.315 0.753 -0.656162 0.9074
Post-Test * Random Increase Condition * Location * Directionality * Block Trial
0.448353 0.388475 1.154 0.249 -0.314068 1.210774
Post-Test * Constant Condition * Directionality * Action Requirement * Block Trial
0.514922 0.387741 1.328 0.185 -0.246067 1.275912
Post-Test * Random Increase Condition * Directionality * Action Requirement * Block Trial
-0.170106
0.388396 -0.438
0.662 -0.932365 0.592153
Post-Test * Constant Condition * Location * Directionality * Action Requirement * Block Trial
0.980442 0.830125 1.181 0.238 -0.648881 2.609765
Post-Test * Random Increase Condition * Location * Directionality * Action Requirement * Block Trial
0.858463 0.808822 1.061 0.289 -0.729061 2.445987

173
APPENDIX G. Experiment 1: Pre-/ Post-test Secondary Analysis Coefficients for Absolute Error
Estimates of Fixed Effects Parameter Estimate Std. Error t Sig. 95% Confidence Interval
Lower Bound Upper Bound
Intercept 2.25 0.381711 5.885 0 1.490496 3.002067
Post-Test -0.49 0.13986 -3.476 0.001 -0.760621 -0.211673
Block Trial 0.09 0.025566 3.628 0.001 0.041532 0.143954
Location -0.72 0.470498 -1.526 0.127 -1.641397 0.205224
Action Requirement 0.71 0.252528 2.803 0.008 0.198317 1.217577
Directionality 0.52 0.163903 3.17 0.002 0.197969 0.841269
Constant Condition 0.56 0.391731 1.425 0.162 -0.234469 1.351168
Random Increase Condition 0.09 0.391466 0.228 0.821 -0.703271 0.881472
Total Rotation -0.01 0.007993 -1.324 0.186 -0.026271 0.005101
Max Rotation 0.04 0.019643 1.907 0.057 -0.001093 0.076008
Rotational Difference 0.13 0.020275 6.217 0 0.08627 0.165845
SampEn-X -6.24 5.256227 -1.186 0.236 -16.571009 4.09892
SampEn-Y -3.73 6.209963 -0.601 0.548 -15.933424 8.465187
MSAQ 0.01 0.010882 0.469 0.639 -0.01627 0.026474
Post-Test * MSAQ 0.07 0.028812 2.519 0.012 0.016 0.129136
Post-Test * Total Rotation 0.00 0.008239 0.219 0.826 -0.014362 0.017977
Post-Test * Max Rotation -0.01 0.009075 -0.925 0.355 -0.026202 0.009419
Post-Test * Rotational Difference -0.10 0.024813 -4.192 0 -0.152697 -0.055309
Constant Condition * MSAQ -0.02 0.030585 -0.715 0.475 -0.081931 0.038196
Random Increase Condition * MSAQ -0.05 0.033124 -1.42 0.156 -0.112077 0.018024
Constant Condition * Total Rotation -0.01 0.010808 -0.899 0.369 -0.030933 0.011491
Random Increase Condition * Total Rotation 0.00 0.009959 -0.165 0.869 -0.021191 0.017897
Constant Condition * Max Rotation -0.01 0.011531 -0.903 0.367 -0.033043 0.012215
Random Increase Condition * Max Rotation -0.02 0.011706 -1.402 0.161 -0.039381 0.006565
Constant Condition * Rotational Difference -0.09 0.03666 -2.402 0.017 -0.160052 -0.016093
Random Increase Condition * Rotational Difference -0.05 0.037462 -1.378 0.169 -0.125157 0.021926
Post-Test * Constant Condition 0.47 0.318983 1.484 0.138 -0.15263 1.099412
Post-Test * Random Increase Condition 1.06 0.305424 3.464 0.001 0.458551 1.657404
Constant Condition * Block_Trial_0 0.01 0.064594 0.165 0.87 -0.118904 0.140227
Random Increase Condition * Block_Trial_0 -0.02 0.064692 -0.368 0.714 -0.153548 0.105948
Post-Test * Constant Condition * Total Rotation 0.01 0.021205 0.578 0.563 -0.029355 0.053879
Post-Test * Random Increase Condition * Total Rotation 0.02 0.019513 0.78 0.435 -0.02307 0.053522
Post-Test * Constant Condition * Max Rotation 0.02 0.022276 0.83 0.407 -0.025221 0.062216
Post-Test * Random Increase Condition * Max Rotation 0.02 0.022293 0.963 0.336 -0.022276 0.065229

174
Post-Test * Constant Condition * Rotational Difference -0.16 0.057752 -2.818 0.005 -0.276071 -0.049399
Post-Test * Random Increase Condition * Rotational Difference -0.03 0.065218 -0.494 0.621 -0.160236 0.095735

175
APPENDIX H. LSD Post Hoc Analysis of Block for Experimental Blocks for SampEn-X in Experiment 1.
Pairwise Comparisons
(I) Block (J) Block Mean Difference (I-J) Std. Error Sig. 95% Confidence Interval for Difference
Lower Bound Upper Bound
Block1 Block2 -.006* 0.001 0 -0.008 -0.004
Block3 -.004* 0.001 0 -0.005 -0.002
Block4 -.002* 0.001 0.025 -0.004 0
Block5 -.010* 0.001 0 -0.012 -0.008
Block6 -.013* 0.001 0 -0.015 -0.011
Block2 Block1 .006* 0.001 0 0.004 0.008
Block3 .003* 0.001 0.002 0.001 0.004
Block4 .004* 0.001 0 0.002 0.006
Block5 -.003* 0.001 0 -0.005 -0.002
Block6 -.006* 0.001 0 -0.008 -0.005
Block3 Block1 .004* 0.001 0 0.002 0.005
Block2 -.003* 0.001 0.002 -0.004 -0.001
Block4 0.00 0.001 0.089 0 0.003
Block5 -.006* 0.001 0 -0.008 -0.004
Block6 -.009* 0.001 0 -0.011 -0.007
Block4 Block1 .002* 0.001 0.025 0 0.004
Block2 -.004* 0.001 0 -0.006 -0.002
Block3 0.00 0.001 0.089 -0.003 0
Block5 -.007* 0.001 0 -0.009 -0.006
Block6 -.010* 0.001 0 -0.012 -0.009
Block5 Block1 .010* 0.001 0 0.008 0.012
Block2 .003* 0.001 0 0.002 0.005
Block3 .006* 0.001 0 0.004 0.008
Block4 .007* 0.001 0 0.006 0.009
Block6 -.003* 0.001 0 -0.005 -0.001
Block6 Block1 .013* 0.001 0 0.011 0.015
Block2 .006* 0.001 0 0.005 0.008
Block3 .009* 0.001 0 0.007 0.011
Block4 .010* 0.001 0 0.009 0.012
Block5 .003* 0.001 0 0.001 0.005
Based on estimated marginal means
* The mean difference is significant at the .05 level.

176
APPENDIX I. LSD Post Hoc Analysis of Block for Experimental Blocks for SampEn-Y in Experiment 1.
Pairwise Comparisons (I) Block (J) Block Mean Difference (I-J) Std. Error Sig 95% Confidence Interval for Difference
Lower Bound Upper Bound
Block1 Block2 .003* 0.001 0 0.002 0.004
Block3 .004* 0.001 0 0.003 0.005
Block4 .003* 0.001 0 0.002 0.004
Block5 .003* 0.001 0 0.002 0.004
Block6 .002* 0.001 0.004 0.001 0.003
Block2 Block1 -.003* 0.001 0 -0.004 -0.002
Block3 .001* 0.001 0.046 2.02E-05 0.002
Block4 0.00 0.001 0.625 -0.001 0.001
Block5 0.00 0.001 0.851 -0.001 0.001
Block6 0.00 0.001 0.057 -0.002 3.13E-05
Block3 Block1 -.004* 0.001 0 -0.005 -0.003
Block2 -.001* 0.001 0.046 -0.002 -2.02E-05
Block4 0.00 0.001 0.132 -0.002 0
Block5 -.001* 0.001 0.029 -0.002 0
Block6 -.002* 0.001 0 -0.003 -0.001
Block4 Block1 -.003* 0.001 0 -0.004 -0.002
Block2 0.00 0.001 0.625 -0.001 0.001
Block3 0.00 0.001 0.132 0 0.002
Block5 0.00 0.001 0.499 -0.002 0.001
Block6 -.001* 0.001 0.017 -0.002 0
Block5 Block1 -.003* 0.001 0 -0.004 -0.002
Block2 0.00 0.001 0.851 -0.001 0.001
Block3 .001* 0.001 0.029 0 0.002
Block4 0.00 0.001 0.499 -0.001 0.002
Block6 0.00 0.001 0.086 -0.002 0
Block6 Block1 -.002* 0.001 0.004 -0.003 -0.001
Block2 0.00 0.001 0.057 -3.13E-05 0.002
Block3 .002* 0.001 0 0.001 0.003
Block4 .001* 0.001 0.017 0 0.002
Block5 0.00 0.001 0.086 0 0.002
Based on estimated marginal means * The mean difference is significant at the .05 level.

177
APPENDIX J. Experiment 2: Descriptive Statistics for Collected Predictors Experimental Blocks
PREDICTOR N MINIMUM MAXIMUM MEAN STD. DEVIATION
TOTAL ROTATION (DEGREES) 3022 40.92 287.74 81.07 19.32 MAX ROTATION (DEGREES) 3022 29.20 107.04 71.92 13.76 ROTATIONAL DIFFERENCE (DEGREES) 3022 0.00 28.64 5.72 4.48 SSQ 3022 0.00 30.00 2.00 4.48 ML POSTURAL SWAY (ENTROPY) 3022 0.03 0.13 0.06 0.02 AP POSTURAL SWAY (ENTROPY) 3022 0.02 0.11 0.06 0.02
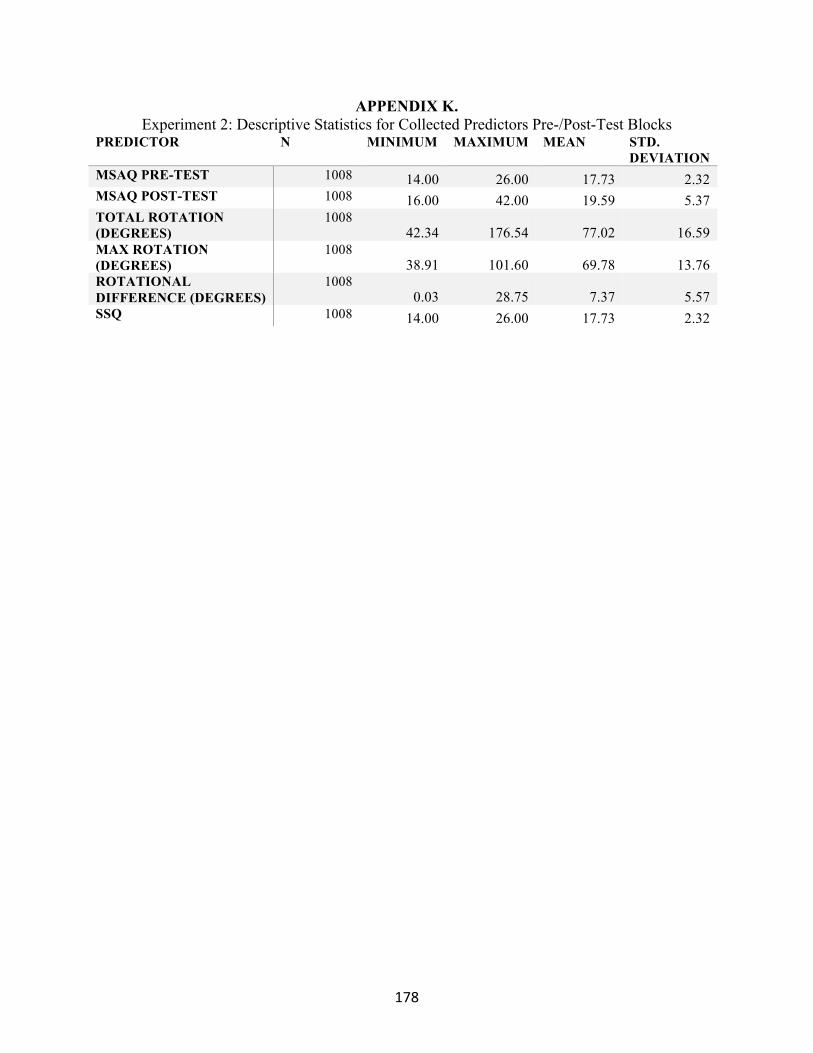
178
APPENDIX K. Experiment 2: Descriptive Statistics for Collected Predictors Pre-/Post-Test Blocks
PREDICTOR N MINIMUM MAXIMUM MEAN STD. DEVIATION
MSAQ PRE-TEST 1008 14.00 26.00 17.73 2.32 MSAQ POST-TEST 1008 16.00 42.00 19.59 5.37 TOTAL ROTATION (DEGREES)
1008 42.34 176.54 77.02 16.59
MAX ROTATION (DEGREES)
1008 38.91 101.60 69.78 13.76
ROTATIONAL DIFFERENCE (DEGREES)
1008 0.03 28.75 7.37 5.57
SSQ 1008 14.00 26.00 17.73 2.32

179
APPENDIX L. Experiment 2: Experimental Block Primary Analysis Coefficients for the Outcome Variable of
Absolute Error
Estimates of Fixed Effects
Parameter Estimate Std. Error t Sig. 95% Confidence Interval
Lower Bound
Upper Bound
Intercept 1.632842 0.131993
12.371 0 1.371098 1.894586
Block 2 -0.119703 0.08135 -1.471
0.141 -0.279214 0.039807
Block 3 -0.131787 0.081485
-1.617
0.106 -0.291562 0.027988
Block 4 -0.264799 0.081432
-3.252
0.001 -0.42447 -0.105129
Block 5 -0.23412 0.081437
-2.875
0.004 -0.393802 -0.074438
Block 6 -0.266754 0.081509
-3.273
0.001 -0.426575 -0.106932
Block Trial -0.023034 0.008917
-2.583
0.012 -0.04087 -0.005197
Location 0.060584 0.047317 1.28 0.20
1 -0.032194 0.153363
Action Requirement 0.310778 0.07864 3.952 0 0.151913 0.469643
Directionality 0.306499 0.082226 3.727 0.00
1 0.140193 0.472805
Oscillating Condition -0.009347 0.137584
-0.068
0.946 -0.289611 0.270917
Constant Increase Condition -0.062604 0.14225 -0.44 0.663 -0.352491 0.227283
Block 2 * Block Trial 0.018394 0.023867 0.771 0.44
1 -0.028404 0.065191
Block 3 * Block Trial 0.042854 0.023794 1.801 0.07
2 -0.0038 0.089508
Block 4 * Block Trial 0.041986 0.023775 1.766 0.07
8 -0.004632 0.088603
Block 5 * Block Trial 0.070396 0.02379 2.959 0.003 0.02375 0.117043
Block 6 * Block Trial 0.058455 0.023803 2.456 0.01
4 0.011783 0.105127
Block 2 * Location -0.011009 0.163191
-0.067
0.946 -0.330992 0.308974
Block 3 * Location -0.09863 0.163157
-0.605
0.546 -0.418544 0.221285
Block 4 * Location 0.177968 0.163025 1.092 0.27
5 -0.14169 0.497625
Block 5 * Location -0.140184 0.163027 -0.86 0.39 -0.459845 0.179478
Block 6 * Location -0.214393 0.163274
-1.313
0.189 -0.534538 0.105752
Block 2 * Action Requirement -0.19872 0.163302
-1.217
0.224 -0.518921 0.12148
Block 3 * Action Requirement -0.234456 0.163197
-1.437
0.151 -0.55445 0.085539
Block 4 * Action Requirement -0.281406 0.163174
-1.725
0.085 -0.601356 0.038545
Block 5 * Action Requirement -0.324876 0.163217 -1.99 0.04
7 -0.644909 -0.004843
Block 6 * Action Requirement -0.123215 0.163465
-0.754
0.451 -0.443734 0.197304
Block 2 * Directionality -0.379454 0.166543
-2.278
0.023 -0.706008 -0.0529
Block 3 * Directionality -0.20478 0.168609
-1.215
0.225 -0.535386 0.125825
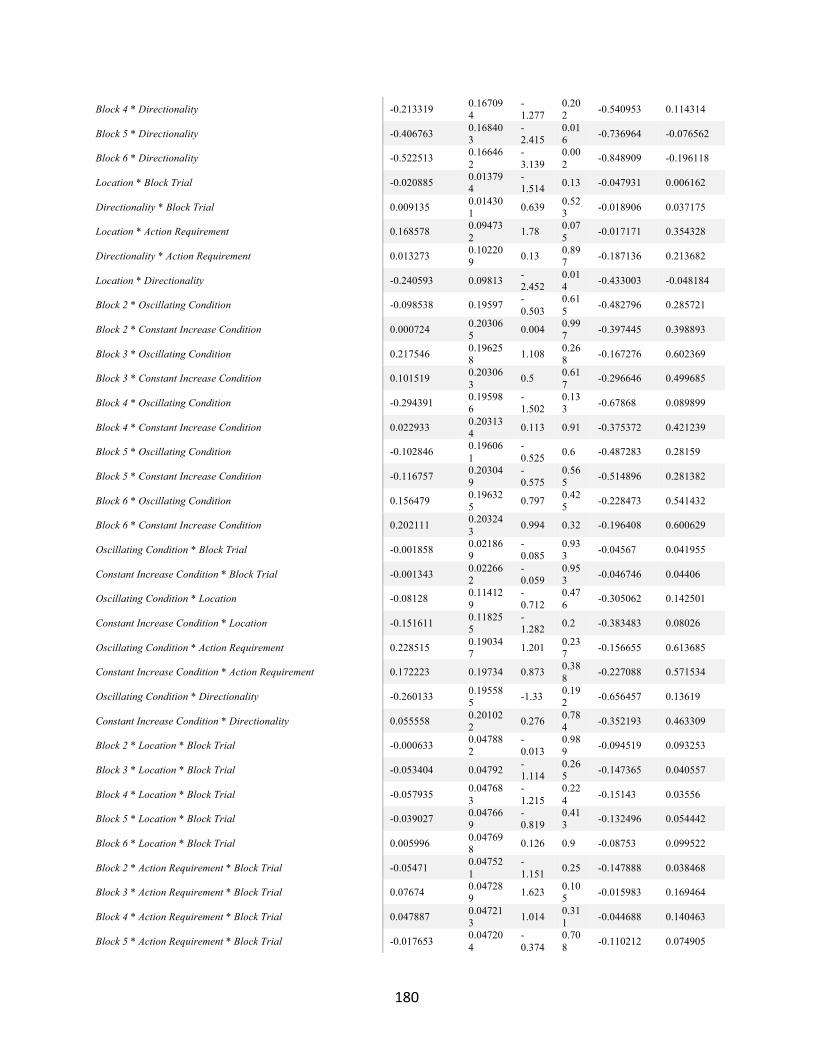
180
Block 4 * Directionality -0.213319 0.167094
-1.277
0.202 -0.540953 0.114314
Block 5 * Directionality -0.406763 0.168403
-2.415
0.016 -0.736964 -0.076562
Block 6 * Directionality -0.522513 0.166462
-3.139
0.002 -0.848909 -0.196118
Location * Block Trial -0.020885 0.013794
-1.514 0.13 -0.047931 0.006162
Directionality * Block Trial 0.009135 0.014301 0.639 0.52
3 -0.018906 0.037175
Location * Action Requirement 0.168578 0.094732 1.78 0.07
5 -0.017171 0.354328
Directionality * Action Requirement 0.013273 0.102209 0.13 0.89
7 -0.187136 0.213682
Location * Directionality -0.240593 0.09813 -2.452
0.014 -0.433003 -0.048184
Block 2 * Oscillating Condition -0.098538 0.19597 -0.503
0.615 -0.482796 0.285721
Block 2 * Constant Increase Condition 0.000724 0.203065 0.004 0.99
7 -0.397445 0.398893
Block 3 * Oscillating Condition 0.217546 0.196258 1.108 0.26
8 -0.167276 0.602369
Block 3 * Constant Increase Condition 0.101519 0.203063 0.5 0.61
7 -0.296646 0.499685
Block 4 * Oscillating Condition -0.294391 0.195986
-1.502
0.133 -0.67868 0.089899
Block 4 * Constant Increase Condition 0.022933 0.203134 0.113 0.91 -0.375372 0.421239
Block 5 * Oscillating Condition -0.102846 0.196061
-0.525 0.6 -0.487283 0.28159
Block 5 * Constant Increase Condition -0.116757 0.203049
-0.575
0.565 -0.514896 0.281382
Block 6 * Oscillating Condition 0.156479 0.196325 0.797 0.42
5 -0.228473 0.541432
Block 6 * Constant Increase Condition 0.202111 0.203243 0.994 0.32 -0.196408 0.600629
Oscillating Condition * Block Trial -0.001858 0.021869
-0.085
0.933 -0.04567 0.041955
Constant Increase Condition * Block Trial -0.001343 0.022662
-0.059
0.953 -0.046746 0.04406
Oscillating Condition * Location -0.08128 0.114129
-0.712
0.476 -0.305062 0.142501
Constant Increase Condition * Location -0.151611 0.118255
-1.282 0.2 -0.383483 0.08026
Oscillating Condition * Action Requirement 0.228515 0.190347 1.201 0.23
7 -0.156655 0.613685
Constant Increase Condition * Action Requirement 0.172223 0.19734 0.873 0.388 -0.227088 0.571534
Oscillating Condition * Directionality -0.260133 0.195585 -1.33 0.19
2 -0.656457 0.13619
Constant Increase Condition * Directionality 0.055558 0.201022 0.276 0.78
4 -0.352193 0.463309
Block 2 * Location * Block Trial -0.000633 0.047882
-0.013
0.989 -0.094519 0.093253
Block 3 * Location * Block Trial -0.053404 0.04792 -1.114
0.265 -0.147365 0.040557
Block 4 * Location * Block Trial -0.057935 0.047683
-1.215
0.224 -0.15143 0.03556
Block 5 * Location * Block Trial -0.039027 0.047669
-0.819
0.413 -0.132496 0.054442
Block 6 * Location * Block Trial 0.005996 0.047698 0.126 0.9 -0.08753 0.099522
Block 2 * Action Requirement * Block Trial -0.05471 0.047521
-1.151 0.25 -0.147888 0.038468
Block 3 * Action Requirement * Block Trial 0.07674 0.047289 1.623 0.10
5 -0.015983 0.169464
Block 4 * Action Requirement * Block Trial 0.047887 0.047213 1.014 0.31
1 -0.044688 0.140463
Block 5 * Action Requirement * Block Trial -0.017653 0.047204
-0.374
0.708 -0.110212 0.074905

181
Block 6 * Action Requirement * Block Trial 0.039361 0.047282 0.832 0.40
5 -0.05335 0.132072
Block 2 * Location * Action Requirement -0.24689 0.327059
-0.755 0.45 -0.888183 0.394403
Block 3 * Location * Action Requirement -0.194712 0.326168
-0.597
0.551 -0.834258 0.444833
Block 4 * Location * Action Requirement -0.400487 0.326245
-1.228 0.22 -1.040186 0.239211
Block 5 * Location * Action Requirement -0.421755 0.326183
-1.293
0.196 -1.061331 0.217821
Block 6 * Location * Action Requirement -0.35727 0.326511
-1.094
0.274 -0.997489 0.282949
Block 2 * Location * Directionality 0.042797 0.337084 0.127 0.89
9 -0.618149 0.703742
Block 3 * Location * Directionality -0.510748 0.338758
-1.508
0.132 -1.174976 0.15348
Block 4 * Location * Directionality 0.269405 0.336888 0.8 0.42
4 -0.391156 0.929967
Block 5 * Location * Directionality 0.116926 0.338618 0.345 0.73 -0.547028 0.78088
Block 6 * Location * Directionality -0.464836 0.334758
-1.389
0.165 -1.121223 0.19155
Block 2 * Directionality * Action Requirement -0.159879 0.334875
-0.477
0.633 -0.816498 0.49674
Block 3 * Directionality * Action Requirement -0.12192 0.339083 -0.36 0.71
9 -0.786786 0.542947
Block 4 * Directionality * Action Requirement -0.344384 0.335607
-1.026
0.305 -1.002437 0.313668
Block 5 * Directionality * Action Requirement -0.434955 0.339676
-1.281 0.2 -1.100986 0.231076
Block 6 * Directionality * Action Requirement -0.364246 0.334913
-1.088
0.277 -1.020936 0.292443
Location * Action Requirement * Block Trial 0.034021 0.027859 1.221 0.22
2 -0.020605 0.088647
Location * Directionality * Block Trial 0.067401 0.02819 2.391 0.017 0.012127 0.122675
Action Requirement * Block Trial -0.026675 0.02205 -1.21 0.226 -0.069909 0.01656
Directionality * Action Requirement * Block Trial 0.081758 0.028488 2.87 0.00
4 0.0259 0.137616
Location * Directionality * Action Requirement 0.050721 0.196679 0.258 0.79
7 -0.334923 0.436365
Location * Cross-Body * Block Trial -0.007403 0.019409
-0.381
0.703 -0.04546 0.030654
Location * Open-Body* Block Trial -0.033708 0.019645
-1.716
0.086 -0.072227 0.004811
Block 2 * Oscillating Condition * Block Trial 0.046979 0.057209 0.821 0.41
2 -0.065195 0.159153
Block 2 * Constant Increase Condition * Block Trial 0.036488 0.05928 0.616 0.538 -0.079749 0.152725
Block 3 * Oscillating Condition * Block Trial 0.085403 0.056986 1.499 0.13
4 -0.026335 0.197141
Block 3 * Constant Increase Condition * Block Trial 0.095171 0.05914 1.609 0.108 -0.020791 0.211133
Block 4 * Oscillating Condition * Block Trial 0.042297 0.056974 0.742 0.45
8 -0.069416 0.154011
Block 4 * Constant Increase Condition * Block Trial 0.081128 0.059131 1.372 0.17 -0.034816 0.197072
Block 5 * Oscillating Condition * Block Trial -0.011272 0.057058
-0.198
0.843 -0.123151 0.100607
Block 5 * Constant Increase Condition * Block Trial 0.099267 0.059246 1.676 0.09
4 -0.016902 0.215437
Block 6 * Oscillating Condition * Block Trial 0.039108 0.057066 0.685 0.49
3 -0.072785 0.151002
Block 6 * Constant Increase Condition * Block Trial 0.084736 0.059015 1.436 0.15
1 -0.030981 0.200452
Block 2 * Oscillating Condition * Location -0.196203 0.393109
-0.499
0.618 -0.967008 0.574602
Block 2 * Constant Increase Condition * Location -0.074386 0.406776
-0.183
0.855 -0.87199 0.723217
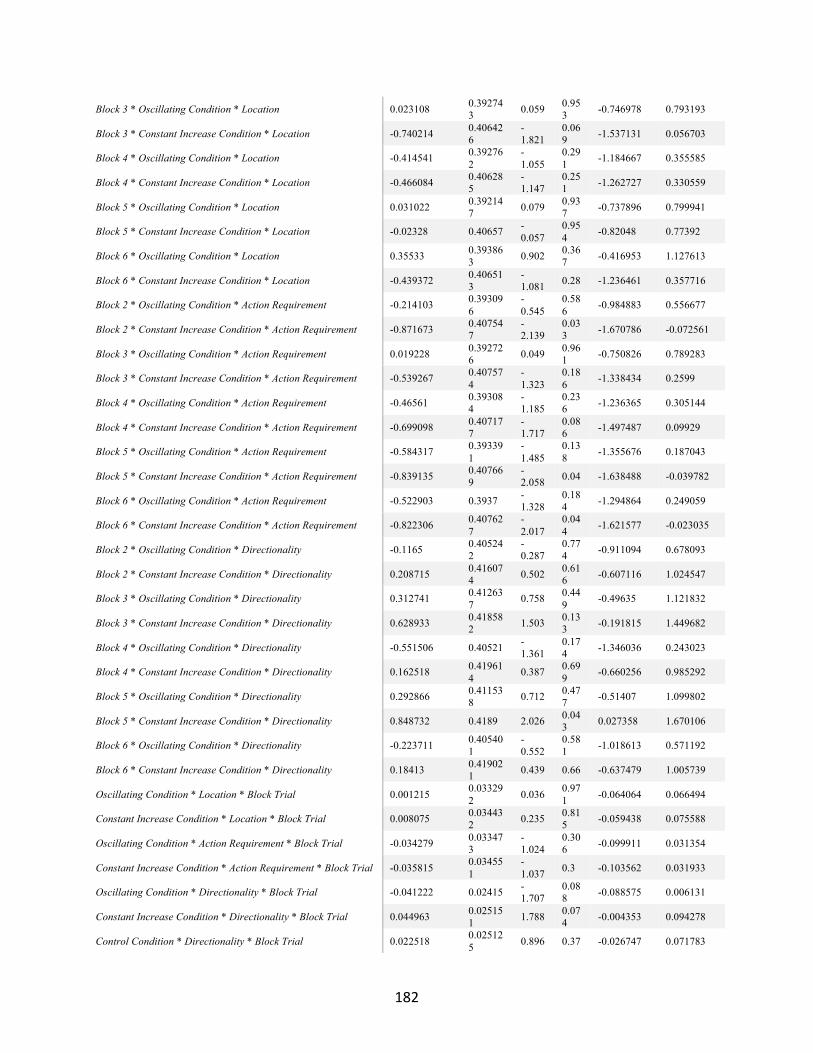
182
Block 3 * Oscillating Condition * Location 0.023108 0.392743 0.059 0.95
3 -0.746978 0.793193
Block 3 * Constant Increase Condition * Location -0.740214 0.406426
-1.821
0.069 -1.537131 0.056703
Block 4 * Oscillating Condition * Location -0.414541 0.392762
-1.055
0.291 -1.184667 0.355585
Block 4 * Constant Increase Condition * Location -0.466084 0.406285
-1.147
0.251 -1.262727 0.330559
Block 5 * Oscillating Condition * Location 0.031022 0.392147 0.079 0.93
7 -0.737896 0.799941
Block 5 * Constant Increase Condition * Location -0.02328 0.40657 -0.057
0.954 -0.82048 0.77392
Block 6 * Oscillating Condition * Location 0.35533 0.393863 0.902 0.36
7 -0.416953 1.127613
Block 6 * Constant Increase Condition * Location -0.439372 0.406513
-1.081 0.28 -1.236461 0.357716
Block 2 * Oscillating Condition * Action Requirement -0.214103 0.393096
-0.545
0.586 -0.984883 0.556677
Block 2 * Constant Increase Condition * Action Requirement -0.871673 0.407547
-2.139
0.033 -1.670786 -0.072561
Block 3 * Oscillating Condition * Action Requirement 0.019228 0.392726 0.049 0.96
1 -0.750826 0.789283
Block 3 * Constant Increase Condition * Action Requirement -0.539267 0.407574
-1.323
0.186 -1.338434 0.2599
Block 4 * Oscillating Condition * Action Requirement -0.46561 0.393084
-1.185
0.236 -1.236365 0.305144
Block 4 * Constant Increase Condition * Action Requirement -0.699098 0.407177
-1.717
0.086 -1.497487 0.09929
Block 5 * Oscillating Condition * Action Requirement -0.584317 0.393391
-1.485
0.138 -1.355676 0.187043
Block 5 * Constant Increase Condition * Action Requirement -0.839135 0.407669
-2.058 0.04 -1.638488 -0.039782
Block 6 * Oscillating Condition * Action Requirement -0.522903 0.3937 -1.328
0.184 -1.294864 0.249059
Block 6 * Constant Increase Condition * Action Requirement -0.822306 0.407627
-2.017
0.044 -1.621577 -0.023035
Block 2 * Oscillating Condition * Directionality -0.1165 0.405242
-0.287
0.774 -0.911094 0.678093
Block 2 * Constant Increase Condition * Directionality 0.208715 0.416074 0.502 0.61
6 -0.607116 1.024547
Block 3 * Oscillating Condition * Directionality 0.312741 0.412637 0.758 0.44
9 -0.49635 1.121832
Block 3 * Constant Increase Condition * Directionality 0.628933 0.418582 1.503 0.13
3 -0.191815 1.449682
Block 4 * Oscillating Condition * Directionality -0.551506 0.40521 -1.361
0.174 -1.346036 0.243023
Block 4 * Constant Increase Condition * Directionality 0.162518 0.419614 0.387 0.69
9 -0.660256 0.985292
Block 5 * Oscillating Condition * Directionality 0.292866 0.411538 0.712 0.47
7 -0.51407 1.099802
Block 5 * Constant Increase Condition * Directionality 0.848732 0.4189 2.026 0.043 0.027358 1.670106
Block 6 * Oscillating Condition * Directionality -0.223711 0.405401
-0.552
0.581 -1.018613 0.571192
Block 6 * Constant Increase Condition * Directionality 0.18413 0.419021 0.439 0.66 -0.637479 1.005739
Oscillating Condition * Location * Block Trial 0.001215 0.033292 0.036 0.97
1 -0.064064 0.066494
Constant Increase Condition * Location * Block Trial 0.008075 0.034432 0.235 0.81
5 -0.059438 0.075588
Oscillating Condition * Action Requirement * Block Trial -0.034279 0.033473
-1.024
0.306 -0.099911 0.031354
Constant Increase Condition * Action Requirement * Block Trial -0.035815 0.034551
-1.037 0.3 -0.103562 0.031933
Oscillating Condition * Directionality * Block Trial -0.041222 0.02415 -1.707
0.088 -0.088575 0.006131
Constant Increase Condition * Directionality * Block Trial 0.044963 0.025151 1.788 0.07
4 -0.004353 0.094278
Control Condition * Directionality * Block Trial 0.022518 0.025125 0.896 0.37 -0.026747 0.071783
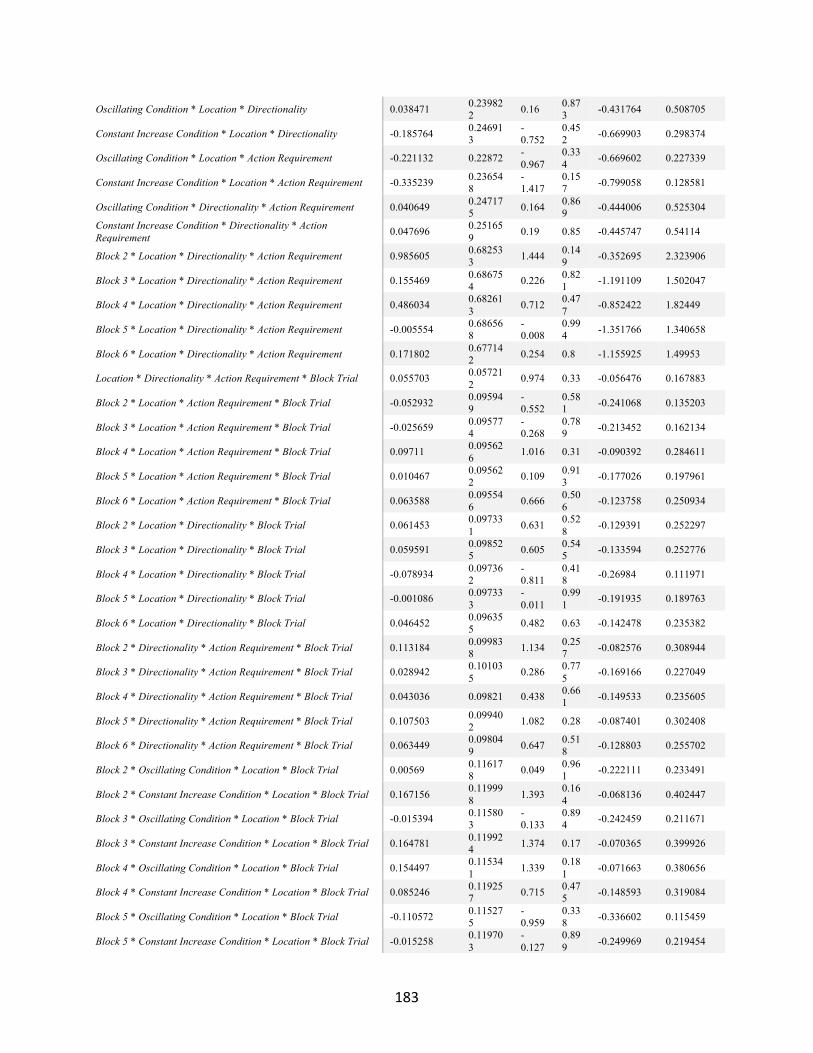
183
Oscillating Condition * Location * Directionality 0.038471 0.239822 0.16 0.87
3 -0.431764 0.508705
Constant Increase Condition * Location * Directionality -0.185764 0.246913
-0.752
0.452 -0.669903 0.298374
Oscillating Condition * Location * Action Requirement -0.221132 0.22872 -0.967
0.334 -0.669602 0.227339
Constant Increase Condition * Location * Action Requirement -0.335239 0.236548
-1.417
0.157 -0.799058 0.128581
Oscillating Condition * Directionality * Action Requirement 0.040649 0.247175 0.164 0.86
9 -0.444006 0.525304
Constant Increase Condition * Directionality * Action Requirement 0.047696 0.25165
9 0.19 0.85 -0.445747 0.54114
Block 2 * Location * Directionality * Action Requirement 0.985605 0.682533 1.444 0.14
9 -0.352695 2.323906
Block 3 * Location * Directionality * Action Requirement 0.155469 0.686754 0.226 0.82
1 -1.191109 1.502047
Block 4 * Location * Directionality * Action Requirement 0.486034 0.682613 0.712 0.47
7 -0.852422 1.82449
Block 5 * Location * Directionality * Action Requirement -0.005554 0.686568
-0.008
0.994 -1.351766 1.340658
Block 6 * Location * Directionality * Action Requirement 0.171802 0.677142 0.254 0.8 -1.155925 1.49953
Location * Directionality * Action Requirement * Block Trial 0.055703 0.057212 0.974 0.33 -0.056476 0.167883
Block 2 * Location * Action Requirement * Block Trial -0.052932 0.095949
-0.552
0.581 -0.241068 0.135203
Block 3 * Location * Action Requirement * Block Trial -0.025659 0.095774
-0.268
0.789 -0.213452 0.162134
Block 4 * Location * Action Requirement * Block Trial 0.09711 0.095626 1.016 0.31 -0.090392 0.284611
Block 5 * Location * Action Requirement * Block Trial 0.010467 0.095622 0.109 0.91
3 -0.177026 0.197961
Block 6 * Location * Action Requirement * Block Trial 0.063588 0.095546 0.666 0.50
6 -0.123758 0.250934
Block 2 * Location * Directionality * Block Trial 0.061453 0.097331 0.631 0.52
8 -0.129391 0.252297
Block 3 * Location * Directionality * Block Trial 0.059591 0.098525 0.605 0.54
5 -0.133594 0.252776
Block 4 * Location * Directionality * Block Trial -0.078934 0.097362
-0.811
0.418 -0.26984 0.111971
Block 5 * Location * Directionality * Block Trial -0.001086 0.097333
-0.011
0.991 -0.191935 0.189763
Block 6 * Location * Directionality * Block Trial 0.046452 0.096355 0.482 0.63 -0.142478 0.235382
Block 2 * Directionality * Action Requirement * Block Trial 0.113184 0.099838 1.134 0.25
7 -0.082576 0.308944
Block 3 * Directionality * Action Requirement * Block Trial 0.028942 0.101035 0.286 0.77
5 -0.169166 0.227049
Block 4 * Directionality * Action Requirement * Block Trial 0.043036 0.09821 0.438 0.661 -0.149533 0.235605
Block 5 * Directionality * Action Requirement * Block Trial 0.107503 0.099402 1.082 0.28 -0.087401 0.302408
Block 6 * Directionality * Action Requirement * Block Trial 0.063449 0.098049 0.647 0.51
8 -0.128803 0.255702
Block 2 * Oscillating Condition * Location * Block Trial 0.00569 0.116178 0.049 0.96
1 -0.222111 0.233491
Block 2 * Constant Increase Condition * Location * Block Trial 0.167156 0.119998 1.393 0.16
4 -0.068136 0.402447
Block 3 * Oscillating Condition * Location * Block Trial -0.015394 0.115803
-0.133
0.894 -0.242459 0.211671
Block 3 * Constant Increase Condition * Location * Block Trial 0.164781 0.119924 1.374 0.17 -0.070365 0.399926
Block 4 * Oscillating Condition * Location * Block Trial 0.154497 0.115341 1.339 0.18
1 -0.071663 0.380656
Block 4 * Constant Increase Condition * Location * Block Trial 0.085246 0.119257 0.715 0.47
5 -0.148593 0.319084
Block 5 * Oscillating Condition * Location * Block Trial -0.110572 0.115275
-0.959
0.338 -0.336602 0.115459
Block 5 * Constant Increase Condition * Location * Block Trial -0.015258 0.119703
-0.127
0.899 -0.249969 0.219454

184
Block 6 * Oscillating Condition * Location * Block Trial -0.03459 0.115409 -0.3 0.76
4 -0.260884 0.191704
Block 6 * Constant Increase Condition * Location * Block Trial 0.000317 0.119241 0.003 0.99
8 -0.233489 0.234123
Block 2 * Oscillating Condition * Action Requirement * Block Trial 0.36605 0.11523
5 3.177 0.002 0.140098 0.592002
Block 2 * Constant Increase Condition * Action Requirement * Block Trial 0.279487 0.11963
2 2.336 0.02 0.044912 0.514061
Block 3 * Oscillating Condition * Action Requirement * Block Trial 0.350962 0.11490
2 3.054 0.002 0.125662 0.576262
Block 3 * Constant Increase Condition * Action Requirement * Block Trial 0.163009 0.11922
6 1.367 0.172 -0.070769 0.396787
Block 4 * Oscillating Condition * Action Requirement * Block Trial 0.174546 0.11451
6 1.524 0.128 -0.049997 0.399089
Block 4 * Constant Increase Condition * Action Requirement * Block Trial 0.02432 0.11914
9 0.204 0.838 -0.209306 0.257946
Block 5 * Oscillating Condition * Action Requirement * Block Trial 0.229627 0.11421
1 2.011 0.044 0.005681 0.453572
Block 5 * Constant Increase Condition * Action Requirement * Block Trial 0.072221 0.11885
9 0.608 0.543 -0.160838 0.305279
Block 6 * Oscillating Condition * Action Requirement * Block Trial 0.161293 0.11449
5 1.409 0.159 -0.063209 0.385795
Block 6 * Constant Increase Condition * Action Requirement * Block Trial 0.031873 0.11893
2 0.268 0.789 -0.201329 0.265076
Block 2 * Oscillating Condition * Directionality * Block Trial -0.261758 0.11901 -2.199
0.028 -0.495111 -0.028404
Block 2 * Constant Increase Condition * Directionality * Block Trial -0.089638 0.12361
8 -0.725
0.468 -0.332027 0.152751
Block 3 * Oscillating Condition * Directionality * Block Trial -0.238385 0.122699
-1.943
0.052 -0.478971 0.002202
Block 3 * Constant Increase Condition * Directionality * Block Trial 0.018511 0.1237 0.15 0.88
1 -0.224039 0.261061
Block 4 * Oscillating Condition * Directionality * Block Trial 0.005122 0.1196 0.043 0.966 -0.229387 0.239631
Block 4 * Constant Increase Condition * Directionality * Block Trial -0.112725 0.12427
3 -0.907
0.364 -0.356397 0.130947
Block 5 * Oscillating Condition * Directionality * Block Trial -0.073302 0.120535
-0.608
0.543 -0.309645 0.163041
Block 5 * Constant Increase Condition * Directionality * Block Trial 0.029015 0.12371
5 0.235 0.815 -0.213564 0.271595
Block 6 * Oscillating Condition * Directionality * Block Trial -0.065344 0.119257
-0.548
0.584 -0.299181 0.168493
Block 6 * Constant Increase Condition * Directionality * Block Trial 0.002656 0.12375
8 0.021 0.983 -0.240007 0.245319
Block 2 * Oscillating Condition * Location * Action Requirement -0.056564 0.789606
-0.072
0.943 -1.604821 1.491694
Block 2 * Constant Increase Condition * Location * Action Requirement 0.519046 0.81735
9 0.635 0.525 -1.08363 2.121722
Block 3 * Oscillating Condition * Location * Action Requirement -1.044536 0.785759
-1.329
0.184 -2.585253 0.49618
Block 3 * Constant Increase Condition * Location * Action Requirement -0.338473 0.81477
3 -0.415
0.678 -1.936079 1.259134
Block 4 * Oscillating Condition * Location * Action Requirement -0.623424 0.78535 -0.794
0.427 -2.16334 0.916491
Block 4 * Constant Increase Condition * Location * Action Requirement -0.405466 0.81483
7 -0.498
0.619 -2.003198 1.192265
Block 5 * Oscillating Condition * Location * Action Requirement -0.446303 0.785573
-0.568 0.57 -1.986657 1.094051
Block 5 * Constant Increase Condition * Location * Action Requirement -0.106293 0.81548 -0.13 0.89
6 -1.705286 1.4927
Block 6 * Oscillating Condition * Location * Action Requirement 0.353806 0.787162 0.449 0.65
3 -1.189661 1.897273
Block 6 * Constant Increase Condition * Location * Action Requirement -0.376442 0.81516
1 -0.462
0.644 -1.974811 1.221927
Block 2 * Oscillating Condition * Location * Directionality 0.616907 0.810419 0.761 0.44
7 -0.972159 2.205973
Block 2 * Constant Increase Condition * Location * Directionality 0.137111 0.83555 0.164 0.87 -1.50123 1.775452
Block 3 * Oscillating Condition * Location * Directionality 1.228259 0.82283 1.493 0.136 -0.385142 2.841661

185
Block 3 * Constant Increase Condition * Location * Directionality -1.554441 0.83219
9 -1.868
0.062 -3.186215 0.077333
Block 4 * Oscillating Condition * Location * Directionality -0.297778 0.809406
-0.368
0.713 -1.884858 1.289301
Block 4 * Constant Increase Condition * Location * Directionality -1.038981 0.83903
2 -1.238
0.216 -2.68415 0.606189
Block 5 * Oscillating Condition * Location * Directionality 0.856763 0.816214 1.05 0.29
4 -0.743667 2.457193
Block 5 * Constant Increase Condition * Location * Directionality -0.878335 0.83476 -
1.052 0.293 -2.515129 0.75846
Block 6 * Oscillating Condition * Location * Directionality 0.871255 0.812928 1.072 0.28
4 -0.722725 2.465236
Block 6 * Constant Increase Condition * Location * Directionality 0.061764 0.83530
6 0.074 0.941 -1.576099 1.699626
Block 2 * Oscillating Condition * Directionality * Action Requirement -0.100997 0.82512
3 -0.122
0.903 -1.718891 1.516898
Block 2 * Constant Increase Condition * Directionality * Action Requirement -1.123208 0.85298
6 -1.317
0.188 -2.795735 0.54932
Block 3 * Oscillating Condition * Directionality * Action Requirement -1.377057 0.83812
3 -1.643 0.1 -3.020436 0.266323
Block 3 * Constant Increase Condition * Directionality * Action Requirement -0.450357 0.85481
2 -0.527
0.598 -2.126465 1.22575
Block 4 * Oscillating Condition * Directionality * Action Requirement -0.824646 0.82463
9 -1 0.317 -2.441588 0.792297
Block 4 * Constant Increase Condition * Directionality * Action Requirement 0.453706 0.85661
7 0.53 0.596 -1.225942 2.133354
Block 5 * Oscillating Condition * Directionality * Action Requirement -0.434726 0.84029
2 -0.517
0.605 -2.082364 1.212911
Block 5 * Constant Increase Condition * Directionality * Action Requirement -0.466139 0.85459
1 -0.545
0.585 -2.141817 1.209538
Block 6 * Oscillating Condition * Directionality * Action Requirement -1.346107 0.82416 -
1.633 0.103 -2.96211 0.269896
Block 6 * Constant Increase Condition * Directionality * Action Requirement -0.330884 0.85643 -
0.386 0.699 -2.010165 1.348396
Oscillating Condition * Location * Action Requirement * Block Trial 0.00076 0.06676
3 0.011 0.991 -0.130147 0.131667
Constant Increase Condition * Location * Action Requirement * Block Trial -0.005812 0.06909
2 -0.084
0.933 -0.141287 0.129663
Oscillating Condition * Location * Directionality * Block Trial 0.088961 0.068554 1.298 0.19
5 -0.045458 0.223379
Constant Increase Condition * Location * Directionality * Block Trial 0.031868 0.07039
4 0.453 0.651 -0.106159 0.169894
Oscillating Condition * Directionality * Action Requirement * Block Trial -0.151172 0.07032
7 -2.15 0.032 -0.289067 -0.013277
Constant Increase Condition * Directionality * Action Requirement * Block Trial -0.099393 0.07196
8 -1.381
0.167 -0.240506 0.041719
Oscillating Condition * Location * Directionality * Action Requirement -0.727878 0.48035 -
1.515 0.13 -1.669736 0.213979
Constant Increase Condition * Location * Directionality * Action Requirement -1.258691 0.49678 -
2.534 0.011 -2.232763 -0.284618
Block 2 * Location * Directionality * Action Requirement * Block Trial 0.24712 0.20144
1 1.227 0.22 -0.147864 0.642103
Block 3 * Location * Directionality * Action Requirement * Block Trial 0.259003 0.20373
1 1.271 0.204 -0.140471 0.658478
Block 4 * Location * Directionality * Action Requirement * Block Trial 0.073346 0.20011
2 0.367 0.714 -0.319033 0.465724
Block 5 * Location * Directionality * Action Requirement * Block Trial 0.23593 0.19980
1 1.181 0.238 -0.155838 0.627699
Block 6 * Location * Directionality * Action Requirement * Block Trial 0.019374 0.19722
8 0.098 0.922 -0.367349 0.406097
Block 2 * Oscillating Condition * Location * Directionality * Action Requirement 1.639288 1.66326
1 0.986 0.324 -1.622063 4.900639
Block 2 * Constant Increase Condition * Location * Directionality * Action Requirement 0.418882 1.72983
7 0.242 0.809 -2.973014 3.810777
Block 3 * Oscillating Condition * Location * Directionality * Action Requirement 1.116407 1.67988
7 0.665 0.506 -2.177547 4.41036
Block 3 * Constant Increase Condition * Location * Directionality * Action Requirement 0.168906 1.71385
1 0.099 0.921 -3.191648 3.52946
Block 4 * Oscillating Condition * Location * Directionality * Action Requirement 0.413856 1.64825
5 0.251 0.802 -2.81807 3.645783
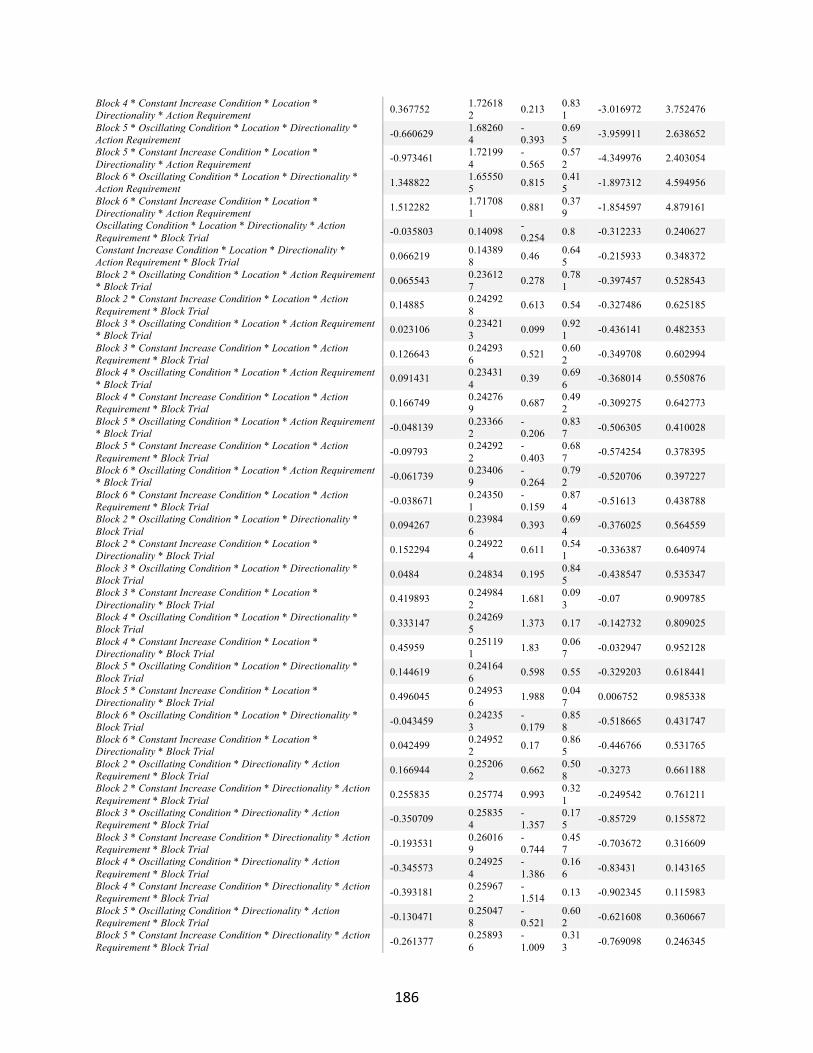
186
Block 4 * Constant Increase Condition * Location * Directionality * Action Requirement 0.367752 1.72618
2 0.213 0.831 -3.016972 3.752476
Block 5 * Oscillating Condition * Location * Directionality * Action Requirement -0.660629 1.68260
4 -0.393
0.695 -3.959911 2.638652
Block 5 * Constant Increase Condition * Location * Directionality * Action Requirement -0.973461 1.72199
4 -0.565
0.572 -4.349976 2.403054
Block 6 * Oscillating Condition * Location * Directionality * Action Requirement 1.348822 1.65550
5 0.815 0.415 -1.897312 4.594956
Block 6 * Constant Increase Condition * Location * Directionality * Action Requirement 1.512282 1.71708
1 0.881 0.379 -1.854597 4.879161
Oscillating Condition * Location * Directionality * Action Requirement * Block Trial -0.035803 0.14098 -
0.254 0.8 -0.312233 0.240627
Constant Increase Condition * Location * Directionality * Action Requirement * Block Trial 0.066219 0.14389
8 0.46 0.645 -0.215933 0.348372
Block 2 * Oscillating Condition * Location * Action Requirement * Block Trial 0.065543 0.23612
7 0.278 0.781 -0.397457 0.528543
Block 2 * Constant Increase Condition * Location * ActionRequirement * Block Trial 0.14885 0.24292
8 0.613 0.54 -0.327486 0.625185
Block 3 * Oscillating Condition * Location * Action Requirement* Block Trial 0.023106 0.23421
3 0.099 0.921 -0.436141 0.482353
Block 3 * Constant Increase Condition * Location * Action Requirement * Block Trial 0.126643 0.24293
6 0.521 0.602 -0.349708 0.602994
Block 4 * Oscillating Condition * Location * Action Requirement * Block Trial 0.091431 0.23431
4 0.39 0.696 -0.368014 0.550876
Block 4 * Constant Increase Condition * Location * Action Requirement * Block Trial 0.166749 0.24276
9 0.687 0.492 -0.309275 0.642773
Block 5 * Oscillating Condition * Location * Action Requirement * Block Trial -0.048139 0.23366
2 -0.206
0.837 -0.506305 0.410028
Block 5 * Constant Increase Condition * Location * Action Requirement * Block Trial -0.09793 0.24292
2 -0.403
0.687 -0.574254 0.378395
Block 6 * Oscillating Condition * Location * Action Requirement * Block Trial -0.061739 0.23406
9 -0.264
0.792 -0.520706 0.397227
Block 6 * Constant Increase Condition * Location * Action Requirement * Block Trial -0.038671 0.24350
1 -0.159
0.874 -0.51613 0.438788
Block 2 * Oscillating Condition * Location * Directionality * Block Trial 0.094267 0.23984
6 0.393 0.694 -0.376025 0.564559
Block 2 * Constant Increase Condition * Location * Directionality * Block Trial 0.152294 0.24922
4 0.611 0.541 -0.336387 0.640974
Block 3 * Oscillating Condition * Location * Directionality * Block Trial 0.0484 0.24834 0.195 0.84
5 -0.438547 0.535347
Block 3 * Constant Increase Condition * Location * Directionality * Block Trial 0.419893 0.24984
2 1.681 0.093 -0.07 0.909785
Block 4 * Oscillating Condition * Location * Directionality * Block Trial 0.333147 0.24269
5 1.373 0.17 -0.142732 0.809025
Block 4 * Constant Increase Condition * Location * Directionality * Block Trial 0.45959 0.25119
1 1.83 0.067 -0.032947 0.952128
Block 5 * Oscillating Condition * Location * Directionality * Block Trial 0.144619 0.24164
6 0.598 0.55 -0.329203 0.618441
Block 5 * Constant Increase Condition * Location * Directionality * Block Trial 0.496045 0.24953
6 1.988 0.047 0.006752 0.985338
Block 6 * Oscillating Condition * Location * Directionality * Block Trial -0.043459 0.24235
3 -0.179
0.858 -0.518665 0.431747
Block 6 * Constant Increase Condition * Location * Directionality * Block Trial 0.042499 0.24952
2 0.17 0.865 -0.446766 0.531765
Block 2 * Oscillating Condition * Directionality * Action Requirement * Block Trial 0.166944 0.25206
2 0.662 0.508 -0.3273 0.661188
Block 2 * Constant Increase Condition * Directionality * Action Requirement * Block Trial 0.255835 0.25774 0.993 0.32
1 -0.249542 0.761211
Block 3 * Oscillating Condition * Directionality * Action Requirement * Block Trial -0.350709 0.25835
4 -1.357
0.175 -0.85729 0.155872
Block 3 * Constant Increase Condition * Directionality * Action Requirement * Block Trial -0.193531 0.26016
9 -0.744
0.457 -0.703672 0.316609
Block 4 * Oscillating Condition * Directionality * Action Requirement * Block Trial -0.345573 0.24925
4 -1.386
0.166 -0.83431 0.143165
Block 4 * Constant Increase Condition * Directionality * Action Requirement * Block Trial -0.393181 0.25967
2 -1.514 0.13 -0.902345 0.115983
Block 5 * Oscillating Condition * Directionality * Action Requirement * Block Trial -0.130471 0.25047
8 -0.521
0.602 -0.621608 0.360667
Block 5 * Constant Increase Condition * Directionality * Action Requirement * Block Trial -0.261377 0.25893
6 -1.009
0.313 -0.769098 0.246345

187
Block 6 * Oscillating Condition * Directionality * Action Requirement * Block Trial -0.204662 0.24544
2 -0.834
0.404 -0.685927 0.276602
Block 6 * Constant Increase Condition * Directionality * Action Requirement * Block Trial -0.305249 0.25871
4 -1.18 0.238 -0.812538 0.20204
Block 2 * Oscillating Condition * Location * Directionality * Action Requirement * Block Trial -0.585955 0.53921
1 -1.087
0.277 -1.64326 0.47135
Block 2 * Constant Increase Condition * Location * Directionality * Action Requirement * Block Trial -0.343353 0.54472
4 -0.63 0.529 -1.41147 0.724764
Block 3 * Oscillating Condition * Location * Directionality * Action Requirement * Block Trial -0.22683 0.54788
2 -0.414
0.679 -1.301139 0.847479
Block 3 * Constant Increase Condition * Location * Directionality * Action Requirement * Block Trial -0.055757 0.54847
4 -0.102
0.919 -1.131227 1.019712
Block 4 * Oscillating Condition * Location * Directionality * Action Requirement * Block Trial -0.802474 0.54120
9 -1.483
0.138 -1.863697 0.25875
Block 4 * Constant Increase Condition * Location * Directionality * Action Requirement * Block Trial -0.831738 0.54988
5 -1.513
0.131 -1.909975 0.246499
Block 5 * Oscillating Condition * Location * Directionality * Action Requirement * Block Trial -0.074564 0.52501
8 -0.142
0.887 -1.10404 0.954913
Block 5 * Constant Increase Condition * Location * Directionality * Action Requirement * Block Trial 0.085154 0.54360
5 0.157 0.876 -0.980768 1.151076
Block 6 * Oscillating Condition * Location * Directionality * Action Requirement * Block Trial -0.474687 0.52436
5 -0.905
0.365 -1.502883 0.553509
Block 6 * Constant Increase Condition * Location * Directionality * Action Requirement * Block Trial -0.384838 0.55214
5 -0.697
0.486 -1.467505 0.697829
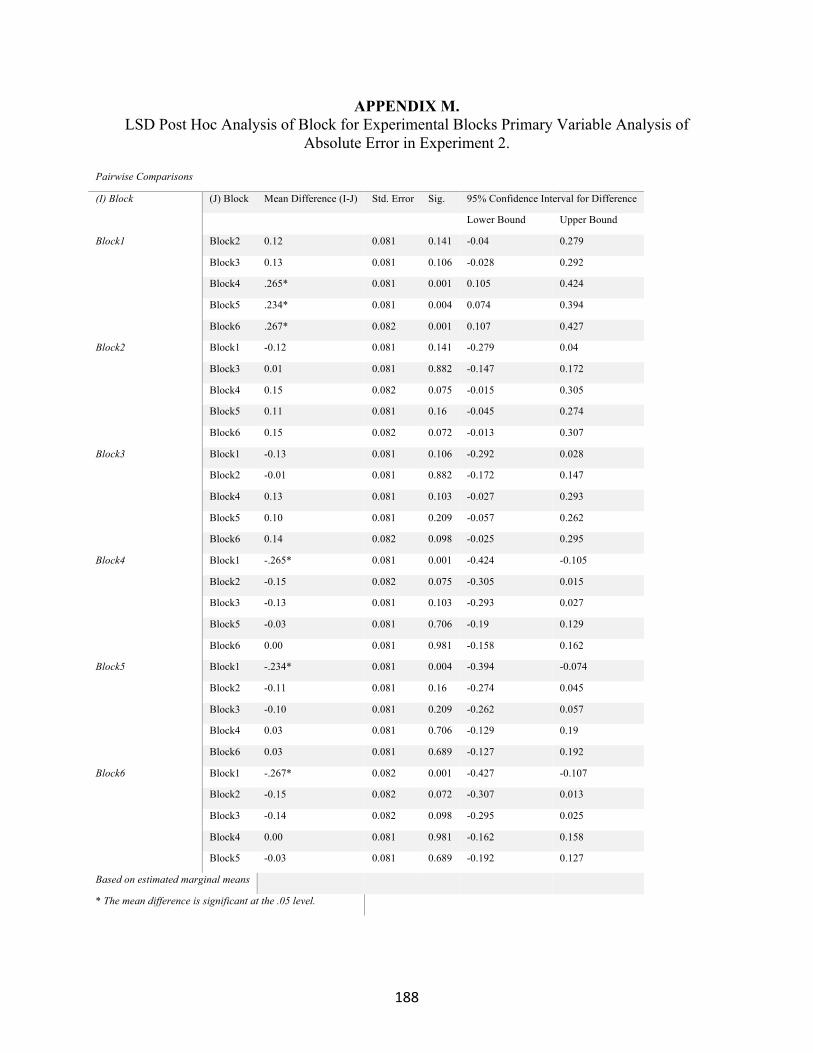
188
APPENDIX M. LSD Post Hoc Analysis of Block for Experimental Blocks Primary Variable Analysis of
Absolute Error in Experiment 2.
Pairwise Comparisons
(I) Block (J) Block Mean Difference (I-J) Std. Error Sig. 95% Confidence Interval for Difference
Lower Bound Upper Bound
Block1 Block2 0.12 0.081 0.141 -0.04 0.279
Block3 0.13 0.081 0.106 -0.028 0.292
Block4 .265* 0.081 0.001 0.105 0.424
Block5 .234* 0.081 0.004 0.074 0.394
Block6 .267* 0.082 0.001 0.107 0.427
Block2 Block1 -0.12 0.081 0.141 -0.279 0.04
Block3 0.01 0.081 0.882 -0.147 0.172
Block4 0.15 0.082 0.075 -0.015 0.305
Block5 0.11 0.081 0.16 -0.045 0.274
Block6 0.15 0.082 0.072 -0.013 0.307
Block3 Block1 -0.13 0.081 0.106 -0.292 0.028
Block2 -0.01 0.081 0.882 -0.172 0.147
Block4 0.13 0.081 0.103 -0.027 0.293
Block5 0.10 0.081 0.209 -0.057 0.262
Block6 0.14 0.082 0.098 -0.025 0.295
Block4 Block1 -.265* 0.081 0.001 -0.424 -0.105
Block2 -0.15 0.082 0.075 -0.305 0.015
Block3 -0.13 0.081 0.103 -0.293 0.027
Block5 -0.03 0.081 0.706 -0.19 0.129
Block6 0.00 0.081 0.981 -0.158 0.162
Block5 Block1 -.234* 0.081 0.004 -0.394 -0.074
Block2 -0.11 0.081 0.16 -0.274 0.045
Block3 -0.10 0.081 0.209 -0.262 0.057
Block4 0.03 0.081 0.706 -0.129 0.19
Block6 0.03 0.081 0.689 -0.127 0.192
Block6 Block1 -.267* 0.082 0.001 -0.427 -0.107
Block2 -0.15 0.082 0.072 -0.307 0.013
Block3 -0.14 0.082 0.098 -0.295 0.025
Block4 0.00 0.081 0.981 -0.162 0.158
Block5 -0.03 0.081 0.689 -0.192 0.127
Based on estimated marginal means
* The mean difference is significant at the .05 level.

189
APPENDIX N. LSD Post Hoc Analysis of Location by Action Requirement by Condition by Directionality for
Experimental Blocks Primary Variable Analysis of Absolute Error in Experiment 2.
Pairwise Comparisons
Location Action Requirement Condition (I)
Directionality (J) Directionality Mean Difference (I-J)
Std. Error Sig. 95% Confidence Interval for
Difference
Lower Bound Upper Bound
Peripheral Cross Body Oscillating Under Rotation Over Rotation 0.067 0.204 0.74
4 -0.335 0.468
Over Rotation Under Rotation -0.067 0.204 0.744 -0.468 0.335
Constant Increase
Under Rotation Over Rotation 0.184 0.205 0.37 -0.22 0.588
Over Rotation Under Rotation -0.184 0.205 0.37 -0.588 0.22
Control Under Rotation Over Rotation 0.246 0.23 0.28
5 -0.206 0.699
Over Rotation Under Rotation -0.246 0.23 0.285 -0.699 0.206
Open Body Oscillating Under Rotation Over Rotation -0.074 0.153 0.62
7 -0.375 0.227
Over Rotation Under Rotation 0.074 0.153 0.627 -0.227 0.375
Constant Increase
Under Rotation Over Rotation 0.3 0.158 0.06 -0.013 0.612
Over Rotation Under Rotation -0.3 0.158 0.06 -0.612 0.013
Control Under Rotation Over Rotation 0.155 0.183 0.39
7 -0.205 0.515
Over Rotation Under Rotation -0.155 0.183 0.397 -0.515 0.205
Frontal Cross Body Oscillating Under Rotation Over Rotation 0.186 0.189 0.32
6 -0.186 0.558
Over Rotation Under Rotation -0.186 0.189 0.326 -0.558 0.186
Constant Increase
Under Rotation Over Rotation .772* 0.187 0 0.403 1.141
Over Rotation Under Rotation -.772* 0.187 0 -1.141 -0.403
Control Under Rotation Over Rotation 0.263 0.158 0.09
7 -0.048 0.573
Over Rotation Under Rotation -0.263 0.158 0.097 -0.573 0.048
Open Body Oscillating Under Rotation Over Rotation 0.203 0.154 0.19
1 -0.102 0.507
Over Rotation Under Rotation -0.203 0.154 0.191 -0.507 0.102
Constant Increase
Under Rotation Over Rotation .450* 0.158 0.00
5 0.14 0.761
Over Rotation Under Rotation -.450* 0.158 0.005 -0.761 -0.14
Control Under Rotation Over Rotation .647* 0.183 0.00
1 0.285 1.008
Over Rotation Under Rotation -.647* 0.183 0.001 -1.008 -0.285
Based on estimated marginal means

190
APPENDIX O. Experiment 2: Experimental Block Secondary Analysis Coefficients of Absolute Error
Estimates of Fixed Effects
Parameter Estimate Std. Error t Sig. 95% Confidence Interval
Lower Bound Upper Bound
Intercept 1.477945 0.165284 8.942 0 1.151289 1.804601
Block 2 -0.074378 0.083791 -0.888 0.375 -0.238673 0.089917
Block 3 -0.113312 0.083003 -1.365 0.172 -0.276063 0.049439
Block 4 -0.207809 0.085981 -2.417 0.016 -0.376398 -0.03922
Block 5 -0.218787 0.086258 -2.536 0.011 -0.387922 -0.049653
Block 6 -0.218835 0.091651 -2.388 0.017 -0.398557 -0.039113
Block Trial -0.026052 0.008997 -2.896 0.005 -0.044089 -0.008015
Location 0.23019 0.184077 1.251 0.211 -0.130754 0.591135
Action Requirement 0.377181 0.08645 4.363 0 0.203101 0.551262
Directionality 0.305123 0.053659 5.686 0 0.199912 0.410335
Oscillating Condition 0.082659 0.148591 0.556 0.582 -0.221577 0.386895
Constant Increase Condition -0.020462 0.153791 -0.133 0.895 -0.335646 0.294723
Total Rotation 1.50E-05 0.002121 0.007 0.994 -0.004143 0.004173
Max Rotation -0.007285 0.007521 -0.969 0.333 -0.022032 0.007462
Rotational Difference 0.012117 0.009311 1.301 0.193 -0.006141 0.030375
Grand_sampEnm3x -2.807348 1.804452 -1.556 0.12 -6.351331 0.736635
Grand_sampEnm3y -0.133312 2.1235 -0.063 0.95 -4.30637 4.039746
SSQ 0.005856 0.012915 0.453 0.651 -0.019696 0.031409
Pre-MSAQ 0.013033 0.028602 0.456 0.652 -0.04565 0.071715
Post-MSAQ 0.017228 0.013891 1.24 0.223 -0.010967 0.045422
Block 2 * SSQ 0.035618 0.027849 1.279 0.201 -0.018988 0.090225
Block 3 * SSQ 0.032749 0.026872 1.219 0.223 -0.019943 0.08544
Block 4 * SSQ -0.003773 0.026561 -0.142 0.887 -0.055876 0.048329
Block 5 * SSQ 0.01759 0.026543 0.663 0.508 -0.034488 0.069669
Block 6 * SSQ 0.045494 0.026679 1.705 0.089 -0.006878 0.097866
Block 2 * Total Rotation 0.001101 0.004071 0.271 0.787 -0.00688 0.009083
Block 3 * Total Rotation -0.001096 0.004395 -0.249 0.803 -0.009713 0.007521
Block 4 * Total Rotation 0.007329 0.004666 1.571 0.116 -0.001821 0.016479
Block 5 * Total Rotation 0.004194 0.004359 0.962 0.336 -0.004352 0.01274
Block 6 * Total Rotation -3.14E-06 0.004418 -0.001 0.999 -0.008667 0.00866
Block 2 * Max Rotation -0.001807 0.006176 -0.293 0.77 -0.013916 0.010302
Block 3 * Max Rotation -0.007244 0.006094 -1.189 0.235 -0.019193 0.004705
Block 4 * Max Rotation 0.00601 0.006044 0.994 0.32 -0.005841 0.017862
Block 5 * Max Rotation -0.000749 0.006154 -0.122 0.903 -0.012816 0.011318

191
Block 6 * Max Rotation -0.006256 0.006093 -1.027 0.305 -0.018203 0.00569
Oscillating Condition * SSQ 0.042619 0.035285 1.208 0.23 -0.027477 0.112716
Constant Increase Condition * SSQ 0.020915 0.030912 0.677 0.499 -0.040031 0.081861
Oscillating Condition * Total Rotation 0.000678 0.00352 0.193 0.847 -0.006223 0.007579
Constant Increase Condition * Total Rotation -0.002271 0.003809 -0.596 0.551 -0.009738 0.005197
Oscillating Condition * Max Rotation -0.000621 0.004388 -0.142 0.887 -0.009225 0.007983
Constant Increase Condition * Max Rotation -0.005973 0.004542 -1.315 0.189 -0.014879 0.002933
Oscillating Condition * Rotational Difference 0.01753 0.015586 1.125 0.261 -0.013041 0.0481
Constant Increase Condition * Rotational Difference 0.014896 0.016529 0.901 0.368 -0.017522 0.047314
Block 2 * Oscillating Condition -0.022963 0.198106 -0.116 0.908 -0.411408 0.365482
Block 2 * Constant Increase Condition 0.07853 0.204874 0.383 0.702 -0.323186 0.480246
Block 3 * Oscillating Condition 0.20204 0.196971 1.026 0.305 -0.184181 0.588262
Block 3 * Constant Increase Condition 0.185271 0.205726 0.901 0.368 -0.218116 0.588657
Block 4 * Oscillating Condition -0.227972 0.200886 -1.135 0.257 -0.621866 0.165922
Block 4 * Constant Increase Condition 0.122017 0.209924 0.581 0.561 -0.289597 0.533632
Block 5 * Oscillating Condition -0.157925 0.197344 -0.8 0.424 -0.544875 0.229026
Block 5 * Constant Increase Condition -0.00564 0.213554 -0.026 0.979 -0.42437 0.413091
Block 6 * Oscillating Condition 0.206423 0.199045 1.037 0.3 -0.183864 0.596709
Block 6 * Constant Increase Condition 0.341844 0.213355 1.602 0.109 -0.076498 0.760185
Block 2 * Oscillating Condition * SSQ 0.154084 0.095522 1.613 0.107 -0.033214 0.341383
Block 2 * Constant Increase Condition * SSQ 0.147802 0.097429 1.517 0.129 -0.043234 0.338839
Block 3 * Oscillating Condition * SSQ 0.230399 0.096623 2.385 0.017 0.040943 0.419855
Block 3 * Constant Increase Condition * SSQ 0.140796 0.098518 1.429 0.153 -0.052379 0.333972
Block 4 * Oscillating Condition * SSQ 0.146175 0.094025 1.555 0.12 -0.038188 0.330538
Block 4 * Constant Increase Condition * SSQ 0.187449 0.096227 1.948 0.052 -0.001245 0.376143
Block 5 * Oscillating Condition * SSQ 0.257014 0.093307 2.754 0.006 0.074054 0.439974
Block 5 * Constant Increase Condition * SSQ 0.206863 0.094945 2.179 0.029 0.020671 0.393055
Block 6 * Oscillating Condition * SSQ 0.171174 0.089749 1.907 0.057 -0.004824 0.347171
Block 6 * Constant Increase Condition * SSQ 0.150569 0.092045 1.636 0.102 -0.029964 0.331102
Block 2 * Oscillating Condition * Total Rotation 0.011415 0.011493 0.993 0.321 -0.011119 0.03395
Block 2 * Constant Increase Condition * Total Rotation 0.004634 0.012535 0.37 0.712 -0.019944 0.029211
Block 3 * Oscillating Condition * Total Rotation -0.005738 0.011744 -0.489 0.625 -0.028765 0.017289
Block 3 * Constant Increase Condition * Total Rotation -0.017483 0.012432 -1.406 0.16 -0.04186 0.006893
Block 4 * Oscillating Condition * Total Rotation -0.001257 0.011849 -0.106 0.916 -0.02449 0.021976
Block 4 * Constant Increase Condition * Total Rotation -0.006638 0.012512 -0.531 0.596 -0.031172 0.017895
Block 5 * Oscillating Condition * Total Rotation 0.009521 0.011298 0.843 0.399 -0.012632 0.031673
Block 5 * Constant Increase Condition * Total Rotation 0.002512 0.012855 0.195 0.845 -0.022694 0.027718
Block 6 * Oscillating Condition * Total Rotation 0.012915 0.010841 1.191 0.234 -0.008343 0.034172
Block 6 * Constant Increase Condition * Total Rotation -0.001695 0.01213 -0.14 0.889 -0.025479 0.022088
Block 2 * Oscillating Condition * Max Rotation 0.008997 0.014811 0.607 0.544 -0.020044 0.038039

192
Block 2 * Constant Increase Condition * Max Rotation 0.006811 0.015516 0.439 0.661 -0.023613 0.037235
Block 3 * Oscillating Condition * Max Rotation 0.001975 0.014737 0.134 0.893 -0.02692 0.030871
Block 3 * Constant Increase Condition * Max Rotation -0.016828 0.015234 -1.105 0.269 -0.046698 0.013043
Block 4 * Oscillating Condition * Max Rotation -0.011154 0.01459 -0.764 0.445 -0.039762 0.017454
Block 4 * Constant Increase Condition * Max Rotation -0.012303 0.015181 -0.81 0.418 -0.04207 0.017464
Block 5 * Oscillating Condition * Max Rotation 0.009853 0.014843 0.664 0.507 -0.019251 0.038957
Block 5 * Constant Increase Condition * Max Rotation 0.003771 0.01542 0.245 0.807 -0.026464 0.034006
Block 6 * Oscillating Condition * Max Rotation 0.013969 0.014668 0.952 0.341 -0.014793 0.04273
Block 6 * Constant Increase Condition * Max Rotation -0.00843 0.01538 -0.548 0.584 -0.038587 0.021727
Block 2 * Oscillating Condition * Rotational Difference -0.102954 0.044989 -2.288 0.022 -0.191167 -0.014741
Block 2 * Constant Increase Condition * Rotational Difference -0.062914 0.043491 -1.447 0.148 -0.14819 0.022363
Block 3 * Oscillating Condition * Rotational Difference -0.041817 0.041527 -1.007 0.314 -0.123242 0.039609
Block 3 * Constant Increase Condition * Rotational Difference -0.084955 0.045398 -1.871 0.061 -0.173969 0.004059
Block 4 * Oscillating Condition * Rotational Difference 0.019581 0.046528 0.421 0.674 -0.07165 0.110812
Block 4 * Constant Increase Condition * Rotational Difference -0.020284 0.046181 -0.439 0.661 -0.110835 0.070267
Block 5 * Oscillating Condition * Rotational Difference -0.050404 0.040023 -1.259 0.208 -0.128881 0.028073
Block 5 * Constant Increase Condition * Rotational Difference -0.030972 0.046652 -0.664 0.507 -0.122445 0.060501
Block 6 * Oscillating Condition * Rotational Difference -0.003156 0.04219 -0.075 0.94 -0.085882 0.079569
Block 6 * Constant Increase Condition * Rotational Difference -0.042002 0.048599 -0.864 0.388 -0.137293 0.053289

193
APPENDIX P. Experiment 2: Pre-/ Post-Test Primary Analysis Coefficients for the Outcome Variable of
Absolute Error
Estimates of Fixed Effects
Parameter Estimate Std. Error
t Sig. 95% Confidence Interval
Lower Bound
Upper Bound
Intercept 2.16408 0.246898
8.765 0 1.672883 2.655277
Pre-test -0.830237 0.125681
-6.606
0 -1.076886 -0.583588
Block Trial 0.092881 0.025319
3.668 0 0.042422 0.143341
Location 0.347905 0.1257 2.768 0.006
0.101222 0.594588
Action Requirement 0.30041 0.128634
2.335 0.02 0.047972 0.552848
Directionality 0.244851 0.132885
1.843 0.066
-0.015921 0.505623
Oscillating Condition -0.011591 0.285046
-0.041
0.968
-0.58812 0.564939
Constant Increase Condition 0.274871 0.295571
0.93 0.358
-0.322932 0.872674
Pre-test * Block Trial 0.031951 0.036453
0.877 0.381
-0.039588 0.103491
Pre-test * Location -0.102838 0.251871
-0.408
0.683
-0.597126 0.391451
Pre-test * Action Requirement -0.135163 0.251731
-0.537
0.591
-0.629176 0.35885
Pre-test * Directionality 0.950214 0.258548
3.675 0 0.442839 1.457588
Location * Block Trial 0.019892 0.037043
0.537 0.591
-0.052803 0.092588
Action Requirement * Block Trial 0.071027 0.037662
1.886 0.06 -0.002882 0.144936
Directionality * Block Trial 0.038761 0.038707
1.001 0.317
-0.037197 0.114718
Location * Action Requirement 0.061774 0.252626
0.245 0.807
-0.433996 0.557543
Directionality * Action Requirement 0.641243 0.298502
2.148 0.032
0.055438 1.227048
Location * Directionality -0.477933 0.256869
-1.861
0.063
-0.98202 0.026155
Oscillating Condition * Block Trial -0.06607 0.061211
-1.079
0.284
-0.188131 0.05599
Constant Increase Condition * Block Trial -0.012727 0.063542
-0.2 0.842
-0.139429 0.113974
Oscillating Condition * Location -0.518895 0.302621
-1.715
0.087
-1.112782 0.074992
Constant Increase Condition * Location 0.219358 0.313836
0.699 0.485
-0.396538 0.835254
Oscillating Condition * Action Requirement -0.014562 0.303308
-0.048
0.962
-0.609794 0.580669
Constant Increase Condition * Action Requirement -0.060287 0.315729
-0.191
0.849
-0.679892 0.559318
Oscillating Condition * Directionality 0.494129 0.31262 1.581 0.114
-0.119356 1.107614
Constant Increase Condition * Directionality 0.030406 0.326182
0.093 0.926
-0.609686 0.670498
Pre-test * Location * Block Trial 0.168711 0.07399 2.28 0.023
0.023511 0.313912
Pre-test * Action Requirement * Block Trial 0.082865 0.074048
1.119 0.263
-0.062447 0.228178
Pre-test * Directionality * Block Trial -0.096409 0.075338
-1.28 0.201
-0.244252 0.051433

194
Pre-test * Location * Action Requirement 0.294901 0.505394
0.584 0.56 -0.696912 1.286713
Pre-test * Location * Directionality 1.100396 0.509613
2.159 0.031
0.100317 2.100474
Pre-test * Directionality * Action Requirement 0.512872 0.528253
0.971 0.332
-0.523773 1.549518
Location * Action Requirement * Block Trial -0.097105 0.074087
-1.311
0.19 -0.242496 0.048286
Location * Directionality * Block Trial 0.115462 0.07507 1.538 0.124
-0.031854 0.262778
Directionality * Action Requirement * Block Trial 0.38054 0.079443
4.79 0 0.224614 0.536467
Location * Directionality * Action Requirement 0.381088 0.521231
0.731 0.465
-0.641799 1.403975
Location * Cross-body * Block Trial -0.02662 0.052336
-0.509
0.611
-0.129326 0.076086
Location * Open-Body * Block Trial 0.07466 0.05242 1.424 0.155
-0.028213 0.177532
Pre-test * Oscillating Condition * Block Trial -0.095594 0.087535
-1.092
0.275
-0.267383 0.076196
Pre-test * Constant Increase Condition * Block Trial -0.10486 0.090692
-1.156
0.248
-0.282844 0.073125
Pre-test * Oscillating Condition * Location 0.498387 0.603263
0.826 0.409
-0.685509 1.682284
Pre-test * Constant Increase Condition * Location 0.000656 0.627201
0.001 0.999
-1.230204 1.231517
Pre-test * Oscillating Condition * Action Requirement -0.59195 0.6044 -0.979
0.328
-1.778081 0.594181
Pre-test * Constant Increase Condition * Action Requirement 0.73619 0.628301
1.172 0.242
-0.496839 1.96922
Pre-test * Oscillating Condition * Directionality 0.549714 0.622203
0.883 0.377
-0.671305 1.770734
Pre-test * Constant Increase Condition * Directionality 1.404308 0.638604
2.199 0.028
0.151096 2.65752
Oscillating Condition * Location * Block Trial -0.016996 0.088969
-0.191
0.849
-0.191593 0.157602
Constant Increase Condition * Location * Block Trial -0.089752 0.092322
-0.972
0.331
-0.270929 0.091426
Oscillating Condition * Action Requirement * Block Trial 0.141827 0.089107
1.592 0.112
-0.03304 0.316695
Constant Increase Condition * Action Requirement * Block Trial 0.10237 0.093096
1.1 0.272
-0.080325 0.285065
Oscillating Condition * Directionality * Block Trial -0.037742 0.063107
-0.598
0.55 -0.161586 0.086102
Constant Increase Condition * Directionality * Block Trial 0.124289 0.069032
1.8 0.072
-0.011176 0.259755
Control Condition * Directionality * Block Trial 0.01959 0.066853
0.293 0.77 -0.111601 0.150782
Oscillating Condition * Location * Action Requirement 0.159019 0.606682
0.262 0.793
-1.031582 1.34962
Constant Increase Condition * Location * Action Requirement 0.231282 0.629257
0.368 0.713
-1.003627 1.466191
Oscillating Condition * Location * Directionality 0.113377 0.620773
0.183 0.855
-1.104847 1.331601
Constant Increase Condition * Location * Directionality -0.458526 0.638669
-0.718
0.473
-1.711875 0.794823
Oscillating Condition * Directionality * Action Requirement 0.106863 0.697666
0.153 0.878
-1.262261 1.475986
Constant Increase Condition * Directionality * Action Requirement -1.41759 0.731175
-1.939
0.053
-2.852572 0.017392
Pre-test * Location * Directionality * Action Requirement 0.905153 1.052562
0.86 0.39 -1.160434 2.97074
Location * Directionality * Action Requirement * Block Trial 0.158362 0.154212
1.027 0.305
-0.144268 0.460992
Pre-test * Location * Action Requirement * Block Trial 0.042277 0.149618
0.283 0.778
-0.25134 0.335895
Pre-test * Location * Directionality * Block Trial -0.108693 0.149598
-0.727
0.468
-0.402267 0.184881
Pre-test * Directionality * Action Requirement * Block Trial 0.06519 0.15406 0.423 0.672
-0.237137 0.367517
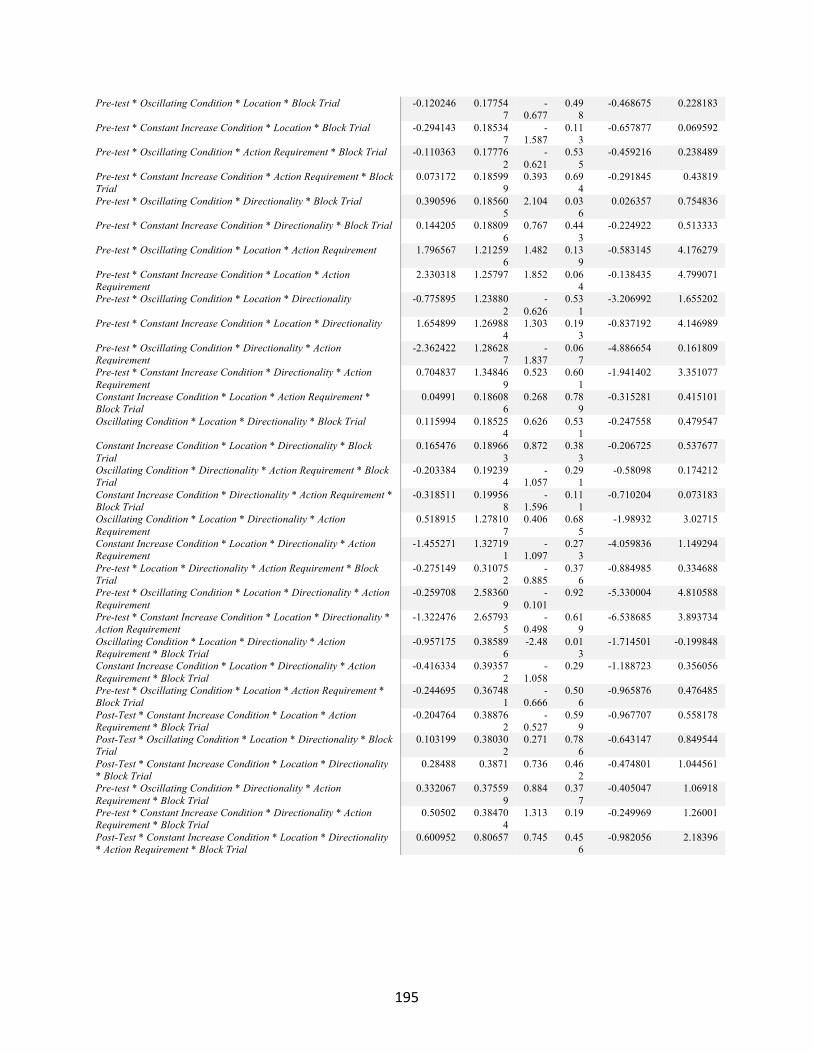
195
Pre-test * Oscillating Condition * Location * Block Trial -0.120246 0.177547
-0.677
0.498
-0.468675 0.228183
Pre-test * Constant Increase Condition * Location * Block Trial -0.294143 0.185347
-1.587
0.113
-0.657877 0.069592
Pre-test * Oscillating Condition * Action Requirement * Block Trial -0.110363 0.177762
-0.621
0.535
-0.459216 0.238489
Pre-test * Constant Increase Condition * Action Requirement * Block Trial
0.073172 0.185999
0.393 0.694
-0.291845 0.43819
Pre-test * Oscillating Condition * Directionality * Block Trial 0.390596 0.185605
2.104 0.036
0.026357 0.754836
Pre-test * Constant Increase Condition * Directionality * Block Trial 0.144205 0.188096
0.767 0.443
-0.224922 0.513333
Pre-test * Oscillating Condition * Location * Action Requirement 1.796567 1.212596
1.482 0.139
-0.583145 4.176279
Pre-test * Constant Increase Condition * Location * Action Requirement
2.330318 1.25797 1.852 0.064
-0.138435 4.799071
Pre-test * Oscillating Condition * Location * Directionality -0.775895 1.238802
-0.626
0.531
-3.206992 1.655202
Pre-test * Constant Increase Condition * Location * Directionality 1.654899 1.269884
1.303 0.193
-0.837192 4.146989
Pre-test * Oscillating Condition * Directionality * Action Requirement
-2.362422 1.286287
-1.837
0.067
-4.886654 0.161809
Pre-test * Constant Increase Condition * Directionality * Action Requirement
0.704837 1.348469
0.523 0.601
-1.941402 3.351077
Constant Increase Condition * Location * Action Requirement * Block Trial
0.04991 0.186086
0.268 0.789
-0.315281 0.415101
Oscillating Condition * Location * Directionality * Block Trial 0.115994 0.185254
0.626 0.531
-0.247558 0.479547
Constant Increase Condition * Location * Directionality * Block Trial
0.165476 0.189663
0.872 0.383
-0.206725 0.537677
Oscillating Condition * Directionality * Action Requirement * Block Trial
-0.203384 0.192394
-1.057
0.291
-0.58098 0.174212
Constant Increase Condition * Directionality * Action Requirement * Block Trial
-0.318511 0.199568
-1.596
0.111
-0.710204 0.073183
Oscillating Condition * Location * Directionality * Action Requirement
0.518915 1.278107
0.406 0.685
-1.98932 3.02715
Constant Increase Condition * Location * Directionality * Action Requirement
-1.455271 1.327191
-1.097
0.273
-4.059836 1.149294
Pre-test * Location * Directionality * Action Requirement * Block Trial
-0.275149 0.310752
-0.885
0.376
-0.884985 0.334688
Pre-test * Oscillating Condition * Location * Directionality * Action Requirement
-0.259708 2.583609
-0.101
0.92 -5.330004 4.810588
Pre-test * Constant Increase Condition * Location * Directionality * Action Requirement
-1.322476 2.657935
-0.498
0.619
-6.538685 3.893734
Oscillating Condition * Location * Directionality * Action Requirement * Block Trial
-0.957175 0.385896
-2.48 0.013
-1.714501 -0.199848
Constant Increase Condition * Location * Directionality * Action Requirement * Block Trial
-0.416334 0.393572
-1.058
0.29 -1.188723 0.356056
Pre-test * Oscillating Condition * Location * Action Requirement * Block Trial
-0.244695 0.367481
-0.666
0.506
-0.965876 0.476485
Post-Test * Constant Increase Condition * Location * Action Requirement * Block Trial
-0.204764 0.388762
-0.527
0.599
-0.967707 0.558178
Post-Test * Oscillating Condition * Location * Directionality * Block Trial
0.103199 0.380302
0.271 0.786
-0.643147 0.849544
Post-Test * Constant Increase Condition * Location * Directionality * Block Trial
0.28488 0.3871 0.736 0.462
-0.474801 1.044561
Pre-test * Oscillating Condition * Directionality * Action Requirement * Block Trial
0.332067 0.375599
0.884 0.377
-0.405047 1.06918
Pre-test * Constant Increase Condition * Directionality * Action Requirement * Block Trial
0.50502 0.384704
1.313 0.19 -0.249969 1.26001
Post-Test * Constant Increase Condition * Location * Directionality * Action Requirement * Block Trial
0.600952 0.80657 0.745 0.456
-0.982056 2.18396

196
APPENDIX Q. Experiment 2: Pre-/ Post-Test Secondary Analysis Coefficients for the Outcome Variable of
Absolute Error Estimates of Fixed Effects Parameter Estimate Std.
Error df t Sig. 95% Confidence Interval
Lower Bound
Upper Bound
Intercept 3.284676 0.323858
212.586
10.142 0 2.646291 3.923062
Post-Test -0.744971 0.13084 971.52
9 -5.694 0 -1.001733 -0.488209
Block Trial 0.087375 0.024614 68.058 3.55 0.00
1 0.03826 0.136491
Location -2.632366
0.536935
992.059
-4.903 0 -3.686025 -1.578708
Action Requirement 0.421691 0.133351
979.182 3.162 0.00
2 0.160004 0.683377
Directionality 0.876291 0.152004
972.775 5.765 0 0.577998 1.174583
Total Rotation 0.011651 0.006292
978.434 1.852 0.06
4 -0.000697 0.023998
Total Rotation 0.100164 0.019136
984.712 5.234 0 0.062612 0.137715
Rotational Difference 0.167429 0.021145
977.661 7.918 0 0.125934 0.208924
SampEn-X -0.900152 4.59621 217.82
5 -0.196
0.845 -9.958888 8.158585
SampEn-Y 6.014723 4.501405
139.878 1.336 0.18
4 -2.884865 14.914311
MSAQ 0.023474 0.020171
279.788 1.164 0.24
6 -0.016233 0.063181
Oscillating Condition -0.00968 0.285555 41.042 -
0.034 0.973 -0.586352 0.566992
Constant Increase Condition 0.10232 0.291446 40.183 0.351 0.72
7 -0.486632 0.691271
Post-Test * Total Rotation -0.006985 0.0074 920.28
7 -0.944
0.346 -0.021508 0.007539
Post-Test * Total Rotation -0.009313 0.00862 912.05
9 -1.08 0.28 -0.026231 0.007605
Post-Test * Rotational Difference -0.048322
0.023015
973.849 -2.1 0.03
6 -0.093486 -0.003158
Oscillating Condition * MSAQ -0.065617
0.053944 128.91 -
1.216 0.226 -0.172347 0.041114
Constant Increase Condition * MSAQ -0.056615
0.048467
391.906
-1.168
0.243 -0.151903 0.038672
Oscillating Condition * Total Rotation -0.004257
0.009543
972.859
-0.446
0.656 -0.022985 0.01447
Constant Increase Condition * Total Rotation 0.017369 0.009719
965.003 1.787 0.07
4 -0.001704 0.036442
Oscillating Condition * Total Rotation -0.019848
0.011066
971.049
-1.794
0.073 -0.041563 0.001868
Constant Increase Condition * Total Rotation 0.004655 0.011516
975.575 0.404 0.68
6 -0.017945 0.027254
Oscillating Condition * Rotational Difference -0.109356
0.030928
900.255
-3.536 0 -0.170055 -0.048657
Constant Increase Condition * Rotational Difference -0.043421
0.030303
805.201
-1.433
0.152 -0.102903 0.016061
Post-Test * Oscillating Condition 0.632098 0.301529 959.56 2.096 0.03
6 0.040366 1.22383
Post-Test * Constant Increase Condition 0.195479 0.317004
967.298 0.617 0.53
8 -0.426615 0.817573
Oscillating Condition * Block Trial -0.054487
0.059581 66.099 -
0.914 0.364 -0.173441 0.064468
Constant Increase Condition * Block Trial 0.008031 0.06192 66.625 0.13 0.897 -0.115575 0.131637
Post-Test * Oscillating Condition * Total Rotation -0.010616
0.018825
960.486
-0.564
0.573 -0.047559 0.026327

197
Post-Test * Constant Increase Condition * Total Rotation -0.011925
0.020058
961.924
-0.595
0.552 -0.051287 0.027437
Post-Test * Oscillating Condition * Total Rotation 0.000166 0.021715
951.257 0.008 0.99
4 -0.042448 0.04278
Post-Test * Constant Increase Condition * Total Rotation 0.009047 0.022373
956.596 0.404 0.68
6 -0.03486 0.052953
Post-Test * Oscillating Condition * Rotational Difference 0.115912 0.057159
968.663 2.028 0.04
3 0.003743 0.228081
Post-Test * Constant Increase Condition * Rotational Difference
-0.001139 0.05516 971.79
1 -0.021
0.984 -0.109386 0.107107
Post-Test * Oscillating Condition * MSAQ 0.30493 0.161487 522.71 1.888 0.06 -0.012312 0.622173
Post-Test * Constant Increase Condition * MSAQ 0.256963 0.16197 500.974 1.586 0.11
3 -0.061261 0.575187

198
APPENDIX R. LSD Post Hoc Analysis of Block for Pre-/ Post-Test Blocks for SampEn-X in Experiment 2.
Pairwise Comparisons (I) Block (J) Block Mean Difference (I-J) Std. Error Sig. 95% Confidence Interval for Difference
Lower Bound Upper Bound
Block1 Block2 -.007* 0.001 0 -0.009 -0.006
Block3 -.006* 0.001 0 -0.008 -0.005
Block4 -.010* 0.001 0 -0.012 -0.009
Block5 -.008* 0.001 0 -0.009 -0.007
Block6 -.017* 0.001 0 -0.018 -0.015
Block2 Block1 .007* 0.001 0 0.006 0.009
Block3 0.001 0.001 0.167 0 0.003
Block4 -.003* 0.001 0 -0.005 -0.002
Block5 -0.001 0.001 0.283 -0.002 0.001
Block6 -.009* 0.001 0 -0.011 -0.008
Block3 Block1 .006* 0.001 0 0.005 0.008
Block2 -0.001 0.001 0.167 -0.003 0
Block4 -.004* 0.001 0 -0.006 -0.003
Block5 -.002* 0.001 0.014 -0.003 0
Block6 -.011* 0.001 0 -0.012 -0.009
Block4 Block1 .010* 0.001 0 0.009 0.012
Block2 .003* 0.001 0 0.002 0.005
Block3 .004* 0.001 0 0.003 0.006
Block5 .002* 0.001 0.001 0.001 0.004
Block6 -.006* 0.001 0 -0.008 -0.005
Block5 Block1 .008* 0.001 0 0.007 0.009
Block2 0.001 0.001 0.283 -0.001 0.002
Block3 .002* 0.001 0.014 0 0.003
Block4 -.002* 0.001 0.001 -0.004 -0.001
Block6 -.009* 0.001 0 -0.01 -0.007
Block6 Block1 .017* 0.001 0 0.015 0.018
Block2 .009* 0.001 0 0.008 0.011
Block3 .011* 0.001 0 0.009 0.012
Block4 .006* 0.001 0 0.005 0.008
Block5 .009* 0.001 0 0.007 0.01
Based on estimated marginal means * The mean difference is significant at the .05 level.

199
APPENDIX S. LSD Post Hoc Analysis of Block for Pre-/ Post-Test Blocks for SampEn-Y in Experiment 2.
Pairwise Comparisons
(I) Block (J) Block Mean Difference (I-J) Std. Error Sig. 95% Confidence Interval for Difference
Lower Bound Upper Bound
Block1 Block2 0.001 0.001 0.094 0 0.002
Block3 -0.001 0.001 0.088 -0.002 0
Block4 -0.001 0.001 0.267 -0.002 0.001
Block5 .004* 0.001 0 0.003 0.005
Block6 .002* 0.001 0 0.001 0.004
Block2 Block1 -0.001 0.001 0.094 -0.002 0
Block3 -.002* 0.001 0.001 -0.003 -0.001
Block4 -.002* 0.001 0.005 -0.003 -0.001
Block5 .003* 0.001 0 0.002 0.004
Block6 .001* 0.001 0.043 4.16E-05 0.002
Block3 Block1 0.001 0.001 0.088 0 0.002
Block2 .002* 0.001 0.001 0.001 0.003
Block4 0 0.001 0.55 -0.001 0.002
Block5 .005* 0.001 0 0.004 0.006
Block6 .003* 0.001 0 0.002 0.005
Block4 Block1 0.001 0.001 0.267 -0.001 0.002
Block2 .002* 0.001 0.005 0.001 0.003
Block3 0 0.001 0.55 -0.002 0.001
Block5 .005* 0.001 0 0.003 0.006
Block6 .003* 0.001 0 0.002 0.004
Block5 Block1 -.004* 0.001 0 -0.005 -0.003
Block2 -.003* 0.001 0 -0.004 -0.002
Block3 -.005* 0.001 0 -0.006 -0.004
Block4 -.005* 0.001 0 -0.006 -0.003
Block6 -.002* 0.001 0.014 -0.003 0
Block6 Block1 -.002* 0.001 0 -0.004 -0.001
Block2 -.001* 0.001 0.043 -0.002 -4.16E-05
Block3 -.003* 0.001 0 -0.005 -0.002
Block4 -.003* 0.001 0 -0.004 -0.002
Block5 .002* 0.001 0.014 0 0.003