1
Pengantar Datamining
Anto Satriyo Nugroho, Dr.Eng
Center for Information & Communication Technology, Agency for the Assessment & Application of Technology (PTIK-BPPT)
Email: [email protected], [email protected] URL: http://asnugroho.net

• Apakah Datamining itu ? • Teknik dalam datamining • Contoh Aplikasi Datamining • Tutorial Pemakaian Software Datamining “WEKA” • Further Readings
Agenda

• Lots of data is being collected and warehoused – Web data, e-commerce – purchases at department/
grocery stores – Bank/Credit Card
transactions
• Computers have become cheaper and more powerful
• Competitive Pressure is Strong – Provide better, customized services for an edge (e.g. in Customer
Relationship Management)
Why Mine Data? Commercial Viewpoint
Slide source: Tan, Steinbach, Kumar, Introduction to Datamining, Pearson Int’l Edition

Why Mine Data? Scientific Viewpoint
• Data collected and stored at enormous speeds (GB/hour)
– remote sensors on a satellite – telescopes scanning the skies
– microarrays generating gene expression data
– scientific simulations generating terabytes of data
• Traditional techniques infeasible for raw data • Data mining may help scientists
– in classifying and segmenting data – in Hypothesis Formation
Slide source: Tan, Steinbach, Kumar, Introduction to Datamining, Pearson Int’l Edition
– Goal: To predict class (star or galaxy) of sky objects, especially visually faint ones, based on the telescopic survey images (from Palomar Observatory).
– 3000 images with 23,040 x 23,040 pixels per image. – Approach:
• Segment the image. • Measure image aJributes (features) -‐ 40 of them per object.
• Model the class based on these features. • Success Story: Could find 16 new high red-‐shiP quasars, some of the farthest objects that are difficult to find!
Large Scale Data : Sky Survey Cataloging

6 http://www.ncbi.nlm.nih.gov/Genbank/genbankstats.html
7
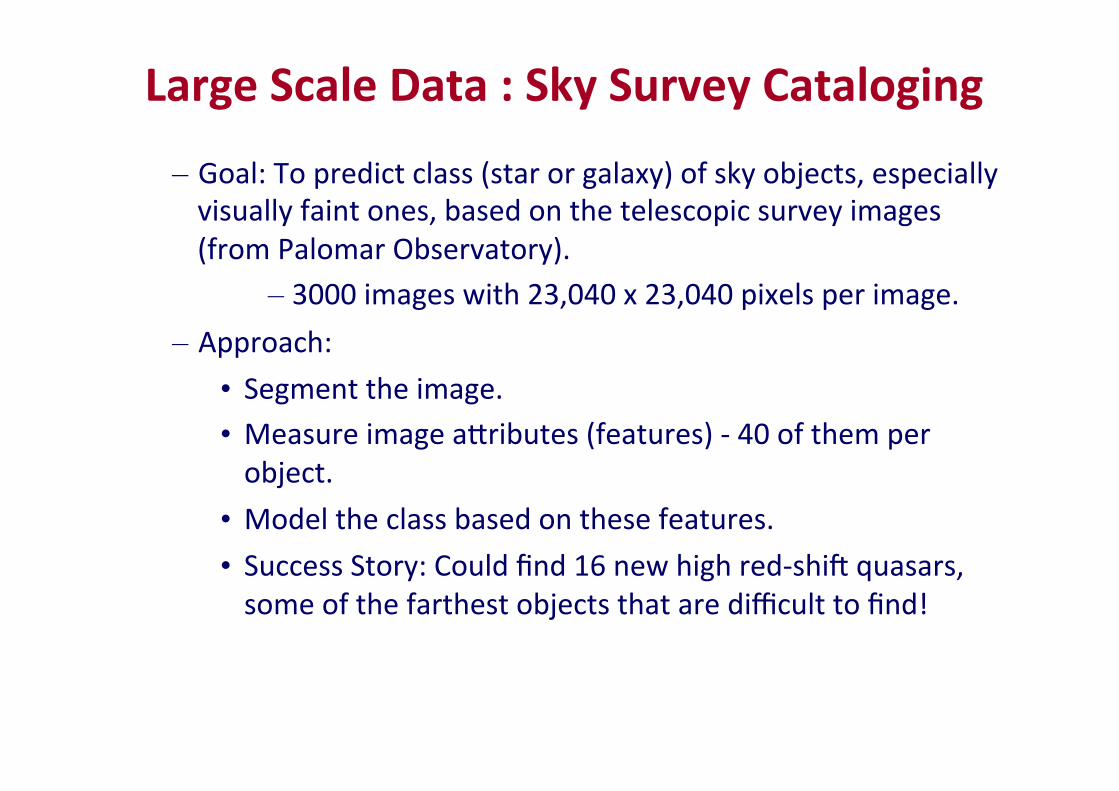
n Measuring the expression of genes
n Possible to obtain the expression of thousands of genes
n Disease classification
Microarray
http://cmgm.stanford.edu/pbrown/array.html
• Definition: automatically (or semiautomatically) process of discovering meaningful pattern in data
• extracting – implicit – previously unknown – potentially useful information from data
Definition of Datamining
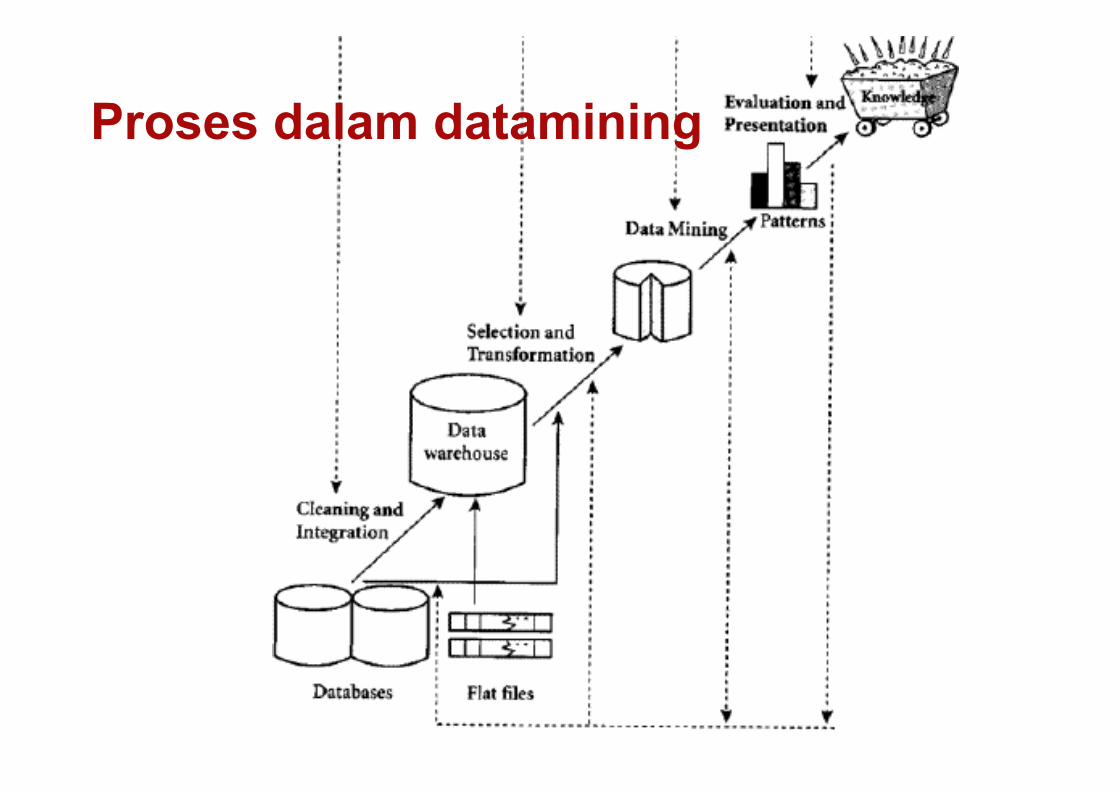
Proses dalam datamining
Datamining Tasks
• Prediction use some variables to predict unknown or future values of other variables
• Description find human-interpretable patterns that describe the data

Datamining Tasks
• Prediction classification regression deviation detection
• Description
clustering association rule discovery sequential pattern discovery

Datamining Techniques
• Prediction classification regression deviation detection
• Description
clustering association rule discovery sequential pattern discovery
Decision Tree Rule-based Bayesian
Artificial Neural network Support Vector Machine
Datamining Techniques
• Prediction classification regression deviation detection
• Description
clustering association rule discovery sequential pattern discovery
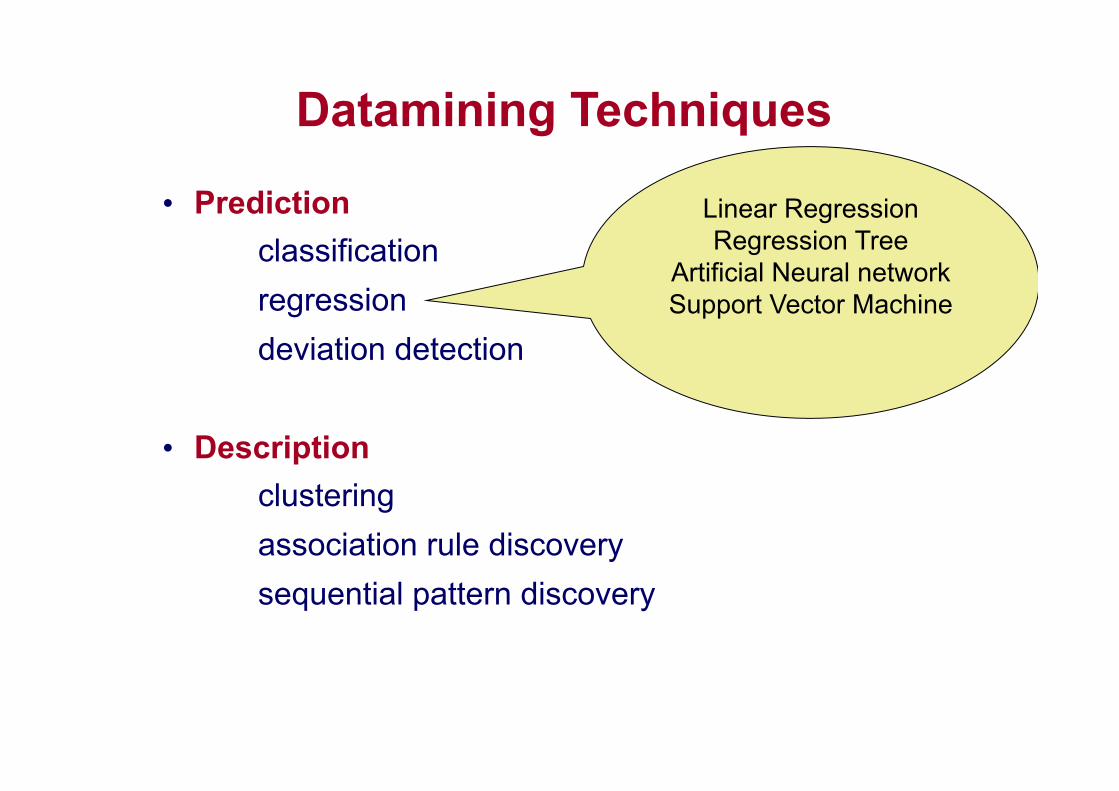
Linear Regression Regression Tree
Artificial Neural network Support Vector Machine

Datamining Techniques
• Prediction classification regression deviation detection
• Description
clustering association rule discovery sequential pattern discovery
K-means Clustering Self Organizing Map
Agglomerative Hierarchical Clustering
DBSCAN

Rule : find the most similar pattern from the training set, then assign the class of the test data by the class of that pattern
X Class A
Class B
X is test pattern
Class of the nearest pattern is A
class of is A X
Nearest Neighbor Classifier
Association Rules & Basket Analysis
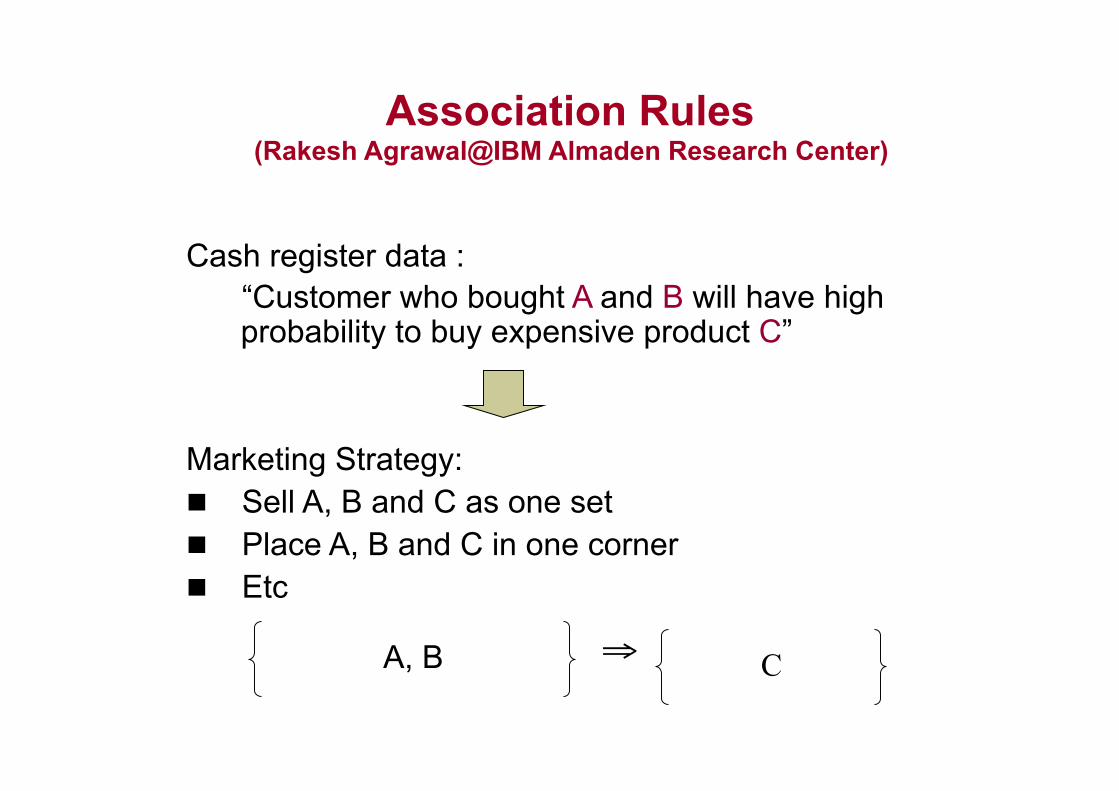
Cash register data : “Customer who bought A and B will have high probability to buy expensive product C”
Marketing Strategy: n Sell A, B and C as one set n Place A, B and C in one corner n Etc
A, B C ⇒
Association Rules (Rakesh Agrawal@IBM Almaden Research Center)

D{ }miii ,...,, 11=Ι
YX ⇒
: Items (products) Database : transactions
φ=∩
⊆
⊆
YXIYIX
Association Rules (Rakesh Agrawal@IBM Almaden Research Center)

YX ∪
YX ⇒
Confidence c% : The ratio between transactions to the total transactions of product X
Support s% : The ratio between transaction to the total transactions
antecedent consequent
YX ⇒
Confidence & Supports

TID Items 001 Beer, coca cola, diapers 002 Beer, diapers 003 Beer,flour 004 Butter, egg, flour
⇒beer diapers
Association Rule Support confidence
50% 67% 25% 33% 25% 100% 25% 33%
⇒beer coca cola ⇒butter flour ⇒beer flour
Confidence & Supports
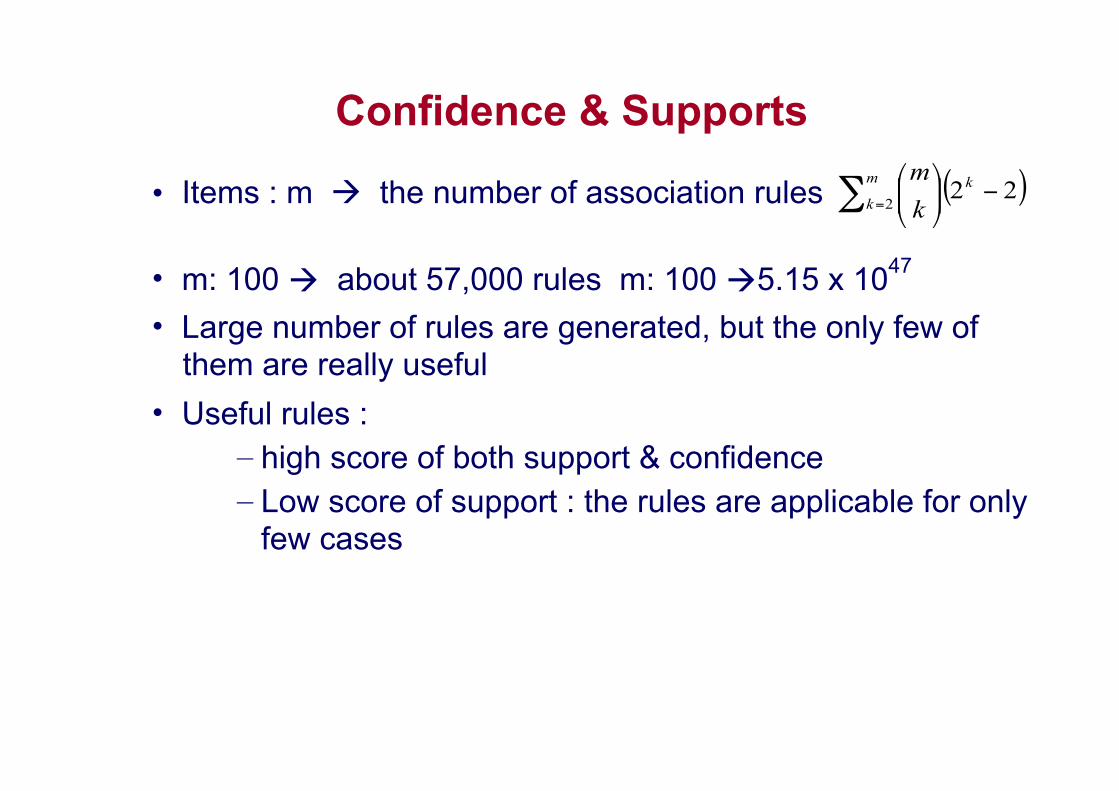
• Items : m à the number of association rules
• m: 100 à about 57,000 rules m: 100 à5.15 x 1047 • Large number of rules are generated, but the only few of
them are really useful • Useful rules :
– high score of both support & confidence – Low score of support : the rules are applicable for only
few cases
( )222
−⎟⎟⎠
⎞⎜⎜⎝
⎛∑ =
km
k km
Confidence & Supports

Artificial Neural Networks
. .
.
x1
x2
x3
xn
y
w1
w2
w3
wn
Input Signal Output f
w= synapses f = Activation Function
mathematical model of information processing in human brain
Mc Culloch-Pitts model (1943)
!"
#$%
&×= ∑
=
n
iii wxfy
1
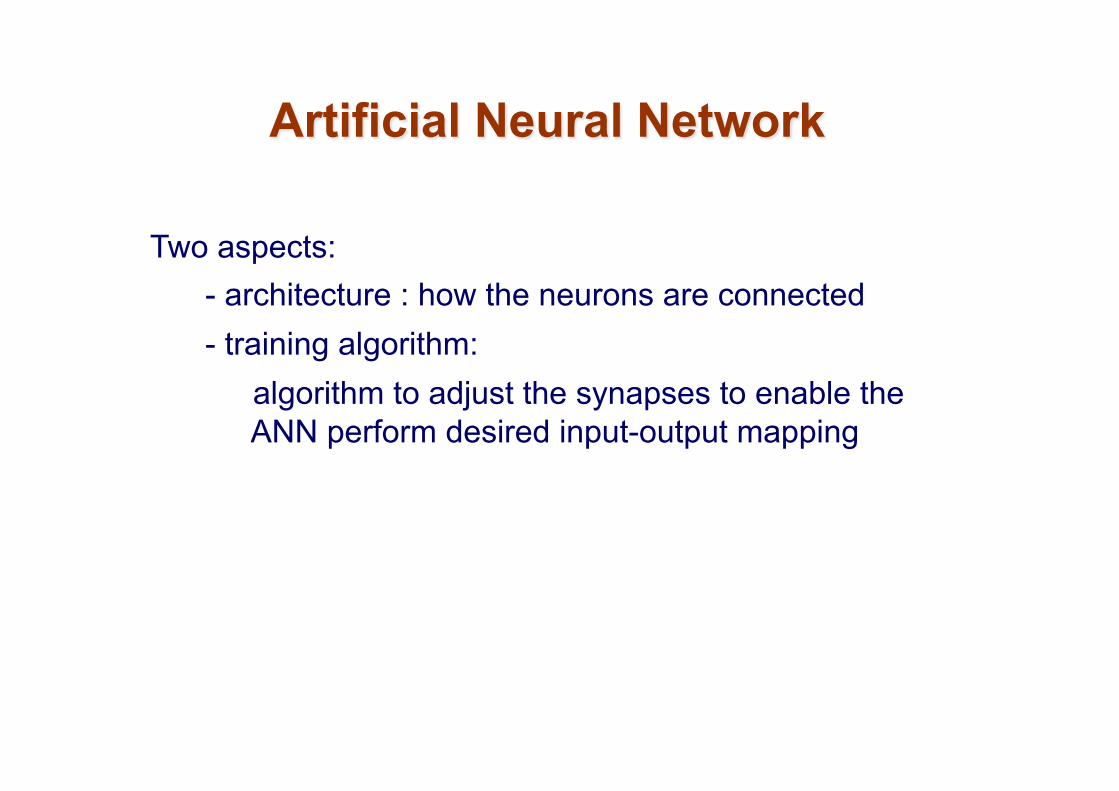
Two aspects: - architecture : how the neurons are connected - training algorithm: algorithm to adjust the synapses to enable the
ANN perform desired input-output mapping
Artificial Neural Network
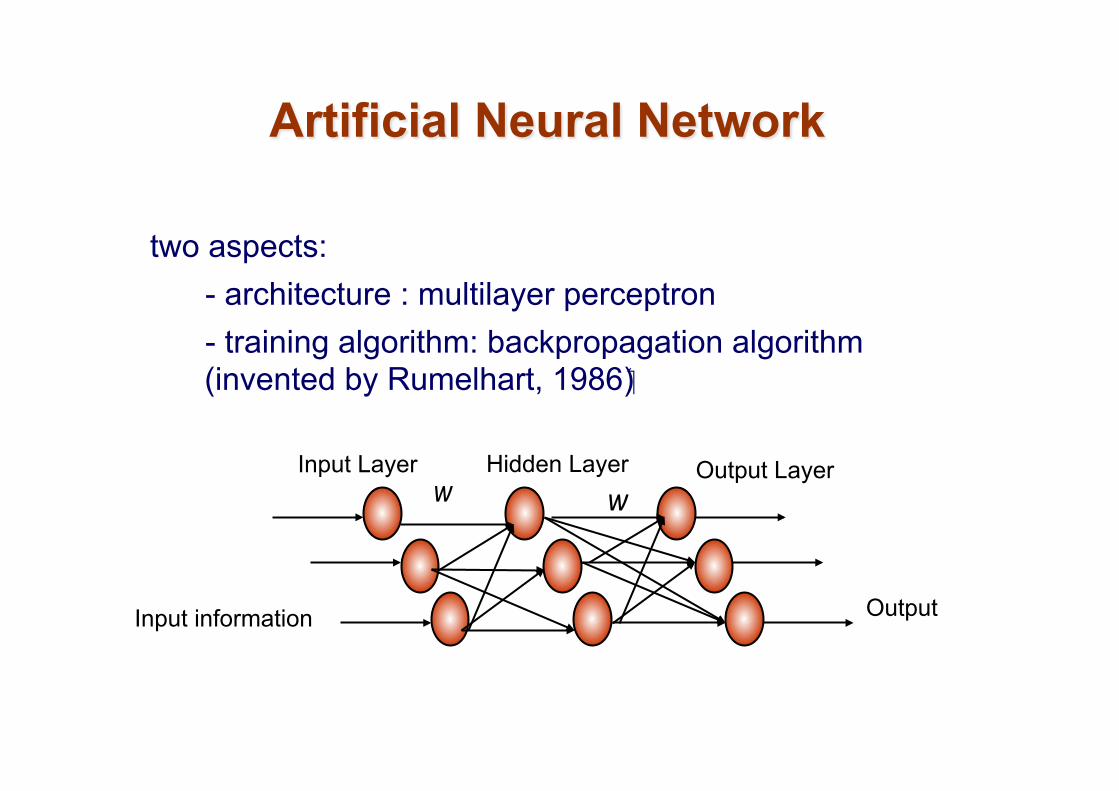
two aspects: - architecture : multilayer perceptron - training algorithm: backpropagation algorithm (invented by Rumelhart, 1986)
Input information Output
Input Layer Output Layer w
Hidden Layer w
Artificial Neural Network
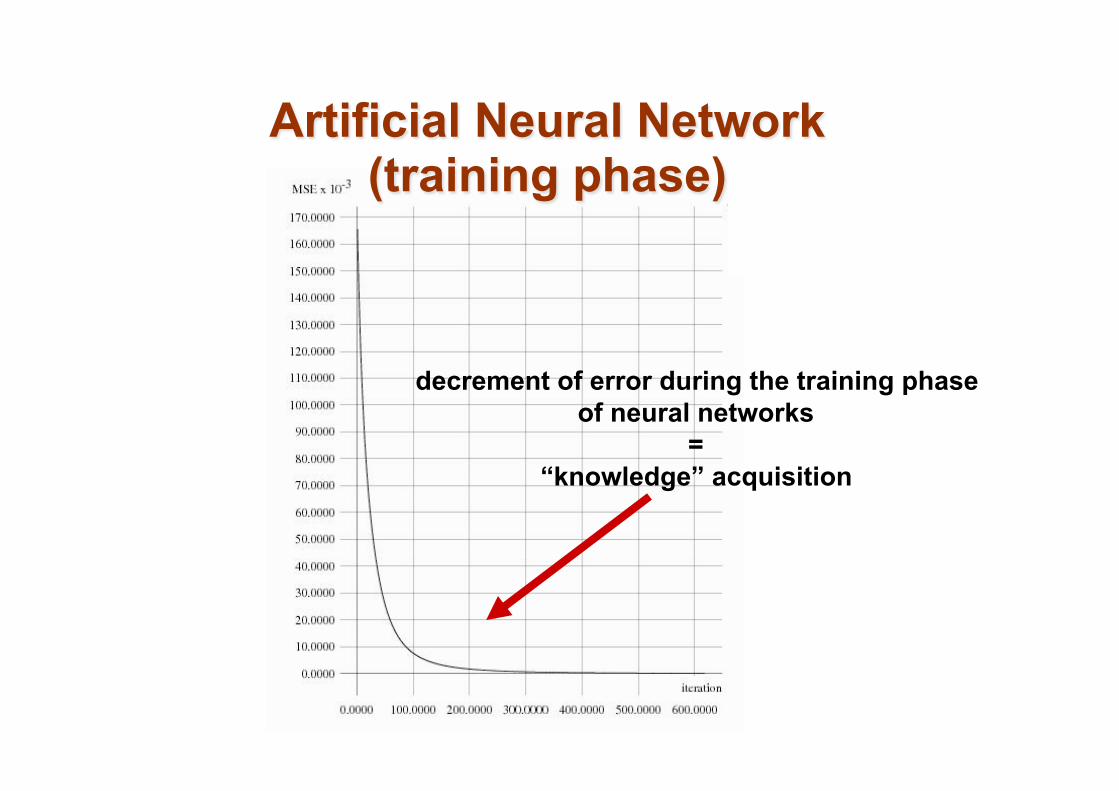
decrement of error during the training phase of neural networks
= “knowledge” acquisition
Artificial Neural Network (training phase)

• Invented by Vapnik (1992) • SVM satisfied three conditions for ideal pattern
recognition method – Robustness – Theoretically Analysis – Feasibility
• In principal, SVM works as binary classifier • Structural-Risk Minimization
Support Vector Machines

Discrimination boundaries
Class -1 Class +1
Binary Classification

Margin
Class -1 Class +1
Optimal Hyperplane by SVM
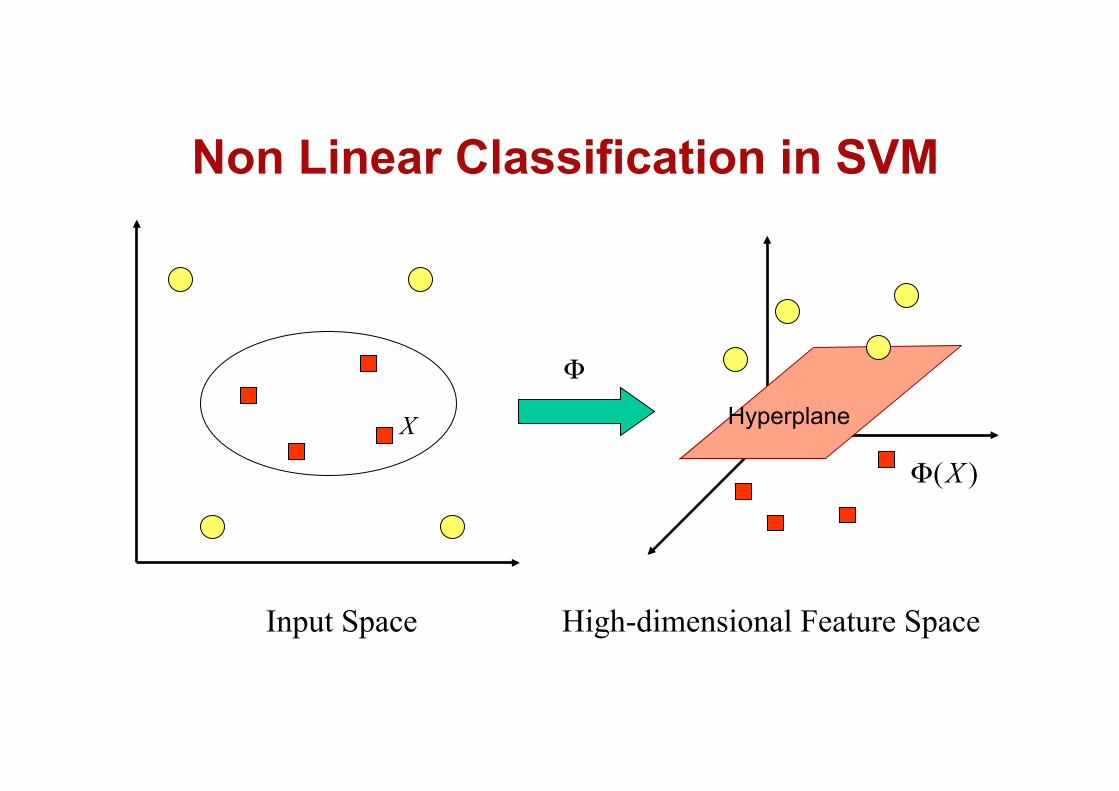
Input Space High-dimensional Feature Space
Hyperplane X
Φ
)(XΦ
Non Linear Classification in SVM
• Fog forecasting • Bioinformatics • Sky survey Cataloging (Fayyad et al.) • Spatio-Temporal Analysis of Disease Spreading using
Webmining • Foreign Exchange Rate Prediction • Network Intrusion Detection • Etc.
Application of Datamining

Sky Survey Cataloging • Sky Survey Cataloging
– Goal: To predict class (star or galaxy) of sky objects, especially visually faint ones, based on the telescopic survey images (from Palomar Observatory).
– 3000 images with 23,040 x 23,040 pixels per image. – Approach:
• Segment the image. • Measure image attributes (features) - 40 of them per object. • Model the class based on these features. • Success Story: Could find 16 new high red-shift quasars, some
of the farthest objects that are difficult to find!
From [Fayyad, et.al.] Advances in Knowledge Discovery and Data Mining, 1996
Slide source: Tan, Steinbach, Kumar, Introduction to Datamining, Pearson Int’l Edition
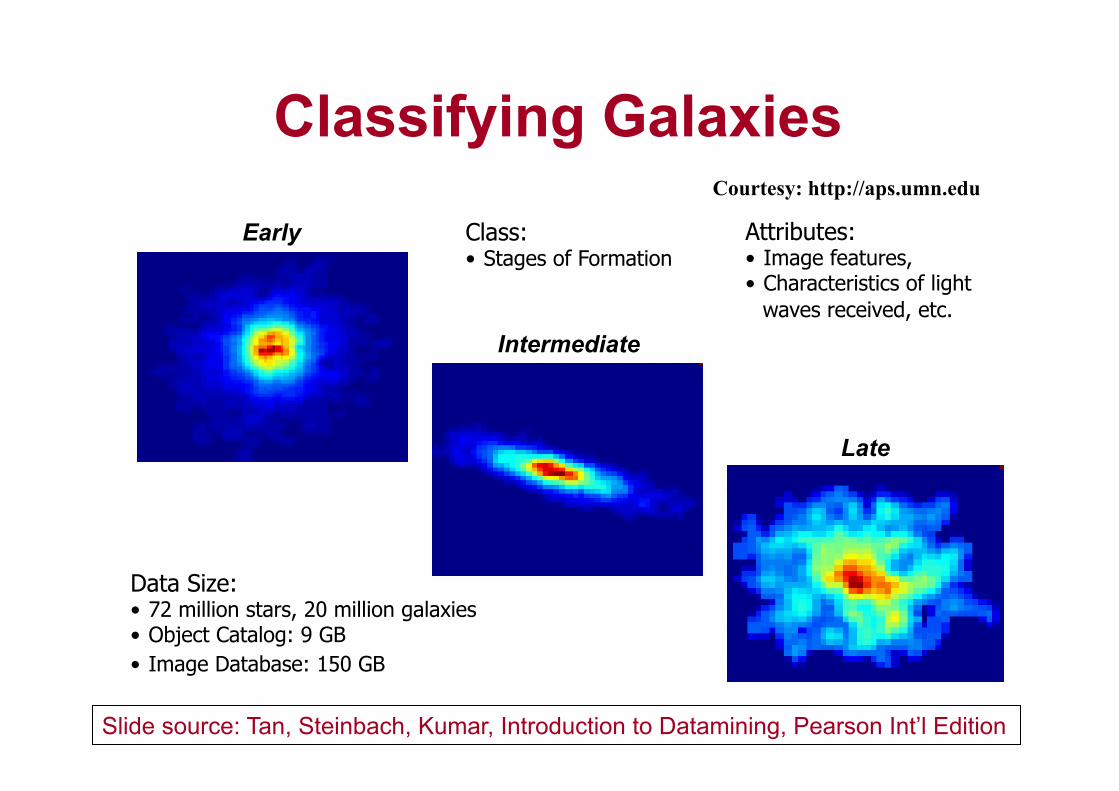
Early
Intermediate
Late
Data Size: • 72 million stars, 20 million galaxies • Object Catalog: 9 GB • Image Database: 150 GB
Class: • Stages of Formation
Attributes: • Image features, • Characteristics of light
waves received, etc.
Courtesy: http://aps.umn.edu
Slide source: Tan, Steinbach, Kumar, Introduction to Datamining, Pearson Int’l Edition
Classifying Galaxies

Further Readings • Buku-buku datamining a.l.
• Pang Ning Tan, Michael Steinbach, Vipin Kumar: Introduction to Datamining, Addison Wesley, 2006
• Datamining: Teknik Pemanfaatan Data untuk Keperluan Bisnis, Budi Santosa, Graha Ilmu, 2007
• Tutorial on datamining by Dr.Iko Pramudiono (NTT, Japan) http://datamining.japati.net/
• Datamining, Knowledge Discovery and Bioinformatics, Shinichi Morishita (winner of KDD 2001): http://asnugroho.wordpress.com/2006/02/05/datamining-knowledge-discovery-bioinformatics-terjemahan-artikel-prof-shinichi-morishita/ (password: gomibako)
• AS. Nugroho: Datamining dalam Bioinformatika: menggali informasi terpendam dalam lautan data biologi, SDA Asia Magazine, No.13, pp.64-66, March 2006 http://asnugroho.wordpress.com/2006/02/06/peran-datamining-dalam-bioinformatika/